Article

Transport Properties of Nanostructured Li2TiO3 Anode Material Synthesized by Hydrothermal Method

by
Ambadi Lakshmi-Narayana
1,
Obili M. Hussain
1,
Alain Mauger
2 and
Christian Julien
2,*
1
Thin Films Laboratory, Department of Physics, Sri Venkateswara University, Tirupati-517502, India
2
Sorbonne Université, Campus Pierre et marie Curie, Institut de Minéralogie, de Physique des Matériaux et de Cosmochimie (IMPMC), CNRS UMR 7590, 4 place Jussieu, 75005 Paris, France
*
Author to whom correspondence should be addressed.
Submission received: 25 June 2019 / Accepted: 4 July 2019 / Published: 20 September 2019
(This article belongs to the Section Chemistry Science)

Abstract

:
Li2TiO3 nanopowders were synthesized by hydrothermal process using anatase TiO2 and LiOH·H2O as raw materials. Li2TiO3 crystallizes in the layered monoclinic structure (space group C2/c) with average crystallite size of 34 nm. Morphology, elemental composition and local structure of products were carried out using high-resolution transmission electron microscopy, field-emission scanning electron microscopy, Raman and Fourier transform infrared spectroscopy. Transport properties investigated by d.c. (4-probe measurements) and a.c. (complex impedance spectroscopy) show the activation energy of 0.71 and 0.65 eV, respectively. The ionic transport properties of Li+ ions in nanocrystalline Li2TiO3 characterized by cyclic voltammetry and impedance spectroscopy validate the good electrochemical properties of this anode material for lithium-ion batteries.

1. Introduction

Among all titanium-based metal oxides, various members including TiO2 rutile, TiO2 anatase, TiO2(B), LiTi2O4, Li2Ti3O7, Li2TiO3, LiTiO2 and Li4Ti5O12 are considered as potential electrode materials for Li-ion batteries (see the phase diagram in Figure 1) [1,2,3,4,5,6,7,8,9,10,11]. In these compounds, the reversible intercalation/deintercalation process of lithium ions involves the reduction of Ti4+ to Ti3+ that takes place in safe voltage region (>0.5 V vs. Li+/Li0). This redox potential gives faster Li+ charging and sustainable cyclability to the electrode because of the congruence to the lowest unoccupied molecular orbital (LUMO) of the organic liquid–carbonate electrolyte, thus avoiding the formation of electrode/electrolyte interphase [12].
Among all titanium-based metal oxides, the rock-salt lithium metatitanate Li2TiO3 is an important material in various energy-related applications including lithium-ion batteries and molten carbonate fuel cells, due to its higher and flatter potential profile for lithium insertion preventing the formation of Li dendrites and the decomposition of electrolyte as well. The crystal structure was determined and refined by several workers [13,14,15]. Li2TiO3 exists in three polymorphic structures: the metastable cubic phase α-Li2TiO3 (space group Fm 3 ¯ m), which transforms above 300 °C to the stable framework β-Li2TiO3 and the high-temperature cubic γ-Li2TiO3 phase formed at 1155 °C (space group Fm 3 ¯ m) [16,17]. Since, we are concerned with applications of the material near room temperature, attention is focused hereunder on the stable phase β-Li2TiO3.
The crystal structure of β-phase Li2TiO3 was first determined by Lang [18] and subsequently refined by Kataoka et al. [19]. It can be described by the chemical formula Li4/3Ti2/3O2 or layered notation Li(Li1/3Ti2/3)O2 and crystallizes in the rock-salt monoclinic structure (space group C2/c) [18]. The unit cell has twenty–four atoms with lattice parameters a = 5.0622 Å, b= 8.7712 Å and c = 9.74787 Å, α = 90°, β = 100.01° and γ = 90° [19,20,21]. Both Li and Ti cations are located in octahedral sites with three crystallographically inequivalent Li positions, namely Li(1), Li(2) and Li(3), occupying the 8f, 4d and 4e Wyckoff sites, respectively, while two non-equivalent titanium positions Ti(1) and Ti(2) reside on 4e sites. β-Li2TiO3 has a layered-type framework that is a stacking of LiTi2 layers composed of Li(3) and Ti cations sharing 4e position and of single Li layers fully occupied by Li(1) and Li(2) ions [22,23].
Various synthesis methods have been reported to grow nanocrystalline Li2TiO3. Conventional solid-state synthesis reaction was used to produce Li2TiO3 with the mixture of Li2CO3 and TiO2 at 900–1100 °C for 10 h to several days [21,24,25,26]. Other preparation methods such as wet-chemical methods include sol–gel technique [27], combustion method [28,29], polymer solution synthesis [30], ball milling [31,32] and extrusion–spheronisation sintering [33] that involve at least one high temperature step (over 900 °C) to obtain a well-crystallized Li2TiO3 phase (named LTO hereafter). To the best of our knowledge, only few reports are available on hydrothermal synthesis of Li2TiO3 using microsized TiO2 powder as raw material [17]. Uniform nano-Li2TiO3 powder particles were prepared via a cetyltrimethyl-ammonium bromide (CTAB)-assisted hydrothermal method [34]. Unlike many synthesis methods, the hydrothermal method allows the control of shape and size of the particles by control of the rate of precipitation of the crystallized powders directly from the solution, the uniformity of nucleation, growth and aging. Expensive surfactants or template are not necessary in this method. Thus, hydrothermal synthesis is a suitable method to produce large scale crystals with high quality at a reasonable price [35].
However, β-Li2TiO3 is a wide gap semiconductor with an indirect band gap at Γ–C (Eg ≈ 3.9 eV) with low electrical conductivity of 10−11 S cm−1 at room temperature [35,36,37] and it was considered as a material with electrochemical inactiveness similarly to the rock-salt Li2MnO3 [38]. However, synthesis of nanocrystalline LTO, under the form of nanoparticles, nanorods, nanoflowers and nanofibers, provides more active surface area and shorter diffusion paths for Li+ ions in the structure, which makes the material electrochemically active and improves the rate capability [39,40]. Several attempts on Li2TiO3-based composites as cathode or anode materials were reported considering the merits of lithium metatitanate, namely its excellent structural stability and improved electrochemical performance for Li-ion batteries [41,42,43,44,45,46,47]. The Si/LTO nanocomposite synthesized by sol-gel process as an anode material exhibited a specific capacity of 471 mAh g−1 even after 50 cycles. In this nanocomposite, the structural stability is due to Li2TiO3, which acts as excellent buffer to the Si powders and partly compensate the capacity loss [44]. The composite 0.55Li2TiO3-0.45LiCrO2 prepared by spray pyrolysis exhibits the highest initial discharge capacity of 203 mAh g−1 [45]. Due to its three-dimensional (3D) path for Li+-ion migration and its excellent structural stability, LTO has served as both a Li ion conductive layer and a protective coating layer of cathode material against the attack of HF in the electrolyte [48,49,50,51,52].
In previous works, we have investigated the electrochemical properties of pristine nano-LTO [53], and the improve performance of LTO/CNT and LTO/graphene composites [54]. The effect of nanosized Li2TiO3 was evidenced by the excellent cyclability and the stable specific discharge capacity of 113, 143 and 150 mAh g−1, respectively, retained over 30 charge–discharge cycles at 1C rate. In the present study, we report additional measurements that evidence the beneficial effect of nanosized scale on the transport properties of LTO specimens prepared by hydrothermal synthesis after heat treatment at 800 °C in ambient conditions. The transport properties are investigated using d.c. and a.c. electrical conductivity, cyclic voltammetry (CV) and electrochemical impedance spectroscopy (EIS). Finally, the structural stability and the cyclability of LTO nanopowders cycled in aqueous cell is discussed.

2. Materials and Methods

2.1. Synthesis

Nanocrystalline β-Li2TiO3 was synthesized by hydrothermal reaction using 1.198 g (0.015 mol) TiO2 powder (anatase phase, Sigma-Aldrich, USA) and 1.259 g (0.03 mol) LiOH∙H2O (Sigma-Aldrich, USA) as raw materials. TiO2 and LiOH∙H2O powders (molar ratio 2:1) were added into a Teflon lined autoclave (50 mL) together with 15 mL distilled water and heated at 200 °C for 10 h. During the reaction period the autoclave was kept at the autogenous saturation vapor pressure of the solution without agitation. Then, the product was filtered, rinsed with deionized water. The as-prepared powder was dried at 50 °C in ambient conditions. The obtained powder was calcined at 800 °C for 2 h in air.

2.2. Characterization

The structure of samples was investigated by the X-ray diffraction (XRD) technique using a Siefert computerized X-ray diffractometer (model 3003-TT) equipped with a CuKα radiation (λ = 1.5406 Å) source filtered by Ni film operated at a scan speed of 0.03 degree per second in the 2θ range 10°–70°. Raman scattering (RS) spectra were recorded at room temperature in the range of 50–1000 cm−1 with a spectral resolution of ≈1 cm−1 using a HR800UV Raman spectrometer (Jobin-Yvon, Longjumeau, France) using air-cooled frequency doubled Nd:YAG laser 532 nm with an excitation source of 50 mW. The spectral calibration was carried out using the 520 cm−1 scattering line of silicon. A 100× objective lens was used to focus the laser light on sample surface. The Fourier transform infrared (FTIR) measurements were carried out using a VERTEX 80v (Bruker, Karlsruhe, Germany) in the spectral range 100–1000 cm−1. High resolution transmission electron microscope (HRTEM) (model FEI, TECHNAI G2-30 S-twin D905) was used to analyze the microstructure of the sample. The surface morphology of the sample was observed by a field emission scanning electron microscope (FESEM, SIRION 200). The composition of the sample was analyzed by energy dispersive spectroscopy with FESEM (FESEM, SIRION 200).
A.C. conductivity was performed by impedance spectroscopy using a phase sensitive multimeter (model PSM 1700, Newton, Leicester, UK) at various temperatures from 300 to 500 °C. The amplitude of the A.C. signal was 50 mV over the frequency range 1 Hz–1 MHz. The synthesized powder was pressed into 12 mm diameter pellet with the thickness of 1.25 mm and annealed at 600 °C for 2 h to enhance the packing density. The pellet was used for electrical studies. Cyclic voltammetry (CV), galvanostatic charge–discharge experiments were conducted to evaluate the specific discharge capacity of the electrode as reported elsewhere [54]. A conventional three-electrode glass cell (Pt/saturated Li2SO4 aqueous solution/Li2TiO3) was used with an Ag/AgCl reference electrodes.

3. Results

3.1. Elemental and Structural Studies

The elemental analysis of the as-prepared Li2TiO3 powders sintered at 800 °C for 2 h carried out by energy dispersive spectroscopy (EDS) gives the composition of 74.5 and 25.5% (accuracy of ±0.5%) of titanium and oxygen, respectively (see Figure 2 in Ref. [54]). The LTO samples have a white color, which indicates a stoichiometric composition, according to Hoshino et al. [55] for products sintered in oxidizing conditions.
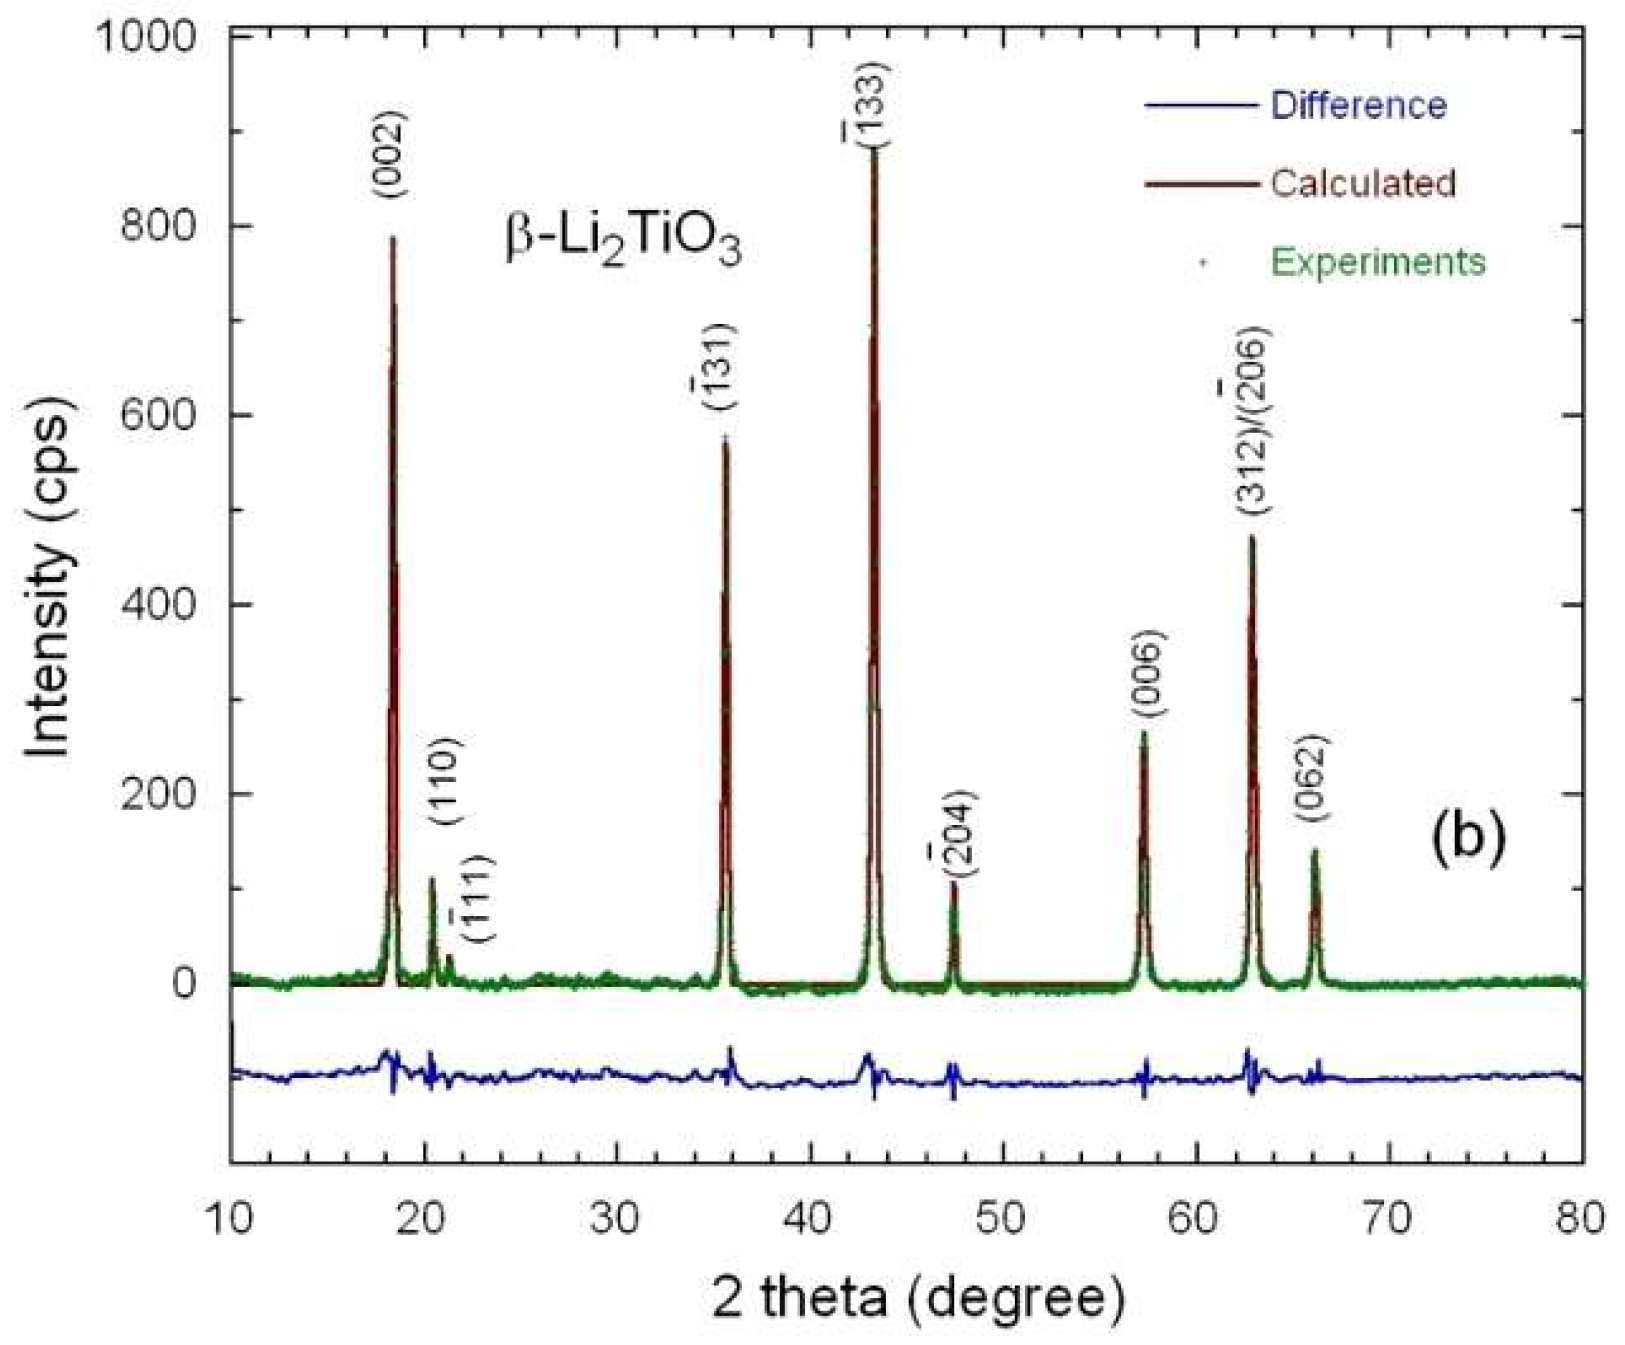
Figure 2b presents the XRD pattern of Li2TiO3 sample recorded using the Bragg–Brentano geometry. All the X-ray diffraction lines can be readily indexed to the monoclinic β-Li2TiO3 structure (JCPDS Card No. 33-0831). The XRD diagram exhibits predominant (002) reflection at 2θ = 18.48° along with other characteristic orientations ( 1 ¯ 31), ( 1 ¯ 33), (043), (006), (312) and (062) corresponding to monoclinic β-Li2TiO3 structure with C2/c space group (ordered phase). In the hydrothermal reaction, the Li-Ti-O framework is formed, characterized by the basic ( 1 ¯ 33) lattice plane. The strong intensity of ( 1 ¯ 33) diffraction peak gives evidence of the good ordering of lithium and titanium ions in the LiTi2 slab of the monoclinic structure in which Li, Ti and O atoms are arranged in the sequence Liinterslab(Li1/3Ti2/3)slabO2. In this lattice, lithium ions occupy 1/3 of 4e sites, while the titanium ions occupy 2/3 other 4e sites (Wyckoff notation) [37]. Note that the intensity of the (002) supercell XRD peak is enhanced by the sintering process at 800 °C for 2 h. Rietveld refinements of XRD data were performed by the FULLPROF program [56]. The comparison between observed (dots) and calculated (solid line) patterns is shown in Figure 2 together with their difference curve. The lattice parameters of the monoclinic structure (space group C2/c) are a = 5.069(1) Å, b = 8.799(1) Å, c = 9.759(2) Å and β = 102°. The elementary unit volume (V = abc sinβ) is 429.1 Å3. These results match well with the literature data and confirm that the specimens are single Li2TiO3 phase [15,16,17]. The crystallite size of the prepared sample was estimated using Debye–Scherrer formula [57]:
L = K λ β cos θ
where β is the full width half maxima (FWHM) in radians, λ is wavelength of the X–ray, θ is corresponding Bragg angle and K is a dimensionless shape factor (K = 0.94). The estimated crystallite size is 34 ± 2 nm with a lattice strain 0.009 in the rock-salt Li2TiO3 powders.
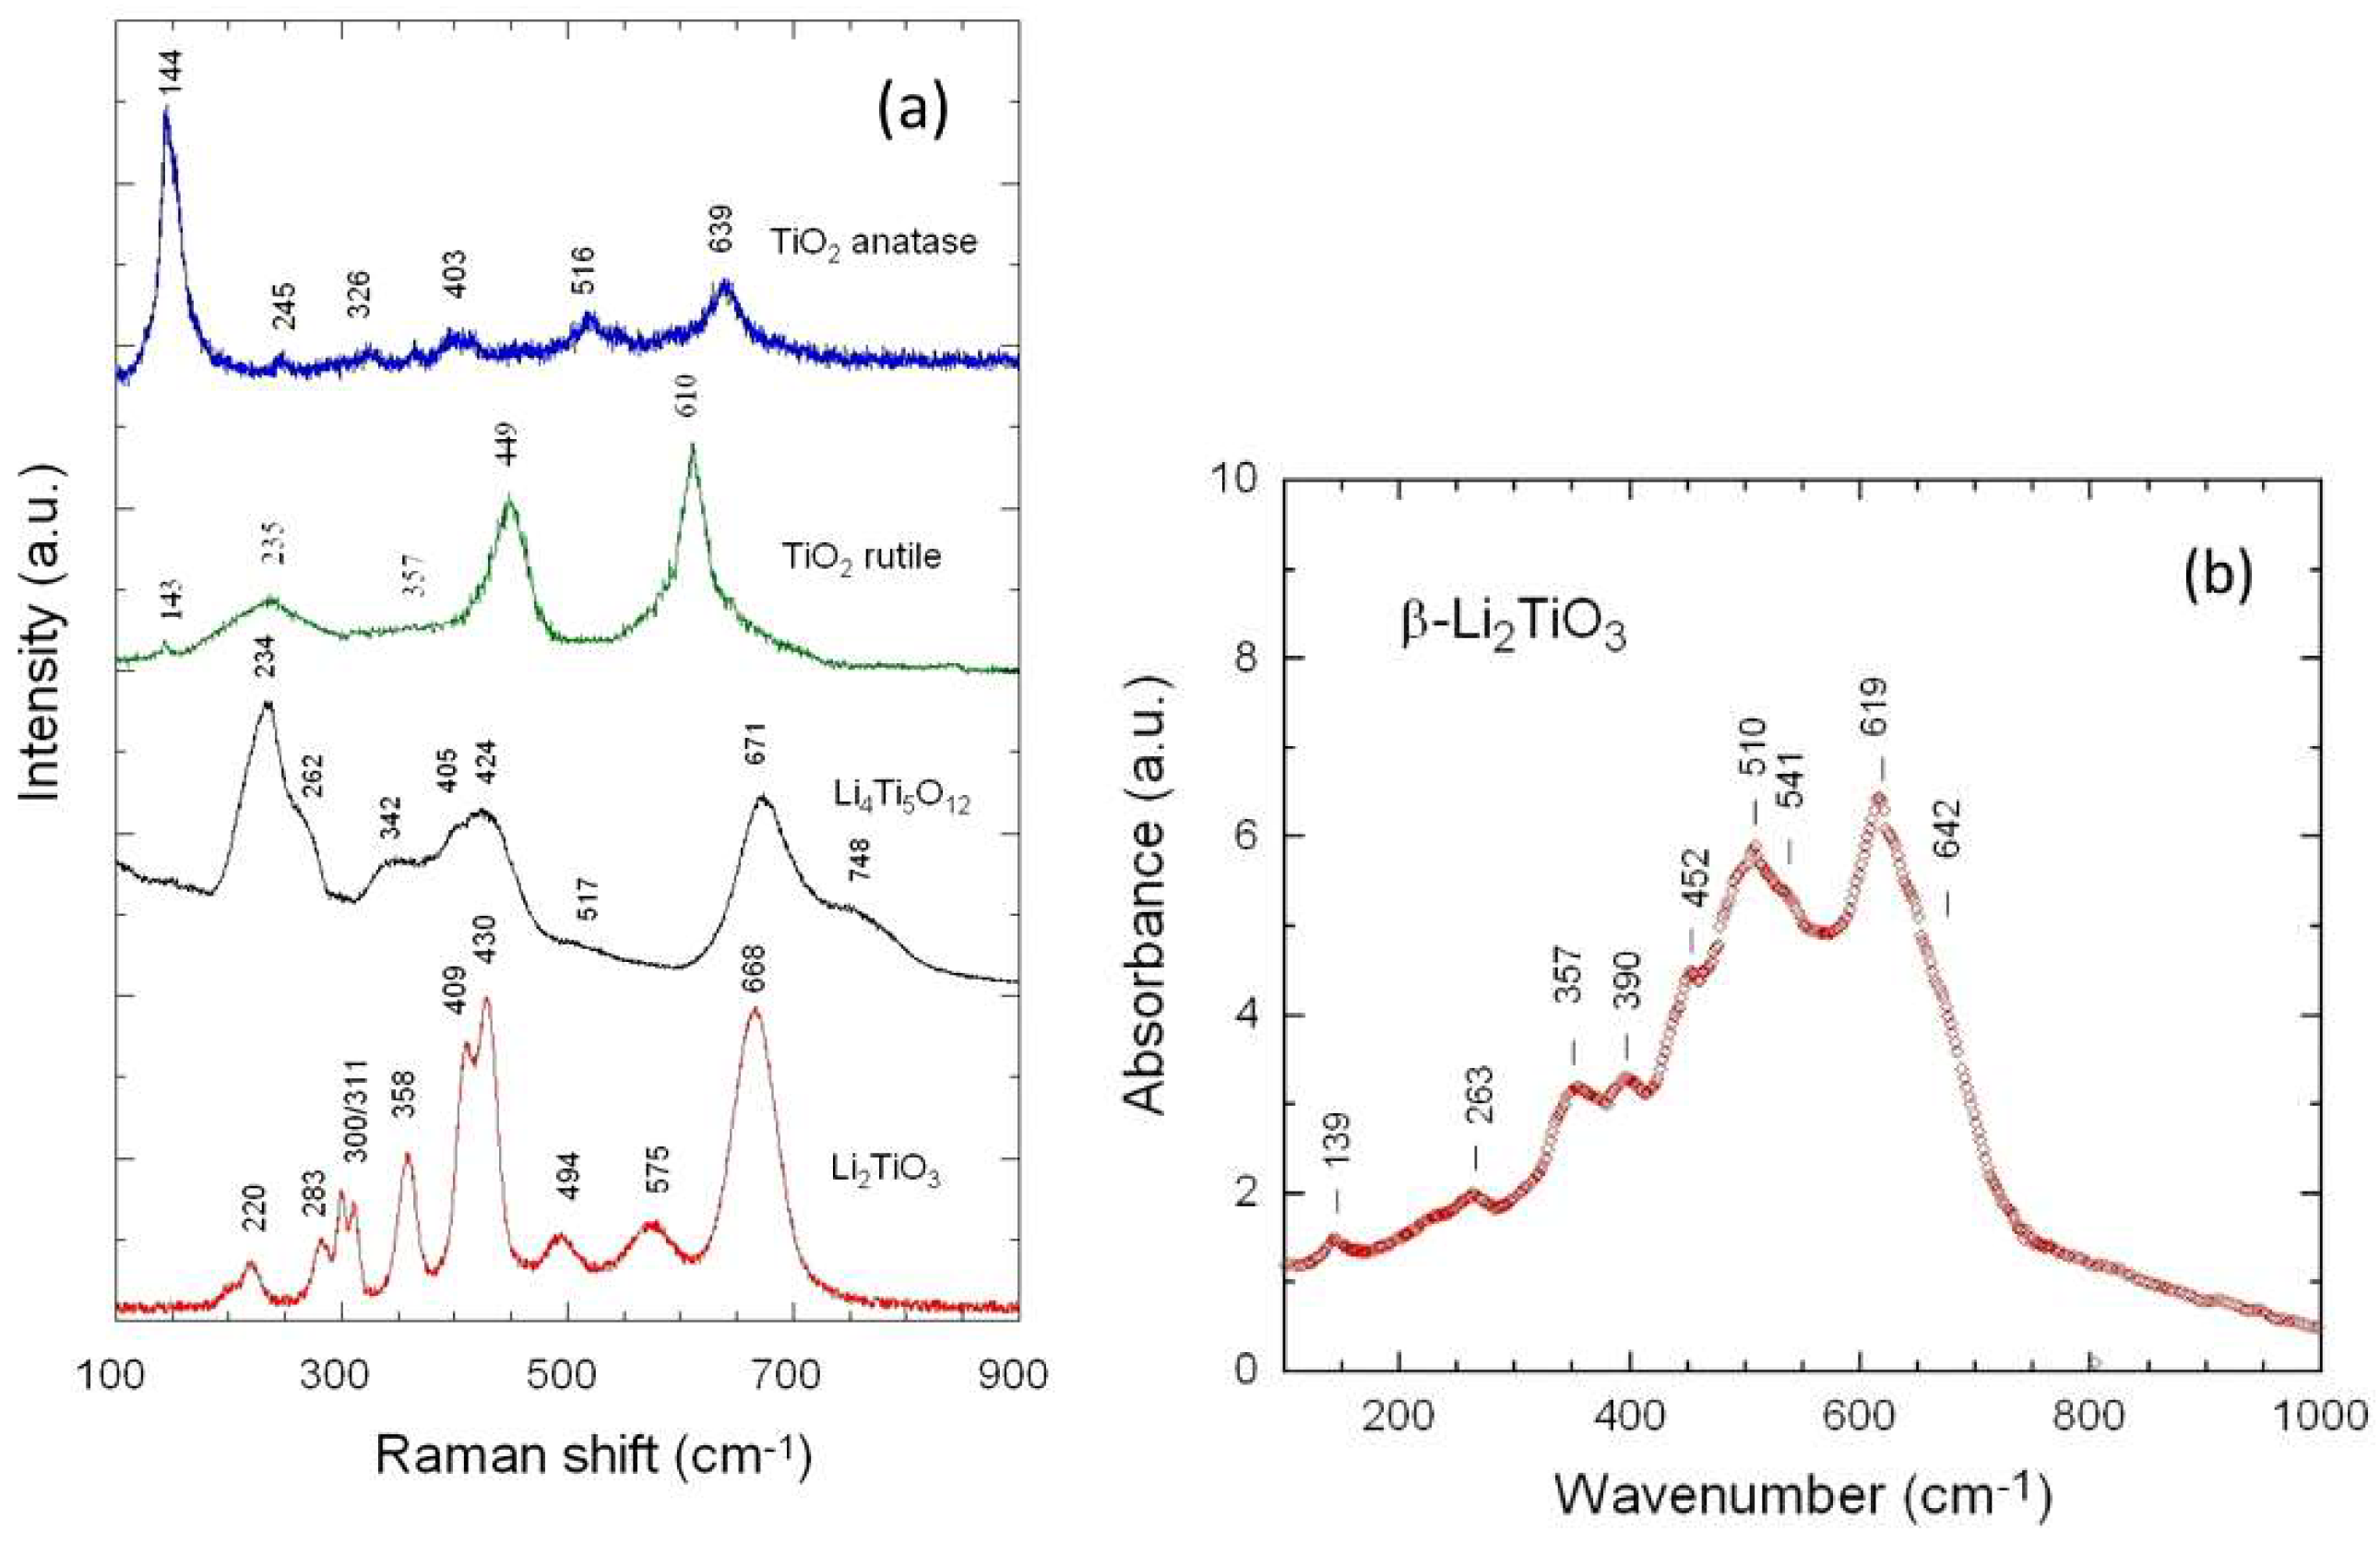
The short-range structural properties of the prepared samples were further investigated by Raman and FTIR spectroscopy that are considered to be powerful for either detecting impurities or determine the local environment of oxygen atoms. In lithiated oxides, where Li ions occupy octahedral sites, the frequency of Li-O stretching is known to be observed within the 200–400 cm−1 spectral region, while for Li tetrahedrally coordination, the frequency lies in the 400–550 cm−1 region [58]. Figure 3a shows the Raman spectra in the spectral range 100–900 cm−1of several titanate oxides, i.e., TiO2 anatase, TiO2 rutile, Li4Ti5O12 spinel and β-Li2TiO3, which evidence the unicity of the monoclinic structure of Li2TiO3. Among the 15 allowed Raman active modes (7Ag + 8Bg) of the C2h6 spectroscopic symmetry, only 11 observed Raman bands are observed, which can be attributed as followed. The high-wavenumber peaks at 575 and 668 cm−1 are assigned to the Ti-O stretching vibrations in TiO6 octahedra; the lattice modes, i.e., Ag(T) translational lattice mode, and O-Ti-O bending modes appear at ν < 320 cm−1; the low-frequency peak at 98 cm−1 (with very weak intensity) is due to the Li-O stretching modes in LiO4 and LiO6 are observed at 358 and 430 cm−1, respectively. Frequency and intensity of Raman bands are listed in Table 1. Our data are in good agreement with the literature [21,36,59,60,61,62,63]. Recently, Raman and infrared bands of Li2TiO3 have been calculated by Wan et al. [36] from first-principles total energy calculations with a generalized gradient approximation and plane-wave pseudopotential model. Our experimental data are compared with calculated frequencies in Table 2. Note that similar situation has been shown in the Raman spectrum of monoclinic Li2MnO3 [64,65]. All mode frequencies match well with the relation:
ω L i 2 T i O 3 ω L i 2 M n O 3 = m M n m T i
Considering the molecular model, the Raman spectrum of the β-Li2TiO3 phase essentially displays stretching and bending of the various polyhedral units constituting the monoclinic lattice without appearance of Raman bands due to anatase TiO2 (at 144 cm−1) and rutile TiO2 (at 449/610 cm−1).
The FTIR spectrum of Li2TiO3 is shown in Figure 3b. It displays only 9 infrared bands instead of 18 expected by the group factor analysis. The two broad peaks at 510 and 619 cm−1 are assigned to the antisymmetric stretching vibrations of Ti-O bonds. The low-frequency bands in the range 350–450 cm−1 are a mixture of the O-Li-O and O-Ti-O bending modes due to the presence of Li ions in the LiTi2 slabs. The band at 263 cm−1 is attributed to the stretching mode of Li-O bonds in LiO6 octahedra. The shoulder of the higher intensity peak at 642 cm−1 should be related to the local distortion of the lattice that results in a decrease of the local structural symmetry generating additional infrared bands [66].

3.2. Surface Morphology

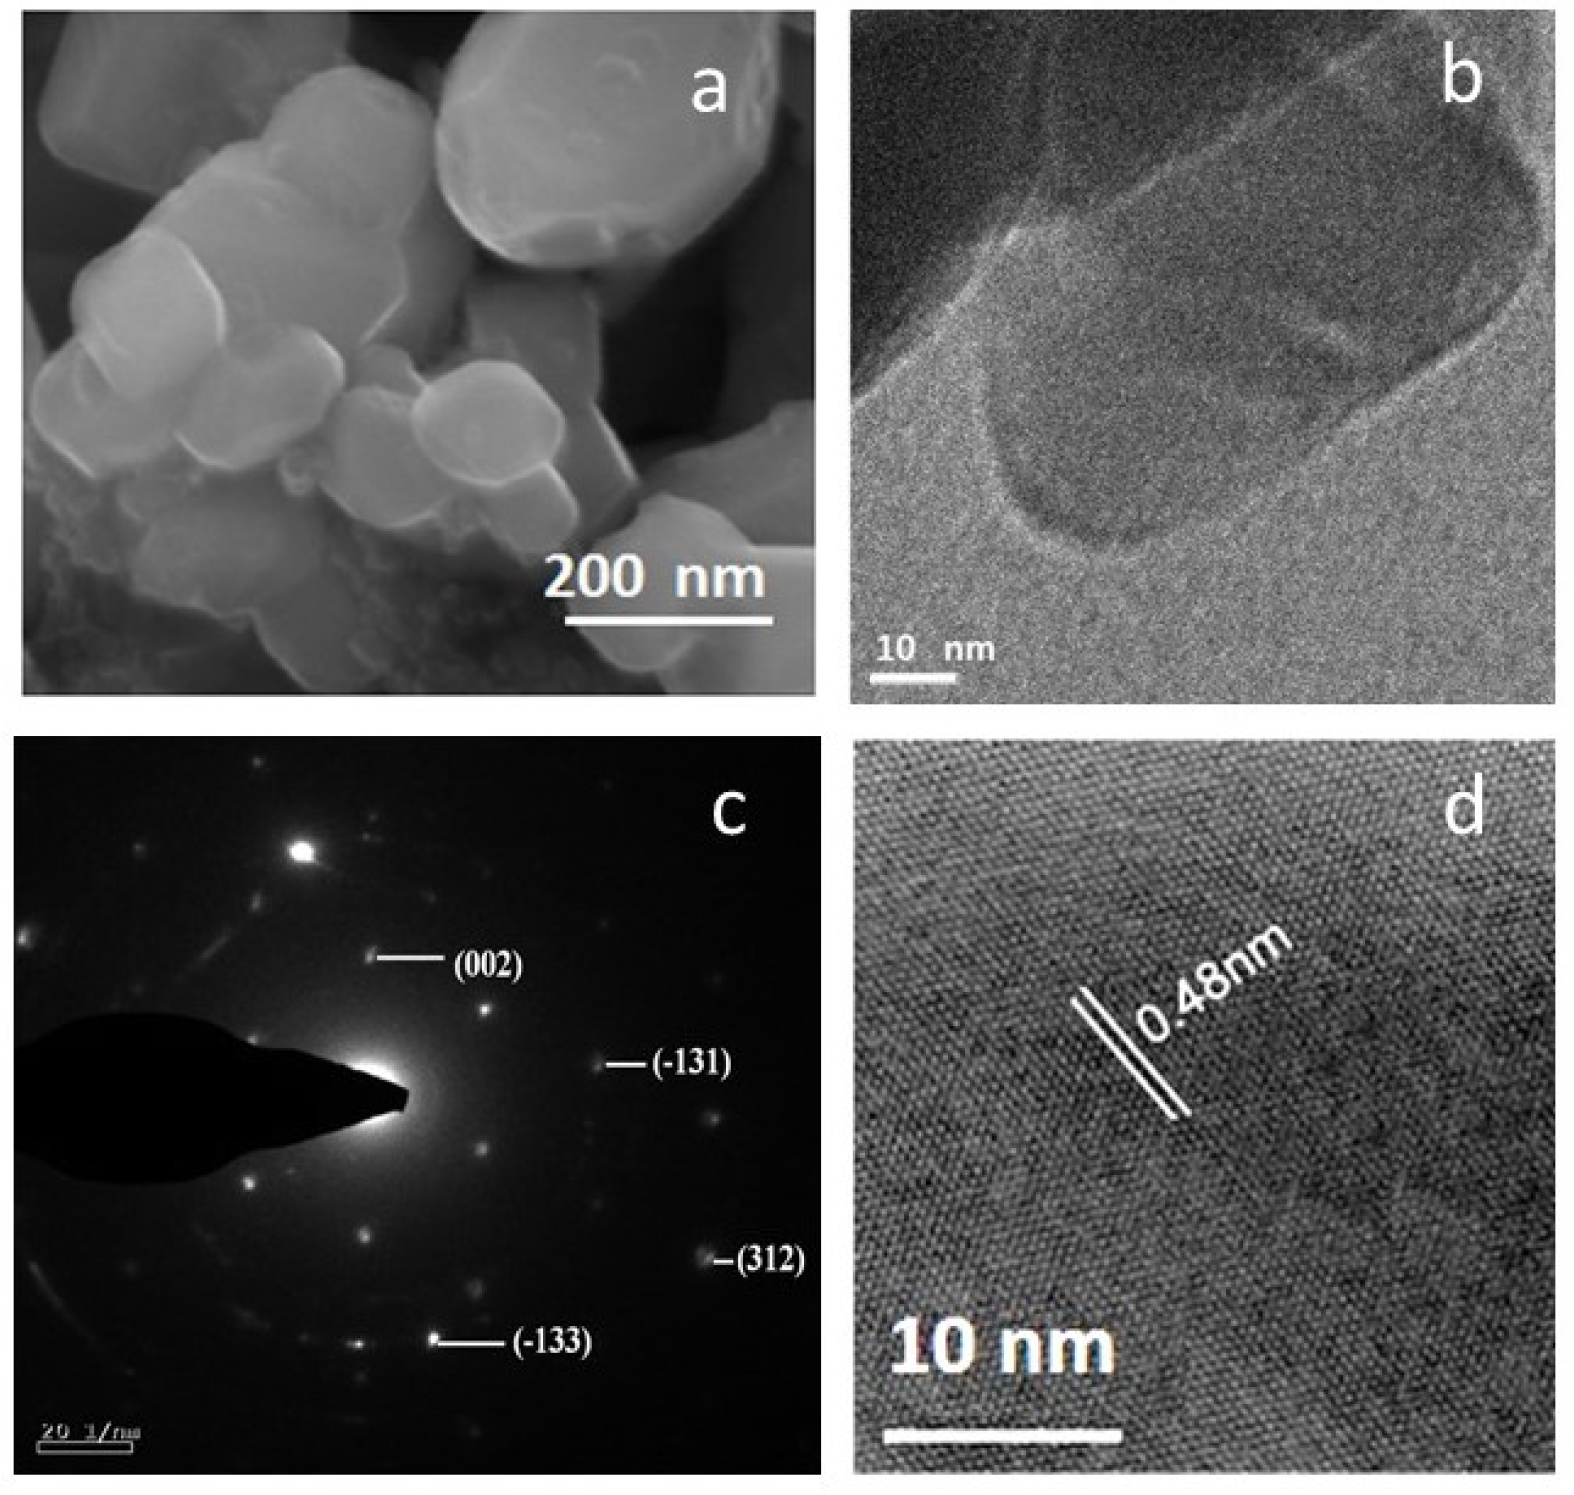
The surface morphology and microstructural features of hydrothermal synthesized Li2TiO3 material calcined at 800 °C for 2 h are observed by field emission scanning electron microscopy (FESEM) and high-resolution transmission electron microscope (HRTEM) in Figure 4 and Figure 4b, respectively. FESEM image of Li2TiO3 shown in Figure 4a reveals that the sample consists of homogeneously distributed spherical-like shaped grains with an average particle size of 150 nm without any obvious aggregations. Figure 4b–d show the HRTEM image, selected area diffraction pattern (SAED) and lattice fringes images of Li2TiO3, respectively. The corresponding selected-area electron diffraction (SAED) pattern of the microstructure (Figure 4c) shows that the nanoparticles are well crystallized. The d-spacing values obtained from SAED patterns are indexed to the respective planes of (002), ( 1 ¯ 31), ( 1 ¯ 33) and (312) that agree well with XRD patterns of the monoclinic structure of Li2TiO3. Figure 2d shows the layered structure with fringe spacing of 0.48 nm matching well with the d-spacing of the high intensity plane (002) of Li2TiO3 and corresponding to LiTi2 slab along the c-axis [67].

3.3. Electrical Transport

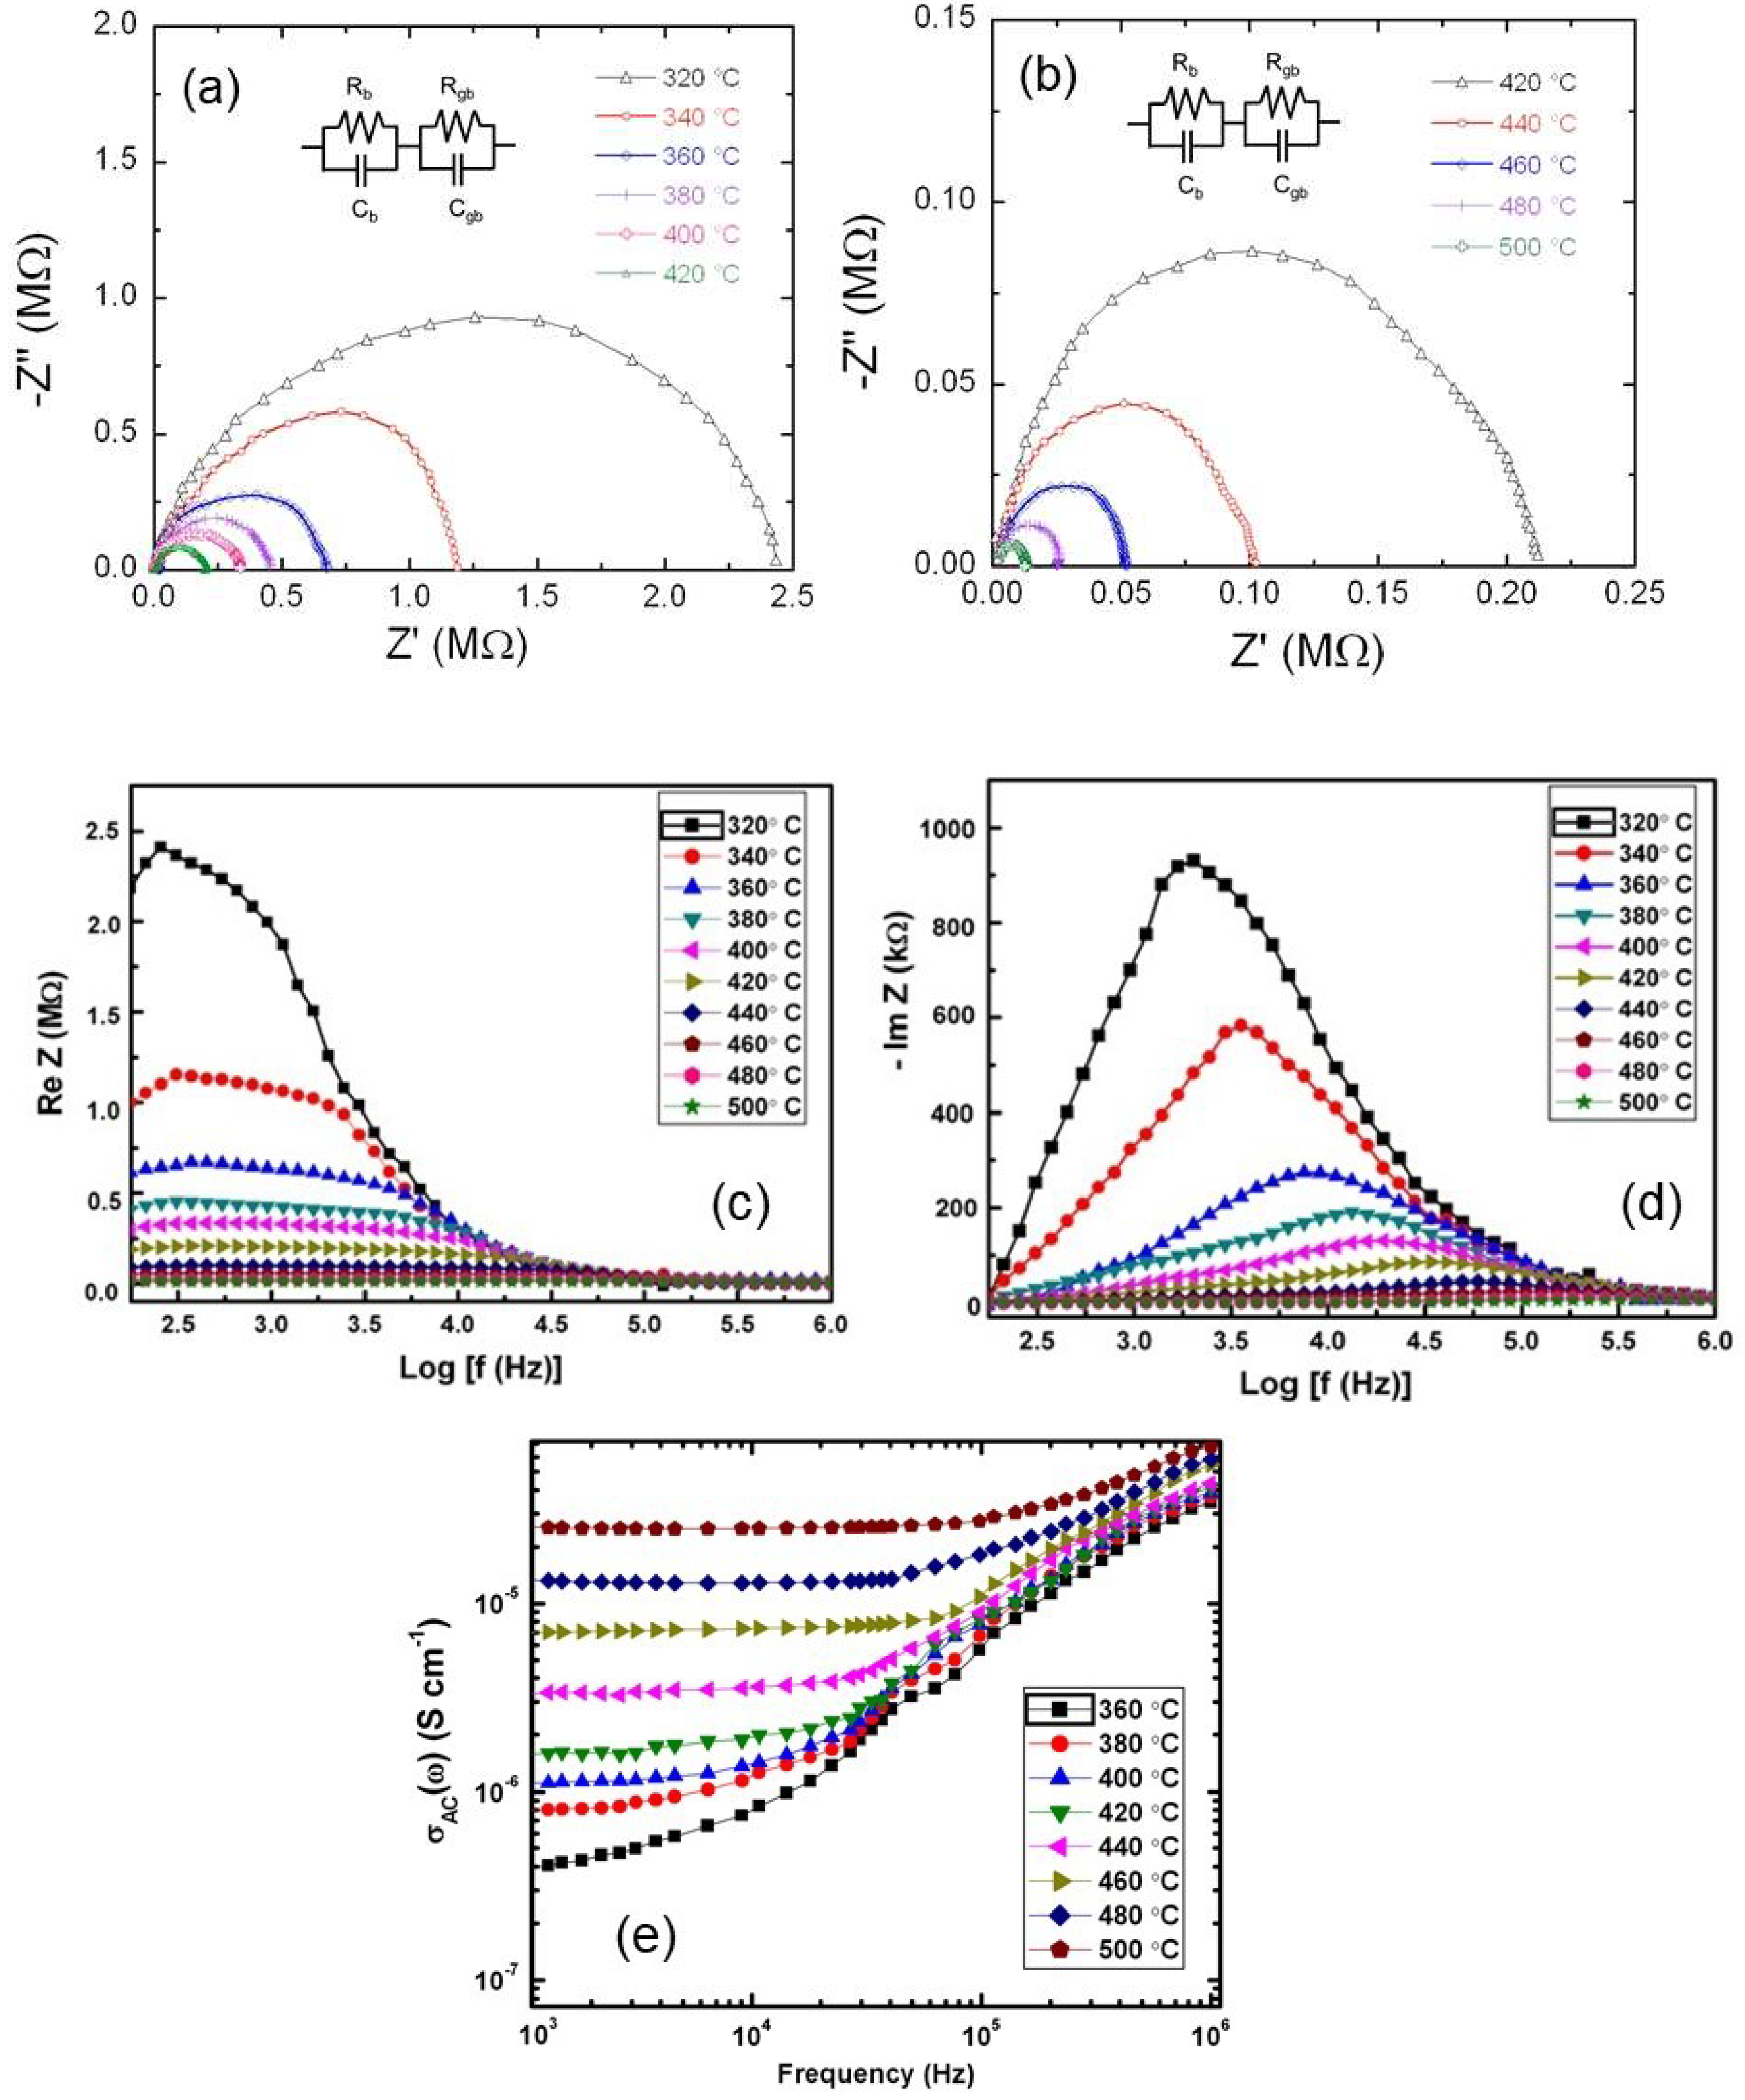
Conductivity measurements were carried out using both d.c. and a.c. techniques to analyze the electrical transport of electrons and ions in the LTO lattice. Impedance spectroscopy is an efficient tool to study a.c. conductivity of materials, when using a large frequency domain, this technique provides analysis of intragrain, intergrain and relaxation process in material (Figure 5a–e). Figure 5a,b show the Nyquist plots (Z′(ω)-Z″(ω) plane) of nanocrystalline Li2TiO3 in a wide frequency range (1 Hz-1 MHz) over the temperature range 320–500 °C. The bulk resistance (Rb) of the LTO sample is determined from the intercept of each semicircle with the real axis. It is observed that both the intercept with the Z′ axis and the maximum of Z” shift as temperature increases. At low temperatures (T < 400 °C), the Li2TiO3 pellet exhibits a high resistance that is mainly due to the bulk property of the sample. At higher temperature, all the Nyquist plots consist of a slightly depressed semicircle in the high-frequency region followed by another depressed semicircle at low frequencies (<1000 Hz). The depressed semicircle, which meets real axis at high frequencies is the response of the bulk resistance (Rb) of the material, i.e., small deviation from a Debye-type relaxation process, while the depressed semicircle originated in the low frequency region is due to grain boundary (Rgb) effect. The high- and low-frequency complex impedance plots for all temperatures can be modeled using a parallel combination of resistance and constant phase element (CPE) equivalent circuit describing the bulk resistance and grain boundary components in Li2TiO3 sample. The bulk electrical conductivity (σ) was calculated using the formula:
σ 0 = 1 R b × l S
where Rb is the bulk resistance, l is the thickness of the sample and S is the active area of the sample.
The real Z′(ω) and imaginary Z″(ω) part of the Li2TiO3 sample impedance are presented for all temperatures in Figure 5c,d, respectively. The plots of Figure 5c show a decrease of Z′(ω) vs. frequency, so that σ(ω) increases with frequency (see Figure 5e). At low frequency, σ increases importantly with temperature. At high frequencies, however, Z′(ω) becomes almost temperature independent so that the Z′(ω) curves at different temperatures merge approximately in a single curve. This is due to the release of space charges caused by reduction in barrier properties of the material [38]. This unique curve at high frequency shows a dip, which is associated to charge carrier hopping in the material. In another hand, Z″ = Im(Z(ω)) reaches a maximum, which shifts towards higher frequency with temperature. This is attributed to the active conduction through the grain boundaries of the sample. The magnitude of Z″(ω) decreases with increasing temperature indicating a decrease of the resistivity of the material. The peak broadening observed with increasing temperature is attributed to a temperature dependent relaxation process in the material. The asymmetric broadening of the peaks indicates the spread of relaxation time in the sample. Our data match well with the results reported in the literature [37,38,68]. The ac response obeys the power law [69]:
σ(ω) = σac = σ0 + Aωn
where σ0 is the d.c. conductivity (at ω = 0), A is a thermally activated quantity and n the fractional constant that is 0.5 < n < 0.8 for an ionic conductor [70,71]. The frequency exponent n (Equation (4)) can be analyzed by a mechanism based on charge carrier hopping between defect sites proposed by Elliott [72]:
n = ( ln σ ac ) ( ln ω ) = 1 6 k B T W m
where T is the absolute temperature, kB the Boltzmann constant and Wm the maximum barrier height (energy of the transport charge). Using Equation (4), from the slope of curves in Figure 5d, one can derive at the highest frequency with n ≈ 0.72 and the value of Wm is 0.63 eV at room temperature.
Figure 6a,b display the Arrhenius plots of σac and σdc, respectively. The solid lines are the fit of the temperature dependence of conductivity thermally activated according the Arrhenius-type behavior:
σ ac , dc = σ 0 T exp ( E a k B T )
where σ0 is the pre-exponential factor, T the absolute temperature, kB the Boltzmann constant and Eac the activation energy of the conductivity. The fit of the curves σT vs. 1/T in Figure 6a,b provides an activation energy Ea = 0.71 eV for σdc and 0.65 eV for σac measured at 50 kHz. These values match well with the value 0.77 eV found for nanoparticles [37], against 0.88 eV [38] or even 0.95 eV for the bulk material [37]. Thus, Ea appears to be dependent on the crystallite size. This is corroborated by the fact that the value Ea = 0.71 eV obtained in the present work (34 nm crystallite size) is slightly smaller than that for crystallites of 88 nm reported by Dash et al. [38]. Therefore, nanosized particle favors the electronic transport and thus the ionic transport since both are correlated to maintain the electrical charge neutrality inside the material.
As shown in Figure 5c, Z″ = Im(Z(ω)) exhibits a peak at the particular frequency, i.e., the relaxation frequency, which corresponds to a single relaxation time that fulfils the relation 2πfmτm = 1, where fm is the frequency of the maximum of Im(Z). The variation of τ with T obeys an Arrhenius law given by [73]:
τ = τ 0 exp ( W a k B T )
where τ0 is the pre-exponential factor and Wa the activation energy. Figure 6c shows the temperature dependence of the relaxation time of LTO sample in the range 320–500 °C. The mean relaxation time of the process is measured in fractions of milliseconds that does not implies electronic and ionic lattice polarization but slow relaxation can be imposed by permanent molecular dipoles, ion defects of a dipolar type, or mobile hopping charge carriers [74]. The activation energy estimated from the linear fit is found to be ~0.66 eV, which indicates a quasi-Debye behavior of the relaxation process of charge carriers in the LTO lattice. The mechanism of ionic motion has been discussed by several workers [23,74,75]. Li2TiO3 has a three-dimensional path for Li+ ion diffusion, in which the ionic migration can occur in the (00l) plane, that is, LiTi2 layer, and along the c axis [74]. The conductivity occurs with the hopping of Li+ ions from tetrahedral sites to adjacent octahedral sites. At low temperatures, defects are created by surface modification. At high temperature a drift of large number of Li+ ions released from tetrahedral sites (LiTi2 layer) then occupied octahedral sites (Li layer), creating interstitial site vacancies that are thermally activated and some structural disorder possibly occurred that facilitate ion transport induced by low activation energy.

3.4. Li+-ion Diffusivity

Investigations of the diffusivity of Li+ ions in the LTO lattice were carried out by cyclic voltammetry (CV) at sweep rate in the range 1–50 mV s−1 and by electrochemical impedance spectroscopy (EIS) measurements in the frequency range 1–106 Hz for Pt/saturated Li2SO4 aqueous solution/Li2TiO3 cells. Cyclic voltammograms display one set of well-defined current peaks (see Figure 7 in Ref. [53]) corresponding to the redox reaction in Li//Li2TiO3 cell, according the (de)insertion reaction:
Li2Ti4+O3 + xLi+ + xe ⇆ Li2+xTi(4−x)+O3
As the starting electrode material is Li2+Ti4+O3, the insertion of the faction x of Li+ ions in Li2+xTiO3 implies the reduction of tetravalent to trivalent titanium [45]. At sweep rate of 10 mV s−1, the reduction peak occurred at 0.338 V during cathodic sweep corresponding to insertion of lithium into interstitial sites of Li2+xTiO3 (x equals to 0.5), while the oxidation peak occurred at 0.643 V during anodic sweep. Thus, a peak separation of 0.305 V for Li2TiO3 is ascribed to the Li+ ion storage at the solid–electrolyte interface during charge–discharge process [76].
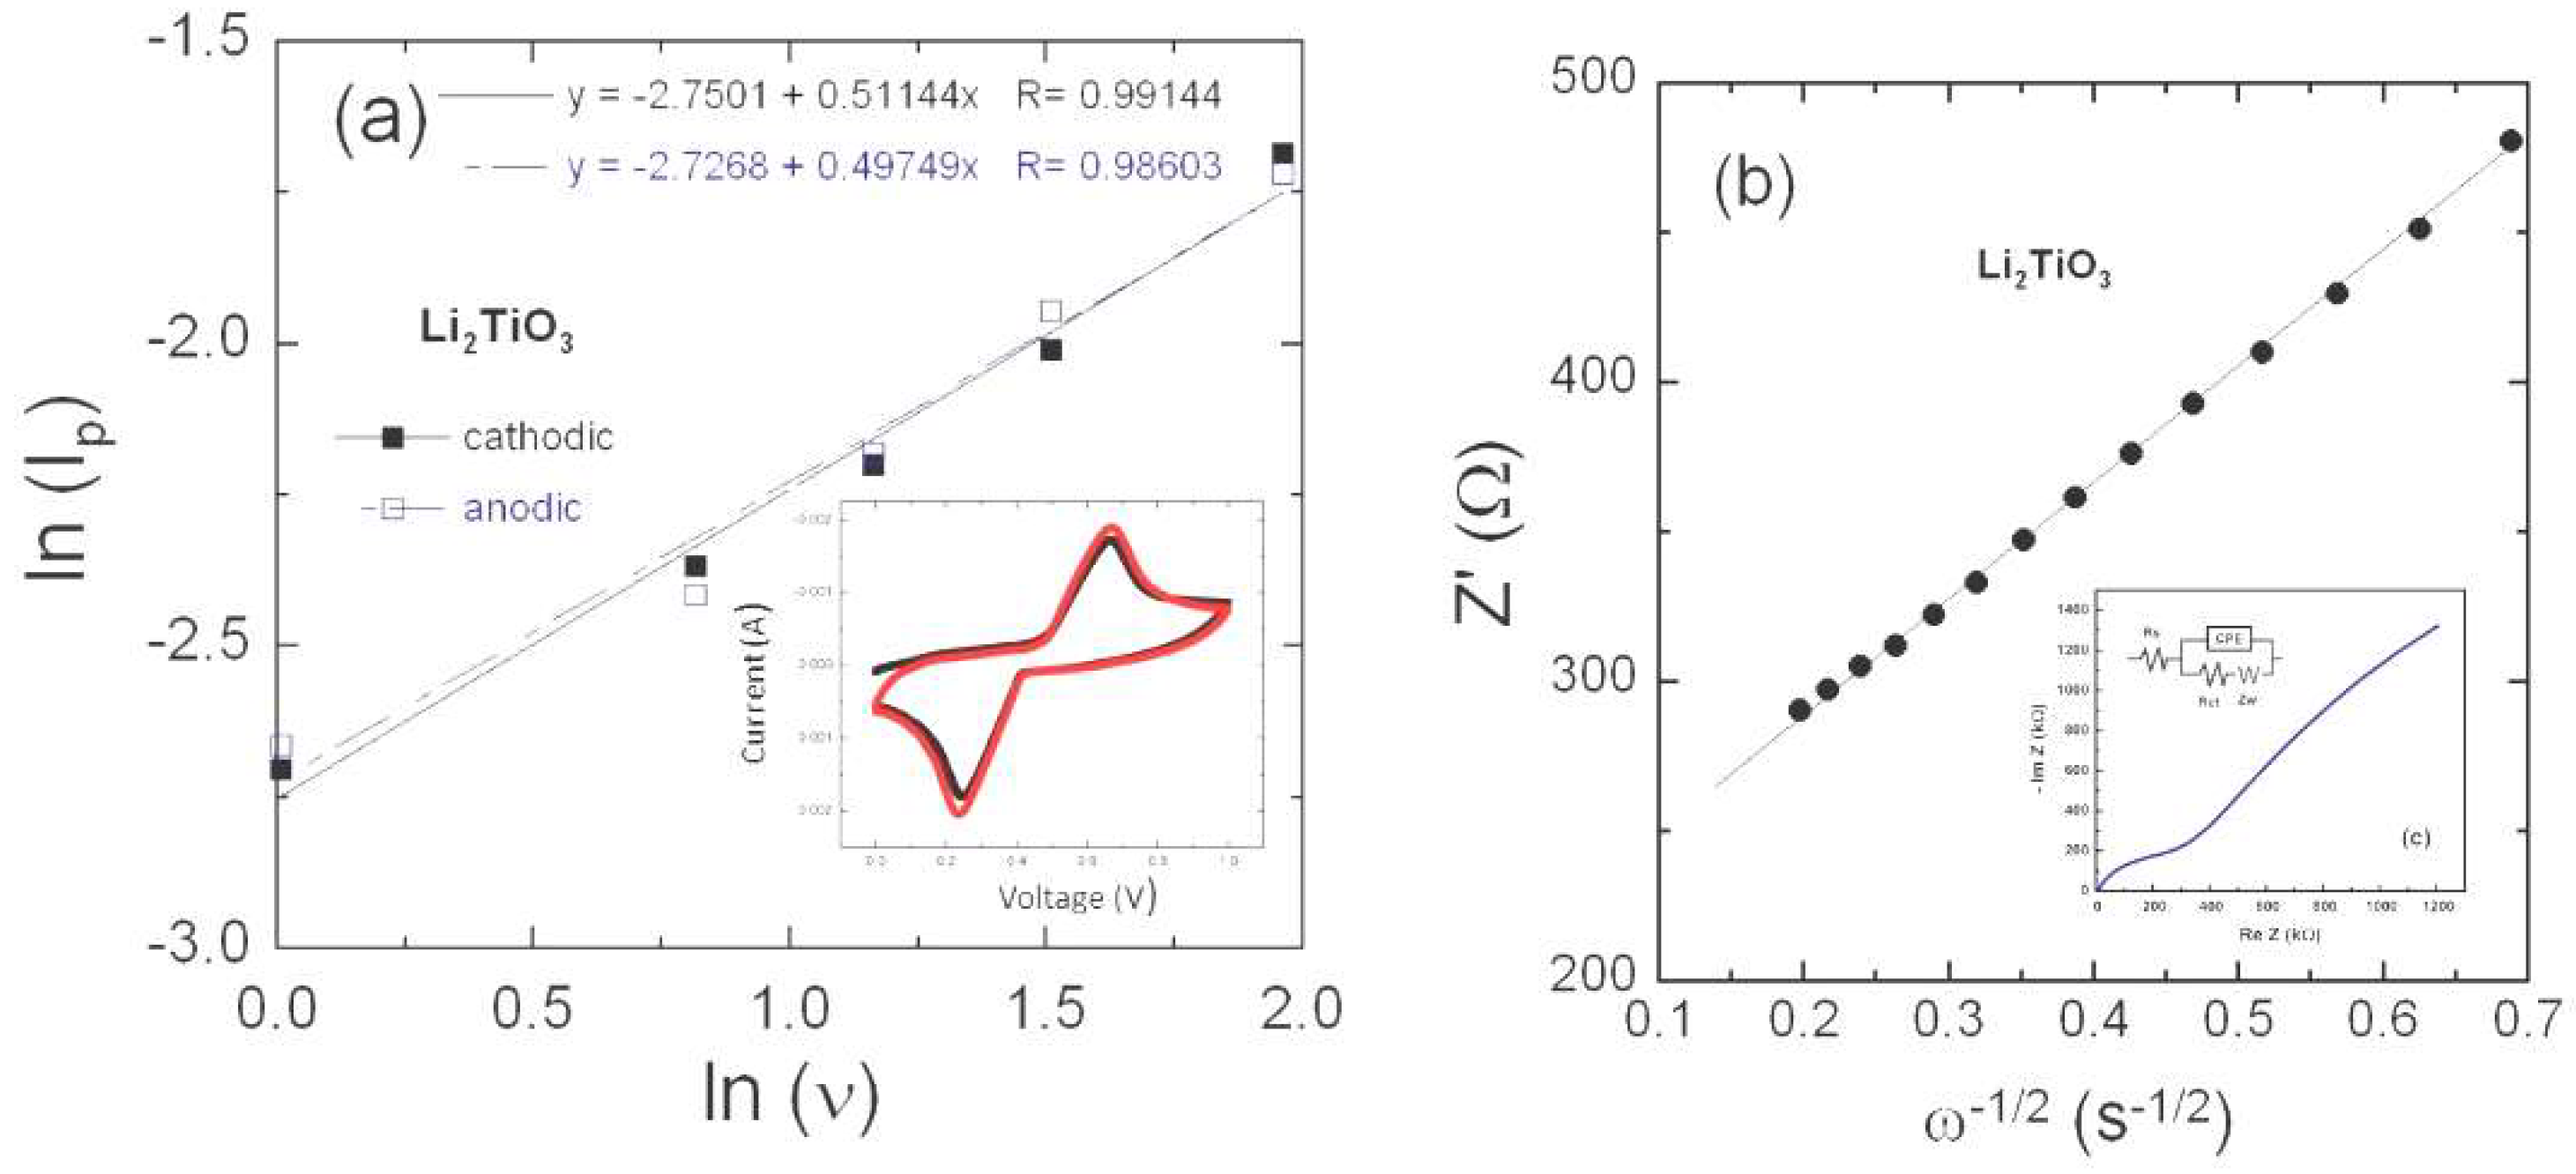
Figure 7a displays the dependency of the peak current Ip for the redox peaks as a function of scan rate ν in CV measurements (typical CV response at ν = 10 mV s−1 is shown in the inset of Figure 7a). For cathodic and anodic reactions, the plots in double logarithmic scale show mutual linear behavior over the entire measurement range with a slope of 0.511 and 0.497, respectively. These values are very close to 0.5, which characterizes the conventional diffusion-controlled faradaic reaction, i.e., the lithium insertion/extraction reaction in LTO. The classical Randles–Sevcik equation for a semi-infinite diffusion of Li-ion into Li2TiO2 layer can be applied [77]:
I p = 0.446 [ n 3 F 2 C Li 2 A 2 D Li ν R T ] 1 2
where Ip is the peak current, n the charge-transfer number, A the surface area in cm2 of the electrode, DLi the chemical diffusion coefficient, ν the scan rate, CLi the bulk concentration of Li-ion in electrode (~1.8 × 10⁻³ mol cm−3 calculated from the volume of Li2TiO3 (429.1 Å3)), F is Faraday constant, R the gas constant and T the absolute temperature. Based on Equation (9), the apparent diffusion coefficient of Li-ion in the nanostructured Li2TiO2 sample was calculated to be 9.2 × 10⁻¹² cm2 s−1.
Electrochemical impedance spectroscopy (EIS) was carried out over the frequency range from 1 Hz to 1 MHz for Li2+xTiO3 electrode in the fully charged state, i.e., x (Li) = 0. The Nyquist plot consists of a depressed semicircle in high frequency and straight line at low frequency region. The interception of Z′ axis at high frequency indicating electrode/electrolyte contact resistance corresponds to the solution resistance (Rs). The depressed semicircle in the middle frequency region denotes the charge transfer resistance Rct related to electrochemical reaction at electrode/electrolyte interface. At low frequency, the observed straight line that is the response of the Warburg impedance Zw, which is related to solid-state diffusion of Li+ ions. The impedance spectrum was fitted using the Randles equivalent circuit shown in the inset of Figure 7b. Resistance RS of the electrode is 38 Ω; Rct is ≈250 Ω and slope of the Warburg impedance (θ ≈ 45°) indicates that the electrode is controlled by a diffusion process. In the Warburg regime, the impedance varies with the angular frequency ω according to the law [78]:
Z′ = Rs + Rct + σw ω−1/2
in which the Warburg impedance σw is obtained from the slope of Z′ vs. ω−1/2 in the low-frequency range (Figure 7b). The apparent diffusion coefficient Li+ ions can be quantified from the low-frequency Warburg impedance according the equation [78]:
D L i + = 1 2 [ R T F 2 A C Li σ W ] 2
where R, T and F are the usual constants, A the surface area of the electrode-electrolyte interface and CLi the lithium-ion concentration in the electrode. Linear fit of data in Figure 7b gives σw = 9.36 V s−1/2 and DLi+ = 2.1 × 1011 cm2 s−1. Note that the DLi+(EIS) value is larger by a factor of 2 in comparison to that obtained by CV. Similar difference in DLi+ for the same cathode material by two different techniques is commonly observed [79,80].
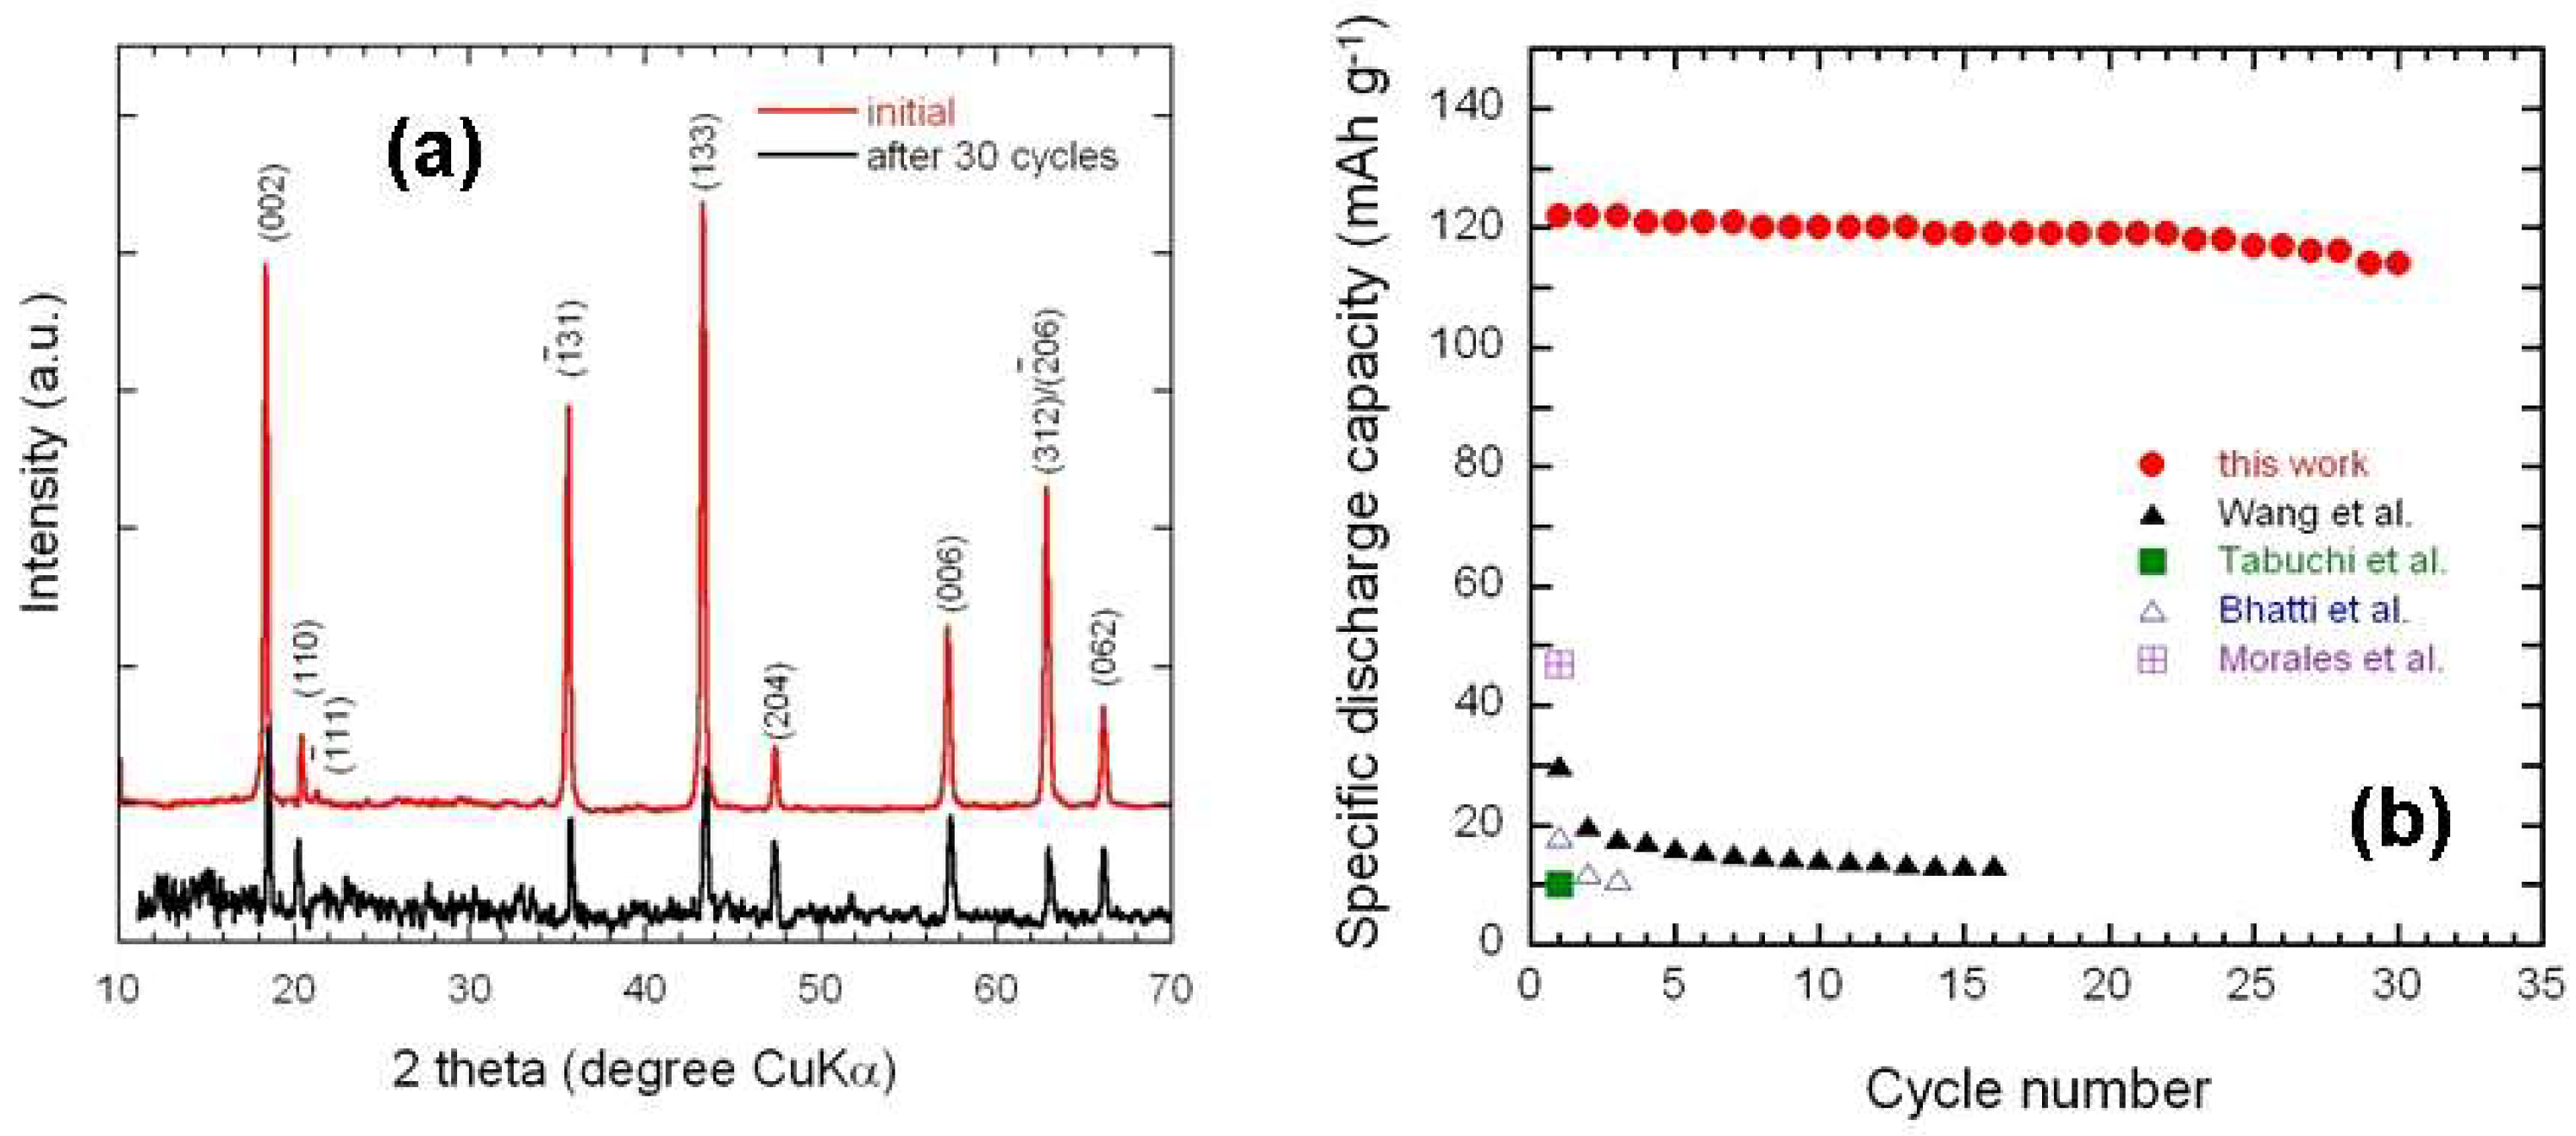
Figure 8a,b present the cyclability of the Li2.55TiO3 electrode (discharge state). The XRD patterns of the starting Li2TiO3 and final Li2.55TiO3 phase after cycling process are displayed in Figure 8a displays. These results show that the structure has retained after 30 insertion-extraction cycles with the C2/c monoclinic symmetry. This insertion process is in good agreement with the model of Bian and Dong [59] who demonstrated the formation of a non-stoichiometric Li2+xTiO3 with x = 0.2 that retains the initial rock-salt structure. These authors have proposed three possible occupation mechanisms in Li-rich Li2TiO3: (i) excess of Li+ ions occupied the tetrahedral interstitial sites, which took the composition Li2+4yTi1−yO3; (ii) the Li+ ions are located on the Ti4+ sites formed as antisite defects (2Li″Ti = 3VO••); and (iii) excess of Li+ ions occupied itself site and Ti4+ and O2− site vacancies formed simultaneously. The plot of the specific discharge capacity vs. cycle number for the Li2TiO3 electrode over 30 cycles in the voltage range 0.0–1.0 V is shown in Figure 5b. The Li2TiO3 anode exhibited an initial discharge capacity of ≈122 mAh g−1 that is retained up to ≈114 mAh g−1 after 30 cycles. The capacity retention is about 94%. In this figure the present results are compared with those of literature [41,43,46,47].

4. Discussion

In view of these previous results reported in Figure 8b, one understands why Li2TiO3 was not considered as a possible anode element. Indeed, the material in these works were not investigated as an anode for itself, but was used as an element entering in the composition of a composite with another anode material, usually Li4Ti5O12 [46,47], or LiFeO2 [41,43]. Coating lamellar cathode element with Li2TiO3 has also been made [81]. In any case, the voltage range used for electrochemical investigation was 1–3 V, since Li4Ti5O12 or LiFeO2 or the lamellar compounds are active only at voltage higher than 1 volt. However, in the range 1-3 V, Li2TiO3 is simply electrochemically inactive. The purpose of the addition of Li2TiO3 in the composite was to increase the ionic conductivity and stabilize the structure of the electrode materials [46,48,81] by taking advantage of the strong Ti-O bond in Li2TiO3 [82,83,84]. In addition, Li2TiO3 is known to be a fast Li+ conductor when it is doped [85,86]. Here, no doping has been made, but the conductivity has been improved owing to the nano-size of the particles. In the present work, we have shown that nanostructured Li2TiO3 has interesting electrochemical properties at low voltage (<1 V). This result can also explain former results obtained on Li4Ti5O12/Li2TiO3 composite. In Ref. [47], the authors noticed an increased capacity of this composite, associated to a sloping discharge in the range 1.25–0 V with respect to the results observed when cycling with a lower cut-off of 1.25 V. Although this effect was attributed to an intrinsic property of Li4Ti5O12 since an increased capacity in this voltage range has been reported by one group with Li4Ti5O12 alone [87], the present work suggests that at least part of this effect can be attributed to Li2TiO3. In addition, the enhanced conductivity and the correlated improved Li-diffusion by reduction of the Li2TiO3 material to the nanosize observed in the present work explains the enhanced electrochemical performance of recent electrospun Li4Ti5O12/Li2TiO3 composite nanofibers observed recently [88].
Table 2. Values of the activation energy for the charge carrier transport in Li2TiO3 reported in the literature.
Method UsedActivation Energy (eV)Ref.
7Li NMR, a.c. conductivity0.47–0.80[89]
a.c. conductivity0.81–0.91[90]
electrical conductivity0.60–0.90[37]
6,7Li NMR0.27[74]
periodic quantum−chemical DFT0.44–0.54[75]
complex impedance0.77/0.88[38]
d.c. conductivity0.86[68]
6,7Li NMR0.52[91]
atomistic simulation0.51[92]
DFT calculations0.76[93]
a.c. conductivity0.65/0.71this work
Few experimental works reported the kinetics of Li+ ion in the LTO framework, while the Li ion dynamics is discussed controversially. Table 2 list the values of the activation energy for the charge carrier transport in Li2TiO3 reported in the literature. Vijayakumar et al. utilized a combination of 6,7Li nuclear magnetic resonance (NMR) and molecular dynamics (MD) simulations to predict that Li ions can be occupy a tetrahedral site if a Ti cationic defect is present in the LiTi2 layer. They obtained a small activation energy of 0.27 eV for Li diffusion in β-Li2TiO3, which seems to be associated with impurities and stoichiometric deviation [74]. Ruprecht et al. [89] reported a self-diffusion coefficient of 2 × 10⁻¹³ cm2 s−1 measured by 7Li NMR stimulated echoes at 160 °C and an extremely slow Li diffusion, i.e., DLi+ = 3 × 10⁻¹⁷ cm2 s−1 at room temperature, evaluated from a.c. conductivity with the help of the Nernst-Einsten equation. Islam and Bredow [75] determined activation energies ranging between 0.44 and 0.55 eV for Li+ ion migrating along the ab plane and perpendicularly to the LiTi2 layers as well. The early work by Vitins et al. [90] shows that the electrical conductivity of Li2TiO3 is strongly dependent on the heat treatment conditions during sample preparation. Typical specimen mixed with 1.5 mol% Li+ and annealed at 760 °C for 20 h exhibits a conductivity of σ300 = 4 × 10⁻⁶ S cm−1 and Ea = 0.81 eV in the temperature range 187–424 °C. The authors suggested an excess TiO2 incorporated in the lattice by TiLi3+ defects charge compensated for by VLi−1 defects, which facilitates Li diffusion. Ruprecht et al. [89] reported a dc conductivity of 5 × 10⁻¹³ and 4 × 10⁻⁶ S cm−1 at room temperature and 250 °C, respectively (with Ea = 0.8 eV for long-range Li transport above 100 °C), which is very close with the value 3 × 10⁻⁶ S cm−1 at 300 °C obtained by Fehr and Schmidbauer [37]. Employing atomistic simulations to study the point defect processes and lithium diffusion in LTO, Kuganathan et al. evaluated the activation energy of 0.51 eV for Li+ migration along the ab plane and showed that the energetically favorable intrinsic defect is lithium Frenkel type with 1.25 eV per defect [92]. More recently, Ki et al. considered three types of lithium vacancies to investigate the diffusion behavior of tritium in LTO using density functional theory (DFT) calculations and found a minimum energy barrier of 0.76 eV for the tritium atom to escape the Li vacancy well [93].

5. Conclusions

The nanocrystalline Li2TiO3 phase has been successfully synthesized using a simple, low cost and scalable hydrothermal reaction. The structural analyses carried out using X-ray diffraction, Raman and FTIR spectroscopy show that β-Li2TiO3 crystallizes with C2/c space group with crystallites 34 nm. FESEM image shows that the nanocrystalline β-Li2TiO3 particles are homogeneously distributed as nearly spherical shaped grains with an average size of 150 nm. The Raman and FTIR spectroscopy confirm the impurity free monoclinic structure exhibiting well-defined vibrational modes Ti-O and Li-O stretching and O-Ti-O and O-Li-O bending modes. The electrical properties revealed a thermally activated conduction mechanism (Arrhenius-type behavior) with an activation energy of 0.71 eV. The conduction mechanism of the sample is greatly improved due to more charge carriers corresponding to nanoparticles. The electrochemical of β-Li2TiO3 studies demonstrate that reduction of Ti4+/Ti3+ (0.55 Li uptake) occurred in potential range 1.0–0.0 V. The nanocrystalline β-Li2TiO3 shows a specific discharge capacity of 114 mAh g−1 after 30 cycles at current density of 0.05 mAh cm-2. These results suggest that nanocrystalline β-Li2TiO3 nano particles have shortened the Li–ion diffusion lengths and enhanced the electrochemical kinetics of the sample, which are very important keys to high rate capacity. The electrode retains 94% of capacity even after 30 cycles with an excellent structural stability.

Author Contributions

Conceptualization, O.M.H.; experimental, A.L.-N.; data analysis; C.M.J.; writing—review and editing, C.M.J. and A.M.

Funding

This work was supported by the Council of Scientific & Industrial Research (CSIR), India. Grant CSIR-UGC NET-JRF/SRF.

Conflicts of Interest

The authors declare no conflict of interest.

References

  1. Julien, C.M.; Mauger, A.; Vijh, A.; Zaghib, K. Lithium Batteries: Science and Technology; Springer: Cham, Switzerland, 2016. [Google Scholar]
  2. Mauger, A.; Xie, H.; Julien, C.M. Composite anodes for lithium-ion batteries: Status and trends. AIMS Mater. Sci. 2016, 3, 1054–1106. [Google Scholar] [CrossRef]
  3. Aykol, M.; Kim, S.; Hegde, V.I.; Snydacker, D.; Lu, Z.; Hao, S.; Kirklin, S.; Morgan, D.; Wolverton, C. High-throughput computational design of cathode coatings for Li-ion batteries. Nat. Commun. 2016, 7, 13779. [Google Scholar] [CrossRef] [PubMed] [Green Version]
  4. Krtil, P.; Fattakhova, D. Li insertion into Li-Ti-O spinels: Voltammetric and electrochemical impedance spectroscopy study. J. Electrochem. Soc. 2001, 148, A1045–A1050. [Google Scholar] [CrossRef]
  5. Pfanzell, M.; Kubiak, P.; Fleischhmmer, M.; Wohlfahrt-Mehrens, M. TiO2 rutile—An alternative anode material for safe lithium-ion batteries. J. Power Sources 2011, 196, 6815–6821. [Google Scholar] [CrossRef]
  6. Guo, Y.-G.; Hu, Y.-S.; Sigle, W.; Maier, J. Superior electrode performance of nanostructured mesoporous TiO2 (anatase) through efficient hierarchical mixed conducting networks. Adv. Mater. 2007, 19, 2087–2091. [Google Scholar] [CrossRef]
  7. Armstrong, G.; Armstrong, A.R.; Bruce, P.G.; Reale, P.; Scrosati, B. TiO2(B) nanowires as an improved anode material for lithium-ion batteries containing LiFePO4 or LiNi0.5Mn1.5O4 cathodes and a polymer electrolyte. Adv. Mater. 2006, 18, 2597–2600. [Google Scholar] [CrossRef]
  8. Yang, J.; Zhao, J.; Chen, Y.; Li, Y. Preparation and characterization of LiTi2O4 anode material synthesized by one-step solid-state reaction. Ionics 2010, 16, 425–429. [Google Scholar] [CrossRef]
  9. Ogihara, T.; Kodera, T. Synthesis of Li2Ti3O7 anode materials by ultrasonic spray pyrolysis and their electrochemical properties. Materials 2013, 6, 2285–2294. [Google Scholar] [CrossRef]
  10. Hong, Z.; Wei, M.; Ding, X.; Jiang, L.; Wei, K. Li2ZnTi3O8 nanorods: A new anode material for lithium-ion battery. Electrochem. Commun. 2010, 12, 720–723. [Google Scholar] [CrossRef]
  11. Zaghib, K.; Simoneau, M.; Armand, M.; Gauthier, M. Electrochemical study of Li4Ti5O12 as negative electrode for Li-ion polymer rechargeable batteries. J. Power Sources 1999, 81–82, 300–305. [Google Scholar] [CrossRef]
  12. Han, J.-T.; Huang, Y.-H.; Goodenough, J.B. New anode framework for rechargeable lithium batteries. Chem. Mater. 2011, 23, 2027–2029. [Google Scholar] [CrossRef]
  13. Gicquel, C.; Mayer, M.; Bouaziz, R. Diagramme de phase du système Li2O-TiO2. C. R. Acad. Sci. Ser. C 1972, 275, 1427–1430. [Google Scholar]
  14. Izquierdo, G.; West, A.R. Phase equilibria in the system Li2O-TiO2. Mater. Res. Bull. 1980, 15, 1655–1660. [Google Scholar] [CrossRef]
  15. Kleykamp, H. Enthalpy, heat capacity and enthalpy of transformation of Li2TiO3. J. Nucl. Mater. Sci. 2001, 43, 244–248. [Google Scholar] [CrossRef]
  16. Kleykamp, H. Phase equilibria in the Li-Ti-O system and physical properties of Li2TiO3. Fusion Eng. Des. 2002, 61, 361–366. [Google Scholar] [CrossRef]
  17. Laumann, A.; Fehr, K.T.; Wachsmann, M.; Holzapfel, M.; Iversen, B.B. Metastable formation of low temperature cubic Li2TiO3 under hydrothermal conditions—Its stability and structural properties. Solid State Ion. 2010, 181, 1525–1529. [Google Scholar] [CrossRef]
  18. Lang, G. Die kristallstruktur einiger vertreter der verbindungsklasse MeI2MeIVO3 als beitrag zur aufklarung der ordnungsphase von Li2TiO3. Z. Anorg. Allg. Chem. 1954, 276, 77–94. [Google Scholar] [CrossRef]
  19. Kataoka, K.; Takahashi, Y.; Kijima, N.; Nagai, H.; Akimoto, J.; Idemoto, Y.; Ohshima, K.-I. Crystal growth and structure refinement of monoclinic Li2TiO3. Mater. Res. Bull. 2009, 44, 168–172. [Google Scholar] [CrossRef]
  20. Laumann, A.; Jensen, K.M.O.; Tyrsted, C.; Bremholm, M.; Fehr, K.T.; Holzapfel, M.; Iversen, B.B. In situ synchrotron X-ray diffraction study of the formation of cubic Li2TiO3 under hydrothermal conditions. Eur. J. Inorg. Chem. 2011, 14, 2221–2226. [Google Scholar] [CrossRef]
  21. Ramaraghavulu, R.; Buddhudu, S.; Bhaskar-Kumar, G. Analysis of structural and thermal properties of Li2TiO3 ceramic powders. Ceram. Int. 2011, 37, 1245–1249. [Google Scholar] [CrossRef]
  22. Dorrian, J.F.; Newnham, R.E. Refinement of the structure of Li2TiO3. Mater. Res. Bull. 1969, 4, 179–183. [Google Scholar] [CrossRef]
  23. Murphy, S.T.; Hine, N.D.M. Point defects and non-stoichiometry in Li2TiO3. Chem. Mater. 2014, 26, 1629–1638. [Google Scholar] [CrossRef]
  24. Castellanos, M.; West, A.R. Order-disorder phenomena in oxides with rock salt structures: The system Li2TiO3–MgO. J. Mater. Sci. 1979, 14, 450–454. [Google Scholar] [CrossRef]
  25. Aguas, M.D.; Coombe, G.C.; Parkin, I.P. New solid-state routes to lithium transition metal oxides via reactions with lithium oxide. Polyhedron 1998, 17, 49–53. [Google Scholar] [CrossRef]
  26. Bhaskar-Kumar, G.; Buddhudu, S. Synthesis and emission analysis of RE3+ (Eu3+ or Dy3+): Li2TiO3 ceramics. Ceram. Int. 2009, 35, 521–525. [Google Scholar] [CrossRef]
  27. Wu, X.; Wen, Z.; Lin, B.; Xu, X. Sol–gel synthesis and sintering of nano-size Li2TiO3 powder. Mater. Lett. 2008, 62, 837–839. [Google Scholar] [CrossRef]
  28. Jung, C.H.; Park, J.Y.; Oh, S.J.; Park, H.K.; Kim, Y.S.; Kim, D.K.; Kim, J.H. Synthesis of Li2TiO3 ceramic breeder powders by the combustion process. J. Nucl. Mater. 1998, 253, 203–212. [Google Scholar] [CrossRef]
  29. Sinha, A.; Nair, S.R.; Sinha, P.K. Single step synthesis of Li2TiO3 powder. J. Nucl. Mater. 2010, 399, 162–166. [Google Scholar] [CrossRef]
  30. Jung, C.-H.; Lee, S.J.; Kriven, W.M.; Park, J.-Y.; Ryu, W.-S. A polymer solution technique for the synthesis of nano-sized Li2TiO3 ceramic breeder powders. J. Nucl. Mater. 2008, 373, 194–198. [Google Scholar] [CrossRef]
  31. Zhang, L.; He, G.; Zhaou, D.; Zhou, J.; Yao, Q. Study on transformation mechanism of lithium titanate modified with hydrochloric acid. Ionics 2016, 22, 2007–2014. [Google Scholar] [CrossRef]
  32. Ma, J.-L.; Fu, Z.-F.; Gao, J.; Zhang, X.-S. A simple method to synthesize nanosized Li2TiO3 powders through high-energy ball-milling. Powder Metall. Met. Ceram. 2015, 54, 410–415. [Google Scholar] [CrossRef]
  33. Lulewicz, J.D.; Roux, N. Fabrication of Li2TiO3 pebbles by the extrusion–spheronisation–sintering process. J. Nucl. Mater. 2002, 307, 803–806. [Google Scholar] [CrossRef]
  34. Wang, H.; Yang, M.; Gong, Y.; Feng, L.; Dang, C.; Shia, Y.; Shi, Q.; Wei, J.; Liao, Z.; Lu, T. Fabrication of nanostructured Li2TiO3 ceramic pebbles as tritium breeders using powder particles synthesized via a CTAB-assisted method. Ceram. Int. 2017, 43, 5680–5686. [Google Scholar] [CrossRef]
  35. Miao, B.; Zeng, W.; Hussain, S.; Mei, Q.; Xu, S.; Zhang, H.; Li, Y. Large scale hydrothermal synthesis of monodisperse hexagonal WO3 nanowire and the growth mechanism. Mater. Lett. 2015, 147, 12–15. [Google Scholar] [CrossRef]
  36. Wan, Z.; Yu, Y.; Zhang, H.F.; Gao, T.; Chen, X.J.; Xiao, C.J. First-principles study of electronic, dynamical and thermodynamic properties of Li2TiO3. Eur. Phys. J. B 2012, 85, 181–187. [Google Scholar] [CrossRef]
  37. Fehr, T.; Schmidbauer, E. Electrical conductivity of Li2TiO3 ceramics. Solid State Ion. 2007, 178, 35–41. [Google Scholar] [CrossRef]
  38. Dash, U.; Sahoo, S.; Chaudhuri, P.; Parashar, S.K.S.; Parashar, K. Electrical properties of bulk and nano Li2TiO3 ceramics: A comparative study. J. Adv. Ceram. 2014, 3, 89–97. [Google Scholar] [CrossRef]
  39. Kim, J.-S.; Johnson, C.S.; Vaughey, J.T.; Thackeray, M.M.; Hackney, S.A.; Yoon, W.; Grey, C.P. Electrochemical and structural properties of xLi2M’O3 (1-x)LiMn0.5Ni0.5O2 electrodes for lithium batteries (M’ = Ti, Mn, Zr; 0 ≤ x ≤ 0.3). Chem. Mater. 2004, 16, 1996–2006. [Google Scholar] [CrossRef]
  40. Chauvaut, V.; Cassir, M. Behaviour of titanium species in molten Li2CO3+Na2CO3 and Li2CO3+K2CO3 in the anodic conditions used in molten carbonate fuel cells. II. Electrochemical intercalation of Li+ in Li2TiO3 at 600 °C and 650 °C. J. Electroanal. Chem. 1999, 474, 9–15. [Google Scholar] [CrossRef]
  41. Tabuchi, M.; Nakashima, A.; Shigemura, H.; Ado, K.; Kobayashi, H.; Sakaebe, H.; Tatsumi, K.; Kageyama, H.; Nakamura, T.; Kanno, R. Fine Li(4-x)/3Ti(2-2x)/3FexO2 (0.18 ≤ x ≤ 0.67) powder with cubic rock-salt structure as a positive electrode material for rechargeable lithium batteries. J. Mater. Chem. 2003, 13, 1747–1757. [Google Scholar] [CrossRef]
  42. Shigemura, H.; Tabuchi, M.; Sakaebe, H.; Kobayashi, H.; Kageyama, H. Lithium extraction and insertion behavior of nanocrystalline Li2TiO3-LiFeO2 solid solution with cubic rock salt structure. J. Electrochem. Soc. 2003, 150, A638–A644. [Google Scholar] [CrossRef]
  43. Morales, J.; Santos-Pena, J.; Trocoli, R.; Franger, S. Electrochemical activity of rock-salt-structured LiFeO2-Li4/3Ti2/3O2 nanocomposites in lithium cells. J. Nanopart. Res. 2008, 10, 217–226. [Google Scholar] [CrossRef]
  44. Shi, J.; Liang, Y.; Li, L.; Peng, Y.; Yang, H. Evaluation of the electrochemical characteristics of silicon/lithium titanate composite as anode material for lithium ion batteries. Electrochim. Acta 2015, 155, 125–131. [Google Scholar] [CrossRef]
  45. Ko, Y.N.; Choi, S.H.; Kang, Y.C.; Park, S.B. Characteristics of Li2TiO3-LiCrO2 composite cathode powders prepared by ultrasonic spray pyrolysis. J. Power Sources 2013, 244, 336–343. [Google Scholar] [CrossRef]
  46. Wang, Y.; Zhou, A.; Dai, X.; Geng, L.; Li, J.; Li, J. Solid–state synthesis of submicron–sized Li4Ti5O12/Li2TiO3 composites with rich grain boundaries for lithium ion batteries. J. Power Sources 2014, 266, 114–120. [Google Scholar] [CrossRef]
  47. Bhatti, H.S.; Anjum, D.; Ullah, S.; Ahmed, B.; Habib, A.; Karim, A.; Hasanain, S.K. Electrochemical characteristics and Li+ ion intercalation kinetics of dual-phase Li4Ti5O12/Li2TiO3 composite in the voltage range 0–3 V. J. Phys. Chem. C 2016, 120, 9553–9561. [Google Scholar] [CrossRef]
  48. Lu, J.; Peng, Q.; Wang, W.; Nan, C.; Li, L.; Li, Y. Nanoscale coating of LiMO2 (M = Ni, Co, Mn) nanobelts with Li+-conductive Li2TiO3: toward better rate capabilities for Li-ion batteries. J. Am. Chem. Soc. 2013, 135, 1649–1652. [Google Scholar] [CrossRef] [PubMed]
  49. Deng, H.; Nie, P.; Luo, H.; Zhang, Y.; Wang, J.; Zhang, X. Highly enhanced lithium storage capability of LiNi0.5Mn1.5O4 by coating with Li2TiO3 for Li-ion batteries. J. Mater. Chem. A 2014, 2, 18256–18262. [Google Scholar] [CrossRef]
  50. Jia, G.; Liu, S.; Yang, G.; Li, F.; Wu, K.; He, Z.; Shangguan, X. Effects of Li2TiO3 coating on the structure and the electrochemical properties of LiNi0.5Mn0.5O2 cathode materials at high voltages. Ionics 2019, 25, 399–410. [Google Scholar] [CrossRef]
  51. Zhao, E.; Liu, X.; Hu, Z.; Sun, L.; Xiao, X. Facile synthesis and enhanced electrochemical performances of Li2TiO3-coated lithium-rich layered Li1.13Ni0.30Mn0.57O2 cathode materials for lithium-ion batteries. J. Power Sources 2015, 294, 141–149. [Google Scholar] [CrossRef]
  52. Wang, J.; Yu, Y.; Li, B.; Fu, T.; Xie, D.; Cai, J.; Zhao, J. Improving the electrochemical properties of LiNi0.5Co0.2Mn0.3O2 at 4.6 V cutoff potential by surface coating with Li2TiO3 for lithium-ion batteries. Phys. Chem. Chem. Phys. 2015, 17, 32033–32043. [Google Scholar] [CrossRef] [PubMed]
  53. Lakshmi-Narayana, A.; Dhananjaya, M.; Guru-Prakash, N.; Hussain, O.M.; Julien, C.M. Nanocrystalline Li2TiO3 electrodes for supercapattery application. Ionics 2017, 23, 3419–3428. [Google Scholar] [CrossRef]
  54. Lakshmi-Narayana, A.; Dhananjaya, M.; Guru-Prakash, N.; Hussain, O.M.; Mauger, A.; Julien, C.M. Li2TiO3/graphene and Li2TiO3/CNT composites as anodes for high power Li–ion batteries. ChemistrySelect 2018, 3, 9150–9158. [Google Scholar] [CrossRef]
  55. Hoshino, T.; Kawamura, H.; Dokiya, M.; Takahashi, Y.; Terai, T.; Yamawaki, M. Non-stoichiometry of Li2TiO3 under hydrogen atmosphere conditions. J. Nucl. Mater. 2004, 329, 1300–1304. [Google Scholar] [CrossRef]
  56. Roisnel, T.; Rodriguez-Carjaval, J. WinPLOTR: A windows tool for powder diffraction pattern analysis. Mater. Sci. Forum 2001, 378, 118–123. [Google Scholar] [CrossRef]
  57. Langford, J.I.; Wilson, A.J.C. Scherrer after sixty years: A survey and some new results in the determination of crystallite size. J. Appl. Cryst. 1978, 11, 102–113. [Google Scholar] [CrossRef]
  58. Julien, C. Local cationic environment in lithium nickel-cobalt oxides used as cathode materials for lithium batteries. Solid State Ion. 2000, 136, 887–896. [Google Scholar] [CrossRef]
  59. Bian, J.J.; Dong, Y.F. Sintering behavior, microstructure and microwave dielectric properties of Li2+xTiO3 (0 ≤ x ≤ 0.2). Mater. Sci. Eng. B 2011, 176, 147–151. [Google Scholar] [CrossRef]
  60. Zhang, T.; Zuo, R.; Zhang, J. Structure, microwave dielectric properties and low-temperature sintering of acceptor/donor codoped Li2Ti1-x(Al0.5Nb0.5)xO3 ceramics. J. Am. Ceram. Soc. 2016, 99, 825–832. [Google Scholar] [CrossRef]
  61. Nakazawa, T.; Naito, A.; Aruga, T.; Grismanovs, V.; Chimi, Y. High energy heavy ion induced structural disorder in Li2TiO3. J. Nucl. Mater. 2007, 367, 1398–1403. [Google Scholar] [CrossRef]
  62. Mukai, K.; Kato, Y.; Nakano, H. Understanding the zero-strain lithium insertion scheme of Li[Li1/3Ti5/3]O4: Structural changes at atomic scale clarified by Raman spectroscopy. J. Phys. Chem. C 2014, 118, 2992–2999. [Google Scholar] [CrossRef]
  63. Denisova, T.A.; Maksimova, L.G.; Polyalov, E.V.; Zhuravlev, N.A.; Kovyazina, S.A.; Leonidova, O.N.; Khazbibulin, D.F.; Yureva, E.I. Metatitanic acid: Synthesis and properties. Russ. J. Inorg. Chem. 2006, 51, 691–699. [Google Scholar] [CrossRef]
  64. Amalraj, F.; Markovsky, B.; Sharon, D.; Talianker, M.; Zinigrad, E.; Persky, R.; Haik, O.; Grinblat, J.; Lampert, J.; Schulz-Dobrick, M.; et al. Study of the electrochemical behavior of the “inactive” Li2MnO3. Electrochim. Acta 2012, 78, 32–39. [Google Scholar] [CrossRef]
  65. Julien, C.M.; Massot, M. Lattice vibrations of materials for lithium rechargeable batteries III Lithium manganese oxides. Mater. Sci. Eng. B 2003, 100, 69–78. [Google Scholar] [CrossRef]
  66. Li, Z.; Du, F.; Bie, X.; Zhang, D.; Cai, Y.; Cui, X.; Wang, C.; Chen, G.; Wei, Y. Electrochemical kinetics of the Li[Li0.23Co0.3Mn0.47]O2 cathode material by GITT and EIS. J. Phys. Chem. C 2010, 114, 22751–22757. [Google Scholar] [CrossRef]
  67. Yu, C.-L.; Yanagisawa, K.; Kamiya, S.; Kozawa, T.; Ueda, T. Monoclinic Li2TiO3 nano–particles via hydrothermal reaction: Processing and structure. Ceram. Int. 2014, 40, 1901–1908. [Google Scholar] [CrossRef]
  68. Dash, U.; Sahoo, S.; Parashar, S.K.S.; Chaudhuri, P. Effect of Li+ ion mobility on the grain boundary conductivity of Li2TiO3 nanoceramics. J. Adv. Ceram. 2014, 3, 98–108. [Google Scholar] [CrossRef]
  69. Ngai, K.L.; Leon, C. Cage decay, near constant loss, and crossover to cooperative ion motion in ionic conductors: Insight from experimental data. Phys. Rev. B 2002, 66, 064308. [Google Scholar] [CrossRef] [Green Version]
  70. Eddrief, M.; Dzwonkowski, P.; Julien, C.; Balkanski, M. The ac conductivity in B2O3-xLi2O films. Solid State Ion. 1991, 45, 77–82. [Google Scholar] [CrossRef]
  71. Dzwonkowski, P.; Eddrief, M.; Julien, C.; Balkanski, M. Electrical a.c. conductivity of B2O3-xLi2O glass thin films and analysis using the electric modulus formalism. Mater. Sci. Eng. B 1991, 8, 193–200. [Google Scholar] [CrossRef]
  72. Elliott, S.R. Temperature dependence of a.c. conductivity of chalcogenide glasses. Philos. Mag. B 1978, 37, 553–560. [Google Scholar] [CrossRef]
  73. Jonscher, A.K. The universal dielectric response. Nature 1977, 267, 673–679. [Google Scholar] [CrossRef]
  74. Vijayakumar, M.; Kerisit, S.; Yang, Z.G.; Graff, G.L.; Liu, J.; Sears, J.A.; Burton, S.D.; Rosso, K.M.; Hu, J.Z. Combined 6,7Li NMR and molecular dynamics study of Li diffusion in Li2TiO3. J. Phys. Chem. C 2009, 113, 20108–20116. [Google Scholar] [CrossRef]
  75. Islam, M.M.; Bredow, T. Lithium diffusion pathways in β-Li2TiO3: A theoretical study. J. Phys. Chem. C 2016, 120, 7061–7066. [Google Scholar] [CrossRef]
  76. Sun, X.; Hegde, M.; Zhang, Y.; He, M.; Gu, L.; Wang, Y.; Shu, J.; Radovanovic, P.V.; Cui, B. Structure and electrochemical properties of spinel Li4Ti5O12 nanocomposites as anode for lithium-ion battery. Int. J. Electrochem. Sci. 2014, 9, 1583–1596. [Google Scholar]
  77. Tang, S.B.; Lai, M.O.; Lu, L. Li-ion diffusion in highly (003) oriented LiCoO2 thin film cathode prepared by pulsed laser deposition. J. Alloys Compd. 2008, 449, 300–303. [Google Scholar] [CrossRef]
  78. Ho, C.; Raistrick, I.D.; Huggins, R.A. Application of a–c techniques to the study of lithium diffusion in tungsten trioxide thin films. J. Electrochem. Soc. 1980, 127, 343–350. [Google Scholar] [CrossRef]
  79. Shi, Q.; Hu, R.; Zeng, M.; Zhu, M. A diffusion kinetics study of Li-ion in LiV3O8 thin film electrode. Electrochim. Acta 2010, 55, 6645–6650. [Google Scholar] [CrossRef]
  80. Xie, J.; Tanaka, T.; Imanishi, N.; Matsumura, T.; Hirano, A.; Takeda, Y.; Yamamoto, O. Li-ion transport kinetics in LiMn2O4 thin films prepared by radio frequency magnetron sputtering. J. Power Sources 2008, 180, 576–581. [Google Scholar] [CrossRef]
  81. Yang, X.; Yu, R.; Ge, L.; Wang, D.; Zhao, Q.; Wang, X.; Bai, Y.; Yuan, H.; Shu, H. Facile synthesis and performances of nanosized Li2TiO3-based shell encapsulated LiMn1/3Ni1/3Co1/3O2 microspheres. J. Mater. Chem. A 2014, 2, 8362–8368. [Google Scholar] [CrossRef]
  82. Kim, J.S.; Johnson, C.S.; Thackeray, M.M. Layered xLiMO2∙(1-x)Li2M’O3 electrodes for lithium batteries: A study of 0.95LiMn0.5Ni0.5O2∙0.05Li2TiO3. Electrochem. Commun. 2002, 4, 205–209. [Google Scholar] [CrossRef]
  83. Zhang, L.Q.; Noguchi, H. Novel layered Li-Cr-Ti-O  cathode materials related to the LiCrO2-Li2TiO3 solid solution. J. Electrochem. Soc. 2003, 150, A601–A607. [Google Scholar] [CrossRef]
  84. Zhang, L.Q.; Wang, X.Q.; Noguchi, H.; Yoshio, M.; Takada, K.; Sasaki, T. Electrochemical and ex situ XRD investigations on (1-x)LiNiO2∙xLi2TiO3 (0.05 ≤ x ≤ 0.5). Electrochim. Acta 2004, 49, 3305–3311. [Google Scholar] [CrossRef]
  85. Wu, X.W.; Wen, Z.Y.; Xu, X.G.; Han, J.D. Synthesis and ionic conductivity of Mg-doped Li2TiO3. Solid State Ion. 2008, 179, 1779–1782. [Google Scholar] [CrossRef]
  86. Wu, X.W.; Wen, Z.Y.; Wang, X.Y.; Xu, X.G.; Lin, J.; Song, S.F. Effect of Ta-doping on the ionic conductivity of lithium titanate. Fusion Eng. Des. 2010, 85, 1442–1445. [Google Scholar] [CrossRef]
  87. Zhu, Y.R.; Yin, L.C.; Yi, T.F.; Liu, H.; Xie, Y.; Zhu, R.S. Electrochemical performance and lithium-ion intercalation kinetics of micron-sized Li4Ti5O12 anode material. J. Alloys Compd. 2013, 547, 107–112. [Google Scholar] [CrossRef]
  88. Li, S.; Guo, J.; Ma, Q.; Yang, Y.; Dong, X.; Yang, M.; Yu, W.; Wang, J.; Liu, G. Electrospun Li4Ti5O12/Li2TiO3 composite nanofibers for enhanced high-rate lithium ion batteries. J. Solid State Electrochem. 2017, 21, 2779–2790. [Google Scholar] [CrossRef]
  89. Ruprecht, B.; Wilkening, M.; Ueckerb, R.; Heitjans, P. Extremely slow Li ion dynamics in monoclinic Li2TiO3—probing macroscopic jump diffusion via 7Li NMR stimulated echoes. Phys. Chem. Chem. Phys. 2012, 14, 11974–11980. [Google Scholar] [CrossRef]
  90. Vitins, G.; Kizane, G.; Lusis, A.; Tiliks, J. Electrical conductivity studies in the system Li2TiO3-Li1.33Ti1.67O4. J. Solid State Electrochem. 2002, 6, 311–319. [Google Scholar] [CrossRef]
  91. Baklanova, Y.V.; Arapova, I.Y.; Shein, I.R.; Maksimova, L.G.; Mikhalev, K.N.; Denisova, T.A. Charge distribution and mobility of lithium ions in Li2TiO3 from 6,7Li NMR data. J. Struct. Chem. 2013, 54, 111–118. [Google Scholar] [CrossRef]
  92. Kuganathan, N.; Kordatos, A.; Fitzpatrick, M.E.; Vovk, R.V.; Chroneos, A. Defect process and lithium diffusion in Li2TiO3. Solid State Ion. 2018, 327, 93–98. [Google Scholar] [CrossRef]
  93. Ki, K.; Yang, W.; Wang, W.-H.; Li, Y.-T. First principles study of tritium diffusion in Li2TiO3 crystal with lithium vacancy. Materials 2018, 11, 2383. [Google Scholar]
Figure 1. Ternary Li-Ti-O phase diagram showing the lithiation path of Li2TiO3 (dashed line).
Sci 01 00056 g001
Figure 2. X-ray diffraction pattern of Li2TiO3 powders indexed in the monoclinic symmetry, C2/c space group of the β-Li2TiO3 phase. The Rietveld refinement is shown with χ2 = 5.21.
Sci 01 00056 g002
Figure 3. (a) Raman spectra of titanate compounds: anatase TiO2, rutile TiO2, spinel Li4Ti5O12 and Li2TiO3. (b) FTIR spectrum of Li2TiO3 recorded in the spectral range 100–1000 cm−1 at 2 cm−1 spectral resolution.
Sci 01 00056 g003
Figure 4. Morphology of nano Li2TiO3 (a) FESEM image showing spherical-like shaped grains with an average particle size of 150 nm. (b) HRTEM image, (c) selected area diffraction pattern (SAED) and (d) lattice fringes images of Li2TiO3.
Sci 01 00056 g004
Figure 5. Temperature dependence of the electrical properties of nano-Li2TiO3. Nyquist plots of nanocrystalline Li2TiO3 in the temperature range 320–420 °C (a) and 420–500 °C (b). Variation of real part of the impedance Z″ = Re (Z) vs. frequency (c). Variation of imaginary part of the impedance Z″ = Im(Z) vs. frequency (d). Plot of the ac conductivity σac(ω) versus frequency in the temperature range 360–500 °C (e).
Sci 01 00056 g005
Figure 6. Temperature dependence of (a) a.c. conductivity measured at 50 kHz, (b) d.c. conductivity and (c) relaxation time.
Sci 01 00056 g006
Figure 7. Determination of the Li+-ion transport in nano-Li2TiO3. (a) Plot of ln(Ip) vs. ln (ν) from CV data. Inset shows the typical CV response at 10 mV s−1. (b) Plot of Z′ vs. ω−1/2 plots in the Warburg region of the EIS shown in the inset.
Sci 01 00056 g007
Figure 8. (a) XRD patterns of the starting Li2TiO3 and final Li2.55TiO3 phase after cycling process. (b) Specific discharge capacity vs. cycle number for the Li2TiO3 electrode over 30 cycles at C/13 rate.
Sci 01 00056 g008
Table 1. Frequency (in cm−1) and strength of Raman and infrared bands of β-Li2TiO3. Calculated frequencies are reproduced from Wan et al. [36].
RamanInfrared
ωexp.Intensity *ωcal.ωexp.Intensity *ωcal.
98vw83Ag
211w214Ag139vw143BU
277m278Bg266vw263Bu
294m302Ag357m355Au
303m314Bg390w393Au
350m360Ag452w456Au
402S401Ag510S-
420S432Bg541m544Bu
484w470Bg619S617Au
567w542Ag642s634Au
658S617Ag
* w = weak, vw = very weak, m = medium, S = strong, s = shoulder.