Abstract
The NELIPS acronym stands for Nano-Enhanced Laser-Induced Plasma Spectroscopy. Within this framework, the temporal variation in the enhanced plasma emissions from pure nanomaterials with respect to corresponding bulk materials was monitored as a function of delay time in the range from 1 to 5–11 μs. Six different pure nanomaterials were employed including silver, zinc, aluminum, titanium, iron, and silicon. Radiation from pulsed Nd: YAG laser at wavelength 1064 nm was used to induce both bulk and pure nanomaterial plasmas under similar experimental conditions. Plasma emissions from both targets were monitored via optical emission spectroscopy technique (OES). The spectral line intensities (Signal-To-Noise ratio S/N) from the pure nanomaterial plasma turns out to decline in a constant logarithmic manner but at a slower rate than that from the corresponding bulk material plasma. Consequently, the measured average enhanced emission from different nanomaterials features an increase in an exponential manner with delay time. This trend of increase was accounted for via mathematical elaboration of enhanced emission based on the measured Signal-To-Noise data. Plasma parameters (electron density and temperature) were precisely measured at each delay time as well.
1. Introduction
The focusing of pulsed laser light on plane solid targets with irradiance level above the threshold of plasma ignition leads to an immediate generation of plasma. This process is called laser-induced plasma (LIP). Plasma as the 4th state of matter is characterized by two measurable parameters, namely electron density and temperature. The measured values of plasma parameters are used to specify the plasma’s thermodynamical state of equilibrium and, hence, the set of equilibrium distribution functions that can be applied [1,2,3,4,5]. Fortunately, plasmas induced by lasers lay in the range of local thermodynamical equilibrium (LTE) [1,2,3,4,5]. It was assumed that the emitted light from plasma is strongly influenced by plasma parameters [1,2,3,4,5]. Consequently, the emitted light from plasma is resolved and analyzed utilizing the optical emission spectroscopy (OES) technique. This process is called laser-induced plasma spectroscopy (LIPS) or laser-induced breakdown spectroscopy (LIBS) [6,7]. The latter acronym is almost concerned with the versatile applications by spectrochemists [8,9,10], while the acronym (LIPS) is more concerned with the spectroscopic study of the plasmas induced by lasers. This incorporates the state of thermodynamical equilibrium [1,2,3,4], the set of equilibrium distribution relations that can be applied [1,2,3,4], plasma dynamics (expansion) [11], spectral line shape analysis [12,13], including spectral line shift, asymmetry [14], plasma opacity to different emitted spectral lines via self-absorption and/or self-reversal processes [15,16], the inhomogeneity nature of plasma produced after focusing of laser light on target surface [1,2,3,17], and the observed strong enhanced light emissions from plasma created from pure nanomaterials with respect to bulk counterpart [5,18].
Interestingly, the interaction of pulsed lasers with pure nanomaterials was found to produce more luminescent plasmas than that produced from the pure bulk counterpart of similar stoichiometry [5,18]. This “suggested” inherent tendency has been thoroughly investigated within the framework named with Nano-Enhanced laser-induced plasma spectroscopy (NELIPS) [5]. This approach is more concerned with the practical study (using OES technique) and theoretical modeling (recommended thermodynamical approach) of the observed strong plasma emission originated from pure nanomaterial targets, but in a regular manner (parametric study) [5].
Meanwhile, in the previously published work adopting NELIPS, the experimental measurements were carried out at one arbitrary salient transition wavelength [18]—the doubts about that enhanced emission may be affected by the sintering of nanoparticles when compressed into a tablet shape [19,20]—and, finally, there was an obvious lack of reliable theoretical modeling able to describe, in quantitative manner, the temporal variation in enhanced emission [5,18].
In this article, six different nanomaterials were employed, including silver, zinc, aluminum, silicon, iron, and titanium, together with their respective bulk counterparts with similar stoichiometry. The amount of enhanced emission was monitored using OES technique at different delay times ranging from 1 μs to a maximum of 11 μs at a fixed gate time of 1 μs via proper employment of several spectral lines emitted from each element. The measurement of plasma parameters (electron density and temperature) were carried out at each delay time for both types of plasmas, which are originated from pure nanomaterial and its bulk counterpart. Finally, a rigorous theoretical relation describing the temporal variation in the amount of enhanced emission was elaborated.
2. Experimental Setup and Methodology
This study constitutes one part of a series of parametric studies on pulsed laser interaction with pure nanomaterials, in comparison to its bulk counterpart, within the framework of NELIPS [5]. A detailed description of the experimental setup can be found in ref [18]. It comprises Nd: YAG laser (type Brilliant B-Quantel®, Paris, France) working at a wavelength of 1064 nm with pulse duration time of 5 ns. The level of laser fluence was adjusted to a constant level of 6.3 ± 0.5 J/cm2, at which enhanced emission is pronounced [18]. In order to avoid breakdown in the surrounding air, targets were positioned at a distance of 98 mm from the laser focusing lens (of focal length of 100 mm) (Sill Optics GmbH®, Wendelstein, Germany). The target holder was especially designed in order to guarantee that surface of bulk material will not be deteriorated by splashed hot nanoparticles during the experimental course). The optical emission from both plasmas was monitored during the fixed gate time of 1 μs while the delay time was detuned in the range from 1 to 5 μs up to 11 μs.
The optical emission spectroscopy (OES) comprises SE200-Echelle-type spectrograph (Catalina Scientific®, Tucson, AZ, USA) equipped with a time-controlled ICCD-Camera (type Andor Technology®, Belfast, Ireland) with typical electronic resolution of 0.02 nm per pixel and instrumental bandwidth of 0.2 nm. The light emitted from different plasmas was brought to the spectrograph entrance hole using a 25 μm quartz optical fiber with fair optical throughput.
Six different types of nanomaterials were employed. Ferrous oxide nanomaterial (Fe3O4) with purity 99% (MKN-Fe3O4-M20) (MKnano Co., Ltd., Toronto, ON, Canada) was supplied in the form of magnetic nano-powder crystals of size diameters of around 20 ± 4 nm. This value has been confirmed adopting the application of the established NELIPS technique [refer to Appendix C] which yields nanoparticles with diameter size of (20 ± 1 nm). Likewise, lipophilic titanium oxide (TiO2) was supplied in the form of nano-powder [MKN-TiO2-R020W] (MKnano Co., Ltd., Toronto, ON, Canada) with a certified purity of 92% with nanoparticle diameter size of 20 ± 3 nm while our measurements indicate a diameter of (20 ± 2) nm [see Appendix C]. Moreover, zinc mono oxide (ZnO) was supplied in nano-powder form [MKN-ZnO-030; 1314-13-2] (MKnano Co., Ltd., Toronto, ON, Canada) with a certified purity of 99.9%, with particle diameters of (30 nm) while our measurements indicate diameters of 30 nm according to NELIPS technique [refer to Appendix C]. A pure silver powder [MKN-Ag-090] (MKnano Co., Ltd., Toronto, ON, Canada) of nanoparticles having a diameter of 90 nm has been verified by the supplemented technique to the incorporated particles of sizes about 90 ± 1 nm [see Appendix C]. A pure silicon powder of yellow-brown color (purity 99.9%) of average particle diameter size of 40 nm (MKN-Si-040) (MKnano Co., Ltd., Toronto, ON, Canada) was supplied. The aluminum nanomaterial was supplied in powder form of average particle size around 40 nm (MKN-Al-040) (MKnano Co., Ltd., Toronto, ON, Canada). The supplied nano-powder is molded as a plane target using the popular double-face sticker which adsorbs the nano-powder until being saturated. This simple method was adopted to avoid problems that might arise from nanoparticle-sintering during compression into tablet form [19,20]. The recorded spectrum of the plasmas was taken via accumulation of plasma emissions over three different laser shots on different target positions to ensure fresh target conditions. Moreover, every data point constitutes the average over three separate spectra in order to allow for accurate estimation of the amount of error accompanied with each presented data point.
3. Results and Discussion
3.1. Measurement of Plasma Electron Density and Temperature
Accurate measurement of plasmas electron density is usually carried out utilizing the unique properties of the Hα-line at 656.27 nm [21,22] present in all emission spectra. Within the framework of NELIPS, the relative electron density is the more likely factor which determines any changes in the values of electron density from the bulk-material-based plasma to that from the corresponding nanomaterial-based plasma. Figure 1A–C present three examples of the normalized spectral line shapes of the Hα-line, utilizing emission spectra from silver, zinc, and aluminum at three different delay times as depicted in the subfigures (bulk-based plasma emission is plotted in black color and nanomaterial-based plasmas is plotted in red color), with the overall numerical results given in Table A1 (see Appendix B).
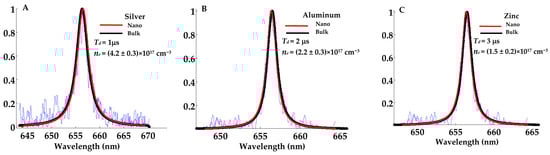
Figure 1.
Spectral line shapes of the Hα-line. (A) Silver, (B) aluminum, and (C) zinc.
On the other hand, a reliable measurement of the electron temperature of laser-induced plasma is normally carried out utilizing the Boltzmann plot method [1,2,3,4,7,8,9], provided that certain tight criteria should be fulfilled [1,2,3,4,23,24,25,26].
In order to construct a straight Boltzmann line, additional corrections to spectral line intensity were carried out against the spectral sensitivity of the used apparatus and distortions in the spectral line shape by plasma opacity (self-absorption) [15,18,27,28].
Figure 2A,B demonstrate the results of the application of the Boltzmann plot method to measure the plasma electron temperatures. The lower dashed straight lines were constructed utilizing spectral lines emerged from plasma and originated from the bulk-based plasma while the upper solid line is assigned to plasma induced at the surface of the nanomaterial. Figure 2A was assigned to neutral silver spectral lines at wavelengths of 546.54, 520.90, 768.77, 827.35, 338.28, and 328.06 nm, while Figure 2B is assigned to the neutral zinc spectral lines at the wavelengths of 481.08, 472.20, 468.01, 636.23, 334.55, and 330.27 nm.
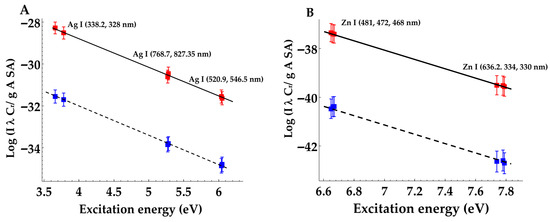
Figure 2.
Examples of the Boltzmann plot method, (A) silver at delay time 3 μs, and (B) zinc at delay time 5 μs.
The overall results at different delay times are presented in Table A1 (Appendix B).
Close inspection to the overall results presented in Table A1 (Appendix B) would evidently validate the assumption laid within the framework of NELIPS [5,18], namely and at a fixed delay time.
So far, an example of the temporal variation in electron density (as measured from bulk and nanomaterial targets) with delay time is presented in Figure 3A, utilizing the data of the silver element (present in both of nanomaterial and bulk forms), while the temporal variation in measured electron temperatures is shown in Figure 3B, utilizing the data of the zinc element’s spectral lines.
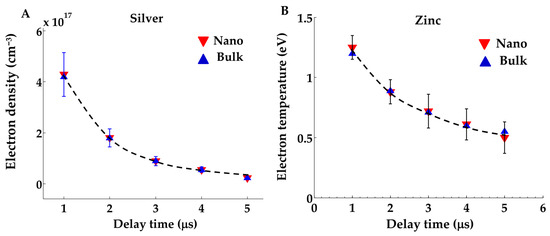
Figure 3.
Temporal variation in plasma parameters, (A) electron density, and (B) electron temperature.
Figure 3A,B indicate a logarithmic decrease in both plasma parameters with delay time, with similar results given in ref [26].
However, the dense unresolved lines emitted from neutral titanium and iron make it nearly impossible to use the Boltzmann plot method to measure electron temperature because of the severe absence of the relevant Stark broadening parameters [29,30,31,32,33].
3.2. Measurement of Average Enhancement over Different Wavelengths
Actually, there are two methods to calculate . The first is via utilizing the Boltzmann plot method which yields reliable values of the average enhanced emission [18]—a good example can be seen in Figure 2; however, it requires good knowledge of associated atomic parameters for each of the employed lines, e.g., transition probability statistical weight and energy of upper state [29] and Stark broadening parameters of each spectral line [29,30,31,32,33].
The other suggested method is simpler and does not require any of the previously mentioned lengthy procedures. It is based on the direct measurement of the ratio
Here, is the average amount of spectral-line intensities emitted from the pure nanomaterial plasma over the wavelength interval and is the corresponding quantity from the corresponding bulk counterpart.
This method is very suitable for certain elements which contain a dense spectral emission (too many emission lines per nm), e.g., iron and titanium. For iron and titanium, we have carefully set in the range from 250 to 580 nm. This range of wavelengths was chosen in order to avoid the unwanted spectral emission lines originated from the ambient air (oxygen, nitrogen, and the Hα-line) or unwanted elements, e.g., the strong (sodium 2D lines at wavelengths 589.0 and 589.6 nm). However, this method might contain some errors, but the averaging over the three measured spectra is sufficient to cover this error. The results of the application of this method to titanium and iron are shown in Figure 4F,H, together with their respective error bars which were found in the range of 10–20%.
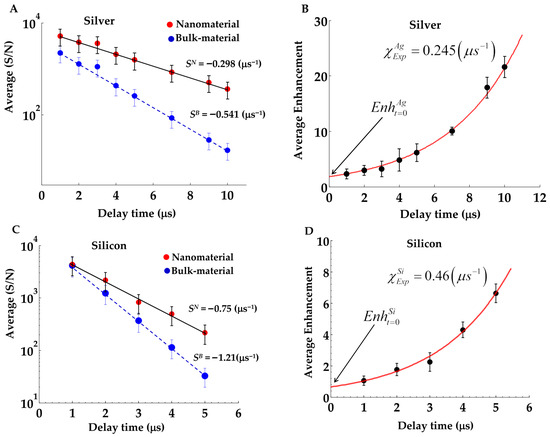
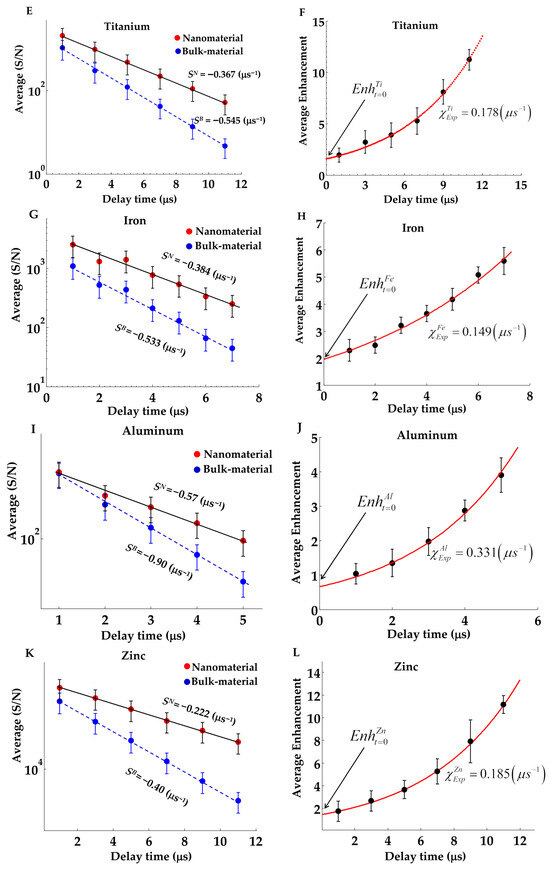
Figure 4.
(A,C,E,G,I,K) Temporal variation in Signal-To-Noise (S/N) ratio utilizing different nanomaterials. (B,D,F,H,J,L) Temporal variation in enhanced emission, together with the evaluated fitting parameters .
Surprisingly, we have found that this method is valid when applied to other elements which are characterized by strong and well-resolved spectral lines, e.g., the neutral atomic spectral lines from silver, zinc, aluminum, and silicon, without resorting to the necessary lengthy corrections against spectral sensitivity of apparatus and plasma opacity (via self-absorption). Hence, the average amount of enhancement over the considered spectral lines can be expressed as
The following set of wavelengths were taken into consideration for the different employed nanomaterials:
- (a)
- Silver: Ag I—lines at wavelengths 328.02, 338.2, 520.9, 546.5, 768.7 and 827.3 nm;
- (b)
- Zinc: Zn I—lines at wavelength 330.29, 334.55, 468.2, 472.2, 481.01, and 636.38 nm;
- (c)
- Aluminum: Al I—lines at wavelengths 308.2, 309.3, 394.8, 396.15 nm;
- (d)
- Silicon: Si I—lines at wavelengths 288.15, 390.55 nm.
The overall results of the temporal variation in enhanced emission are given in Figure 4B,D,J,L for the different elements, together with their respective error bars (calculated as previously mentioned).
In the second column of Figure 4, one can notice that the data points (black solid disks) displays a nonlinear increase in the average amount of enhanced emission with delay time. Obviously, this increasing trend is repeated at different rates with the different employed nanomaterials, while there is no clear evidence that the diameters of the used nanomaterials play some role. Therefore, modeling is an essential issue.
In order to explore the reasons laid behind by the obvious nonlinear increasing trend of the measured temporal variation in enhanced emission from different employed nanomaterials, we have drawn the average signal-to-noise (S/N) ratio from the different pure nanomaterials plasmas and the corresponding values from the bulk-based material plasmas on a logarithmic scale, with the results as shown in Figure 4A,C,E,G,I,K at the first column.
On the other hand, the set of plots shown in the first column in Figure 4 shows a monotonic logarithmic decreasing trend with delay time, but with different values of the slopes between the pure nanomaterial plasma and the corresponding bulk-material-based plasma . Furthermore, the values of the slopes are also different from one element to the other. Moreover, it is clear that the rate of decrease from the pure-nanomaterial-based plasma is smaller than that from the bulk material counterpart, i.e., , this is without a clear effect of the sizes of the used nanomaterials. At this point, it is an essential issue.
3.3. Modeling of the Temporal Variation in Enhanced Emission NELIPS
In order to theoretically predict the measured trend of variation in enhanced emission with time, we have started from the following simplified differential equation:
The solution of this equation can be written as (with the detailed derivations given in Appendix A)
The fitting parameters represent the initial value of enhancement at zero time delay and the strength of variation in the exponential function, respectively. Numerical values of these parameters are depicted in Figure 4B,D,F,H,J,L.
Moreover, the mathematical derivations (as given in Appendix A) show that the exponent-fitting parameter can be expressed in terms of the mathematical difference between the slopes of the straight lines appearing in Figure 4A,C,E,G,I,K, i.e.,
Meanwhile, these slopes, and feature the rates of plasma radiative energy loss during the plasma expansion process. This would inevitably imply that nanomaterial plasma luminosity declines at a relatively lower rate than its bulk counterpart, and it differs from one element to another. Obviously, this difference in rates (Expression (5)) is the main reason for the observed exponential rise in the average amount of enhanced emission.
However, until now, one cannot introduce a clear physical mechanism of the small rate of radiative energy losses from laser-induced plasma from pure nonmaterial This requires further and deeper theoretical research (Foundations of the Electromagnetic theory would be plausible).
4. Conclusions
Within the framework of the NELIPS approach, the temporal variation in the average enhanced plasma emission over different emission wavelengths was explored. Nanomaterials and their bulk-counterpart plasmas, including silver, zinc, aluminum, silicon, iron, and titanium, turn out to nearly share similar plasma electron density and temperature during plasma expansion. However, the monitored average amount of enhancement reveals to exponentially increase with delay time, which was correlated with the recorded slower rate of radiative emission by the plasma generated from the pure nanomaterials. These experimental findings were found compatible with the mathematically suggested approach. These conclusions would encourage us to conduct further investigations to correlate these different rates of radiative energy losses to the basic physical mechanisms responsible for the process of enhanced emission from pure nanomaterials at different delay times via employment of the foundations of EM theory. Furthermore, the results in this research article induce some questions about the typical contribution of the nanoparticles in the process of enhanced emission, e.g.,
- (a)
- Why does this happen when pure nanomaterials are irradiated by pulsed lasers?
- (b)
- Could this enhanced emission happen if one induces plasma from pure nanomaterials by a different excitation method, e.g., inductively coupled plasma (ICP) or by arc discharge?
- (c)
- Is this enhanced emission an inherent property of the nanomaterials’ class of matter?
Author Contributions
Conceptualization, A.E.S.; methodology, A.E.S.; software, A.E.S.; validation, A.E.S. and A.A.; formal analysis, A.E.S.; investigation, A.E.S.; data curation, A.E.S.; writing—original draft preparation, A.E.S.; writing—review and editing, A.E.S. and A.A.; visualization, A.E.S. and A.A.; supervision, A.A. All authors have read and agreed to the published version of the manuscript.
Funding
This research received external funding from the MTC (supply of the different nanomaterials).
Data Availability Statement
The data presented in this study concerning NELIPS are available upon a reasonable request from the corresponding author.
Acknowledgments
The authors would like to express their deepest gratitude to the Quantum Beam Sci.-MDPI-Publishing-House. Special acknowledgement should be addressed to the MTC (Department of Physics and Mathematics) for the supply of the different nanomaterials used in this study via MOU (SAMAA000-37-2022XT).
Conflicts of Interest
The authors declare no conflicts of interest.
Appendix A
Mathematical derivation of the temporal variation in enhanced emission
One can start from the basic definition of enhanced emission,
The rate of change of enhanced emission with time can be expressed as
This can be simply expanded as
Upon rearranging, we obtain
After rearrangement, we obtain
This derivative can be rewritten as
Implicitly, this implies that one should use the logarithm of the spectral line intensities.
Integrating both sides of (A6) yields the final solution as
The exponent factor appeared in Equation (A7) and can be written as
Here, are the slopes of the measured (S/N) ratio (on a logarithmic scale) as shown in Figure 4 (left column),
Appendix B
Results of measurement of plasma parameters in a limited range of delay time (1–5 μs).

Table A1.
The measured plasma parameters.
Table A1.
The measured plasma parameters.
| Measured Electron Density (×1017 cm−3) with Associated Error Margins | ||||||||||
| Delay | 1 μs | 2 μs | 3 μs | 4 μs | 5 μs | |||||
| Element | Nano | Bulk | Nano | Bulk | Nano | Bulk | Nano | Bulk | Nano | Bulk |
| Ag | 4.29 ± 0.1 | 4.2 ± 0.08 | 1.8 ± 0.12 | 1.79 ± 0.10 | 0.89 ± 0 0.04 | 0.89 ± 0.03 | 0.55 ± 0.15 | 0.55 ± 0.13 | 0.23 ± 0.04 | 0.23 ± 0.05 |
| Zn | 4.4 ± 0.66 | 4.7 ± 0.70 | 2.5 ± 0.90 | 2.4 ± 0.80 | 1.2 ± 0.40 | 1.4 ± 0.50 | 0.7 ± 0.26 | 0.70 ± 0.24 | 0.64 ± 0.08 | 0.54 ± 0.07 |
| Si | 4.37 ± 0.8 | 4.1 ± 0.50 | 1.5 ± 0.09 | 1.45 ± 0.09 | 0.78 ± 0.07 | 0.77 ± 0.08 | 0.42 ± 0.08 | 0.45 ± 0.07 | 0.37 ± 0.02 | 0.34 ± 0.05 |
| Al | 4.6 ± 0.66 | 4.7 ± 0.70 | 2.2 ± 0.90 | 2.3 ± 0.80 | 1.2 ± 0.40 | 1.1 ± 0.50 | 0.69 ± 0.26 | 0.68 ± 0.24 | 0.54 ± 0.08 | 0.54 ± 0.07 |
| Fe | 4.42 ± 0.8 | 4.8 ± 0.50 | 1.47 ± 0.09 | 1.46 ± 0.09 | 0.83 ± 0.07 | 0.77 ± 0.08 | 0.42 ± 0.08 | 0.43 ± 0.07 | 0.35 ± 0.02 | 0.33 ± 0.05 |
| Ti | 3.4 ± 0.7 | 3.4 ± 0.03 | 1.8 ± 0.08 | 1.7 ± 0.03 | 0.99 ± 0.05 | 0.91 ± 0.04 | 0.72 ± 0.07 | 0.69 ± 0.02 | 0.52 ± 0.04 | 0.54 ± 0.03 |
| Measured Electron Temperatures (eV) with Associated Error Margins | ||||||||||
| Delay | 1 μs | 2 μs | 3 μs | 4 μs | 5 μs | |||||
| Element | Nano | Bulk | Nano | Bulk | Nano | Bulk | Nano | Bulk | Nano | Bulk |
| Ag | 1.12 ± 0.1 | 1.06 ± 0.09 | 0.89 ± 0.08 | 0.89 ± 0.06 | 0.72 ± 0.05 | 0.72 ± 0.07 | 0.63 ± 0.07 | 0.60 ± 0.02 | 0.54 ± 0.04 | 0.55 ± 0.06 |
| Zn | 1.25 ± 0.24 | 1.2 ± 0.21 | 0.88 ± 0.14 | 0.89 ± 0.11 | 0.72 ± 0.09 | 0.71 ± 0.08 | 0.61 ± 0.07 | 0.60 ± 0.05 | 0.50 ± 0.05 | 0.55 ± 0.06 |
| Al | 1.1 ± 0.1 | 1.02 ± 0.09 | 0.89 ± 0.08 | 0.89 ± 0.06 | 0.72 ± 0.05 | 0.72 ± 0.07 | 0.63 ± 0.07 | 0.60 ± 0.02 | 0.53 ± 0.04 | 0.55 ± 0.06 |
| Si | 1.05 ± 0.24 | 1.2 ± 0.21 | 0.88 ± 0.14 | 0.89 ± 0.11 | 0.72 ± 0.09 | 0.71 ± 0.08 | 0.61 ± 0.07 | 0.60 ± 0.05 | 0.50 ± 0.05 | 0.51 ± 0.06 |
Appendix C
Application of NELIPS in the measurement of nanoparticle size diameter
This proposed method is based on the direct measurement of the thresholds’ fluence of laser-plasma ignition for both nanomaterial and the corresponding bulky counterpart [34].
The following procedures are typically adopted:
- 1.
- Using the standard NELIPS experimental setup.
- 2.
- Measure the laser spot size area at the target position in the units of cm2 and measure laser energy per laser shot (in units Joule), then determine the laser fluence in the units of (J/cm2).
- 3.
- Start with irradiating bulk material and record the plasma emission spectrum.
- 4.
- Decrease the laser fluence by nearly equal steps (via introducing neutral density filters in the laser beam path) and repeat the previous step until no appreciable optical signal is recorded.
- 5.
- Plot the relation between laser fluence and the spectral intensity (Signal-To-Noise) S/N ratio of one of the prominent spectral lines, e.g., the emission at wavelength of 480 nm is suitable for zinc (presented on form of bulk and nanomaterial), while wavelength at 520.9 nm is suitable for silver.
- 6.
- Under typical experimental conditions, one should repeat the previous procedures for the corresponding nanomaterial.
- 7.
- Measure the plasma ignition thresholds of both bulk and nanomaterial as shown in Figure A1 at the point of intersection of the backward extrapolation with the horizontal axis at S/N = 3. One must notice that .
- 8.
- With the help of the available standard data tables, find the numerical values of the following thermal quantities of the bulk material in SI units as given in Table A1, which presents the coefficient of thermal conductivity, density and isochoric heat capacity of the bulk materials, respectively.
- 9.
- With basic knowledge of the laser pulse duration time , one can calculate the thermal diffusion (or conduction) length of the bulk material using the well-known expression [34] .
- 10.
- Utilizing one of the important outcomes of the recently established principle of the NELIPS approach, i.e., if one can measure the laser-induced plasma ignition threshold fluence of a bulk material and for the corresponding nano material , the following expression can be held expressing the relation of the diameter of the nanoparticles with thermal conduction length [34], .
In the present experiment, four different nanomaterials of different diameters were supplied (iron, titanium, zinc and silver) with certified diameters as previously given at the experimental setup. The thermal quantities of the different bulk materials are given in Table A2. We have used the laser radiation from Nd: YAG working at the fundamental wavelength of 1064 nm with typical delay and gate times of 1 μs and typical laser pulse duration time Hence, as mentioned at step # 9, one can calculate the thermal conduction length of the bulk materials in the units of (nm), with the results as given in Table A2—the last column.
Table A2.
Thermal constants of the used bulk materials.
Table A2.
Thermal constants of the used bulk materials.
| Material | ||||
|---|---|---|---|---|
| Titanium | 22 | 4500 | 523 | 216 |
| Iron | 80 | 7870 | 444 | 338 |
| Silver | 429 | 10,500 | 237 | 928 |
| Zinc | 111 | 7133 | 383 | 450 |

Figure A1.
Variation in (S/N) ratio with laser fluence “Measurement of plasma ignition threshold”.
Figure A1.
Variation in (S/N) ratio with laser fluence “Measurement of plasma ignition threshold”.

A demonstration of the method of measurement of plasma ignition threshold fluence is presented in Figure A1A–D, with numerical results are as depicted in each of the subfigures, including the estimated diameters of the nanoparticles. It is obvious that the estimated values of the nanomaterial particle diameters adopting the NELIPS approach [34] nearly match those supplied in data sheets.
References
- Kunze, H.-J. Introduction to Plasma Spectroscopy; Springer Series on Atomic, Optical, and Plasma Physics; Springer: Berlin/Heidelberg, Germany, 2009; ISBN 9783642022326. [Google Scholar]
- Griem, H.R. Principles of Plasma Spectroscopy; Cambridge University Press: Cambridge, UK, 1997; 366p, ISBN 9780511524578. [Google Scholar] [CrossRef]
- Cremers, D.A.; Radziemski, L.J. Handbook of Laser-Induced Breakdown Spectroscopy, 1st ed.; Wiley: Hoboken, NJ, USA, 2013. [Google Scholar] [CrossRef]
- Fujimoto, T. Plasma Spectroscopy; Oxford Scientific Publications: Oxford, UK, 2004; ISBN 0-19-853028-5. [Google Scholar] [CrossRef]
- Sherbini, A.E.; Aboulfotouh, A.; Sherbini, T.E. On the Similarity and Differences Between Nano-Enhanced Laser-Induced Breakdown Spectroscopy and Nano-Enhanced Laser-Induced Plasma Spectroscopy in Laser-Induced Nanomaterials Plasma. QuBS 2024, 9, 1. [Google Scholar] [CrossRef]
- Hahn, D.W.; Omenetto, N. Laser-Induced Breakdown Spectroscopy (LIBS), Part II: Review of Instrumental and Methodological Approaches to Material Analysis and Applications to Different Fields. Appl. Spectrosc. 2012, 66, 347–419. [Google Scholar] [CrossRef] [PubMed]
- Fernandes Andrade, D.; Pereira-Filho, E.R.; Amarasiriwardena, D. Current Trends in Laser-Induced Breakdown Spectroscopy: A Tutorial Review. Appl. Spectrosc. Rev. 2021, 56, 98–114. [Google Scholar] [CrossRef]
- Villas-Boas, P.R.; Franco, M.A.; Martin-Neto, L.; Gollany, H.T.; Milori, D.M.B.P. Applications of Laser-induced Breakdown Spectroscopy for Soil Characterization, Part II: Review of Elemental Analysis and Soil Classification. Eur. J. Soil Sci. 2020, 71, 805–818. [Google Scholar] [CrossRef]
- Sallé, B.; Cremers, D.A.; Maurice, S.; Wiens, R.C.; Fichet, P. Evaluation of a Compact Spectrograph for In-Situ and Stand-off Laser-Induced Breakdown Spectroscopy Analyses of Geological Samples on Mars Missions. Spectrochim. Acta B At. Spectrosc. 2005, 60, 805–815. [Google Scholar] [CrossRef]
- Marangoni, B.S.; Nicolodelli, G.; Senesi, G.S.; Fonseca, N.; Izario Filho, H.J.; Xavier, A.A.; Villas-Boas, P.R.; Milori, D.M.B.P.; Menegatti, C.R. Multi-Elemental Analysis of Landfill Leachates by Single and Double Pulse Laser-Induced Breakdown Spectroscopy. Microchem. J. 2021, 165, 106125. [Google Scholar] [CrossRef]
- Capitelli, M.; Casavola, A.; Colonna, G.; De Giacomo, A. Laser-Induced Plasma Expansion: Theoretical and Experimental Aspects. Spectrochim. Acta B At. Spectrosc. 2004, 59, 271–289. [Google Scholar] [CrossRef]
- Konjević, N.; Ivković, M.; Jovićević, S. Spectroscopic Diagnostics of Laser-Induced Plasmas. Spectrochim. Acta B At. Spectrosc. 2010, 65, 593–602. [Google Scholar] [CrossRef]
- Gomez, T.A.; Nagayama, T.; Cho, P.B.; Kilcrease, D.P.; Fontes, C.J.; Zammit, M.C. Introduction to Spectral Line Shape Theory. J. Phys. B At. Mol. Opt. Phys. 2022, 55, 034002. [Google Scholar] [CrossRef]
- Sorge, S.; Günter, S. Simulation of Shifted and Asymmetric Hydrogen Line Profiles. Eur. Phys. J. D 2000, 12, 369–375. [Google Scholar] [CrossRef]
- Sabri, N.M.; Haider, Z.; Tufail, K.; Ismail, F.D.; Ali, J. Spectroscopic Diagnostics of Laser Induced Plasma and Self-Absorption Effects in Al Lines. Phys. Plasmas 2018, 25, 073303. [Google Scholar] [CrossRef]
- El Sherbini, A.M.; El Farash, A.H.; El Sherbini, T.M.; Parigger, C.G. Opacity Corrections for Resonance Silver Lines in Nano-Material Laser-Induced Plasma. Atoms 2019, 7, 73. [Google Scholar] [CrossRef]
- Aguilera, J.A.; Aragón, C. New Procedure for CSigma Laser Induced Breakdown Spectroscopy Addressing the Laser-Induced Plasma Inhomogeneity. Spectrochim. Acta B At. Spectrosc. 2024, 217, 106969. [Google Scholar] [CrossRef]
- Sherbini, A.M.E.; Aboulfotouh, A.-N.M.; Rashid, F.F.; Allam, S.H.; Dakrouri, A.E.; Sherbini, T.M.E. Observed Enhancement in LIBS Signals from Nano vs. Bulk ZnO Targets: Comparative Study of Plasma Parameters. World J. Nano Sci. Eng. 2012, 2, 181–188. [Google Scholar] [CrossRef]
- De Giacomo, A.; Gaudiuso, R.; Koral, C.; Dell’Aglio, M.; De Pascale, O. Nanoparticle-Enhanced Laser-Induced Breakdown Spectroscopy of Metallic Samples. Anal. Chem. 2013, 85, 10180–10187. [Google Scholar] [CrossRef]
- Dell’Aglio, M.; Alrifai, R.; De Giacomo, A. Nanoparticle Enhanced Laser Induced Breakdown Spectroscopy (NELIBS), a First Review. Spectrochim. Acta B At. Spectrosc. 2018, 148, 105–112. [Google Scholar] [CrossRef]
- El Sherbini, A.M.; Hegazy, H.; El Sherbini, T.M. Measurement of Electron Density Utilizing the Hα-Line from Laser Produced Plasma in Air. Spectrochim. Acta B At. Spectrosc. 2006, 61, 532–539. [Google Scholar] [CrossRef]
- Kim, Y.; Shi, Y.-J.; Yang, J.; Kim, S.; Kim, Y.-G.; Dang, J.-J.; Yang, S.; Jo, J.; Oh, S.-G.; Chung, K.-J.; et al. Electron Density Profile Measurements from Hydrogen Line Intensity Ratio Method in Versatile Experiment Spherical Torus. Rev. Sci. Instrum. 2016, 87, 11E540. [Google Scholar] [CrossRef]
- Bousquet, B.; Gardette, V.; Ros, V.M.; Gaudiuso, R.; Dell’Aglio, M.; De Giacomo, A. Plasma Excitation Temperature Obtained with Boltzmann Plot Method: Significance, Precision, Trueness and Accuracy. Spectrochim. Acta B At. Spectrosc. 2023, 204, 106686. [Google Scholar] [CrossRef]
- Thouin, J.; Benmouffok, M.; Freton, P.; Gonzalez, J.-J. Interpretation of Temperature Measurements by the Boltzmann Plot Method on Spatially Integrated Plasma Oxygen Spectral Lines. Eur. Phys. J. Appl. Phys. 2023, 98, 65. [Google Scholar] [CrossRef]
- Idris, N.; Usmawanda, T.N.; Lahna, K.; Ramli, M. Temperature Estimation Using Boltzmann Plot Method of Many Calcium Emission Lines in Laser Plasma Produced on River Clamshell Sample. J. Phys. Conf. Ser. 2018, 1120, 012098. [Google Scholar] [CrossRef]
- Alrebdi, T.A.; Fayyaz, A.; Asghar, H.; Zaman, A.; Asghar, M.; Alkallas, F.H.; Hussain, A.; Iqbal, J.; Khan, W. Quantification of Aluminum Gallium Arsenide (AlGaAs) Wafer Plasma Using Calibration-Free Laser-Induced Breakdown Spectroscopy (CF-LIBS). Molecules 2022, 27, 3754. [Google Scholar] [CrossRef] [PubMed]
- Sontag-González, M.; Mittelstraß, D.; Kreutzer, S.; Fuchs, M. Wavelength Calibration and Spectral Sensitivity Correction of Luminescence Measurements for Dosimetry Applications: Method Comparison Tested on the IR-RF of K-Feldspar. arXiv 2024, arXiv:2408.07991. [Google Scholar] [CrossRef]
- John, L.M.; Anoop, K.K. A Numerical Procedure for Understanding the Self-Absorption Effects in Laser Induced Breakdown Spectroscopy. RSC Adv. 2023, 13, 29613–29624. [Google Scholar] [CrossRef] [PubMed]
- Kramida, A.; Ralchenko, Y. NIST Atomic Spectra Database, NIST Standard Reference Database 78; National Institute of Standards and Technology: Gaithersburg, MA, USA, 1999.
- Dimitrijević, M.S.; Sahal-Bréchot, S. Stark Broadening of AgI Spectral Lines. At. Data Nucl. Data Tables 2003, 85, 269–290. [Google Scholar] [CrossRef]
- Dimitrijevic, M.S.; Sahal-Bréchot, S. Stark Broadening Parameter Tables for Neutral Zinc Spectral Lines. Serb. Astron. J. 1999, 160, 21–33. [Google Scholar] [CrossRef]
- Djurović, S.; Blagojević, B.; Konjević, N. Experimental and Semiclassical Stark Widths and Shifts for Spectral Lines of Neutral and Ionized Atoms (A Critical Review of Experimental and Semiclassical Data for the Period 2008 Through 2020). J. Phys. Chem. Ref. Data 2023, 52, 031503. [Google Scholar] [CrossRef]
- Isidoro-García, L.; De Andrés-García, I.; Porro, J.; Fernández, F.; Colón, C. Experimental and Theoretical Electron Collision Broadening Parameters for Several Ti II Spectral Lines of Industrial and Astrophysical Interest. Atoms 2024, 12, 35. [Google Scholar] [CrossRef]
- El Sherbini, A.M.; Parigger, C.G. Nano-Material Size Dependent Laser-Plasma Thresholds. Spectrochim. Acta B At. Spectrosc. 2016, 124, 79–81. [Google Scholar] [CrossRef]


Disclaimer/Publisher’s Note: The statements, opinions and data contained in all publications are solely those of the individual author(s) and contributor(s) and not of MDPI and/or the editor(s). MDPI and/or the editor(s) disclaim responsibility for any injury to people or property resulting from any ideas, methods, instructions or products referred to in the content. |
© 2025 by the authors. Licensee MDPI, Basel, Switzerland. This article is an open access article distributed under the terms and conditions of the Creative Commons Attribution (CC BY) license (https://creativecommons.org/licenses/by/4.0/).