1. Introduction
Polymer gels consist of three-dimensional networks formed by covalent cross-linking between polymer chains. Once covalent cross-links have been formed, they are irreversible, leading to the retention of heterogeneities derived from immobilized cross-linking points and sparsely distributed polymer chains [
1,
2]. These microscopic heterogeneities significantly affect macroscopic properties such as mechanical strength [
1,
2]. Therefore, characterizing heterogeneities in polymer gels is of great importance. Small-angle X-ray scattering (SAXS) and small-angle neutron scattering (SANS) are powerful tools to discuss network inhomogeneities. These techniques provide correlation lengths related to the network polymer mesh size and the characteristic lengths of fluctuation of high and low network densities [
3,
4,
5,
6,
7]. However, it is difficult to evaluate directly the distribution of mesh size in network polymers. In contrast, dynamic light scattering (DLS) is an excellent method for analyzing the distribution of heterogeneity within network polymers [
8,
9,
10,
11,
12,
13]. DLS can provide the chain dynamics of the polymer chains consisting of the network polymers, but if there is internal heterogeneity, the chain dynamics should be different depending on the location within the network polymers. Therefore, DLS measurements at a number of different points on the network polymers can provide insight into the distribution of chain dynamics in relation to the sparsity of crosslink density. However, light scattering is difficult to apply to opaque samples. In order to evaluate the distribution of networks and density fluctuations regardless of the state of the sample, it is desirable to use X-rays as a light source. X-ray photon correlation methods are the most common methods for analyzing dynamics with X-rays corresponding to DLS. For the dynamic analysis of the network polymers using X-rays corresponding to DLS, X-ray photon correlation spectroscopy (XPSC) has been conducted for in-operand dynamic analyses of particles in rubber and in situ analyses of the curing process of adhesives [
14,
15,
16,
17,
18]. However, XPSC requires high-coherent X-rays and highly sensitive detectors. As an alternative method to XPSC, diffracted X-ray tracking (DXT), which is a method for evaluating the dynamics of crystalline nanoparticles such as gold nanocrystals [
19,
20], is considered to be suitable for network polymers.
The DXT method is a technique to visualize the rotational motion of individual crystalline nanoparticles by monitoring the displacement of diffraction spots from moving crystalline nanoparticles, such as gold nanocrystals, using time-resolved X-ray diffraction measurements with broadband X-rays (a white or pink beam) [
19,
20,
21,
22,
23,
24,
25].
Figure 1 shows a schematic representation of DXT for crystalline nanoparticles by using broad-band X-rays. The coordinates of diffraction spots on a two-dimensional detector from crystalline nanoparticles using broadband X-rays are described by the azimuthal angle (
φ) and diffraction angle (2
θ). The
φ is determined by the rotation angle of the crystalline plane of the crystalline nanoparticle with the direction of the incident X-ray. Therefore, the
φ-component of the displacement of the diffraction spot corresponds to the rotational motion around the axis parallel to the direction of the incident X-ray. The
θ, on the other hand, follows Bragg’s law. In the case of broadband X-rays, different angles between the incident X-ray and the diffracting plane result in different wavelengths that satisfy Bragg’s law, so the position of the spot changes according to the following equation.
where
n is the diffraction order,
λ is the wavelength of incident X-rays,
d is the Bragg spacing for a particular diffracting plane, and
θ is the angle between the incident X-ray and the diffracting plane. Therefore, the diffraction spots move from time to time in response to the rotational motion of the crystalline nanoparticles. Since the DXT tracks the trajectories of highly brilliant diffraction spots from crystalline nanoparticles, it is highly sensitive and inevitably achieves measurements with a high time resolution. Therefore, DXT has been used to track the dynamics of a single protein molecule tethered to a gold nanoparticle. When crystalline nanoparticles are encapsulated in network polymers in a dilute concentration, X-ray diffractions with microbeam X-rays should provide Laue diffraction spots. Therefore, the diffraction spots from crystalline nanoparticles should show displacements due to the rotational motion of the nanoparticles. The rotational motions of the nanoparticles encapsulated in the network polymers should be governed by the cross-linking density of the network surrounding them. Therefore, DXT for individual crystalline nanoparticles in the network polymers provides information on the heterogeneity of the cross-linking density. However, studies on the heterogeneity of cross-linking in network polymers using the DXT method have not been sufficiently conducted. Thus, the aim of this study is to investigate the heterogeneity of the cross-linking density of the network in polyacrylamide gel (PAAm gel), which is a typical network polymer, including gold nanocrystals (GNPs) by DXT for individual GNPs.
2. Materials and Methods
Reagents. Acrylamide (AAm), methylene bisacrylamide (BIS), and N,N,N’,N’-tetramethylethylenediamine (TMEDA) were purchased from FUJIFILM Wako Pure Chemical Co., Ltd. (Tokyo, Japan). Ammonium persulfate (APS) was purchased from Sigma-Aldrich Co., LLC (St. Louis, MO, USA). GNP with 200 nm diameter was purchased from BBI solutions (Salisbury, UK). Polymerization inhibitors in AAm and BIS were removed with activated alumina under dry N2 atmosphere before they were used in the synthesis. Other reagents were used as obtained.
Preparation of PAAm gels. PAAm gels with or without GNPs were prepared by free radical polymerization of AAm monomer and BIS as a cross-linking agent with APS as an initiator and TMEDA as a polymerization accelerator at ambient temperature under N2 atmosphere. The molar ratio of AAm to APS was 1.0 × 10³, and that of BIS to AAm was 0.1. The polymerization rate was adjusted by the amount of TMEDA. The PAAm gels including GNPs were synthesized by adding GNPs to the solutions for synthesis of PAAm gels at ca. 1 vol% under the same condition. The presence or absence of GNPs does not affect the reaction times required for gelation and the equilibrium swelling ratio of the PAAm gel prepared under the same conditions. PAAm gels with different polymerization rates but the same equilibrium swelling ratio of 8 were used as samples for DXT analyses. Here, the equilibrium swelling ratio was determined as the ratio of the weight of fully swollen PAAm gel, which was prepared by immersing the dry PAAm gel in a large amount of water for 12 h, to the weight of well-dried PAAm gel. Among several PAAm gels synthesized at different polymerization rates, we selected two PAAm gels with the same equilibrium swelling ratio of 8. PAAm gels obtained at a fast and slow polymerization rates are denoted as PAAm gel(F) and PAAm gel(S), respectively.
Small-angle X-ray scattering (SAXS). SAXS measurements were carried out to characterize static heterogeneity of the networks of PAAm gel(F) and PAAm gel(S) swollen to equilibrium with water at BL-40B2 at SPring-8, (Sayo Town, Sayo District, Hyōgo Prefecture, Japan). A Pillatus3S 2M (Dectris, Switzerland) was used as a 2-dimensional photon-counting detector. The distance from the sample to the detector was set to 1 m. A vacuum tube was installed between the sample and the detector. The wavelength of incident X-ray beam (λ) was fixed at 0.1 nm. A swollen PAAm gel specimen without GNPs with 1 mm thickness was sandwiched between two polyimide films and placed on sample stage. X-ray transmittances of the PAAm gels were measured by using two ion chambers (optical path length = 1 cm) placed in front of and behind the PAAm gel samples. SAXS data were obtained with an exposure time of 60 s. The obtained two-dimensional SAXS images were converted to one-dimensional scattering intensity vs. q curves by circular averaging. Here, q is the magnitude of scattering vector defined as q = (4π/λ) sinθ, where 2θ is the scattering angle. The excess scattering intensity (I(q)) from the PAAm gels was obtained by subtracting the background scattering from the raw SAXS profiles with appropriate transmittance corrections.
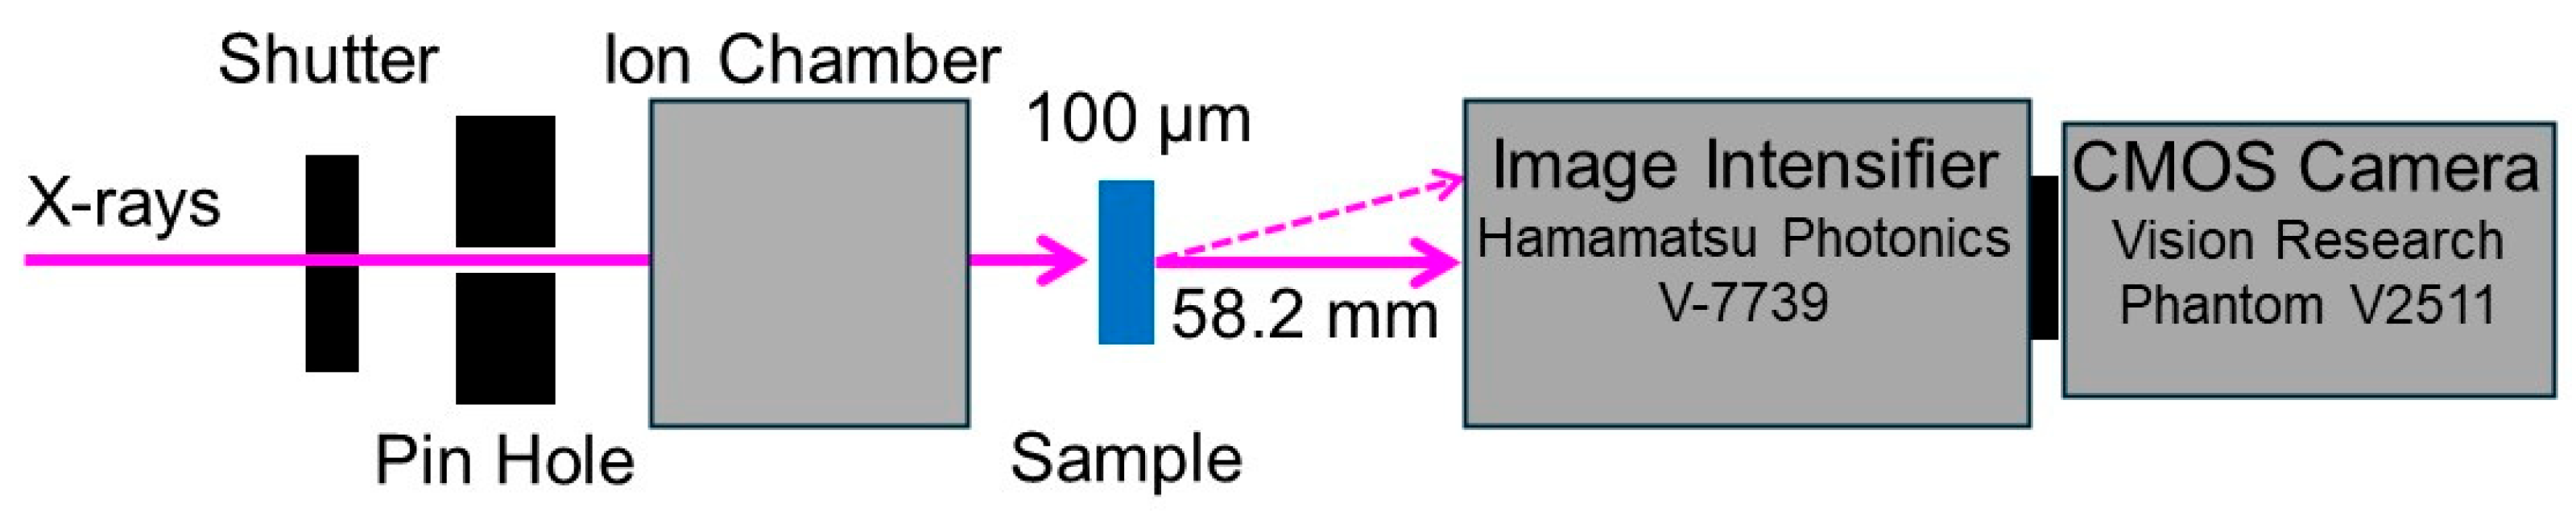
Diffracted X-ray tracking (DXT). DXT measurements were carried out at BL-40XU at SPring-8, Japan.
Figure 2 shows a schematic representation of the apparatus for the DXT measurements. The distance from the sample to the detector was set to 58.2 mm. The gap of insertion device was tuned to 20.1 mm. A quasi-monochromatic X-ray beam with a center wavelength of 0.0826 nm (15 keV ± 1%) and photon flux of 1011 photons/s was used as the incident X-ray. The beam size of incident X-ray beam was adjusted to 50 μm in diameter at the position of sample by inserting a pinhole aperture upstream of the sample. A swollen PAAm gel containing GNPs with 100 μm thickness was sandwiched between two polyimide films and placed on sample stage. For the PAAm gels, time-resolved X-ray diffraction measurements were conducted by using an X-ray image intensifier (V7739, Hamamatsu photonics, Hamamatsu, Japan) and a CMOS camera (Phantom V2511, Vision Research, Wayne, NJ, USA) as the 2-dimensional detector. For each sample, the time-resolved X-ray diffraction images were recorded at 100 positions (10 × 10) at an interval of 10 ms, and 450 images were acquired for one position. Approximately 500 trajectories of diffraction spots from the (111) planes of GNPs were tracked by using Trackpy, which is an open-source Python3 software, after appropriate corrections of the background.
3. Results and Discussion
Figure 3 shows the static SAXS profiles from PAAm gel(F) and PAAm gel(S) without GNPs. The vertical axis is
I(
q), and the horizontal axis is
q. The SAXS profile from PAAm gel(F) shows an intensive upturn of
I(
q) with decreasing
q in the small-angle region (
q < 0.3 nm
−1), whereas there is almost no significant
q-dependence of
I(
q) for PAAm gel(S) at
q < 0.3 nm
−1. This indicates that PAAm gel(F) has a higher degree of cross-linking heterogeneity than PAAm gel(S). The solid lines are theoretical scattering curves calculated using Equations (2) and (3). The SAXS profile from PAAm gel(S) is well fitted with the following Lorentz function using 2.7 nm for
ξ [
26,
27,
28].
where
ξ is the correlation length of the network. This means that a homogeneous network with a correlation length of 2.7 nm is formed throughout PAAm gel(S). On the other hand, the SAXS profile from PAAm gel(F) is not fitted by the theoretical curve calculated by Equation (2). For the SAXS profile from PAAm gel(F), the theoretical curve calculated by Equation (3) combines the two functions of a Lorentz and squared Lorentz function to take into account the heterogeneity of the density of cross-linking as follows [
26,
27,
28].
where Ξ is the characteristic length of heterogeneities of dense and sparse cross-linking regions. The SAXS profile of PAAm gel(F) is well fitted with Equation (3) with Ξ > 15 nm and
ξ = 1.6 nm. Although PAAm gel(S) and PAAm gel(F) have an identical equilibrium swelling ratio, PAAm gel(S) has a homogeneous cross-linking density throughout the gel, while PAAm gel(F) has spatial heterogeneity in the regions of dense and sparse cross-linking densities. Since a difference in spatial heterogeneity of PAAm gels is expected to appear as a difference in the dynamics of the encapsulated GNPs, DXT was conducted for the diffraction from GNPs encapsulated in PAAm gel(S) and PAAm gel(F).
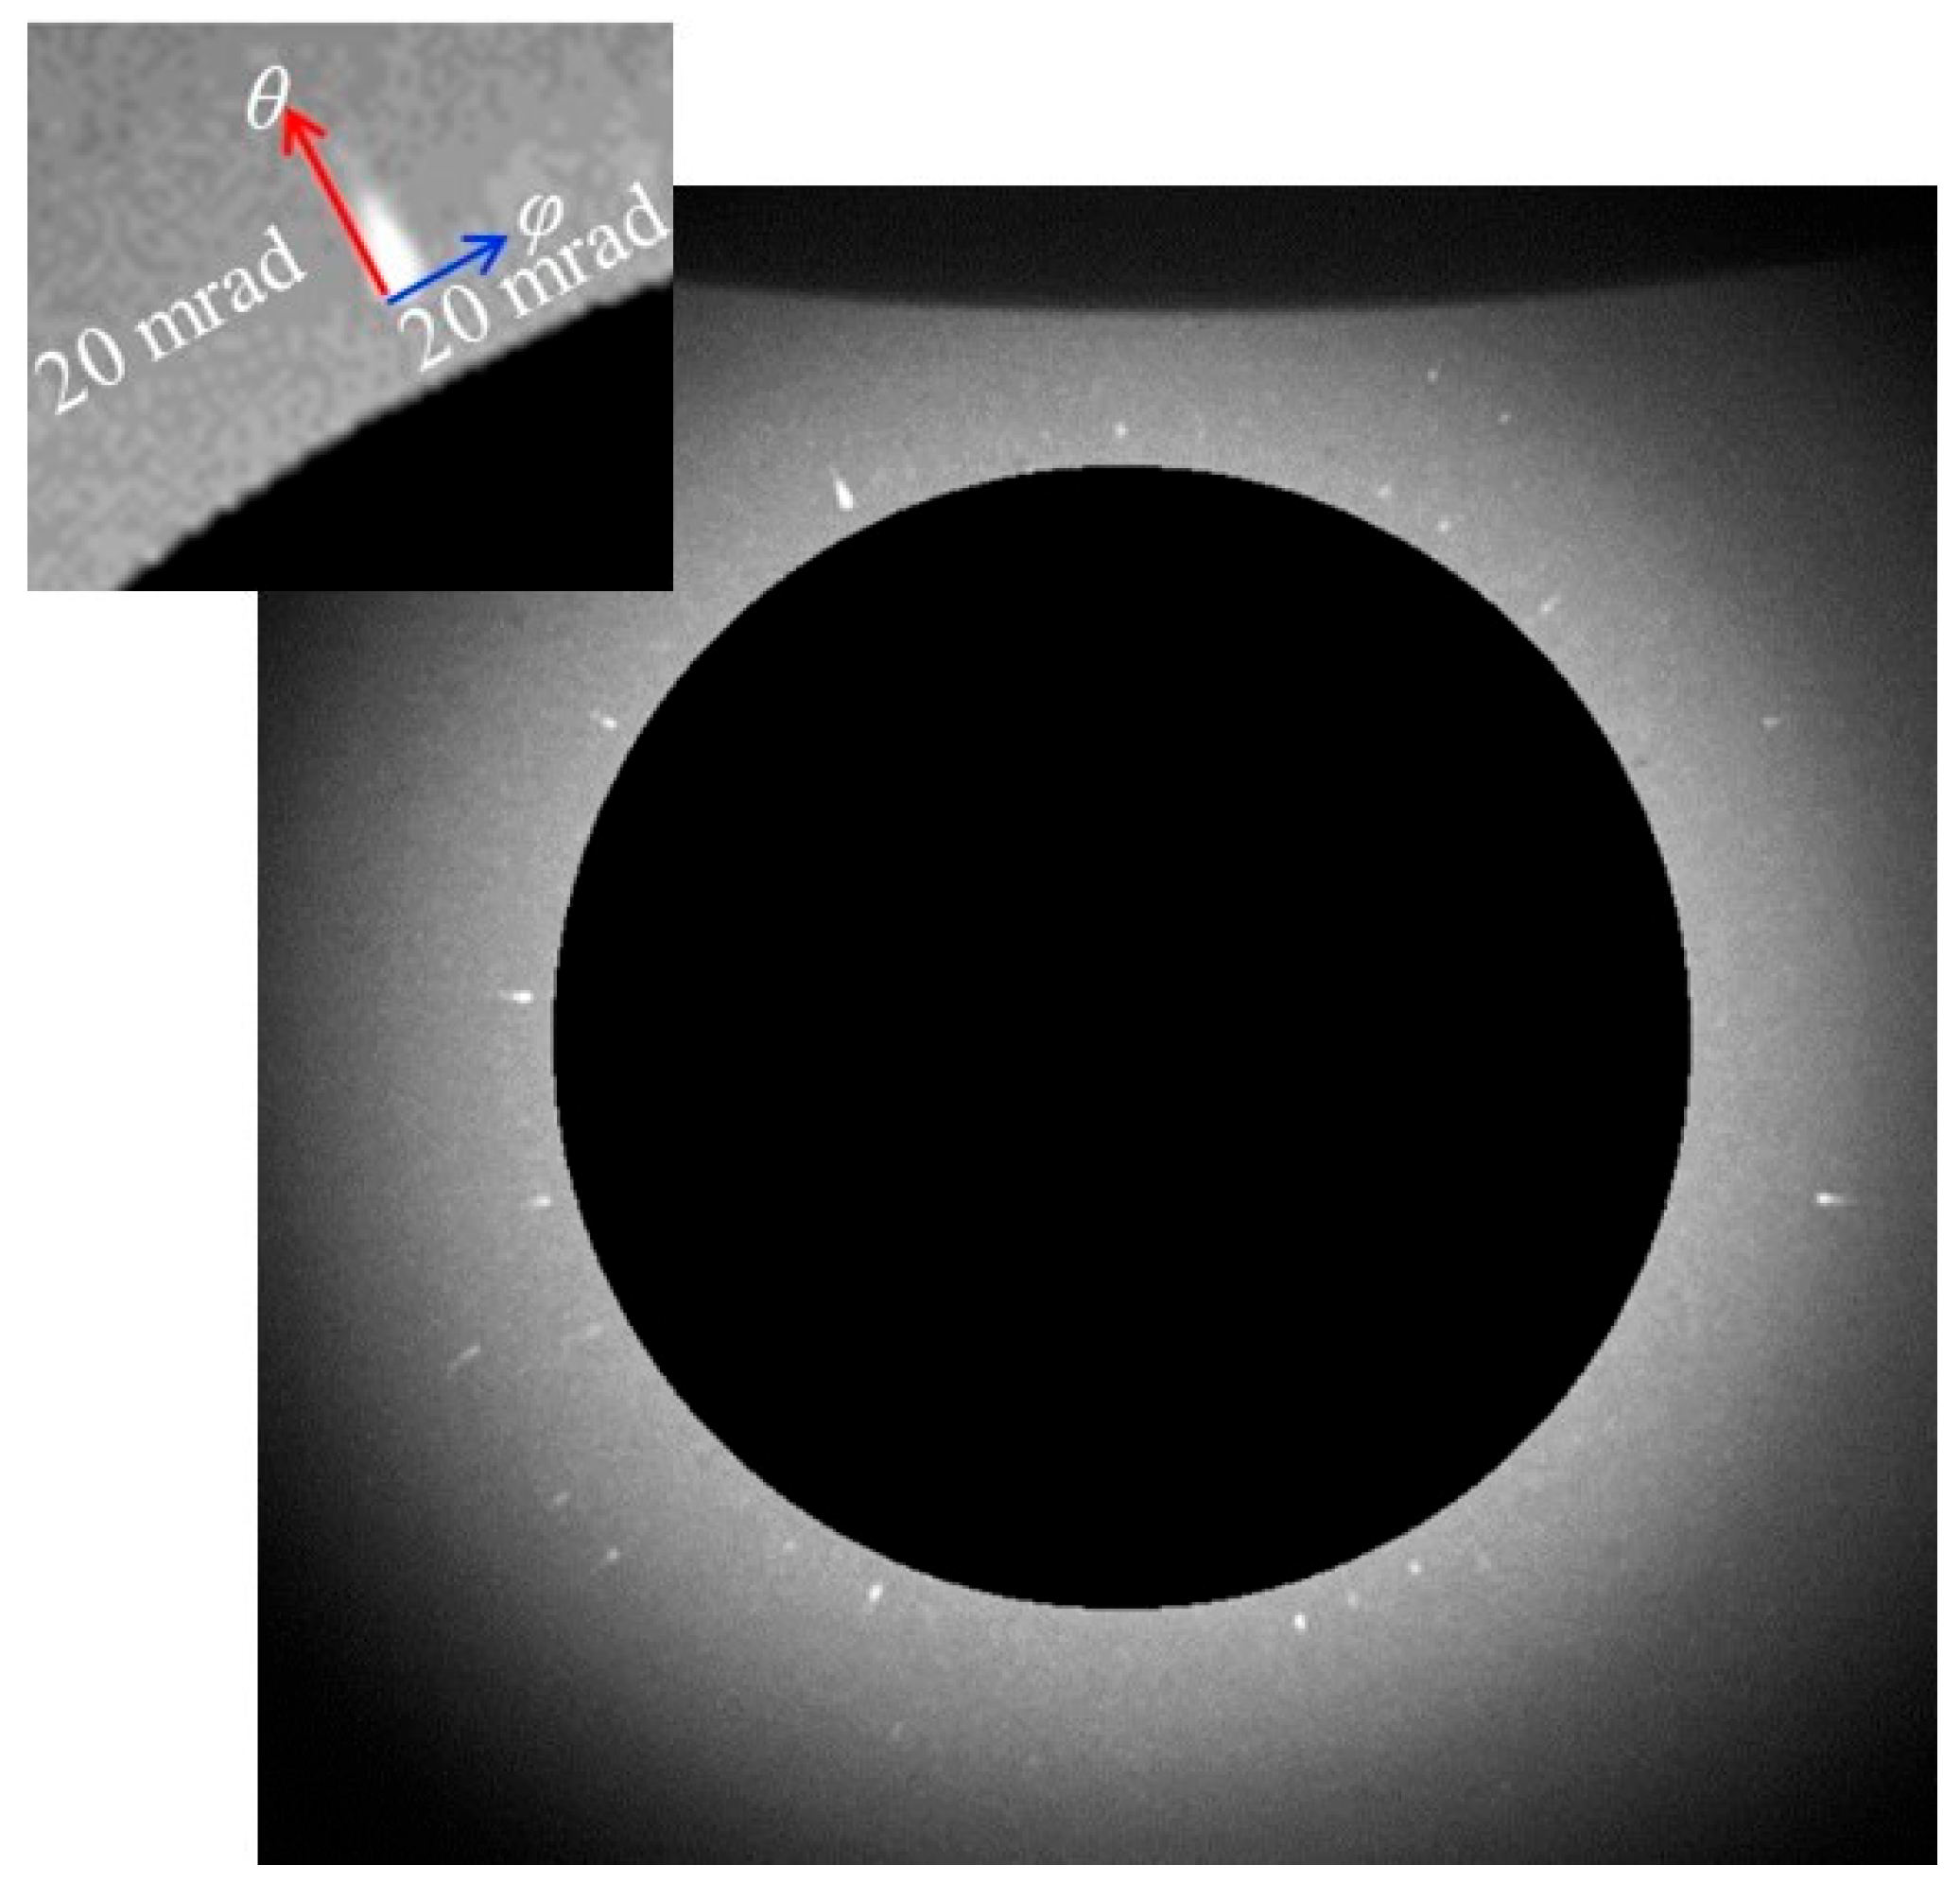
Figure 4 shows a two-dimensional diffraction image of the GNPs encapsulated in PAAm gel(S). This image is obtained by integrating a series of 450 diffraction images acquired through time-resolved X-ray diffraction measurements at an interval of 10 ms. The dark region at the innermost part is the area where the X-ray beam is masked. Just outside the dark region, many Laue diffraction spots attributed to the Au (111) plane are observed on a concentric circle. A similar result is obtained for PAAm gel(F). This means GNPs are individually dispersed in PAAm gels. It can be seen that the diffraction spots are not points but have widths. The width of these diffraction spots is due to the displacement of the diffraction spots caused by the rotational motion of GNPs in the PAAm gel(S). The inset in
Figure 4 is an enlarged view of a typical diffraction spot. The spot appears to be elongated in the
θ direction. As can be seen from
Figure 1, the rotational motion in the
θ direction appears to be the displacement of the diffraction angle corresponding to twice of rotational angle of the GNPs. Accordingly, the spatial resolution is 0.19 mrad/pix in the
θ direction, which is much better than that in the
φ direction (1.1 mrad/pix). The trajectories of the diffraction spots of Au (111) planes of individual GNPs are tracked to analyze the rotational motion of GNPs in PAAm gels.
Figure 5 shows the rotational angle of GNPs in the
φ and
θ directions obtained from the displacements of diffraction spots from Au (111) planes in PAAm gel(S) as time progresses. As can be seen at a glance, there are large angular displacements of diffraction spots in the
φ direction, whereas those to the
θ direction are quite small. The angular displacements in the
θ direction correspond to the rotational motion of GNPs around the rotation axis perpendicular to the direction of the incident X-ray. In this case, the displacement of the diffraction spot indicates the change in the X-ray wavelength that satisfies Bragg’s condition. Because the energy distribution of X-rays used in this study is ±1% for 15.3 keV, the displacement of the rotational angle of GNPs in the
θ direction is limited within ±30 mrad. On the other hand, since the angular displacements of GNPs in the
φ direction do not change the Bragg conditions, the rotational displacement of GNPs in the
φ direction is allowed up to 2
π rad. Therefore, although the angular resolution of the
θ direction is much better than that in the
φ direction, the rotational displacements in the
φ direction are observed over a wider angular range than those in the
θ direction. Thus, the displacements of diffraction spots from the Au (111) planes of GNPs, which are in an environment where the rotational motion of GNP in the
θ direction is restricted and that in the
φ direction is allowed, are mainly detected. This indicates that the displacements of the diffraction spots from GNPs in the
φ direction more sensitively capture the rotational motion of the GNPs. Thus, in this study, we discuss the distribution of the rotational motion of the GNPs based on the displacements of diffraction spots in the
φ direction.
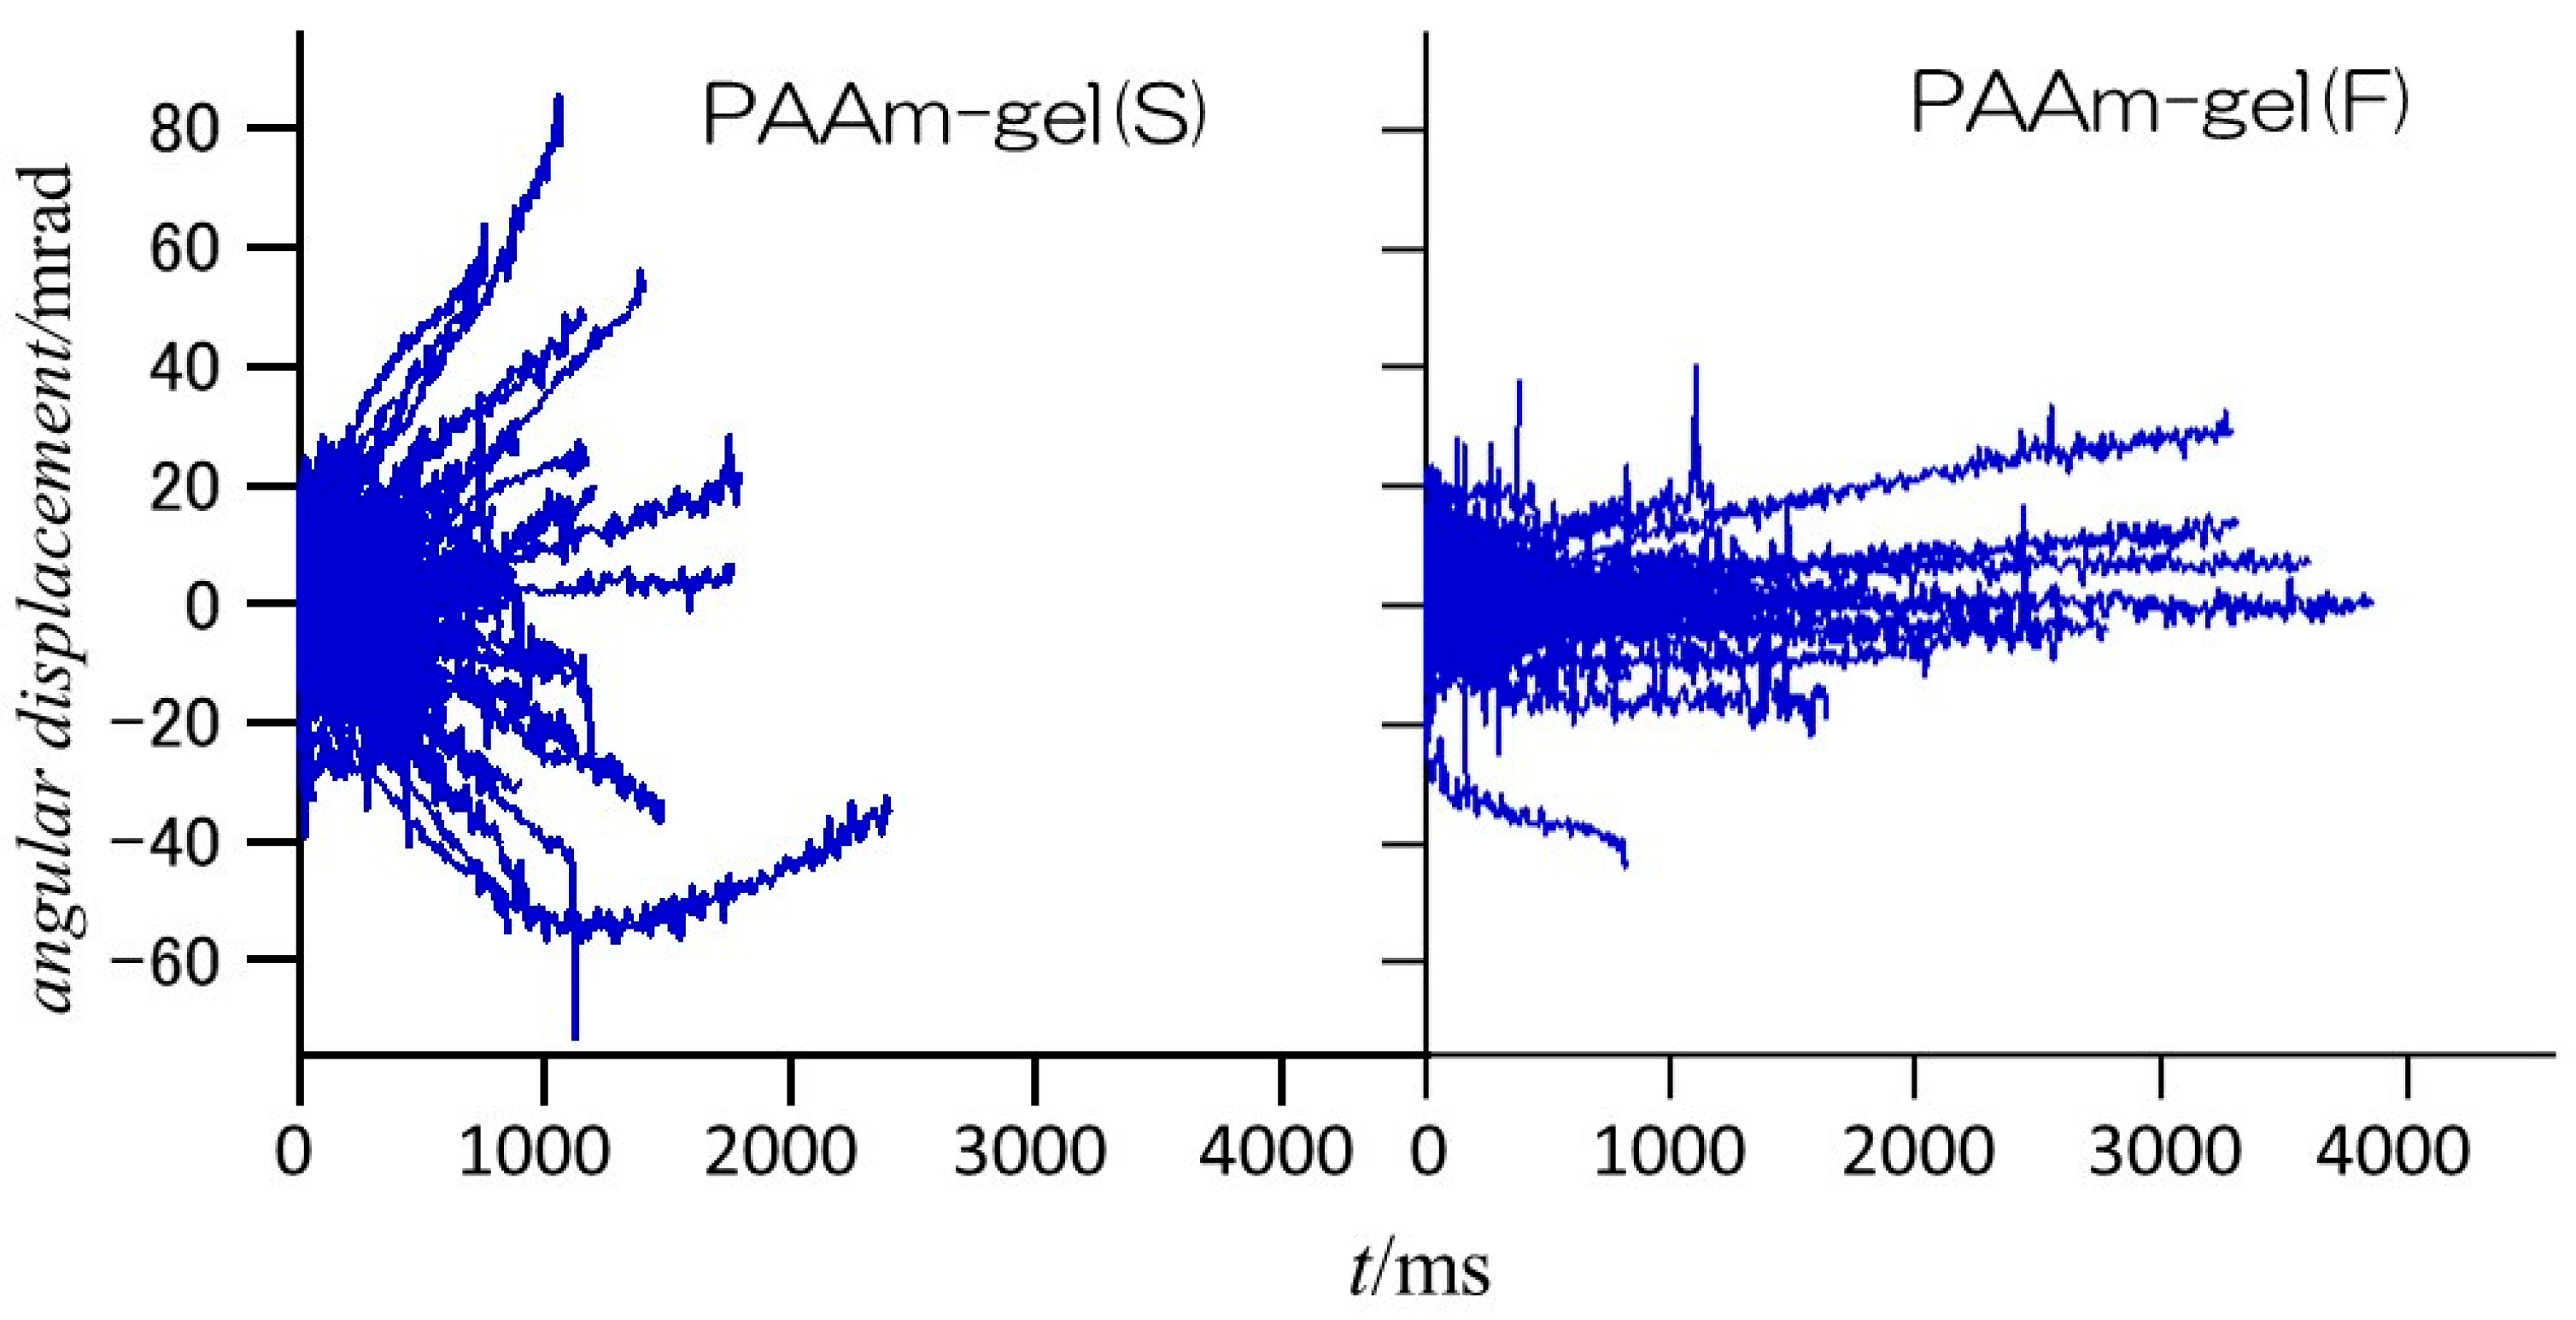
Figure 6 shows the angular displacements of the diffraction spots from the Au (111) planes of GNPs encapsulated in PAAm gel(S) and PAAm gel(F) in the
φ direction. In the PAAm gel(S), which is the homogeneous gel, the range of angular displacement is wider than ±60 mrad, and most diffraction spots disappear within approximately 2000 ms after they appear. On the other hand, in the heterogeneous PAAm gel(F), the range of angular displacement is within ±40 mrad, and there are diffraction spots that are observed for more than 3000 ms. This indicates that PAAm gel(S) contains more GNPs with high mobility, while PAAm gel(F) contains more GNPs with restricted rotational motion. Since most of the observed diffraction spots were observed for up to 200 ms after they appeared, the time dependences of the mean square angular displacement (
MSD) of GNPs in the PAAm gels within 200 ms are examined.
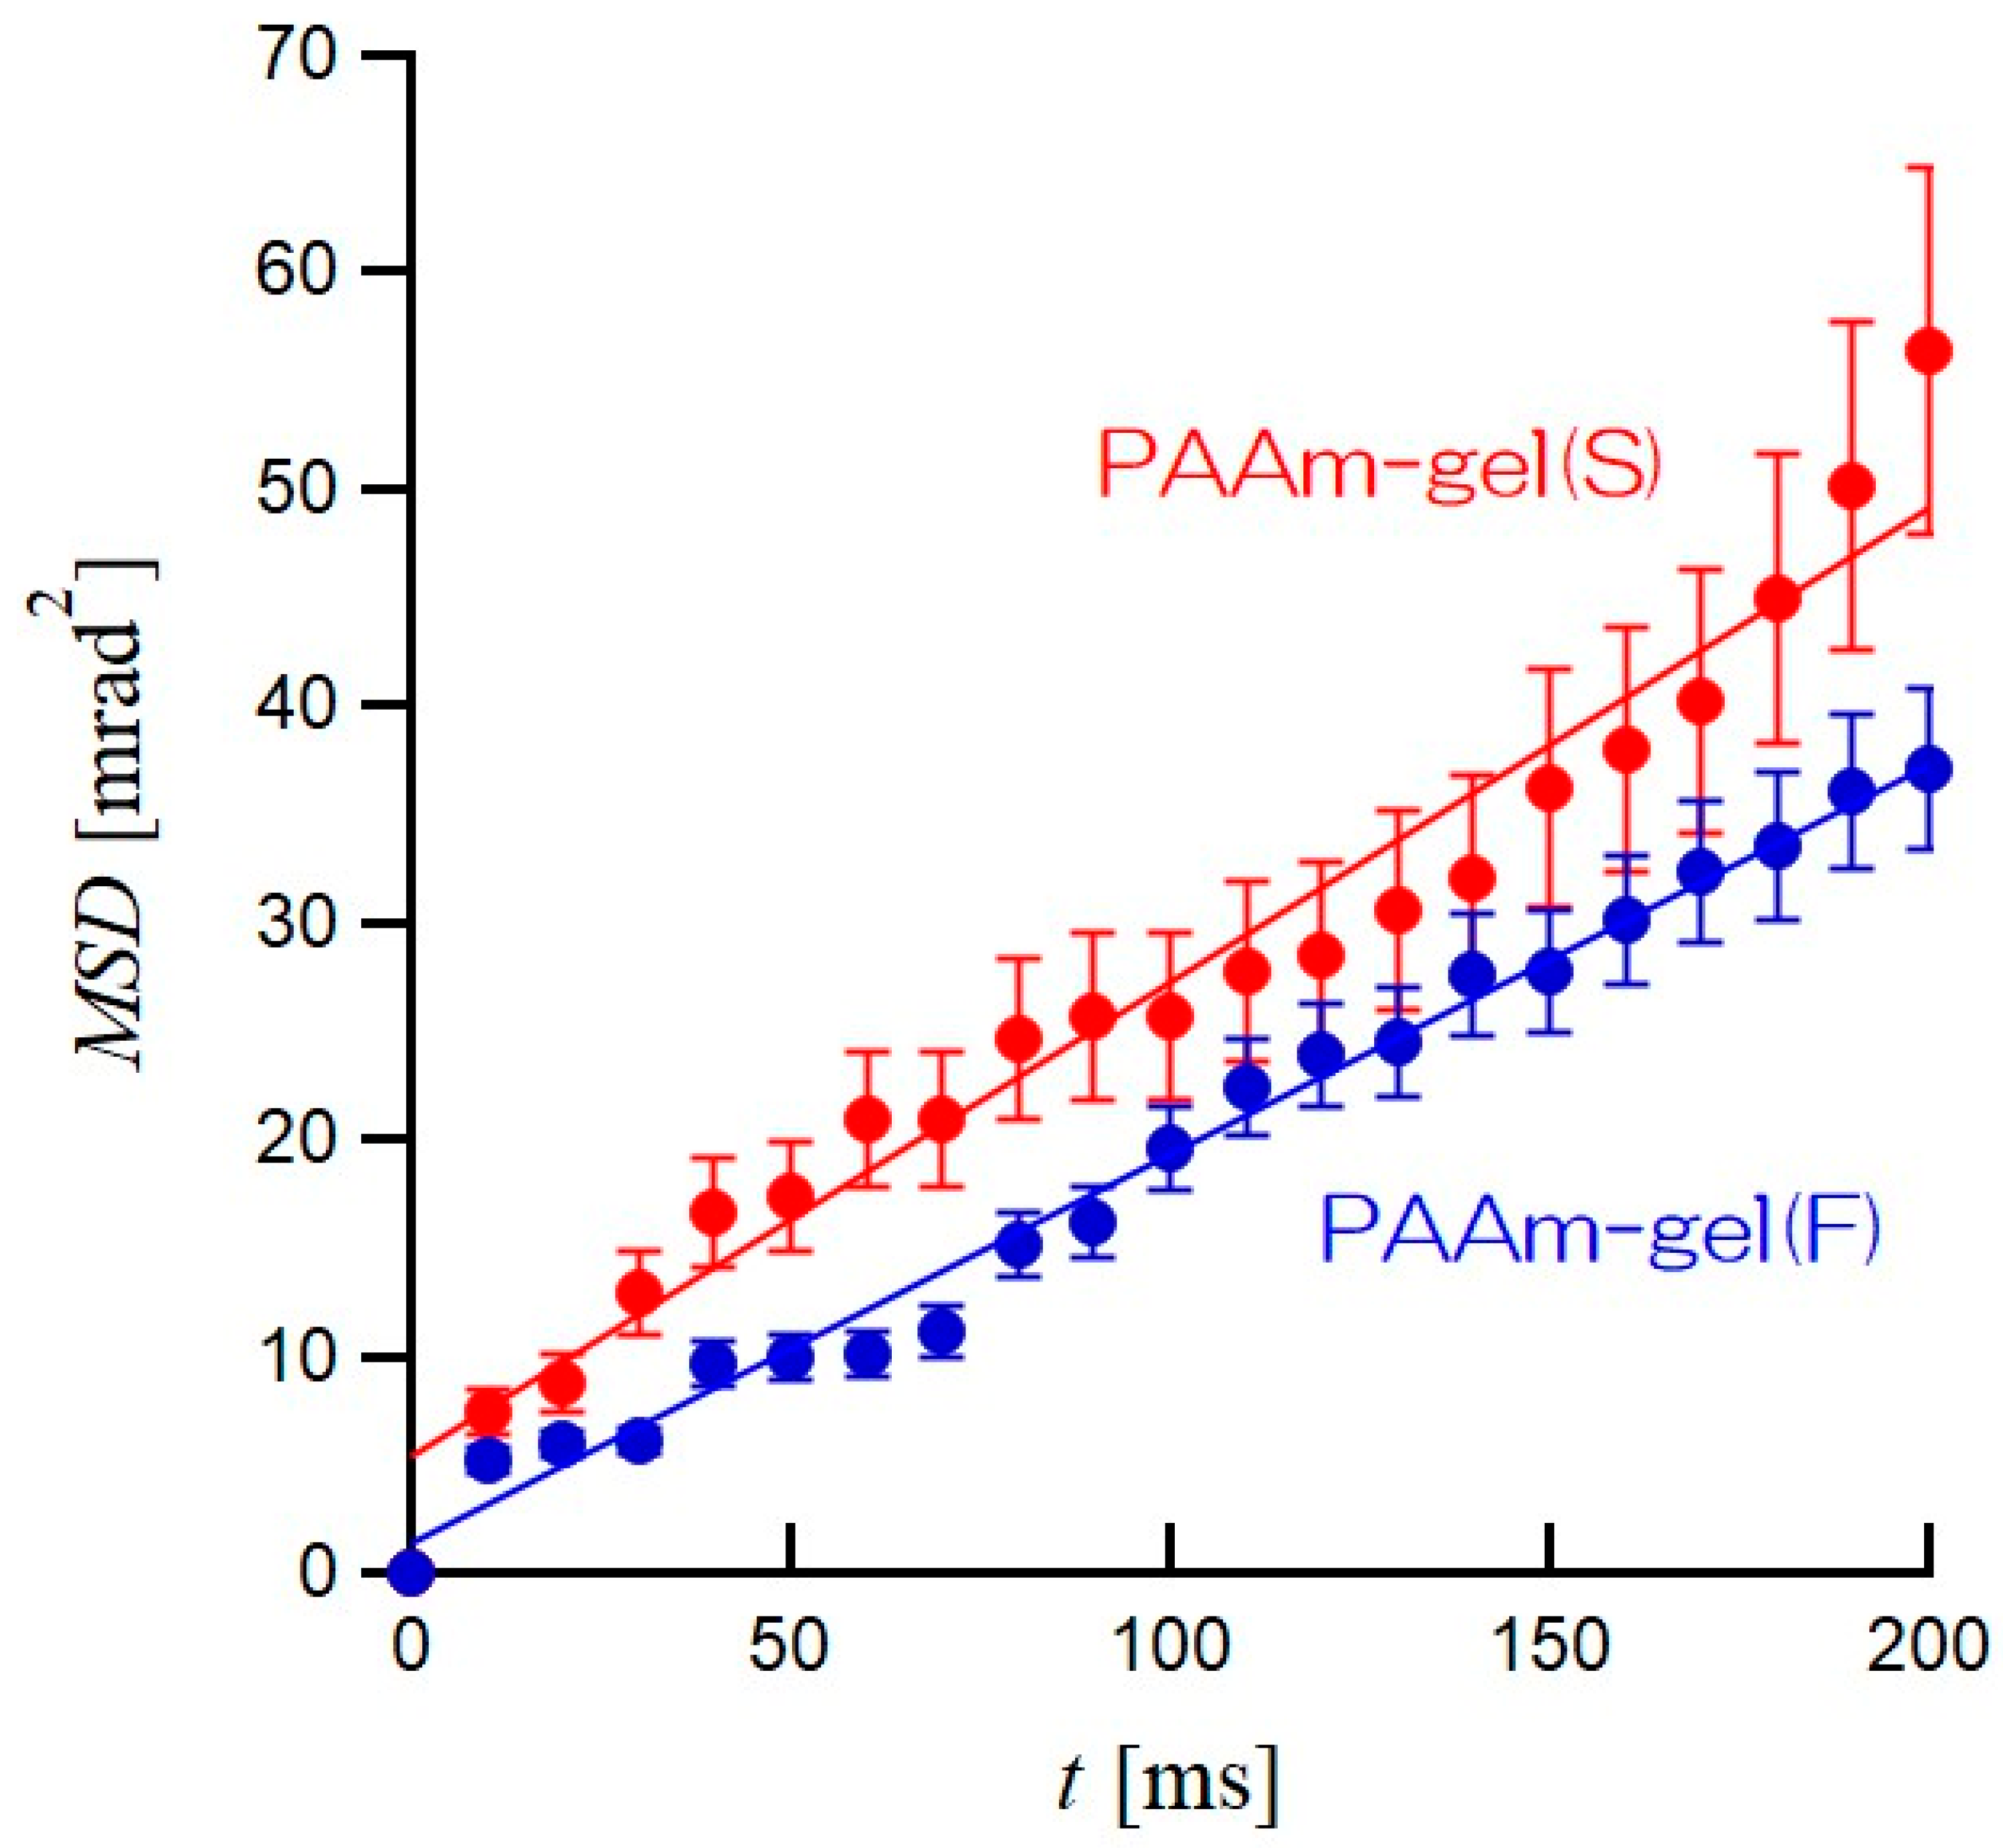
Figure 7 shows plots of
MSDs as the average of the
MSDs of all GNPs in the PAAm gel(S) and PAAm gel(F) as functions of elapsed time
t. In both PAAm gel(S) and PAAm gel(F), it can be seen that the
MSDs are proportional to
t. The solid lines in
Figure 7 are straight lines obtained by the least-squares approximation excluding
t = 0. The slope of the
MSD vs.
t plot for PAAm gel(S) is slightly larger than that of PAAm gel(F). In other words, the GNPs encapsulated in PAAm gel(S) are more active in terms of rotational motion than those in PAAm gel(F). The time dependence of
MSD is related to the rotational diffusion coefficient of the GNPs in PAAm gels by the following equation:
where
Drot is the rotational diffusion coefficient of GNPs,
t is the elapsed time after the diffraction spot appears, and
σ is the average error, which is a random error when determining the position of the GNPs and is generally discarded [
29]. For PAAm gel(S), the straight line was obtained by using 0.218 mrad
2/ms as the slope containing the standard deviation of ±0.011 and 5.34 as 2
σ2, with a correlation factor
r2 of 0.958. On the other hand, for PAAm gel(F), the straight line was obtained by using 0.180 mrad
2/ms as the slope containing the standard deviation of ±0.0047 and 5.63 as 2
σ2, with a correlation factor
r2 of 0.988. Therefore, for both PAAm gel(S) and PAAm gel(F), good linear approximations were obtained. The averaged
Drots of GNPs obtained from the straight lines in
Figure 7 are 0.064 mrad
2/ms for PAAm gel(S) and 0.048 mrad
2/ms for PAAm gel(F). The
Drot of PAAm gel(S) is 1.3 times higher than that of PAAm gel(F), even though the equilibrium swelling factors are the same. The heterogeneous PAAm gel(F) is constructed by both high- and low-network-density regions. The rotational motions of GNPs with a 200 nm diameter incorporated in the low-network-density region are restricted, even though the low-network-density region can swell with water. Therefore, the difference in the heterogeneity of the network density in PAAm gels with the same swelling ratio should cause slight differences in the average
Drot for all GNPs in PAAm gels. In order to discuss the heterogeneity of the network in PAAm gels, it is necessary to obtain the
Drot for each GNP and to determine their distribution. Thus, the
Drot is calculated for each diffraction spot based on the relationship between
MSD and time, and the distribution was examined.
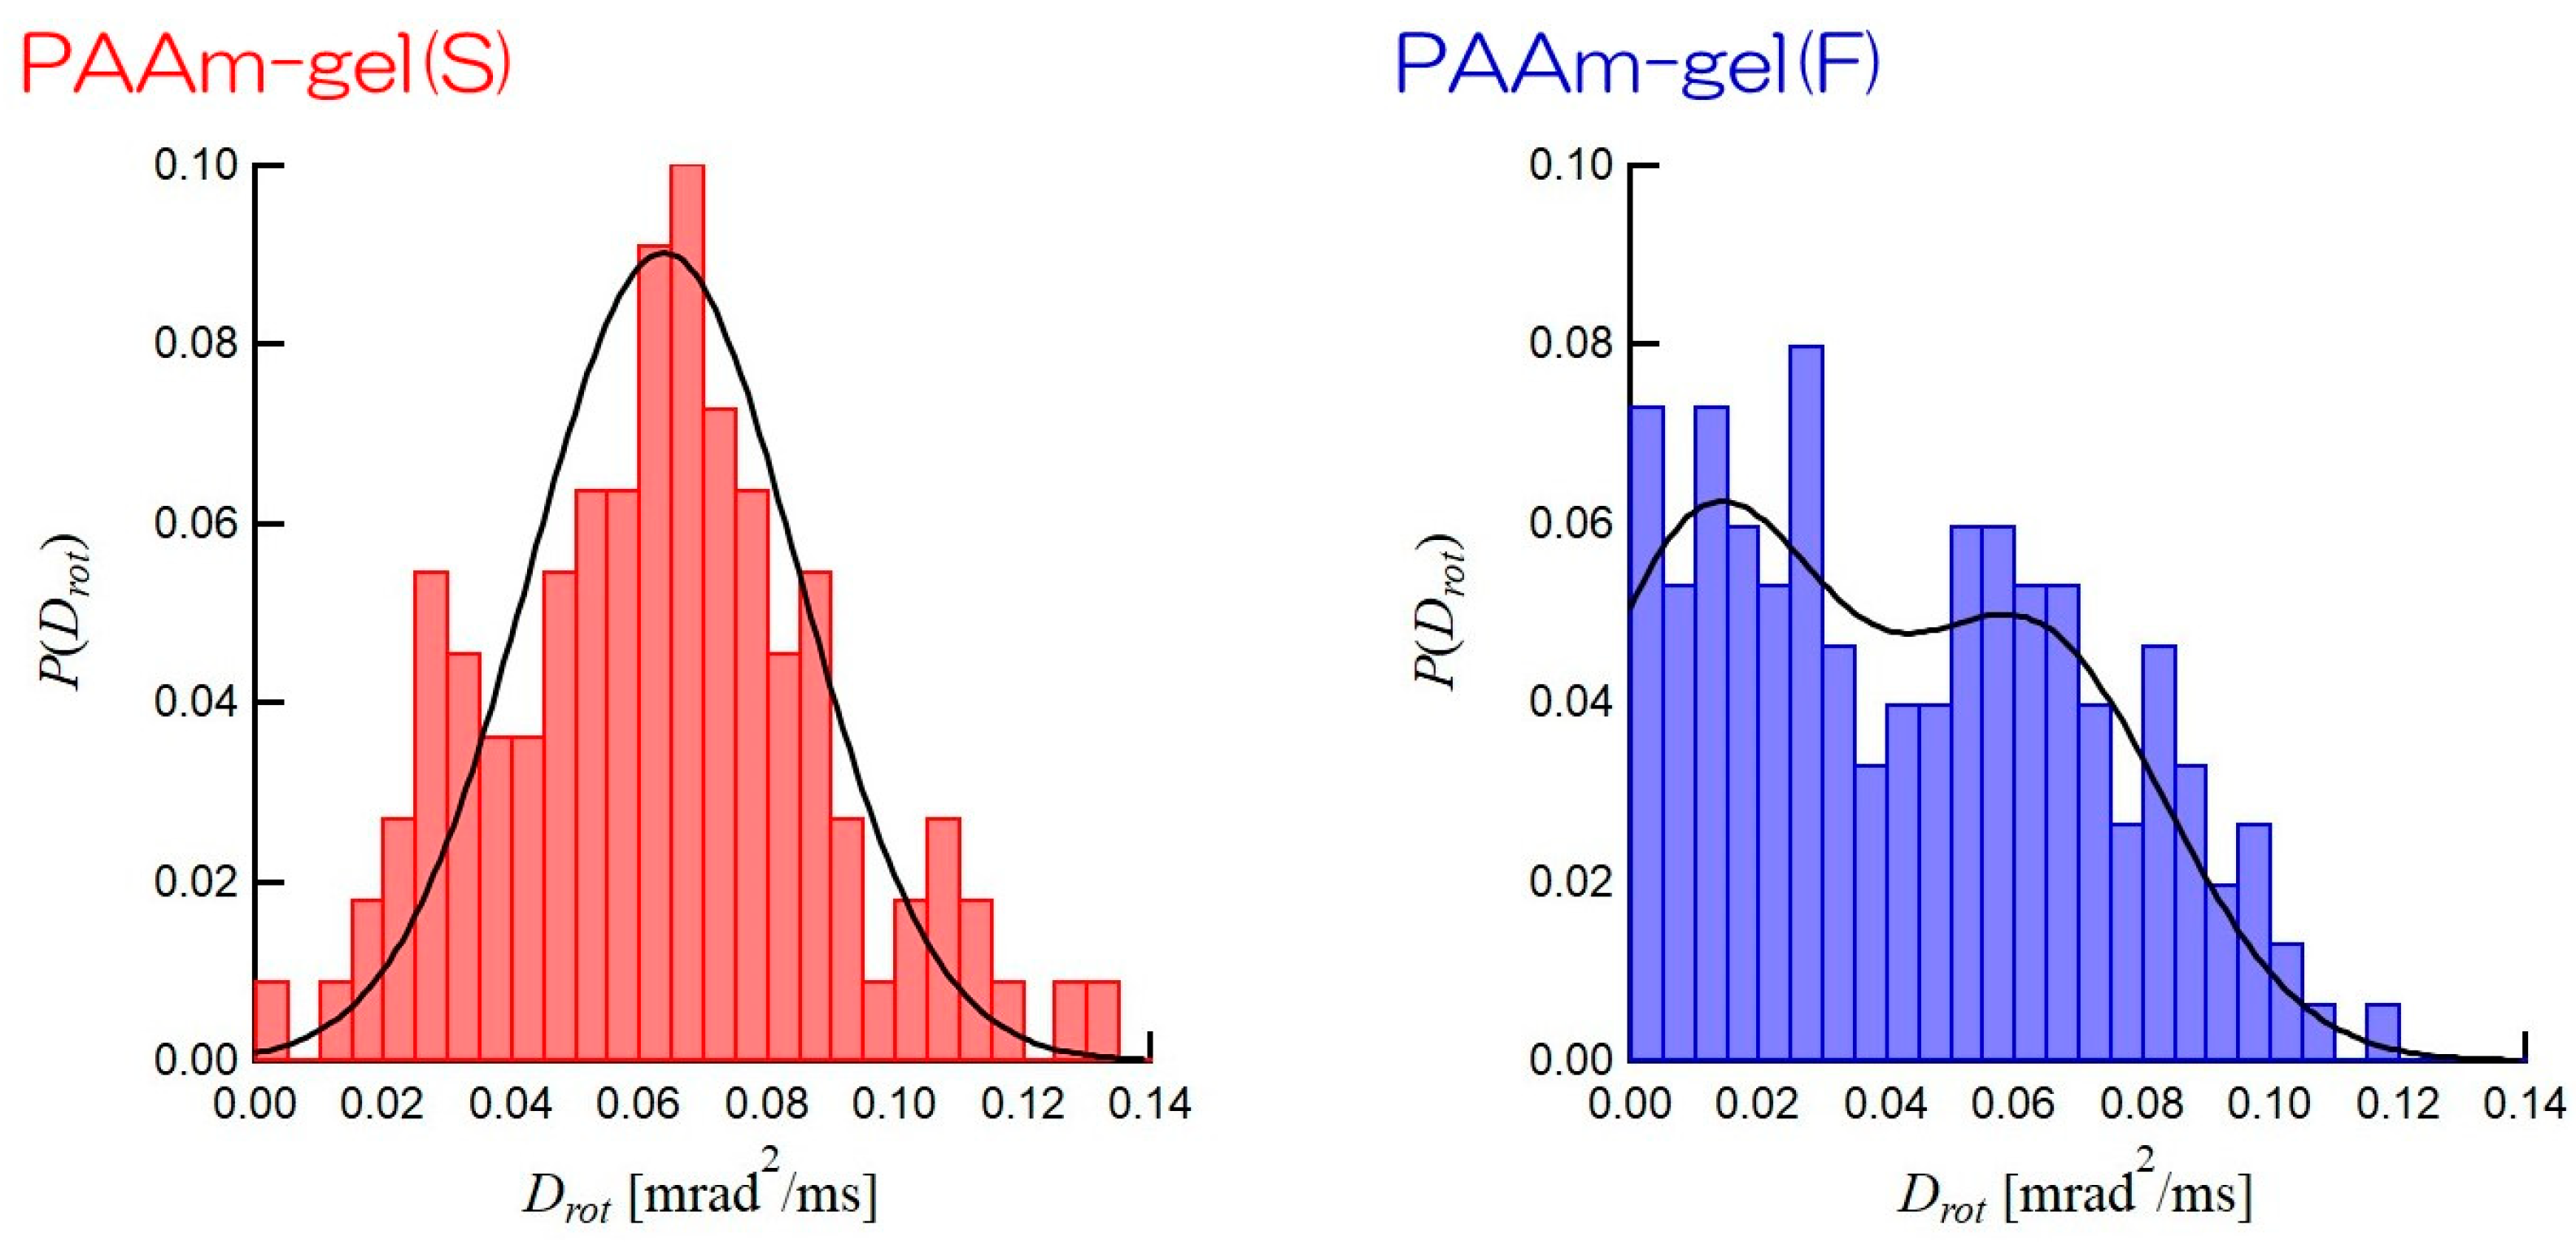
Figure 8 shows the distributions of
Drots of GNPs incorporated in PAAm gel(S) and PAAm gel(F). The distribution of
Drot of GNPs in PAAm gel(S) has a single maximum at
Drot = 0.06 mrad
2/ms and a narrow width. This indicates that the mobilities of the GNPs are homogeneous in PAAm gel(S). On the other hand, the distribution of
Drot of GNPs in PAAm gel(F) clearly shows two maximums at
Drot = 0.01 mrad
2/ms and
Drot = 0.06 mrad
2/ms. Hence, there are two types of GNPs with different
Drots in the PAAm gel(F). The solid line for PAAm gel(S) is obtained by the Gauss distribution function with a mean
Drot = 0.64 mrad
2/ms and a standard deviation of 0.21 mrad
2/ms. In contrast, the solid line for PAAm gel(F) is the result of combining two Gaussian distributions: one is the Gaussian distribution with a mean
Drot = 0.63 mrad
2/ms and a standard distribution of 0.21 mrad
2/ms and the other is that with a mean
Drot = 0.12 mrad
2/ms and a standard distribution of 0.2 mrad
2/ms. These results are consistent with the SAXS results shown in
Figure 3. The SAXS results show that PAAm gel(S) has a homogeneous network structure, whereas there are high and sparse cross-linking density regions in PAAm gel(F). The GNPs incorporated into the high cross-linking density region of PAAm gel(F) have a low level of mobility and a small
Drot, while those incorporated into the low cross-linking density regions can move actively, so they have a high
Drot. Therefore, the distribution of
Drot of the GNPs encapsulated into the PAAm gel(F) is expected to be bimodal. The ratio of GNPs captured in the low-cross-linking density region to those captured in the high-density region, as obtained by the integration of each Gaussian distribution, is ca. 1:1 in PAAm gel(F). This suggests that the volume ratio of the high cross-linking density region to the sparse cross-linking density region is 1:1 in PAAm gel(F). Therefore, DXT, which tracks the mobility of individual particles, can provide the ratio of the high cross-linking density region to the sparse cross-linking region in a gel. Therefore, DXT can be considered suitable for heterogeneity analyses of network polymers.


