Article

Residual Stresses of Small-Bore Butt-Welded Piping Measured by Quantum Beam Hybrid Method

by
Kenji Suzuki
1,*,
Yasufumi Miura
2,
Hidenori Toyokawa
3,
Ayumi Shiro
4,
Takahisa Shobu
5,
Satoshi Morooka
5 and
Yuki Shibayama
5
1
Factulty of Education, Niigata University, Ikarashi-2-no-cho, Nishi-ku, Niigata 950-2181, Japan
2
Central Research Institute of Electric Power Industry, 2-6-1 Nagasaka, Yokosuka-shi 240-0196, Japan
3
Japan Synchrotron Radiation Research Institute, 1-1-1, Koto, Sayo-cho, Hyogo 679-5198, Japan
4
Kansai Photon Science Institute, National Institute for Quantum and Radiological Science and Technology, 1-1-1, Koto, Sayo-cho, Hyogo 679-5198, Japan
5
Materials Sciences Research Center, Japan Atomic Energy Agency, 2-4 Shirakata, Tokai-mura, Naka-gun, Ibaraki 319-1195, Japan
*
Author to whom correspondence should be addressed.
Quantum Beam Sci. 2025, 9(2), 15; https://doi.org/10.3390/qubs9020015
Submission received: 27 January 2025 / Revised: 6 April 2025 / Accepted: 17 April 2025 / Published: 2 May 2025
(This article belongs to the Section Engineering and Structural Materials)

Abstract

:
Cracks due to stress corrosion cracking in stainless steels are becoming a problem not only in boiling water reactors but also in pressurized water reactor nuclear plants. Stress improvement measures have been implemented mainly for large-bore welded piping, but in the case of small-bore welded piping, post-welding stress improvement measures are often not possible due to dimensional restrictions, etc. Therefore, knowing the actual welding residual stresses of small-bore welded piping regardless of reactor type is essential for the safe and stable operation of nuclear power stations, but there are only a limited number of examples of measuring the residual stresses. In this study, austenitic stainless steel pipes with an outer diameter of 100 mm and a wall thickness of 11.1 mm were butt-welded. The residual stresses were measured by the strain scanning method using neutrons. Furthermore, to obtain detailed residual stresses near the penetration bead where the maximum stress is generated, the residual stresses near the inner surface of the weld were measured using the double-exposure method (DEM) with hard X-rays of synchrotron radiation. A method using a cross-correlation algorithm was proposed to determine the accurate diffraction angle from the complex diffraction patterns from the coarse grains, dendritic structures, and plastic zones. A quantum beam hybrid method (QBHM) was proposed that uses the circumferential residual stresses obtained by neutrons and the residual stresses obtained by the double-exposure method in a complementary use. The residual stress map of welded piping measured using the QBHM showed an area where the axial tensile residual stress exists from the neighborhood of the penetration bead toward the inside of the welded metal. This result could explain the occurrence of stress corrosion cracking in the butt-welded piping. A finite element analysis of the same butt-welded piping was performed and its results were compared. There is also a difference between the simulation results of residual stress using the finite element method and the measurement results using the QBHM. This difference is because the measured residual stress map also includes the effect of the stress of each crystal grain based on elastic anisotropy, that is, residual micro-stress.

1. Introduction

In nuclear power stations, stress corrosion cracking (SCC) of austenitic stainless steels is a problem. SCC occurs due to the interaction between austenitic stainless steels and a corrosive environment and tensile residual stress. If the corrosive environment cannot be avoided, it is necessary to improve the tensile residual stress. Water jet peening [1,2], laser peening [3,4], induction heating stress improvement (IHSI) [5,6], and ultrasonic shot peening [7,8] have been implemented as stress improvement methods for large piping in BWR nuclear plants. For small-diameter piping, freezing and delta T methods have also been proposed [9].
In nuclear plants, residual stress measurements have been performed on mock-up specimens of large piping [10,11], but in the future, residual stress measurements will also be required for small-diameter piping. In recent years, cracks due to SCC in stainless steel were found in the spray line piping of the pressurizer in Unit 3 of the Ohi Nuclear Power Plant in Japan [12,13]; thus, it is necessary to understand the residual stress in austenitic stainless steel welded piping in pressurized water reactors (PWRs). For PWRs within Japan, Many of the stainless steel piping welds have not been subjected to stress improvement measures. For BWRs within Japan, stress improvement measures have been implemented for piping welds in domestic boiling water reactor (BWRs), mainly for large-diameter pipes. However, in small diameter piping, there are cases where post-weld stress improvement measures cannot be implemented due to dimensional restrictions. Although it is essential to know the actual welding residual stress of small-diameter piping regardless of reactor type for the safe and stable operation of nuclear power plants, there are only a few examples of actual measurements of residual stress [14].
On the other hand, the strain scanning method using neutrons is well known as a non-destructive stress measurement method [15,16], but when attempting to achieve high spatial resolution, problems arise with coarse grains. The three-dimensional X-ray diffraction (3DXRD) method is suitable for determining the shape, orientation, and stress of crystal grains [17,18]. Making it difficult to apply to bulk materials, because but there are restrictions on the number and size of crystal grains that can be measured. Thus, there is no example of applying it to stress measurement of welding parts. A study has looked into overcoming this problem by using spiral slits [19]. The spiral slit provides strict collimation and allows the diffraction angle to be measured accurately by a two-dimensional detector, but it limits the diffraction angle that can be measured by the slit. A diffraction spot tracing method, which uses a rotating slit system and a two-dimensional detector, has also been proposed [20]. This method achieved collimation over a wide range of diffraction angles. However, it has many issues such as a complex slit system, poor measurement efficiency, and spatial resolution.
A double-exposure method (DEM) [21] was proposed, which enables stress measurement with high spatial resolution using simple optics and an area detector. Since there are various diffraction patterns such as coarse grains, texture, and plastic deformation, the challenge is to determine the diffraction peaks with high accuracy. This DEM enabled measurement of welding residual stress with a spatial resolution of 0.4 mm.
In this paper, we report the application of the DEM to the residual stress measurement of small-bore butt-welded piping, propose a method for determining the diffraction angles using a cross-correlation function, and examine its effectiveness. As a result, the diffraction peak determination method using the correlation function has made it possible to efficiently perform X-ray stress measurements on welded materials with coarse grains and preferred orientation. The DEM measurements involve cutting a plate specimen from the piping to measure the stress, which had a weak point of releasing the hoop residual stress. To solve this problem, we attempted to use the hoop residual stress obtained by triaxial stress measurement using a neutron diffraction. A detailed residual stress map under a triaxial stress state can be obtained by combining the hoop residual stress measured by neutrons and the residual stress measured by the DEM. The results are compared with those of a finite element analysis.

2. Experimental Methods

2.1. Welded Piping and Welded Specimen

In this study, austenitic stainless steel pipes (SUS316, 100A, and schedule 120) were butt-welded. Two pipes were prepared with grooves, butted together via an insert ring. The welding rod and the insert ring materials were both YS316L. The groove angle of the butt-weld was 60 degrees. The welding was performed in seven layers, and each layer was TIG welded with one pass. The welding conditions (current, voltage, and welding speed) used in this study are the same as those used in actual nuclear power plant piping. All layers were finished in seven passes, and the excess weld was removed with a grinder. As shown in Figure 1a, the length of the welded pipe is 300 mm, the outer diameter is 114.3 mm, and the wall thickness is 11.1 mm.
Welded specimens for the DEM measurement were extracted from the welded piping by electrical discharge machining. A photograph of the test specimen is shown in Figure 1b. The axial length of the welded specimen was determined to be 80 mm, based on the position where the axial welding residual stress disappears, i.e., a position four times the pipe thickness away from the weld line. The thickness of the welded specimen was 5 mm, which was a thickness that did not reduce a bending stiffness of the specimen and took into account the penetration of X-rays. Figure 1c shows a photograph of a specimen weld, which was electrolytically polished to show the welded parts clearly. The coordinate position of the welded specimen was defined with the top of the penetration bead as the origin, as shown in Figure 1c. The strain-free d 0 -sample is shown in Figure 1d.

2.2. Stress Measurement Using Neutrons

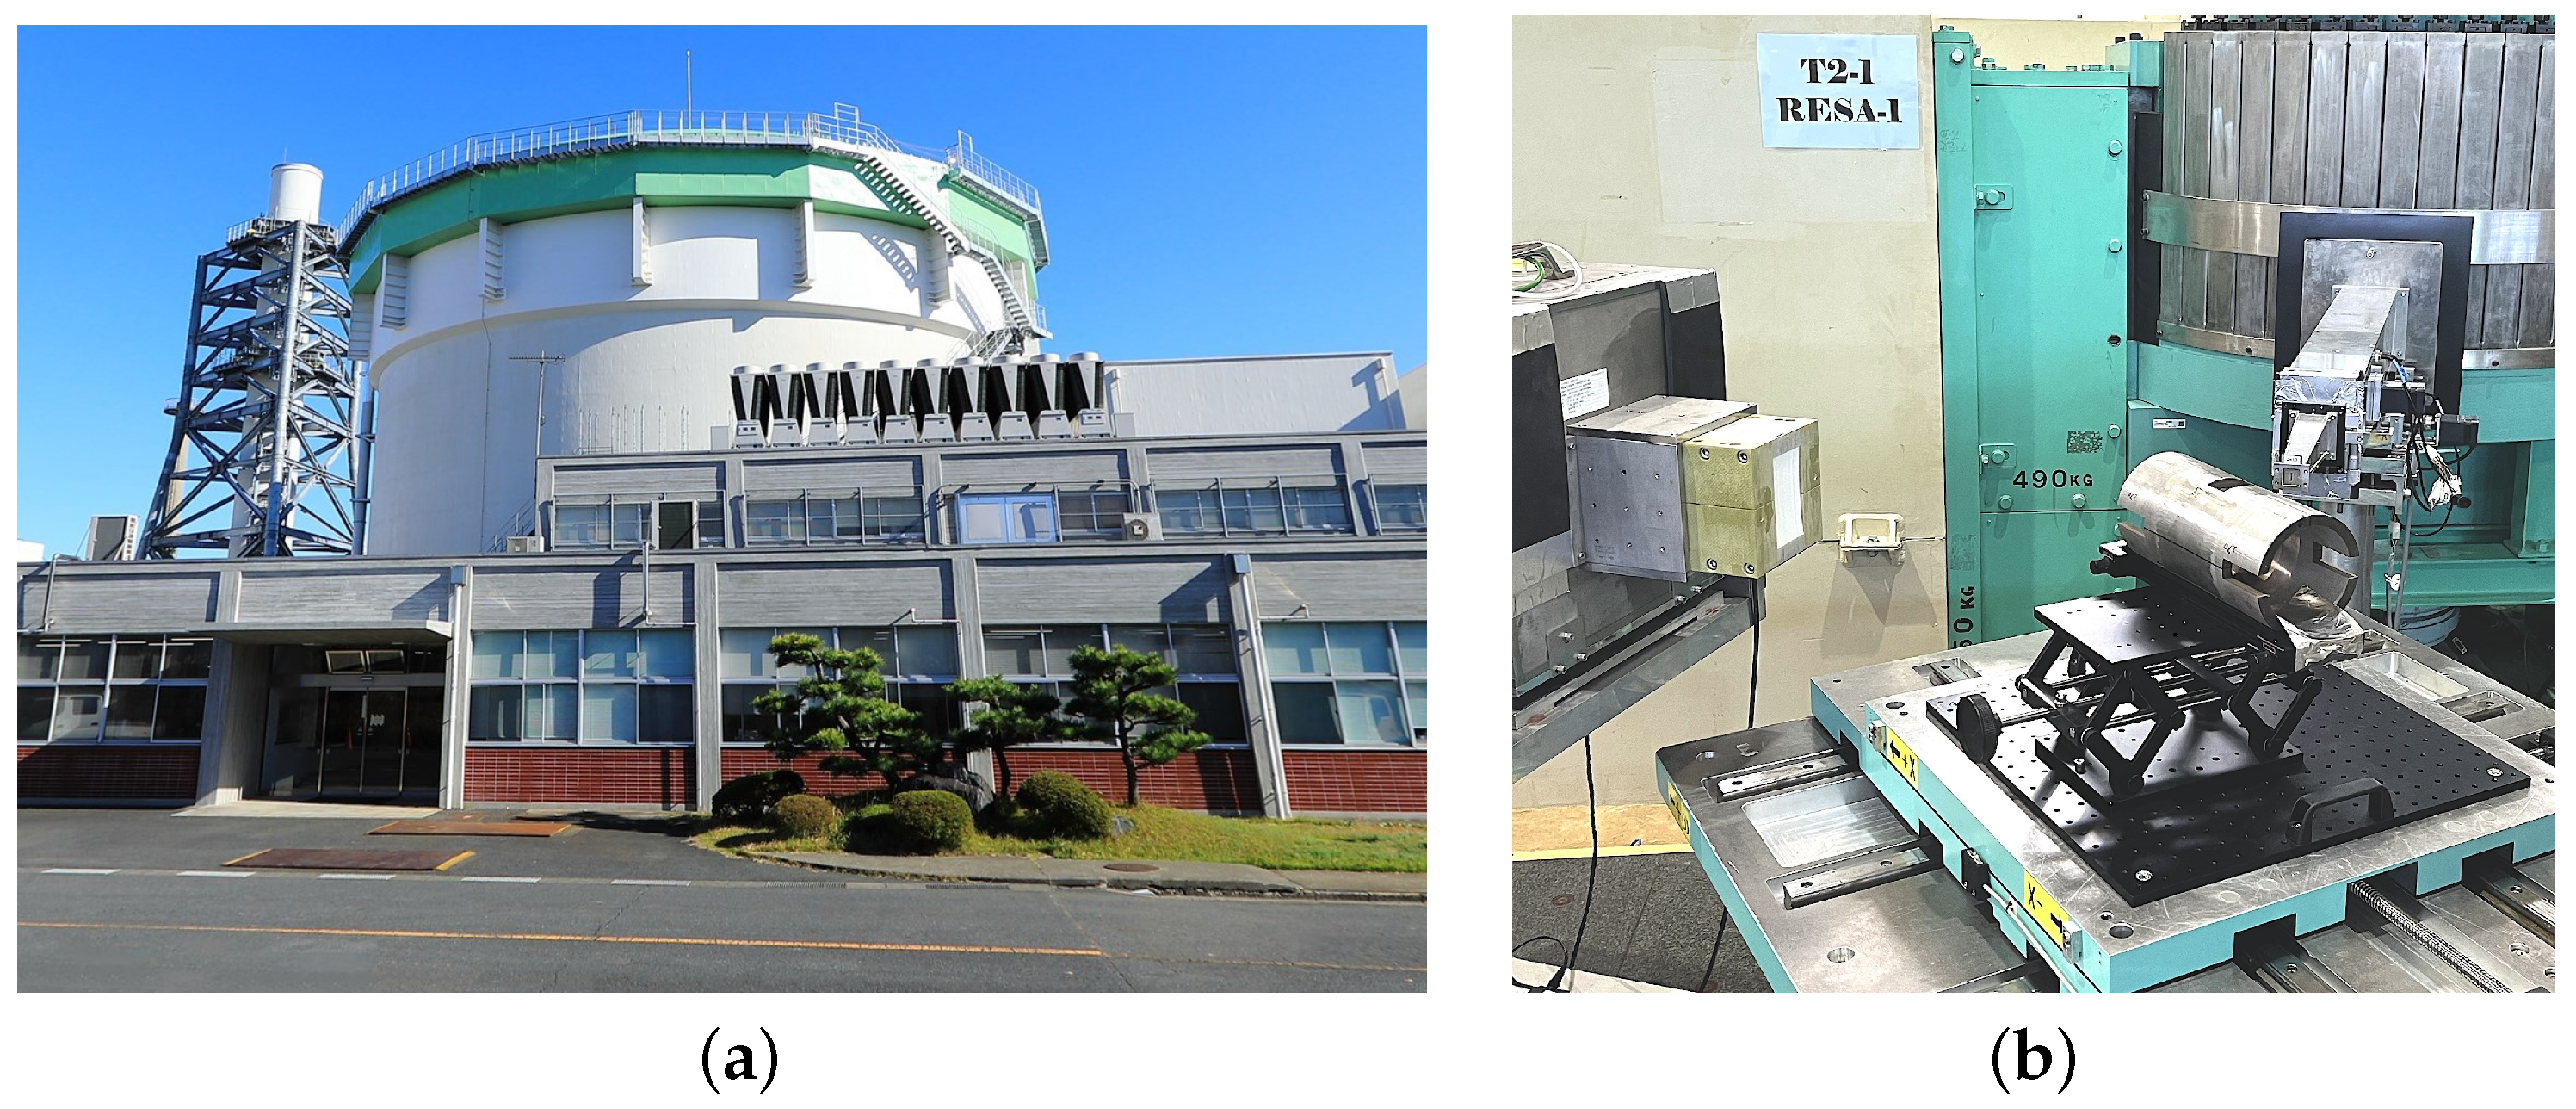
First, to obtain the residual stress in the welded piping non-destructively, the residual stresses in the welded piping were measured using a strain scanning method with thermal neutrons. The neutron source was the Japan Atomic Energy Agency’s research reactor JRR-3 [22], shown in Figure 2a. Neutrons generated by nuclear fission in the research reactor JRR-3 were guided through a neutron-guide tube to the neutron scattering facility. The monochromatic neutron beam was made by a Si single-crystal monochromator, and the neutron diffraction was measured using the RESA diffractometer, shown in Figure 2b.
The strain scanning method was used for neutron stress measurement. The strain, ε , was determined from the change in diffraction angle θ using the Bragg’s law as follows [23]:
ε = sin θ 0 sin θ 1 ,
where θ 0 is a strain-free diffraction angle.
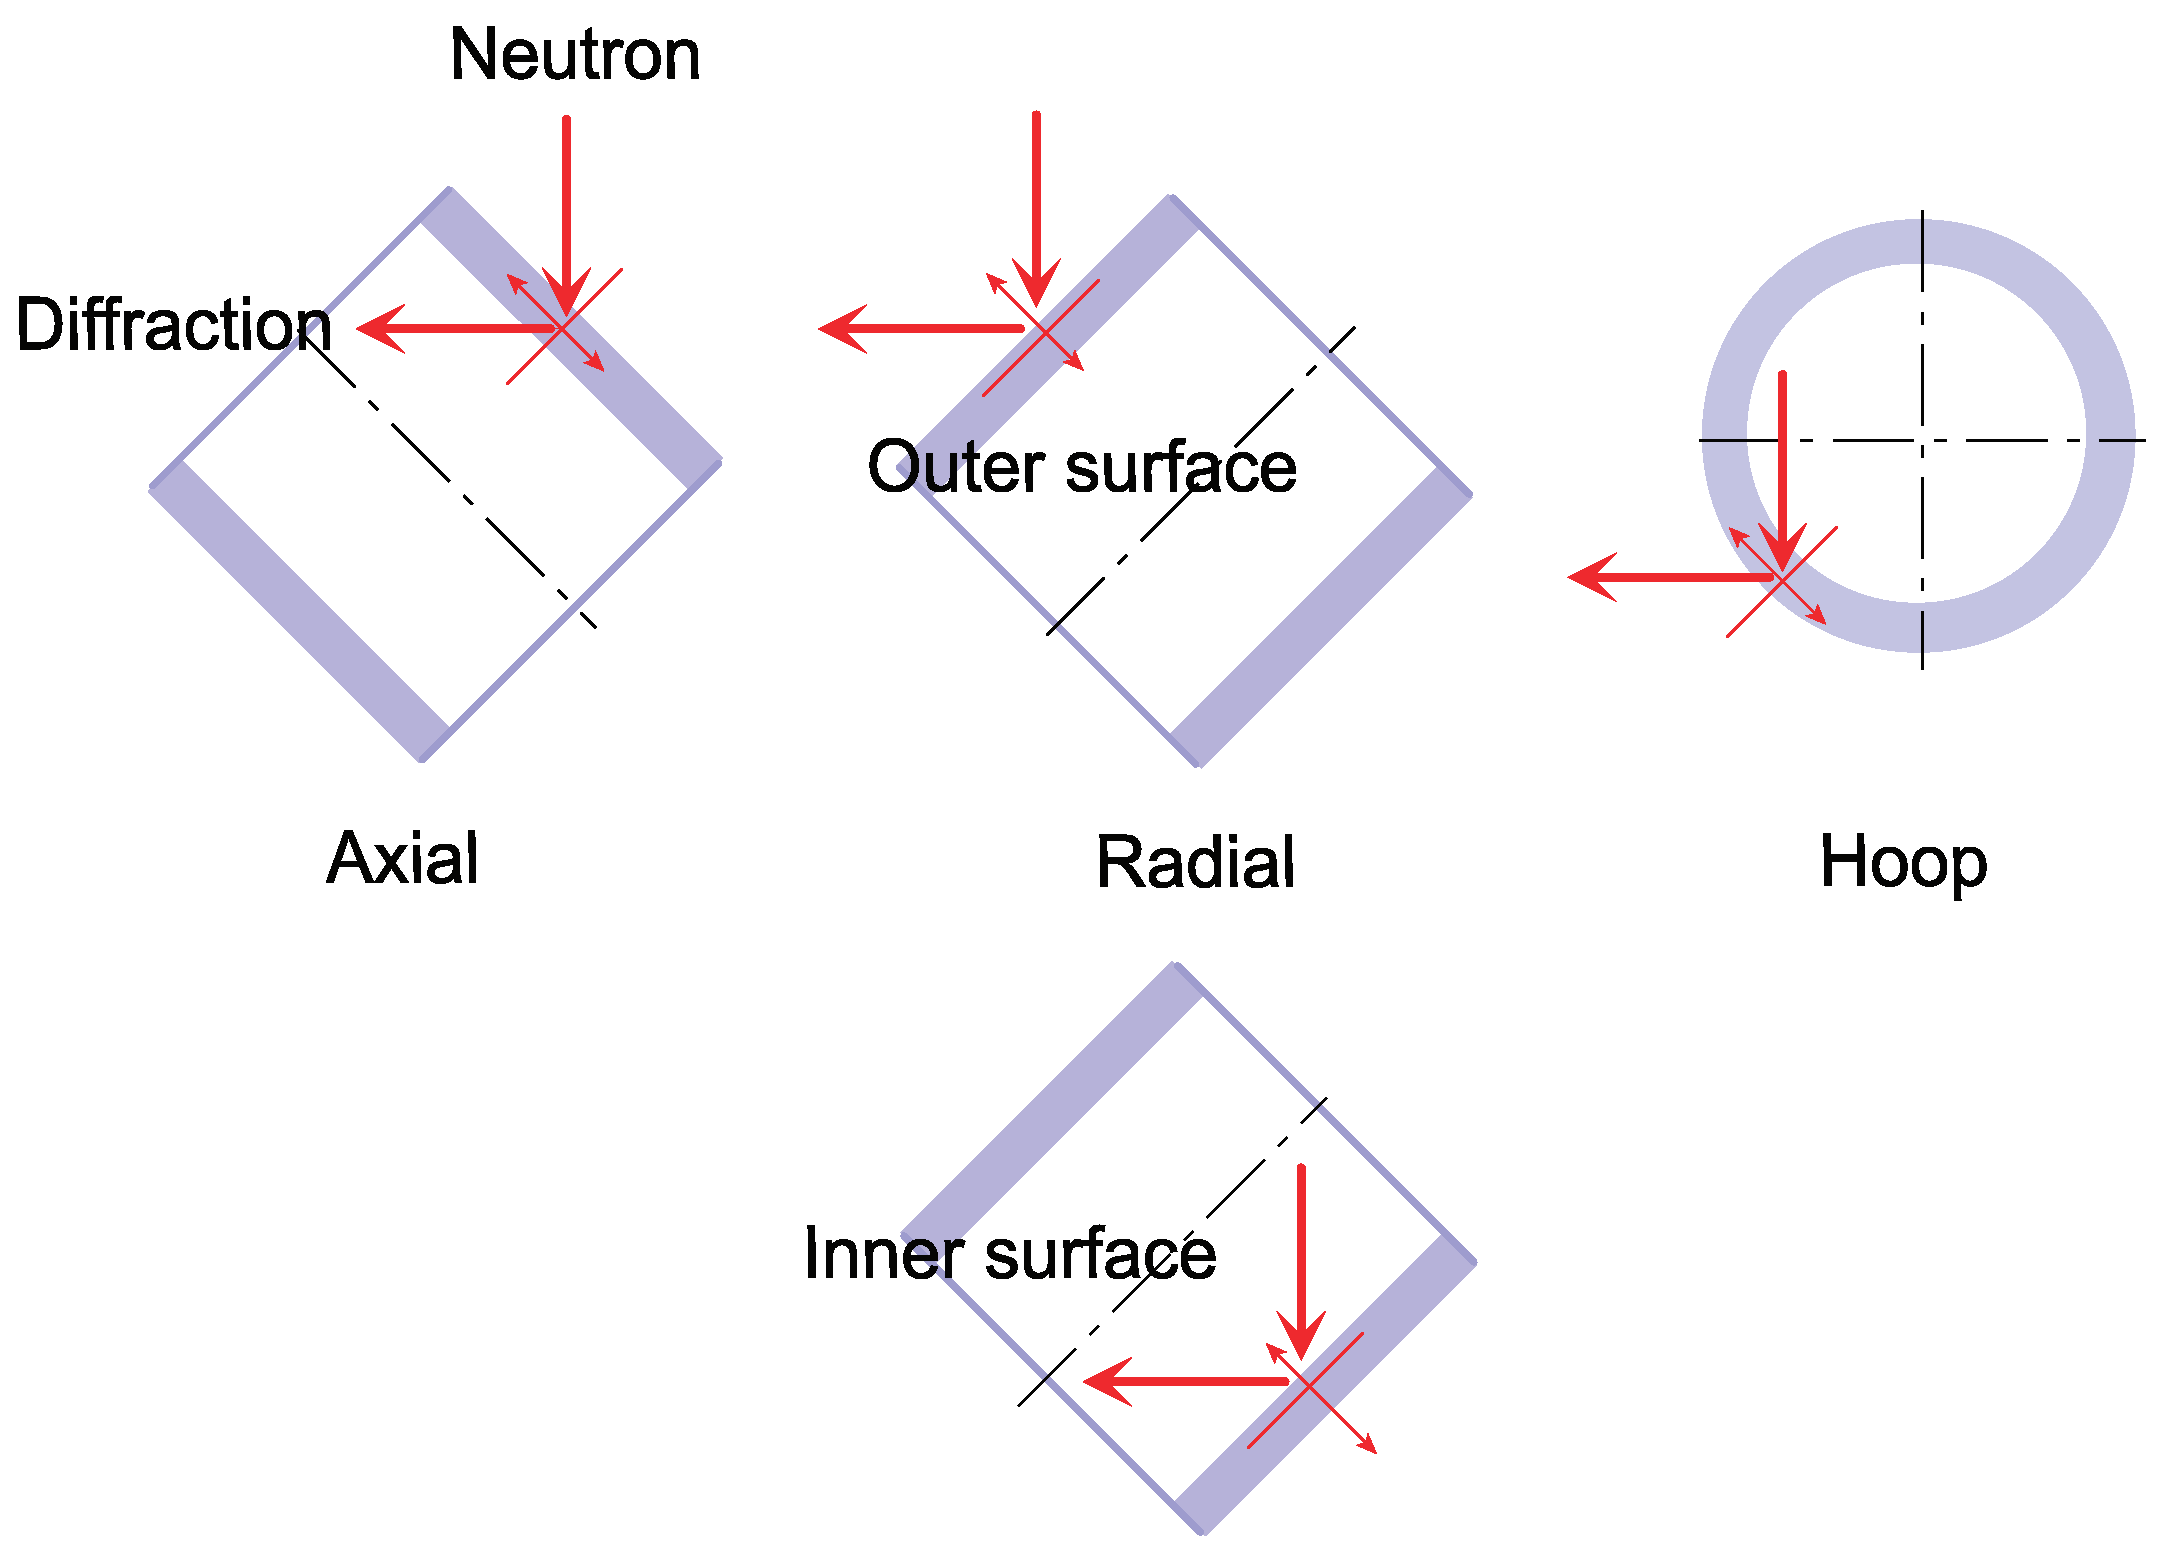
A radial collimator of 2 mm gauge volume was installed in front of the detector. Figure 3 shows the relationship between the incident neutron beam and the position of the welded piping for each strain direction: axial, radial and hoop. The neutron measurement positions were five lines at ± 5 , ± 10 mm and the welding line ( x = 0 mm), and depths of y = 4 , 6, 8, 10 mm in the depth direction, with y = 2 mm added to x = 0 mm. In addition, the diffraction angles of the strain-free specimen, θ 0 , were measured using the d 0 -specimen, which was stress-released by being slit with a wire cutter.

2.3. Double-Exposure Method (DEM)

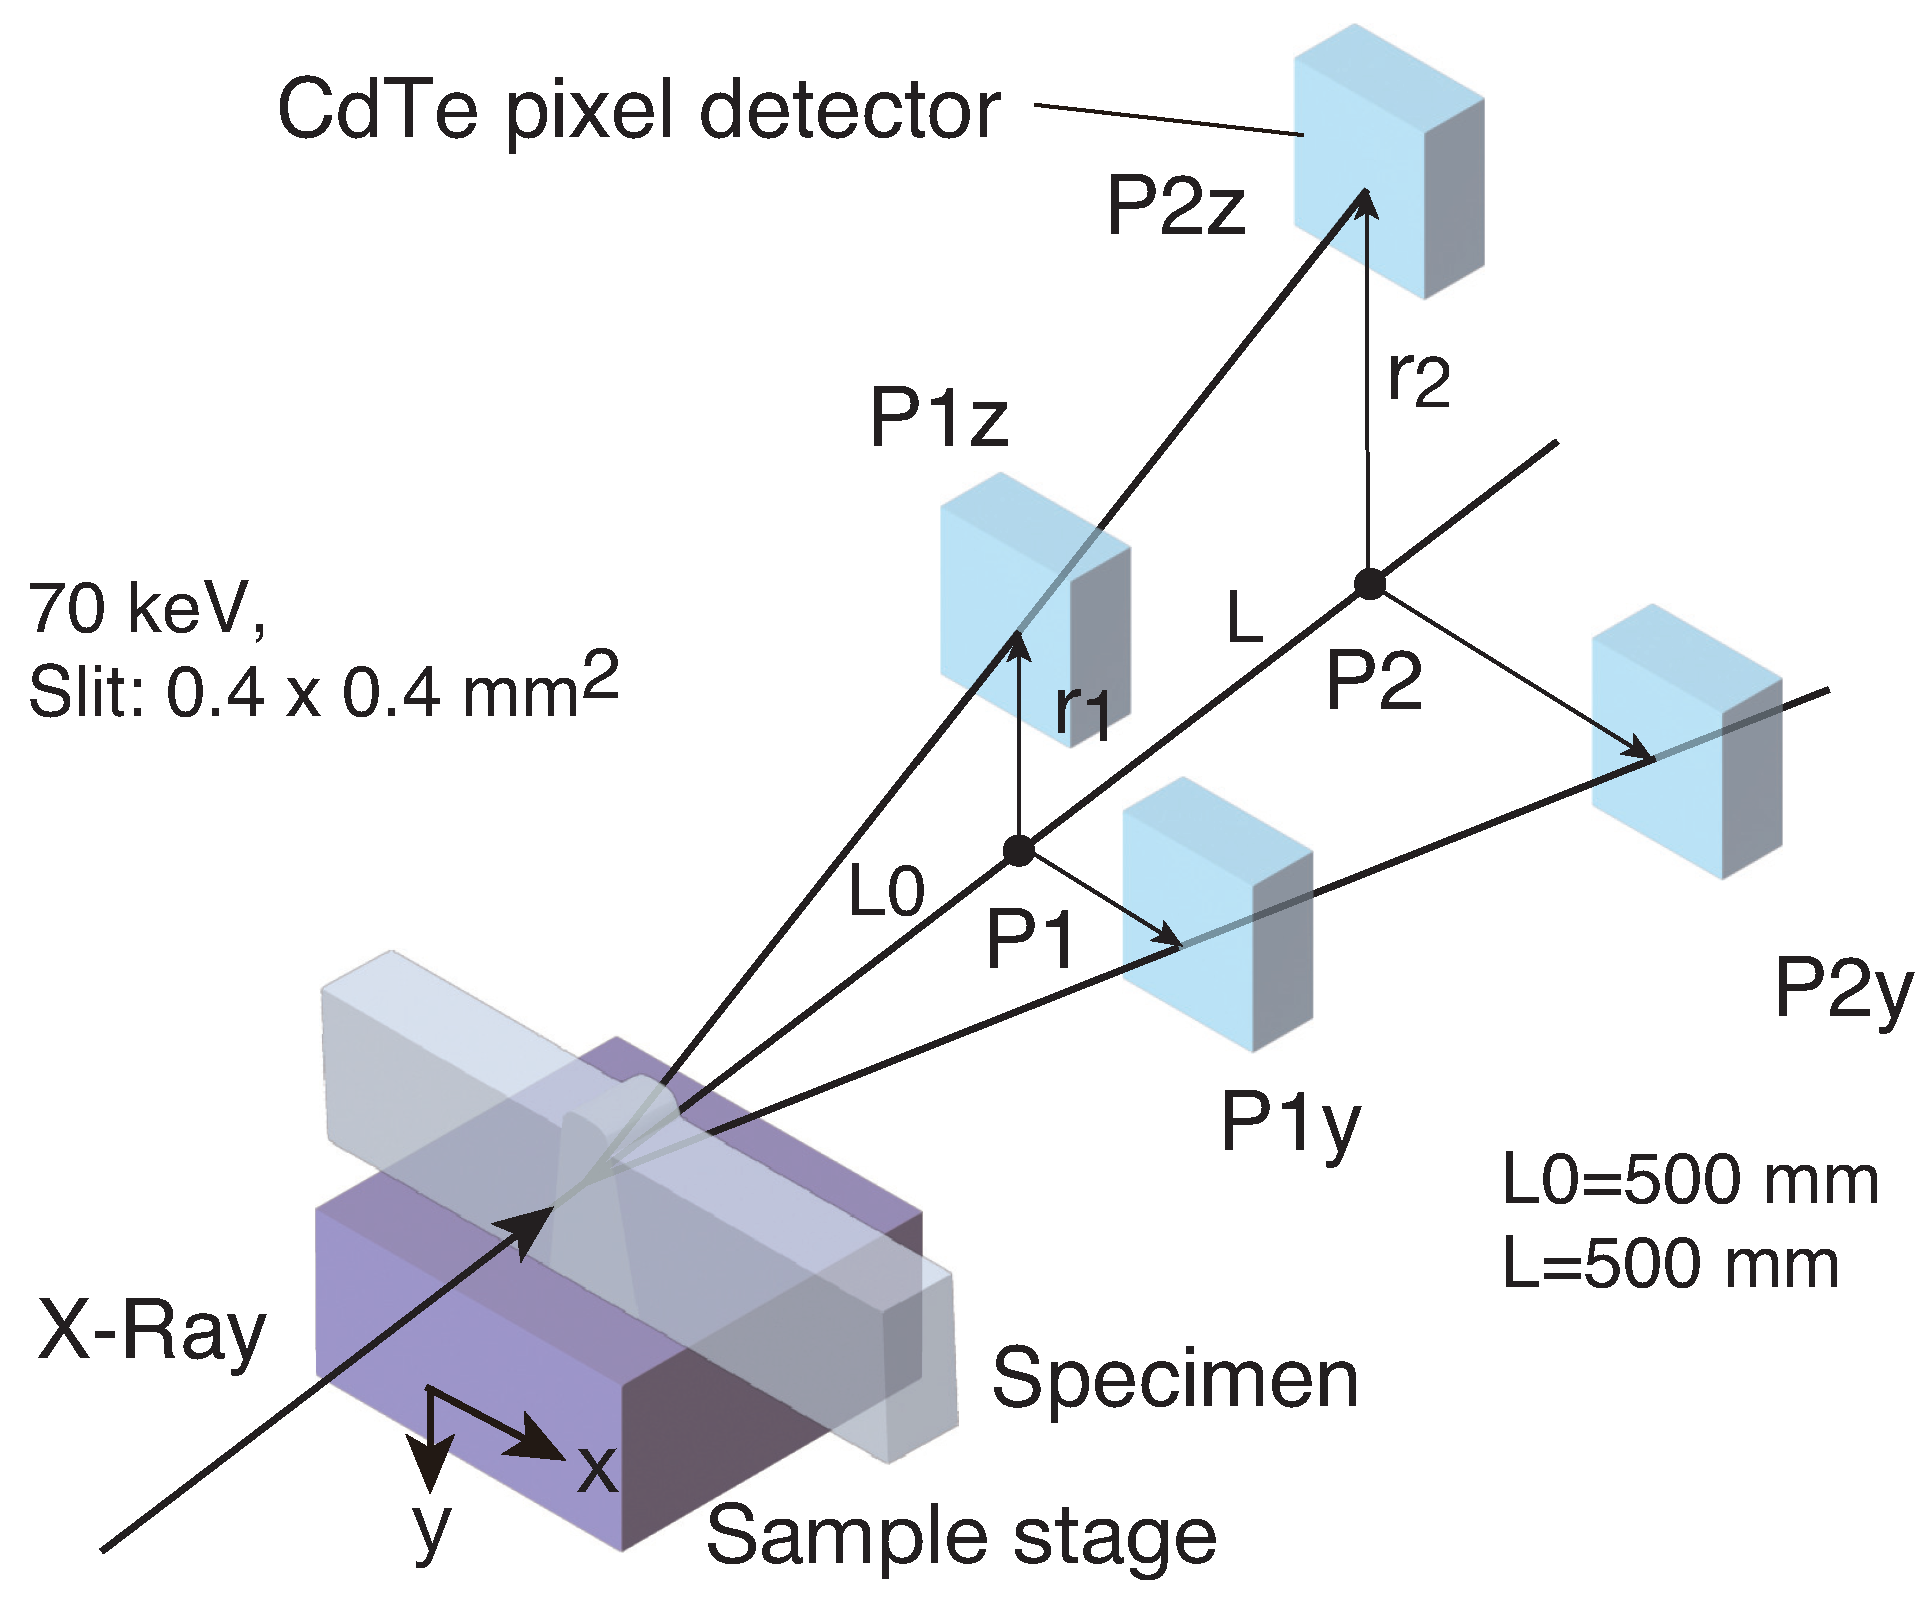
The DEM with hard synchrotron X-rays was used to measure the residual stress near the heat-affected zone (HAZ) of the welded piping with high spatial resolution. The principle of measuring the diffraction angle using the DEM is shown in Figure 4. The welded specimen is placed on the sample stage, and the high-energy synchrotron monochromatic X-ray beam is transmitted perpendicular to the welded specimen. The diffraction pattern is detected by the area detector. When the diffraction radius measured by the detector at P1 is r 1 , we cannot know where the diffraction comes from; therefore, the camera length L 0 cannot be determined and an accurate diffraction angle 2 θ cannot be obtained. If the diffraction pattern is measured at two points, P1 and P2, and the diffraction radii r 1 and r 2 are obtained, respectively, the diffraction angle can be determined from the difference between these radii. The camera length L 0 is not required in the DEM. Hence, the accurate diffraction angle can be obtained by the following formula:
2 θ = arctan r 2 r 1 L = arctan r L ,
where L is the distance between P1 and P2, as shown in Figure 4. This method is called the double-exposure method (DEM) [21]. The DEM has no restrictions on the size or number of crystal grains of the sample, making it possible to measure the stress of bulk materials such as welded specimens, and it does not require a complex slit system. By moving the sample stage in the x y -directions, a residual stress map with high spatial resolution can be created. If the diffraction spots are discrete, the DEM can also identify the diffraction positions within the material.
To perform the DEM for the 5 mm thick welded specimen shown in Figure 1b, high-energy synchrotron radiation X-rays were required. In this study, the X-ray energy used was 70 keV and the incident X-ray beam dimension was 0.4 × 0.4 mm 2 , as shown in Figure 4. A CdTe pixel detector was used as an area detector suitable for high-energy X-rays. Its pixel size was 0.2 × 0.2 mm2, and the number of pixels was 201 × 191 [24].
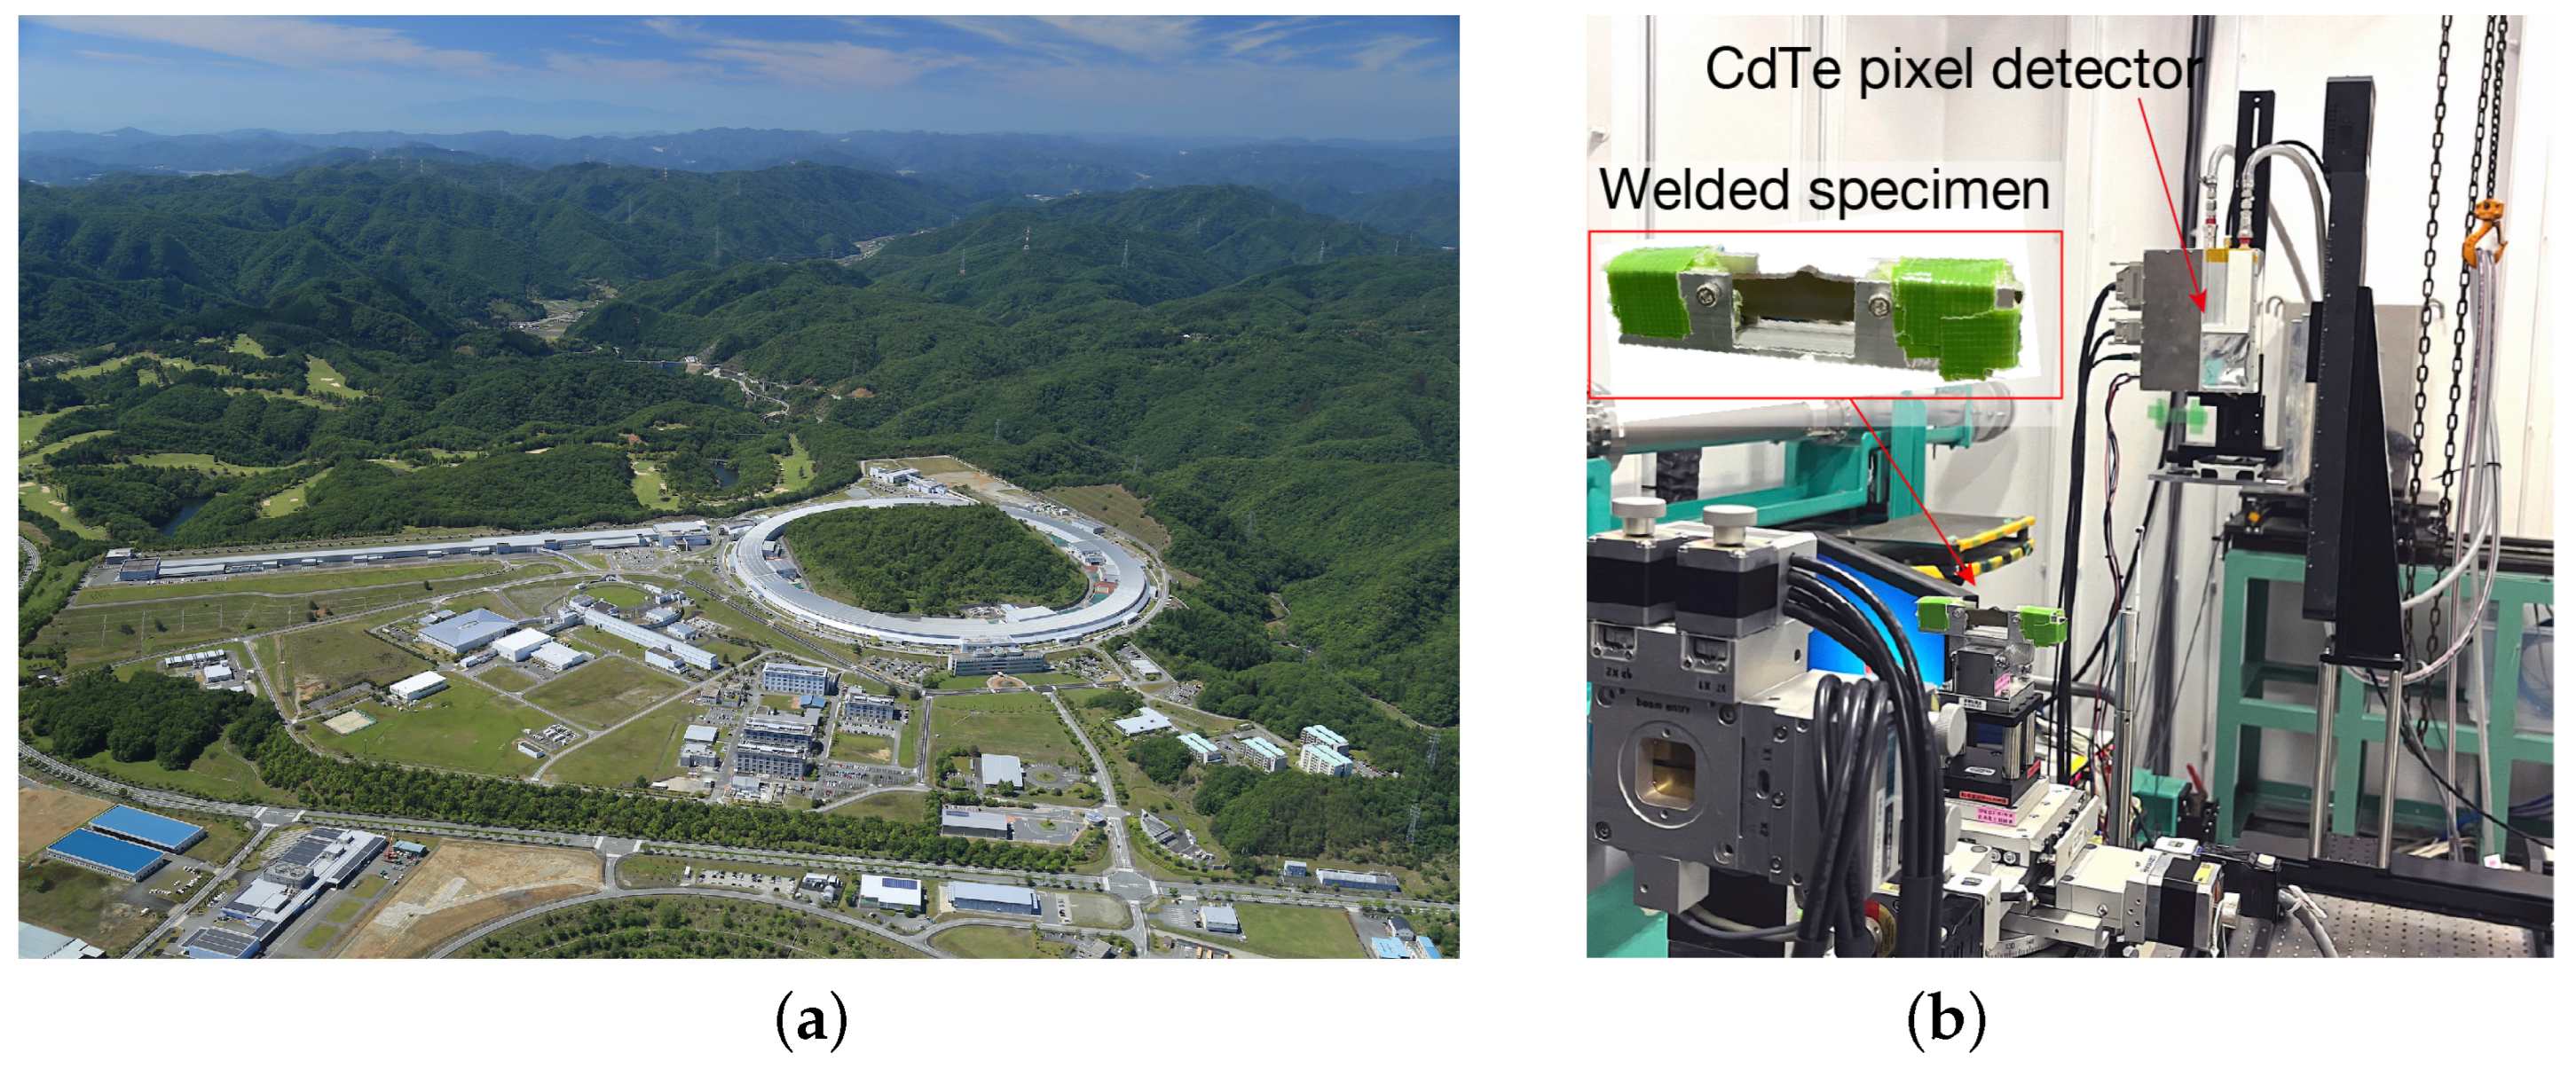
The DEM experiment was carried out using the National Institute for Quantum and Radiological Science and Technology (QST) dedicated beamline BL14B1 at the synchrotron radiation facility SPring-8 in Japan [25], which can utilize high-energy synchrotron X-rays (Figure 5a). The detector was mounted on an automatic x y z -stage and moved to positions P1 and P2 to measure the diffraction images in the horizontal and vertical directions, as shown in Figure 5b. The distance between P1 and P2, L, was set to 500 mm as shown in Figure 4. When the camera length L 0 was set to 500 mm, and the angular resolution at the detection plane at P1 was approximately 0 . 02 . L was set to the same as L 0 , and the angular resolution of r was also set to the same as P1. When L 0 and L are long, the angular resolution is high, but the exposure time becomes long and measurement time is lost. In addition, when L 0 is short, diffraction spots interfere. If L is made longer than L 0 , the diffraction waveforms of P1 and P2 will not be similar. Based on our experience, L = L 0 = 500 mm in this experiment is suitable for creating a stress map. In addition, the range of the circumferential integral was set to a range of ± 5 for each direction so as to be within the measurement range of the detector at P2.

3. Results and Discussion

3.1. Residual Stress Measured by Neutron Diffraction

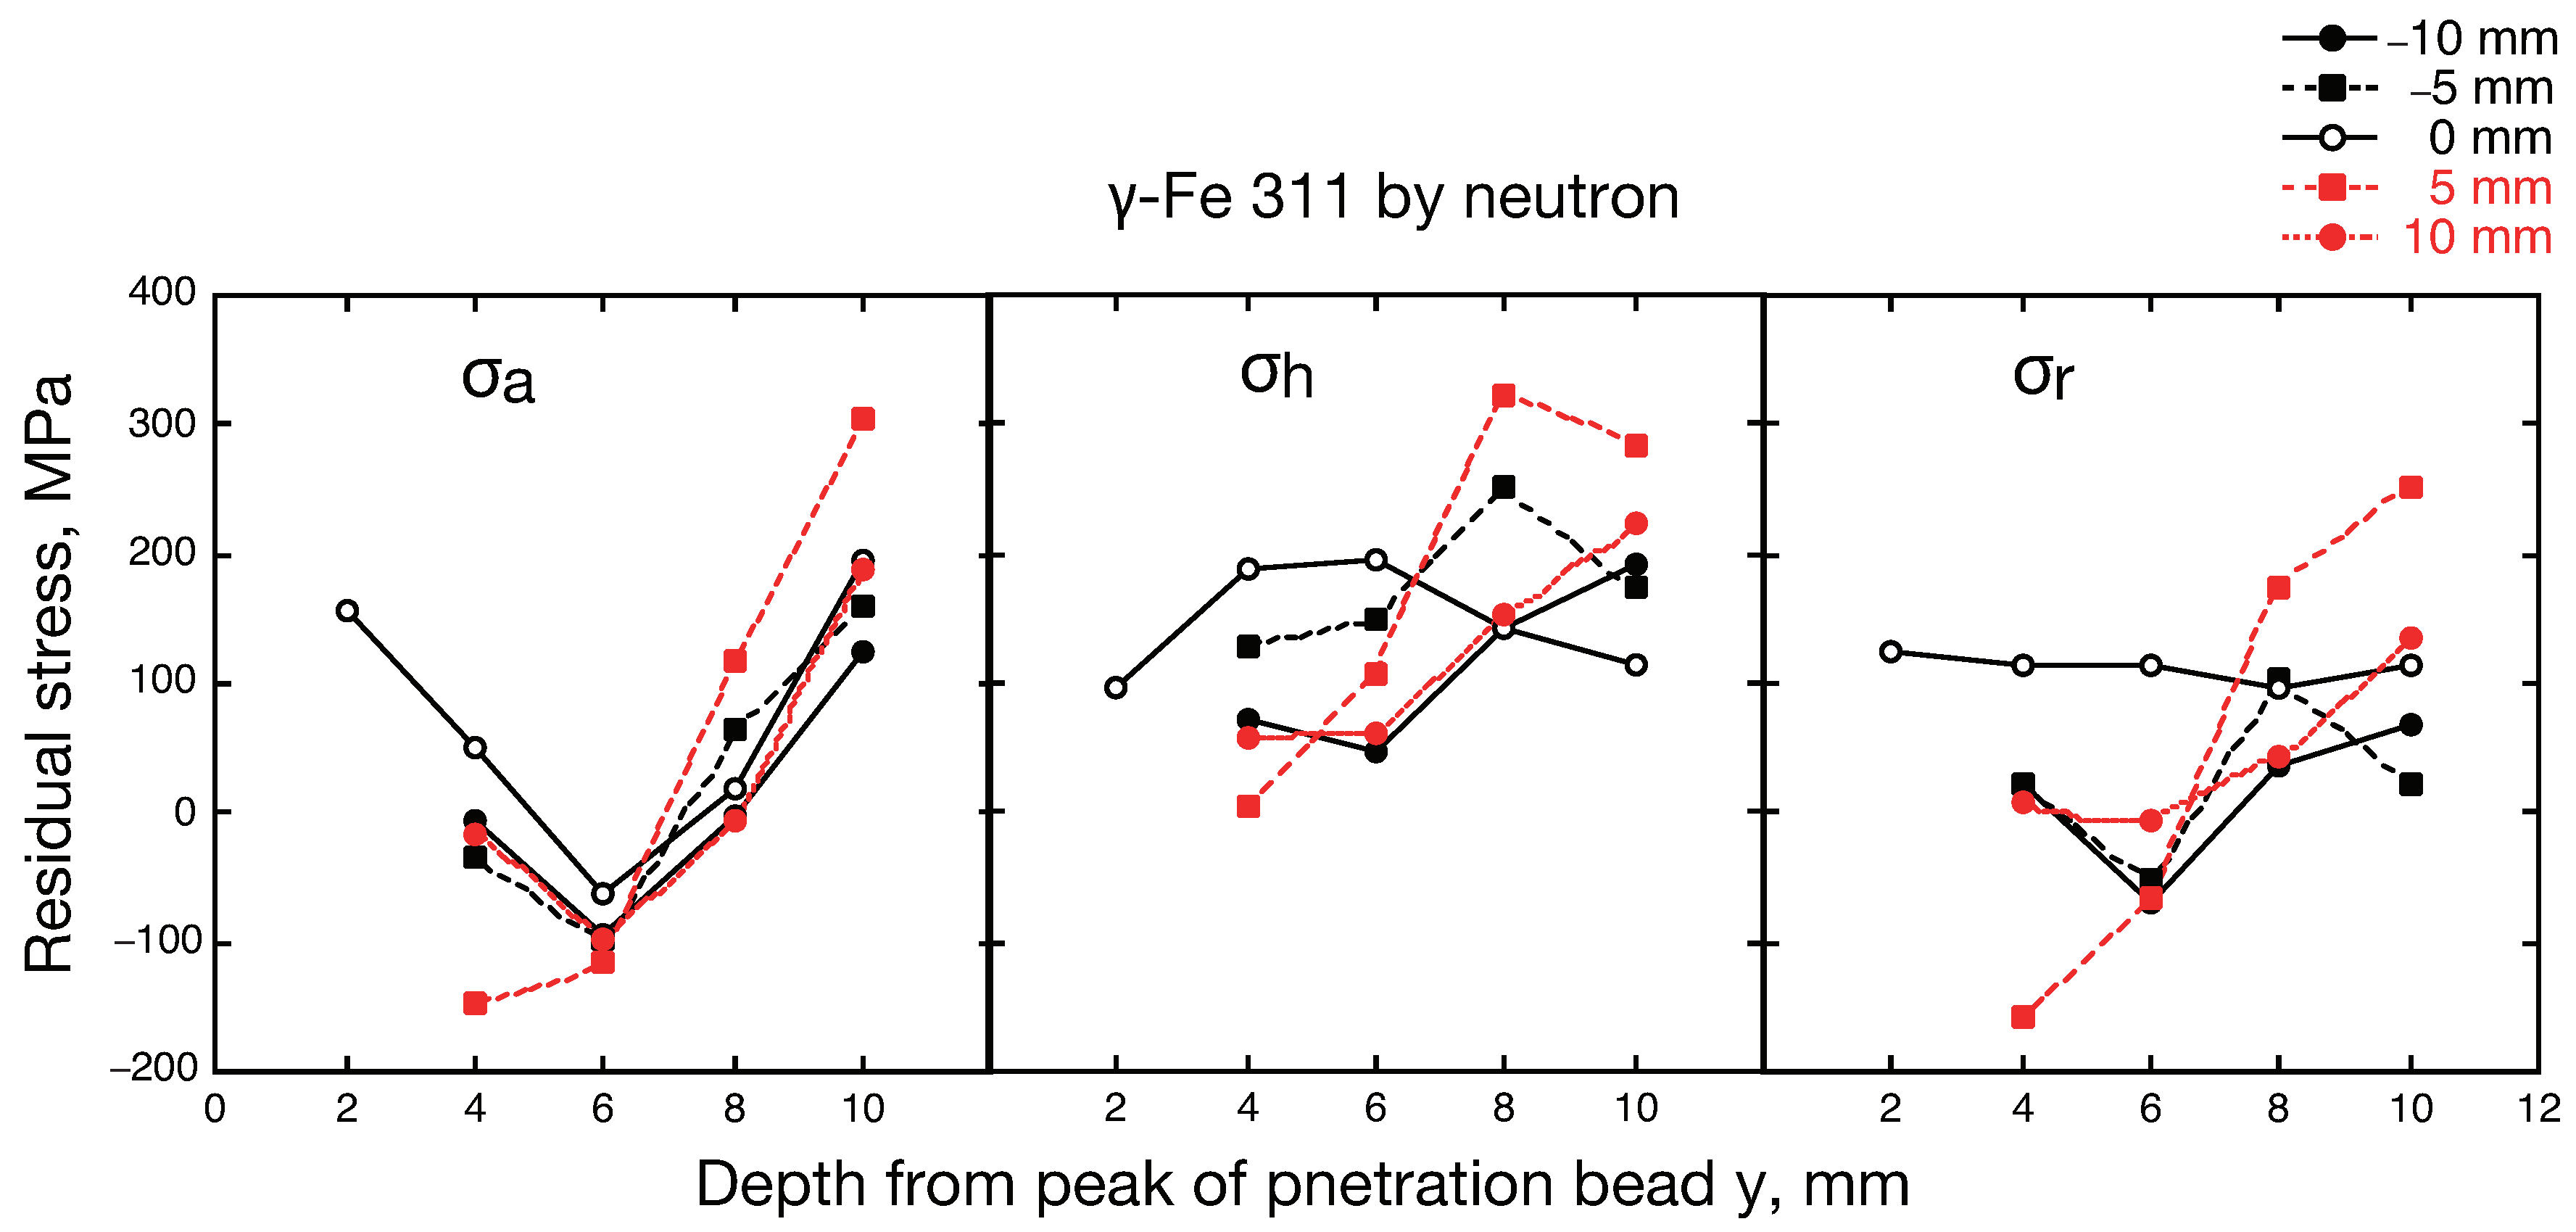
The strains for the axial, hoop, and radial directions are denoted ε a , ε h , and ε r , respectively. These strains were measured using the neutron strain scanning method described above. The 311 diffraction of γ -Fe was used for the measurements. The axial, hoop, and radial residual stresses, σ a , σ h , and σ r , were calculated from these measured strains using the following equations [27]:
σ a = E 1 + ν ε a + ν 1 2 ν ( ε a + ε h + ε r ) , σ h = E 1 + ν ε h + ν 1 2 ν ( ε h + ε h + ε r ) , σ r = E 1 + ν ε r + ν 1 2 ν ( ε r + ε h + ε r ) ,
where E and ν are the diffraction elastic constants Young’s modulus and Poisson’s ratio, respectively. In this study, the diffraction elastic constants of the 311 diffraction were calculated using the Kröner model [28] using the stiffnesses c 11 = 206 , c 12 = 133 , and c 44 = 119 GPa of a single crystal of SUS316, as taken from [29], and the values E = 182 GPa and ν = 0.307 were obtained [30].
The residual stress distribution in the welded piping determined based on the above procedure is shown in Figure 6. The axial stress σ a at the welding line ( x = 0 mm) shows tension near the inner and outer surface sides of the welded piping, and is compressive in the middle of the wall thickness. The following factors are thought to be responsible for this type of residual stress distribution. After welding, the outer periphery shrinks and the welded piping is squeezed inwards, the tensile residual stress generates near the inner surface of the pipe. On the other hand, the welding excess on the outside of the welded piping is removed with a grinder, and the tensile residual stressed occur in the outer periphery. The axial stress trends of the other x-lines also correspond to those of the welding line, but are not completely symmetrical about the welding line.
On the other hand, the hoop residual stresses tend to be tensile overall and increase towards the outer periphery. The radial residual stresses are also tensile overall in the welding line. The residual stresses in the other x-lines are small, but are slightly tensile near the outside of the pipe. The distributions of the radial residual stresses are also not symmetrical about the welding line.
In order to make these residual stress distributions easier to understand, residual stress maps were created based on Figure 6, and the results are shown in Figure 7. The residual stress maps clearly show the states of the residual stresses in the welded piping. Neutron measurement can non-destructively determine the residual stress distribution in the piping. However, it has the disadvantage of not being able to determine the detailed residual stresses near the root of the welding and in the HAZ (heat-affected zone) near the inner surface.

3.2. Residual Stresses Measured by Double-Exposure Method

The strain scanning method with neutrons has a large gauge volume with a spatial resolution of 2 mm. Therefore, it is not possible to obtain the detailed stress distribution near the weld root. On the other hand, the DEM can achieve a spatial resolution of 0.4 mm. The diffraction patterns obtained with a transmitted beam of synchrotron radiation X-rays are shown in Figure 8. As shown in the figure, the diffraction from the base metal shows a spotty diffraction pattern due to coarse grains. The diffraction from the area close to the HAZ shows a diffraction pattern that is a mixture of spots and a continuous ring. The diffraction from the HAZ shows a typical continuous ring due to plastic deformation. The diffraction from the weld metal shows a coarse and textured diffraction pattern due to dendritic structures. In X-ray stress measurement of welded piping, it is necessary to accurately and efficiently determine the diffraction angle from the various diffraction patterns that include a mixture of coarse grains, a continuous ring, and texture structures.
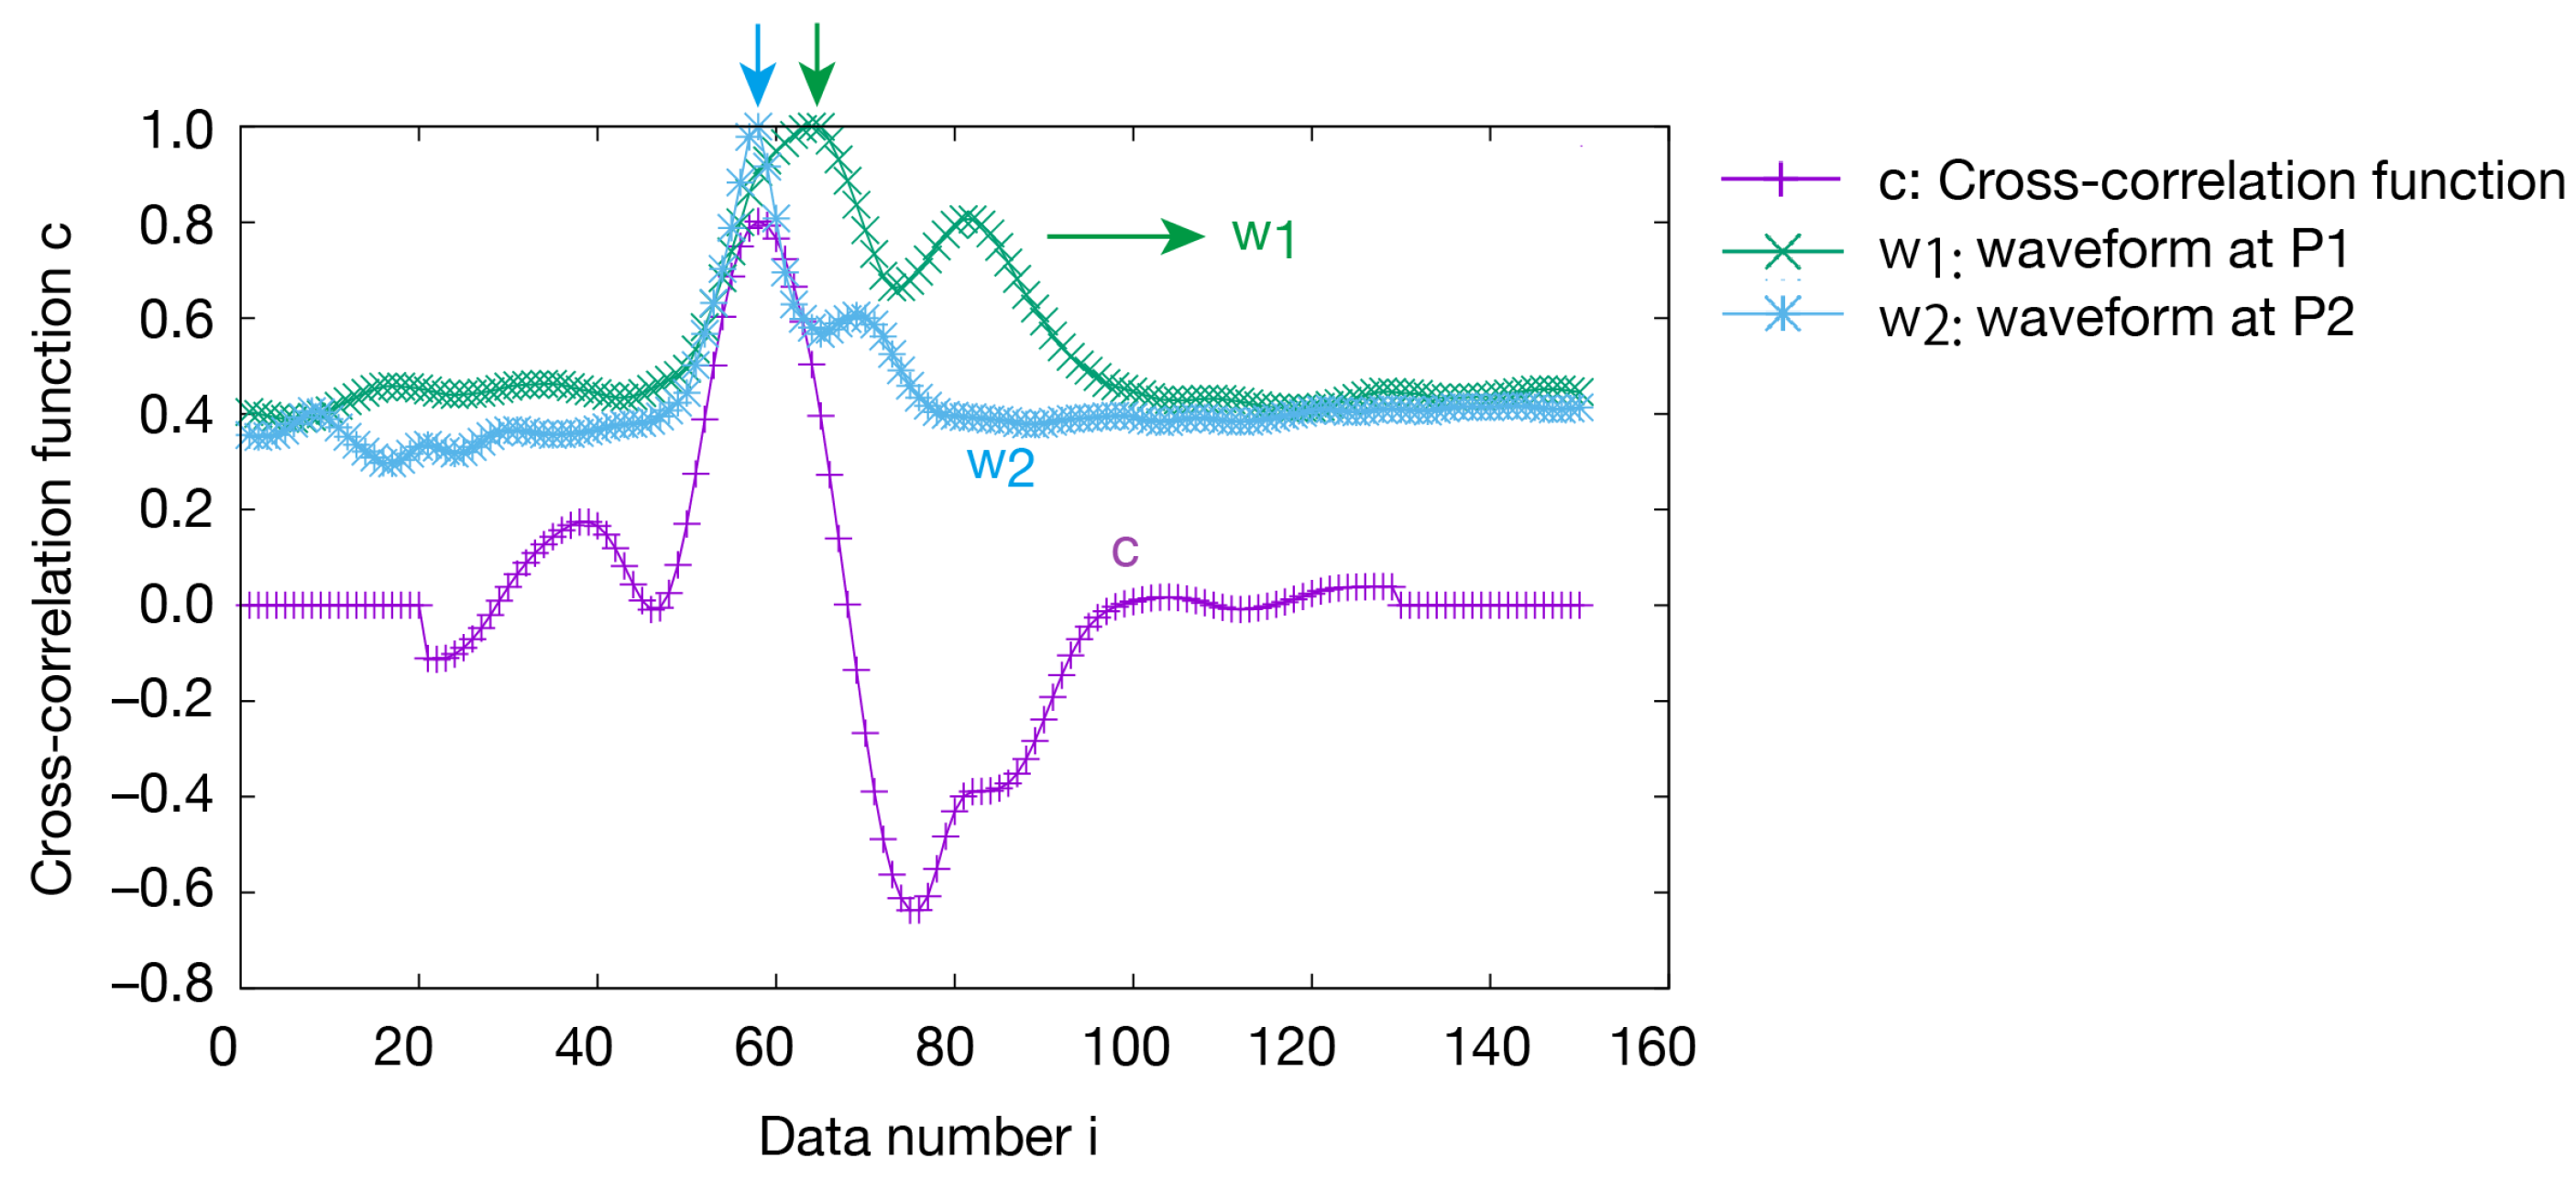
Generally, the diffraction angle is determined by approximating the diffraction curve with a functional form such as a Gaussian function. However, it is difficult to apply conventional methods to complex diffraction patterns. In this study, the diffraction patterns are measured by using the area detector at positions P1 and P2. The diffraction intensity curves obtained by integrating the shaded area in Figure 8 in the circumferential direction are designated as waveforms w 1 and w 2 . The diffraction angle is determined by using the cross-correlation between waveforms w 1 and w 2 .
The method for determining the diffraction angle is explained using Figure 9 as an example. The waveform w 1 ( i ) measured at position P1 is moved sequentially with j, and the cross-correlation function with the waveform w 2 ( i ) measured at position P2 is calculated. The cross-correlation function c ( j ) between w 1 and w 2 is defined by the following equation [31]:
c ( j ) = i = 1 n w 1 ( i + j ) m 1 w 2 ( i ) m 2 i = 1 n w 1 ( i + j ) m 1 2 i = 1 n w 2 ( i ) m 2 2
where m 1 is the mean of w 1 and m 2 is the mean of w 2 .
By changing j and moving waveform w 1 , the value of c in Figure 9 can be obtained by calculating the cross-correlation function. When the top of the curve c is approximated with a parabola, the position where waveforms w 1 and w 2 coincide is determined. By using this method, the peak can be determined with high accuracy, even in the case of complex diffraction intensity curves, since waveforms w 1 and w 2 are similar.
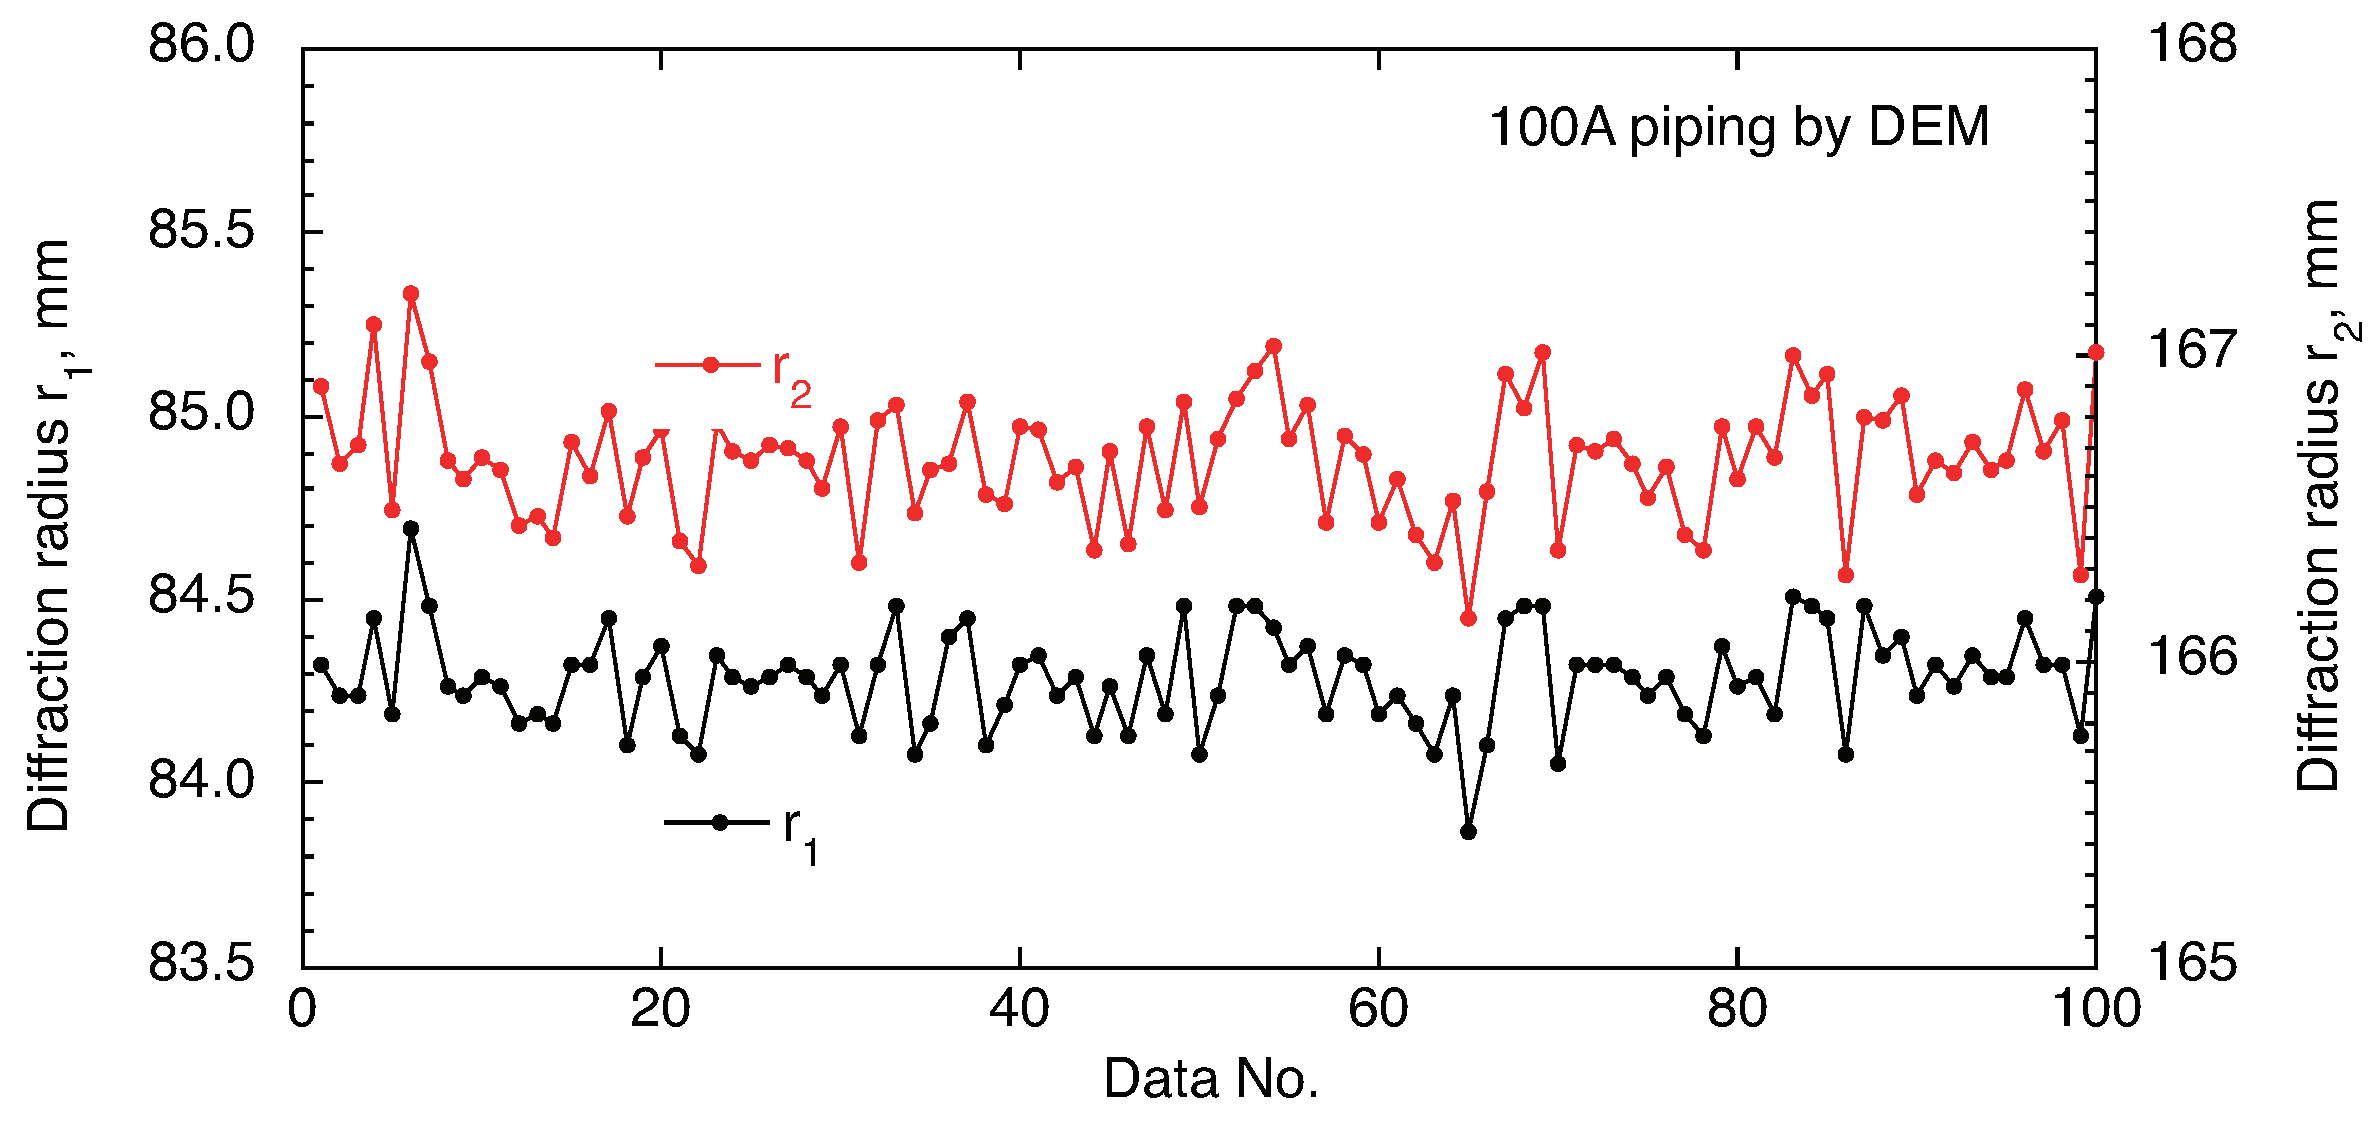
The positions of the diffracting grains are random, so the diffraction angles determined by the positions of the grains are random too. Therefore, the diffraction radii r 1 and r 2 measured at P1 and P2 fluctuate greatly, as shown in Figure 10. The fluctuations in these diffraction radii are much larger than the changes caused by elastic strain. The fluctuation of the diffraction radius is equivalent to approximately ± 1200 MPa in stress value. As a result, it is difficult to measure the strain of coarse grains with one area detector. However, Figure 10 shows that the fluctuations in the diffraction radii r 1 and r 2 are synchronized with each other. In the DEM, the diffraction angle 2 θ is determined from the difference between r 1 and r 2 , as shown in Equation (2), so the fluctuations due to the positions of the crystal grains can be canceled out. Therefore, the DEM is an excellent method for determining the strain of coarse-grained materials.
The axial strain ε a and radial strain ε r measured in the DEM are inclined by θ with respect to each normal direction of the lattice plane. Therefore, the axial stress σ a and radial stress σ r were calculated using the following equations [32]:
σ a = E ( 1 + ν ) cos 2 θ ε a + S ( ε a + ε r ) ,
σ r = E ( 1 + ν ) cos 2 θ ε r + S ( ε a + ε r ) , S = ν ( 1 + ν ) cos 2 θ 2 ν ,
where E and ν are the diffraction elastic constants Young’s modulus and Poisson’s ratio, as in Equation (3).
Figure 11 shows the welded residual stress maps measured by the DEM. Comparing this figure with the maps in Figure 7 measured with neutrons, the DEM gives us detailed information about the residual stresses near the root of the weld. Welding was performed symmetrically about the welding line with one pass for each layer, but the results of this measurement show that the residual stress distribution is asymmetric about the welding line. This result can be explained by observing that the results for the weld in Figure 1c are also asymmetric. A large axial residual stress is generated near the inner surface on the right side of the HAZ, which corresponds to the initiation of SCC. As for the radial residual stress, large tension is generated in the welded part.
The residual stress maps measured by the DEM shown in Figure 11 are the residual stresses of a plate specimen taken from the welded piping shown in Figure 1. Strictly speaking, the hoop residual stress has been released and it is under a plane stress state. Next, we consider reconstructing the residual stresses under triaxial stress using the axial and radial strains, ε a and ε r , obtained from the DEM and the hoop stress σ h obtained from the neutron measurement. When the hoop stress σ h is applied under a plane strain condition to the strain distribution measured with the DEM, the following equations are obtained [33]:
σ a = E 1 ν 2 ε a + ν ε r + ν 1 ν σ h ,
σ r = E 1 ν 2 ε r + ν ε a + ν 1 ν σ h .
The residual stress maps of σ a and σ r obtained using Equations (7) and (8) are shown in Figure 12. The residual stress measured by neutron diffraction in Figure 7 was obtained from the average strain of a large gauge volume, and the measurement interval is also wide, so the change in residual stress is smooth. On the other hand, the residual stress measured using the DEM is superimposed with micro-stress, which is the stress of each crystal grain. Therefore, the stress value in Figure 11 changes more than the mechanical stress. The residual stress distribution in Figure 12 is larger than that in Figure 11, because the hoop stress in Figure 7 is applied to the stress value obtained using the DEM in Figure 11. Although the axial residual stresses are larger than in Figure 11, the distributions of residual stresses are almost the same as in Figure 11. It is possible to obtain detailed actual residual stresses using the neutron- and synchrotron-derived stresses. The welding residual stress obtained by neutrons and the DEM is asymmetrical with respect to the welding line and has unevenness due to the crystal grains. The large axial residual stress occurs from the HAZ near the penetration bead toward the weld part. The characteristic of this welding residual stress is consistent with the crack propagation of SCC for the welded piping of SUS316 [34]. This method should appropriately be called a quantum beam hybrid method (QBHM), since the complementary use of neutrons and the DEM with synchrotron hard X-rays has made it possible to create the more detailed actual stress maps.

3.3. Comparison of Actual Stress Analysis and Simulation

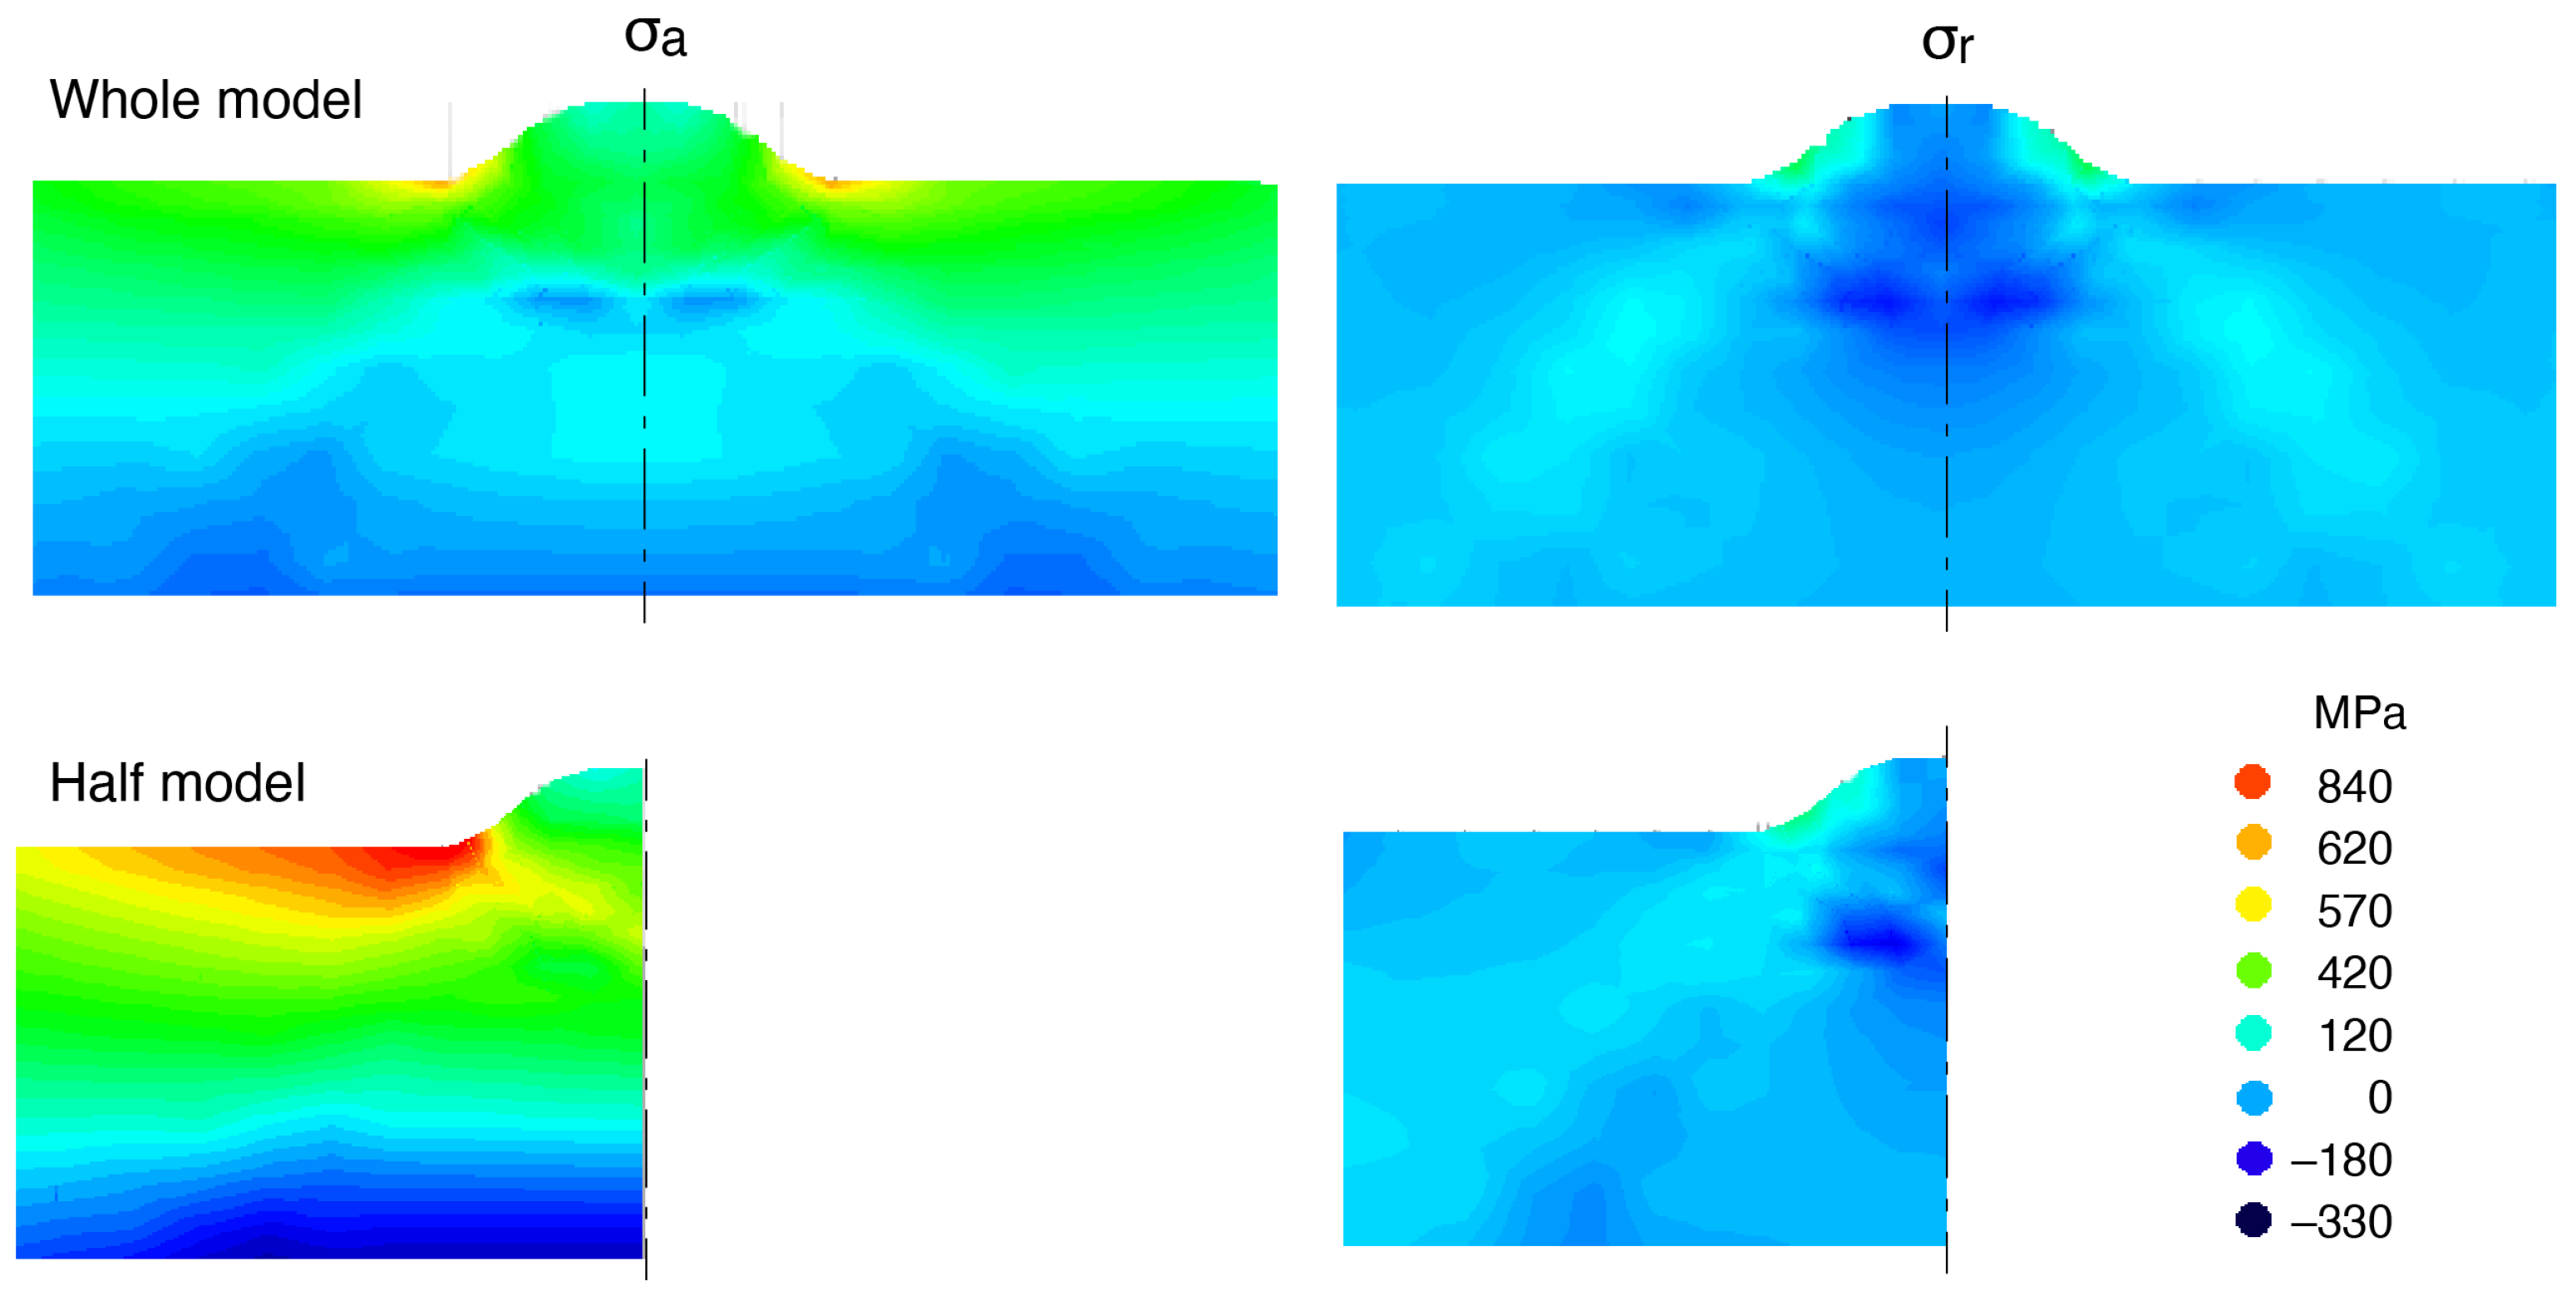
The welding residual stress of the butt-welded piping with a small bore was analyzed using the QBHM. Comparing experiments and simulations is important in order to confirm the reliability of each. So, we tried to simulate the welding residual stress using a finite element method. The finite element model of 100A piping is shown in Figure 13. Two types of finite element models were prepared: a whole model, a butt-welded pipe with a height of 140 mm; and a half model, taking into account symmetry about the welding line of the butt-welded pipe. Both models were created with the same elements. The cross-section of the element model and details of the weld are shown in Figure 13, as well as models of each pass of the seven-layer weld.
The temperature-dependent physical properties of austenitic stainless steel used were taken from [35]. For the finite element analysis, the Quick Welder software (ver. 1.0.0) was used [36,37]. The welding conditions for the simulation were the same as the actual TIG welding of this study.
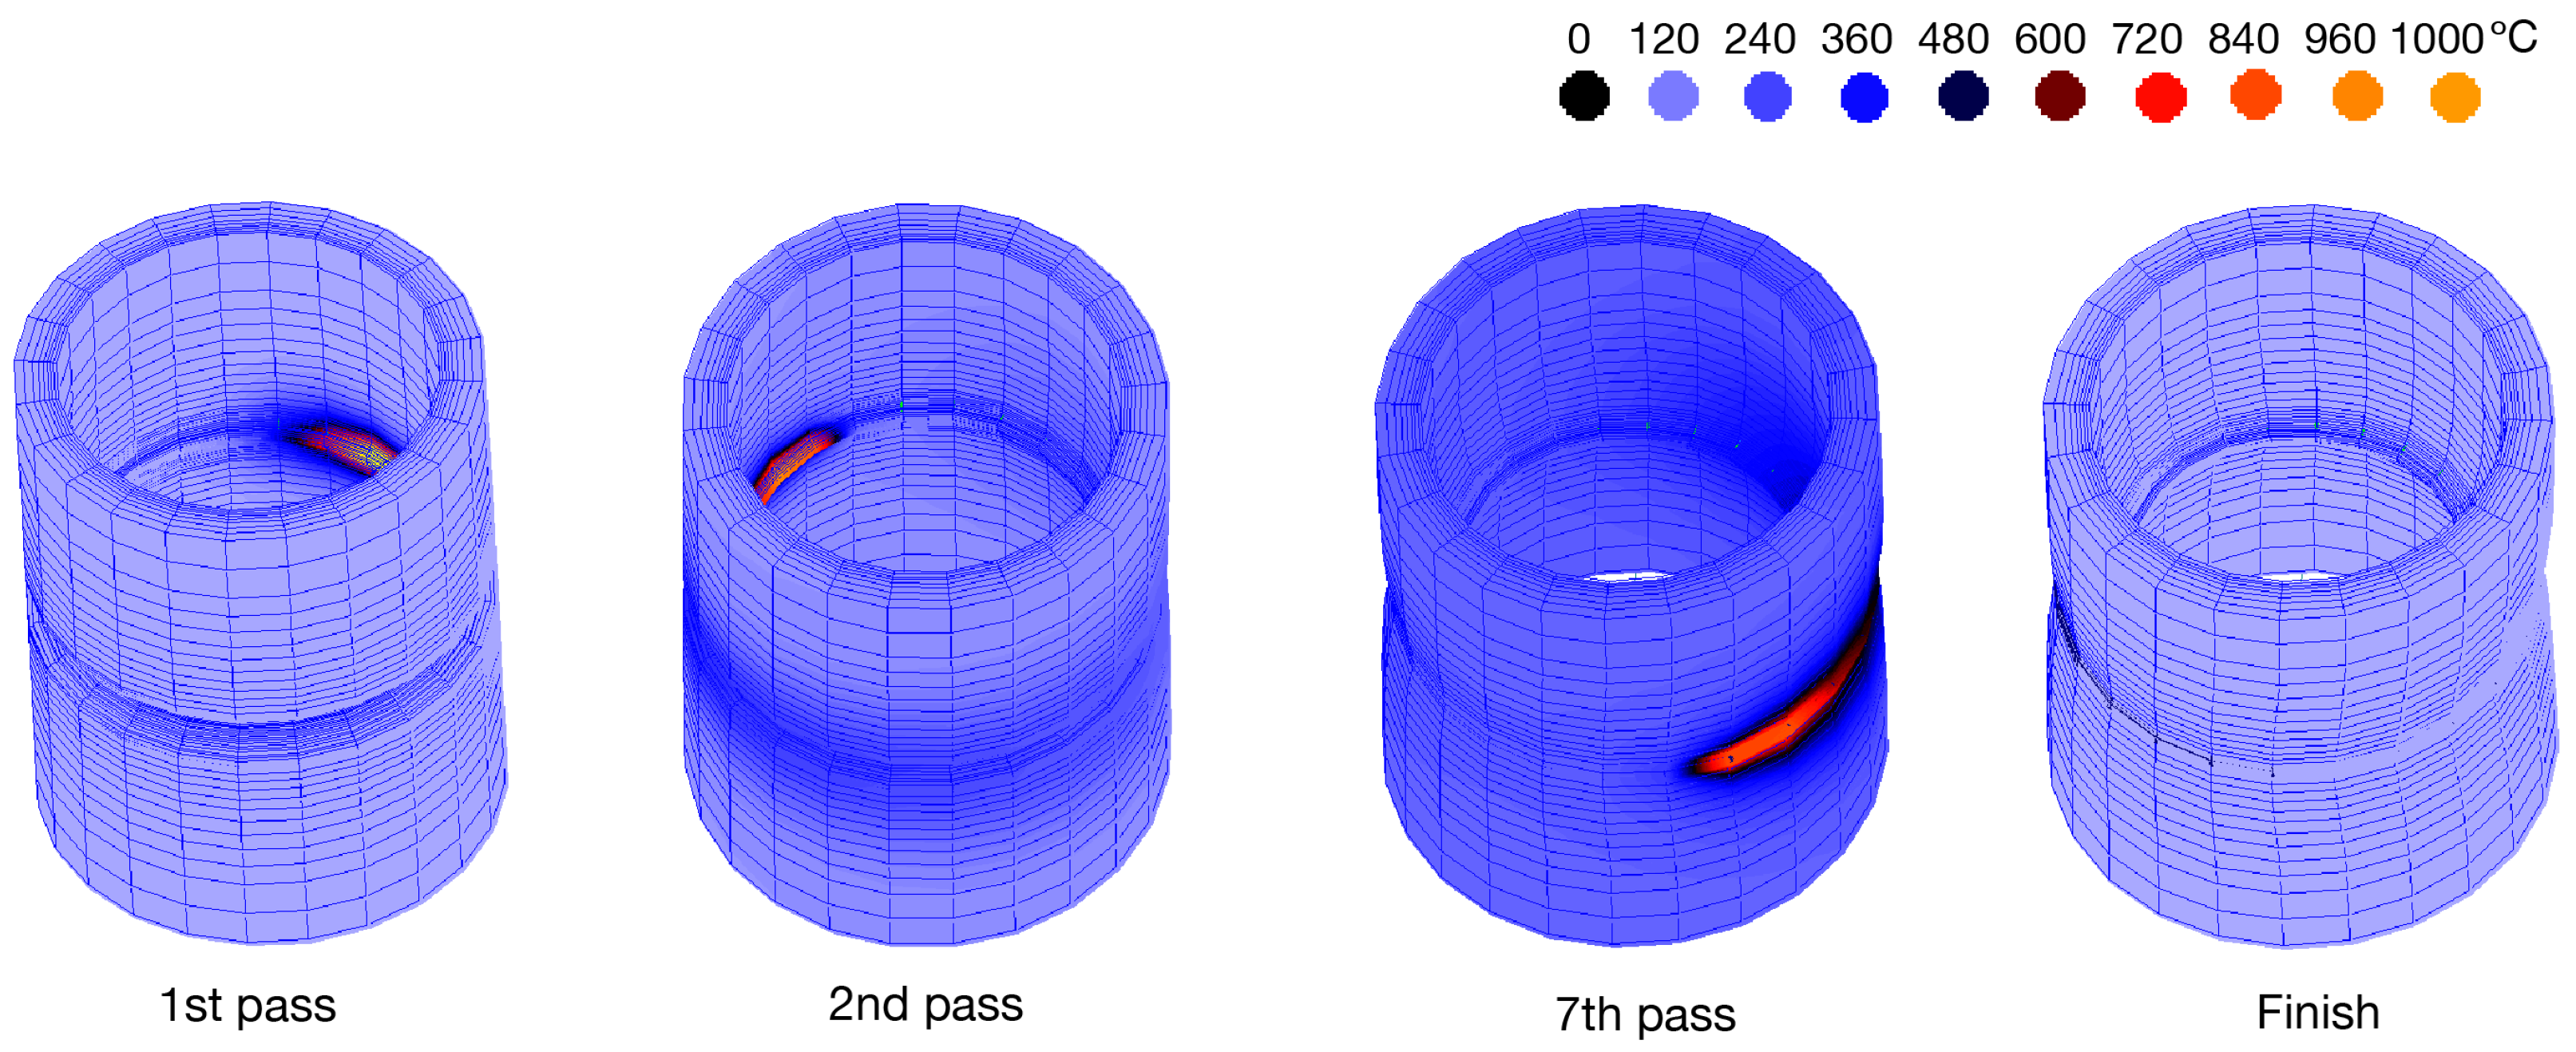
As an example of the finite element analysis of butt-welded piping, Figure 14 shows the behavior of temperature and the displacement of the whole model: The welding pass goes around the circumference of the butt joint, and welding stops at the end of the weld for each layer. The temperature of the pipe drops to a low temperature, and then the next weld is made. As the welding pass goes around the circumference, the pipe behaves as if it is swinging its head around. When the welding of the seventh and final layer is finished and the temperature of the pipe drops, the welded piping deforms as if it was being tied with a belt. As a result, the root of the weld deforms as if it has been bent towards the inside of the pipe. A large tension is generated near the root of the weld, and the HAZ near the penetration bead plastically deforms.
The simulated results of the residual stresses in the butt-welded pipe are shown in Figure 15. The residual stress distribution in the whole model is symmetrical about the welding line. The axial stress σ a shows a large tension in the HAZ at the inner surface of the pipe, and the maximum axial stress is 620 MPa. The distribution of the radial stress σ r does not show a large stress. The residual stress distribution obtained by the simulation is typical of the residual stress in a butt-welded pipe. However, this simulation by the FEM is unable to represent the large axial tensile residual stress from the inner surface near the penetration bead toward the weld.
As the elements and welding conditions of the half model are exactly the same as those of the whole model, the residual stress distribution should be the same. However, the axial stress σ a in the half model is much larger than that in the whole model, and the maximum axial stress is 840 MPa. The shape of the residual stress distribution of the half model is the same as that of the whole model.
The reason why the half model shows larger residual stress than the whole model is due to the assumption of welding line symmetry. If we assume welding line symmetry, the butt-surface has to remain flat. Actually, the weld swings its head with the welding cycle, so the butt-surface never remains flat and the assumption of welding line symmetry is not correct. As a result, large residual stresses are generated. The residual stresses measured using the QBHM suggest that the whole model gives residual stresses which are closer to reality.
Although the residual stresses in the whole model agree with the stress levels measured using the QBHM (Figure 12), the residual stress distribution measured by the QBHM is not symmetrical about the welding line. In addition, the measured residual stress distribution shows some variation due to the crystal structure. The elastic anisotropy parameter A is calculated by the following equation [38]:
A = c 44 c 11 c 12 ,
where c i j is the stiffnesses of a single crystal. For an isotropic elastic crystal, A is 1, but that of austenitic stainless steel is 3.26. The austenitic stainless steel is a material with large crystal elastic anisotropy. When plastic deformation occurs due to welding thermal deformation, the large intergranular strain occurs due to the crystal elastic anisotropy. Therefore, the residual stress map of this welded piping shows a large change in the residual stress in each grain [39]. Due to the crystal elastic anisotropy, the residual stress varies among crystal grains. The crystal grains with hard lattice planes have low residual stress, while the crystal grains with soft lattice planes have high residual stress [40]. The 311 diffraction used in this measurement is a lattice plane that is less affected by intergranular strain because it shows a mechanical stress, but it is thought to reflect the effect of elastic anisotropy around the crystal grains.

4. Conclusions

In this study, austenitic stainless steel pipes with a small diameter (100A) were butt-welded and the residual stress was measured. The outcomes were as follows.
(1)
The residual stresses in welded piping were measured using the neutron diffraction method. Because of the large gauge volume and low spatial resolution, it was difficult to obtain detailed residual stress near the weld root, which is the most critical area.
(2)
The welded piping showed complicated diffraction patterns that were a mixture of diffraction spots and continuous rings. Therefore, the diffraction waveforms were obtained by circumferentially integrating the diffraction images measured at the front and rear positions using the double-exposure method. Using the cross-correlation between the two waveforms to determine the diffraction angle, it was possible to measure the residual stress with high accuracy.
(3)
In the measurement by a single detector, the error of more than ± 1000 MPa due to the diffraction crystal grain position. The double-exposure method can cancel out the error, and has the advantage of being able to determine the diffraction angle with high accuracy. The double-exposure method has made it to measure residual stresses in coarse-grained materials and welded components.
(4)
The welding residual stress measured by the quantum beam hybrid method is asymmetrical with respect to the welding line and has unevenness due to the crystal grains. Large axial residual stress occurs from the HAZ near the penetration bead toward the weld part.
(5)
A simulation of a butt-welded pipe was performed using the finite element method. In the half model of the welded pipe, the butt-plane was assumed to keep a plane. The simulated residual stress by the half model was larger than that by the whole model. To perform an accurate simulation, the whole butt-welded piping must be modeled. The real tensile stress area from the HAZ near the penetration bead toward the weld was not obtained by the simulation.

Author Contributions

Overall research, K.S. and Y.M.; synchrotron radiation experiments at the beamline BL14B1 in SPring-8, H.T. and A.S.; neutron experiments at JRR-3, T.S., S.M. and Y.S. All authors have read and agreed to the published version of the manuscript.

Funding

This work was supported by JSPS KAKENHI, Grant Numbers JP22K03819.

Data Availability Statement

Data are available on reasonable request from the authors.

Acknowledgments

The synchrotron radiation experiments were supported by the approval of QST (Nos. 2023-H11, 2024-H19), Advanced Research Infrastructure for Materials and Nanotechnology in Japan (Nos. JPMXP1223QS0011, JPMXP1224QS0119), and JASRI (No. 2023B5051). The neutron experiments were carried out under the Inter-University Program for the Joint-use of JAEA/QST Facilities, Nuclear Professional School, School of Engineering, the University of Tokyo, at the Research Reactor JRR-3, JAEA (No. 2023105204) and the program of JAEA (No. 2024A-A11).

Conflicts of Interest

The authors declare no conflicts of interest.

References

  1. Enomoto, K.; Hirano, K.; Mochizuki, M.; Kurosawa, K.; Saito, H.; Hayashi, E. Improvement of residual stress on material surface by water jet peening. J. Soc. Mater. Sci. Jpn. 1996, 45, 734–739. [Google Scholar] [CrossRef]
  2. Hirano, K.; Enomoto, K.; Hayashi, E.; Kurosawa, K. Effect of water jet peening on corrosion resistance and fatigue strength of type 304 stainless steel. J. Soc. Mater. Sci. Jpn. 1996, 45, 740–745. [Google Scholar] [CrossRef]
  3. Sano, Y.; Kimura, M.; Sato, K.; Obata, M.; Sudo, A.; Hamamoto, Y.; Shima, S.; Ichikawa, Y.; Yamazaki, H.; Naruse, M.; et al. Development and application of laser peening system to prevent stress corrosion cracking of reactor core shroud. In Proceedings of the 8th International Conference on Nuclear Engineering (ICONE-8), Baltimore, MD, USA, 2–6 April 2000. [Google Scholar]
  4. Sano, Y. Quarter century development of laser peening without coating. Metals 2020, 10, 152. [Google Scholar] [CrossRef]
  5. Ando, Y.; Yagawa, G.; Hayase, Y. Evaluation of induction heating stress improvement (IHSI) treatment applied to nuclear primary piping. Int. J. Press. Vessel. Pip. 1982, 10, 399–406. [Google Scholar] [CrossRef]
  6. Umemoto, T.; Matsushita, A.; Tanaka, A. Application of Induction Heating Stress Improvement to the Joint Between the Recirculation Inlet Nozzle and the Safe-End Weld; IAEA-SM-278/5; International Atomic Energy Agency: Vienna, Austria, 1985; pp. 117–126. [Google Scholar]
  7. Abdulla, A.; Malaki, M.; Eskandari, A. Strength enhancement of the welded structures by ultrasonic peening. Mater. Des. 2012, 38, 7–18. [Google Scholar] [CrossRef]
  8. Malaki, M.; Ding, H. A review of ultrasonic peening treatment. Mater. Des. 2015, 87, 1072–1086. [Google Scholar] [CrossRef]
  9. Aoike, S.; Tsuruki, M.; Okido, S.; Fukuda, Y.; Oritani, N. Analytical study of residual stress improvement method, delta-T process for small-diameter pipe. Trans. Jpn. Soc. Mech. Eng. Ser. A 2012, 78, 481–491. [Google Scholar] [CrossRef]
  10. Maekawa, A.; Serizawa, H.; Nakacho, K.; Murakawa, H. Fast finite element analysis of weld residual stress in large-diameter thick-walled stainless pipe joints and its experimental validation. Q. J. Jpn. Weld. Soc. 2013, 31–34, 129–133. [Google Scholar] [CrossRef]
  11. Haigh, R.D.; Hutchings, M.T.; James, J.A.; Ganguly, S.; Mizuno, R.; Ogawa, K.; Okido, S.; Paradowska, A.M.; Fitzpatrick, M.E. Neutron diffraction residual stress measurements on girth-welded 304 stainless steel pipes with weld metal deposited up to half and full pipe wall thickness. Int. J. Press. Vessel. Pip. 2013, 101, 1–11. [Google Scholar] [CrossRef]
  12. Terachi, T. SCC in Japan. In Proceedings of the International Workshop on Aging Management Considerations in Mechanical Codes Standards, Tokyo, Japan, 28–29 June 2023; Available online: https://www.oecd-nea.org/upload/docs/application/pdf/2023-07/presentations_-_session_3.pdf (accessed on 29 March 2025).
  13. Materias Committee PA-MSC-1950. Safety Assessment of Recent Atypical Stress Corrosion Cracking Operating Experience in Non-Isolable Stainless Branch Piping. Framatome Doc. No. 51–9357850-000. 2023; pp. 2–8. Available online: https://www.nrc.gov/docs/ML2324/ML23243A870.pdf (accessed on 29 March 2025).
  14. Deng, D.; Murakawa, H. Numerical simulation of temperature field and residual stress in multi-pass welds in stainless steel pipe and comparison with experimental measurements. Comput. Mater. Sci. 2006, 37, 269–277. [Google Scholar] [CrossRef]
  15. Webster, P.J. Neutron strain scanning. Neutron News 1991, 2, 19–22. [Google Scholar] [CrossRef]
  16. Webster, P.J.; Mills, G.; Wang, X.D.; Kang, W.P.; Holden, T.M. Impediments to efficient through-surface strain scanning. Neutron Res. 1996, 3, 223–240. [Google Scholar] [CrossRef]
  17. Poulsen, H.F.; Nielsen, S.F.; Lauridsen, E.M.; Schmidt, S.; Suter, R.M.; Lienert, U.; Margulies, L.; Lorentzen, T.; Juul Jensen, D. Three-dimensional maps of grain boundaries and the stress state of individual grains in polycrystals and powders. J. Appl. Crystallogr. 2001, 34, 751–756. [Google Scholar] [CrossRef]
  18. Kutsal, M.; Poulsen, H.F.; Winther, G.; Sørensen, H.O.; Detlefs, C. High-resolution 3D X-ray diffraction microscopy: 3D mapping of deformed metal microstructures. J. Appl. Crystallogr. 2022, 55, 1125–1138. [Google Scholar] [CrossRef] [PubMed]
  19. Hayashi, Y.; Setoyama, D.; Fukuda, K.; Okuda, K.; Katayama, N.; Kimura, H. Scanning three-dimensional X-ray diffraction microscopy with a spiral slit. Quantum Beam Sci. 2023, 7, 16. [Google Scholar] [CrossRef]
  20. Suzuki, K.; Shobu, T.; Shiro, A.; Zhang, S. Evaluation welding residual stress using diffraction spot tracing method. Adv. Mater. Res. 2014, 996, 76–81. [Google Scholar] [CrossRef]
  21. Suzuki, K.; Shobu, T.; Shiro, A. Stress measurements of coarse grain materials using double exposure method with hard synchrotron X-rays. Mater. Res. Proc. 2018, 6, 69–74. [Google Scholar]
  22. JRR-3 Instrument. Available online: https://jrr3uo.jaea.go.jp/jrr3uoe/instruments/index.htm (accessed on 29 March 2025).
  23. He, B.B. Two-Dimensional X-Ray Diffraction; John Wiley & Sons, Inc.: Hoboken, NJ, USA, 2009; p. 260. [Google Scholar]
  24. Toyokawa, H.; Saji, C.; Kawase, M.; Wu, S.; Furukawa, Y.; Kajiwara, K.; Sata, M.; Hirono, T.; Shiro, A.; Shobu, T.; et al. Development of CdTe pixel detectors combined with an aluminum Schottky diode sensor and photon-counting ASICs. J. Instr. 2017, 12, C01044. [Google Scholar] [CrossRef]
  25. BL14B1 Outline. Available online: http://www.spring8.or.jp/wkg/BL14B1/instrument/lang-en/INS-0000000309 (accessed on 29 March 2025).
  26. SPring-8. Available online: http://www.spring8.or.jp/ja/about_us/access/img/img02l.jpg (accessed on 29 March 2025).
  27. Hutchings, M.T.; Withers, P.J.; Holden, T.M.; Lorentzen, T. Introduction to the Characterization of Residual Stress by Neutron Diffraction; Taylor & Francis: Boca Raton, FL, USA, 2005; p. 203. [Google Scholar]
  28. Kröner, E. Berechnung der elastischen Konstanten des Vielkristalls aus den Konstanten des Einkristalls. Z. Phys. 1958, 151, 504–518. [Google Scholar] [CrossRef]
  29. Ledbetter, H.M. Predicted single-crystal elastic constants of stainless-steel 316. Br. J.-Non-Destr. Test. 1981, 23, 286–287. [Google Scholar]
  30. X-Ray and Mechanical Elastic Constants by Kröner Model. Available online: https://x-ray.jsms.jp/kroner/index.html (accessed on 29 March 2025).
  31. Kohari, A. Introduction to Probability and Statistics; Iwanami Syoten: Tokyo, Japan, 1973; pp. 91–100. [Google Scholar]
  32. Suzuki, K.; Kura, K.; Miura, Y.; Shiro, A.; Toyokawa, H.; Saji, C.; Kajiwara, K.; Shobu, T. A study on stress measurement of welded part using double exposure method. J. Soc. Mater. Sci. Jpn. 2022, 71, 1005–1012. [Google Scholar] [CrossRef]
  33. Suzuki, K.; Miura, Y.; Shiro, A.; Toyokawa, H.; Saji, C.; Shobu, T.; Morooka, S. Actual stress analysis of small-bore butt-welded pipe by complementary use of synchrotron X-rays and neutrons. J. Soc. Mater. Sci. Jpn. 2023, 72, 316–323. [Google Scholar] [CrossRef]
  34. Okamura, Y.; Yamashita, H.; Fukuda, T.; Futami, T. Structual integrity evaluation for core shroud and PLR piping with SCC. J. High Press. Inst. Jpn. 2005, 43, 4–14. [Google Scholar]
  35. Suzuki, K.; Yamagishi, A.; Nishikawa, S.; Shobu, T. Residual stresses in dissimilar metal Joint by multi-pass Welds. Maintenology 2012, 11, 91–98. [Google Scholar]
  36. Deng, D.; Kiyoshima, S. FEM prediction of welding residual stresses in a SUS304 girth-welded pipe with emphasis on stress distribution near weld start/end location. Comput. Mater. Sci. 2010, 50, 612–621. [Google Scholar] [CrossRef]
  37. Deng, D. Influence of deposition sequence on welding residual stress and deformation in an austenitic stainless steel J-groove welded joint. Mater. Des. 2013, 43, 1022–1033. [Google Scholar] [CrossRef]
  38. Nye, J.F. Physical Properties of Crystals; Oxford University Press: Oxford, UK, 2000; pp. 123–130. [Google Scholar]
  39. Holden, T.M. Intergranular stresses. J. Neutron Res. 1999, 7, 291–317. [Google Scholar] [CrossRef]
  40. Suzuki, K.; Shobu, T. Residual microstress of austenitic stainless steel due to tensile deformation. Mater. Sci. Forum 2010, 652, 7–12. [Google Scholar] [CrossRef]
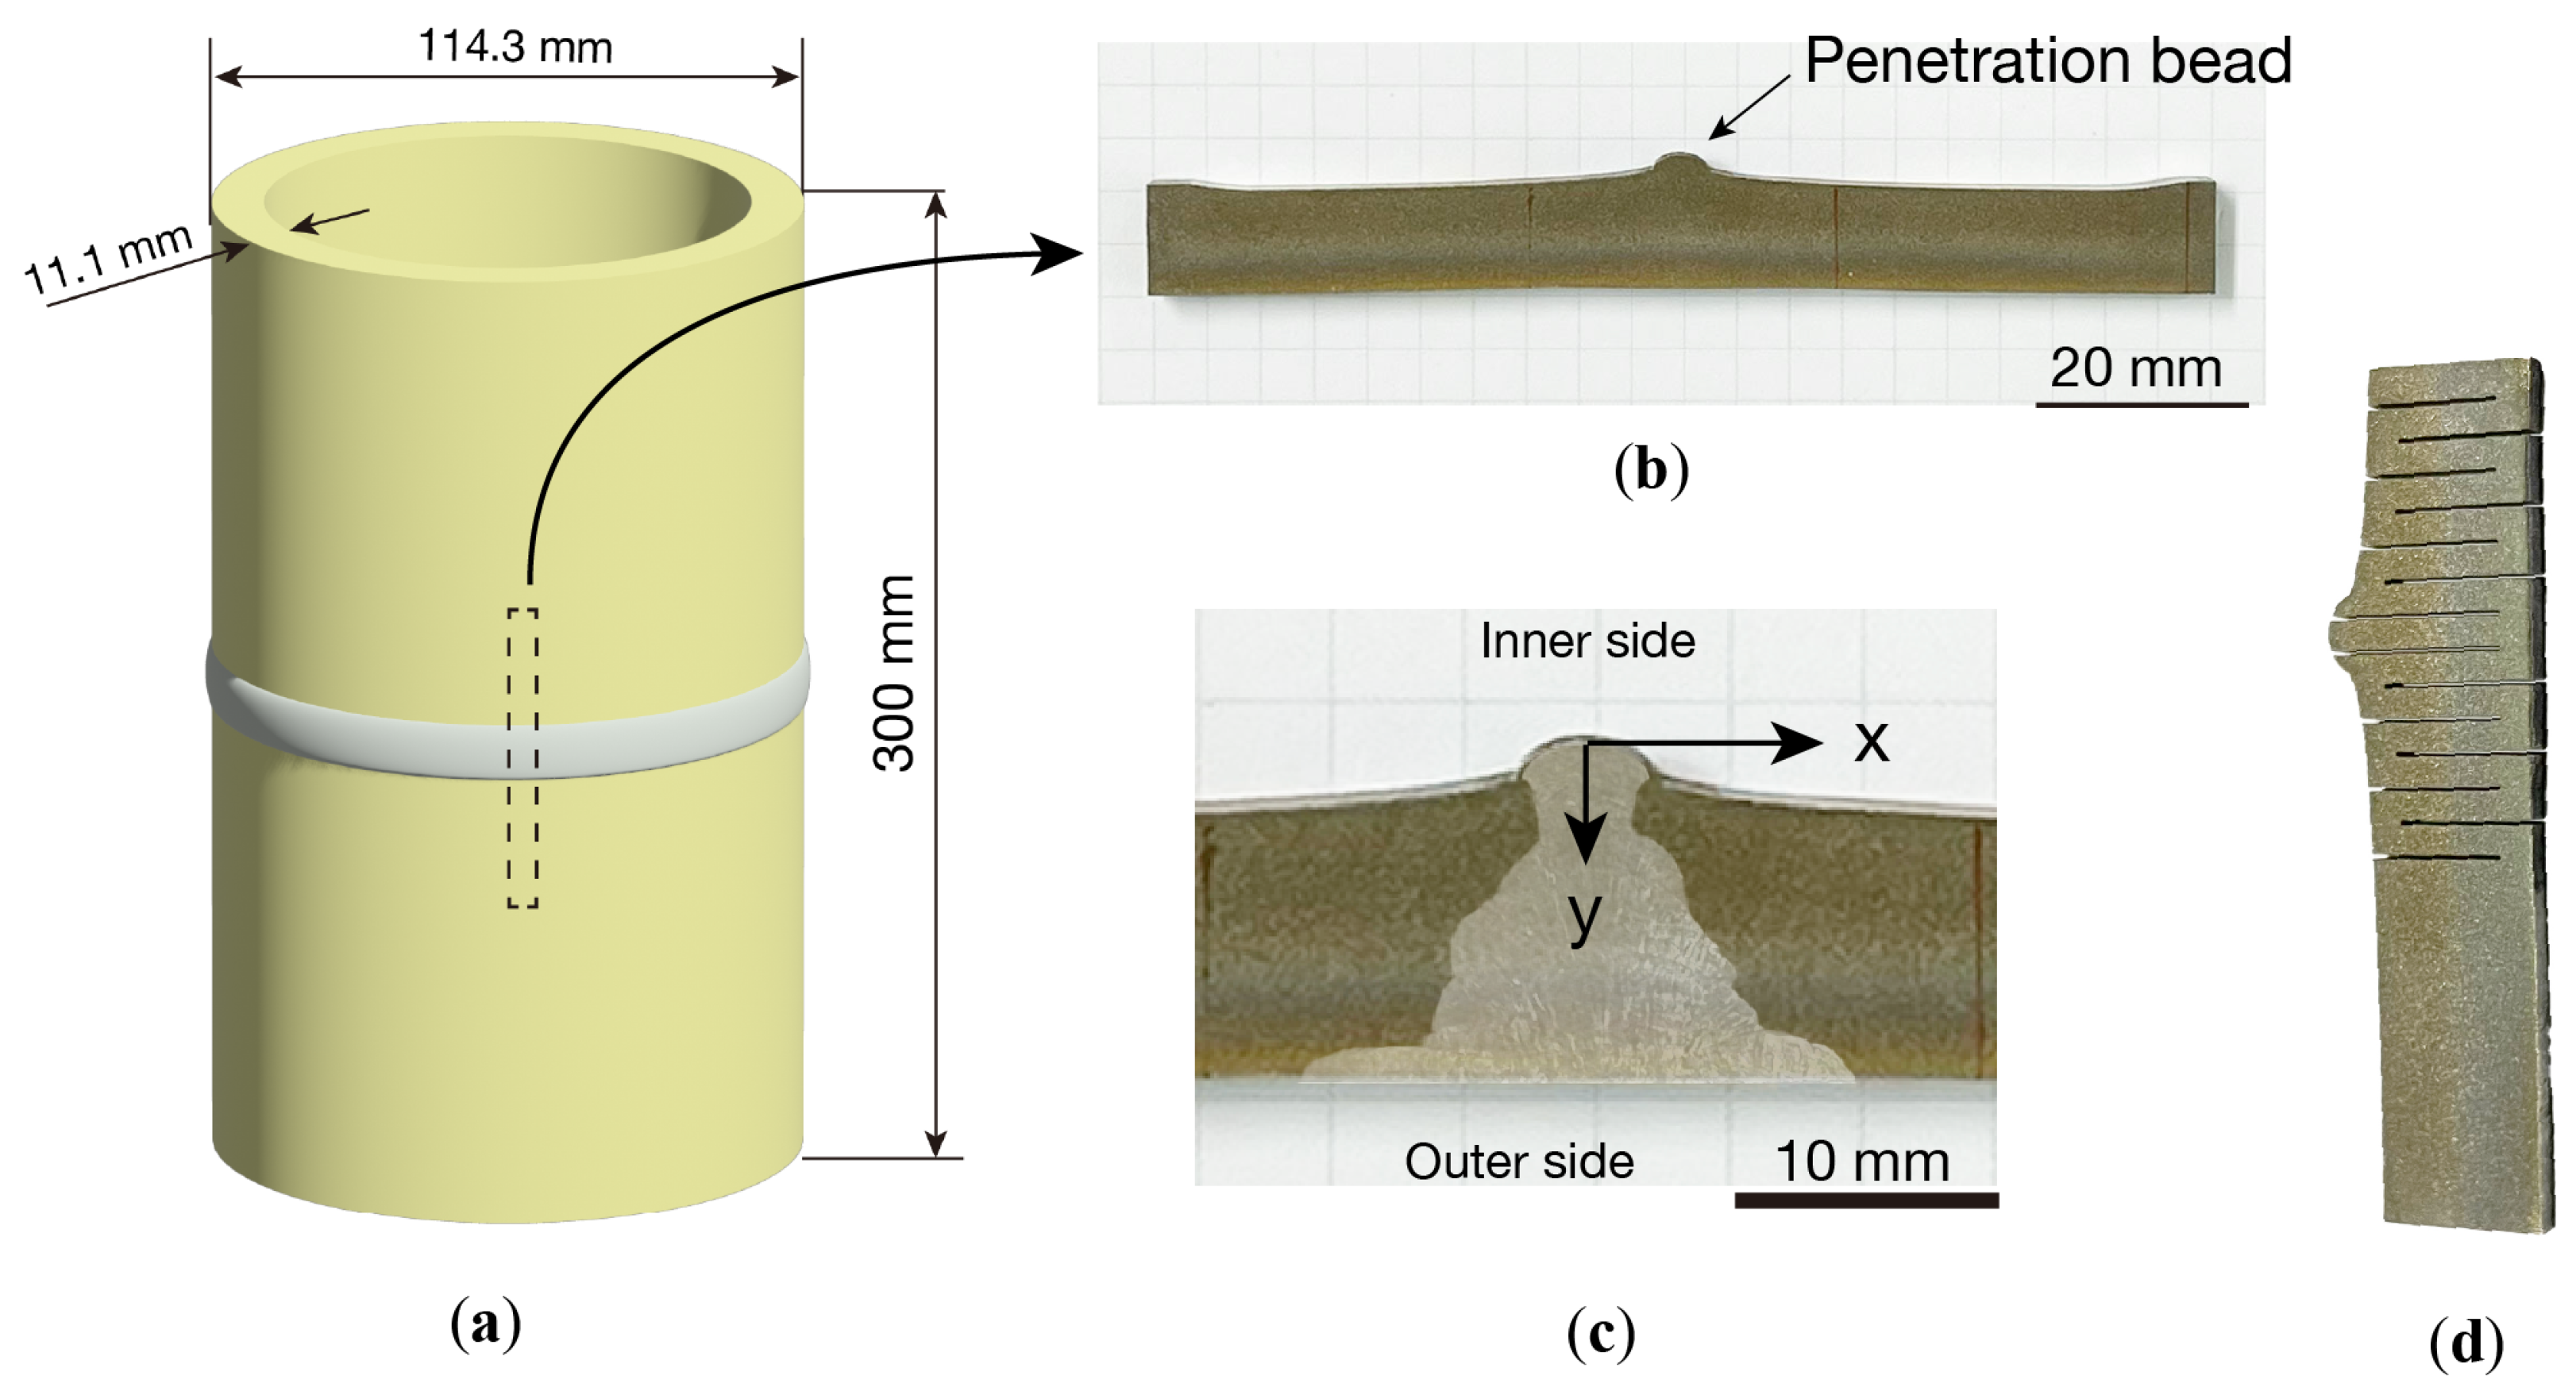
Figure 1. Welded pipe, welded specimen and d 0 -specimen. (a) Welded piping, (b) test specimen, (c) welded part and coordinates for measurement location, (d) strain free d 0 -specimen.
Qubs 09 00015 g001
Figure 2. The neutron scattering facility of Japan Atomic Energy Agency. (a) Research reactor JRR-3; (b) diffractometer for residual stress analysis (RESA).
Qubs 09 00015 g002
Figure 3. Configuration of piping for strain scanning method with neutrons. The neutron beam and welded piping positions for each strain measurement direction are shown.
Qubs 09 00015 g003
Figure 4. Principle of double-exposure method.
Qubs 09 00015 g004
Figure 5. DEM experiment. (a) Synchrotron radiation facility SPring-8 in Japan [26]. (b) Photograph of DEM experiment at BL14B1.
Qubs 09 00015 g005
Figure 6. Residual stress distribution measured by neutrons. x is the distance from the welding center and the welding line corresponds to x = 0 mm. σ a , σ h , and σ r are the axial, hoop, and radial residual stresses, respectively.
Qubs 09 00015 g006
Figure 7. Residual stress distribution map created based on Figure 6. The symbols used in the figure are the same as in Figure 6.
Qubs 09 00015 g007
Figure 8. Diffraction patterns from the 311 diffraction of the welded specimen. Various diffraction patterns are observed depending on the measurement position: coarse grains, plastic deformation, and textured structure. The yellow box illustrates the measuring area.
Qubs 09 00015 g008
Figure 9. Cross-correlation function between waveforms w 1 and w 2 . The arrow mark indicates peak top of each waveform.
Qubs 09 00015 g009
Figure 10. Diffraction radii r 1 and r 2 measured at P1 and P2.
Qubs 09 00015 g010
Figure 11. Residual stress maps of welded specimen measured using DEM.
Qubs 09 00015 g011
Figure 12. Residual stress maps of welded specimen, which were created from axial and radial residual strain maps by DEM and hoop residual stress map by neutron diffraction.
Qubs 09 00015 g012
Figure 13. Finite element model of welded piping. To make easier to distinguish layers of welding, each layer is colour coded.
Qubs 09 00015 g013
Figure 14. Temperature and displacement in welding. With each welding pass, the welded pipe deforms as if swinging its head around. Eventually, it deforms as if the welded area is tied with a belt.
Qubs 09 00015 g014
Figure 15. Residual stress maps simulated by FEM. The upper residual stress map is the whole model, and the lower residual stress map is the half model.
Qubs 09 00015 g015
Disclaimer/Publisher’s Note: The statements, opinions and data contained in all publications are solely those of the individual author(s) and contributor(s) and not of MDPI and/or the editor(s). MDPI and/or the editor(s) disclaim responsibility for any injury to people or property resulting from any ideas, methods, instructions or products referred to in the content.