Article

Impact of Pseudo-Random Number Generators on Dosimetric Parameters in Validation of Medical Linear Accelerator Head Simulation for 6 MV Photons Using the GATE/GEANT4 Platform

1
Subatomic Research and Applications Team, Laboratory of the Physics of Condensed Matter (LPMC-ERSA), Faculty of Sciences Ben M’Sick, Hassan II University, Casablanca BP 7955, Morocco
2
Laboratory of Sciences and Health Technologies, High Institute of Health Sciences (ISSS), Hassan I University, Settat BP 555, Morocco
3
Faculty of Medicine and Pharmacy, Hassan II University, Casablanca BP 9154, Morocco
*
Author to whom correspondence should be addressed.
Quantum Beam Sci. 2025, 9(2), 16; https://doi.org/10.3390/qubs9020016
Submission received: 7 December 2024 / Revised: 22 March 2025 / Accepted: 21 April 2025 / Published: 5 May 2025
(This article belongs to the Section Radiation Scattering Fundamentals and Theory)

Abstract

Monte Carlo simulation relies on pseudo-random number generators. In general, the quality of these generators can have a direct impact on simulation results. The GATE toolbox, widely adopted in radiotherapy, offers three generators from which users can choose: Mersenne Twister, Ranlux-64, and James-Random. In this study, we used these generators to simulate the head of a medical linear accelerator for 6 MV photons in order to assess their potential impact on the results obtained in radiotherapy simulation. Simulations were conducted for four different field openings. The simulations included a linac head model and a water phantom, all components of the head of the medical linear accelerator, and a water phantom placed at a distance of 100 cm from the electron source. Statistical analysis based on normal probability and Bland–Altman plots were used to compare dose distributions in the voxelized water phantom obtained by each generator. Experimental data (dose profiles, percentage dose at depth, and other dosimetric parameters) were measured using an appropriate quality assurance protocol for comparison with the different simulations. The evaluation of dosimetric criteria shows significant variations, particularly in the physical penumbra of the dose profile for large fields. The gamma index analysis highlights significant distinctions in generator performance. In all simulations, the average time of the primary particle generation rate, number of tracks, and steps in the simulation of different random number generators showed differences. The Mersenne Twister generator was distinguished by high performance in several aspects, particularly in terms of execution time, primary particle production, track and step production flow rate, and coming closer to the experimental results. Regarding computational time, the simulation using the Mersenne Twister generator was about 18% faster than the one using the James-Random generator and 27% faster than the simulation using the Ranlux-64 generator. This suggests that this generator is the most reliable for accurate and fast modeling of the medical linear accelerator head for 6 MV energy.

1. Introduction

The Monte Carlo (MC) method is a numerical solution for solving problems involving the modeling of interactions between objects or between objects and their environment and is used to solve high-dimensionality problems [1,2]. In particle physics, the interaction of a particle can be in all directions, implying a large dimensionality of the problem. Therefore, MC provides a solution to simulate the complexity of transporting particles in the radiation therapy energy range [3,4]. In general, MC relies on the repetitive sampling of probability distribution functions. In the simulation of photon transport, the probability is based on the attenuation law to express the cumulative distribution function of the probability weights and on which the sampling of the mean free path will be applied [5]. Then comes the sampling step of the interaction type using a second random number, knowing that with a known interaction type, all other particle state variables can be determined by sampling the probability distribution defined by the corresponding differential cross sections [6]. The reiteration of these simulation steps presented in general is also applied to secondary particles.
In addition, sampling is conducted by generating pseudo-random numbers, thus constituting the core of MC, automatically impacting simulation outcome [7]. In the literature, several studies have verified the reliability and performance of pseudo-random number generators (PRNGs) before their integration in MC codes [8], but this does not guarantee accuracy in MC simulations [9,10]. Only comparisons of PRNGs using MC have been made in publications [11,12] but for energy intervals that do not exceed 1 MeV, which is much lower than those used in radiotherapy [13]. However, it is important to note that the choice of the best generator will depend on the specific application and random quality requirements, especially in radiotherapy, where the accuracy of the results is crucial. Some generators may be more suitable for certain applications than others [14,15]. In-depth testing and comparison against relevant criteria can be useful in making an informed decision.
This work was initiated due to the lack of literature concerning the choice of a pseudo-random number generator (PRNG) in an MC simulation in radiotherapy using the GATE MC toolkit [16,17]. GATE provides three PRNGs inherited from Geant4/CLHEP (Class Library for High Energy Physics). A Mersenne Twister (MT) generator is the default option if the user has not specified a preferred choice for the simulation. However, no specific recommendation is given for its selection in radiotherapy applications. This article aims to provide the reliability of the random number generators available in GATE for the validation of accelerator head simulation for an energy of 6 MV by comparing the dosimetric parameters obtained using the Mersenne Twister (MT), Ranlux64 (RL), and James-Random (JR) generators with experimental data. The simulation codes were not modified when switching from one generator to another, except the generator itself, so that the analysis of the results is reliable. Users will be able to make informed decisions when selecting an appropriate generator for their MC radiotherapy simulations for 6 MV energy, resulting in optimal MC simulation radiotherapy applications.

2. Methods and Materials

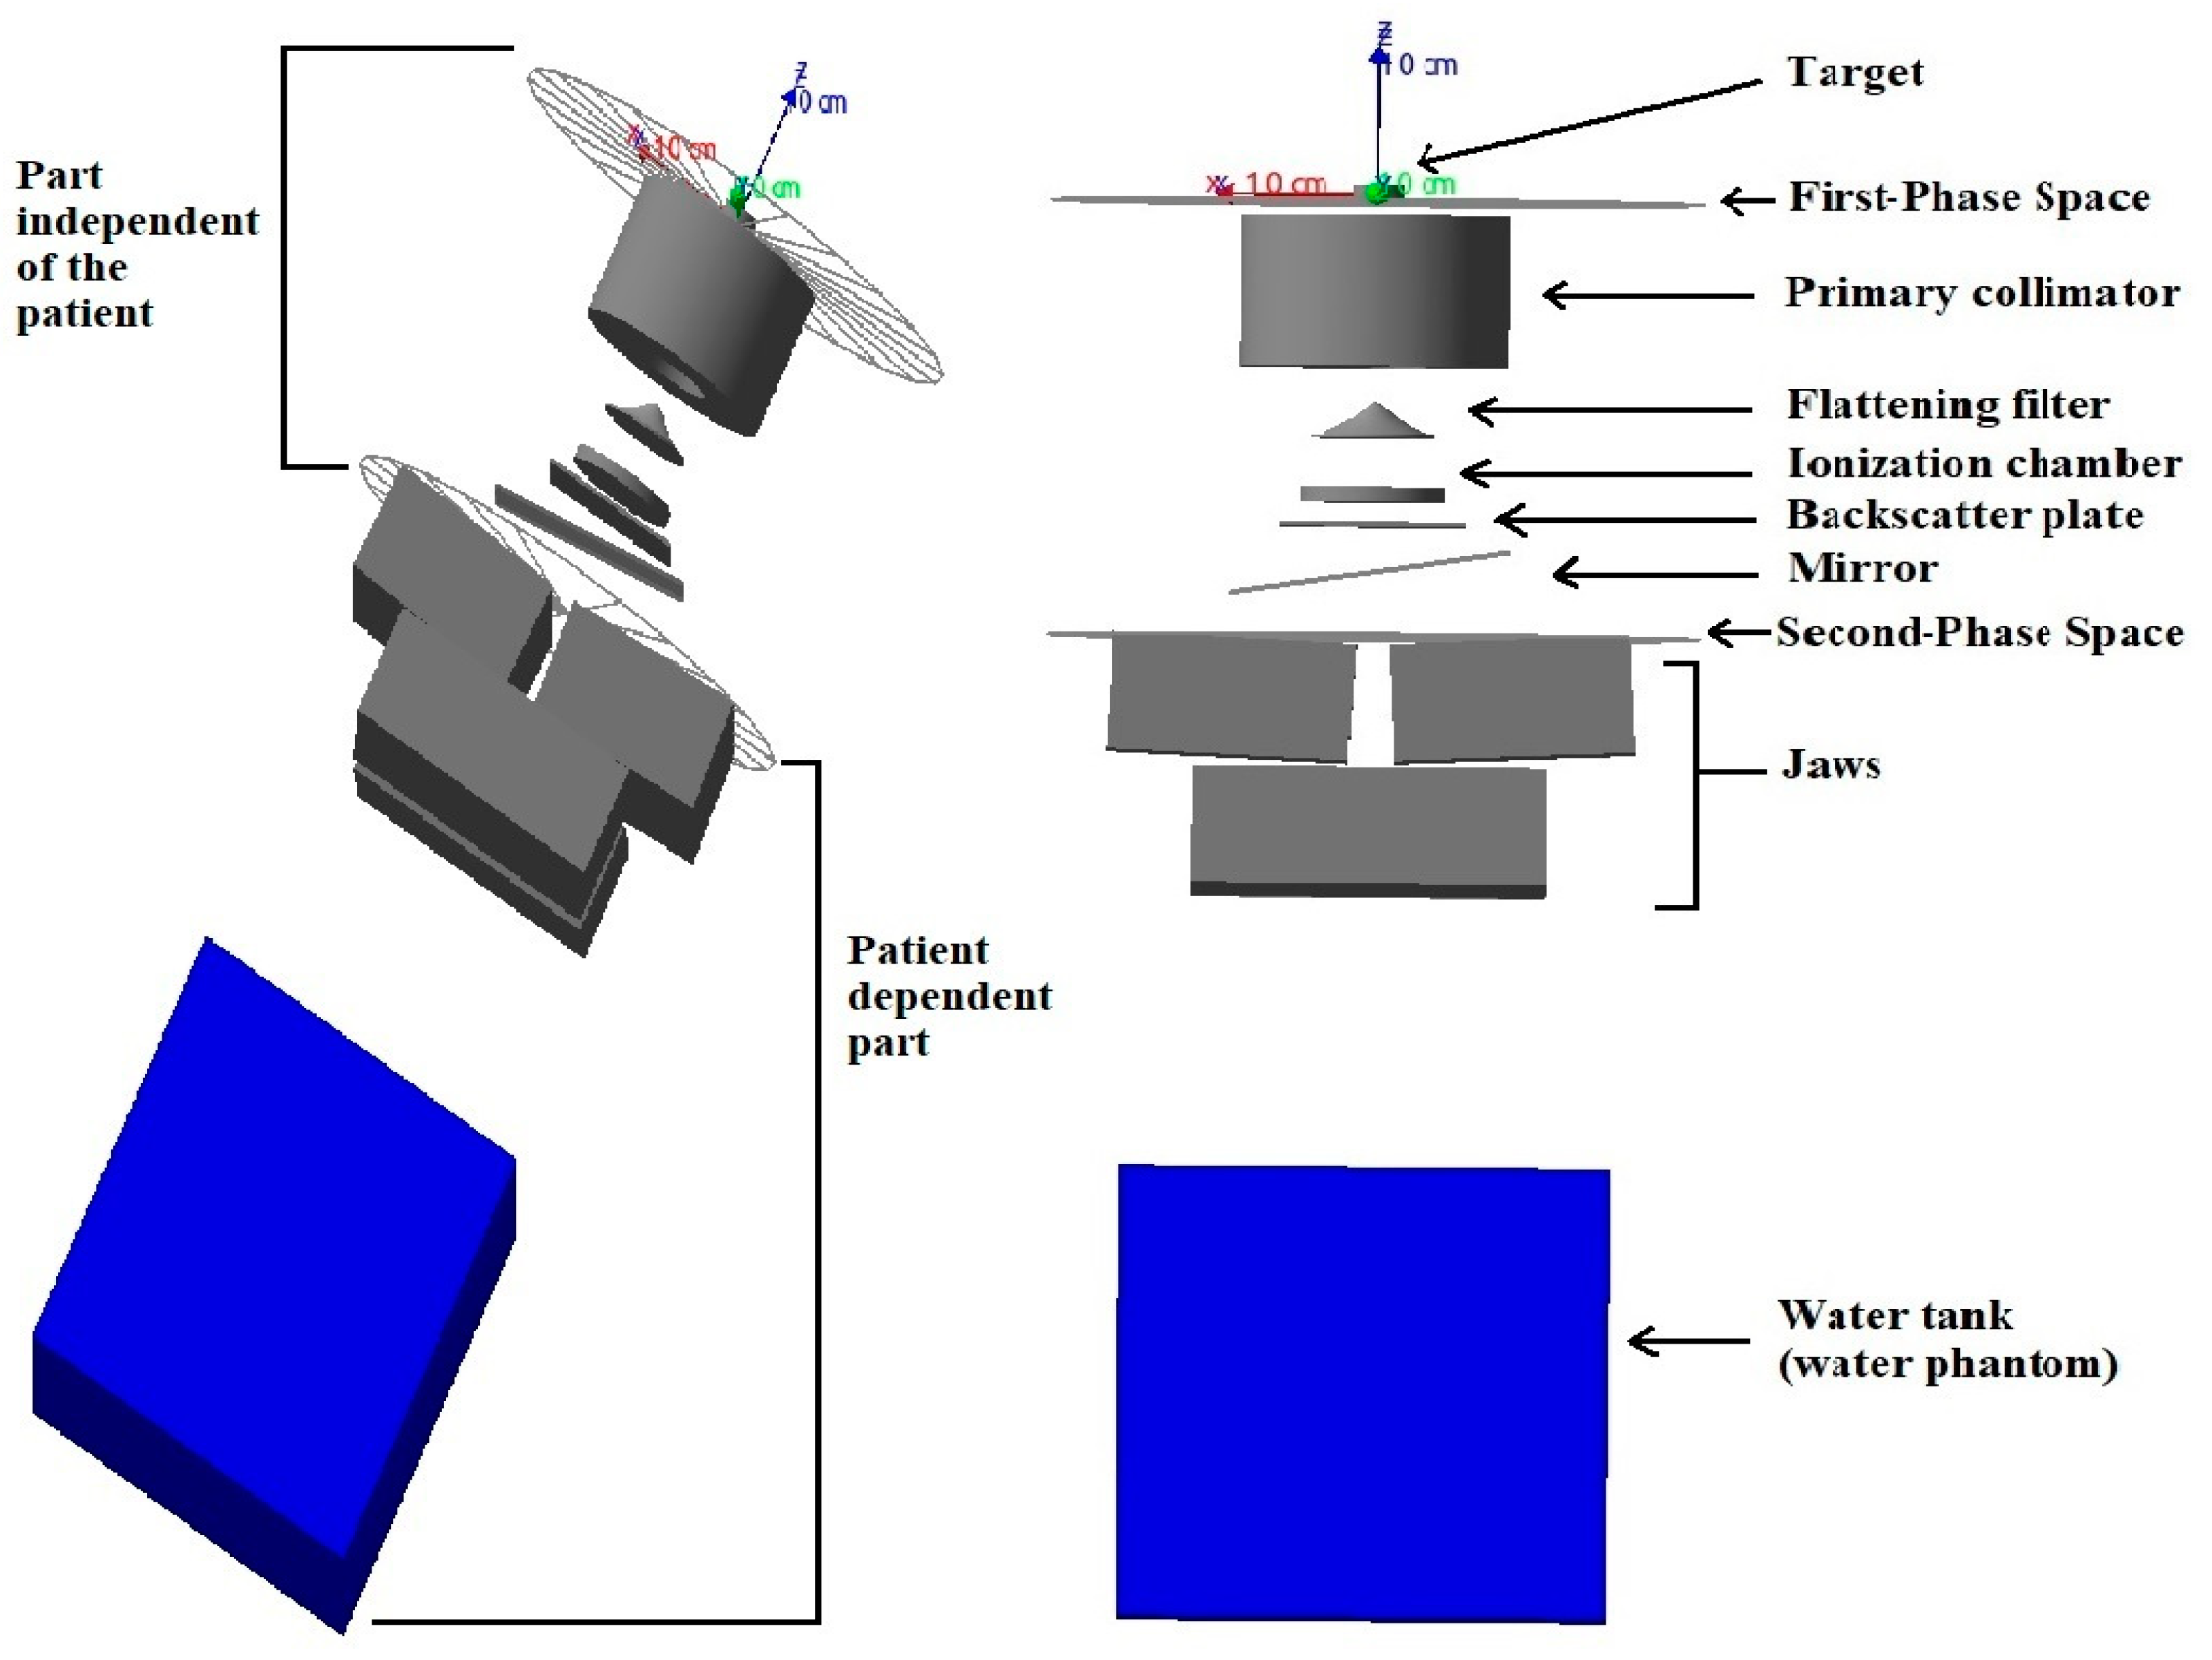
2.1. Medical Linear Accelerator, Source, and Voxel Water Phantom Simulation

To assess the influence of employing different PRNGs on the validity of the simulation of the medical linear accelerator head for an energy of 6 MV, it was crucial to model the latter. The 6 MV photon beam of the Clinac 2100 Varian medical linear accelerator was modeled taking into account the geometry and components of the accelerator head. A water phantom was simulated to evaluate doses at 100 cm source-to-skin distance (SSD), with dimensions of 50 × 50 × 50 cm3 and voxels of 3 × 3 × 3 mm3 (Figure 1). The electron source was characterized by a Gaussian distribution of electron energy, angle, and spatial energy distribution. The average electron energy was determined for an energy of 6 MeV with a focal spot size of 3 mm, according to literature data.

2.2. Computing Time Optimization

In this study, various optimization techniques were used to accelerate computing time [18]. First, using the emstandardopt3 physical list, the particle production threshold was set to 1 mm in the accelerator head for electrons, photons, and positrons. However, in the water phantom, the cuts of the 6 MV mode were 1.0 mm, corresponding to about 5 keV and 350 keV for photons and electrons/positrons, respectively [19]. Also, it was important to create geometries attached to an actor called KillActor to stop tracking particles that come out of the studied volume. The selective bremsstrahlung splitting (SBS) method was used to speed up the simulation of X-rays generated by the interaction of primary electrons with the linac target [20].
The calculations were performed using the high-performance computing (HPC) infrastructure provided by Morocco’s National Center for Scientific and Technical Research (CNRST). This remotely accessible platform consists of 38 nodes with a total of 1672 CPU cores, offering a global performance of 165 teraflops. It features 10.4 terabytes of RAM, 396 terabytes of storage capacity, and includes 4 graphical processing units (GPUs).

2.3. Common Pseudo-Random Number Generators (PRNGs)

In this study, the simulation employed three PRNGs available in the GATE platform. PRNGs are algorithms utilized to produce sequences of numbers that mimic randomness but are determined by mathematical functions. They operate with an initial seed and iteratively generate numbers [14]. The MT algorithm was proposed by Matsumoto and Nishimura. It stands out due to its ability to generate numbers. Its extended period guarantees a low correlation between the numbers generated: 219937–1 [21]. Similarly, the JR algorithm, known for its simplicity and effectiveness, combines multiple linear congruence generators to produce 32-bit random numbers. Although not yielding true randomness, it serves well in simulations requiring random behavior. The RL algorithm, based on SWB RCARRY (Subtract-With-Borrow), offers high-quality random number generation with a long period and computational efficiency. Its utilization in various applications underscores its reliability [12,22].

2.4. Output of Simulation

Actors are the tools used to interact and collect information in GATE. Simulation data were collected using Dose Actor and Statistic Actor. They are the most frequently used actors due to the fact that they give access to certain parameters such as the absorbed dose in a voxelized geometry in Gray (Gy), which is the radiation energy deposited per kilogram of material in each voxel. The primary per sec (PPS) indicates the number of primary particles generated per second in the simulation. Primary particles are the initial particles before they interact with the environment. The track per sec (TPS) is the number of simulated tracks per second in the simulation. A track is the path a particle follows through the simulated medium. The number of steps (SPS) represents the total number of steps in the simulation, and this number is the sum of the number of geometric steps involving trajectory changes and the number of steps specifically addressing the detailed physical interactions between the particles. This measure is used to assess and quantify the temporal and physical aspects of the simulations and plays a key role in the analysis and interpretation of the results obtained.
This study focused on the evaluation of dosimetric parameters at the reference field 10 × 10 cm2 [23], the normalized dose at the surface (dS), the depth of the maximum normalized dose (dmax(cm)), the depth of the normalized dose at 10 cm (D10(%)), the depth of the normalized dose at 80 cm (d80(cm)), and the beam-quality indicators, also called tissue phantom ratios, at 10 cm and 20 cm (TPR10,20). In order to evaluate the dose profiles and percentage depth dose curves (PDDs), a linear accelerator simulation was performed for four field apertures (10 × 10 cm2, 20 × 20 cm2, 30 × 30 cm2, and 40 × 40 cm2), chosen to cover a representative range of clinical field sizes used in radiotherapy, from standard fields to larger fields used for specific treatments. This selection allows the assessment of the impact of the PRNG on different dosimetric configurations, particularly in relation to increased particle dispersion and variations in heterogeneity in dose deposition. For each field aperture, the three separate PRNGs were used, each launched with 20 million events, thus ensuring a robust statistical assessment of the recorded differences. To discern the variations between the SPS, PPS, and TPS results obtained with each PRNG, it was essential not to rely on a single value from a single simulation. This is why we used the standard reference field in radiotherapy, measuring 10 × 10 cm2, and repeated the simulation ten times. This approach allowed us to obtain an average and correctly interpret the results. In total, 21 simulations were carried out.

2.5. Experimental Data

Experimental data played a crucial role in this work, first to validate the Monte Carlo simulation model and then to evaluate the validity and the dosimetric impact of our simulation using different PRNGs. The measurements were performed in a radiotherapy department following the quality assurance protocol (QA) dedicated to 6 MV energy [23]. The distance between the medical linear accelerator source and the water surface (SSD) was kept constant at 100 cm for all measurements. The ionization chamber used was the PTW 30013 Farmer, known for its reliability in reference dosimetry for high-energy photons, with an internal diameter of 3.05 mm. The measurements were made in a voxelized water phantom (water tank) of 675 × 645 × 560 mm3, including 15 mm acrylic wall thickness. The parameters measured included dose profiles along the x-axes, as well as yields at different depths of field (10 × 10 cm2, 20 × 20 cm2, 30 × 30 cm2, and 40 × 40 cm2). The dose normalization was performed at the maximum dose of each curve to be able to superimpose them with those obtained by simulation.

2.6. Evaluation Criteria
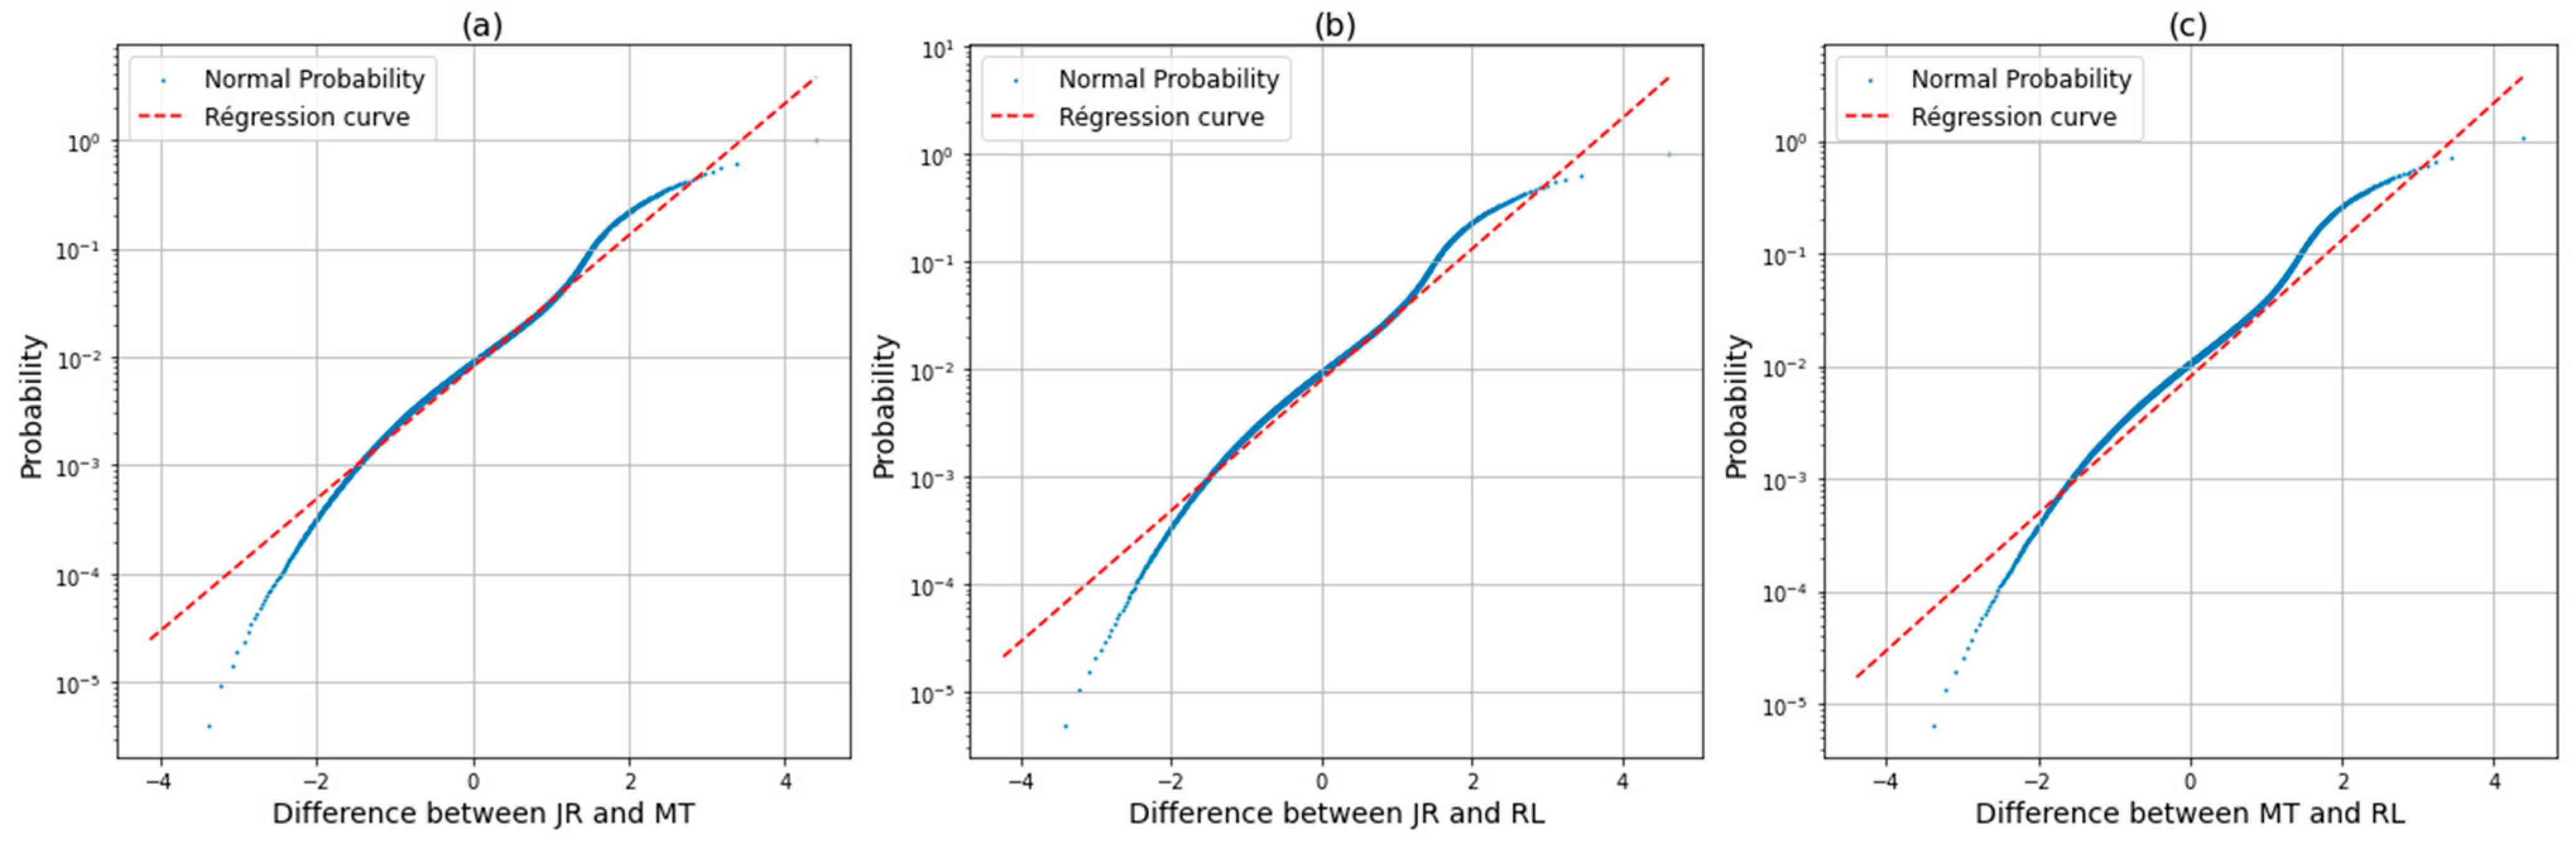
To compare the measured dose profiles and PDDs with those obtained by simulation using each PRNG, the gamma index (γindex) measurement was used with the criteria of 3%/3 mm, 3%/2 mm, and 2%/2 mm [24]. The validation acceptability of all profile curves and PDDs was verified and accepted, with greater than 95% generally required to validate PDDs and profiles with the 3%/3 mm criteria and greater than 92% with the 3%/2 mm criteria, while a threshold of greater than 90% may be acceptable for the more stringent 2%/2 mm criteria [19,25,26].

2.7. Data Analysis

The dose distributions obtained in the voxelized water tank with each PRNG were analyzed and compared independently. Two python codes were created to analyze and compare the results. The first code generates the normal probability plot. The central limit theorem indicates that the distribution of the sum or average of independent and identically distributed random variables converges to a normal distribution as the sample size increases. Thus, if the differences between the results of two PRNGs represent only statistical variations, they should follow a normal distribution. The second code generates a Bland–Altman (BA) plot from the data obtained to compare the two resulting PRNGs by showing the differences according to their mean to evaluate the concordance or agreement between them [27].

3. Results

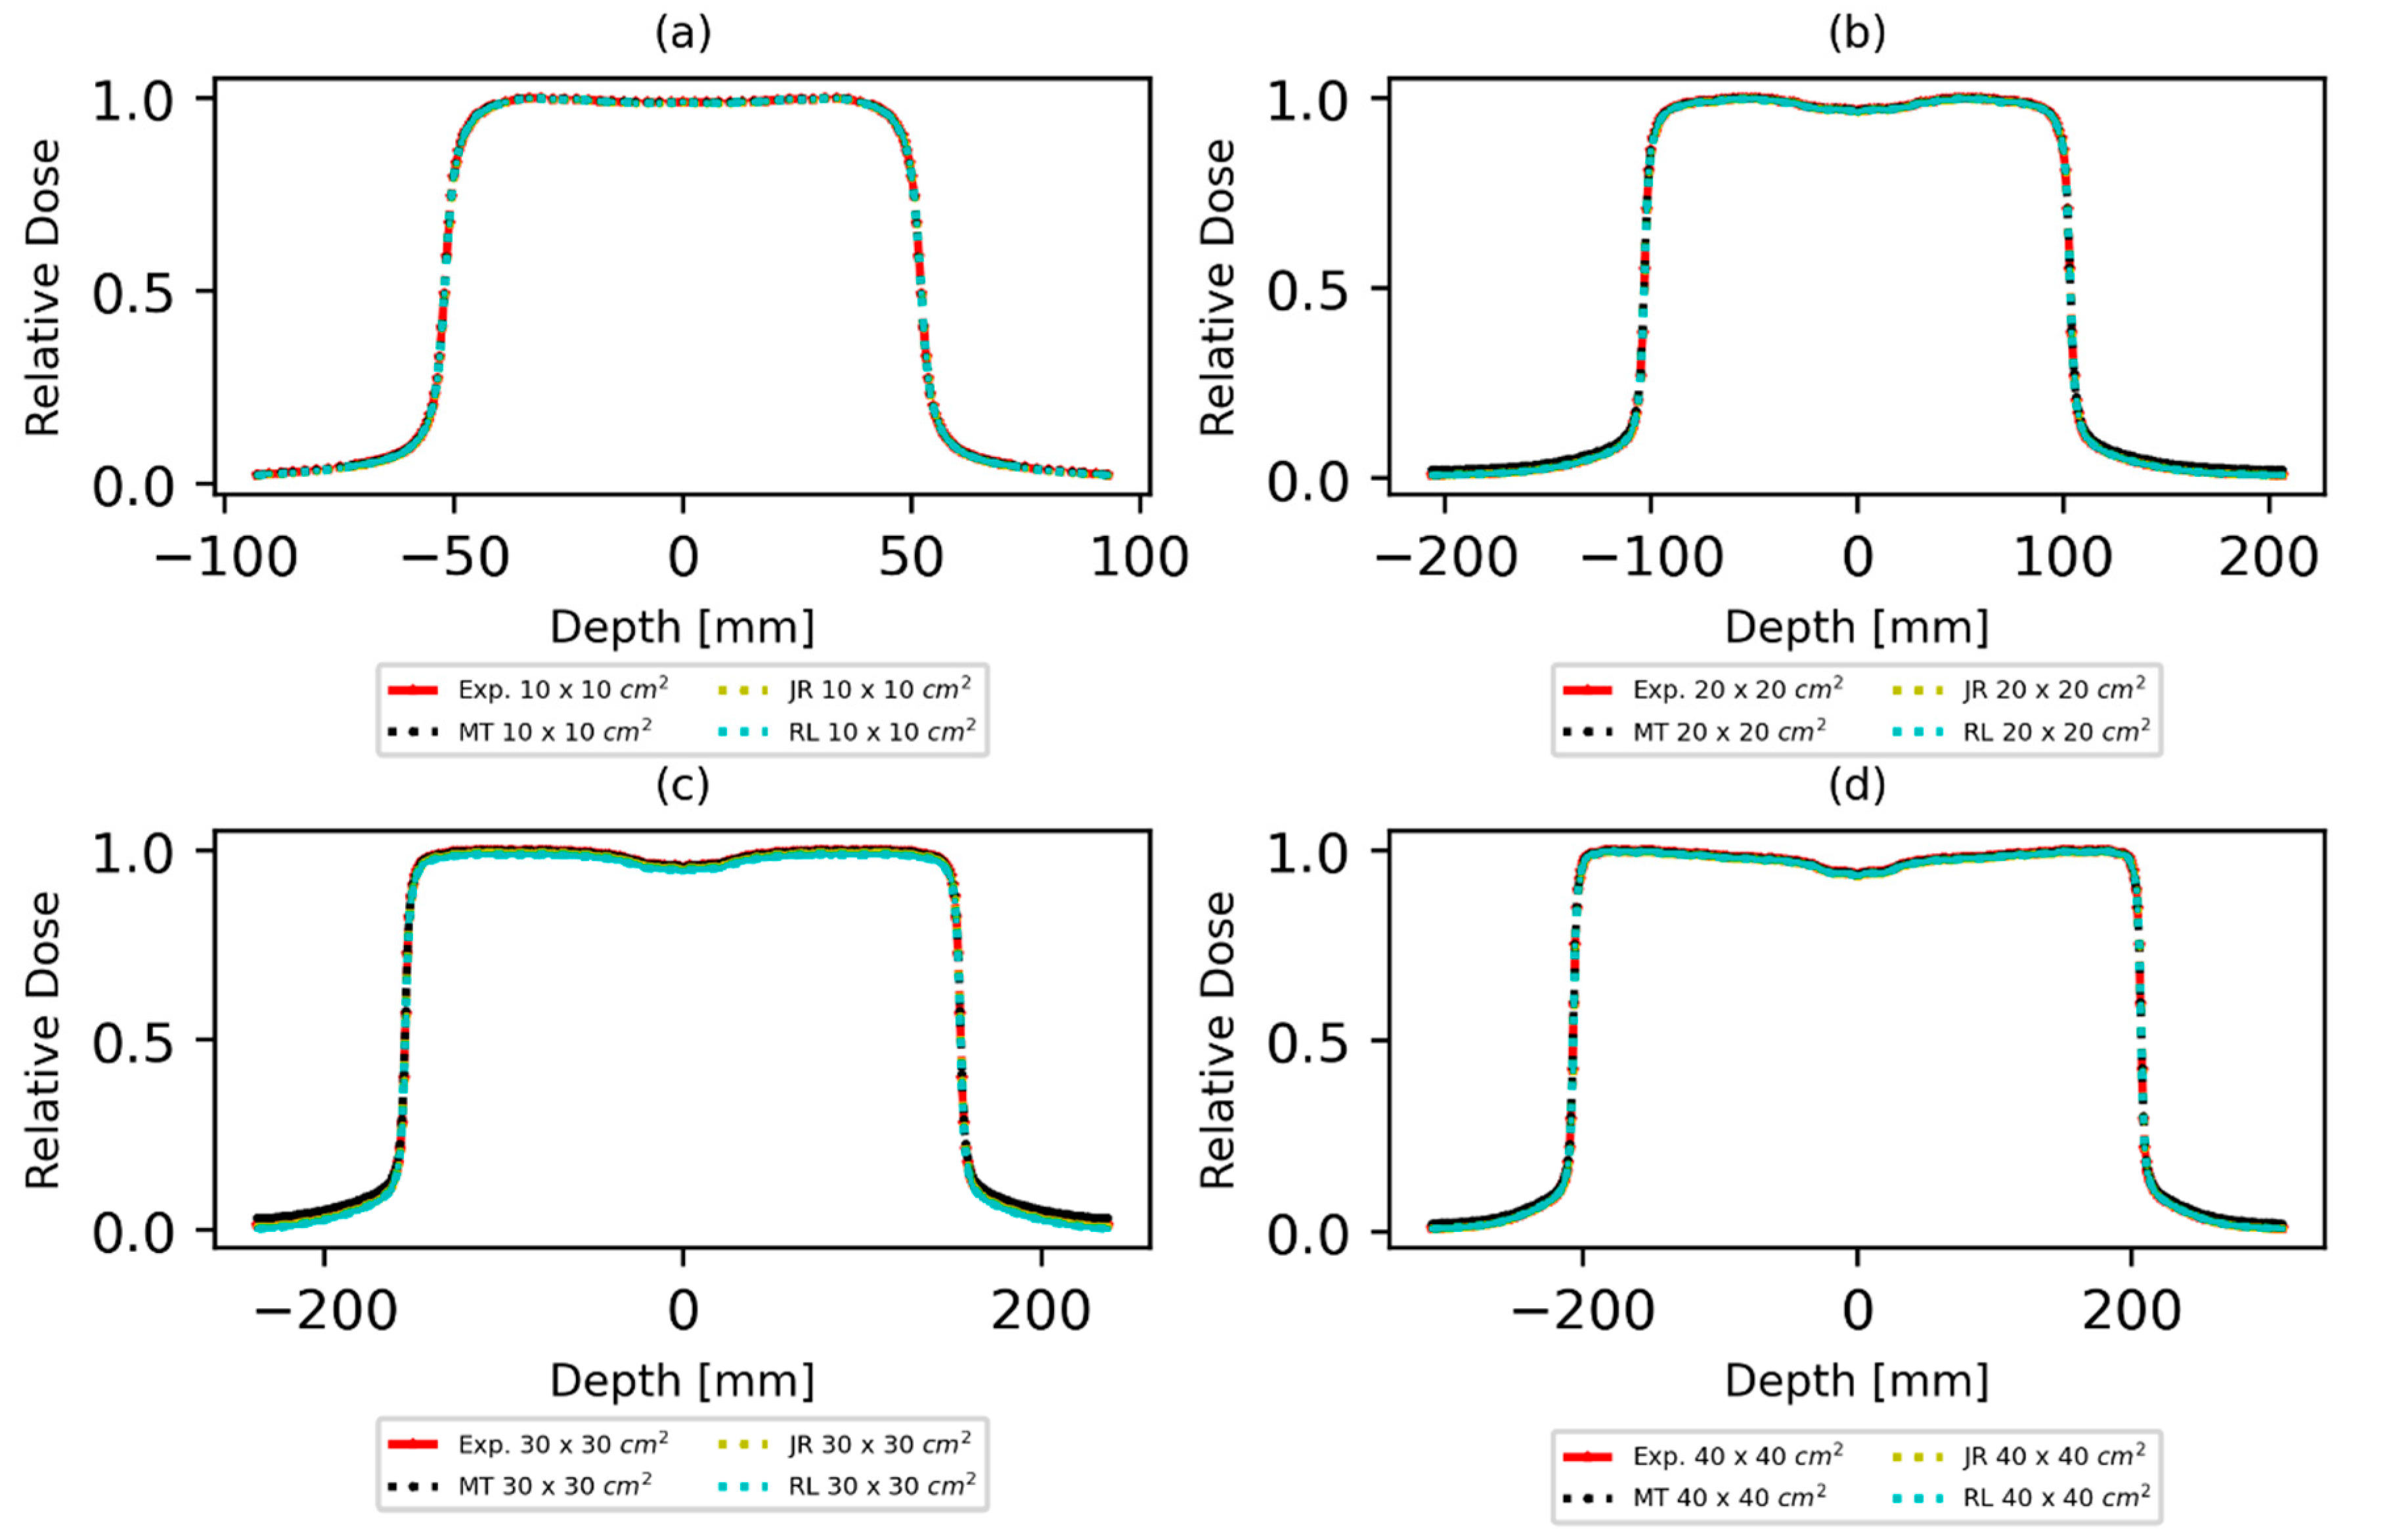
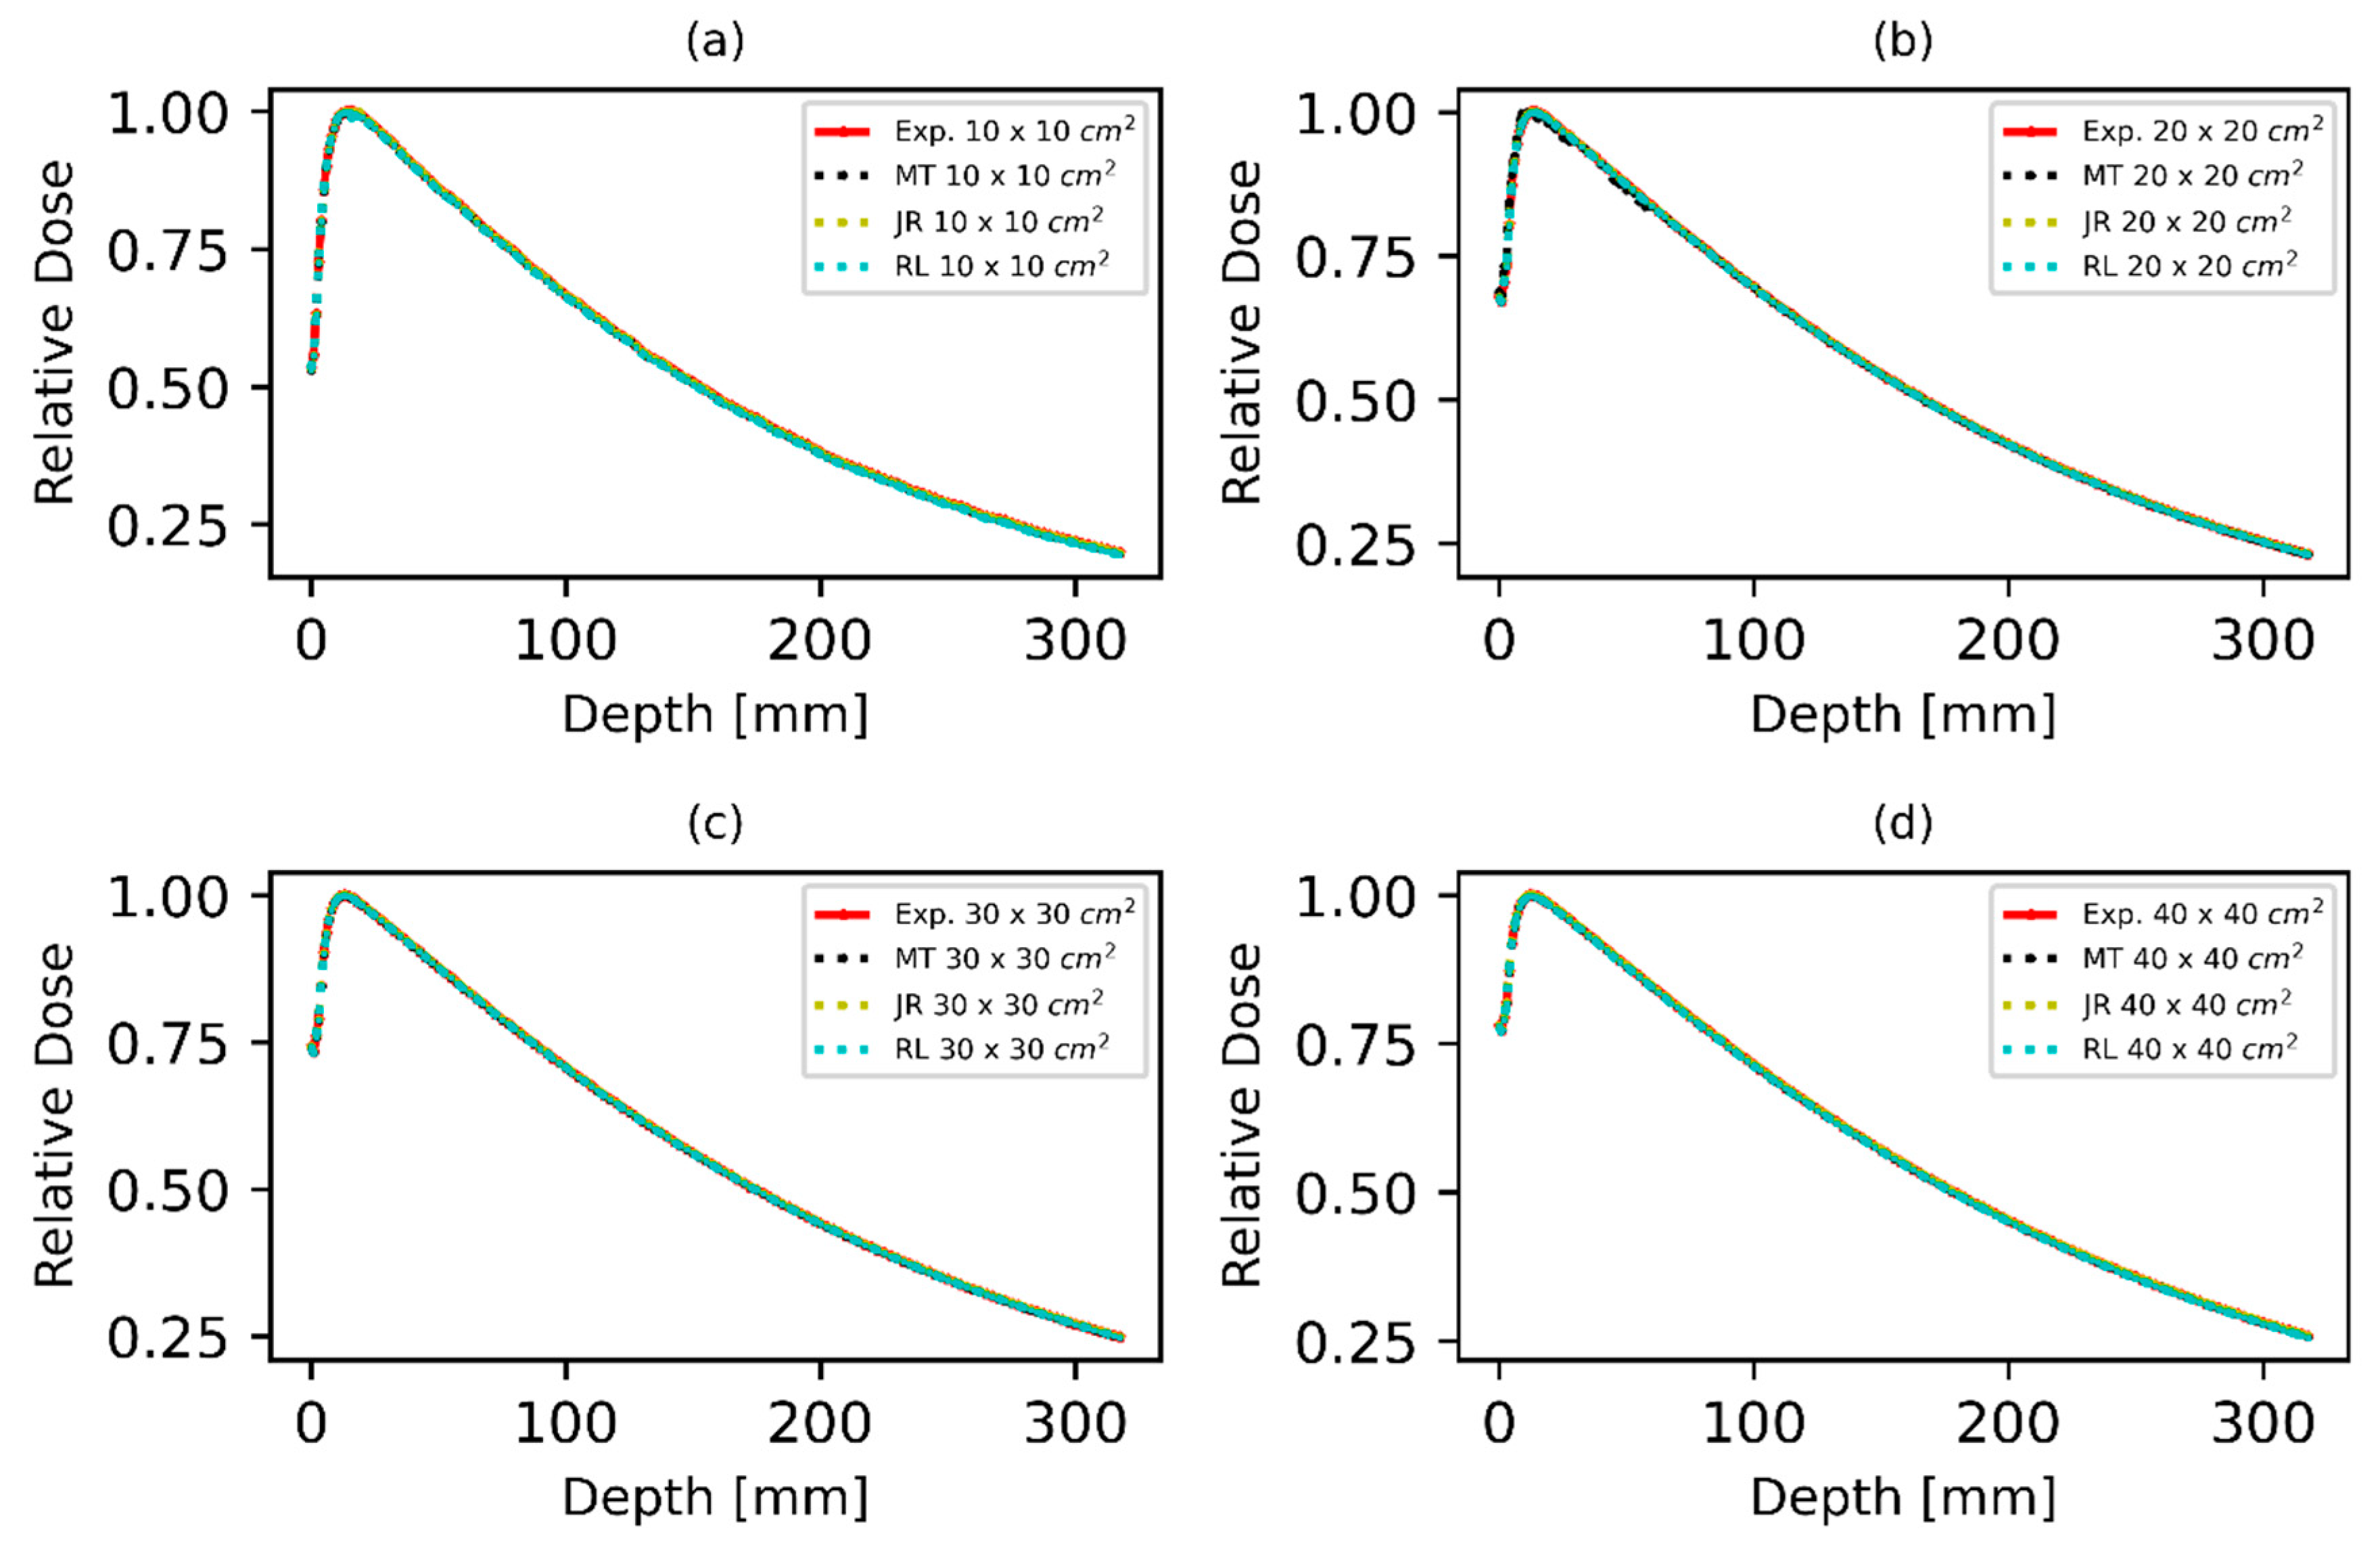
3.1. Dose Profile and Percentage Depth Dose Curve

Figure 2 presents the resulting dose profiles of simulations for 6 MV energy in water generated using three separate random number generators for each simulation. For the 10 × 10 cm2 field, we observe significant variations in dose distributions, particularly at the region of physical penumbra, where dose gradients are most pronounced (Figure 2a). Similarly, for the 20 × 20 cm2 field, the dose profiles at a depth of 1.5 cm show significant fluctuations, highlighting the importance of considering these variations in treatment planning (Figure 2b). The 30 × 30 cm2 and 40 × 40 cm2 fields also have distinct dose profiles, with noticeable differences in the transition regions between the high- and low-dose areas (Figure 2c,d). Using the MT generator, the statistical uncertainty (εk) [28] for the 10 × 10 cm2, 20 × 20 cm2, 30 × 30 cm2, and 40 × 40 cm2 profile curves was 0.83%, 0.63%, 0.97%, and 0.99% respectively, while for RL was 0.73%, 0.63%, 0.91%, and 0.83% and for JR it was 0.76%, 0.58%, 0.90%, and 0.82%.
Figure 3 presents the depth yields for 6MV energy in water using the three random number generators for fields of 10 × 10 cm2, 20 × 20 cm2, 30 × 30 cm2, and 40 × 40 cm2. The results show a notable variation in yields depending on the depth and size of the field. For the 10 × 10 cm2 field, we observe a linear increase in depth yields to a certain depth, followed by a plateau from this depth (Figure 3a). Similar trends are observed for other fields, although plateaus manifest at different depths depending on field size (Figure 3b–d). The statistical uncertainty (εk) for the PDD curves by simulation of fields 10 × 10 cm2, 20 × 20 cm2, 30 × 30 cm2, and 40 × 40 cm2 was 0.59%, 0.61%, 0.78%, and 0.81%, respectively, in the simulation using MT, while in RL it was a value of 0.63%, 0.78%, 0.96%, and 0.81%, respectively, and for JR it was 0.79%, 0.89%, 0.97%, and 0.82%.

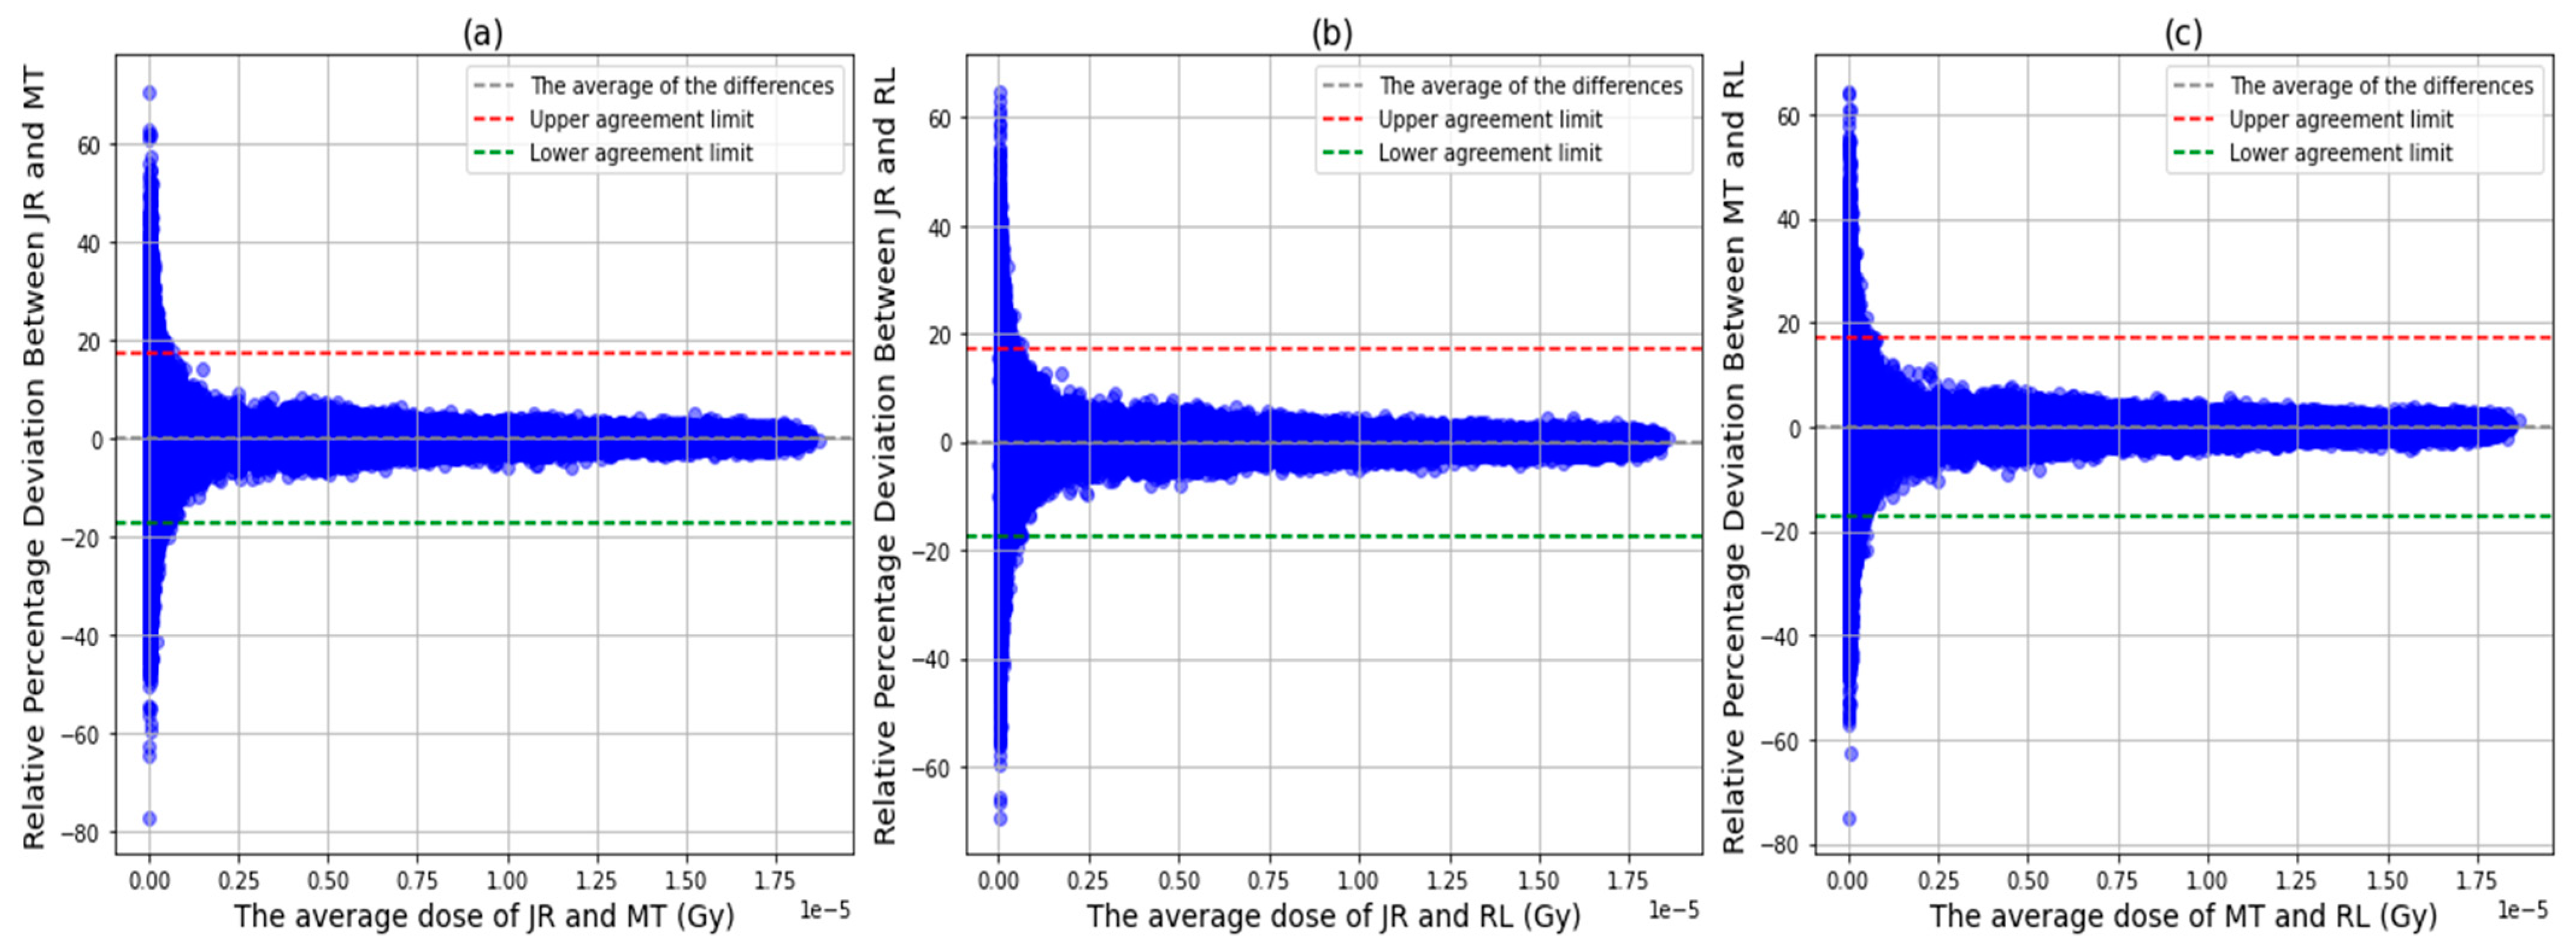
3.2. Voxel Dose Analysis

In Figure 4, the plots of normal probability are generated for a comparison between the different PRNGs. The graphs show the difference between the results obtained and the normality represented by a dotted line. This difference exceeds ±5%, meaning the differences between the resulting distributions do not follow a normal distribution.
Figure 5 represents the general behavior of the chord analysis; three Bland–Altman (BA) plots are reported, which take into account the comparison between two simulation results using two different PRNGs without using the comparison with the experiment since it is not necessary to have all the doses deposited in each voxel of the water tank.
The differences between the use of two different PRNGs in the simulation are visible in the BA plot, which defines a bias of −0.044%, −0.036%, and 0.007% and an agreement range between [17.2267%; −17.353%,17.234%; −17.306%] and [17.307%; −17.293%] for consistency between the derived results of JR-MT, JR-RL, and MT-RL, respectively. This results in a range of about ±17% for the three BA plots mainly caused by dose averages below 0.125 × 10⁻⁵ Gy; above the average 0.250 × 10⁻⁵ Gy, the range of agreement is less than 10%.

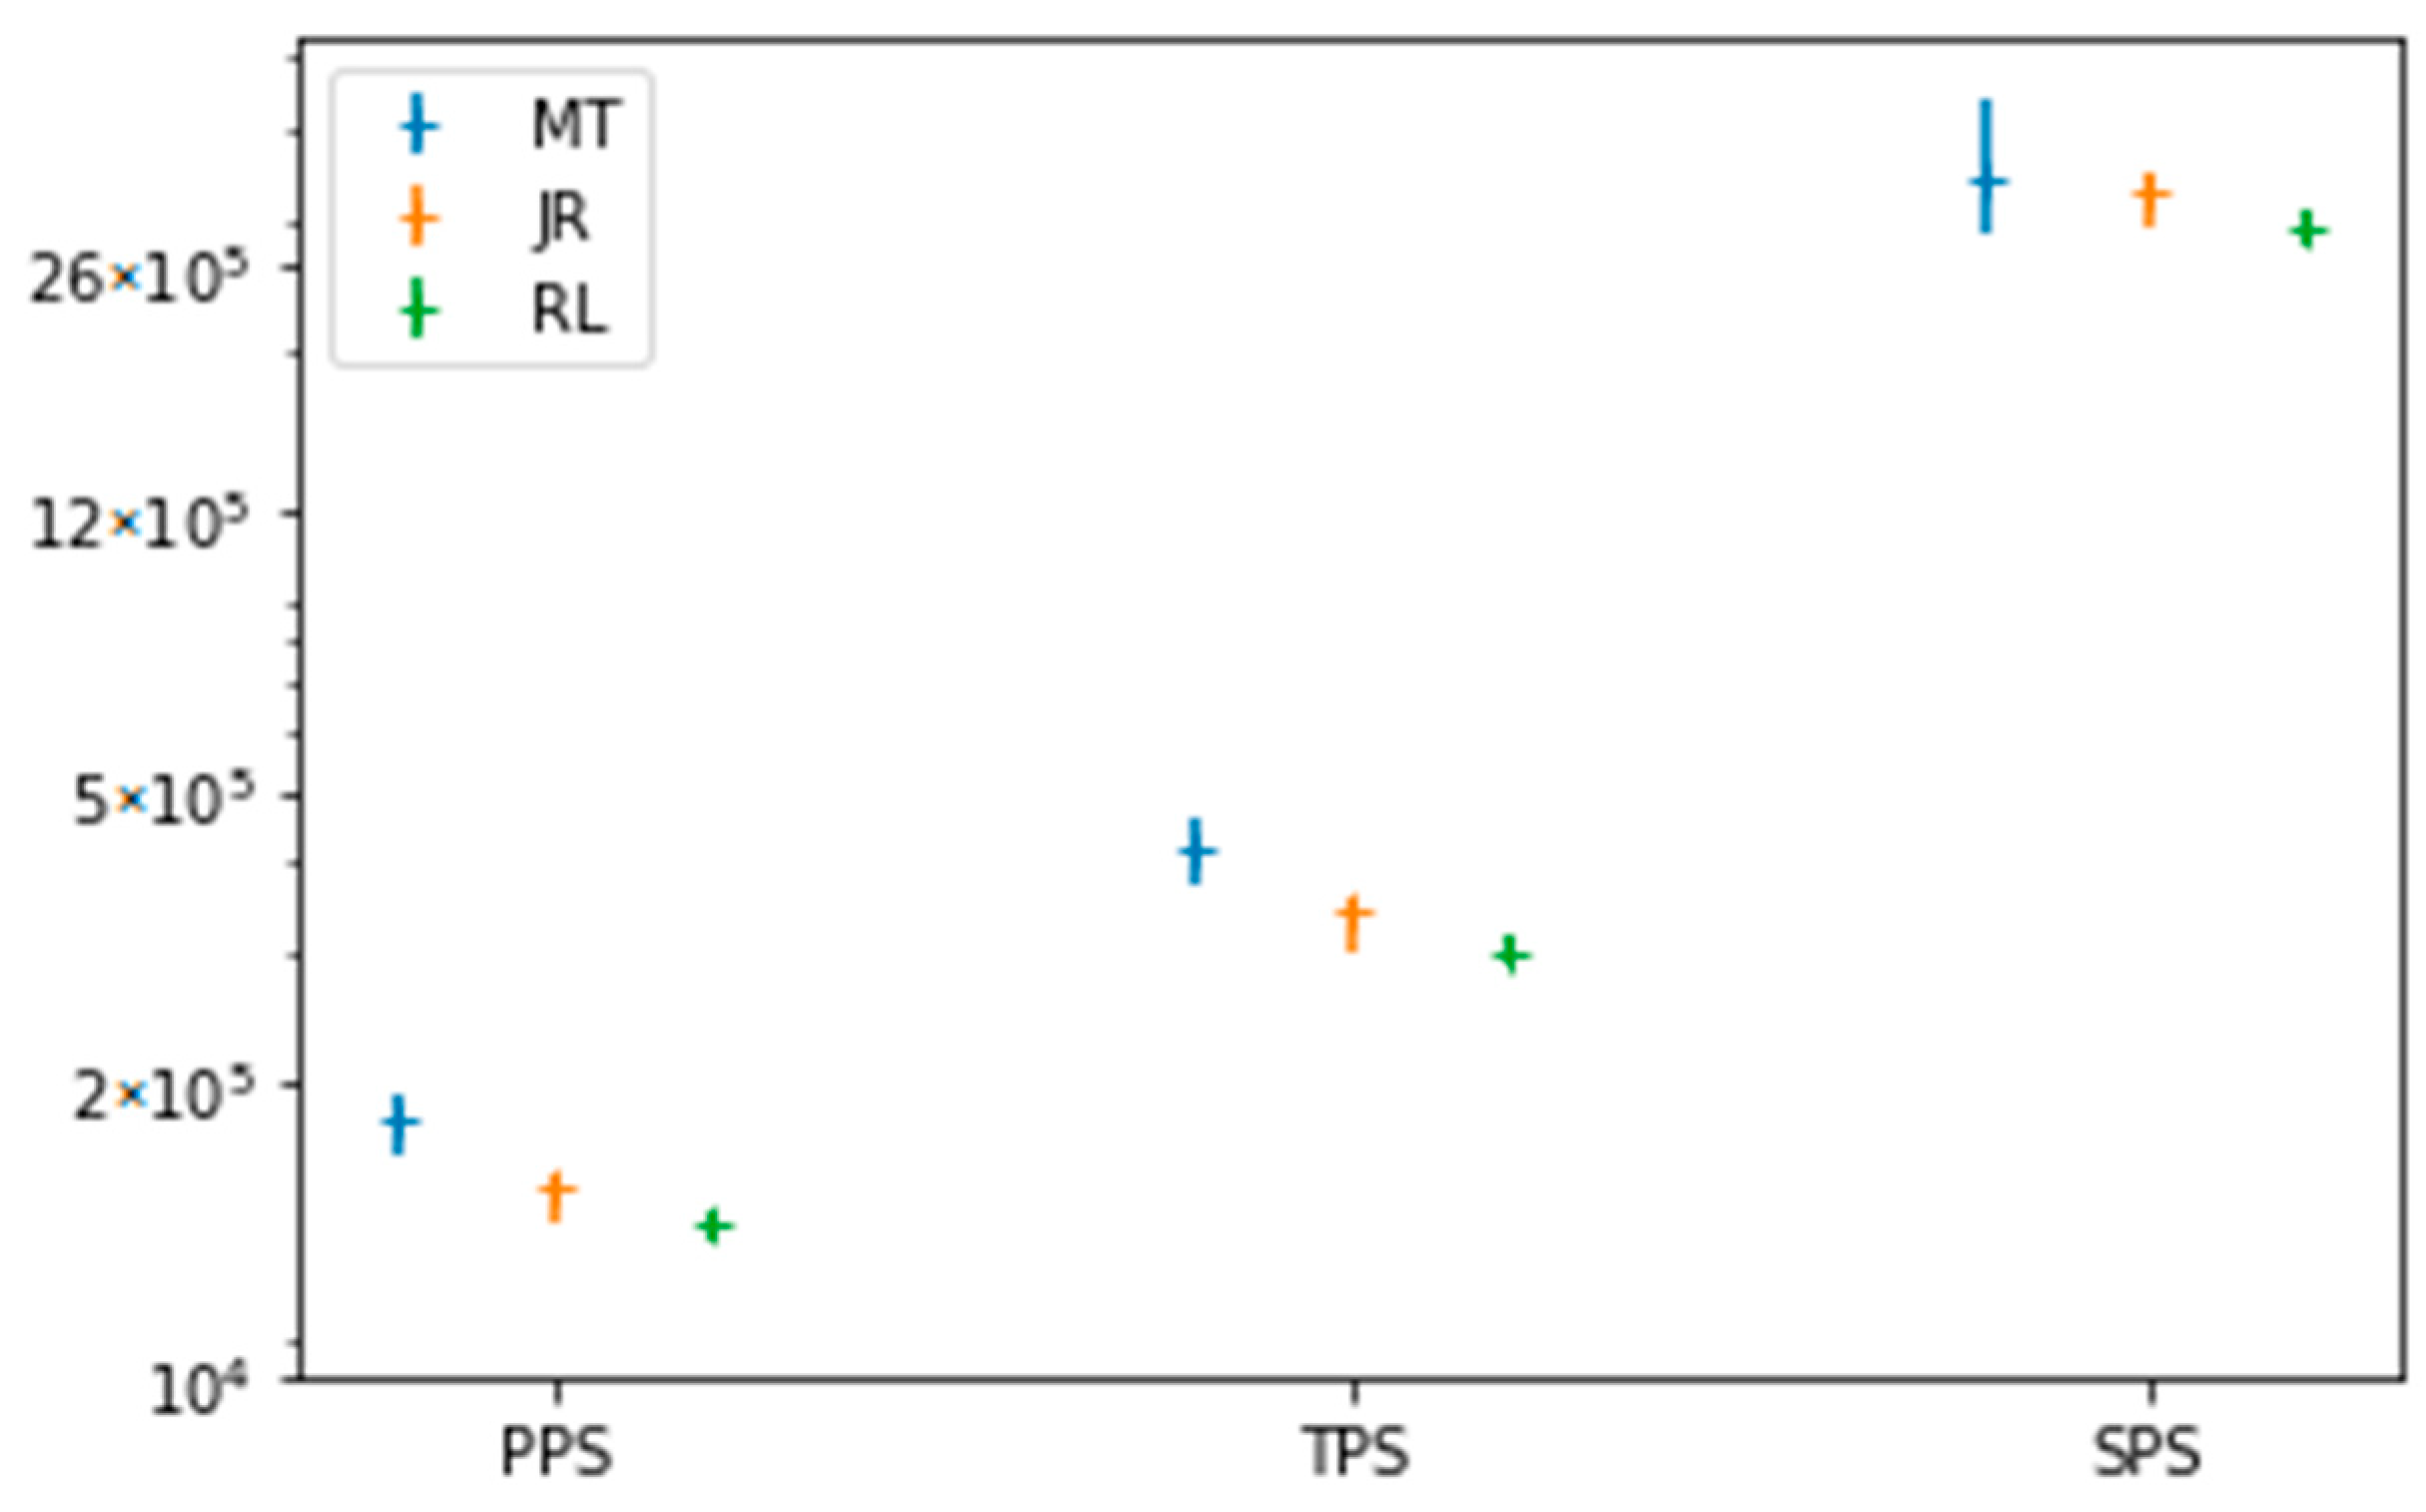
3.3. Simulation Statistic Data

Figure 6 shows a graph with error bars representing simulation statistic data (PPS, TPS, SPS) associated with three distinct sets of values. The data obtained from the three generators (MT, JR, and RL) are analyzed by calculating mean values and confidence intervals. The mean values represent the average over 10 independent simulations with different random seed numbers with the same code, allowing us to have a reliable estimate to interpret the differences between these three generators. Each category has three adjacent bars representing the results obtained for the MT, JR, and RL generators. The error bars around each bar indicate the confidence intervals (minimum and maximum) associated with each mean value. The values on the y-axis vary by several orders of magnitude. A logarithmic scale representation was used for better visualization of the results obtained from the PPS, TPS, and SPS for each PRNG. In addition, a significant disparity between the performance of the MT, JR, and RL generators regarding PPS, TPS, and SPS is found. In fact, MT has high values of PPS and TPS compared to JR and RL, with minimum values also higher than the averages of JR and RL. For SPS, the average value obtained by MT exceeds that of JR and RL, although its minimum value is almost equivalent to the average of RL. This observation suggests substantial differences in performance between the PRNGs, showing the dominance of MT in the PPS and TPS categories. At the same time, the SPS reflects a more complex dynamic with nuances specific to each entity.
Table 1 summarizes the gamma indices for various radiation and PRNG field openings, evaluated according to the 2%/2 mm, 3%/2 mm, and 3%/3 mm criteria. These indices assess the consistency between the dose distributions calculated by the three PRNGs and the experimental distributions. The validation of profiles and PDDs was considered satisfactory by the standards of the literature, with criteria of 95% of the points. In particular, the MT generator shows good performance for the 10 × 10 cm2 field, surpassing the other generators, especially for the 3%/3 mm criterion. Performance decreases slightly for the 20 × 20 cm2 fields, but the MT generator is still considered adequate, while JR and RL show acceptable results. For the 30 × 30 cm2 fields, the MT generator generally excels, while JR and RL exhibit acceptable variability, and for the 40 × 40 cm2 fields, the MT generator maintains high performance, especially for the 3%/3 mm criterion, while JR and RL show variations, however, remaining within an acceptable range.
Table 2 presents a detailed comparison between the experimental measurements and the results obtained by the PRNGs for different dosimetric parameters. Overall, the differences between the experimental values and those calculated by the PRNGs are extremely small concerning dS, dmax, D10, d80, and TPR10,20. These results show that the values of the dosimetric parameters obtained by MT are the closest to the experimental ones compared to the other two PRNGs.

3.4. The Elapsed Time

PRNG simulation execution time was taken into account in this work. A notable distinction emerges between the performances of the three PRNGs studied. The results show that the calculation with the MT generator is the fastest, followed by the JR generator in the second position, while the RL generator occupies the last position in terms of elapsed time. Specifically, the MT generator demonstrated approximately 18% faster computation time compared to JR and about 27% faster compared to RL, highlighting its superior efficiency and significant advantage in simulation performance.

4. Discussion

Our analysis of the dose profiles, PDDs, dose distributions in voxelized water phantoms, and event frequencies revealed significant variations between the use of different generators. The results obtained by the use of MT showed an accuracy superior to the other two generators in this MC simulation; more precisely, at the twilight zone of the dose profile for large fields, this can be explained by the fact that the X-ray beam produced by this generator is harder than that produced by JR and RL since the primary electron flux produced was large, highlighting the impact of the high number of primary particles generated and knowing that their interaction with the target inside the accelerator head for the production of X-rays generates a localized heating of the target, which directly affects the quality of the X-rays produced. Therefore, this aspect also influences the overall quality of the product beam, impacting the dose distribution.
The gamma index analysis confirmed the consistency between the calculated and experimental dose distributions, with MT showing superior performance, especially for the 10 × 10 cm2 fields, meeting the standards of the literature. Statistical analysis of the dose distribution throughout the water tank for a 10 × 10 cm2 field opening showed minimal differences between the PRNG, increasing confidence in the reliability of the generated dose profiles and PDDs. Bland–Altman plots showed significant concordance ranges, with about 18% of data points outside these boundaries. The normal probability plots indicated deviations from a normal distribution. The analysis of the dose differences in voxelized water phantoms revealed disparities, particularly influenced by low dose averages. The values obtained from the dosimetric parameters dS, dmax (cm), D10 (%), d80 (cm), and TPR10,20 were acceptable for all the PRNGs used except that the value of TPR10,20 obtained by the MT generator was closest to that obtained experimentally.
In this study, the MT generator demonstrated the shortest simulation time, outperforming the JR generator by approximately 18% and the RL generator by about 27%. These results highlight MT’s superior computational efficiency, being nearly 20% faster than JR and approaching 30% faster than RL. The known rapid sampling of MT allowed the generation of a large flow of primary electron particles compared to JR and RL. This led to a significant multiplication of simultaneous particle trajectories, resulting in a large number of tracks and steps in the simulation. The integration of the PRNG at each stage of the simulation process, as outlined in our introduction, combined with the superior performance of the MT generator compared to other methods, resulted in an average reduction of 22.5% in simulation execution time.
Finally, our analysis highlights the advantages of MT for fast particle generation and trajectory tracking. This work has shown that the choice of PRNG can have a significant impact on simulated dose distributions, highlighting the need for careful selection to ensure accurate treatment planning.
This study underscores the crucial role of pseudo-random number generators (PRNGs) in Monte Carlo simulations for radiotherapy, while also recognizing certain limitations. The analysis was focused on specific field sizes (10 × 10 cm2 to 40 × 40 cm2) and relied on a voxelized water phantom, which, although standard, does not fully capture the complexity of patient anatomy. Additionally, the simulations were performed on a specific high-performance computing platform, which may affect the applicability of the results to other systems. Nonetheless, this work provides strong evidence of the clear advantages of the MT generator, achieving up to 27% faster computation times compared to other generators while maintaining accuracy. These findings demonstrate the potential of MT to streamline treatment planning processes, making it a valuable tool for clinical applications. Future research could expand on these results by exploring higher-energy beams, incorporating patient-specific geometries, and integrating emerging technologies such as artificial intelligence and hybrid simulation methods. Developing practical guidelines for PRNG selection based on specific clinical needs would further enhance the impact of this approach, ensuring more efficient and accurate radiotherapy simulations.
These results have important clinical implications for Monte Carlo dose calculation in radiotherapy. Since Monte Carlo simulations are widely considered the gold standard for accurate dose calculation, ensuring computational efficiency and dosimetric accuracy remains a major challenge. Our results demonstrate that the choice of PRNG influences not only the accuracy of dose distributions but also the overall efficiency of the simulation process. This is particularly relevant in adaptive radiotherapy, where frequent dose recalculations are required to account for anatomical variations throughout the treatment. Faster and more reliable Monte Carlo simulations could improve real-time treatment plan verification, making these advanced techniques more accessible in clinical practice.
Furthermore, the observed differences between PRNGs highlight the need for a rigorous selection process in Monte Carlo treatment planning systems, particularly for techniques involving high dose gradients and complex field modulation, such as IMRT and VMAT. Because these methods require high statistical accuracy, PRNG variability could introduce subtle but significant differences in dose calculations. Future research should explore patient-specific simulations incorporating heterogeneous anatomical structures to assess the influence of PRNG selection on dose accuracy in realistic clinical scenarios. Furthermore, evaluating PRNG performance in different computing environments, such as GPU-based Monte Carlo simulations, could optimize the tradeoff between accuracy and efficiency.
Ultimately, this study reinforces the need for standardized guidelines for PRNG selection for Monte Carlo simulations in radiotherapy. As Monte Carlo approaches evolve, the introduction of hybrid Monte Carlo methods, artificial intelligence-based variance reduction techniques, and well-defined sampling algorithms could further improve simulation performance. By refining the choice of PRNG based on specific clinical applications, such as stereotactic radiosurgery (SRS), proton therapy, and FLASH radiotherapy, Monte Carlo-based dose calculations can become more accurate and efficient, ensuring better treatment precision and integration into the radiotherapy workflow.

5. Conclusions

This in-depth study of pseudo-random number generators (PRNGs) within the GATE MC toolkit for radiotherapy simulations in 6 MV mode highlights both their equivalences and distinctions. While the Mersenne Twister (MT), James-Random (JR), and Ranlux-64 (RL) generators exhibit similar performance in terms of dose profiles, percentage depth doses (PDDs), and other dosimetric parameters, MT consistently excels in computational efficiency and trajectory tracking. Specifically, MT demonstrated reductions in computation time of approximately 18% compared to JR and 27% compared to RL, underscoring the significant impact of PRNG selection on simulation efficiency.
These results provide strong evidence of MT’s superior capacity for the rapid generation of initial particles and effective tracking of trajectories, making it a key asset for accurate and efficient treatment planning in radiotherapy. Moreover, the substantial differences in simulation time management observed in this study emphasize the critical importance of judicious PRNG selection, particularly in clinical workflows where efficiency and reliability are paramount.
Beyond the scope of this work, these findings open avenues for further exploration, including the integration of PRNGs into advanced computational frameworks such as hybrid Monte Carlo methods and AI-driven algorithms as well as their application to more complex clinical scenarios, such as patient-specific geometries and higher energy beams. This study not only provides valuable guidance for the informed selection of PRNGs but also establishes a foundation for improving simulation reliability and reproducibility, ultimately enhancing treatment planning and patient outcomes in radiotherapy.

Author Contributions

Conceptualization, M.T. and E.M.E.; Software, M.T.; Validation, M.K.; Formal analysis, M.T.; Investigation, O.K.; Writing—original draft, M.T.; Writing—review & editing, M.R.M.; Visualization, A.K.; Supervision, A.K.; Project administration, S.S.; Funding acquisition, M.K. All authors have read and agreed to the published version of the manuscript.

Funding

This research received no external funding.

Data Availability Statement

The data supporting the findings of this study were collected and analyzed as part of clinical routine or research measurements. They are not publicly available due to institutional restrictions but can be made available from the corresponding author upon reasonable request and with permission from the institution.

Acknowledgments

The computation for this calculation was aided by the computational resources of HPC-MARWAN (www.mawan.ma/hpc (accessed on 21 March 2025)), which were supplied by the National Center for Scientific and Technical Research (CNRST) in Rabat, Morocco.

Conflicts of Interest

The authors declare that there is no conflict of interest.

References

  1. Simulation Monte Carlo: Méthodes, Évaluation et Applications—Nova Science Publishers. Consulté le: 20 Février 2024. [En ligne]. Available online: https://novapublishers.com/shop/monte-carlo-simulation-methods-assessment-and-applications/ (accessed on 21 March 2025).
  2. Carl, G.; Denis, T. Simulation Stochastique et Methodes de Monte Carlo; Les Editions de l’Ecole Polytechnique: Paris, France, 2011. [Google Scholar]
  3. Sempau, J.; Acosta, E.; Baro, J.; Fernández-Varea, J.; Salvat, F. An algorithm for Monte Carlo simulation of coupled electron-photon transport. Nucl. Instrum. Methods Phys. Res. Sect. B Beam Interact. Mater. Atoms 1997, 132, 377–390. [Google Scholar] [CrossRef]
  4. Shields, J. Une Revue des Méthodes de Monte Carlo et de Leur Application en Physique Médicale Pour Simuler le Transport de Rayonnements. [En ligne]. Available online: https://scholars.unh.edu/honors/657 (accessed on 21 March 2025).
  5. Joao, S.; Frank, V.; Joao, S.; Frank, V. Monte Carlo Techniques in Radiation Therapy Applications to Dosimetry, Imaging, and Preclinical Radiotherapy, 2nd ed.; CRC Press: Boca Raton, FL, USA, 2013. [Google Scholar]
  6. Andreo, P. Monte Carlo simulations in radiotherapy dosimetry. Radiat. Oncol. 2018, 13, 121. [Google Scholar] [CrossRef] [PubMed]
  7. Sparapani, R. Random Number Generation and Monte Carlo Methods (2nd Edition). J. Stat. Softw. 2004, 11, 1–2. [Google Scholar] [CrossRef]
  8. Coddington, P.D. Analysis of Random Number Generators Using Monte Carlo Simulation. Int. J. Mod. Phys. C 1994, 5, 547–560. [Google Scholar] [CrossRef]
  9. Click, T.H.; Liu, A.; Kaminski, G.A. Quality of random number generators significantly affects results of Monte Carlo simulations for organic and biological systems. J. Comput. Chem. 2011, 32, 513–524. [Google Scholar] [CrossRef] [PubMed]
  10. Demchik, V. Pseudo-random number generators for Monte Carlo simulations on ATI Graphics Processing Units. Comput. Phys. Commun. 2011, 182, 692–705. [Google Scholar] [CrossRef]
  11. Vattulainen, I.; Kankaala, K.; Saarinen, J.; Ala-Nissila, T. A comparative study of some pseudorandom number generators. Comput. Phys. Commun. 1995, 86, 209–226. [Google Scholar] [CrossRef]
  12. James, F. A review of pseudorandom number generators. Comput. Phys. Commun. 1990, 60, 329–344. [Google Scholar] [CrossRef]
  13. Sepehri, F.; Hajivaliei, M.; Rajabi, H. Selection of random number generators in GATE Monte Carlo toolkit. Nucl. Instrum. Methods Phys. Res. Sect. A Accel. Spectrometers Detect. Assoc. Equip. 2020, 973, 164172. [Google Scholar] [CrossRef]
  14. Hill, J.; Sawilowsky, S. Bias in Monte Carlo Simulations Due To Pseudo-Random Number Generator Initial Seed Selection. Theoretical and Behavioral Foundations of Education Faculty Publications, May 2011. [En ligne]. Available online: https://digitalcommons.wayne.edu/coe_tbf/3 (accessed on 21 March 2025).
  15. Deng, L.-Y.; Guo, R.; Lin, D.K.; Bai, F. Improving Random Number Generators in the Monte Carlo simulations via twisting and combining. Comput. Phys. Commun. 2008, 178, 401–408. [Google Scholar] [CrossRef]
  16. Coddington, P.D. Tests of Random Number Generators Using Ising Model Simulations. Int. J. Mod. Phys. C 1996, 7, 295–303. [Google Scholar] [CrossRef]
  17. Hongo, K.; Maezono, R.; Miura, K. Random number generators tested on quantum Monte Carlo simulations. J. Comput. Chem. 2010, 31, 2186–2194. [Google Scholar] [CrossRef] [PubMed]
  18. Tantaoui, M.; Krim, M.; Ghazi, I.; Sobhy, Z.; Kaanouch, O.; Kartouni, A.; Sahraoui, S. Optimization of the calculation time in simulation using the GATE/GEANT4 Monte Carlo of radiotherapy treatment plans for small fields. E3S Web Conf. 2021, 297, 01047. [Google Scholar] [CrossRef]
  19. Grevillot, L.; Frisson, T.; Maneval, D.; Zahra, N.; Badel, J.-N.; Sarrut, D. Simulation of a 6 MV Elekta Precise Linac photon beam using GATE/GEANT4. Phys. Med. Biol. 2011, 56, 903–918. [Google Scholar] [CrossRef] [PubMed]
  20. Kawrakow, I.; Rogers, D.W.O.; Walters, B.R.B. Large efficiency improvements in BEAMnrc using directional bremsstrahlung splitting. Med. Phys. 2004, 31, 2883–2898. [Google Scholar] [CrossRef] [PubMed]
  21. Matsumoto, M.; Nishimura, T. Mersenne twister: A 623-dimensionally equidistributed uniform pseudo-random number generator. ACM Trans. Model. Comput. Simul. 1998, 8, 3–30. [Google Scholar] [CrossRef]
  22. L’Ecuyer, P. History of uniform random number generation. In Proceedings of the 2017 Winter Simulation Conference (WSC), Las Vegas, NV, USA, 3–6 December 2017; IEEE: Piscataway, NJ, USA, 2017; pp. 202–230. [Google Scholar] [CrossRef]
  23. AIEA. International Atomic Energy Agency, Absorbed Dose Determination in External Beam Radiotherapy; Technical Reports Series, no. 398; AIEA: Vienne, France, 2000. [Google Scholar]
  24. Low, D.A.; Harms, W.B.; Mutic, S.; Purdy, J.A. A technique for the quantitative evaluation of dose distributions. Med. Phys. 1998, 25, 656–661. [Google Scholar] [CrossRef] [PubMed]
  25. Validation of Monte Carlo Simulation of 6 MV Photon Beam Produced by Varian Clinac 2100 Linear Accelerator Using Beamnrc Code and Dosxyznrc Code|PDF|Gamma Ray|Radiation Therapy. [En ligne]. Available online: https://fr.scribd.com/document/549916162/s-154747711705003-x (accessed on 20 February 2024).
  26. Toward a Better Understanding of the Gamma Index: Investigation of Parameters with a Surface-Based Distance Method—PMC. [En ligne]. Available online: https://www.ncbi.nlm.nih.gov/pmc/articles/PMC3298565/ (accessed on 27 February 2024).
  27. Altman, D.G.; Bland, J.M. Measurement in Medicine: The Analysis of Method Comparison Studies. J. R. Stat. Soc. Ser. D (Stat.) 1983, 32, 307–317. [Google Scholar] [CrossRef]
  28. Chetty, I.J.; Rosu, M.; Kessler, M.L.; Fraass, B.A.; Haken, R.K.T.; Kong, F.-M.; McShan, D.L. Reporting and analyzing statistical uncertainties in Monte Carlo–based treatment planning. Int. J. Radiat. Oncol. Biol. Phys. 2006, 65, 1249–1259. [Google Scholar] [CrossRef] [PubMed]
Figure 1. Geometric characterization of CLINAC 2100 VARIAN head in photon mode using a water phantom (image is not at full scale).
Qubs 09 00016 g001
Figure 2. Comparison of dose profiles from experiment and simulations at a depth of 1.5 cm using MT, JR, and RL PRNGs at different field apertures: (a) 10 × 10 cm2, (b) 20 × 20 cm2, (c) 30 × 30 cm2, and (d) 40 × 40 cm2.
Qubs 09 00016 g002
Figure 3. Comparison of PDDs from experiment and simulations using MT, JR, and RL PRNGs at different field apertures: (a) 10 × 10 cm2, (b) 20 × 20 cm2, (c) 30 × 30 cm2, and (d) 40 × 40 cm2.
Qubs 09 00016 g003
Figure 4. The normal probability versus normality plot of the comparison between the voxel absorbed dose with different PRNGs in the voxelized water phantom between (a) JR and MT (b) JR and RL (c) MT and RL.
Qubs 09 00016 g004
Figure 5. The Bland–Altman plots between the absorbed doses in the voxelized water phantom derived with different PRNGs (a) JR and MT (b) JR and RL (c) MT and RL.
Qubs 09 00016 g005
Figure 6. Comparison of PPS, TPS, and SPS for MT, JR, and RL simulations.
Qubs 09 00016 g006
Table 1. The gamma index values obtained by the PRNGs JR, RL, and MT for each field opening.
Radiation FieldsPRNG2%/2 mm3%/2 mm3%/3 mm
ProfilPDDProfilPDDProfilPDD
10 × 10 cm2MT95.33%96.12%96.02%99.52%99.81%99.82%
JR94.67%95.75%95.99%97.35%96.74%98.35%
RL95.98%95.31%93.67%95.87%97.32%97.90%
20 × 20 cm2MT92.86%95.93%93.83%94.71%94.83%96.71%
JR91.04%91.73%91.93%93.01%92.72%95.01%
RL93.67%92.42%93.12%92.97%93.12%96.97%
30 × 30 cm2MT93.56%93.88%95.62%95.88%95.62%97.94%
JR92.78%94.91%93.85%94.91%93.50%96.86%
RL93.49%96.30%93.56%96.30%94.03%97.36%
40 × 40 cm2MT93.11%94.91%93.73%96.91%98.87%97.85%
JR91.23%93.78%92.04%95.78%97.65%96.26%
RL93.28%94.78%93.34%94.78%98.41%97.77%
Table 2. The values of the dosimetric parameters were obtained experimentally and by the MT, RL, and JR generators.
dSdmax (cm)D10 (%)d80 (cm) TPR10,20
Experimental53.151.4066.586.520.66
MT53.051.3466.476.450.65
Difference
δ (%)
<0.1<0.1<0.2<0.1<0.1
JR53.181.3166.396.500.63
Difference
δ (%)
<0.1<0.1<0.2<0.1<0.1
RL53.011.5666.376.540.64
Difference
δ (%)
<0.2<0.2<0.2<0.1<0.1
Disclaimer/Publisher’s Note: The statements, opinions and data contained in all publications are solely those of the individual author(s) and contributor(s) and not of MDPI and/or the editor(s). MDPI and/or the editor(s) disclaim responsibility for any injury to people or property resulting from any ideas, methods, instructions or products referred to in the content.

