Abstract
Proton therapy is increasingly widespread and requires an accelerator to provide the high energy protons. Most often, the accelerators used for proton therapy are cyclotrons and the maximum initial beam energy (MIBE) is about 230 MeV or more to be able to achieve a range of approximately 30 cm in water. We ask whether such a high energy is necessary for adequate dosimetry for pathologies to be treated with proton beams. Eight patients of different clinical sites (brain, prostate, and head and neck cancers) were selected to conduct this study. We analyzed the tumor dose coverage and homogeneity, as well as healthy tissue protection for MIBE values of 120, 160, 180, 200 and 230 MeV. For each patient, a proton plan was developed using the particular MIBE and then using multifield optimization (MFO). In this way, 34 plans in total were generated to fulfill the unique clinical goals. This study found that MIBE of 120 MeV for brain tumors; 160 MeV for head and neck cancer; and remarkably, for prostate cancer, only 160 MeV for one patient case and 180 MeV for the remainder satisfied the clinical goals (words: 187 < approx. 200 words or less)
1. Introduction
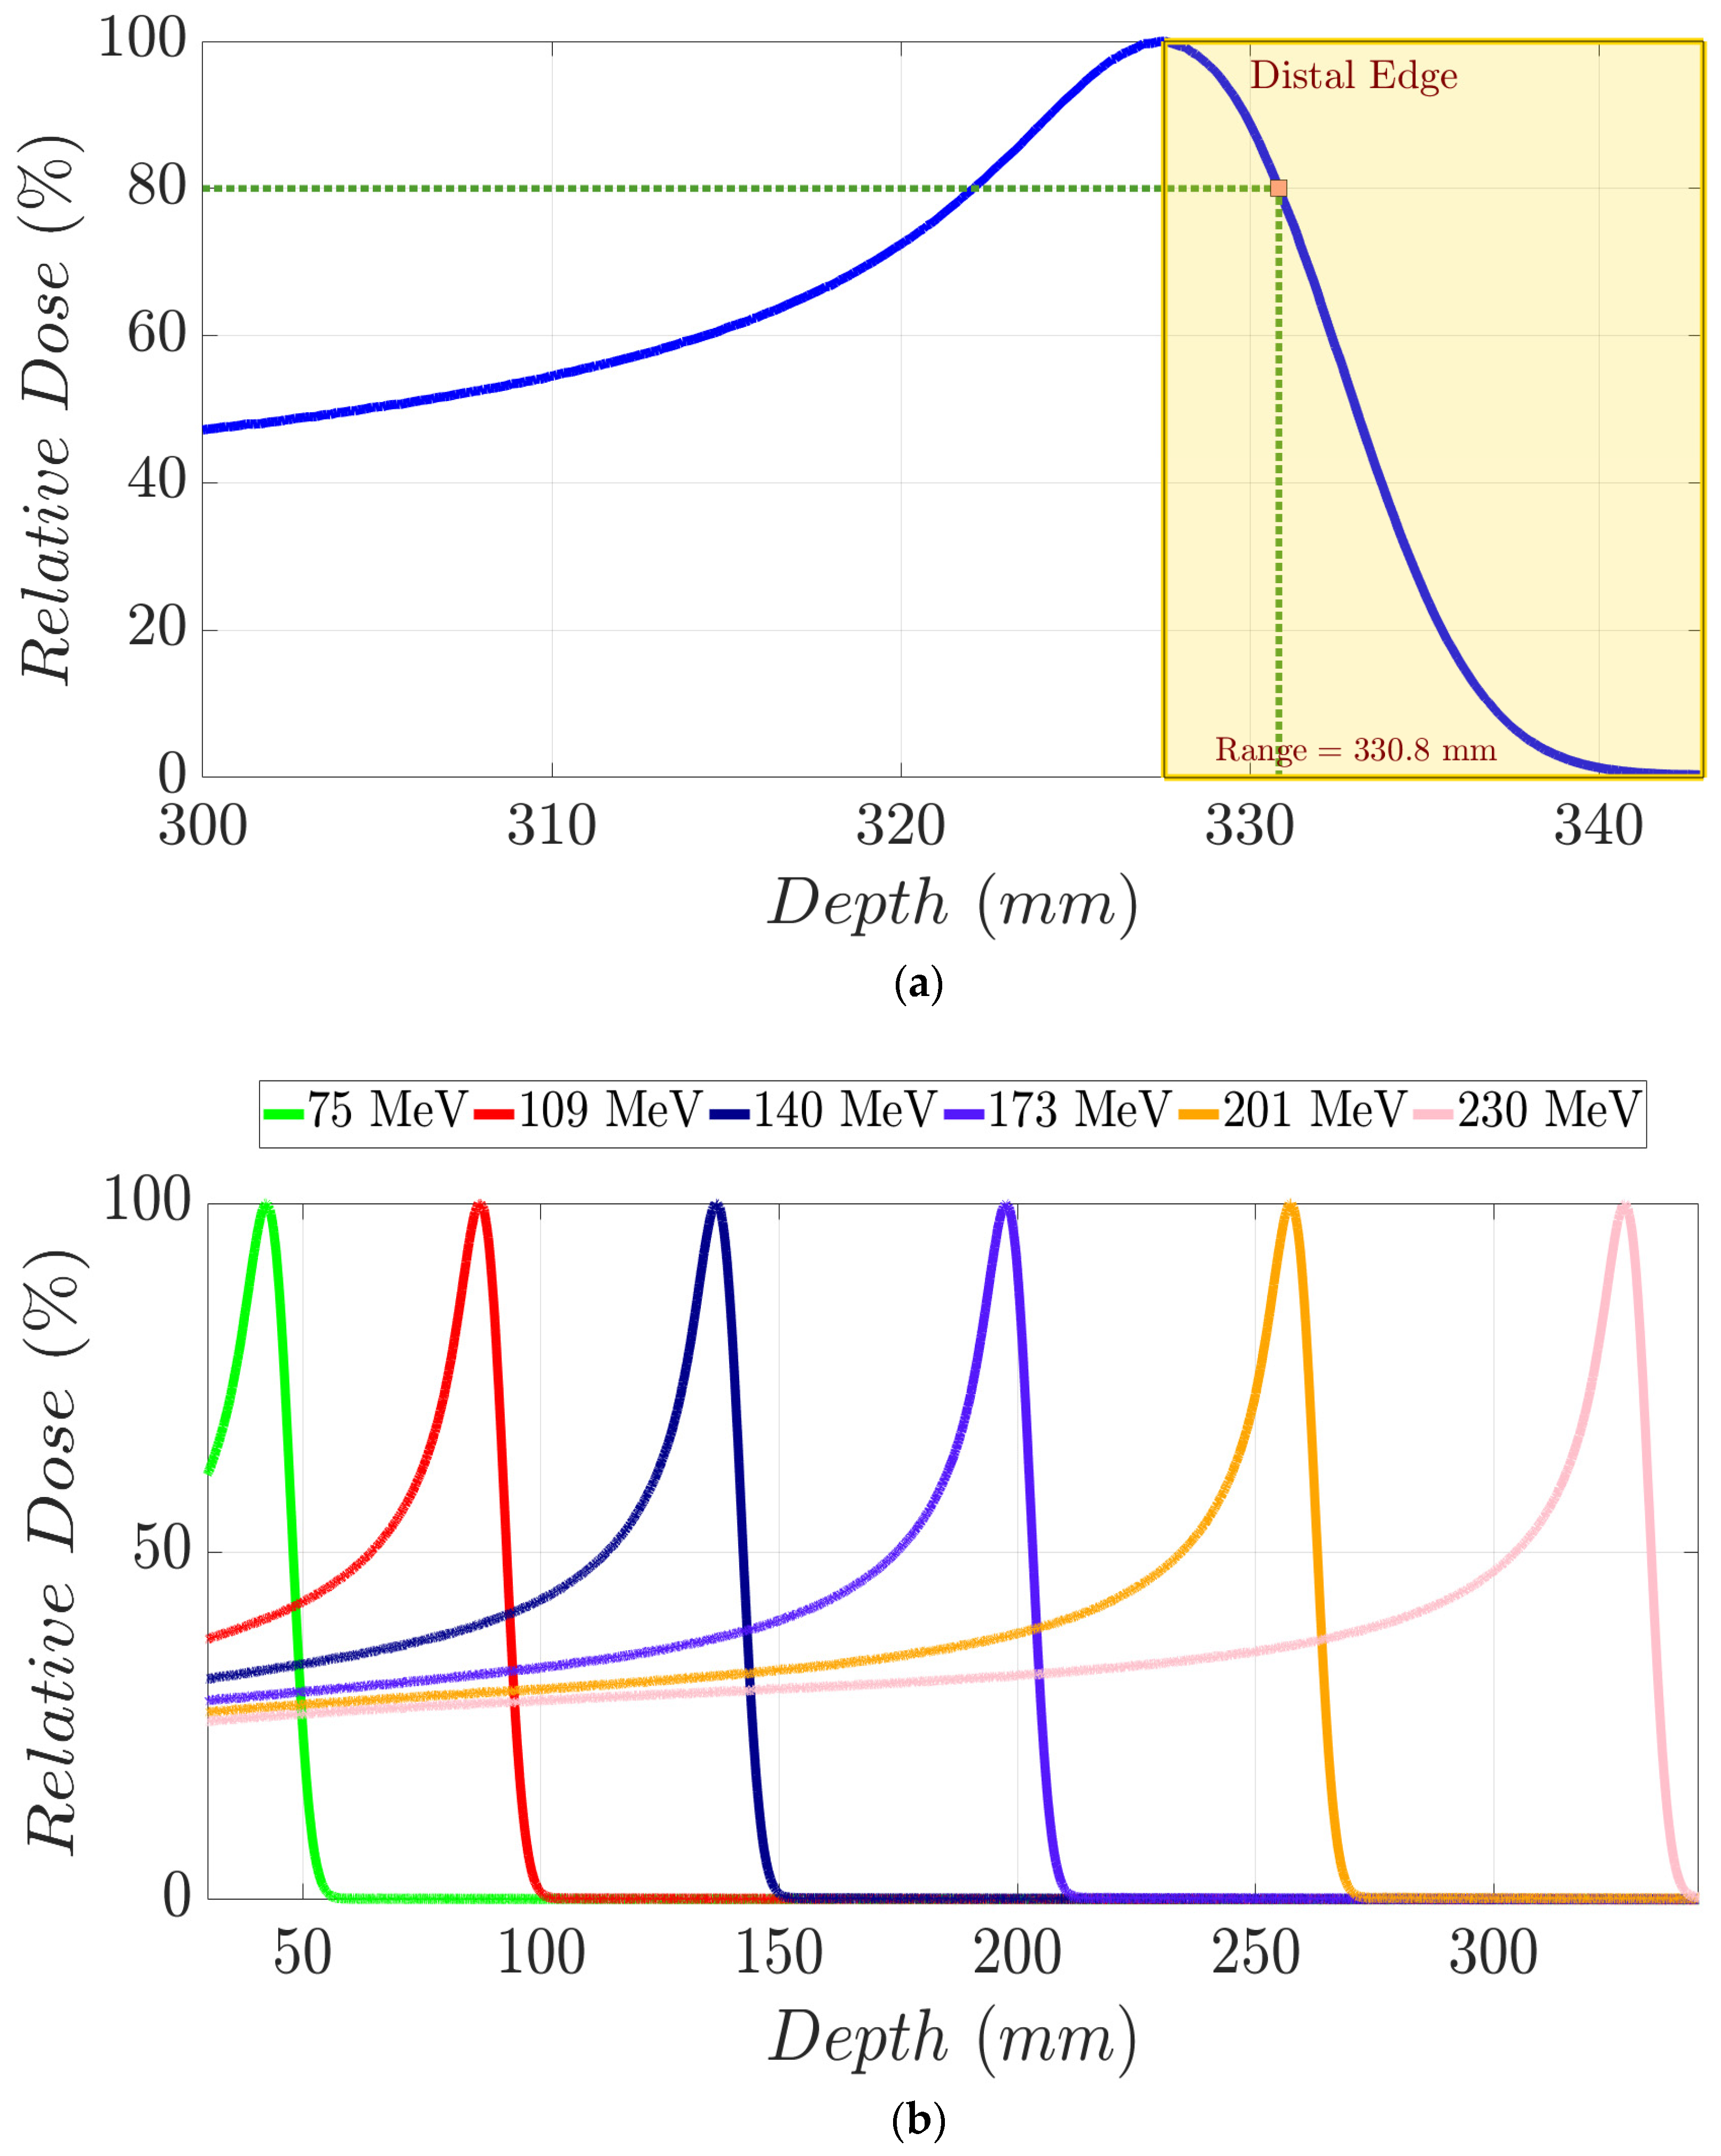
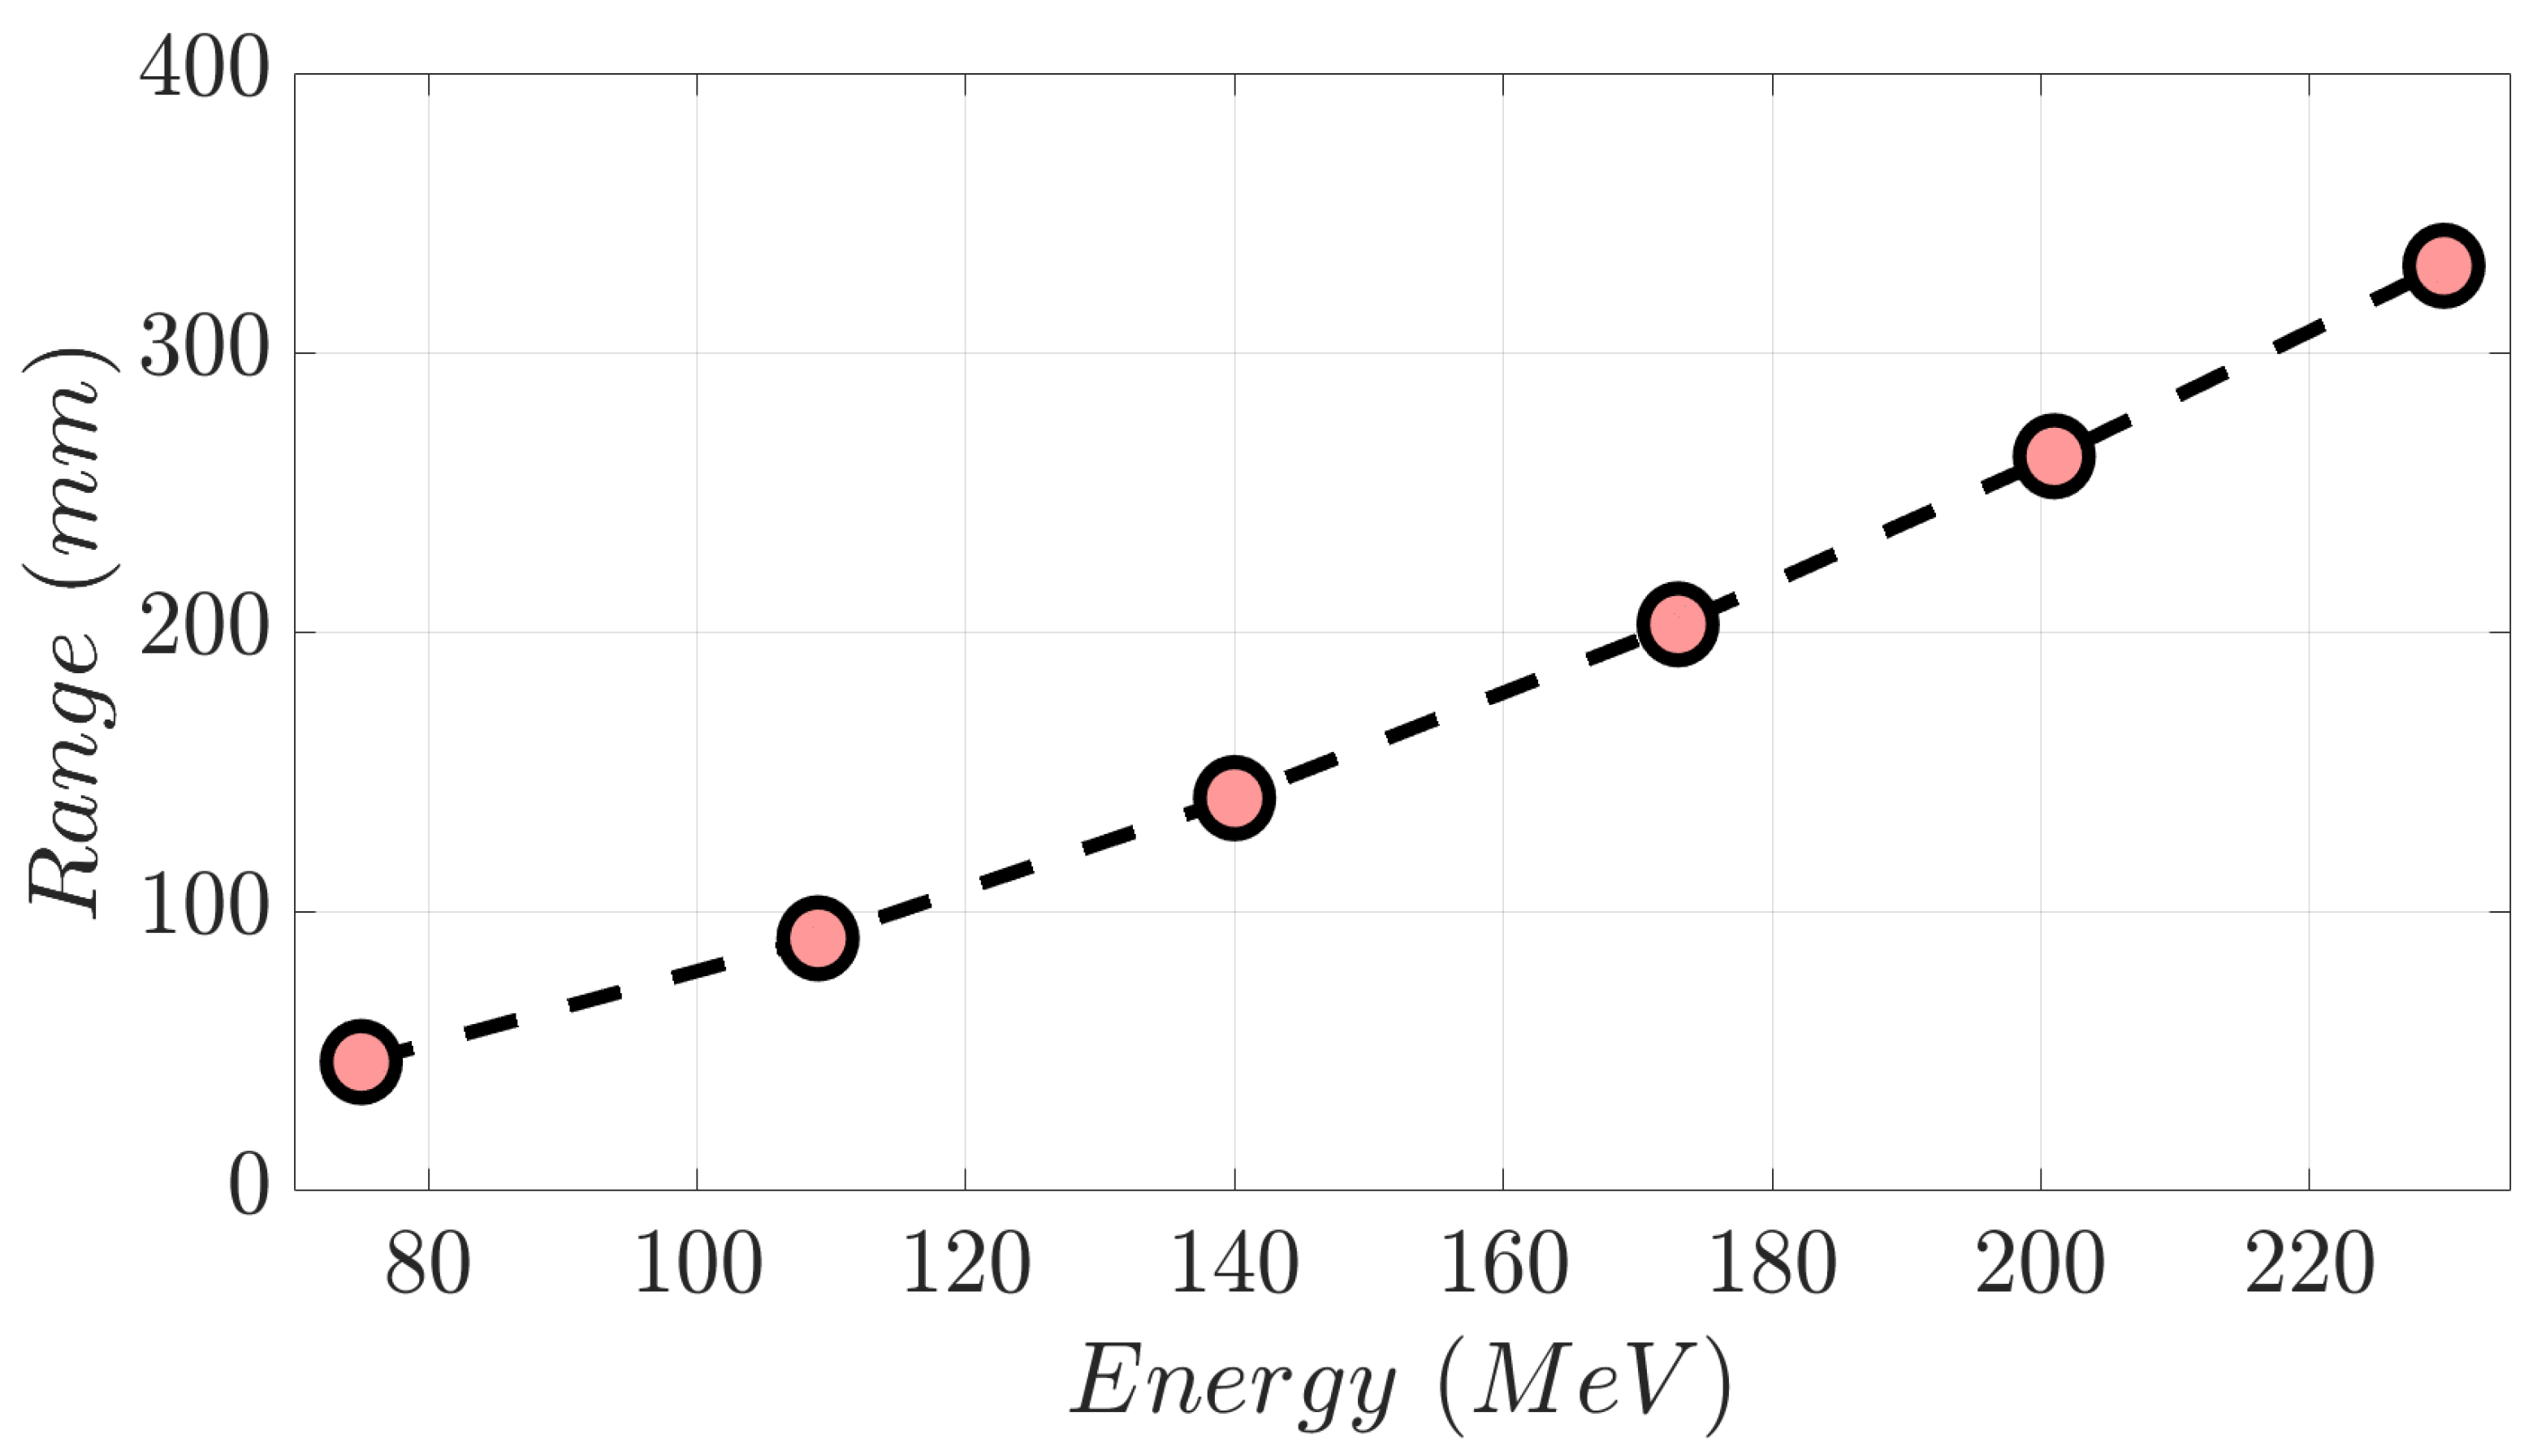
A monoenergetic proton beam presents the following mechanisms of interaction with matter: (1) coulomb scattering with atomic electrons; (2) coulomb scattering with atomic nuclei; (3) single hard scatters with a nucleus or components of it, resulting in nuclear interactions; and (4) bremsstrahlung [1]. As a consequence of these, there is a gradual decrement in beam energy as it moves in depth through matter. To clarify these concepts, in Figure 1a, we show the Integrated Depth Dose (IDD) curve in water of a 230 MeV monoenergetic proton beam. This degradation mentioned above continues until the generation of the Bragg peak (BP) area, where the dose to the medium rises abruptly. Beyond the BP maximum dose, the distal edge of the beam appears (yellow area in Figure 1a), in which the dose goes down to zero virtually. Range (d80%) in proton therapy is defined as depth in a distal edge where the dose is 80% of the maximum BP dose [1]. As shown in Figure 1b, an increment in proton energy results in a bigger range. Specifically, monoenergetic proton beams with kinetic energy of 230 MeV, 201 MeV, 173 MeV, 140 MeV, 109 MeV, and 75 MeV present the following d80% values in water (Figure 2), respectively: 330.8 mm, 262.8 mm, 202.6 mm, 140.4 mm, 90.3 mm, and 46.1 mm [2]. A log–log relationship between range and energy is almost linear, so the dependence of d80% with energy can be approximated as a power law [1,3] as follows:
where coefficients a, b are obtained according to experimental data in water [2].
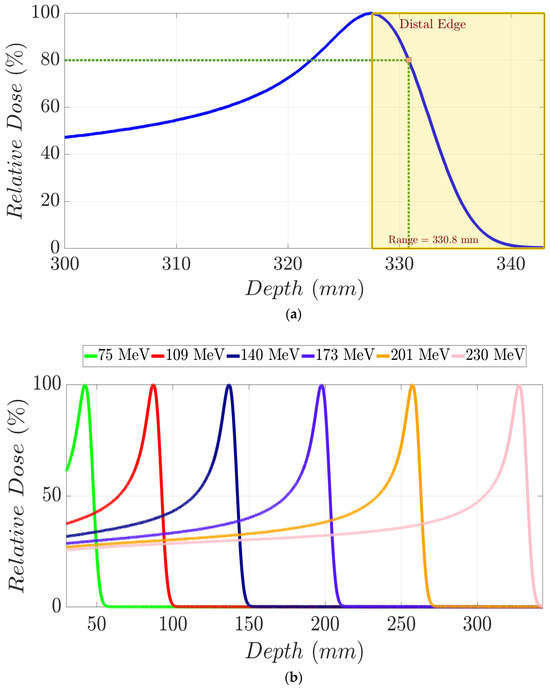
Figure 1.
(a) IDD curve for a 230 MeV proton beam in water. Yellow dashed area represents the distal edge region of the beam from which the dose decreases from the maximum to a zero net dose. Proton range (d80%) is graphically defined through the intersection of vertical and horizontal green dashed lines. (b) IDD curves in water for monoenergetic proton beams with distinct mean energies.
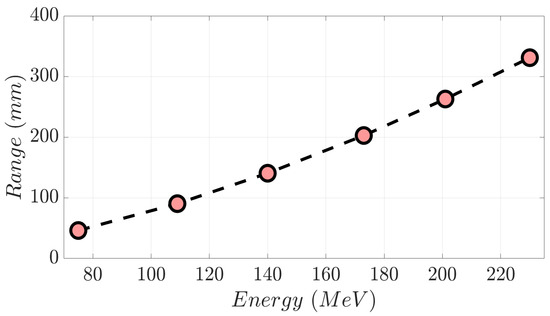
Figure 2.
Range versus proton beam energy from the selected monoenergetic beams displayed in Figure 1b.
The use of proton therapy to treat cancer patients has increased remarkably in the last two decades [4,5]. Its main advantage is dose sparing in healthy tissue compared with photon or electron beams while maintaining an adequate tumor coverage. Therapeutic proton beams are the sum of monoenergetic beams with an energy range from as low as 50 MeV to as high as 250 MeV. Because of the relationship between energy and range, tumors located in different depths are treated by selecting the proper beam energies for it. Therefore, proton accelerators are designed using some type of energy selection system (ESS) to be able to deliver an energy range suitable for the treatment of cancer patients [6]. In addition to this, we note that some special fixed beam lines have relatively lower energy as the maximum energy, for instance, 62 MeV, to reach the proper tumor depth for ocular treatments [7].
The proton beam energy, , is related to its momentum, , and mass, , in a straightforward manner [8]:
where is the speed of light.
The magnetic rigidity, , which is the product of the magnetic field in units of Tesla and the magnet radius in meters, is related to the proton momentum as follows [8]:
There is a relentless motivation to improve the cost-effectiveness of proton therapy [9], which also includes investigations of gantry-less treatments [10]. The viability and improvement of proton therapy cost-effectiveness is a concept that has been a subject of much discussion [11,12,13,14]. Decreasing the accelerator dimensions, is a key factor in reducing the economic outlay in a proton therapy facility. The accelerators experience a remarkable miniaturization (decreasing in ) in their designs. This enhancement is primarily because of the transition from room-temperature to low-temperature superconducting magnet technology while maintaining the same maximum proton momentum. One of the attributes which could enable the proton accelerators’ continued miniaturization is considering a reduction in the maximum proton momentum for the same magnetic field strength. The maximum initial beam energy (MIBE) is related to as follows:
Several studies [15,16,17,18] have analyzed MIBE, highlighting its relevance in proton therapy. According to these studies, a lower value than 230–250 MeV for MIBE is possible without compromising clinical quality. Goitien et al., 1985 [15] conducted a tumor-specific retrospective analysis of the proton beam incursion in treated choroidal melanoma patients. This incursion was defined as a 90% isodose depth. That study concluded that a beam energy between 55 MeV and 60 MeV was necessary to properly treat this kind of tumor. Moyers and Miller 2003 [16] performed an examination of the range, field size, and modulation of treatment plans corresponding to prostate cancer patients. A 290 mm range was considered sufficient to ensure the irradiation of the tumor’s distal edge. Hence, a MIBE of approximately 213 MeV was needed to fulfill this technical requirement using a beam scanning system. Sengbusch et al., 2009, 2011 [17,18] claimed in their geometric study that it was possible to treat most of the cancer patients evaluated with a maximum proton beam energy between 198 and 207 MeV. A variety of different sites were included in their work: specifically, breast, head and neck, brain, pelvis, and prostate cancer patients. Their assessment was conducted in terms of the equivalent pathlength in water to be crossed by a proton beam. In this way, brain tumors demanded a 118 MeV beam energy, while distal tumors such as prostate cancer required higher values up to 200 MeV.
To our knowledge, the effect of MIBE on treatment planning system (TPS)-optimized patient dose distributions has not been previously published. To accomplish this assessment, we set MIBE values below 230 MeV in the TPS and then optimized a spot distribution which satisfied the clinical goals for each patient. The achievement of these clinical aims implies a decrease in the current high energy demands for proton therapy. Moreover, the needs of neutron shielding and maintenance of proton therapy unit would be lower. This is due to the fact that neutron production is lower for a reduced MIBE that is lower than 230–250 MeV [17]. A decrease in the amount of required neutron shielding also has implications for cost reductions for proton therapy.
The goal of this study is to demonstrate that a lower MIBE is still consistent with viable, but likely more cost-effective, proton therapy. To accomplish this task, we replanned real clinical cases with increasingly reduced MIBE to find the minimum MIBE that satisfies the clinical goals. An evaluation of dose distributions in head and neck, prostate, and brain cancer patients was performed for different MIBE selections. For each case, metrics of tumor volumes and organs at risk (OARs) were evaluated to quantify the usefulness of a proton plan using a specific MIBE.
2. Materials and Methods
2.1. Monte Carlo Beam Line Simulations
We defined a generic proton pencil beam scanning (PBS) therapy unit in TPS using Monte Carlo (MC)-generated IDDs and spot profiles from Geant4 toolkit version 10.6 [19,20,21]. Its properties are for a generic cyclotron accelerator. GEANT4 simulations were carried out for monoenergetic proton beams from the MIBE initial value down to 40 MeV. Therefore, a specific beam line was constructed for each of the MIBE values in the assessed range of this work, i.e., 120 MeV, 160 MeV, 180 MeV, 200 MeV, and 230 MeV. The monoenergetic beams were stepped in range in approximately 5 mm steps, assuming a cyclotron like energy degrader. The G4EM STANDARD OPT3 package was selected to calculate the electromagnetic processes involved, and hadronic physics was modeled according to the QGSP_BIC_HP physics list. Production cuts for secondary particle generation were set to 0.01 mm.
We simulated 107 events in a cubic phantom presenting a volume of 80 × 80 × 80 cm3 and filled with water (density = 0.997 g/cm3) to calculate IDD curves. Dose scoring was performed by means of cylindrical volumes 10 cm in diameter with thicknesses of 100 μm. The total length of the cylindrical mesh, defined inside the water tank, was set up according to the theoretical range of the incident proton beam in water. For spot size calculations, water volumes of 10 × 10 × 0.3 cm3 were placed in air along the beam pathlength. Specifically, these volumes were placed at the following depths: isocenter − 20 cm; isocenter − 10 cm; isocenter; isocenter + 10 cm; and isocenter + 20 cm. Cubic meshes of 10 × 10 × 0.1 cm3, with a 0.2 × 0.2 × 0.1 cm3 voxel size, for dose scoring were positioned inside each of these water volumes. In addition to this, lateral dose profiles were acquired to determine the spot size at each depth mentioned above.
The IDD curves obtained in water and the spot sizes calculated in air per energy were imported into the TPS, attending to the original mean energy of the proton beam. In this way, we defined a beam line per each of the MIBE values we employed in this work. This study was determined to be exempt from the requirement for IRB approval (45 CFR 46.104d, category 4) by the Institutional Review Board of Mayo Clinic (IRB# 22-013357) on 27 February 2023.
2.2. Treatment Planning System Modelling and Case Preparations
The established model allows a particular fixed MIBE for proton therapy planning. Permissible MIBE values are 120, 160, 180, 200, and 230 MeV. The justification for the range definition is as follows: Energies below 120 MeV compromise the range in water [3] needed to reach minimum adequate depths in brain patients. In the cases of prostate and head and neck patients, this energy threshold is 160 MeV for the same reason.
For the purpose of our study, 2 brain cancer patients, 4 prostate cancer patients, and 2 head and neck cancer patients were selected. CT scan and RT-struct dicom files were anonymized, exported, and reimported in the TPS. For each value of the MIBE range, an intensity-modulated proton plan (IMPT) was developed for all studied clinical cases. Equal weighted discrete beam angles around the patient were employed. A multi-field optimization (MFO) for a pencil beam scan mode (PBS) was selected in the TPS to fulfill the individual clinical goals. A template treatment plan was developed to facilitate the automation of the workflow. Essentially, 18 angles spaced 20 degrees apart, from 181 to 160 degrees in the clockwise direction, constituted this template. Distinct dose–volume metrics for treatment planning volume (PTV) and OARs were appraised based on the location. In addition to this, dose–volume histogram (DVH) comparison was carried out individually per patient including all the developed treatment plans.
2.3. Brain Patients’ Treatment Plans
Two patients with brain metastasis were evaluated. A dose prescription of 40 Gy in 10 fractions was defined in the first patient for a 3.7 cc tumor volume. The second patient presented a 0.9 cc tumor volume treated in a single fraction of 20 Gy [22]. V110% (%) and V98% (%) were subject to analysis for treatment planning volume (PTV) in both cases. In addition to this, we appraised the ensuing dosimetric factors for OARs: (a) maximum and mean dose for left and right eyes; (b) maximum and mean dose in brainstem; (c) maximum and mean dose for left and right optical nerves; (d) maximum and mean dose in optic chiasm; and (e) V90% (cc) and maximum dose in the brain.
2.4. Prostate Patients’ Treatment Plans
Patients affected with prostate cancer excluding the lymphatic nodes were assessed in our study. Patient 1 had a PTV volume of 100.7 cc, while patients 2 and 3 had PTV volumes of 142.4 cc and 223.5 cc, respectively. Patient 4 presented a right metal hip replacement and a PTV volume of 223.5 cc. Dose prescription was 36.25 Gy in 5 fractions, following the scheme suggested for a stereotactic ablative body radiotherapy (SABR) [23] in prostate cancer.
V107% (%) and V95% (%) in PTV were assessed for all treatment plans in each individual clinical case. Furthermore, we evaluated the following metrics for the OARs involved: (a) V100% (%), V95% (cc), V90% (%), V90% (cc), V80% (%), V50% (%) for the rectum; (b) V100% (cc), D5.5cc (Gy), V90% (%), V50% (%) for the bladder; (c) V40% (%) for femoral heads; and (d) V20Gy (cc) for the penile bulb.
2.5. Head and Neck Patients’ Treatment Plans
Both patients presented bilateral head and neck cancer, with a dose prescription of 70 Gy in 35 fractions for high-risk tumor volume PTVhigh risk [24]. A dose prescription of 63 Gy for intermediate-risk volume PTVint risk in 35 fractions was also defined. The volumes of each PTV per patient, respectively, were 516.1 cc and 1763.1 cc in the first case and 70.4 cc and 111.4 cc in the second case. The second patient also contained a low-risk volume PTVlow risk of 422.4 cc with a prescribed dose of 56 Gy.
V107% (%) and V98% (%) were analyzed for the PTVs. The OAR dose parameters were: (a) Maximum spinal cord dose; (b) mean dose in brainstem; (c) maximum and mean dose in left and right cochlea; (d) mean dose and V20Gy (%) for left and right parotids; (e) V64Gy (%) for mandible; (f) mean dose in lips; (g) mean dose in left and right submandibular gland; (h) V45Gy (%) for oral cavity; (i) mean dose in esophagus; (j) maximum dose in larynx; (k) maximum dose in thyroid; (l) maximum and mean dose in nasal cavity; and (m) maximum and mean dose in right and left mastoid.
3. Results
3.1. Brain Patients’ Treatment Plans
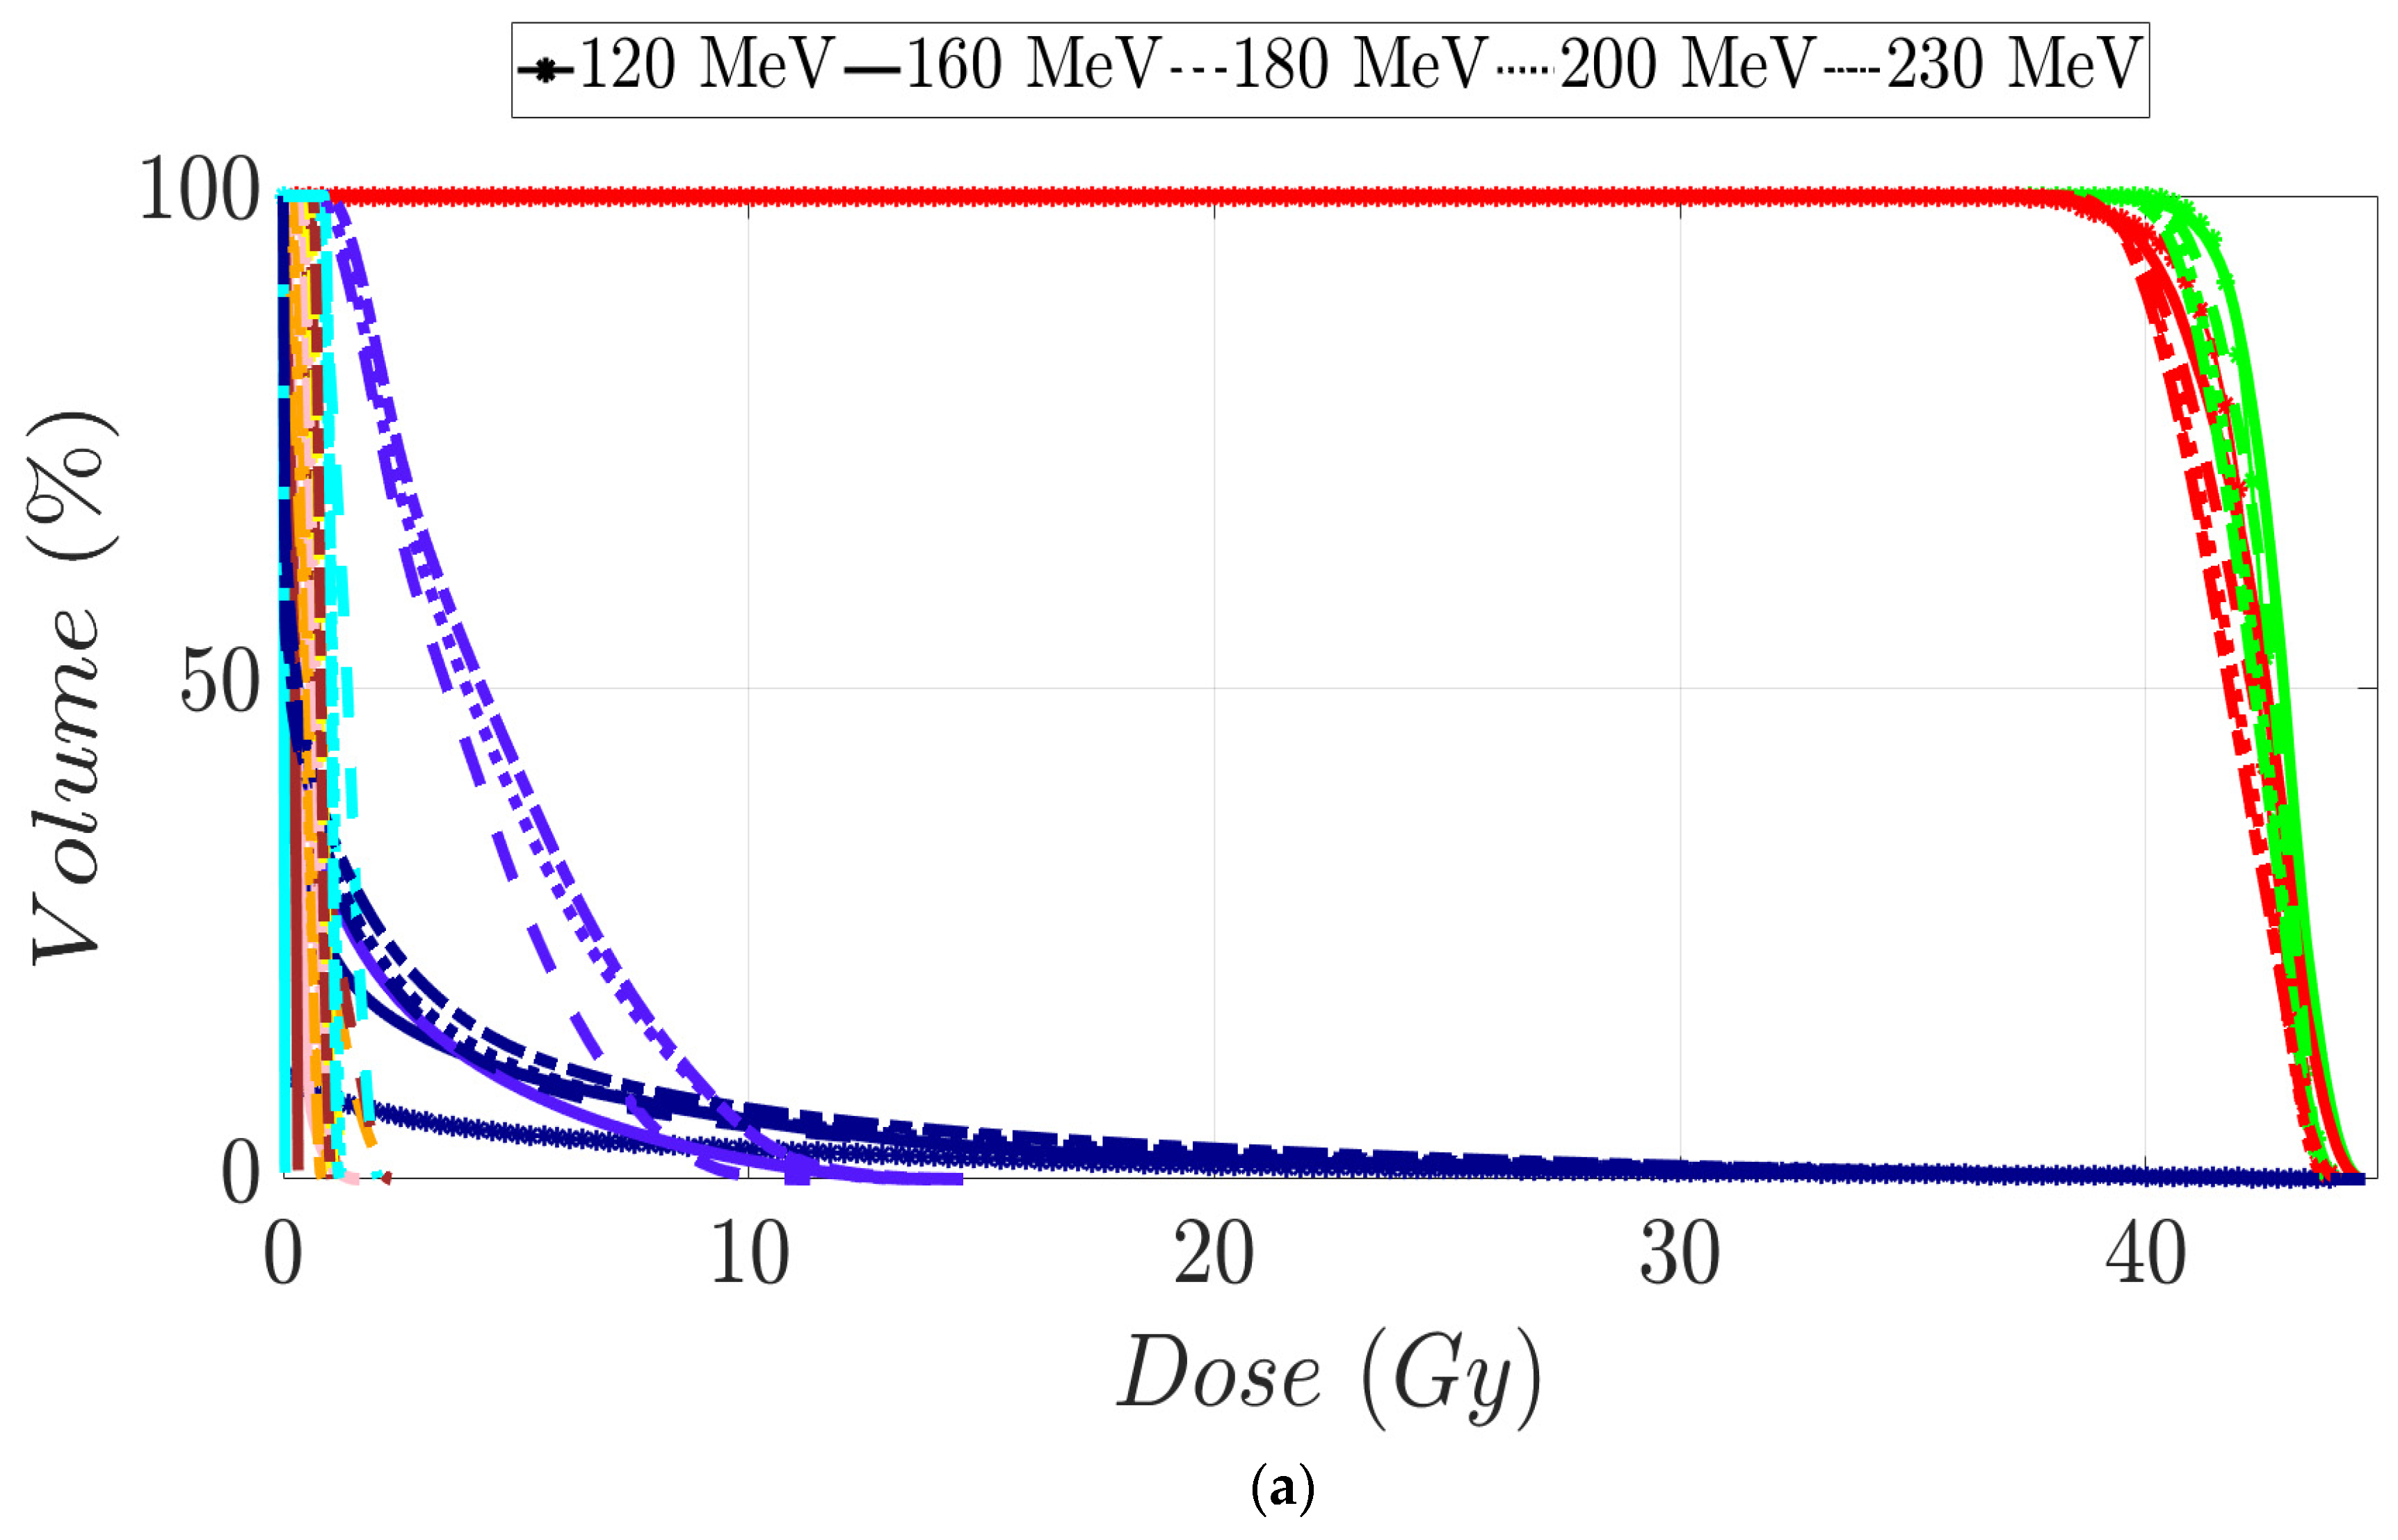
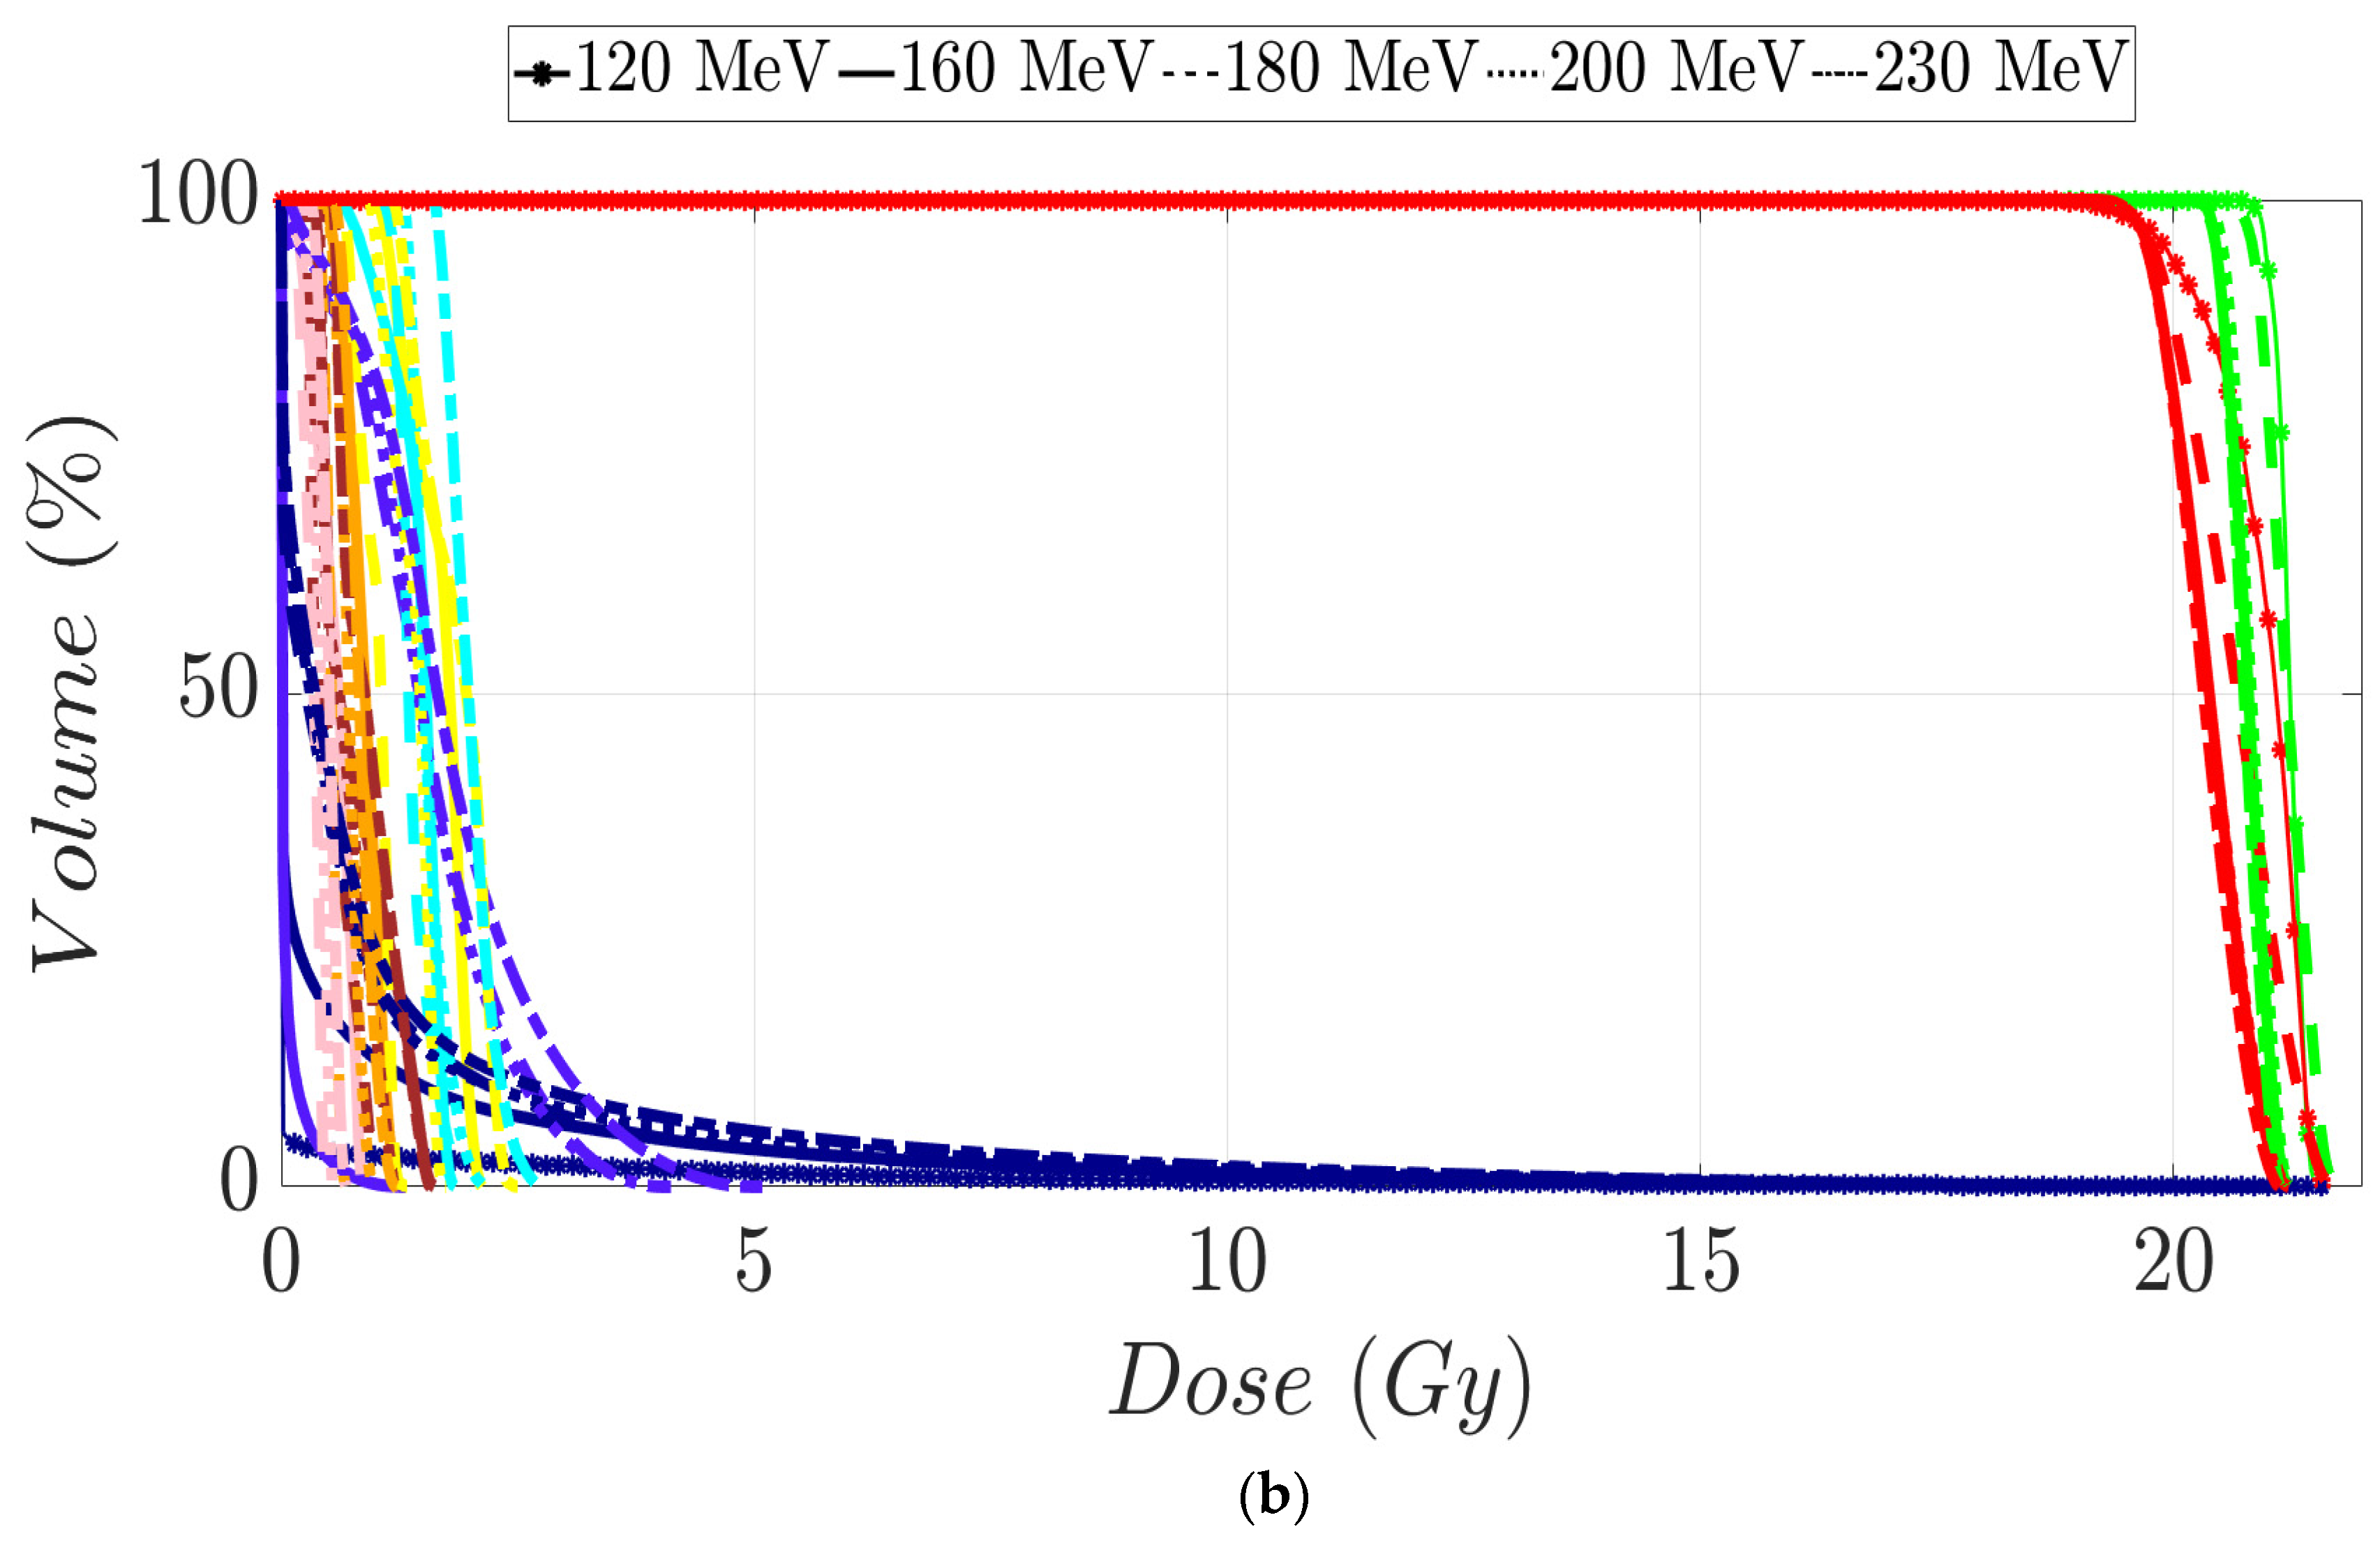
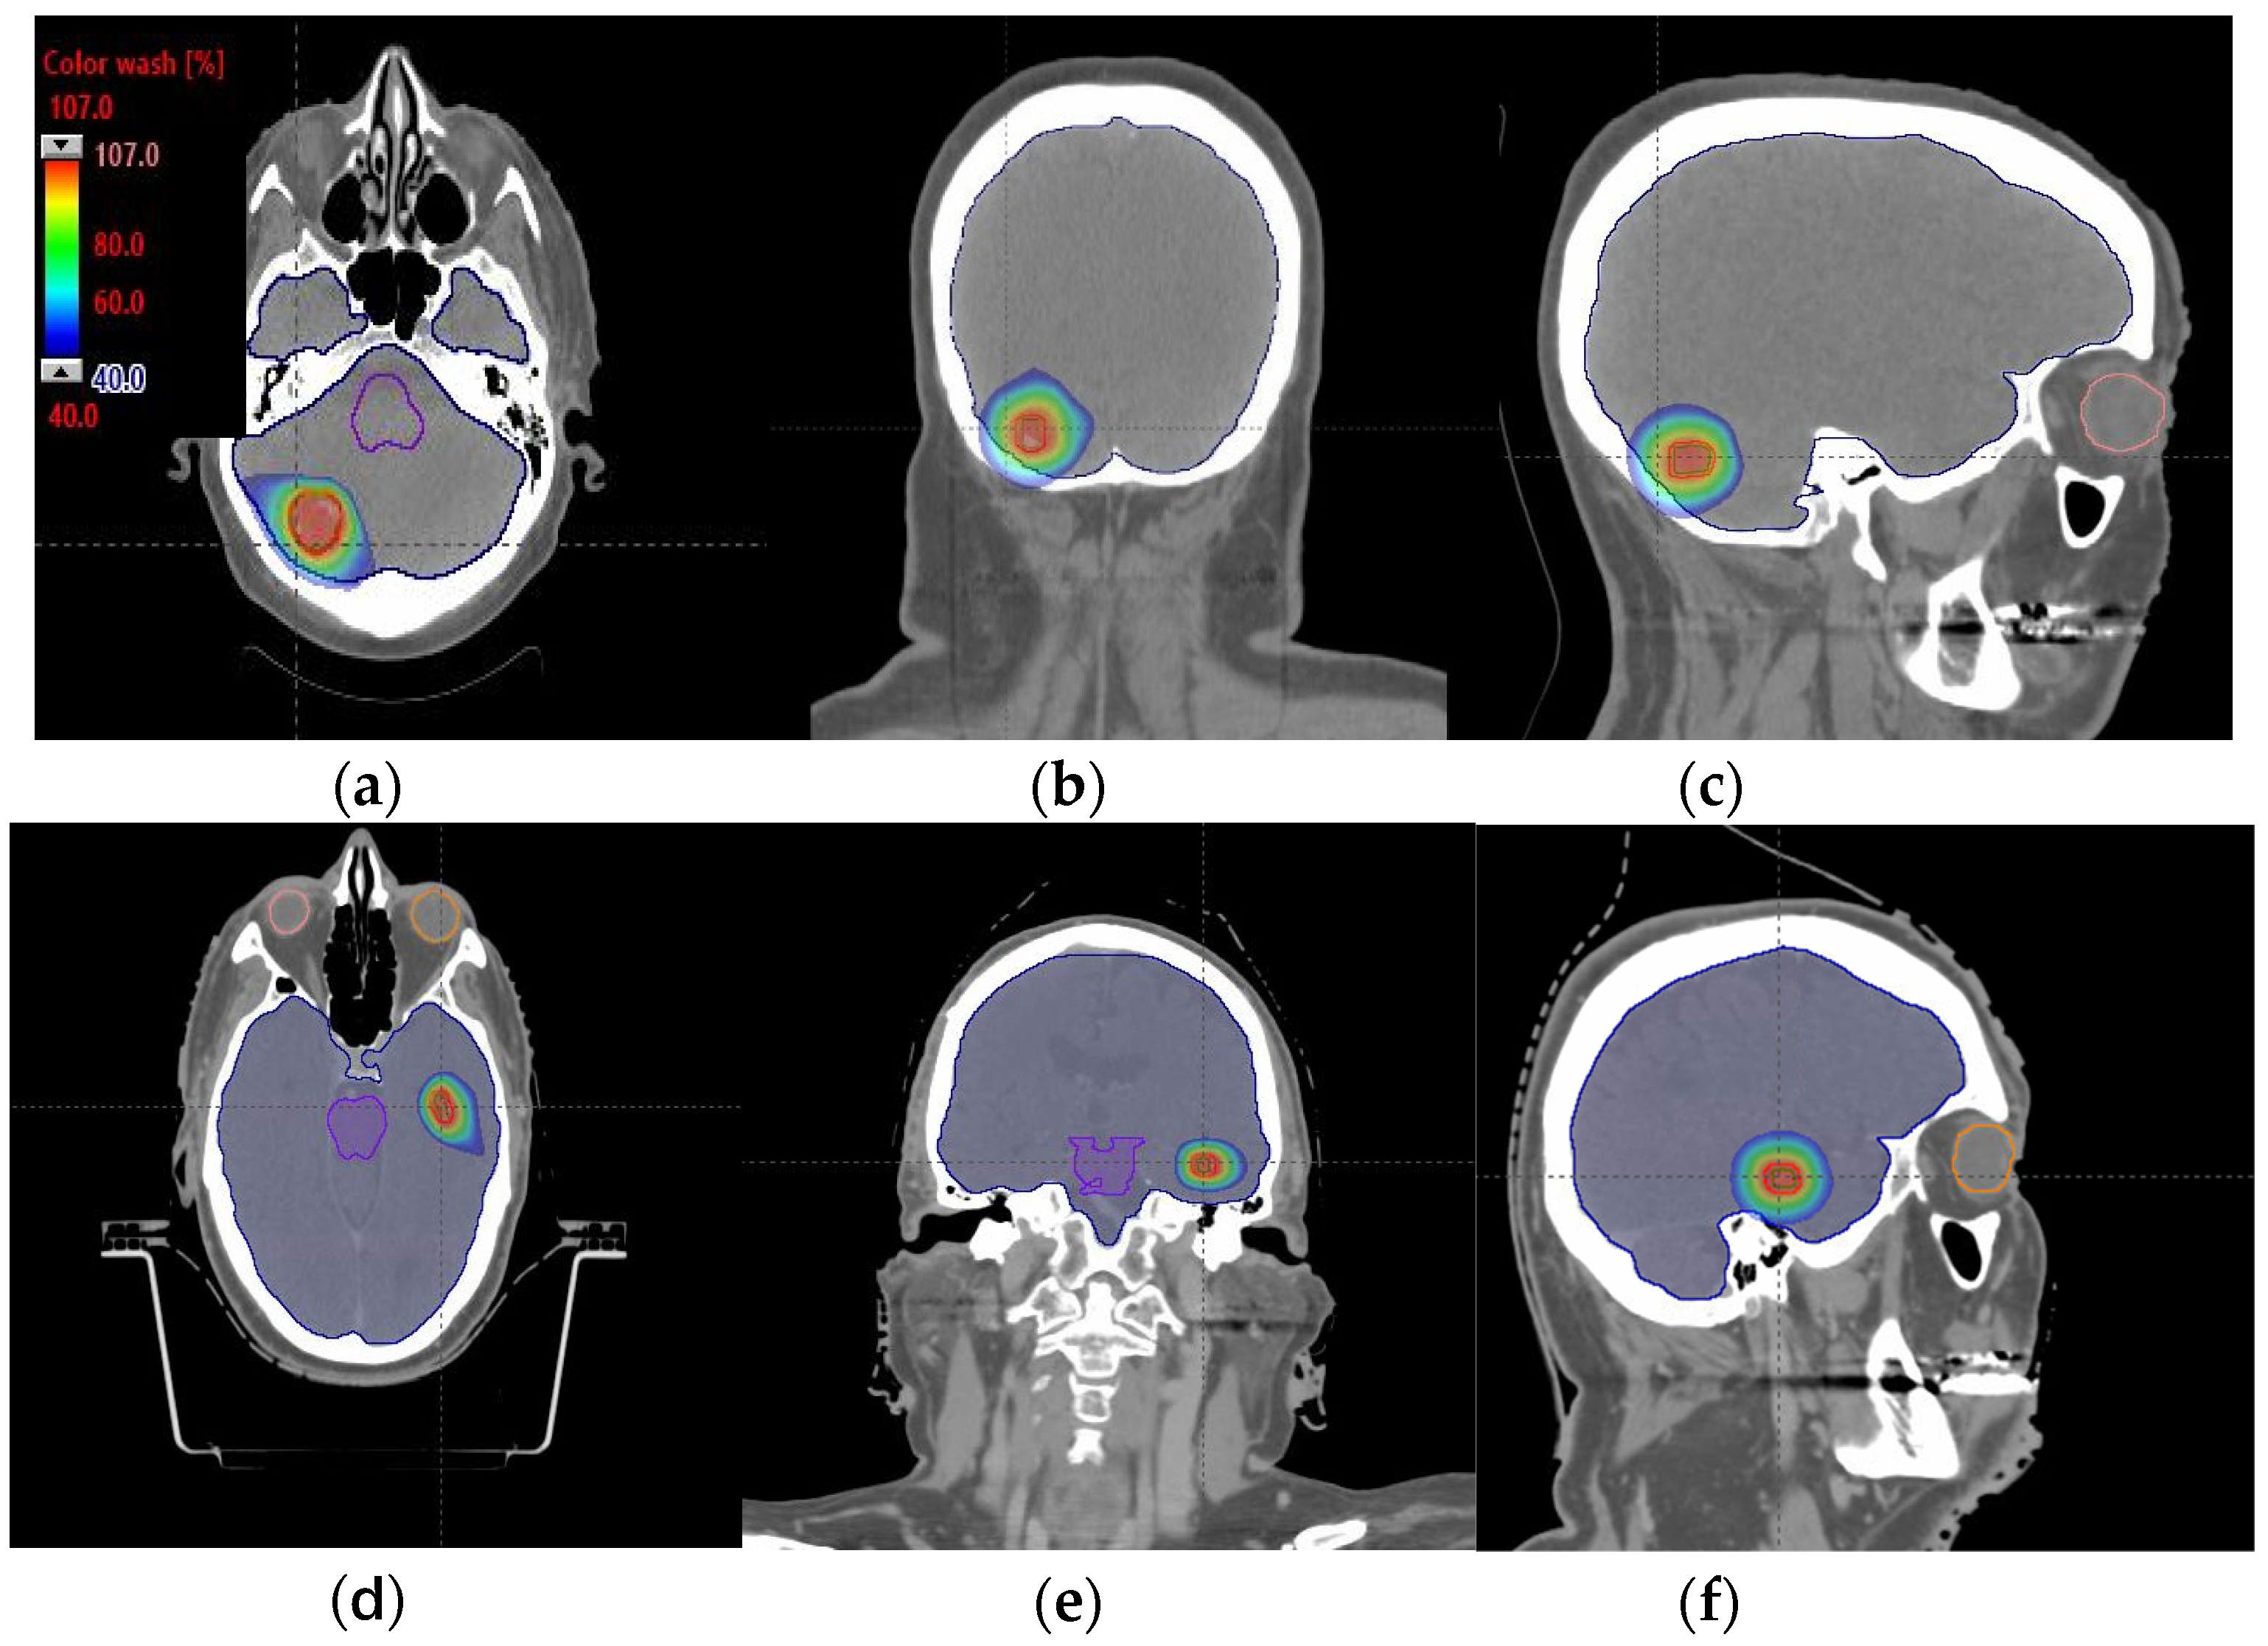
PTV coverage and homogeneity were found to be maintained using a 120 MeV compared to high-energy MIBE (Table 1). In these tables, green values correspond to values that fulfill the clinical dosimetric requirements for a specific volume. Orange values indicate values within ±2% of the dosimetric goals, and red values indicate deviations greater than ±2% from the objective values. Dose sparing in OARs for a 120 MeV MIBE was remarkable compared with the other energies employed (Table 1). DHVs for the developed plans in each patient are displayed in Figure 3a,b. Representative axial, sagittal, and coronal CT slices with overlayed isodose distributions are shown in Figure 4a–f for the plan with the lowest MIBE that satisfied the clinical goals for each of the assessed patients. In both cases, we used a 120 MeV MIBE value. For the 120 MeV and 160 MeV MIBE values, some fields were found not to contribute to dose distribution as the beam range was insufficient to reach the target voxels. For patient 1, the gantry angle range started from 140 to 300 degrees for an MIBE of 120 MeV, and from 60 to 360 degrees for an MIBE of 160 MeV. For patient 2, this range covered values from 40 to 140 degrees for an MIBE of 120 MeV and from 340 to 180 degrees for an MIBE of 160 MeV. Note that all these arcs are defined in the clockwise (CW) direction.

Table 1.
PTV volume values V98% (%) and V110% (%) and dosimetric parameter values in OARs for brain cancer patients 1 and 2 according to each selected MIBE value. For a given volume and metric, first-row values correspond to patient 1 and second-row values to patient 2.
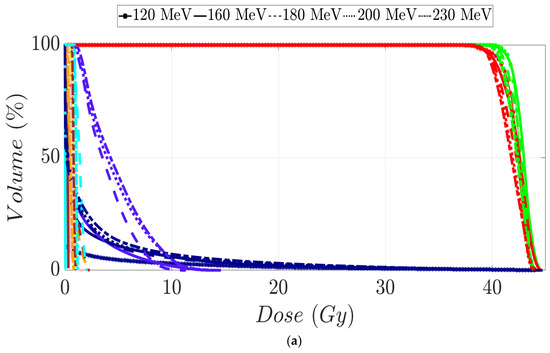
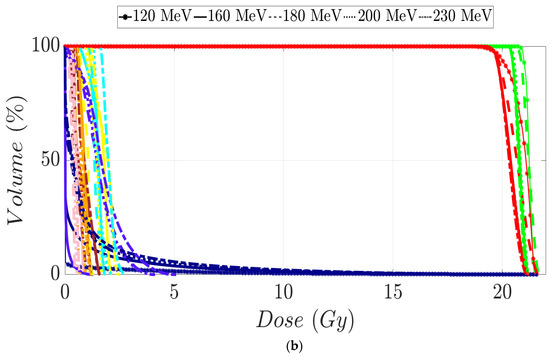
Figure 3.
Dose–volume histogram for brain cancer patients 1 (a) and 2 (b). The following structures are shown: PTV (red), CTV (green), brainstem (purple), brain (dark blue), chiasm (cyan), left optical nerve (yellow), right optical nerve (brown), right eye (pink), and left eye (orange).
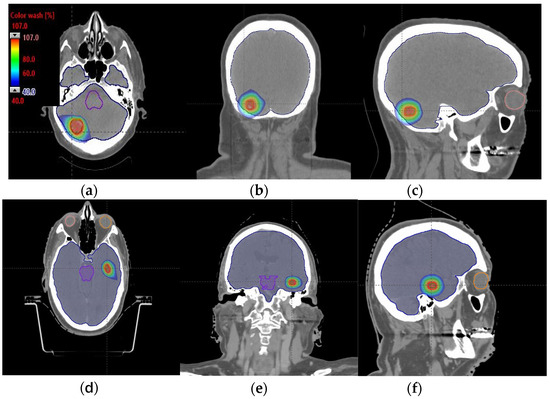
Figure 4.
Axial, coronal, and sagittal CT slices of brain patients 1 (a–c) and 2 (d–f). Dose distribution is displayed in both patients, including isodoses from 40% (blue) to 107% (red) of the prescribed dose.
3.2. Prostate Patients Treatment Plans
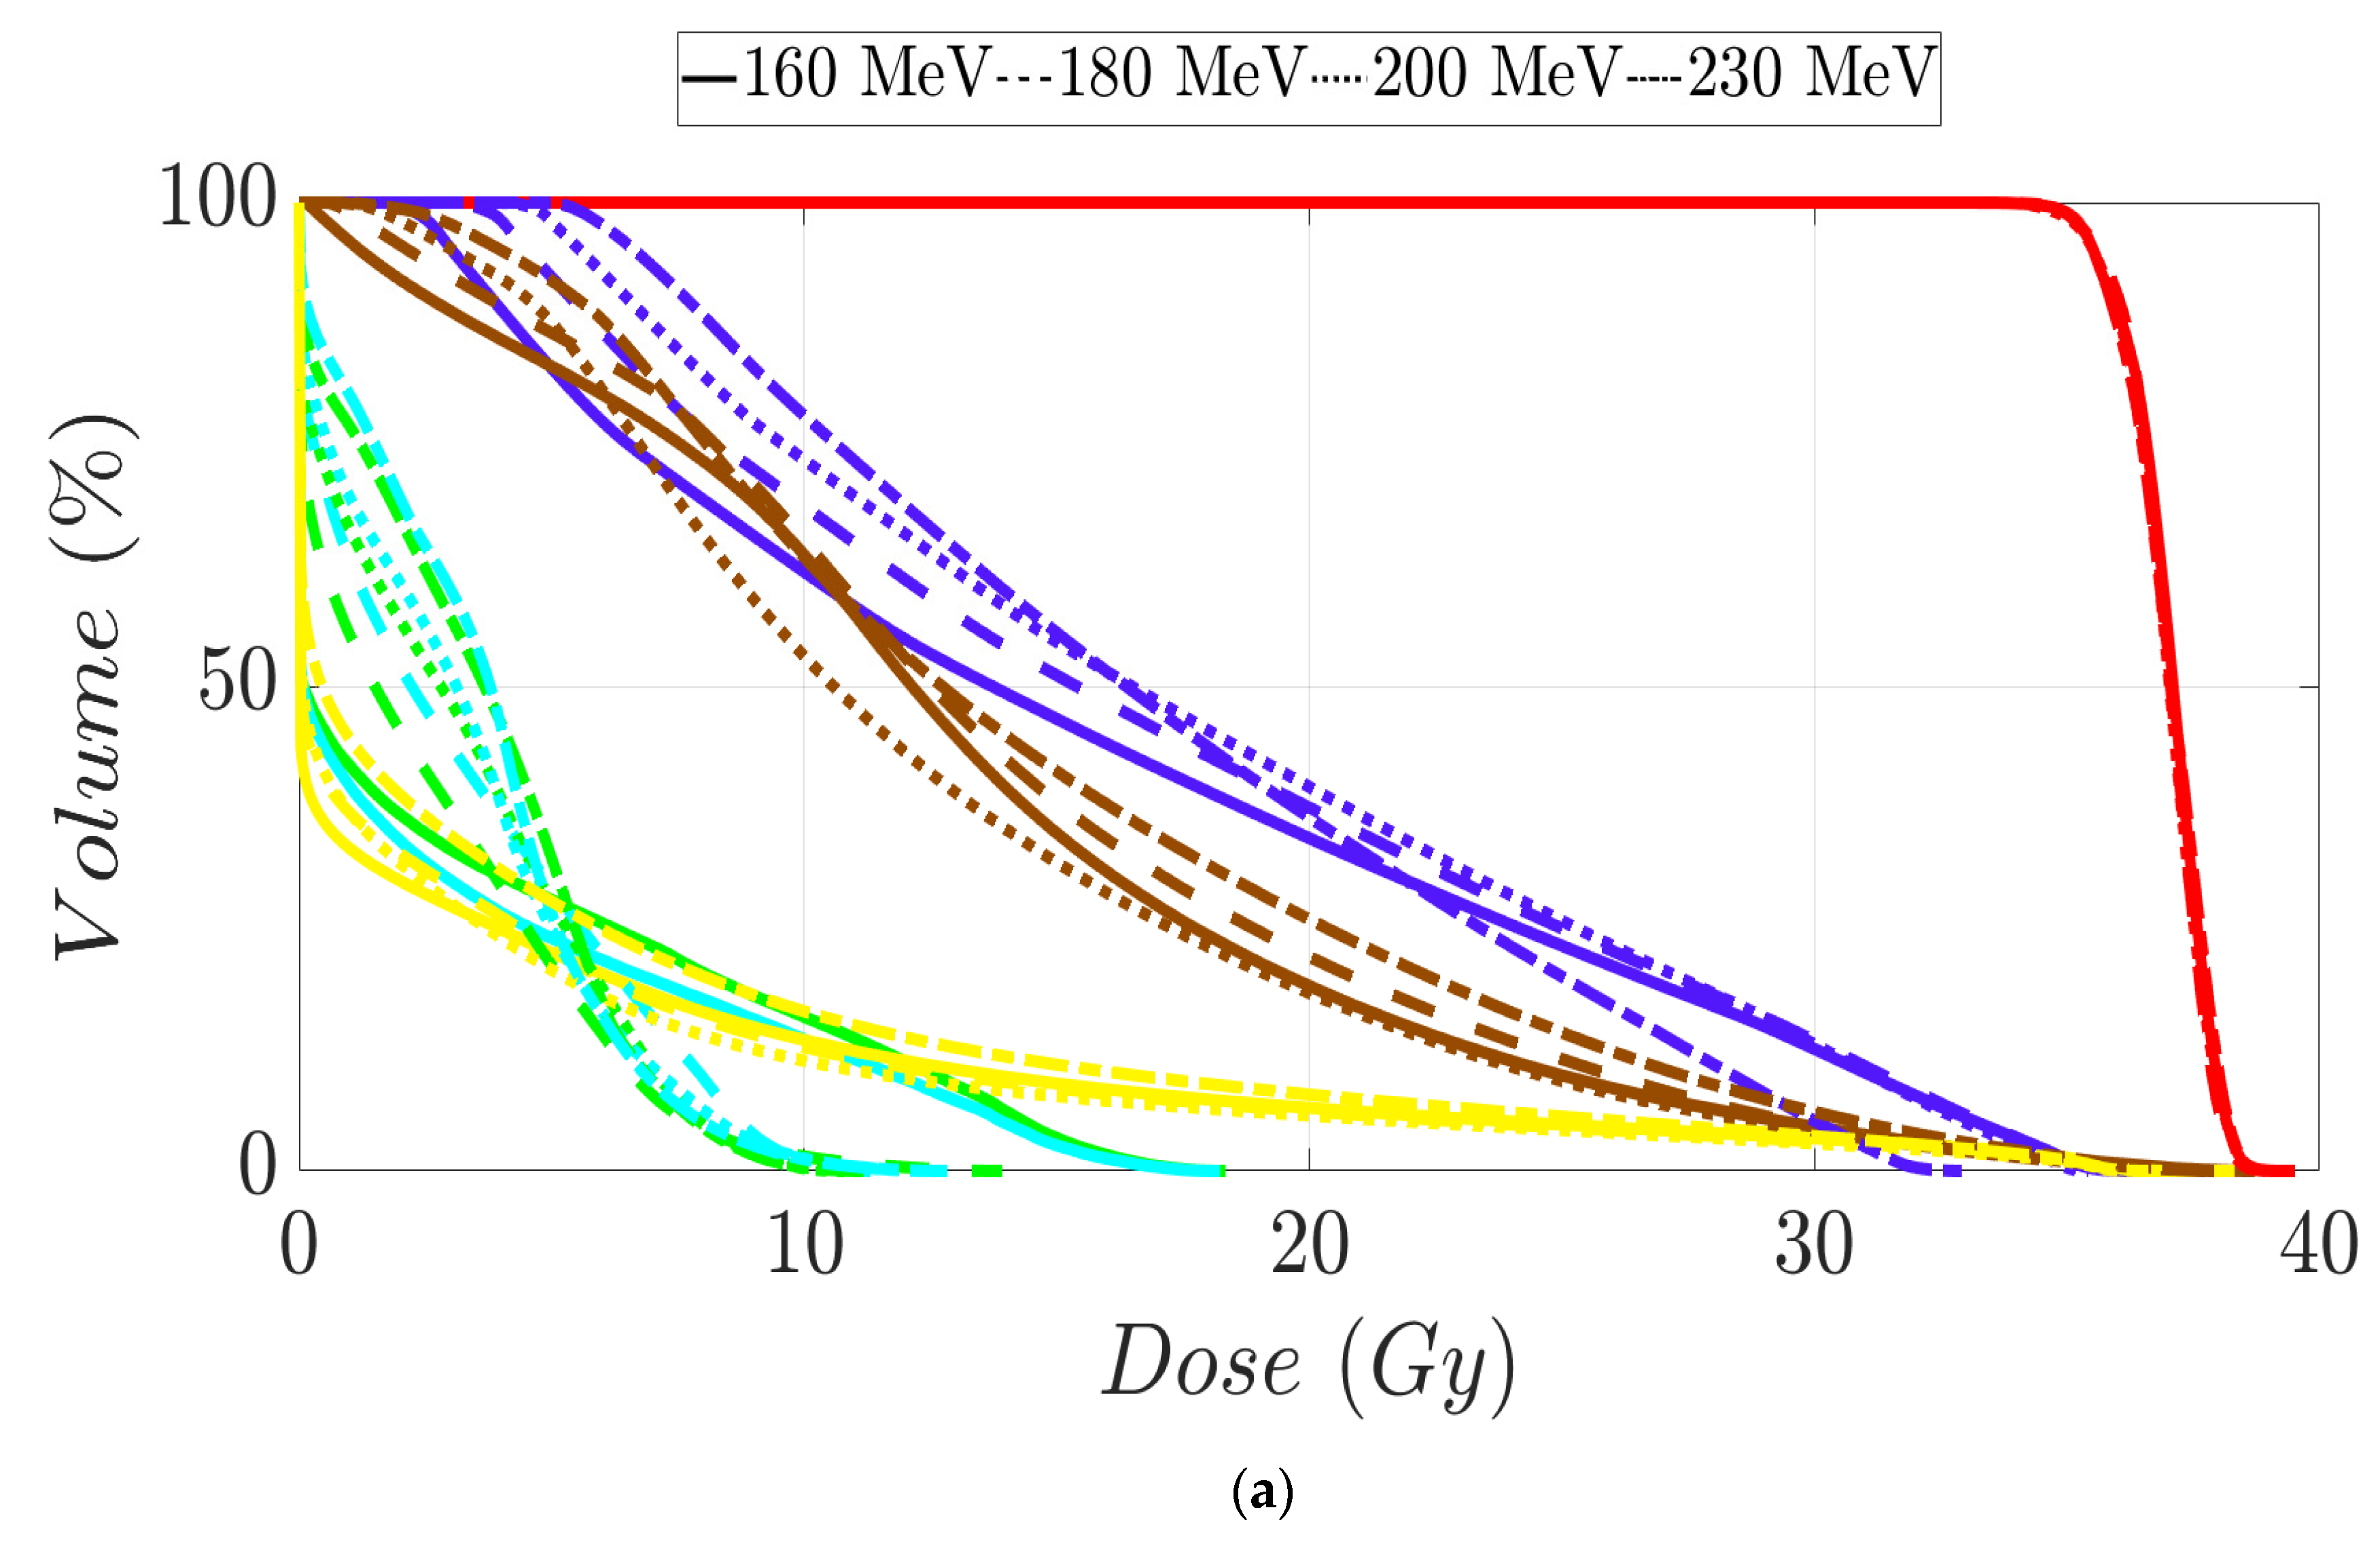
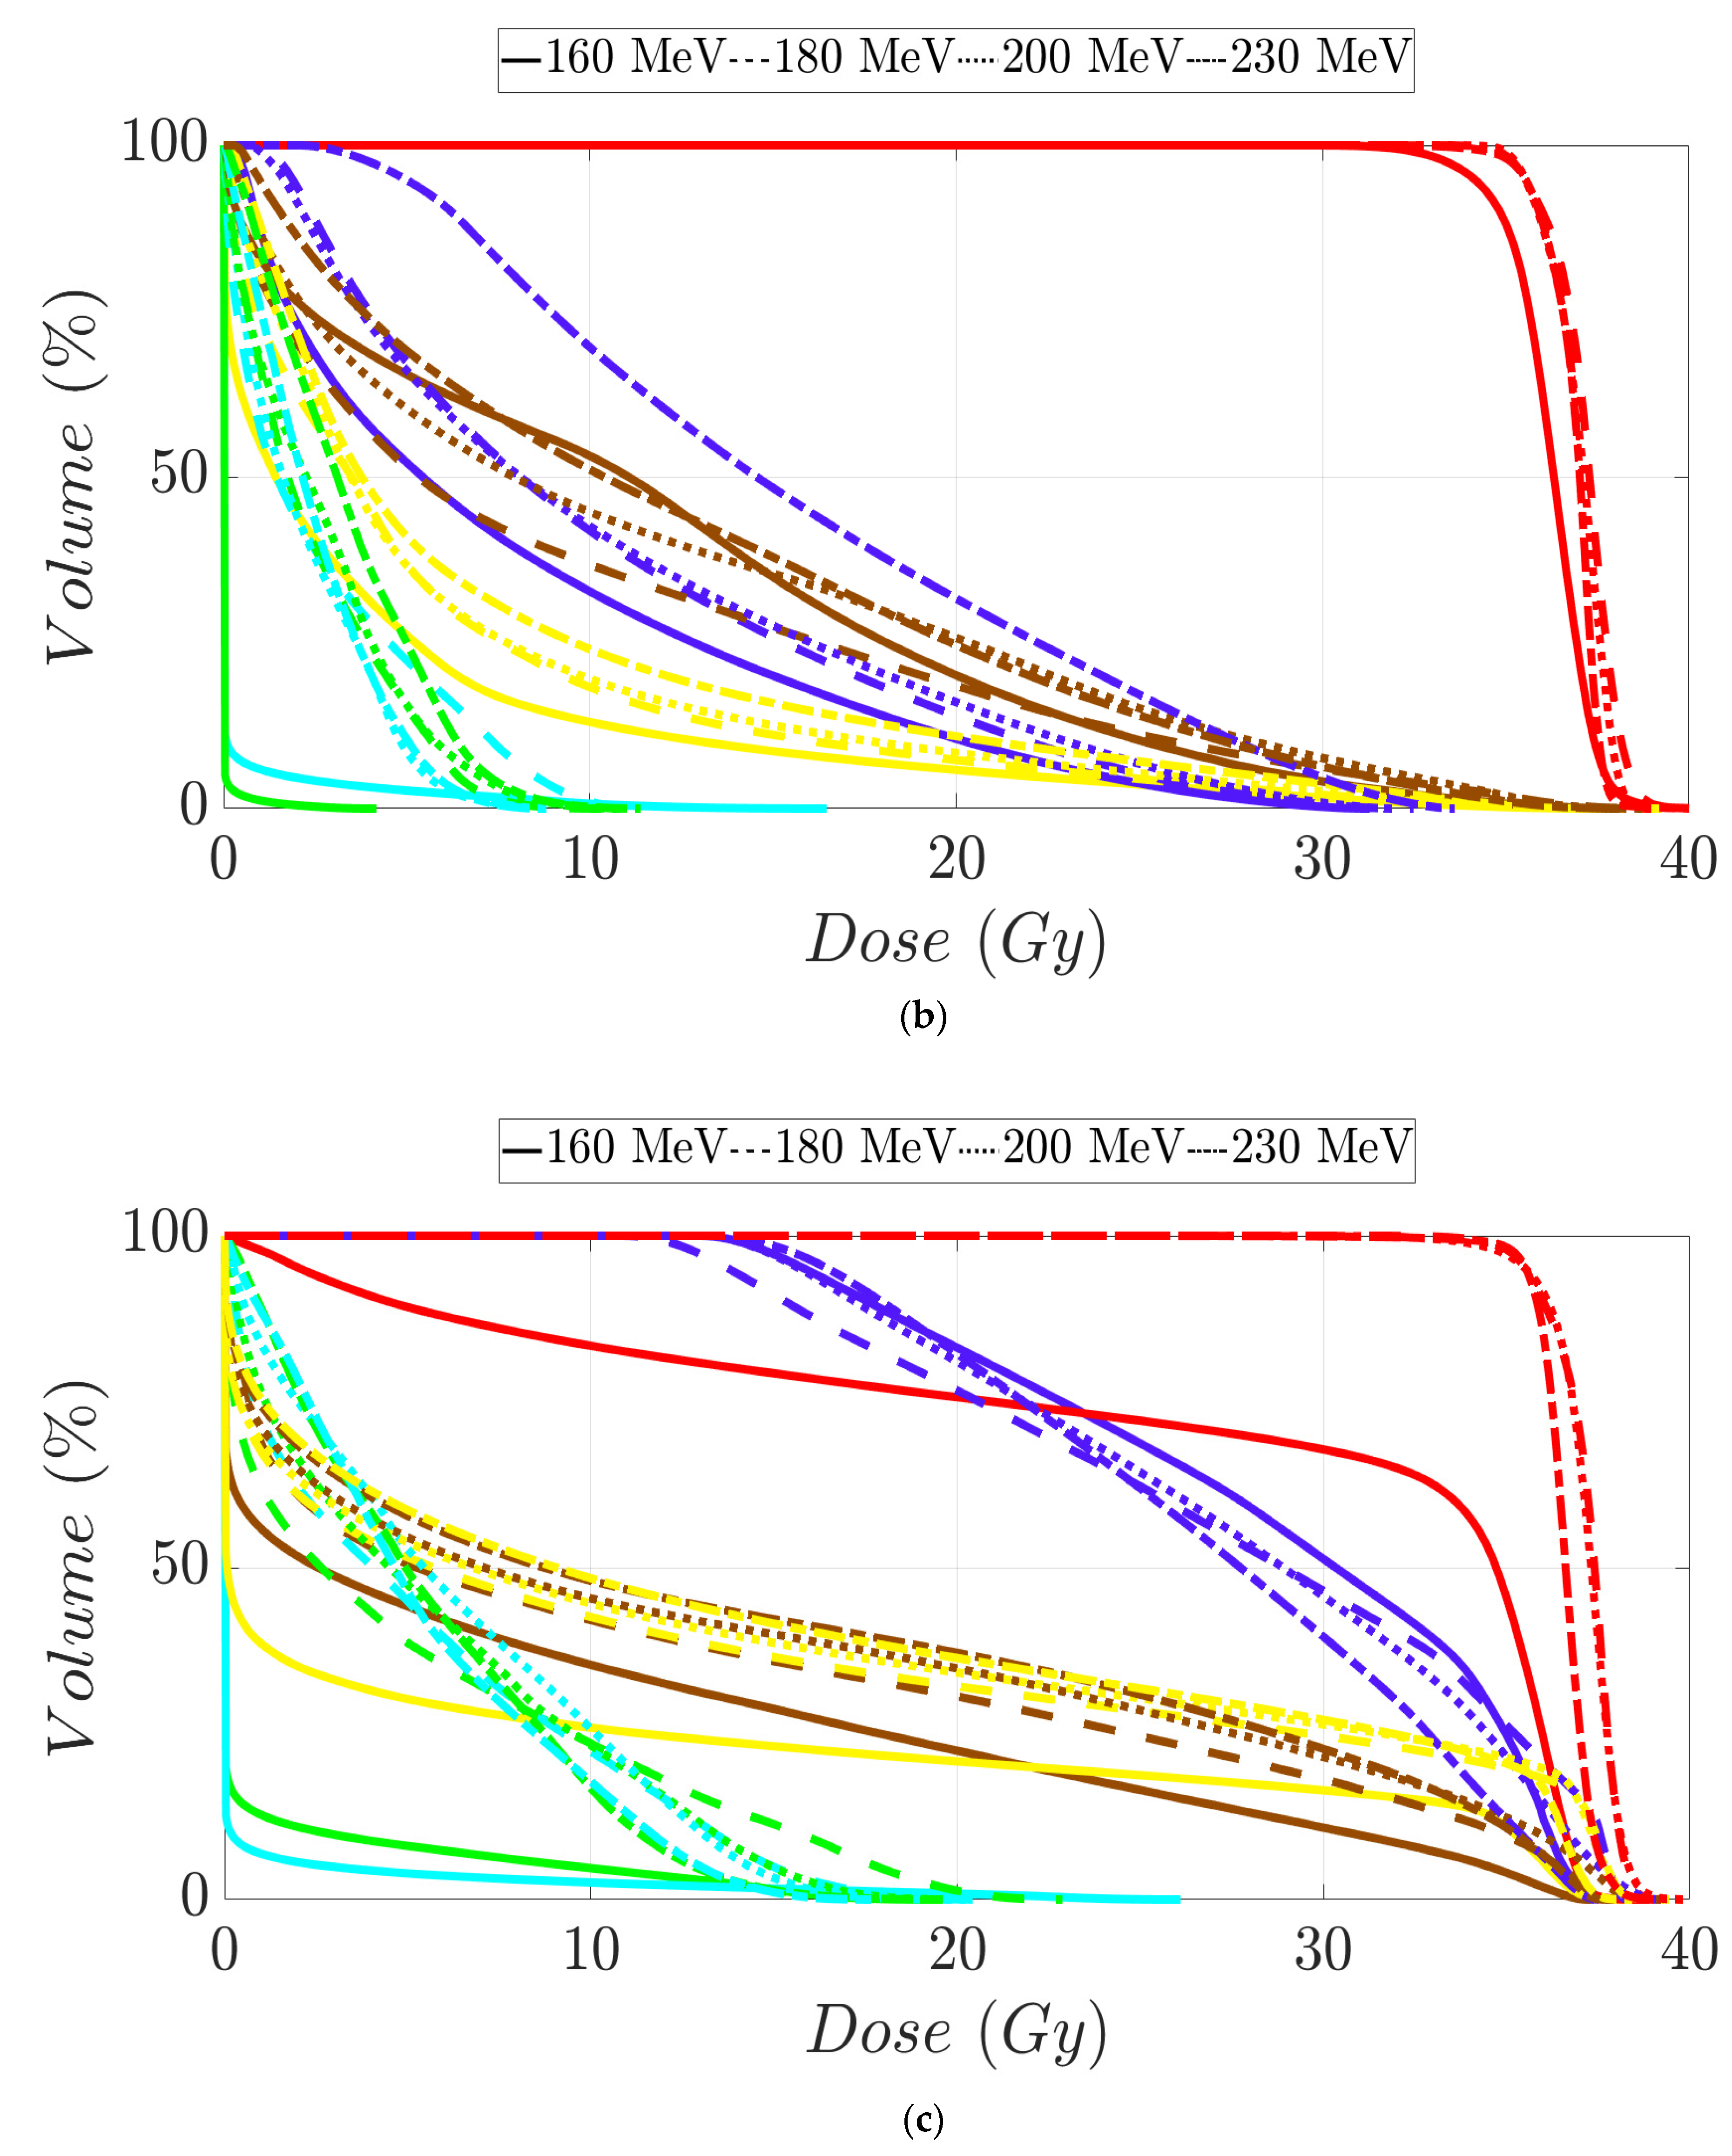
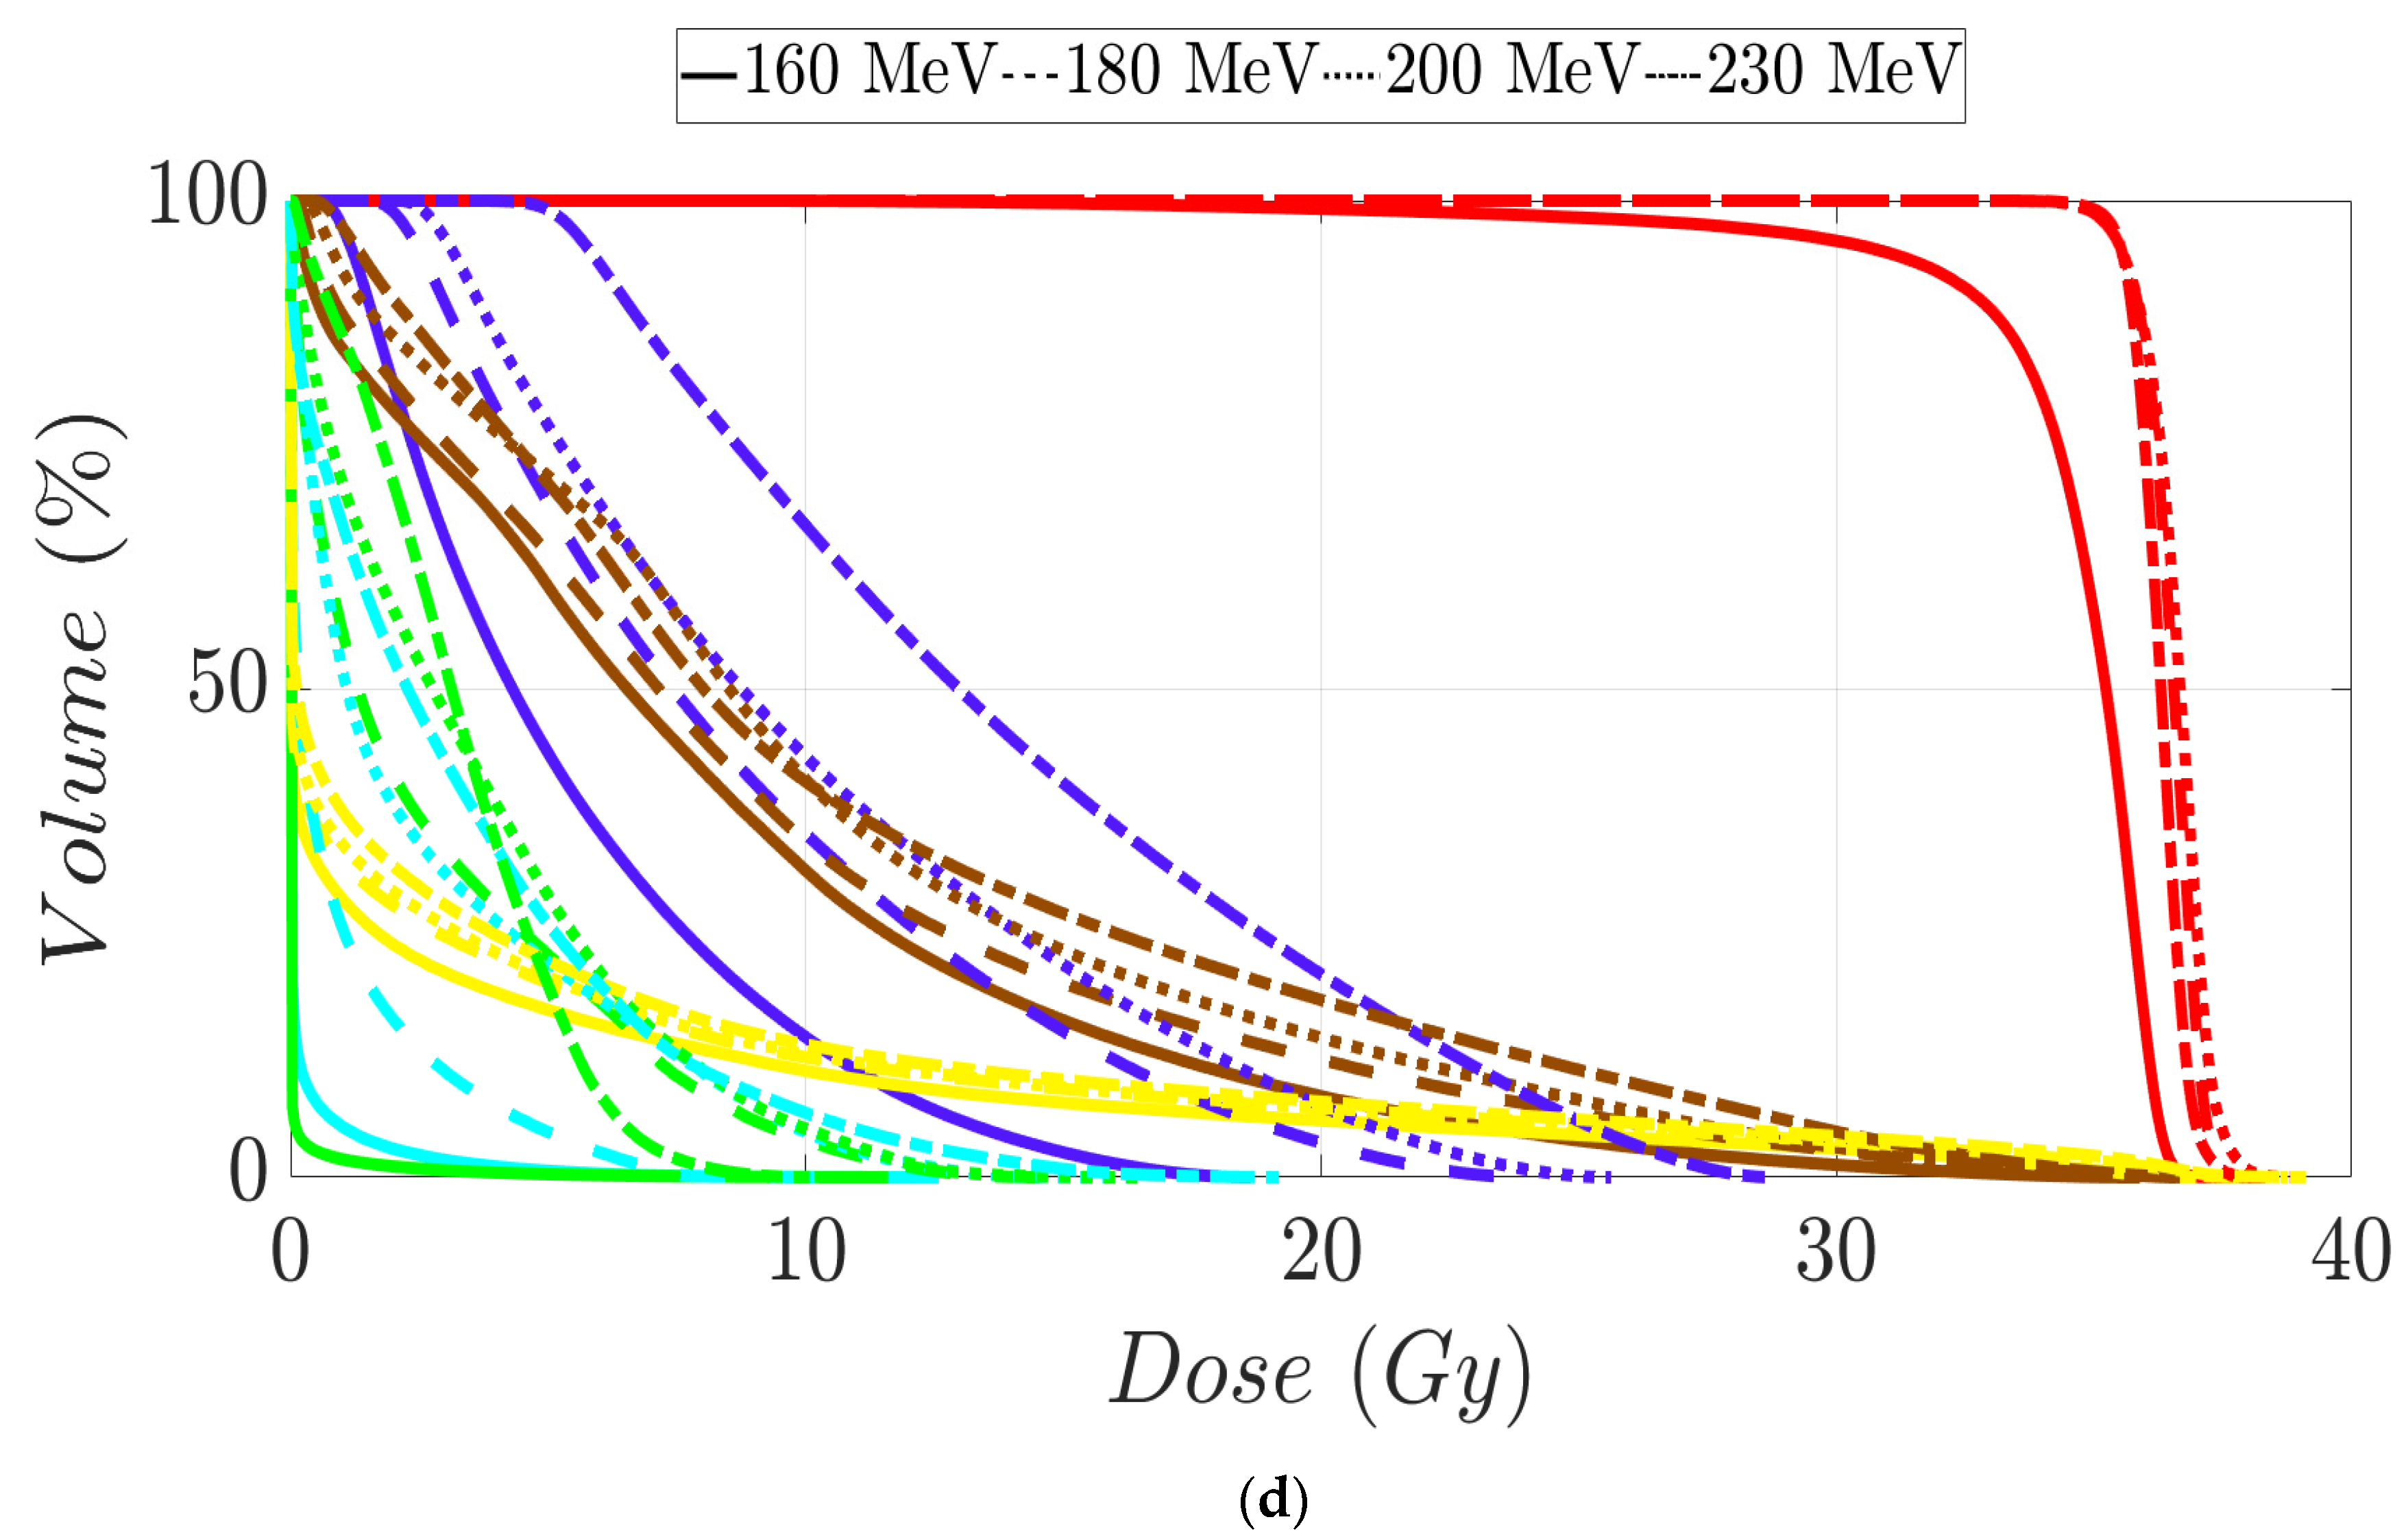
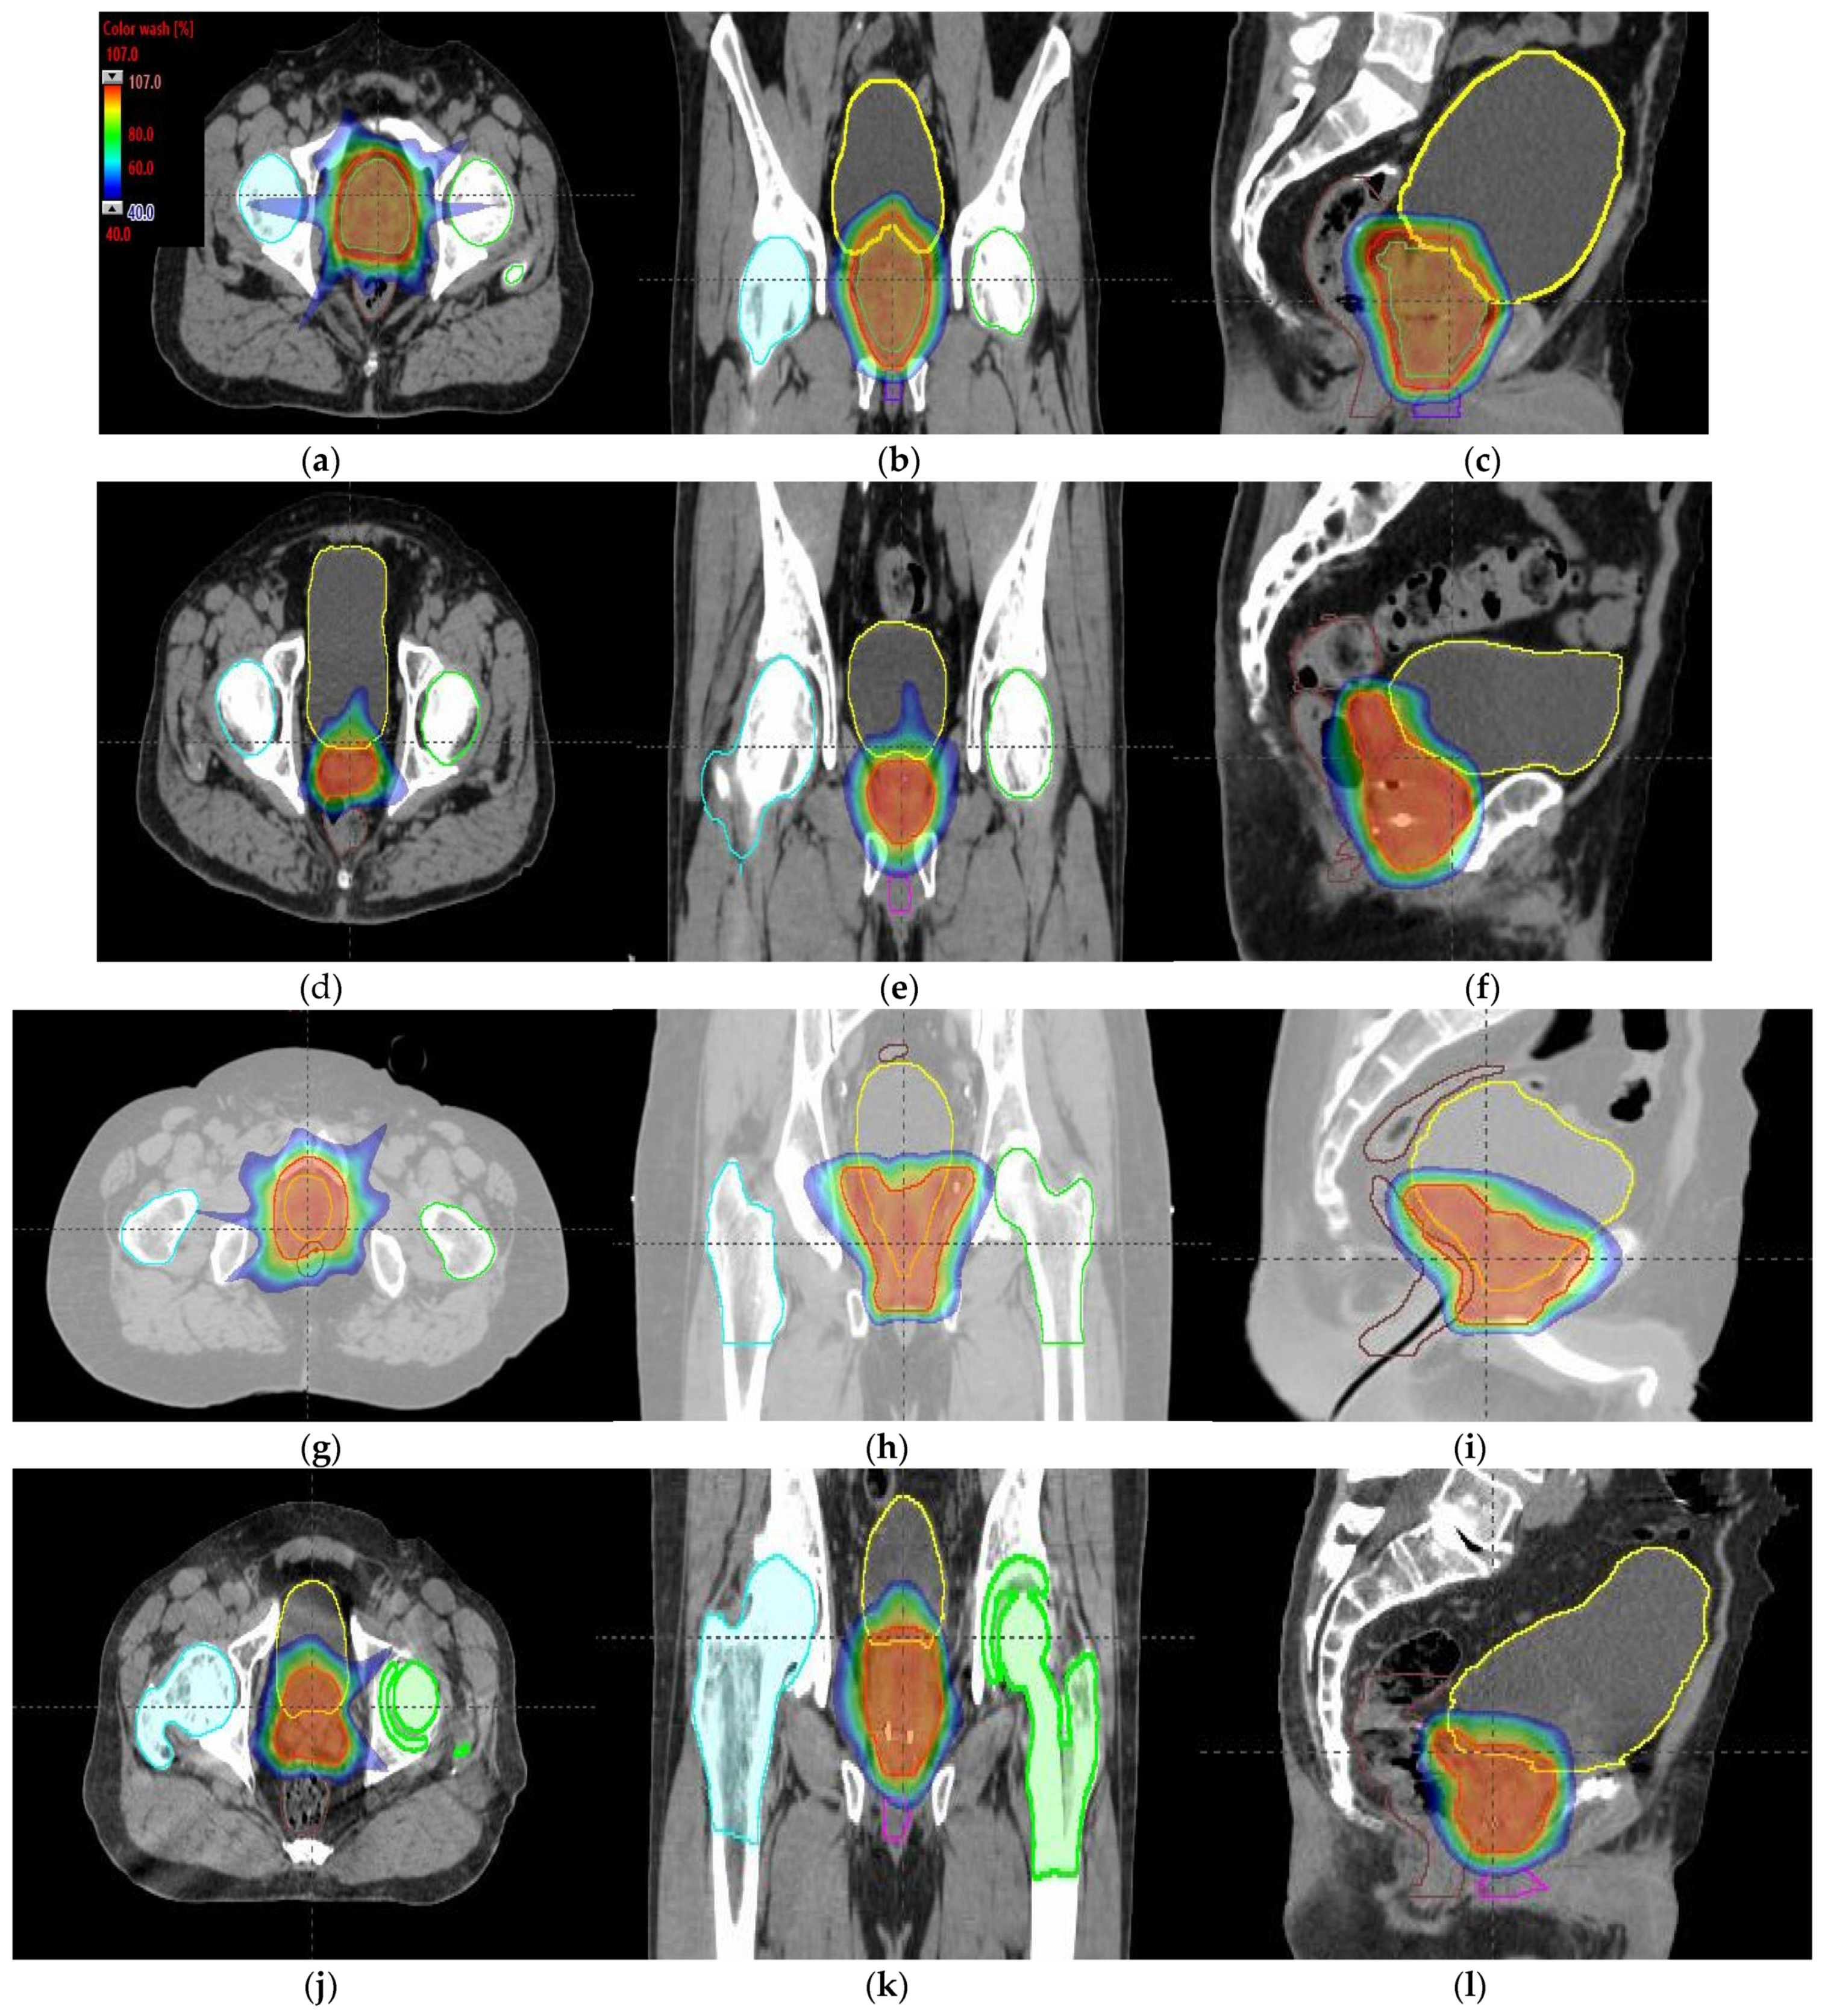
Tumor dose coverage and homogeneity presented acceptable values, i.e., V98% (%) ≥ 95% and V107% (%) ≤ 10%, for all MIBE studied (Table 2), except for 160 MeV. This was due to its inadequate range compared to the water equivalent thickness (WEL) from the entrance to the target for all gantry angles. Moreover, in Table 2, the values of the clinical goals show that 160 MeV allows for better protection of normal tissue, but the lack of coverage in PTV (except for the first patient) suggests the use of 180 MeV as the lowest value for MIBE. The color coding is the same as that used for Table 1. As a summary of the different plans, the DVHs are shown in Figure 5a–d and the axial, sagittal, and coronal slices of dose distributions are shown in Figure 6a–l. The dose distribution in patient 1 corresponded to a proton plan of 160 MeV MIBE, while for the other patients, the MIBE was 180 MeV.

Table 2.
PTV clinical goal values of the relevant OARs assessed in prostate cancer patients 1, 2, 3, and 4 depending on MIBE. PTV volume values V98% (%) and V107% (%) are also displayed.
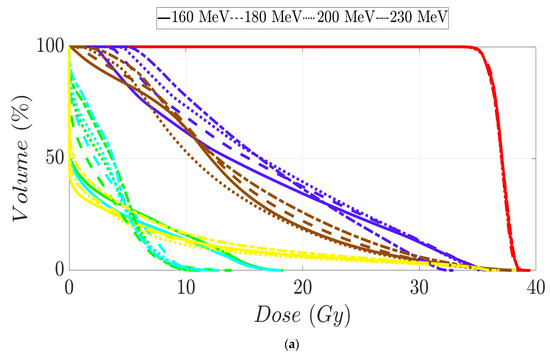
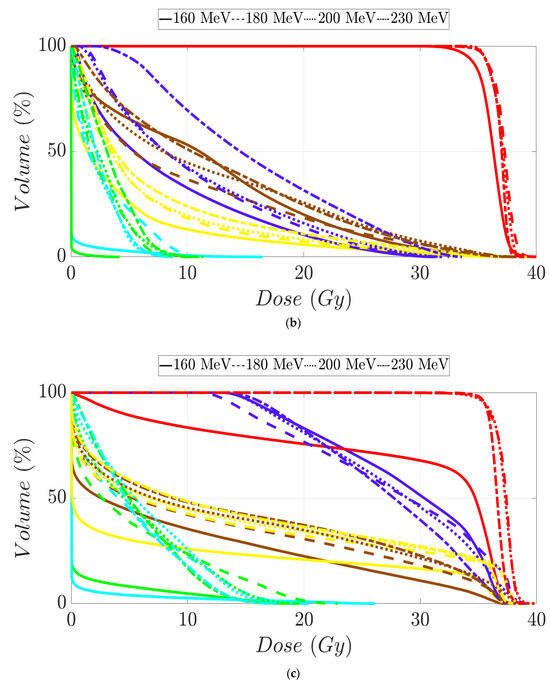
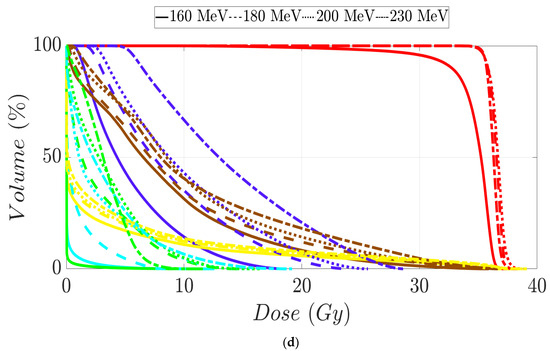
Figure 5.
Dose–volume histogram for prostate cancer patients 1 (a), 2 (b), 3 (c), and 4 (d). The following structures are shown: PTV (red), penile bulb (purple), rectum (brown), bladder (yellow), left femoral head (cyan), right femoral head (green).
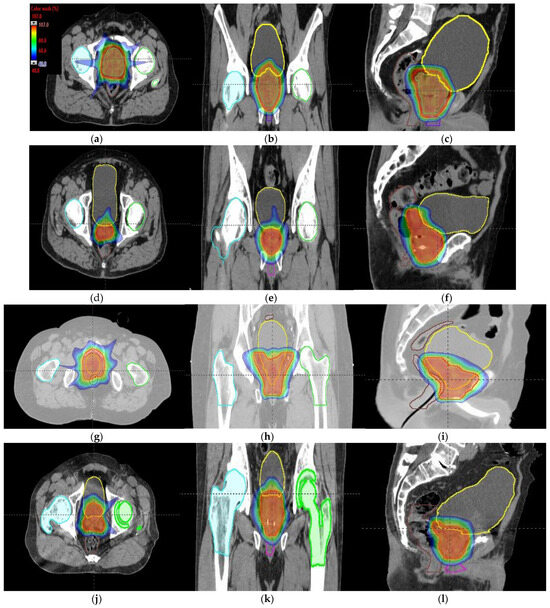
Figure 6.
Axial, coronal, and sagittal CT slices of prostate cancer patients 1 (a–c), 2 (d–f), 3 (g–i), and 4 (j–l). Dose distribution is displayed, showing isodose curves in a range from 40% (blue) to 107% (red) of the prescribed dose.
3.3. Head and Neck Patients’ Treatment Plans
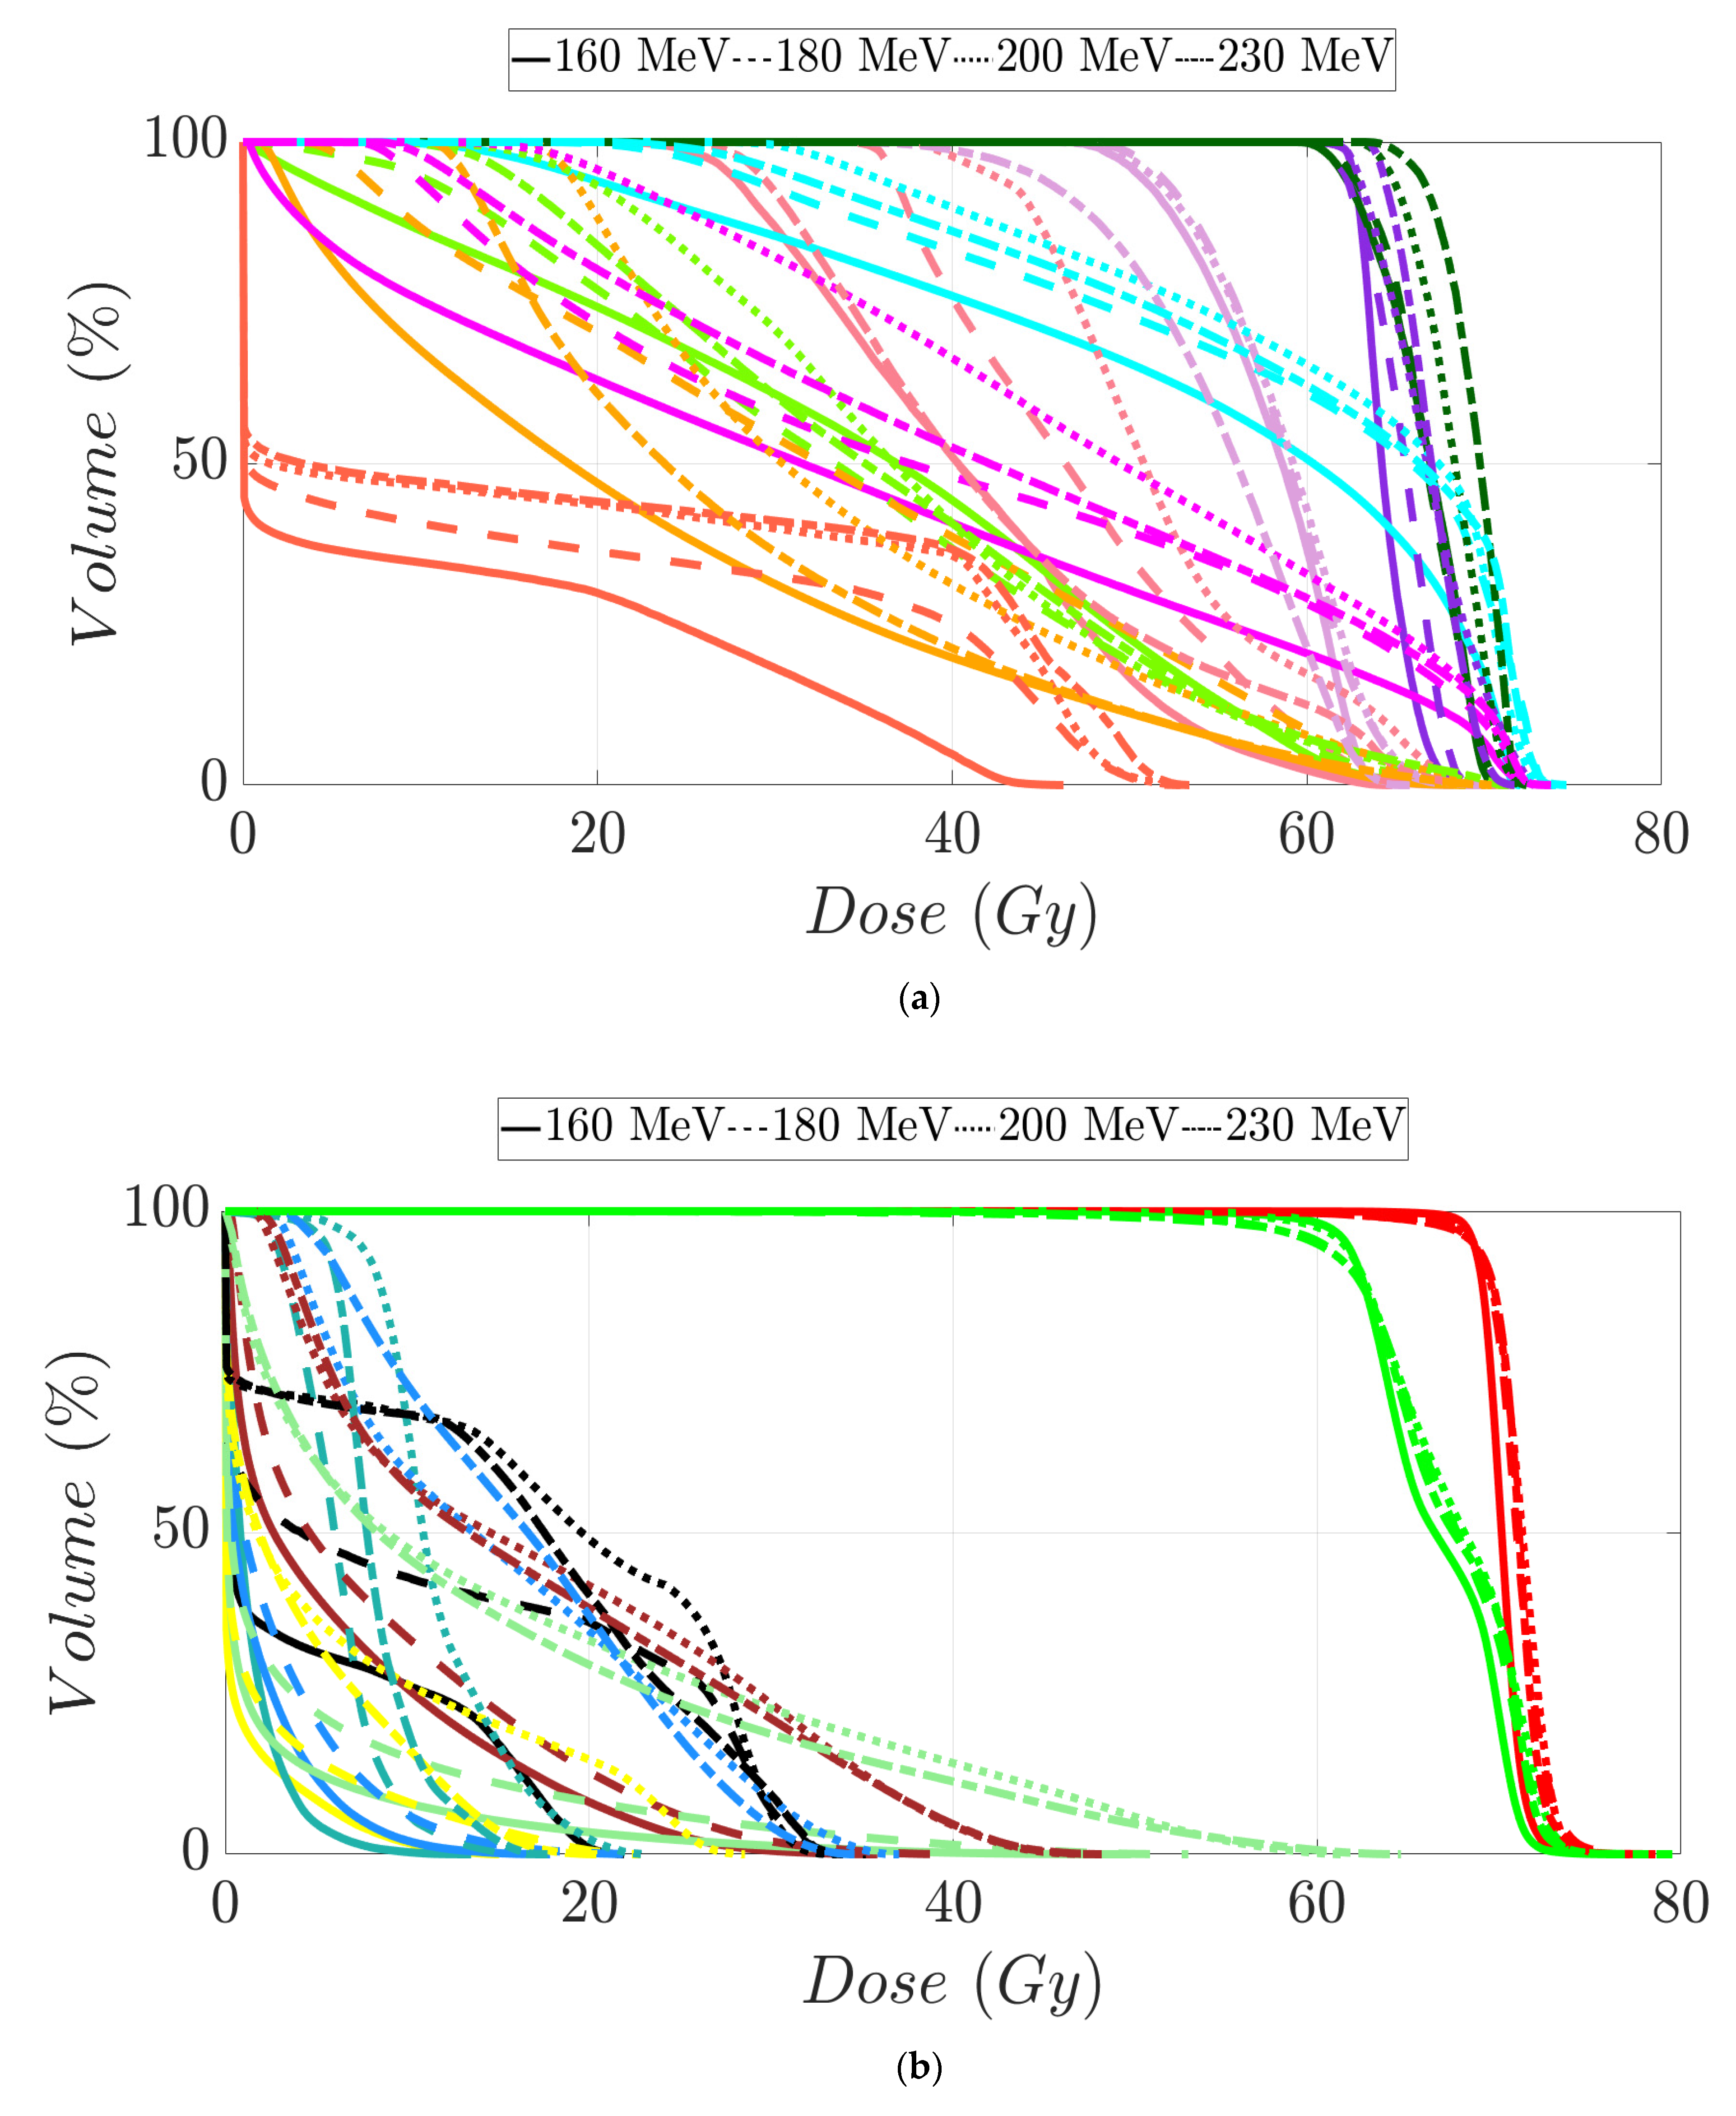
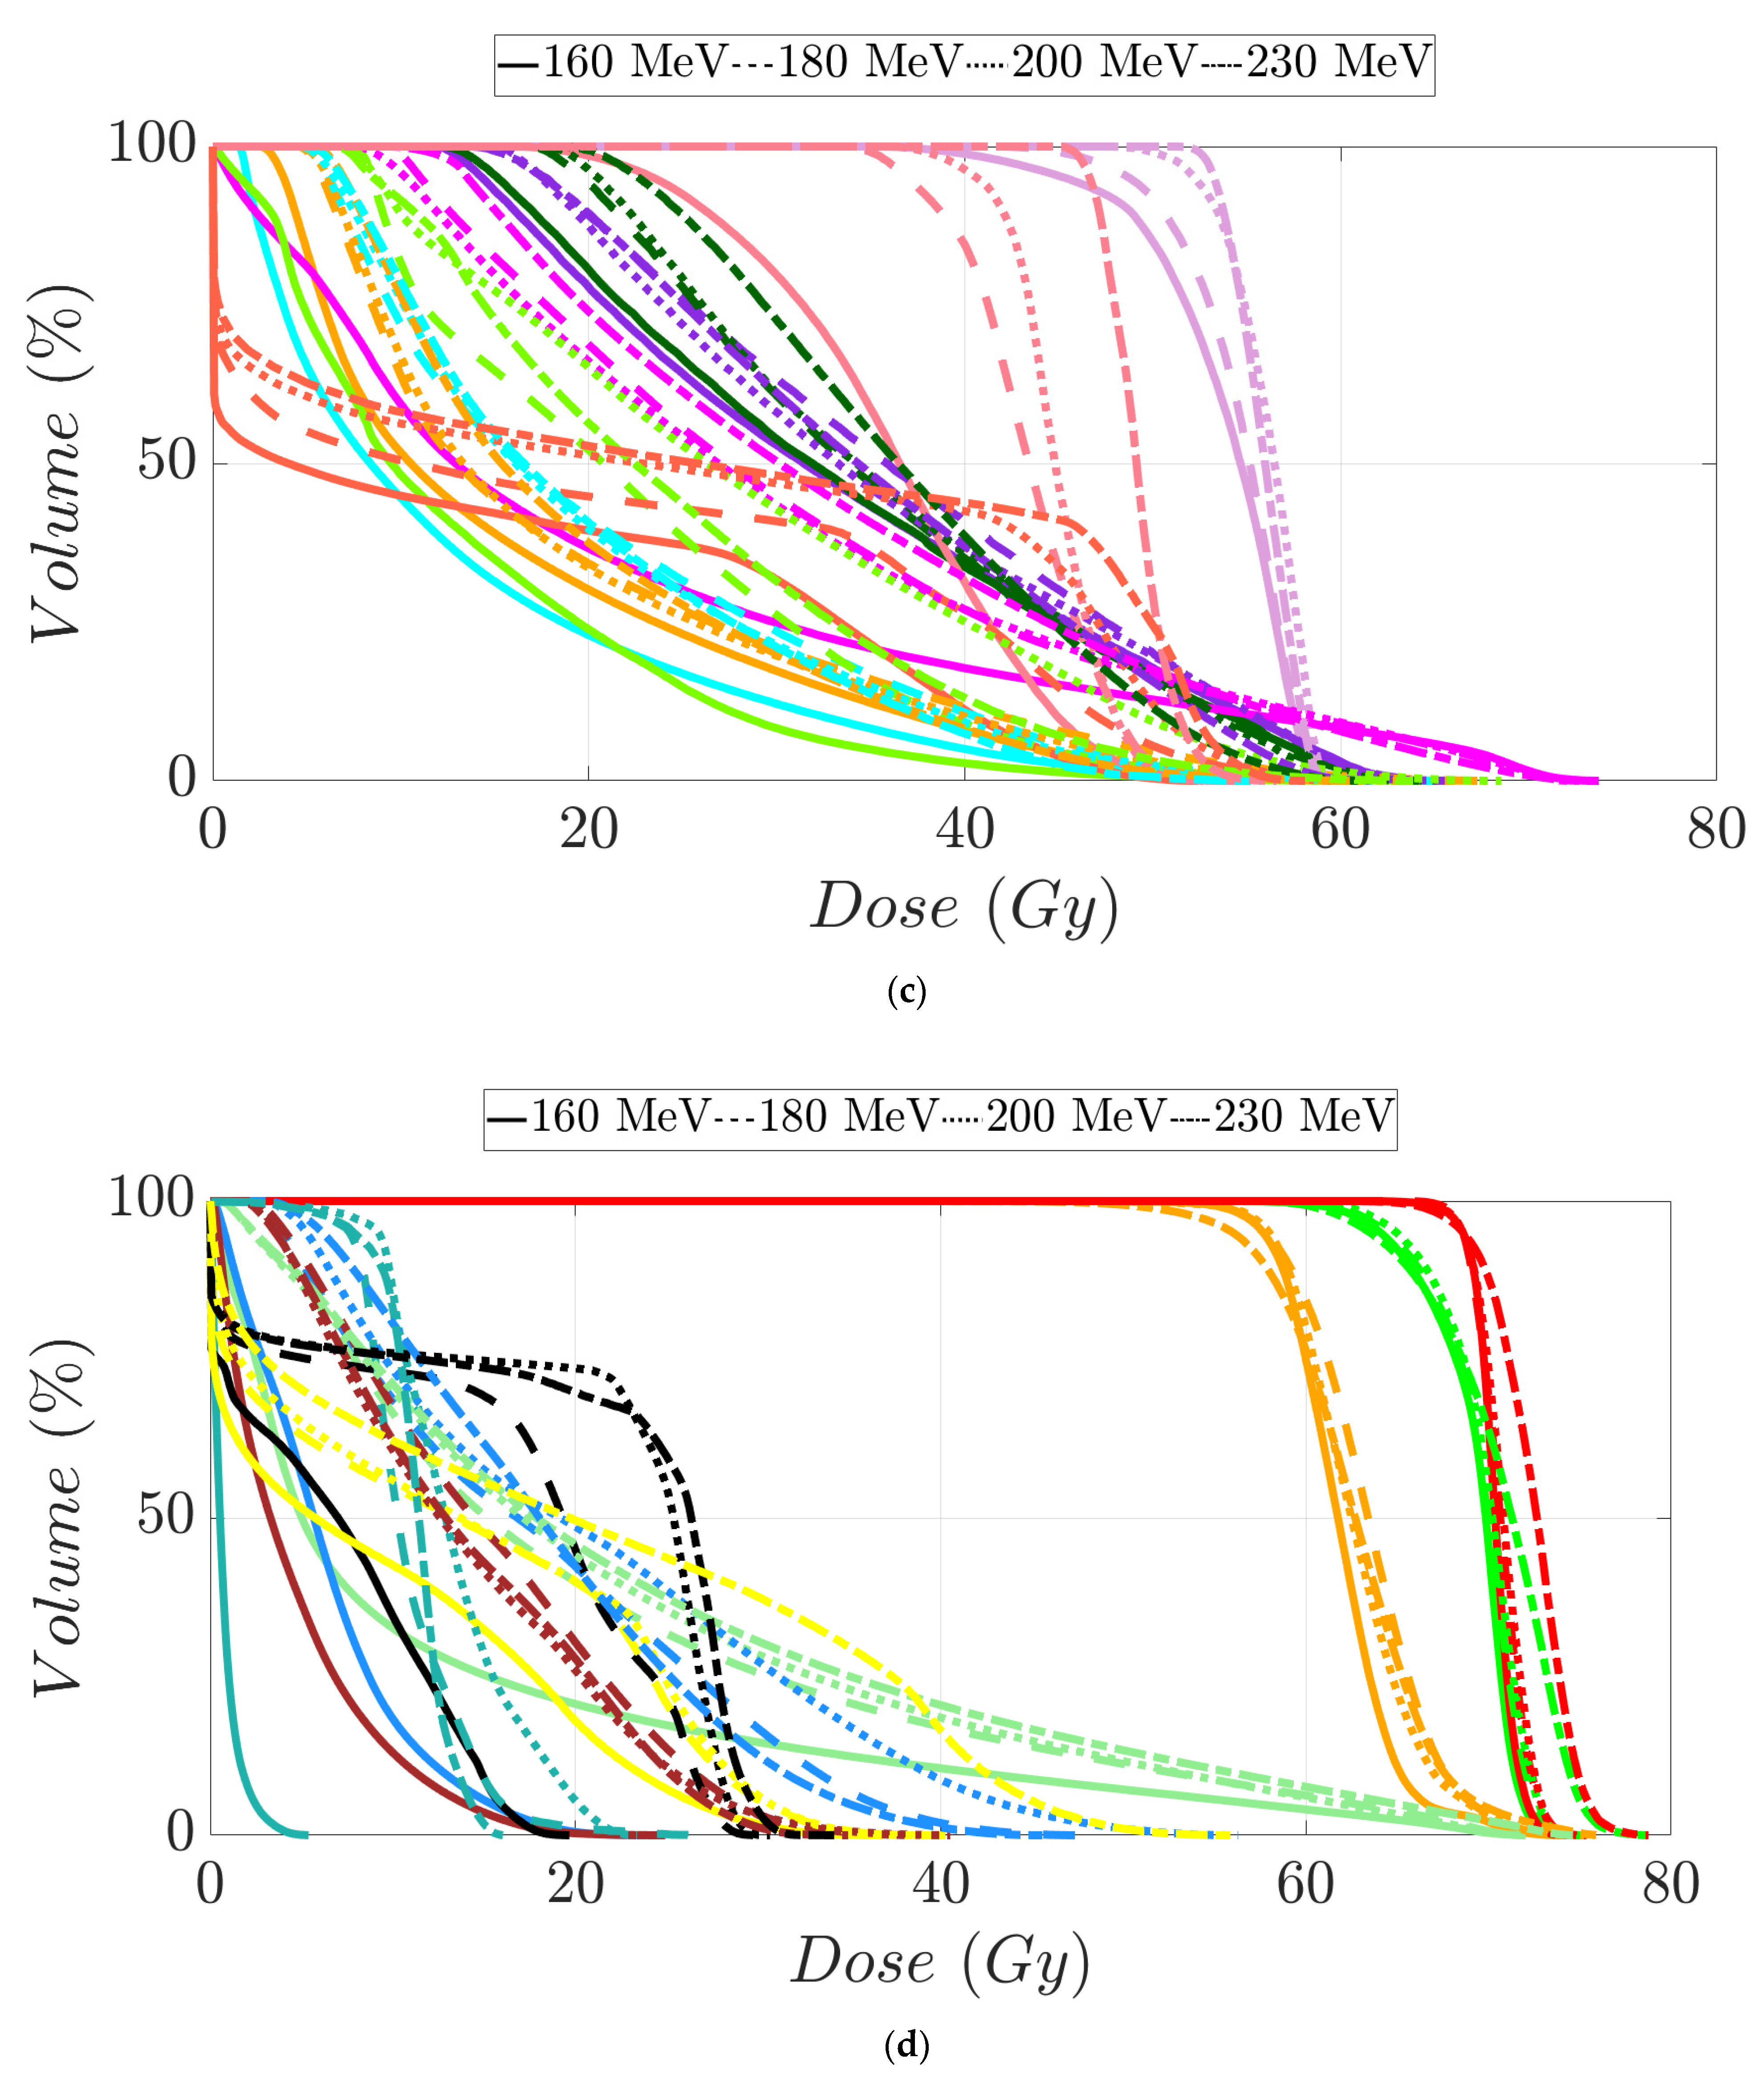
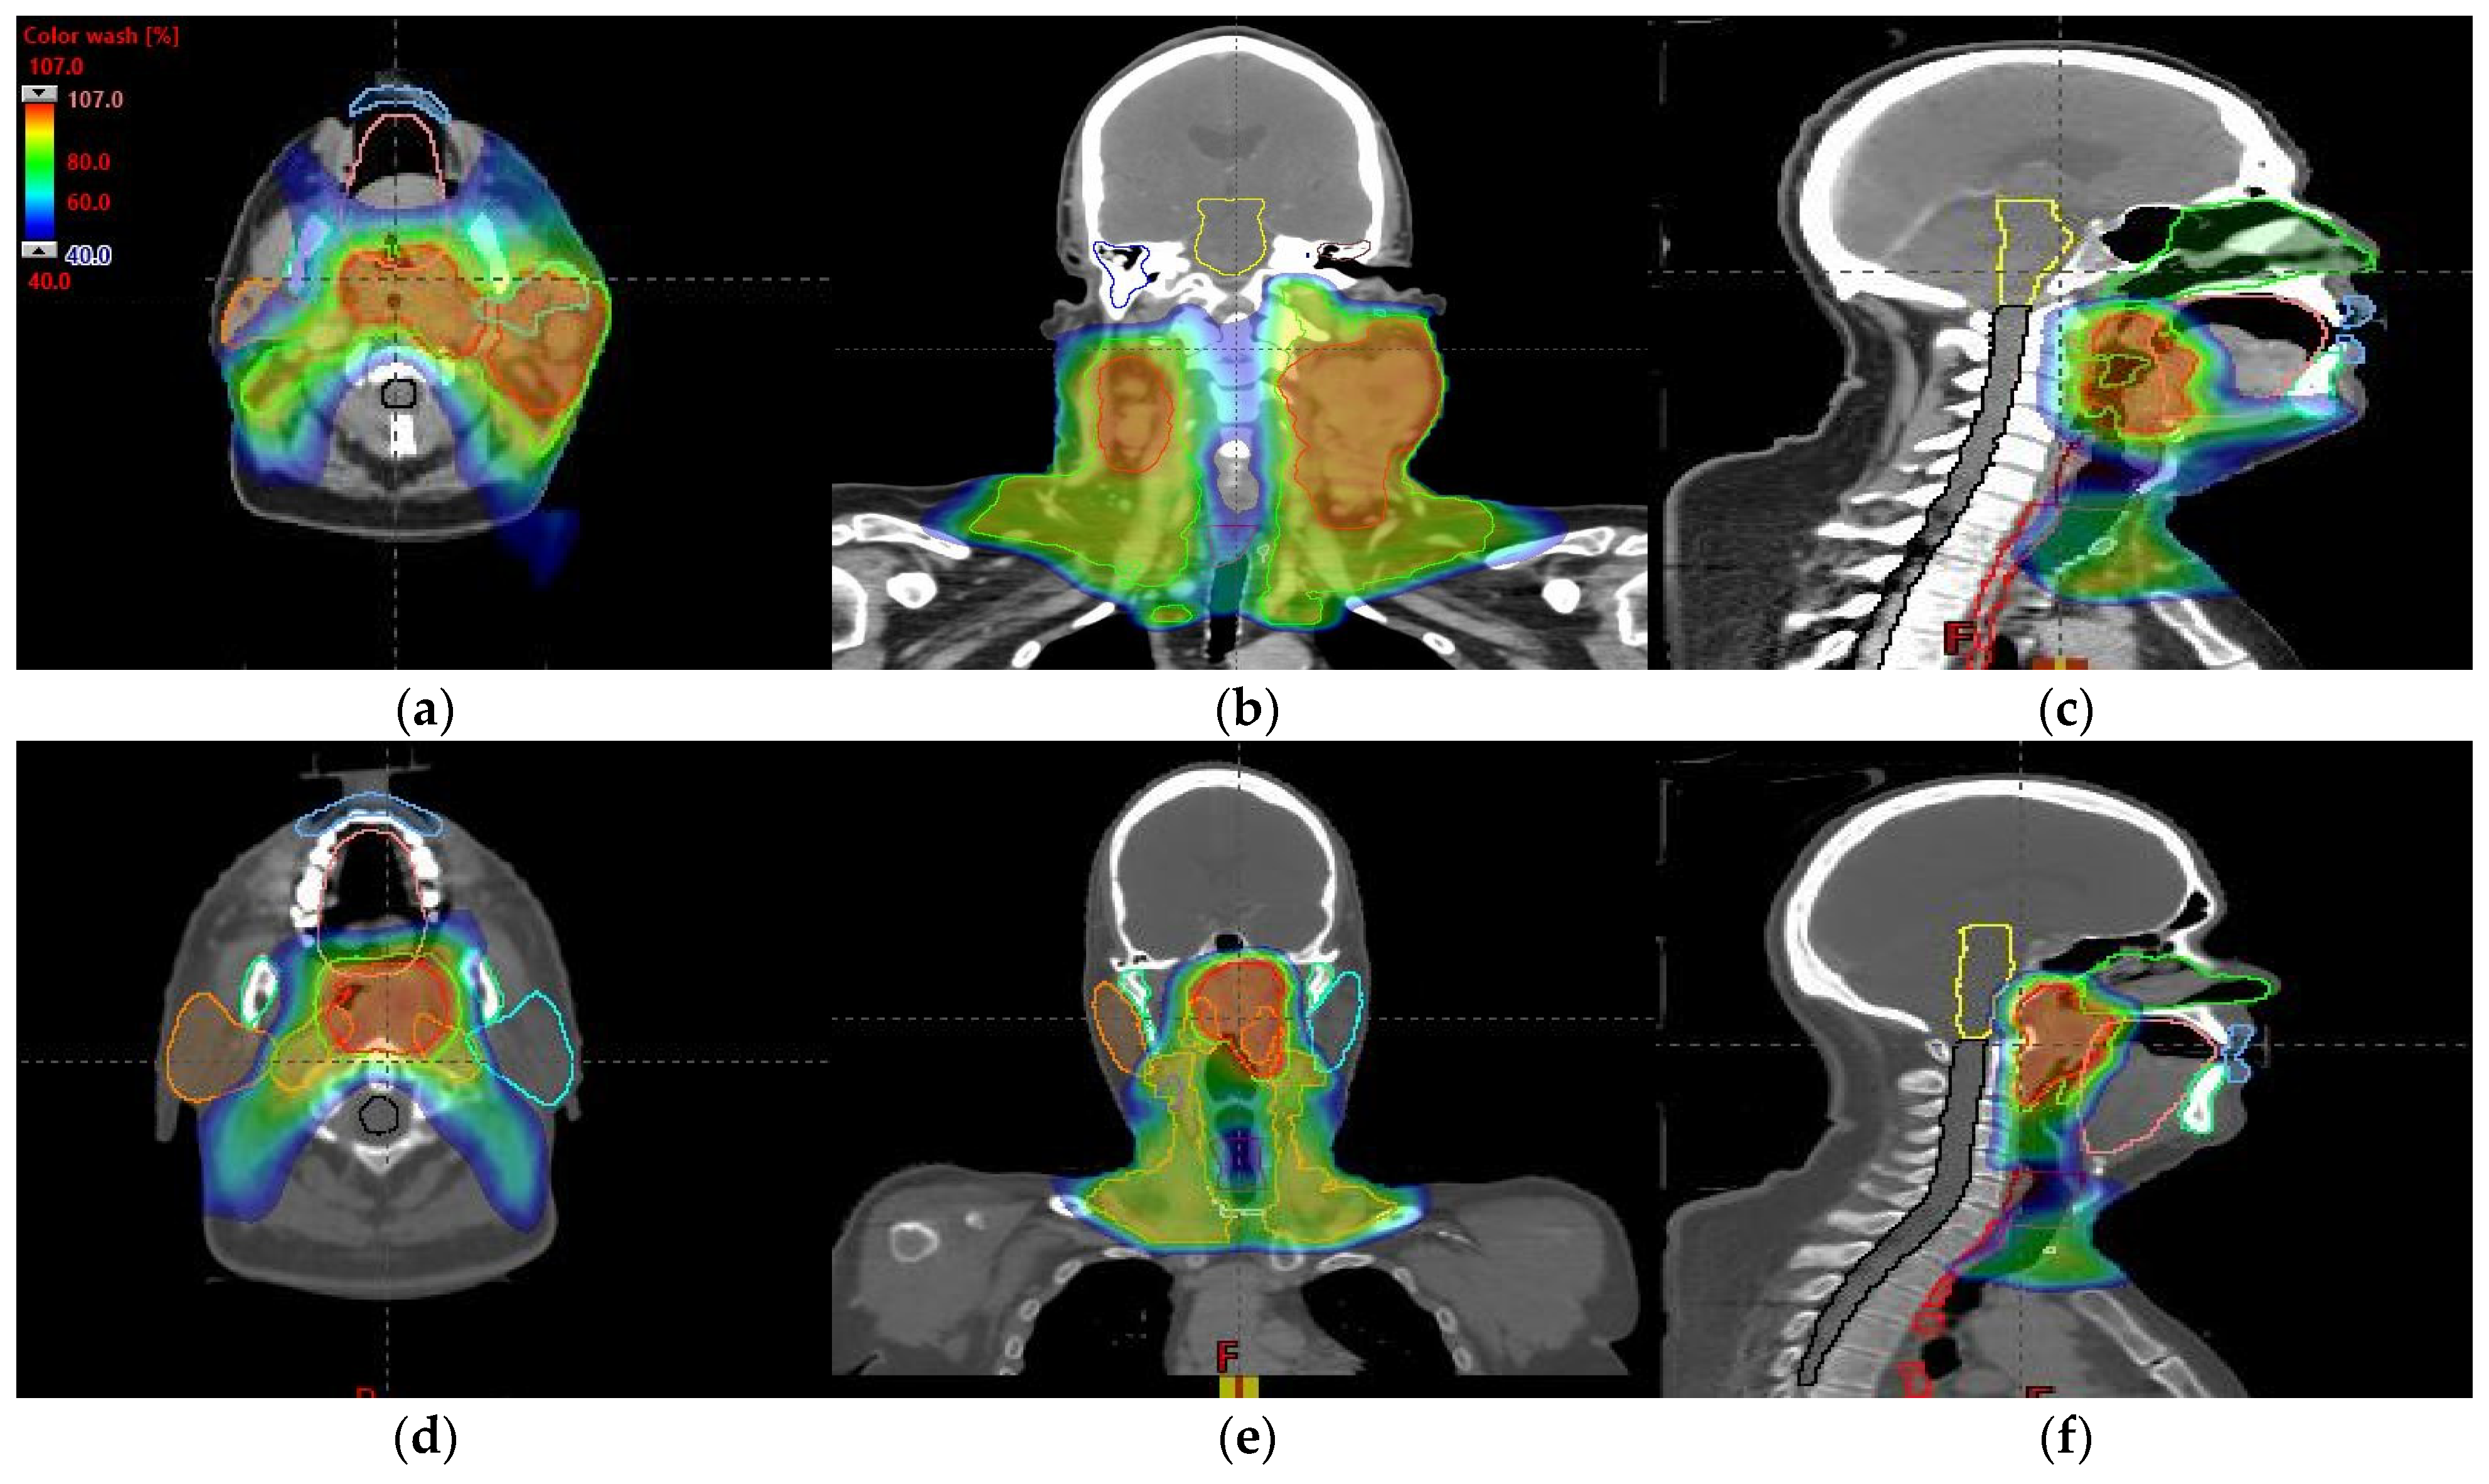
An MIBE of 160 MeV is the appropriate value to consider based on the results obtained for tumor coverage and homogeneity and dose sparing in healthy tissue (Table 3). The color coding is the same as that in Table 1. Figure 7a–d display the DVHs of the created proton treatment plans. We have also included slices (axial, sagittal, and coronal views) with the dose distribution overlayed (Figure 8a–f). For the two patients assessed, the developed plans displayed in Figure 8a–f correspond to a 160 MeV MIBE proton plan.

Table 3.
Clinical goals of the relevant OARs assessed in head and neck cancer patients 1 and 2 depending on MIBE value. V98% (%) for both high-, intermediate-, and low-risk PTVs and V107% (%) for high-risk PTV are also displayed.
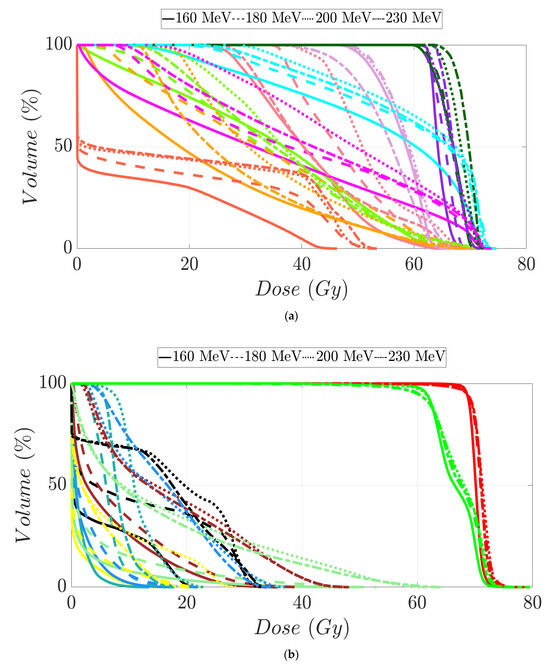
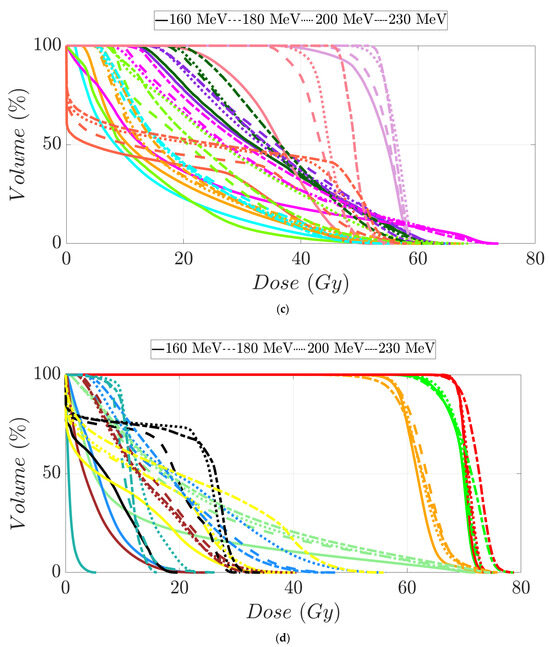
Figure 7.
Dose–volume histogram for head and neck cancer patients 1 (a,b) and 2 (c,d). The following structures are shown: PTVhigh-risk (red), PTVint-risk (green), PTVlow-risk (orange and only for patient 2), brainstem (yellow), left parotid (cyan), right parotid (orange), spinal cord (black), left cochlea (dark blue), right cochlea (magenta), mandible (lemon green), lips (light blue), left submandibular gland (dark green), right submandibular gland (purple), oral cavity (pink), esophagus (red), left mastoid (brown), right mastoid (blue), larynx (maroon), thyroid (light purple), and nasal cavity (green).
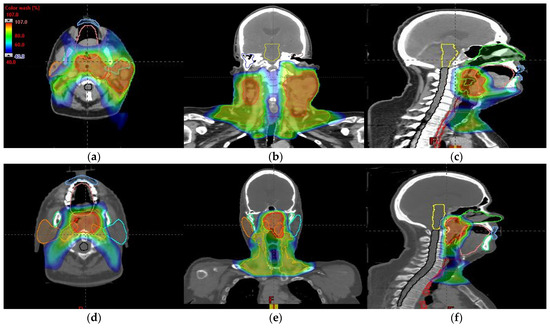
Figure 8.
Axial, coronal, and sagittal CT slices of head and neck cancer patients 1 (a–c) and 2 (d–f). Dose distribution is displayed showing isodose curves in a range from 40% (blue) to 107% (red) of the prescribed dose.
4. Discussion
In all scenarios, we found a non-negligible reduction in MIBE. The MIBE of 180 MeV or more, especially an MIBE of 120 MeV in the case of only treating a brain tumor, implies radioprotection benefits. This statement is based on the dependence of neutron production on proton beam energy. As we know, protons generate neutrons as a result of inelastic reactions with beam line devices and the patient. The neutron spectra generated from these proton interactions are less energetic, and the angular yield is narrower as the proton beam energy decreases [25,26,27]. In this way, the ambient equivalent dose rate caused by the neutrons also reduces the thickness of shielding needed to protect workers and public. Monte Carlo (MC) simulations [17,28,29,30] for monoenergetic proton pencil beams have been carried out to better understand the neutron dose out-of-field in patients. From these studies, it is clear that proton beam energy plays an important role in the neutron spectrum inside the patient. Essentially, the dependence of the neutron dose in patients with beam energy displays roughly the same behavior as explained above with shielding. This highlights the additional advantage of reducing MIBE to lower the required shielding. Likewise, it diminishes the length of a patient transport maze of proton therapy facilities to meet regulations for radiation workers and patient safety. And a byproduct of decreasing the overall footprint of the facility is a reduction in the cost of facility construction.
The treatment plans in our study consist of a step-and-shoot sequence of fields around the tumor volume. In this way, we have made a discretized approach to proton arc therapy (PAT) [31]. However, there are some aspects of this study that could be improved for practicality. First of all, the high demands on memory and computation speed make these assessments very challenging to calculate. Specifically, the spot optimization took approximately 20 to 40 min per plan without formally including robustness, proving that this is impractical to clinically implement on a traditional proton therapy TPS. Secondly, the TPS does not bring in the energy layer switching time [32] as others dedicated algorithms do [32,33,34,35,36]. Despite these shortcomings, we believe we have adequately demonstrated as a proof of concept that lower MIBE in proton therapy could still deliver treatments with adequate clinical plan quality. This advantage may influence beam delivery time as the number of energy layers is optimally reduced [32], especially for brain tumors. Therefore, our results show that PAT could benefit from and motivate new accelerator designs with a lower MIBE.
As we have stated above, there is no such beam line with this specific feature. Hence, future work should aim to define a hypothetical proton therapy unit in the TPS with a maximum energy of 120 MeV, for instance. This virtual machine would be created from experimental measurements made for the commission of a real proton therapy accelerator. Once this item is created, clinical plans for brain tumors can be elaborated and their viability and quality assurance can be checked through end-to-end tests. This workflow would then be followed for head and neck and prostate cases by defining virtual machines of 160 MeV and 180 MeV maximum energy, respectively.
Another aspect to consider is the number of patients evaluated per site. Despite our results for MIBEs lower than 230 MeV, we do not have a strong statistic to generalize the proper MIBE value per clinical site. Encouraged by these initial results, future work will aim to develop a TPS that can generate optimized plans for a much larger cohort of patients in a reasonable amount of time.
In conclusion, we have studied the required MIBE for a proton accelerator in optimized patient treatment planning. This evaluation was carried out in terms of dose coverage and homogeneity in tumors, as well as dose protection of normal tissue for each plan created. In all cases evaluated, we showed that 120 MeV MIBE is sufficient for the brain and 160 MeV MIBE met the demands for all sites other than the prostate, which required an MIBE of 180 MeV.
Author Contributions
Conceptualization, C.J.B., and K.M.F.; methodology, C.J.B.; software, C.J.B.; validation, C.J.B., A.P., and K.M.F.; formal analysis, C.J.B., A.P., and K.M.F.; investigation, C.J.B., A.P., and K.M.F.; data curation, C.J.B., and K.M.F.; writing—original draft preparation, A.P., and K.M.F.; writing—review and editing, C.J.B., A.P., and K.M.F.; visualization, A.P., and K.M.F.; supervision, C.J.B. and K.M.F.; project administration, C.J.B. All authors have read and agreed to the published version of the manuscript.
Funding
This research received no external funding.
Institutional Review Board Statement
The study was determined to be exempt from the requirement for IRB approval (45 CFR 46.104d, category 4) by the Institutional Review Board of Mayo Clinic (IRB# 22-013357) on 27 February 2023.
Informed Consent Statement
Not applicable.
Data Availability Statement
The original contributions presented in the study are included in the article; further inquiries can be directed to the corresponding author.
Conflicts of Interest
The authors declare no conflicts of interest.
References
- Newhauser, W.D.; Zhang, R. The physics of proton therapy. Phys. Med. Biol. 2015, 60, R155. [Google Scholar] [CrossRef]
- Berger, M.J.; Coursey, J.S.; Zucker, M.A.; Chang, J. ESTAR, PSTAR, and ASTAR: Computer Programs for Calculating Stopping-Power and Range Tables for Electrons, Protons, and Helium Ions (version 1.2.3). 2005. Available online: http://physics.nist.gov/PhysRefData/Star/Text/ESTAR.html (accessed on 19 August 2024).
- International Commission on Radiation Units and Measurements. Stopping Powers and Ranges for Protons and Alpha Particles; International Commission on Radiation Units and Measurements: Stockholm, Sweden, 1993; 286p. [Google Scholar]
- Paganetti, H.; Beltran, C.; Both, S.; Dong, L.; Flanz, J.; Furutani, K.; Grassberger, C.; Grosshans, D.R.; Knopf, A.-C.; Langendijk, J.A.; et al. Roadmap: Proton therapy physics and biology. Phys. Med. Biol. 2021, 7, 66. [Google Scholar] [CrossRef] [PubMed]
- Mohan, R.; Radhe Mohan, C. A review of proton therapy—Current status and future directions. Precis. Radiat. Oncol. 2022, 6, 164–176. [Google Scholar] [CrossRef] [PubMed]
- Collings, E.W.; Lu, L.; Gupta, N.; Sumption, M.D. Accelerators, Gantries, Magnets and Imaging Systems for Particle Beam Therapy: Recent Status and Prospects for Improvement. Front. Oncol. 2021, 15, 737837. [Google Scholar] [CrossRef] [PubMed]
- Yap, J.; Resta-López, J.; Kacperek, A.; Schnuerer, R.; Jolly, S.; Boogert, S.; Welsch, C. Beam characterisation studies of the 62 MeV proton therapy beamline at the Clatterbridge Cancer Centre. Phys. Medica 2020, 77, 108–120. [Google Scholar] [CrossRef]
- Schippers, M. Proton Accelerators. In Proton Therapy Physics, 2nd ed.; Pagganeti, H., Ed.; CRC Press: Boca Raton, FL, USA, 2018; pp. 69–111. [Google Scholar]
- Graeff, C.; Volz, L.; Durante, M. Emerging technologies for cancer therapy using accelerated particles. Prog. Part. Nucl. Phys. 2023, 131, 104046. [Google Scholar] [CrossRef] [PubMed]
- Lane, S.A.; Slater, J.M.; Yang, G.Y. Image-Guided Proton Therapy: A Comprehensive Review. Cancers. 2023, 15, 2555. [Google Scholar] [CrossRef] [PubMed]
- Johnstone, P.A.S.; Kerstiens, J.; Richard, H. Proton facility economics: The importance of “simple” treatments. J. Am. Coll. Radiol. 2012, 9, 560–563. [Google Scholar] [CrossRef]
- Lodge, M.; Pijls-Johannesma, M.; Stirk, L.; Munro, A.J.; De Ruysscher, D.; Jefferson, T. A systematic literature review of the clinical and cost-effectiveness of hadron therapy in cancer. Radiother. Oncol. 2007, 83, 110–122. [Google Scholar] [CrossRef]
- Peeters, A.; Grutters, J.P.C.; Pijls-Johannesma, M.; Reimoser, S.; De Ruysscher, D.; Severens, J.L.; Joore, M.A.; Lambin, P. How costly is particle therapy? Cost analysis of external beam radiotherapy with carbon-ions, protons and photons. Radiother. Oncol. 2010, 95, 45–53. [Google Scholar] [CrossRef]
- Pijls-Johannesma, M.; Pommier, P.; Lievens, Y. Cost-effectiveness of particle therapy: Current evidence and future needs. Radiother. Oncol. 2008, 89, 127–134. [Google Scholar] [CrossRef] [PubMed]
- Goitein, M.; Gentry, R.; Koehler, A.M. Energy of proton accelerator necessary for treatment of choroidal melanomas. Int. J. Radiat. Oncol. Biol. Phys. 1983, 9, 259–260. [Google Scholar] [CrossRef] [PubMed]
- Moyers, M.F.; Miller, D.W. Range, range modulation, and field radius requirements for proton therapy of prostate cancer. Technol. Cancer Res. Treat. 2003, 2, 445–447. [Google Scholar] [CrossRef]
- Sengbusch, E.; Pérez-Andújar, A.; DeLuca, P.M.; Mackie, T.R. Maximum proton kinetic energy and patient-generated neutron fluence considerations in proton beam arc delivery radiation therapy. Med. Phys. 2009, 36, 364–372. [Google Scholar] [CrossRef] [PubMed]
- Sengbusch, E.R.; Mackie, T.R. Maximum kinetic energy considerations in proton stereotactic radiosurgery. J. Appl. Clin. Med. Phys. 2011, 12, 122–131. [Google Scholar] [CrossRef] [PubMed]
- Agostinelli, S.; Allison, J.; Amako, K.; Apostolakis, J.; Araujo, H.; Arce, P.; Asai, M.; Axen, D.; Banerjee, S.; Barrand, G.; et al. Geant4—A simulation toolkit. Nucl. Instrum. Methods Phys. Res. A 2003, 506, 250–303. [Google Scholar] [CrossRef]
- Allison, J.; Amako, K.; Apostolakis, J.; Araujo, H.; Dubois, P.A.; Asai, M.; Barrand, G.; Capra, R.; Chauvie, S.; Chytracek, R.; et al. Geant4 developments and applications. IEEE Trans. Nucl. Sci. 2006, 53, 270–278. [Google Scholar] [CrossRef]
- Allison, J.; Amako, K.; Apostolakis, J.; Arce, P.; Asai, M.; Aso, T.; Bagli, E.; Bagulya, A.; Banerjee, S.; Barrand, G.; et al. Recent developments in Geant4. Nucl. Instrum. Methods Phys. Res. A 2016, 835, 186–225. [Google Scholar] [CrossRef]
- Lehrer, E.J.; Prabhu, A.V.; Sindhu, K.K.; Lazarev, S.; Ruiz-Garcia, H.; Peterson, J.L.; Beltran, C.; Furutani, K.; Schlesinger, D.; Sheehan, J.P.; et al. Proton and heavy particle intracranial radiosurgery. Biomedicines 2021, 9, 31. [Google Scholar] [CrossRef]
- Bryant, C.M.; Henderson, R.H.; Nichols, R.C.; Mendenhall, W.M.; Hoppe, B.S.; Vargas, C.E.; Daniels, T.B.; Choo, C.R.; Parikh, R.R.; Giap, H.; et al. Consensus statement on proton therapy for prostate cancer. Int. J. Part. Ther. 2021, 8, 1–16. [Google Scholar] [CrossRef]
- Lin, A.; Chang, J.H.C.; Grover, R.S.; Hoebers, F.J.P.; Parvathaneni, U.; Patel, S.H.; Thariat, J.; Thomson, D.J.; Langendijk, J.A.; Frank, S.J. PTCOG head and neck subcommittee consensus guidelines on particle therapy for the management of head and neck tumors. Int. J. Part. Ther. 2021, 8, 84–94. [Google Scholar] [CrossRef]
- Agosteo, S.; Magistris, M.; Mereghetti, A.; Silari, M.; Zajacova, Z. Shielding data for 100-250 MeV proton accelerators: Double differential neutron distributions and attenuation in concrete. Nucl. Instrum. Methods Phys. Res. B 2007, 265, 581–598. [Google Scholar] [CrossRef]
- Agosteo, S.; Magistris, M.; Silari, M. Shielding of proton accelerators. Radiat. Prot. Dosim. 2011, 146, 414–424. [Google Scholar] [CrossRef] [PubMed]
- Sariyer, D.; Küçer, R.; Küçer, N. Neutron Shielding Properties of Concretes Containing Boron Carbide and Ferro—Boron. Procedia—Soc. Behav. Sci. 2015, 195, 1752–1756. [Google Scholar] [CrossRef]
- Pérez-Andújar, A.; Zhang, R.; Newhauser, W. Monte carlo and analytical model predictions of leakage neutron exposures from passively scattered proton therapy. Med. Phys. 2013, 40, 121714. [Google Scholar] [CrossRef]
- Trinkl, S.; Mares, V.; Englbrecht, F.S.; Wilkens, J.J.; Wielunski, M.; Parodi, K.; Rühm, W.; Hillbrand, M. Systematic out-of-field secondary neutron spectrometry and dosimetry in pencil beam scanning proton therapy. Med. Phys. 2017, 44, 1912–1920. [Google Scholar] [CrossRef] [PubMed]
- Englbrecht, F.S.; Trinkl, S.; Mares, V.; Rühm, W.; Wielunski, M.; Wilkens, J.J.; Hillbrand, M.; Parodi, K. A comprehensive Monte Carlo study of out-of-field secondary neutron spectra in a scanned-beam proton therapy gantry room. Z. Med. Phys. 2021, 31, 215–228. [Google Scholar] [CrossRef]
- Seco, J.; Gu, G.; Marcelos, T.; Kooy, H.; Willers, H. Proton Arc Reduces Range Uncertainty Effects and Improves Conformality Compared With Photon Volumetric Modulated Arc Therapy in Stereotactic Body Radiation Therapy for Non-Small Cell Lung Cancer. Int. J. Radiat. Oncol. Biol. 2013, 87, 188–194. [Google Scholar] [CrossRef] [PubMed]
- Ding, X.; Li, X.; Zhang, J.M.; Kabolizadeh, P.; Stevens, C.; Yan, D. Spot-Scanning Proton Arc (SPArc) Therapy: The First Robust and Delivery-Efficient Spot-Scanning Proton Arc Therapy. Int. J. Radiat. Oncol. Biol. Phys. 2016, 96, 1107–1116. [Google Scholar] [CrossRef]
- Gu, W.; Ruan, D.; Lyu, Q.; Zou, W.; Dong, L.; Sheng, K. A novel energy layer optimization framework for spot-scanning proton arc therapy. Med. Phys. 2020, 47, 2072–2084. [Google Scholar] [CrossRef]
- Liu, G.; Li, X.; Zhao, L.; Zheng, W.; Qin, A.; Zhang, S.; Stevens, C.; Yan, D.; Kabolizadeh, P.; Ding, X. A novel energy sequence optimization algorithm for efficient spot-scanning proton arc (SPArc) treatment delivery. Acta Oncol. 2020, 59, 1178–1185. [Google Scholar] [CrossRef] [PubMed]
- Zhao, L.; Liu, G.; Chen, S.; Shen, J.; Zheng, W.; Qin, A.; Yan, D.; Li, X.; Ding, X. Developing an accurate model of spot-scanning treatment delivery time and sequence for a compact superconducting synchrocyclotron proton therapy system. Radiat. Oncol. 2022, 17, 87. [Google Scholar] [CrossRef] [PubMed]
- Zhao, L.; Liu, G.; Li, X.; Ding, X. An evolutionary optimization algorithm for proton arc therapy. Phys. Med. Biol. 2022, 67, 16NT01. [Google Scholar] [CrossRef] [PubMed]
Disclaimer/Publisher’s Note: The statements, opinions and data contained in all publications are solely those of the individual author(s) and contributor(s) and not of MDPI and/or the editor(s). MDPI and/or the editor(s) disclaim responsibility for any injury to people or property resulting from any ideas, methods, instructions or products referred to in the content. |
© 2024 by the authors. Licensee MDPI, Basel, Switzerland. This article is an open access article distributed under the terms and conditions of the Creative Commons Attribution (CC BY) license (https://creativecommons.org/licenses/by/4.0/).

