Article

A Platform for Laser-Driven Ion Sources Generated with Nanosecond Laser Pulses in the Intensity Range of 1013–1015 W/cm2

by
L. Giuffrida
1,*,
V. Istokskaia
1,2,
A. Picciotto
3,
V. Kantarelou
1,
M. Barozzi
3,
R. Dell`Anna
3,
M. Divoky
4,
O. Denk
4,
D. Giubertoni
3,
F. Grepl
1,2,
A. Hadjikyriacou
1,2,
M. Hanus
4,
J. Krasa
5,
M. Kucharik
2,
T. Levato
1,†,
P. Navratil
4,
J. Pilar
4,
F. Schillaci
1,
S. Stancek
1,6,
M. Tosca
1,7,
M. Tryus
1,
A. Velyhan
1,
A. Lucianetti
4,
T. Mocek
4 and
D. Margarone
1,8
add Show full author list remove Hide full author list
1
ELI Beamlines Facility, The Extreme Light Infrastructure ERIC, 25241 Dolni Brezany, Czech Republic
2
Faculty of Nuclear Sciences and Physical Engineering, Czech Technical University in Prague, 11519 Prague, Czech Republic
3
Micro-Nano Facility, Sensors and Devices, Fondazione Bruno Kessler, 38121 Trento, Italy
4
HiLASE Centre, Institute of Physics of the Czech Academy of Sciences, 25241 Dolni Brezany, Czech Republic
5
Institute of Physics ASCR, v.v.i (FZU), 10000 Prague, Czech Republic
6
Joint Laboratory of Optics, Institute of Physics of Academy of Sciences of the Czech Republic, Faculty of Science, Palacky University, 77900 Olomouc, Czech Republic
7
Faculty of Mathematics and Physics, Department of Macromolecular Physics, Charles University, V Holešovičkách 2, 18000 Prague, Czech Republic
8
Centre for Light-Matter Interactions, School of Mathematics and Physics, Queen’s University Belfast, Belfast BT7 1NN, UK
*
Author to whom correspondence should be addressed.
Currently Address: Advanced Material Research Center, Technology Innovation Institute, Masdar City 50819, United Arab Emirates.
Quantum Beam Sci. 2024, 8(1), 5; https://doi.org/10.3390/qubs8010005
Submission received: 21 July 2023 / Revised: 11 December 2023 / Accepted: 4 January 2024 / Published: 10 January 2024

Abstract

:
An experimental platform for laser-driven ion (sub-MeV) acceleration and potential applications was commissioned at the HiLASE laser facility. The auxiliary beam of the Bivoj laser system operating at a GW level peak power (~10 J in 5–10 ns) and 1–10 Hz repetition rate enabled a stable production of high-current ion beams of multiple species (Al, Ti, Fe, Si, Cu, and Sn). The produced laser–plasma ion sources were fully characterized against the laser intensity on the target (1013–1015 W/cm2) by varying the laser energy, focal spot size, and pulse duration. The versatility and tuneability of such high-repetition-rate laser–plasma ion sources are of potential interest for user applications. Such a statistically accurate study was facilitated by the large amount of data acquired at the high repetition rate (1–10 Hz) provided by the Bivoj laser system.

1. Introduction

Following the first demonstration in 1960 of a laser from a ruby crystal [1], various laser systems started to be used in different research fields. In the 1970s, the possibility to focus a pulsed laser beam into a solid medium to generate ion sources was recognized as a very promising field of research [2,3]. In the 1990s, laser technologies were able to demonstrate the generation of very short pulses (of a few tens of femtoseconds). In addition, thanks to the recent discovery of the chirped pulse amplification (CPA) technique [4], it became possible to concentrate relatively high laser energy in ultra-short pulses, thus enabling the rapid development of TW and PW laser systems [5].
Currently, laser-driven ion sources are being considered as a complementary and compact approach for the generation of ion sources with unique features (e.g., peak current, short bunch duration, high charge state, and low emittance) compared with conventional accelerators. Consequently, a strong effort of the laser–plasma scientific community has been put into the optimization of such non-conventional ion sources (concerning energy, flux, and stability) based on key requirements for their potential use in societal applications, such as cancer treatment ([6,7]), energy production from inertial confinement fusion [8], and cultural heritage [9].
Recently, the availability of table-top, fs-class laser systems operating at a relatively low peak power (TW level) but at a high repetition rate (10 Hz to 1 kHz) has opened exciting new directions of research, including the acceleration of ions with moderate energies (MeV level) but high average flux and high stability [10,11]. On the other hand, table-top, ns-class laser systems operating at a repetition rate of ~10 Hz and delivering 0.01–1 J laser energy on target have been widely used in the last decades to produce high-current ion sources with low energies at laser intensities in the range of 1010–1012 W/cm2 (refs. [12,13,14]). Applications in the fields of pulsed laser deposition [15], laser-induced breakdown spectroscopy [16], nanoparticle production [17], laser implantation [18], and the generation of laser ion sources [19] call for special requirements in terms of ion source performances being optimized prior to the given experiment.
This work is based on the commissioning of an experimental area available for users at the HiLASE laser facility (Czech Republic), which offers the capability to use the auxiliary beam of the Bivoj laser system (10 J, 5–10 ns in FWHM and 1–10 Hz) focused on solid targets at laser intensities of up to 1015 W/cm2 to generate and subsequently use ion sources of different species and energies.
The data on laser–plasma ion sources available in the literature in the intensity range of 1013–1015 W/cm2 have been achieved using kJ class nanosecond (or sub-ns) laser pulses [20,21], which typically operate in a single shot regime (~1 shot/30 min). Herein, we propose a parametric study of the ion beam characteristics at the same laser intensity level but using a laser system delivering much lower energy per pulse (1–10 J) and a much higher repetition rate (up to 10 Hz).
In the vision of future multidisciplinary applications, a parametric study of such laser-driven ion sources is required to evaluate the versatility and tuneability of such particle beams via appropriate experimental scaling laws. We note that the possibility to generate stable ion beams at high repetition rates (up to 10 Hz) enabled us to acquire a large amount of experimental data and, thus, to minimize statistical uncertainties coming from laser–plasma shot-to-shot fluctuations in order to build up robust and reliable scaling laws. In addition, hydrodynamic simulations were performed with the main objective of supporting the interpretation of the acquired experimental data.
Additionally, an application in the field of laser-driven ion implantation was preliminarily explored as a proof-of-principle experimental test and to benchmark results from online diagnostics (TOF-based ion diagnostics) with offline analysis (secondary-ion mass spectrometry analysis (SIMS)).

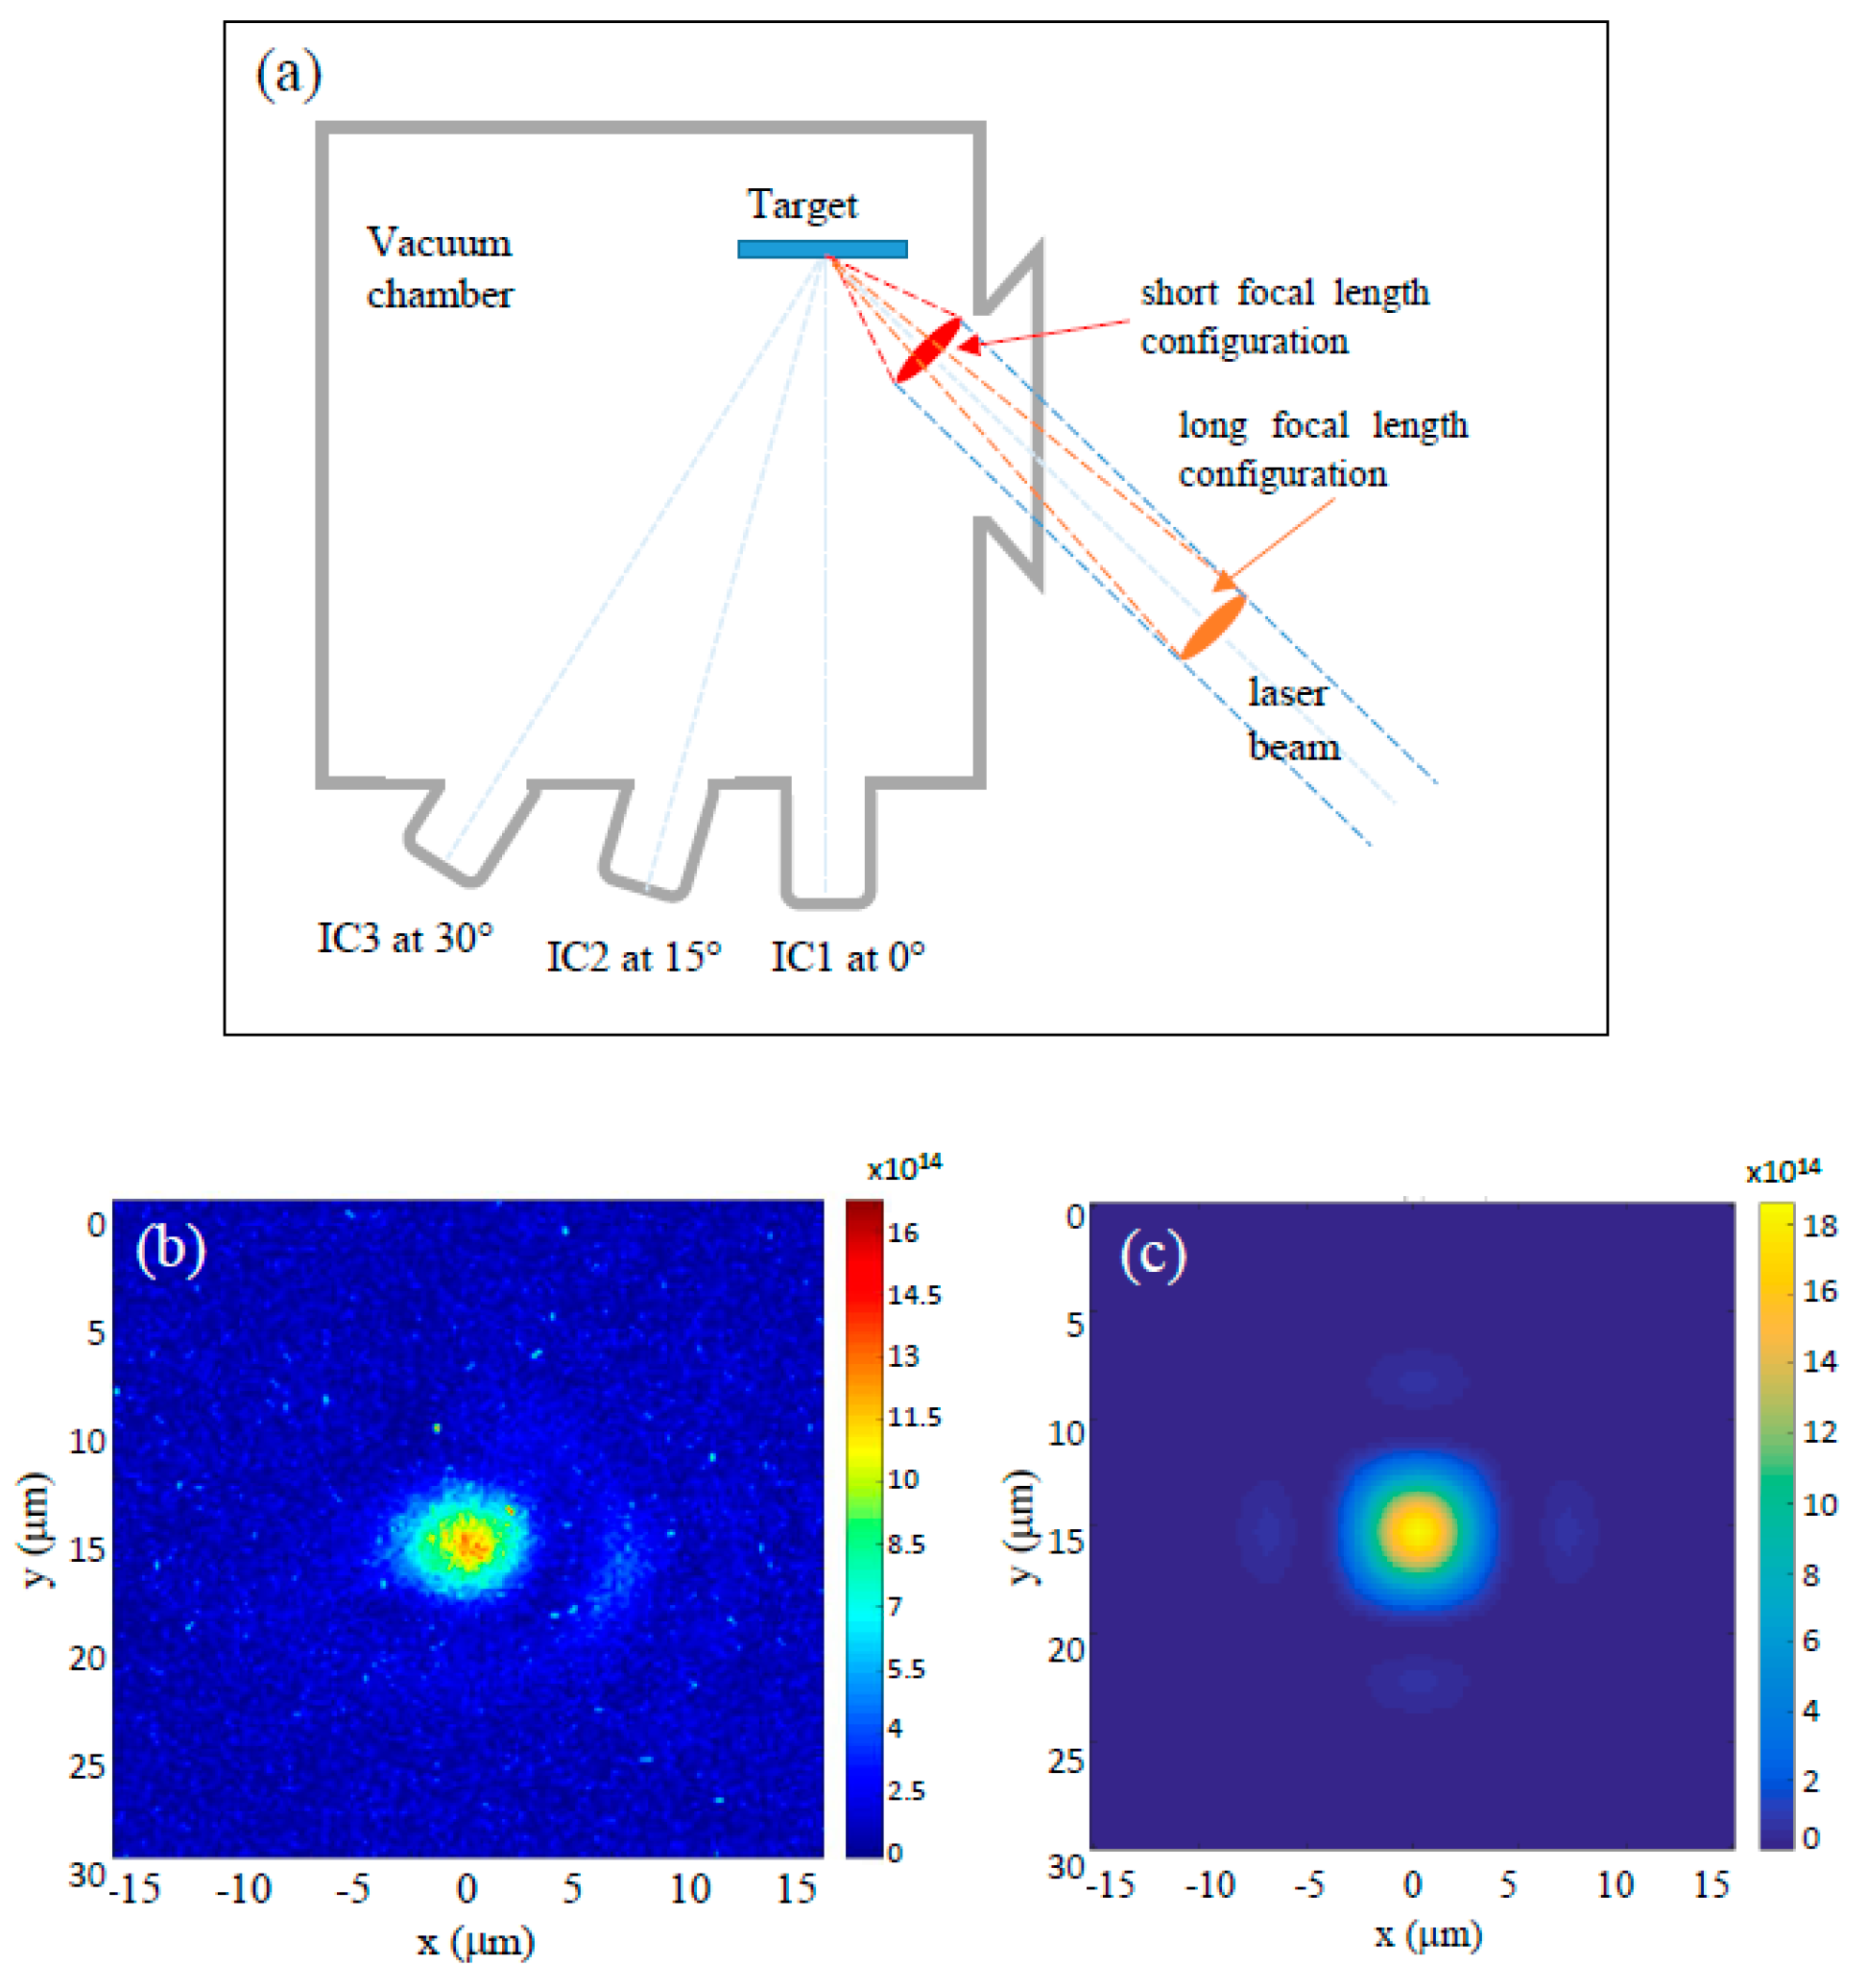
2. Experimental Setup

The used experimental platform was located in the user open-access area of the HiLASE laser facility. It consisted of an in-air optical setup for an online shot-to-shot characterization of the laser beam, a vacuum chamber for the laser–target interaction, and a set of online diagnostics to characterize the ion source. A sketch of the experimental apparatus is depicted in Figure 1a.
The auxiliary beam of the Bivoj laser system (22 × 22 mm2) available for users at this experimental platform allows us to deliver up to 10 J at the fundamental wavelength of 1030 nm with a tunable pulse width from 5 to 10 ns (super-Gaussian). Additionally, the temporal pulse profile can be shaped with a 150 ps resolution based on the specific user requirements [22]. In the following discussion, the laser beam is assumed to have a super-Gaussian spatial profile of the 14th order.
The results shown herein are the result of multiple experimental campaigns achieved using different optical setups.
During the first experiment, a lens with a focal distance of 500 mm was used to focus the laser beam with a minimum spot radius of 24 μm, allowing us to produce laser-driven ion sources in the laser intensity range from 1.5 × 10¹³ to 6 × 10¹³ W/cm2.
A major improvement in the laser beam parameters (namely, the wavefront) allowed us to reach a better spatial quality, resulting in the enhancement of the laser intensity on the target up to 4 × 10¹⁴ W/cm2 (with a laser spot radius of 9.5 µm (FWHM)).
Finally, a new optical setup using a shorter focal lens (100 mm) was used to test the laser–plasma accelerator performance with higher laser intensities (of up to 1.4 × 10¹⁵ W/cm2).
An example of the best laser focal spot measured with a microscopic objective system is presented in Figure 1b. Figure 1c shows a numerical estimation of the laser spot in the focal plane performed using the Virtual Lab Fusion software that returned a value of 4.2 μm, whilst the best experimentally achieved focal spot was 5.5 μm. This corresponds to a laser peak intensity of 2 × 10¹⁵ W/cm2, which is very close to the measured value of 1.4 × 10¹⁵ W/cm2.
However, the use of the short focal lens located inside the vacuum chamber created limitations in the total number of laser shots on the target due to the large amount of debris generated during the high-repetition-rate laser–target interaction and quickly deposited on the lens surface, thus deteriorating the lens performance after a short irradiation time.
In contrast, the long focal lens optical setup, where the lens was located outside the vacuum environment, resolved the issue of debris deposited on the lens surface and made it possible to fire an unlimited number of shots on the target, although the maximum achievable laser intensity was reduced down to 4 × 10¹⁴ W/cm2.
The used cubic vacuum chamber (50 × 50 × 50 cm3) was modular in terms of flanges and viewports available for the connections of various plasma diagnostics directly aiming at the interaction point. Furthermore, thanks to the intentionally small chamber volume, the overall pumping time (from atmospheric pressure to ~10−5 mbar) was much less than 30 min.
Various targets were mounted onto a rotating holder that allowed us to operate up to a repetition rate of 10 Hz, thus enabling us to fire several thousands of laser shots in a single experimental series [23]. The device had two motors, a linear stage for lateral movements and a rotation stage (the combination of both movements made an imprint on the target surface that was like a spiral). The monitoring system used for the alignment of both the laser beam and the target on the focal plane was an infinity-corrected long working distance objective with 10× magnification connected to a tube lens of 200 mm and a CCD camera.
Three ion collectors (ICs) were placed at 0°, 15°, and 30° with respect to the target normal to provide an online shot-to-shot full characterization of the ion source using the time-of-flight (TOF) technique [24]. The laser–target angle of incidence was 45°.
The experimental results reported in this work were obtained using bulk targets (several mm in thickness), thus accelerating ions only in the backward direction (against the incoming laser direction).

3. Experimental Results

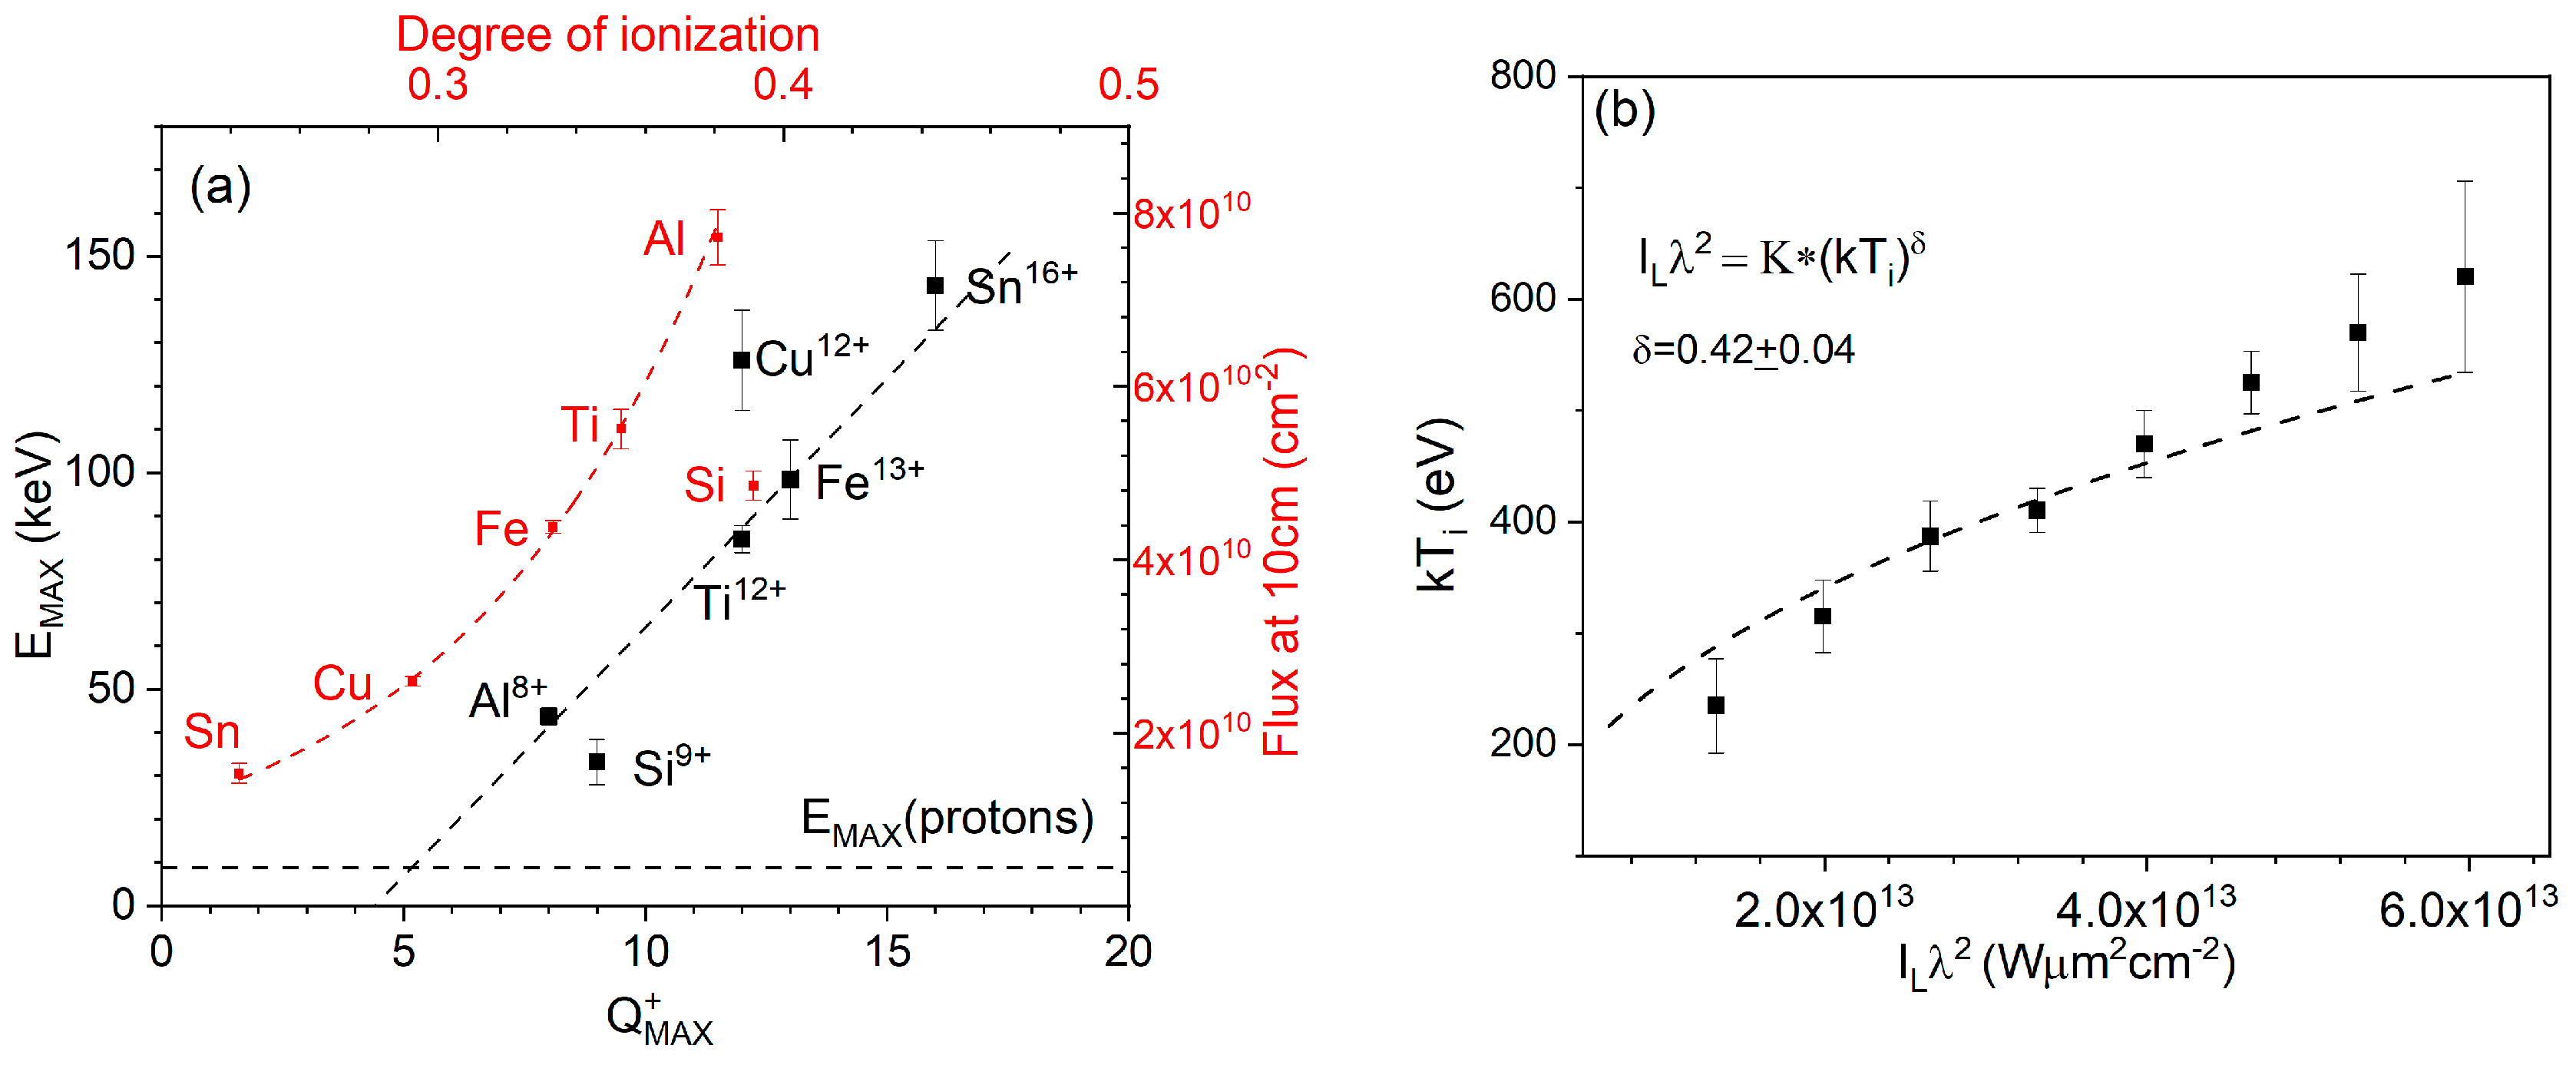
3.1. Laser Intensity Level of up to 6 × 10¹³ W/cm2

The first goal of our work was to perform a systematic study of the performances of the laser–plasma ion sources generated with different target materials in the laser intensity range from 1 × 10¹³ W/cm2 to 6 × 10¹³ W/cm2. This was achieved thanks to a statistically robust investigation showing that light-element targets (e.g., Al) can produce substantially higher ion fluxes compared with heavy-element ones (e.g., Sn). This can be qualitatively explained by the observation that low-Z materials have higher degrees of ionization compared with high-Z materials, thus leading to the generation of larger ion fluxes. Such a dependence is shown in Figure 2a. The red dashed line refers to the measured ion flux against the degree of ionization of the different target materials. On the other hand, the black dashed line shows a linear dependence of the experimental ion cutoff energy versus the calculated maximum ion charge state. It is worth noting that the Si and Cu ions are not in good agreement with the best-fit curve (black dashed line).
At the laser intensity of interest (of the order of 1013 W/cm2), inverse Bremsstrahlung is the main laser absorption mechanism occurring in the plasma [25]. A qualitative picture of the overall acceleration process in the investigated experimental conditions is presented herein.
During the first stages of the laser–target irradiation, electrons undergo isotropic heating and start to collide with other charged particles in the produced plasma. The plasma heated by such collisional absorption occurring at the target front side expands into the half-space away from the target plane. Since protons are the lightest positively charged species in the plasma, they leave the target earlier than other ion species; thus, they are accelerated with an average kinetic energy that does not strongly depend on the target composition but mainly on the laser intensity (this is also shown in Figure 2a, reporting a constant trend for the maximum proton energy for different target materials). Ultimately, at the end of the laser interaction, the plasma heating process ends, and a local space charge effect is generated within the plasma Debye length. Then, the highly charged ions are further pushed away from the high-density, positively charged plasma region, i.e., they acquire additional kinetic energy due to Coulomb repulsion effects that depend on the effective ion charge state. As a result of this mechanism, the final ion energy does not (or only slightly) depend on the plasma (electron) temperature but on the Coulomb repulsion, which is more effective for high ion charge states. The maximum ion energies are recorded for the ions with the highest charge states, whilst the proton energy is basically independent of the target material.
A full characterization of the ion source is mandatory for its optimization and for a deep understanding of the underlying physical processes that regulate the laser–plasma interaction and subsequent ion acceleration. One of the key plasma parameters that can be indirectly extracted from the TOF spectra is the ion temperature kTi. To accomplish this goal, a dedicated experimental run consisting of a series of consecutive laser shots onto Al targets in the intensity range 1 × 10¹³–6 × 10¹³ W/cm2 was conducted. The recorded TOF spectra were post-processed to estimate the ion temperature, using the following fit function [26,27]:
i t = A d 2 t 5 e x p m i 2 k T i d t v S 2
where i(t) is the ion current, A is the normalization coefficient, d is the flight distance, mi is the ion mass, t is the detected TOF, vS is the velocity shift, and kTi is the ion temperature.
The obtained results are summarized in Figure 2b, reporting the relationship between the ion temperature kTi and the laser irradiance I L λ 2 using a fit function of the following type:
T i = K ( I L λ 2 ) δ
where K is the normalization coefficient, and δ is the fitting parameter. The best fit returned a parameter δ = 0.42 ± 0.04, as shown in Figure 2b.

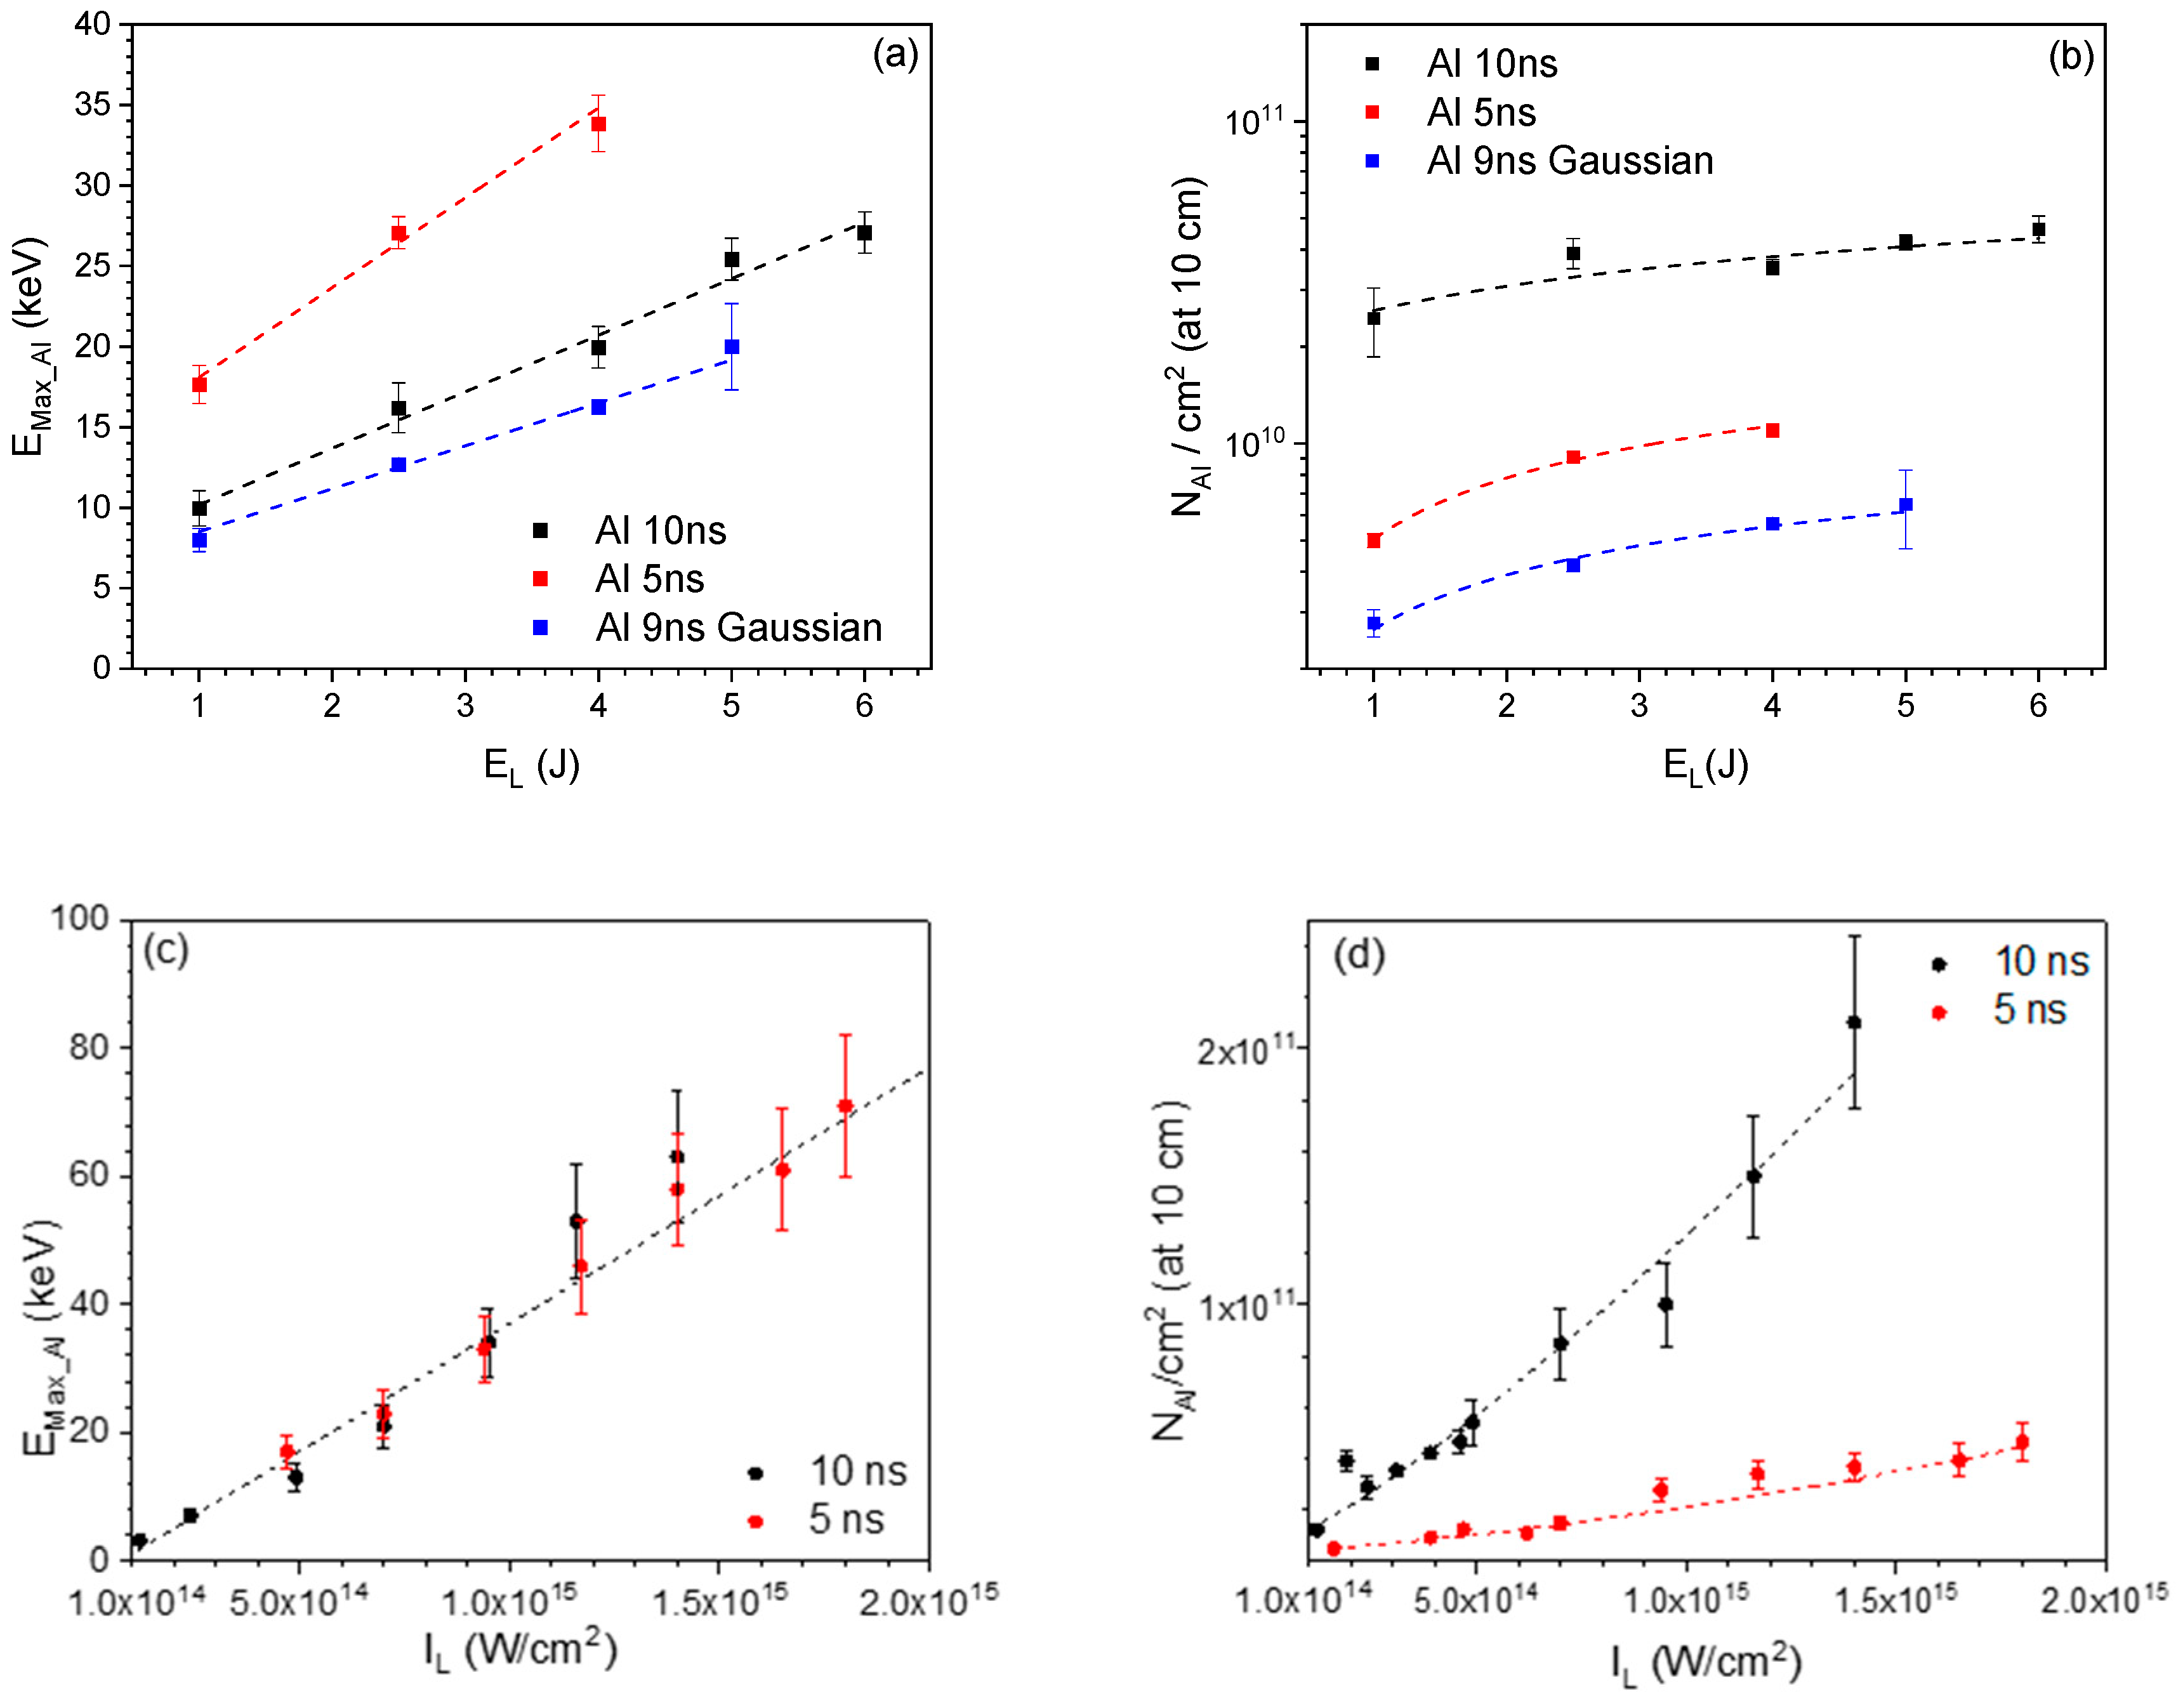
3.2. Laser Intensity Level of up to 2 × 10¹⁵ W/cm2

A test was performed using the short focal lens configuration with the goal of reaching the highest laser intensity on target, which was only possible working with the smallest laser focal spot at the interaction point, as shown in Figure 1b. The laser energy was varied from 0.5 J to 6 J for the given pulse duration of 10 ns, thus allowing us to modulate the laser intensity on the target in the range of 2.4 × 10¹⁴–1.4 × 10¹⁵ W/cm2. In this experimental run, a 2 mm thick Al target was used.
Some examples of TOF spectra recorded at different laser energies (i.e., intensities) with the ICs placed at 0° (a), 15° (b), and 30° (c) are shown in Figure 3. It is worth noting that the amplitudes of such spectra were normalized to a 1 m detection distance for immediate comparison between detectors placed at different distances. In general, the ion signal is faster (rising earlier in the TOF spectrum) when higher laser energies are used and when the detector is closer to the target normal (with a small detection angle).
Moreover, at a given laser energy, the ion signal amplitude decreases when increasing the detection angle (e.g., in the case of a 6 J laser energy, the ion current corresponding to the main peak decreases from ~13 mA at 0° to ~6 mA at 30°).
The long focal lens (f = 500 mm) configuration was used in all the remaining experimental runs to avoid technical issues related to target debris contamination. This setup is appropriate for long irradiation intervals at high repetition rates, e.g., in the case of user applications in the field of laser-driven ion implantation [28,29].
The main drawback of the long focal lens setup is the relatively large focal spot compared with the short focal lens case, which causes a drop in the laser intensity down to ~7 × 10¹⁴ W/cm2 (for a laser energy of 6 J). Laser parameter scans (energy and pulse duration) were carried out to investigate the scaling laws for the ion cutoff energy and ion flux.
A summary of all the experimental runs performed with an Al target is shown in Figure 4a,b. The ion cutoff energy and flux normalized to a 10 cm detection distance was studied for 5 ns (in red), 10 ns (in black), and 9 ns (but with a Gaussian temporal profile, in blue) pulse widths. The experimental values shown in Figure 4 are averaged over 10 consecutive shots obtained in the same laser/target conditions and measured with the IC placed at 0°.
For completeness, the fluxes were normalized to 10 cm since this can be relevant to applications such as ion implantation.
Figure 4a reports the maximum Al ion energies obtained with different laser energies in the cases of 5 ns and 10 ns super-Gaussian temporal profiles and for the case of a 9 ns Gaussian temporal profile. For a given laser energy, the shorter the pulse width, the higher the maximum ion energy, which can be easily linked to the corresponding higher laser intensity. Similarly, for a given pulse duration, the maximum ion energy increases proportionally to the laser energy.
The fit of the experimental points was performed using the following linear formula:
E max _ A l = a + b E L
where Emax_Al is the maximum Al ion energy, EL is the laser energy, and a and b are the fitting parameters. The slope of curve b ranges from 2.7 ± 0.2 (the 9 ns Gaussian case) to 5.6 ± 0.6 (the 5 ns case), with an intermediate value of 3.5 ± 0.2 for the 10 ns case.
On the other hand, the longer the pulse duration, the higher the ion flux (Figure 4b). A longer pulse duration (target irradiation time) can be associated with a plasma sustained for a longer time, thus causing a larger amount of material to be emitted from the target surface and, in turn, a higher ion flux.
Figure 4c shows the relation between the maximum Al ion energy and the laser intensity. The plot clearly shows that the ion energy does not depend on the laser pulse width but merely on the laser intensity. All data can be fitted using the fitting curve:
E max _ A l = a 1 I L b 1
showing an almost linear behavior with b1 equal to 1.087 ± 0.005.
On the other hand, the ion flux strongly depends on the pulse duration, as is shown in Figure 4d, where it appears to be much larger in the case of a 10 ns pulse width.
Figure 4a,b clearly show that the use of a Gaussian pulse is much less efficient than using a super-Gaussian one, both in terms of the ion cutoff energy and ion flux. Hydrodynamic simulations performed with the 2D cylindrical arbitrary Lagrangian–Eulerian code PALE [30] support such experimental findings.
Figure 5 shows a comparison of hydrodynamic simulations obtained using a Gaussian (9 ns pulse width at FWHM) and a super-Gaussian (10 ns at FWHM) laser pulse. Figure 5a–c shows the Al density profile evolution at three different times (2 ns, 6 ns, and 10 ns, respectively) after the interaction of the laser beam with the target. The laser beam comes from the top of each plot and propagates along the z-direction into the Al target (target normal direction). The target front surface is thus positioned at z = 0 μm.
The simulations show that 2 ns after the laser–target interaction (Figure 5a) the shock wave position in the Al target is slightly deeper in the super-Gaussian pulse case. Such a difference largely increases after 6 ns (Figure 5b) and even more at 10 ns (Figure 5c). The super-Gaussian temporal profile is very steep, thus delivering almost all the energy exactly in 10 ns. Vice versa, the Gaussian shape distributes the energy in a broader time. Ultimately, the super-Gaussian pulse supports a more efficient interaction with the target than the Gaussian one. This feature can be clearly seen in the ion density profile calculated numerically: a larger ablated volume appears in the super-Gaussian case.
For completeness, Figure 5d reports the comparison of TOF spectra obtained in both cases by using the same IC detector with the laser parameters used in the hydrodynamic simulations. The TOF spectrum recorded from ions generated by a super-Gaussian pulse (in black) shows a much higher signal than the Gaussian case (in red). Moreover, the TOF signal starts to rise much earlier for the super-Gaussian pulse, thus demonstrating a clear enhancement of the maximum ion energy, as previously summarized in Figure 4.

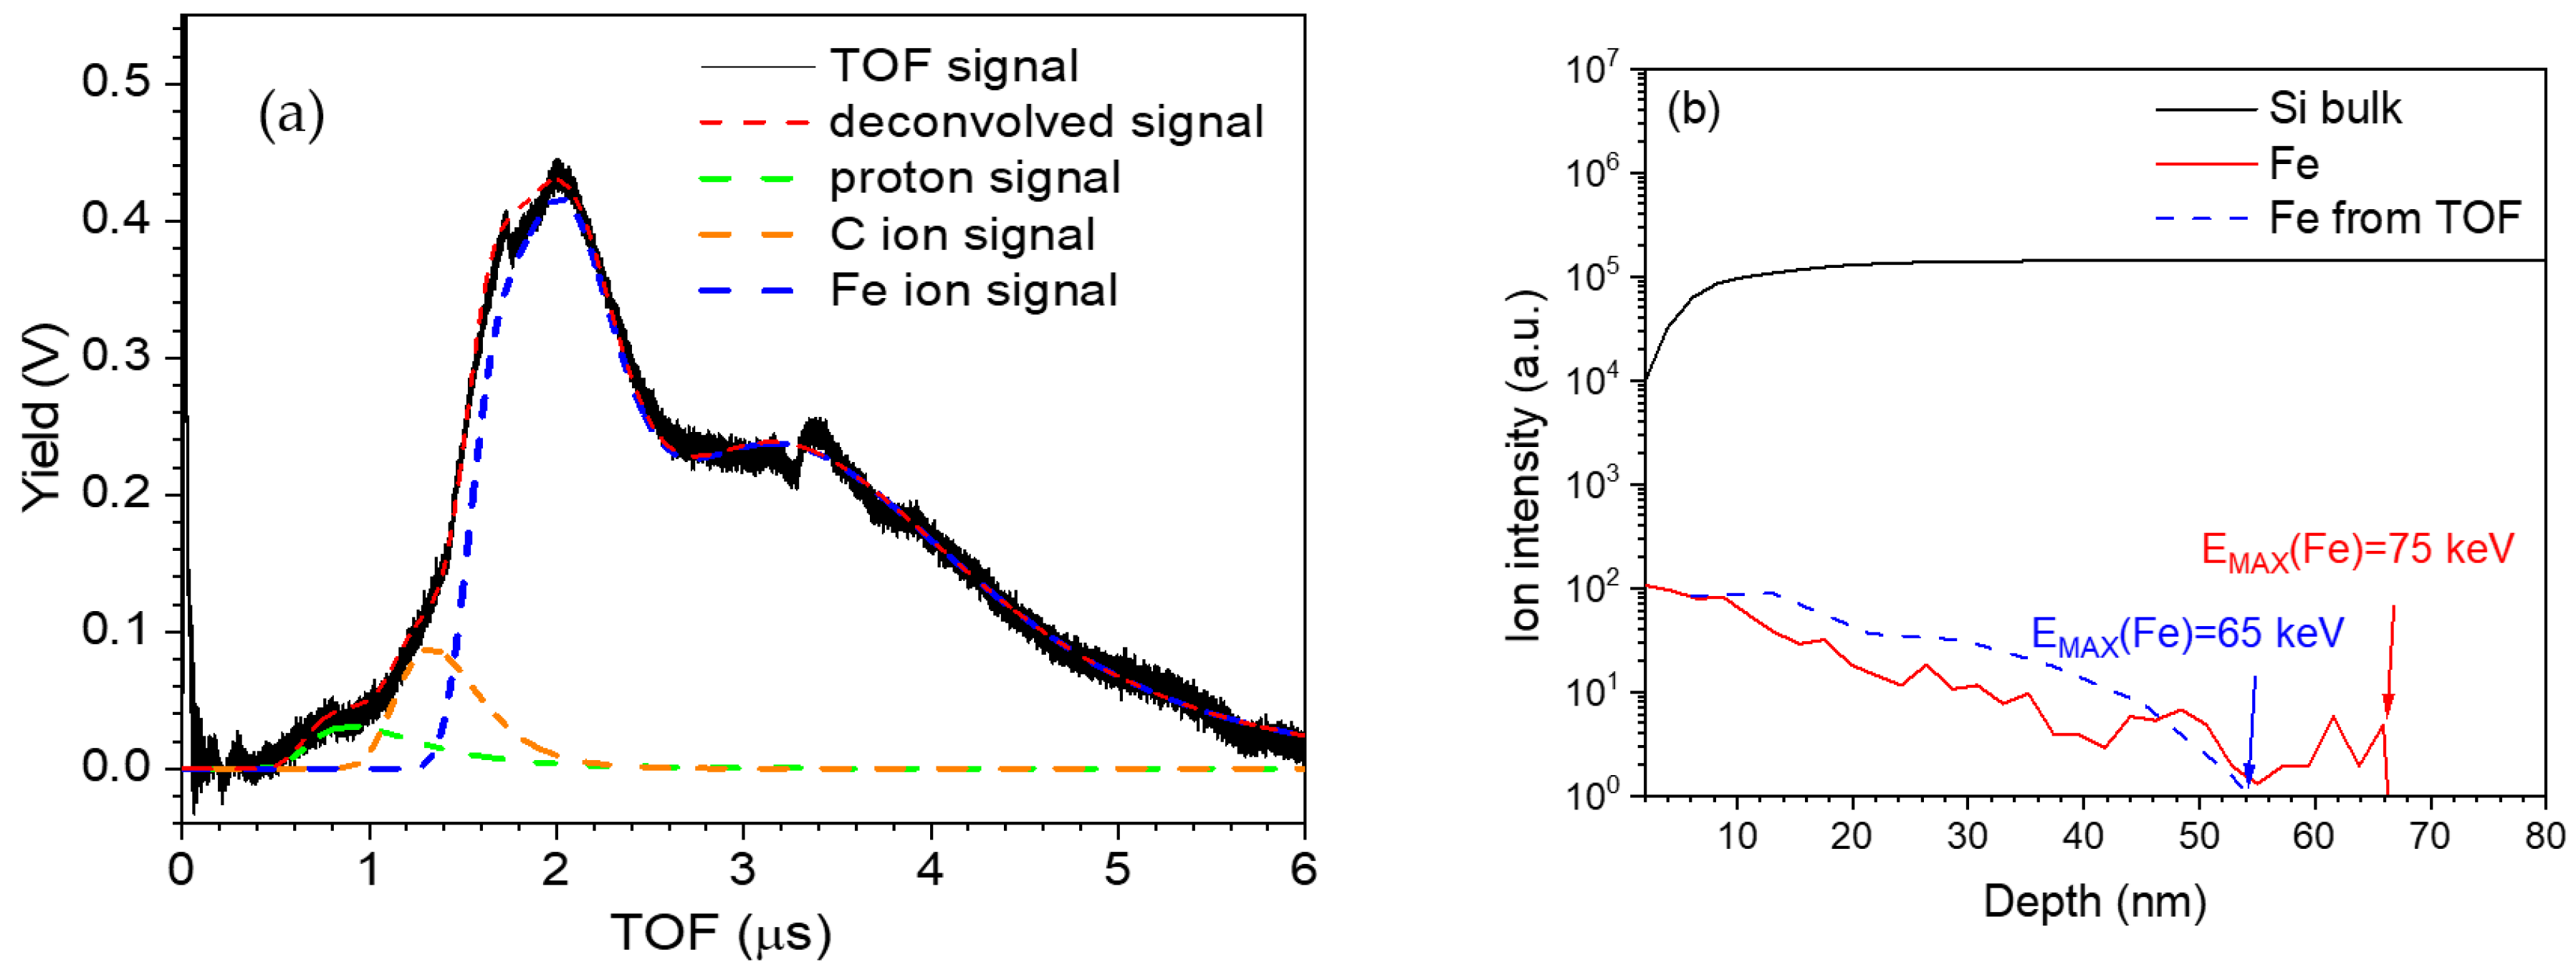
3.3. Ion Diagnostic Benchmark

The online ion diagnostic data were benchmarked with results estimated using ex situ techniques. A good agreement between the results from the TOF diagnostics and the estimation carried out using the SIMS (secondary-ion mass spectrometry analysis) technique, carried out on a sample implanted with ions from the laser plasma source, was demonstrated. For this particular measurement, the Bivoj laser beam was focused with an intensity of 1.4 × 10¹⁵ W/cm2 onto an Fe target. The laser-accelerated Fe ions were implanted on Si substrates (2 × 2 cm2) placed at a 10 cm distance from the Fe target and different angles with respect to the target normal and were simultaneously monitored online with the IC-TOF diagnostics.
An example of a TOF spectrum recorded with the IC positioned at an angle of 15° and 63 cm away from the target, obtained during a run of 3600 consecutive laser shots, is shown in Figure 6a. The TOF spectrum shows an intense and narrow photo-peak used as the starting signal (0 ns), which corresponds to the X-ray plasma radiation produced by the laser–target interaction. This is followed by a broad signal, corresponding to XUV radiation coming from electron recombination processes in the plasma. The beginning of the peak ascribable to ions at approximately 0.4 μs corresponds to protons (the fastest positively charged particles in the plasma) and shows maximum energies of ~10 keV. The most intense and broad part of the signal ascribable to Fe ions and other contaminants present on the target surface (mainly hydrocarbons) starts at ~1 μs and returns a maximum Fe ion energy of 65 keV. Since ion signals of different species in the TOF spectra can overlap with each other, a technique of signal decomposition was applied to distinguish the different components [24]. Figure 6a shows the original TOF spectrum (black line) and the signal (dashed red line) obtained using the revelation of individual ion components (proton signal in green, C ion signal in orange, and Fe ion signal in blue). Such analysis also allowed us to estimate a total Fe ion flux of ~1 × 10¹¹ ions/cm2 at 10 cm from the target.
After ion implantation, all the samples were accurately characterized at Fondazione Bruno Kessler (FBK). Figure 6b shows a result from the SIMS analysis performed in one of the irradiated Si samples placed 10 cm far from the target and at 17° with respect to the target normal and implanted with laser-accelerated Fe ions. The ion intensity profile (relative intensity vs. depth of implantation) for the Si substrate (black line) and the implanted material (Fe in red line) are shown.
The estimated penetration range of Fe ions into the Si substrate between 60 and 70 nm corresponded to a maximum Fe ion energy of 75 keV, which was estimated using the Monte-Carlo-based software SRIM [31].
Additionally, the SIMS analyses allowed us to estimate a flux of 3.4 × 10¹⁰ Fe ions/cm2/shot. Both values (the maximum ion energy and ion flux) were in agreement with those found in the TOF analyses. The penetration depth of Fe ions shown in blue in Figure 6b was estimated from the energy distribution extracted from the TOF signal using the SRIM code to convert the Fe ion energy into the corresponding range in the Si substrate. As shown, the calculated Fe ion range matches well with the one measured via SIMS analyses.
The ion source features demonstrated experimentally at high repetition rates are of interest for future user applications. For example, ion implantation on large samples, e.g., coating various materials with homogenous or nanostructured layers of the desired material (e.g., carbon) [32], requires an overall ion dose in the substrate of the order of 1015 atoms/cm2.
As a proof-of-principle demonstration of such an application, herein, it was demonstrated that by assuming an ion rate of ~5 × 10¹⁰ Fe ions/cm2/shot, it is possible to implant 1015 Fe ions/cm2 into a Si substrate with a depth of 50 nm in ~30 min at a repetition rate of 10 Hz.
As an additional feature, the commissioned laser–plasma ion sources showed unique characteristics in terms of ion beam current in the order of a few amperes in the energy range of several tens of keV, as shown in Figure 7. This is of high relevance in the field of laser ion sources. In fact, heavy ions with a high charge state can be injected into a radiofrequency cavity [33,34] for post-acceleration. In particular, the ion source characterized in the present manuscript can produce a much higher current with respect to the previously published results (where the injected current is in the order of a few hundred mA per shot), which is of interest for applications requiring accelerators that can deliver a relatively high average beam power.
As a potential perspective, the 100 J arm of the Bivoj laser system could be used to enhance the performances of such a laser-driven ion source. In fact, considering the same laser characteristics in terms of the pulse duration and spot size as in the 10 J arm, the 10× higher laser energy would allow it to reach a 10× higher laser intensity in the order of 1016 W/cm2. As a result, higher ion energies could be reached (of ~400 keV, considering the scaling law in Formula (4) extracted from Figure 4c) and, thus, pave the way toward additional applications (e.g., [35]).

4. Conclusions

The results from the commissioning experiment of the laser–plasma ion source platform at the HiLASE Centre were presented. The 10 J auxiliary beam of the ns class Bivoj laser system was operated at a high repetition rate (of up to 10 Hz), thus demonstrating the capability of such an experimental platform to accommodate future user experiments requiring laser-driven ion beams with energies of up to 150 keV as a repetitive source for applications. Various target materials (Al, Ti, Fe, Si, Cu, and Sn) were investigated in the laser intensity range of 1013–1015 W/cm2 (with a 5–10 ns pulse width) with the goal of demonstrating the versatility of the produced laser–plasma ion sources.
The described results represent a statistically robust experimental study enabled by the high repetition rate capability of the experimental chain (laser system, target refreshing device, ion diagnostics, data acquisition, and real-time data analysis), which allowed us to average laser–plasma shot-to-shot fluctuations out and, thus, investigate the experimental scaling laws and, consequently, tune the ion source parameters based on user requirements for future applications.

Author Contributions

Conceptualization: L.G., A.P., A.L., T.M. and D.M.; setup preparation: L.G., F.G., M.T. (M. Tryus), F.S. and A.V.; software: V.I., S.S., A.H., M.K. and T.L.; laser operation: M.D., O.D., M.H., J.P. and P.N.; experiment running: L.G., M.T. (M. Tosca), F.S., S.S., V.I. and A.V.; data analysis: L.G., V.I., A.P., V.K., M.B., R.D., D.G., A.H. and S.S.; data evaluation: L.G., D.M. and J.K.; writing—original draft preparation: L.G. and D.M.; writing—review and editing: all authors; supervision: L.G. and D.M.; project preparation: L.G., A.P., D.M., A.L. and T.M.; funding acquisition: D.M., M.K. and T.M. All authors have read and agreed to the published version of the manuscript.

Funding

This work was supported by the Ministry of Education, Youth, and Sports of the Czech Republic under project no. LQ1606 and the project Advanced Research Using High-Intensity-Laser-Produced Photons and Particles (CZ. 02.1.01/0.0/0.0/16_019/0000789). M. Kucharik was supported by the Czech Science Foundation project 19-24619S, the European Regional Development Fund project CZ. 02.1.01/0.0/0.0/16_019/0000778, the EUROfusion project CfP-FSD-AWP21-ENR-01-CEA-02, and RVO 68407700. This work was co-financed by the European Regional Development Fund and the state budget of the Czech Republic (project HiLASE CoE: grant no. CZ. 02.1.01/0.0/0.0/15_006/0000674).

Data Availability Statement

Dataset available on request from the authors.

Conflicts of Interest

The authors declare no conflicts of interest.

References

  1. Maiman, T.H. Stimulated Optical Radiation in Ruby. Nature 1960, 187, 493–494. [Google Scholar] [CrossRef]
  2. Peacock, N.J.; Pease, R.S. Sources of highly stripped ions. J. Phys. D Appl. Phys. 1969, 2, 1705. [Google Scholar] [CrossRef]
  3. Nuckolls, J.; Wood, L.; Thiessen, A.; Zimmerman, G. Laser Compression of Matter to Super-High Densities: Thermonuclear (CTR) Applications. Nature 1972, 239, 139–142. [Google Scholar] [CrossRef]
  4. Strickland, D.; Mourou, G. Compression of amplified chirped optical pulses. Opt. Commun. 1985, 56, 447–449. [Google Scholar] [CrossRef]
  5. Danson, C.N.; Haefner, C.; Bromage, J.; Butcher, T.; Chanteloup, J.C.-F.; Chowdhury, E.A.; Galvanauskas, A.; Gizzi, L.A.; Hein, J.; Hillier, D.I.; et al. Petawatt and exawatt class lasers worldwide. High Power Laser Sci. Eng. 2019, 7, e54. [Google Scholar] [CrossRef]
  6. Bulanov, S.V.; Khoroshkov, V.S. Feasibility of using laser ion accelerators in proton therapy. Plasma Phys. Rep. 2002, 28, 5. [Google Scholar] [CrossRef]
  7. Yogo, A.; Maeda, T.; Hori, T.; Sakaki, H.; Ogura, K.; Nishiuchi, M.; Sagisaka, A.; Kiriyama, H.; Okada, H.; Kanazawa, S.; et al. Measurement of relative biological effectiveness of protons in human cancer cells using a laser-driven quasi mono energetic proton beamline. Appl. Phys. Lett. 2011, 98, 053701. [Google Scholar] [CrossRef]
  8. Zylstra, A.B.; Hurricane, O.A.; Callahan, D.A.; Kritcher, A.L.; Ralph, J.E.; Robey, H.F.; Ross, J.S.; Young, C.V.; Baker, K.L.; Casey, D.T.; et al. Burning plasma achieved in inertial fusion. Nature 2022, 601, 542–548. [Google Scholar] [CrossRef]
  9. Barberio, M.; Veltri, S.; Scisciò, M.; Antici, P. Laser-Accelerated Proton Beams as Diagnostics for Cultural Heritage. Sci. Rep. 2017, 7, 40415. [Google Scholar] [CrossRef]
  10. Morrison, J.T.; Feister, S.; Frische, K.D.; Austin, D.R.; Ngirmang, G.K.; Murphy, N.R.; Orban, C.; Chowdhury, E.A.; Roquemore, W.M. MeV proton acceleration at kHz repetition rate from ultra-intense laser liquid interaction. New J. Phys. 2018, 20, 022001. [Google Scholar] [CrossRef]
  11. Levy, D.; Andriyash, I.A.; Haessler, S.; Ouillé, M.; Kaur, J.; Flacco, A.; Kroupp, E.; Malka, V.; Lopez-Martens, R. Low-divergence MeV-class proton beams from kHz-driven laser-solid interactions. Phys. Rev. Accel. Beams 2022, 25, 093402. [Google Scholar] [CrossRef]
  12. Torrisi, L.; Caridi, F.; Giuffrida, L. Comparison of Pd plasmas produced at 532 nm and 1064 nm by a Nd:YAG laser ablation. Nucl. Instrum. Methods Phys. Res. B 2010, 268, 13. [Google Scholar]
  13. Kashiwagi, H.; Hattori, T.; Hayashizaki, N.; Yamamoto, K.; Takahashi, Y.; Hata, T.; Okamura, M.; Jameson, R.A.; Katayama, T.; Mescheryakov, N. Nd–YAG laser ion source for direct injection scheme. Rev. Sci. Instrum. 2004, 75, 5. [Google Scholar] [CrossRef]
  14. Rosinski, M.; Giuffrida, L.; Parys, P.; Gasior, P.; Fazio, E.; Mezzasalma, A.M.; Torrisi, L.; Ando, L.; Wolowski, J. Laser produced streams of Ge ions accelerated and optimized in the electric fields for implantation into SiO2 substrates. Rev. Sci. Instrum. 2012, 83, 02B305. [Google Scholar] [CrossRef] [PubMed]
  15. Wang, L.; Li, W.; Zhang, W.; Li, L.; Zhao, R.; Liu, Q.; Li, L.; Wang, H.; Yang, H. Manipulating redox reaction during pulsed laser deposition. J. Appl. Phys. 2015, 118, 185305. [Google Scholar] [CrossRef]
  16. Stavropoulos, P.; Michalakou, A.; Skevis, G.; Couris, S. Laser-induced breakdown spectroscopy as an analytical tool for equivalence ratio measurement in methane-air premixed flames. Spectrochim. Acta Part B 2004, 59, 1885. [Google Scholar] [CrossRef]
  17. Mangione, A.; Torrisi, L.; Picciotto, A.; Caridi, F.; Margarone, D.; Fazio, E.; La Mantia, A.; Di Marco, G. Carbon nanocrystals produced by pulsed laser ablation of carbon. Radiat. Eff. Defects Solids 2005, 160, 655–662. [Google Scholar] [CrossRef]
  18. Giuffrida, L.; Torrisi, L.; Calcagnile, L.; Rosinski, M. Ge Post-Acceleration from laser-generated plasma. Nucl. Instrum. Methods A 2010, 623, 716–719. [Google Scholar] [CrossRef]
  19. Kanesue, T.; Fuwa, Y.; Kondo, K.; Okamura, M. Laser ion source with solenoid field. Appl. Phys. Lett. 2014, 105, 193506. [Google Scholar] [CrossRef]
  20. Jungwirth, K. Recent highlights of the PALS research program. Laser Part. Beams 2005, 23, 2. [Google Scholar] [CrossRef]
  21. Láska, L.; Jungwirth, K.; Krása, J.; Pfeifer, M.; Rohlena, K.; Ullschmied, J.; Badziak, J.; Parys, P.; Wolowski, J.; Gammino, S.; et al. Charge-state and energy enhancement of laser-produced ions due to nonlinear processes in preformed plasma. Appl. Phys. Lett. 2005, 86, 081502. [Google Scholar] [CrossRef]
  22. Navratil, P.; Slezak, O.; Pilar, J.; Ertel, K.G.; Hanus, M.; Banerjee, S.; Phillips, P.J.; Smith, J.; De Vido, M.; Lucianetti, A.; et al. Characterization of Bivoj/DiPOLE 100: HiLASE 100-J/10-Hz diode pumped solid state laser. In Proceedings SPIE 10511, Solid State Lasers XXVII: Technology and Devices; SPIE: San Francisco, CA, USA, 2018; Volume 105110X. [Google Scholar] [CrossRef]
  23. Chagovets, T.; Stanček, S.; Giuffrida, L.; Velyhan, A.; Tryus, M.; Grepl, F.; Istokskaia, V.; Kantarelou, V.; Wiste, T.; Martin, J.C.H.; et al. Automation of Target Delivery and Diagnostic Systems for High Repetition Rate Laser-Plasma Acceleration. Appl. Sci. 2021, 11, 1680. [Google Scholar] [CrossRef]
  24. Margarone, D.; Krása, J.; Giuffrida, L.; Picciotto, A.; Torrisi, L.; Nowak, T.; Musumeci, P.; Velyhan, A.; Prokůpek, J.; Láska, L.; et al. Full characterization of laser-accelerated ion beams using Faraday cup, silicon carbide, and single-crystal diamond detectors. J. Appl. Phys. 2011, 109, 103302. [Google Scholar] [CrossRef]
  25. Eliezer, S. The Interaction of High-Power Lasers with Plasmas; CRC Press: Boca Raton, FL, USA, 2002. [Google Scholar]
  26. Krása, J.; Velyhan, A.; Jungwirth, K.; Krouský, E.; Láska, L.; Rohlena, K.; Pfeifer, M.; Ullschmied, J. Repetitive outbursts of fast carbon and fluorine ions from sub-nanosecond laser-produced plasma. Laser Part. Beams 2009, 27, 171–178. [Google Scholar] [CrossRef]
  27. Picciotto, A.; Krása, J.; Láska, L.; Rohlena, K.; Torrisi, L.; Gammino, S.; Mezzasalma, A.; Caridi, F. Plasma temperature and ion current analysis of gold ablation at different laser power rates. Nucl. Instrum. Methods B 2006, 247, 261–267. [Google Scholar] [CrossRef]
  28. Rosinski, M.; Gasior, P.; Fazio, E.; Ando, L.; Giuffrida, L.; Torrisi, L.; Parys, P.; Mezzasalma, A.; Wolowski, J. Laser generated Ge ions accelerated by additional electrostatic field for implantation technology. Appl. Surf. Sci. 2013, 272, 109–113. [Google Scholar] [CrossRef]
  29. Krása, J.; Láska, L.; Rohlena, K.; Peřina, V.; Hnatowicz, V. Energy spectra of Ag, Au, Sn, and Pb ions emitted from laser-created plasmas determined from their implantation depth profile in a metallic substrate. Laser Part. Beams 2002, 20, 109–112. [Google Scholar] [CrossRef]
  30. Liska, R.; Kuchařík, M.; Limpouch, J.; Renner, O.; Váchal, P.; Bednárik, L.; Velechovský, J. ALE Method for Simulations of Laser-Produced Plasmas. In Finite Volumes for Complex Applications VI Problems & Perspectives; Fořt, J., Fürst, J., Halama, J., Herbin, R., Hubert, F., Eds.; Springer Proceedings in Mathematics; Springer: Berlin/Heidelberg, Germany, 2011; Volume 4. [Google Scholar] [CrossRef]
  31. Available online: www.srim.org (accessed on 8 January 2024).
  32. Maffini, A.; Pazzaglia, A.; Dellasega, D.; Russo, V.; Passoni, M. Production of Carbon Nanofoam by Pulsed Laser Deposition on Flexible Substrates. Carbon Mater. Chem. Phys. 2022, 11, 135–157. [Google Scholar] [CrossRef]
  33. Sako, T.; Yamaguchi, A.; Sato, K.; Goto, A.; Iwai, T.; Nayuki, T.; Nemoto, K.; Kayama, T.; Takeuchi, T. Development of C6+ laser ion source and RFQ linac for carbon ion radiotherapy. Rev. Sci. Instrum. 2016, 87, 02C109. [Google Scholar] [CrossRef]
  34. Okamura, M.; Takeuchi, T.; Jameson, R.A.; Kondrashev, S.; Kashiwagi, H.; Sakakibara, K.; Kanesue, T.; Tamura, J.; Hattori, T. Direct plasma injection scheme in accelerators. Rev. Sci. Instrum. 2008, 79, 02B314. [Google Scholar] [CrossRef]
  35. Romano, L.; Impellizzeri, G.; Tomasello, M.V.; Giannazzo, F.; Spinella, C.; Grimaldi, M.G. Nanostructuring in Ge by self-ion implantation. J. Appl. Phys. 2010, 107, 084314. [Google Scholar] [CrossRef]
Figure 1. (a) Schematic of the experimental setup for the two possible optical geometries: the short focal lens (in red) and the long focal lens (in orange) setups. Three ion collectors (IC1, IC2, and IC3) are placed at different angles to monitor the angular distribution of the accelerated ions. (b,c) show the experimental and theoretical (simulated using Virtual Lab software) laser beam spatial distributions in the focal plane (target position). The color scale in each laser spot represents the laser intensity (in W/cm2).
Qubs 08 00005 g001
Figure 2. (a) Ion flux vs. degree of ionization (in red), and maximum ion energy vs. maximum ion charge state (in black) for different target materials at the laser intensity of 6 × 10¹³ W/cm2. The horizontal black dashed line represents the proton energy cutoff, constant in all cases. (b) Al ion temperature kTi vs. laser irradiance ILλ2. A fitting function of the type kTi = K × (ILλ2)δ matches well with the experimental data when δ = 0.42 ± 0.04.
Qubs 08 00005 g002
Figure 3. Example of TOF spectra from IC detectors placed at 0° (a), 15° (b), and 30° (c) recorded after the interaction of the Al target with the Bivoj laser beam at different energies and a 10 ns pulse duration. Each spectrum has been normalized to a distance of 1 m for their intercomparison.
Qubs 08 00005 g003
Figure 4. (a) Al ion cutoff energy and (b) ion flux normalized to 10 cm detection distance for different laser energies and pulse durations (5 ns and 10 ns super-Gaussian shape, and 9 ns Gaussian temporal shape). (c,d) show the dependence of the Al ion cutoff energy and ion flux on the laser intensity, respectively.
Qubs 08 00005 g004
Figure 5. Hydrodynamic simulations comparing the ion density evolution in the target for Gaussian vs. super-Gaussian temporal laser pulse shapes at three different times after the laser trigger, 2 ns (a), 6 ns (b), and 10 ns (c), respectively. (d) TOF spectra from laser interaction with the Gaussian and super-Gaussian temporal shapes.
Qubs 08 00005 g005
Figure 6. (a) TOF spectrum recorded with an IC at 63 cm from the target and angle of 15° with respect to the target normal. The Fe target was irradiated with a laser intensity of 1.4 × 10¹⁵ W/cm2. The decomposition of the signal into subcomponents (red dashed line) is in good agreement with the TOF signal (black line). For completeness, the proton (green), C (orange), and Fe ion signals (blue) are also shown. (b) SIMS analysis of a Si sample placed at 17° with respect to the target normal implanted with Fe ions with a maximum energy of 75 keV. For comparison, the blue dashed line is shown to represent the depth profile obtained with the IC detector reported in (a).
Qubs 08 00005 g006
Figure 7. Example of TOF spectra after the interaction between Al (black), Fe (red), and Sn (blue) targets with the Bivoj laser. The corresponding energies are specified in Figure 2a (several tens of keV).
Qubs 08 00005 g007
Disclaimer/Publisher’s Note: The statements, opinions and data contained in all publications are solely those of the individual author(s) and contributor(s) and not of MDPI and/or the editor(s). MDPI and/or the editor(s) disclaim responsibility for any injury to people or property resulting from any ideas, methods, instructions or products referred to in the content.

