1. Introduction
Superconducting cavities are an important component of a heavy ion accelerator. The superconducting cavities are operated at low temperatures, such as 4.2 K and 2 K. The reducing of field emission sites, electric defects sites, and magnetic defects sites as much as possible is important to maintain the high quality factor of the superconducting cavity. The performance of the superconducting cavity, which includes quality factor, Lorentz force detuning (LFD), pressure sensitivity, X-ray emission, and resonance frequency, is tested at operation temperature, which is called the vertical test. A vertical test facility which included a hanging booth, pits, a solid state power amplifier (SSPA), control racks, and a control room was designed and constructed [
1,
2]. The performance of the superconducting cavities was tested using a vertical test [
3,
4]. The field emission, which shows electron emission under a local strong electric field [
5,
6,
7], and the thermionic emission, which shows electron emission under a local high temperature, were investigated [
8,
9]. The field emission was studied in terms of dimensions, and the unified theory for the field emission and thermionic emission was also studied [
10,
11,
12]. The field emission sites of the superconducting cavity were investigated [
13,
14,
15]; moreover, reductions in the outgassing and the RF processing of the pulsed high peak power for the superconducting cavity were used to reduce the field emission in order to achieve a high-quality cavity [
16,
17]. The RAON accelerator was designed [
18], the quarter-wave resonator (QWR) and the half-wave resonator (HWR) cryomodule were developed [
19,
20], and the half-wave resonator (HWR) cryomodule was tested at 2 K [
21,
22]. The high-beta cavity for the quarter-wave resonator (QWR) was tested [
23]. Both the electric and magnetic field-dependent surface resistances were studied using a superconducting niobium accelerating cavity [
24,
25,
26]. For superconducting cavities, medium-temperature furnace baking was performed to improve the quality factor [
27], and electro-polishing (EP) was conducted to achieve a high gradient [
28]. The shape of the QWR cavity was optimized to achieve a high Q factor for quantum information systems, and the surface impedance of the superconducting cavities was calculated for quantum computing [
29,
30].
In this research, we demonstrate the vertical test and measure the Q slopes for the quarter-wave resonators (QWRs) as a function of an accelerating electric field. A magnetic effect is shown in a superconducting cavity. The Q factors are shown as a function of the applied peak magnetic field. The magnetic defects cause the Q factor to degrade. The magnetic moments caused by magnetic defects are obtained by fitting the surface resistance data with BCS resistance, in which the band gap is reduced by magnetic defects. Beam commissioning is presented for QWR cryomodules.
2. Magnetic Effect in a Superconducting Cavity
The quality factor of a cavity is defined as the ratio of the stored energy in the resonator to the dissipated energy per cycle by damping processes. The quality factor for the cavity is
where
is the quality factor of the cavity,
is the angular frequency of the cavity,
is the stored energy of the cavity,
is the period of the cycle, and
is the dissipated power in the cavity surface, called the RF surface. The RF power is mainly dissipated in the cavity surface, while some RF power leaves through the input power coupler and transmitted pickup coupler. The quality factor for the input power coupler is defined
where
is the quality factor of the emitted or input power coupler and
is the emitted power through the input power coupler.
The quality factor of the transmitted power coupler is defined as
where
is the quality factor of the transmitted power coupler and
is the transmitted power through the pickup power coupler.
The loaded quality factor is expressed as
where
represents the total power losses in the cavity system. Here,
is the total power,
is the dissipated power in the cavity walls,
is the emitted power, and
is the transmitted power.
The stored cavity energy decays when the RF power is turned off, according to the differential equation
From Equation (5), the stored energy is expressed as
where
represents the initial stored energy. The decay time becomes
The
comes from the measurement of the decay time. The cavity quality factor of
can be obtained by defining the quality factors of the couplers as
where
is the total RF power,
is the dissipated RF power in the cavity,
is the emitted RF power, and
is the transmitted RF power.
From Equation (8), the quality factors are expressed as
The quality factors of Equation (9) become
where
and
.
The
can be expressed as
where
is the forward power,
is the dissipated power in the cavity walls, and
is the reflected power. The cavity is over-coupled for
where the upper sign is used, the cavity is under-coupled for
where the lower sign is used, and the cavity is critically coupled for
.
The
can be expressed as
where
is the transmitted RF power and
is the dissipated RF power on the cavity surface.
The quality factors of Equation (10) becomes
By controlling the variable power coupler, the beta can be set up with the critical coupling of
. The
is very small value, in which
is much bigger than
. The decay time is measured at the critical coupling, and the loaded quality factor can be expressed as
where
.
The accelerating field depends on cavity parameters as well. The accelerating electric field can be expressed as
where the geometric shunt impedance of
is the shunt impedance divided by
, which measures the beam acceleration efficiency per unit-stored energy U at a resonance frequency, and
is the effective length of the cavity, in which
is the velocity over the speed of light. The
and
are found using the CST-MWS simulation. The geometric shunt impedance, which depends only on the cavity’s shape, needs to be maximized for cavity design. RF dissipation is reduced by maximizing both the geometric shunt impedance of
and the geometry factor of G.
The accelerating electric field of Equation (15) is expressed as
The accelerating electric field of Equation (16) is written as
where
is the kappa of the cavity.
The quality factor is also expressed as
where
, and
represent the forward RF power, the reflected RF power, and the transmitted RF power, respectively.
The quality factor of the cavity becomes [
31]
where
is the resonance frequency of the cavity,
is the magnetic field,
is the magnetic permeability,
is the cavity volume, and
is the cavity surface area.
The cavity quality factor is expressed as [
31]
The surface resistance of the superconducting cavity can be expressed as
where
is the residual resistance of the superconducting cavity and
is the BCS resistance of the superconducting cavity. The BCS resistance depends on temperature, and the residual resistance is the leftover resistance at zero temperature.
Magnetic flux is quantized, and the magnetic flux in the superconductor is quantized with the magnetic flux quantum [
32,
33]. The trapped magnetic flux, which is the multiple of the magnetic flux quantum in Nb superconducting cavity, can be expressed as [
32]
where
is the integer number, and h is the Planck constant. The magnetic defect comes from the trapped magnetic flux of Equation (22). The superconducting current surrounds the quantized magnetic flux, in which the core of the vortex corresponds to its normal state.
The action in nature is expressed as , in which S is the action and L is the Lagrangian. The reduced Planck constant () of the minimum action corresponds to the origin of quantization, which includes magnetic flux quantum (/2), conductance quantum (22/), inverse conductance quantum (/22), von Klitzing constant (/2), Josephson constant (2/), photon (f), etc.
The dissipated power in the superconducting cavity walls is the product of the local surface resistance and the local magnetic field squared over all of the RF surface. The average dissipated power for AC dissipation is expressed as
where
is the dissipated power in the superconducting cavity,
is the local surface resistance of the superconducting cavity,
is the local magnetic field over the superconducting cavity surface, and
is the surface area of the superconducting cavity. According to Equation (23), the dissipated power increases as the surface resistance and the trapped magnetic field are increased.
The Cooper pairs in a superconductor show zero resistance towards the DC current, while they show some resistance towards the AC current due to finite momentum. When the temperature is less than half of niobium’s critical temperature
, the BCS surface resistance is approximated by [
34]
where
T is the temperature in Kelvin, C is the material-dependent constant,
is the band gap of the superconducting material, which represents half of the energy required to break a Cooper pair, and
is the resonance frequency of the superconducting cavity.
The BCS resistance is changed by the presence of magnetic defects in the superconducting cavity, which reduces the band gap energy, with
[
35]. From Equation (24), the BCS resistance is expressed as [
35]
where
is the initial band gap,
M is the magnetic moment of the superconducting cavity, and
is the applied peak magnetic field. The surface resistance of Equation (21) can also be expressed as
where
is the residual resistance. Magnetic defects cause magnetic heating, which causes the pair-breaking of the superconducting current density and the increased density of normal-state electrons. The BCS resistance decreases as the temperature decreases from 4.2 K to 2 K. The surface resistance of Equation (26) shows that the residual resistance and the magnetic resistance coming from the magnetic flux remain at zero temperature.
4. Experimental Procedures
The residual-resistivity ratio (RRR) 300-grade niobium was used to fabricate superconducting cavities.
Figure 2 shows the Nb raw materials. The thickness of the Nb sheet was 3 mm. The dimensions, mechanical properties, and electrical properties of Nb sheet were assessed. The resistivity of Nb was measured as a function of temperature [
36]. Young’s modulus was measured for mechanical properties.
The components of the cavity were made using electrical discharge machining (EDM) wire cutting, deep drawing, press forming, and brazing. The resonance frequency of the superconducting cavity was assessed in the stack-up test. The electron beam welding was performed with a vacuum pressure below mbar. A visual inspection was performed for the welding beads.
Ultrasonic cleaning was used to clean the cavity surface. First, 1% of liquinox was used at 50 °C for more than half an hour. Second, deionized (DI) water was used at 50 °C for more than half an hour. Buffered chemical polishing (BCP) was performed. The etchant was 49%HF + 69%HNO3 + 85%H3PO4 (1:1:2 in volume ratio). The etch rate was below 1 µm/min, and the total amount of etching was around 120 µm. The etching temperature was controlled at less than 15 °C because the etching rate increases rapidly as the temperature is increased. The concentration of Nb in the acid solution needs to be less than 15 g/L. The etchant was supplied from the bottom of the quarter-wave resonator (QWR) cavity to the top of the QWR cavity, in which the flow direction was opposite that of gravity. The etchant came out of the top of the QWR cavity, which is the closed loop circulation. Once the etching was finished, the cavity was turned upside down. Then, deionized (DI) water was supplied to the bottom of the QWR cavity, where it moved from the bottom to the top of the cavity. The deionized (DI) water came out of the top of the QWR cavity, which is also the closed loop circulation.
The inner surface of the cavity was inspected after the buffered chemical polishing (BCP). A uniform and smooth surface is important to prevent a rough surface in the cavity. The rough surface can be a field emission site. High-temperature baking at 600 °C for 10 h was performed in a high-vacuum furnace. The resistivity of deionized (DI) water should be higher than 17 at 25 °C. High-pressure rinsing (HPR) was used to remove the leftover particles on the cavity surface. The filter size of the high-pressure rinsing was 0.5 μm, and the water pressure was about 100 bars. The diameter of the nozzle was 0.5 mm, and the speed of the nozzle’s rotation was around 20 rpm. The total rinsing time for each cavity was over 10 h, of which the rinsing time for each step was over 2 h.
A liquid helium vessel or jacket was attached to the outside of the cavity, and then additional light buffered chemical polishing (BCP) and high-pressure rinsing (HPR) were performed after attaching the jacket. The minimum distance between the outside of the cavity and the jacket was 1 cm, in which liquid helium flows. The dimensions and resonance frequency of the cavity were checked, and then a teak test was performed. To locate the suspected leak sites in the cavity, a helium leak detector was used using a spraying test [
37]. The helium leak test was performed at room temperature and then at liquid nitrogen temperature.
The total number of fabricated QWR cavities was 22. Moreover, the performance test for the six QWR cavities was investigated in this research, and the total number of QWR cryomodules was 22.
5. Experimental Setup
The RAON accelerator was designed [
18]. The quarter-wave resonator (QWR) and the half-wave resonator (HWR) cavity were developed [
19,
20]. The performance of the QWR cavities was tested at the vertical test facility.
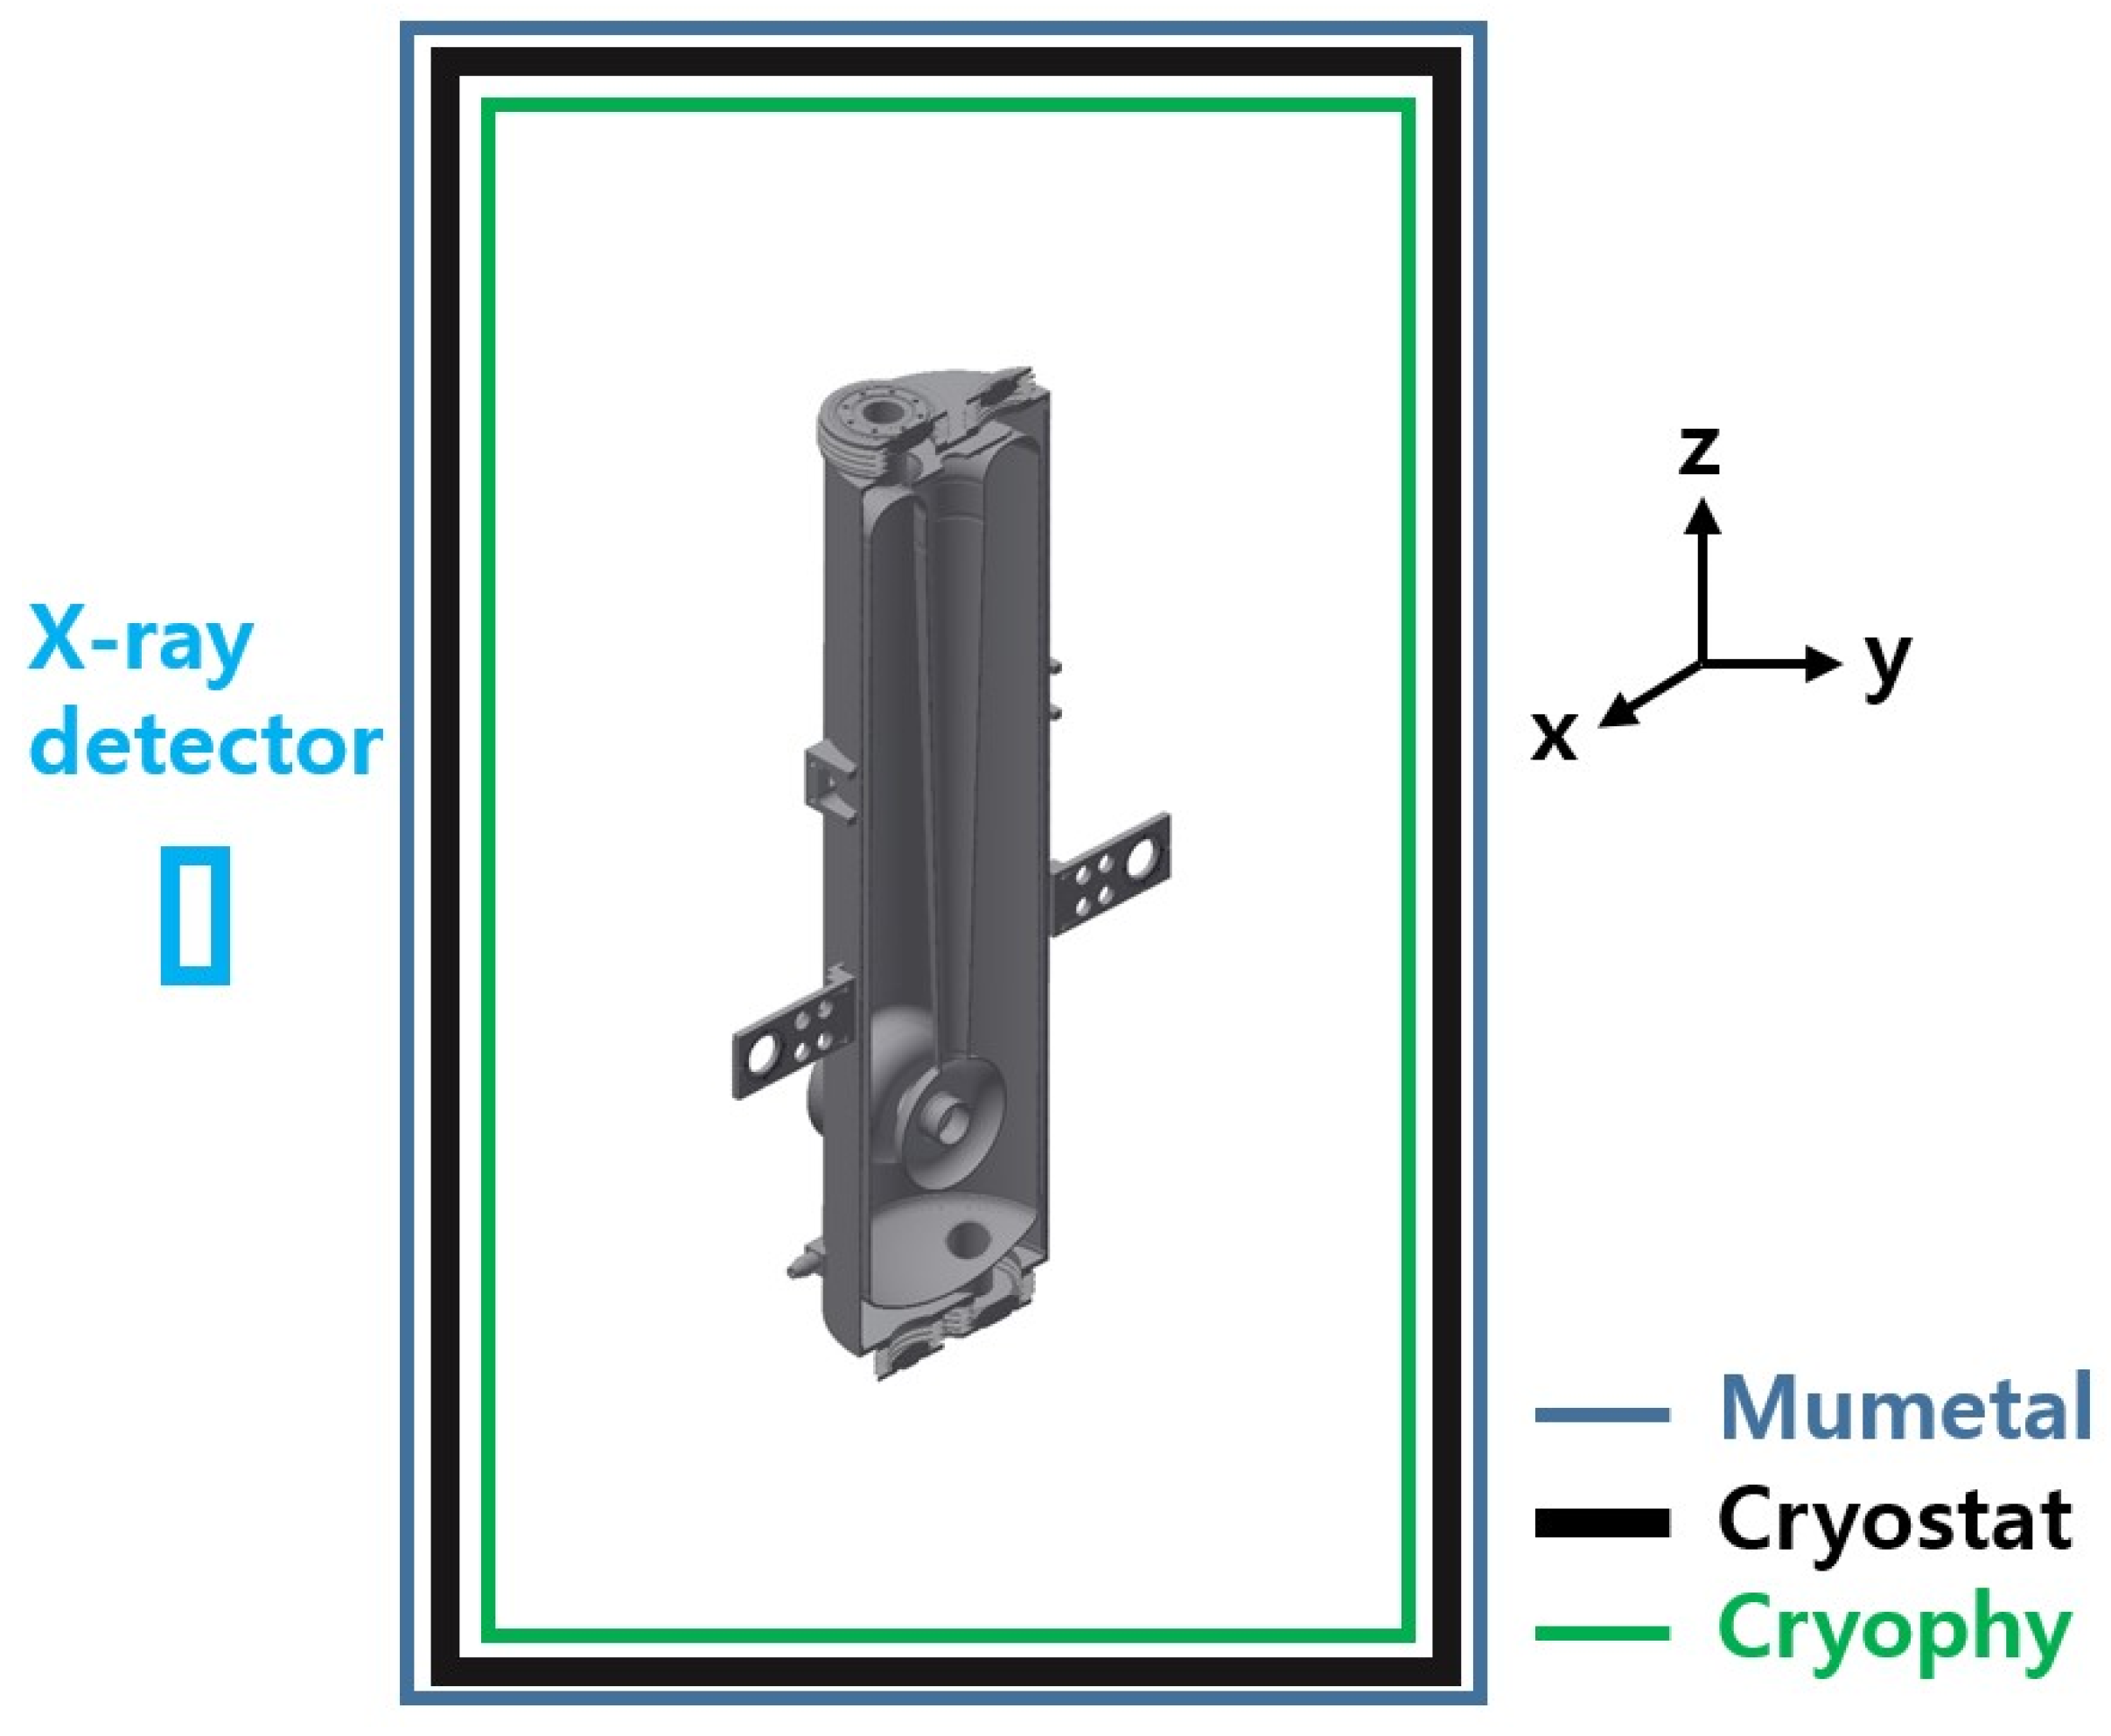
Figure 3 shows the schematic diagram for the magnetic shielding in the cryostat. Mu-metal and cryophy were used to reduce the external magnetic field. The X-ray detector is located outside of the cryostat.
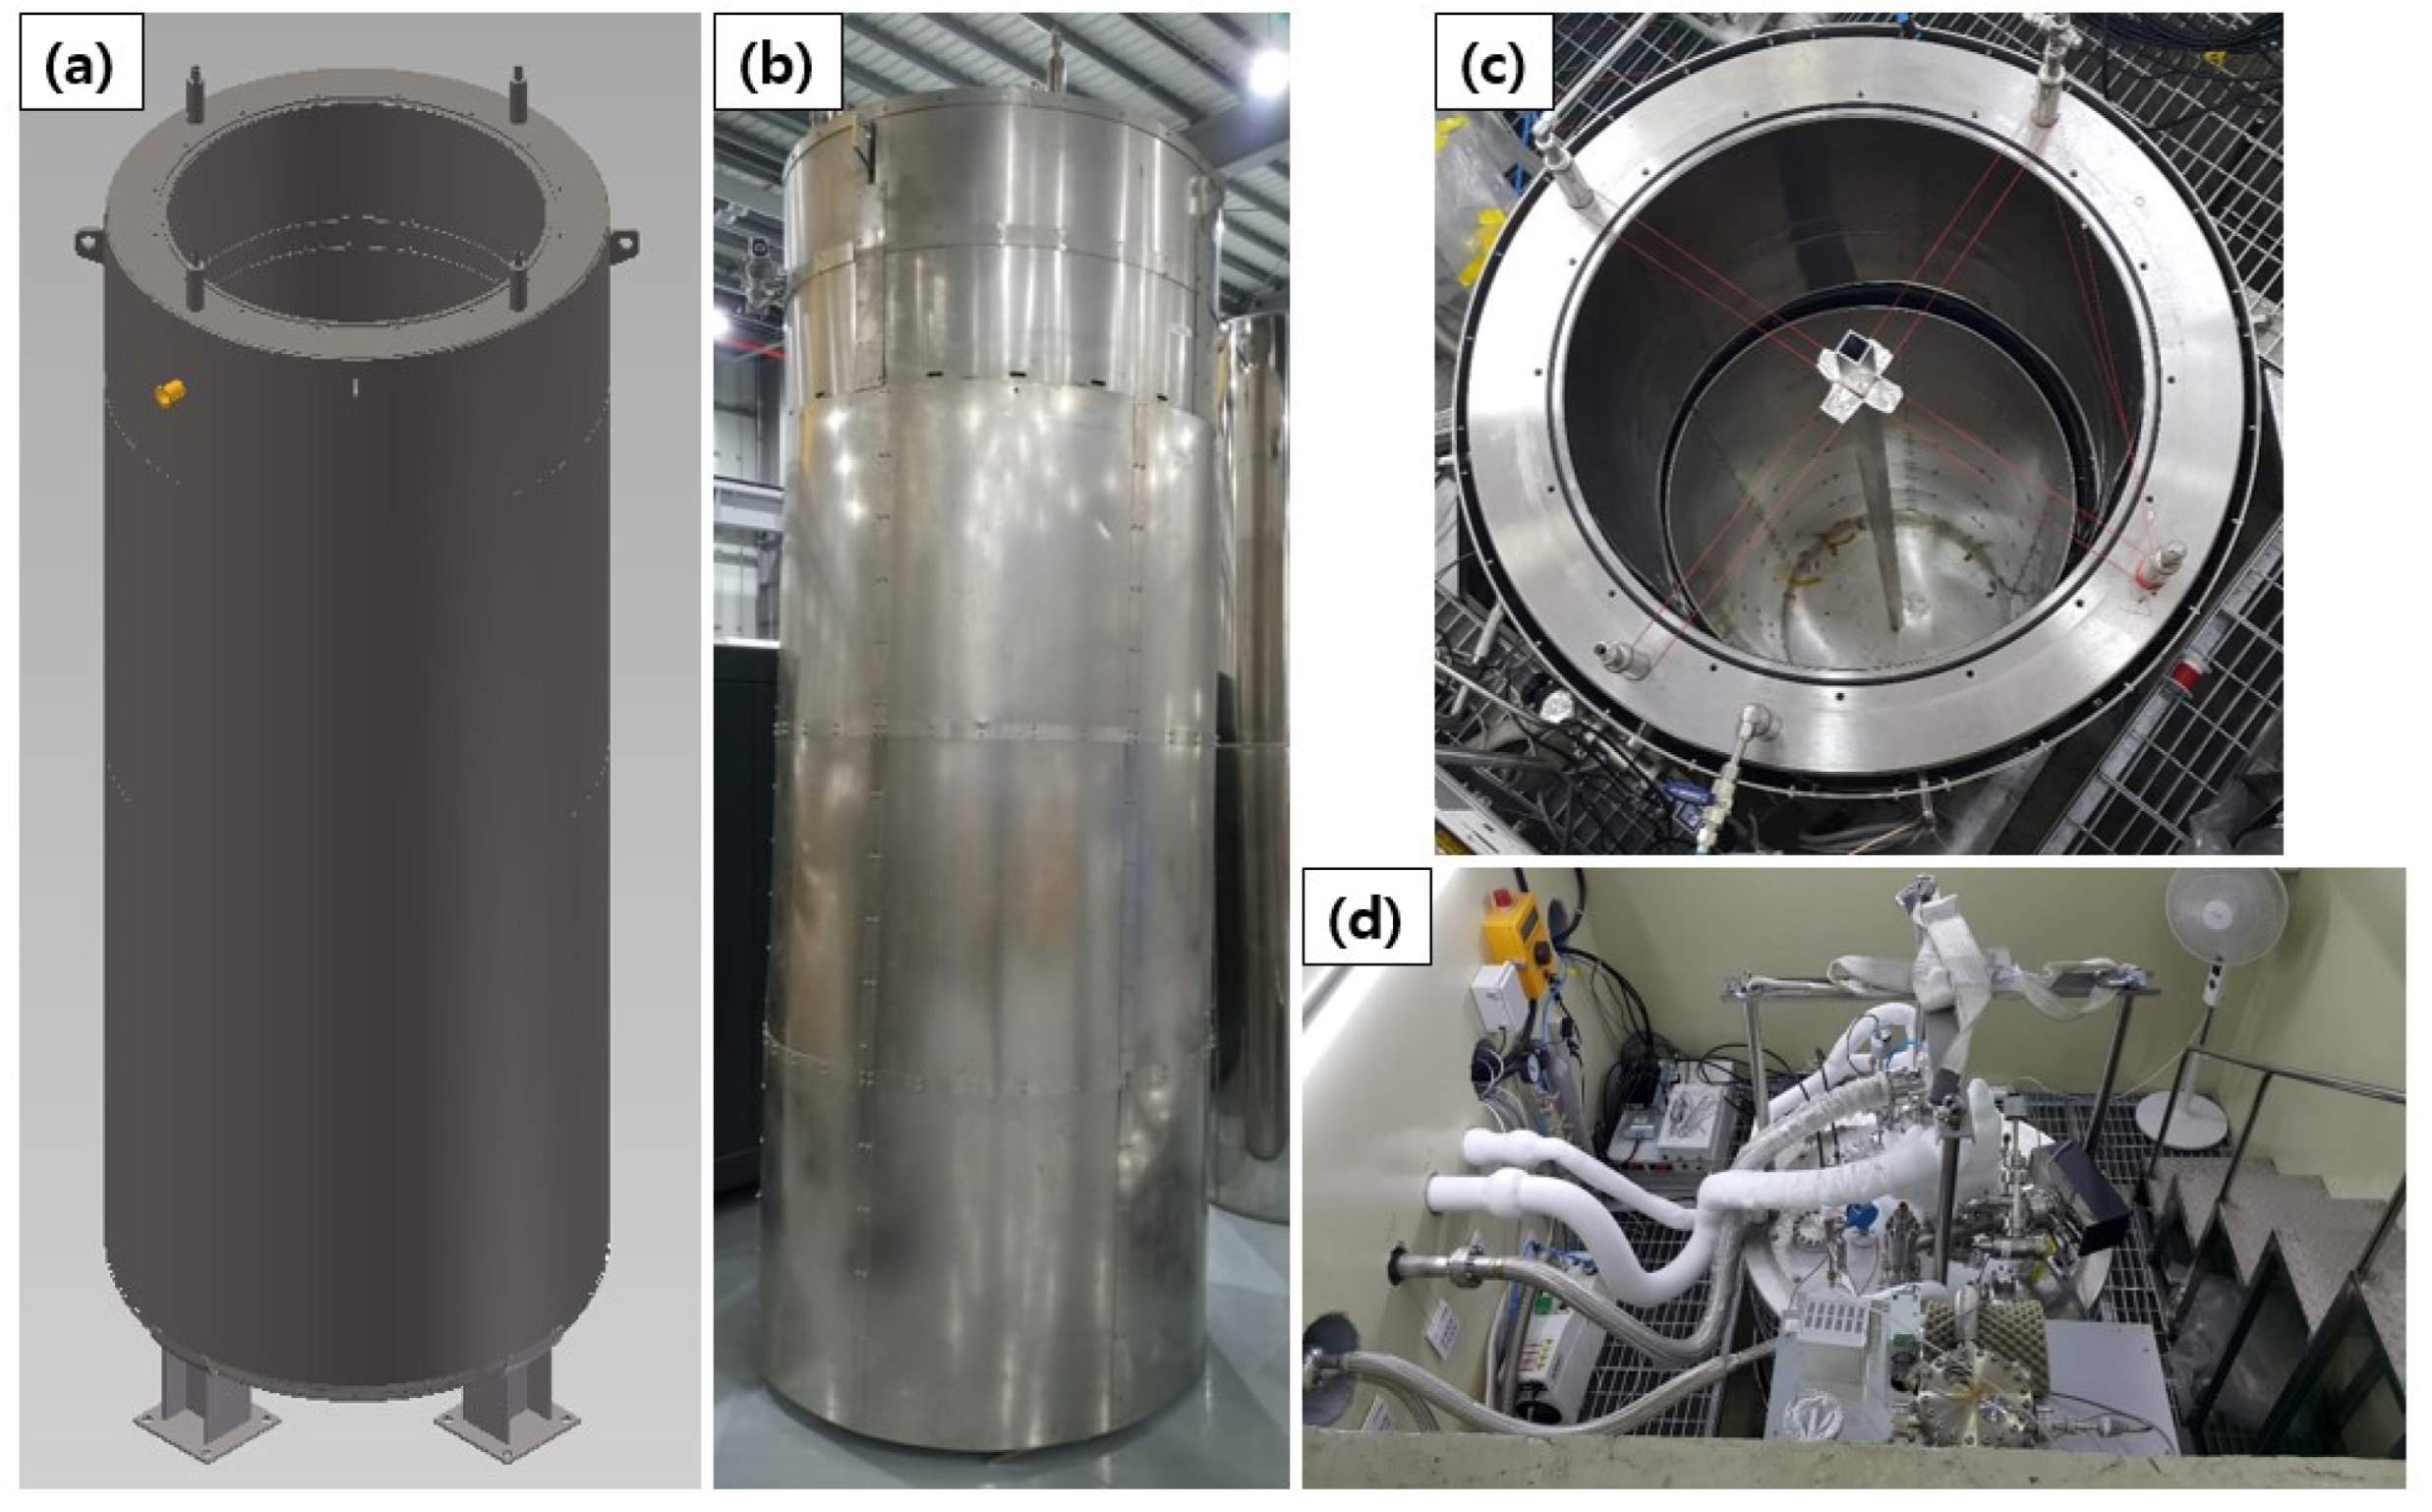
Figure 4 shows the cryostat and magnetic shielding. The design of the cryostat, the magnetic shielding, such as the Mu-metal and cryophy, and the top view of the vertical test are shown in
Figure 4. Two QWR cavities can be simultaneously tested in the cryostat. The measured static heat load of the cryostat is 8 W. The Mag-03MSB100 Three-Axis Magnetic Field Sensor from Bartington Instruments was used to measure the magnetic field strength. The magnetic field strength for the position of the cavity was below 6 mG after applying the Mu-metal and cryophy.
Table 1 shows the parameters of the quarter-wave resonator (QWR) cavity. The resonance frequency for the QWR cavity is 81.25 MHz.
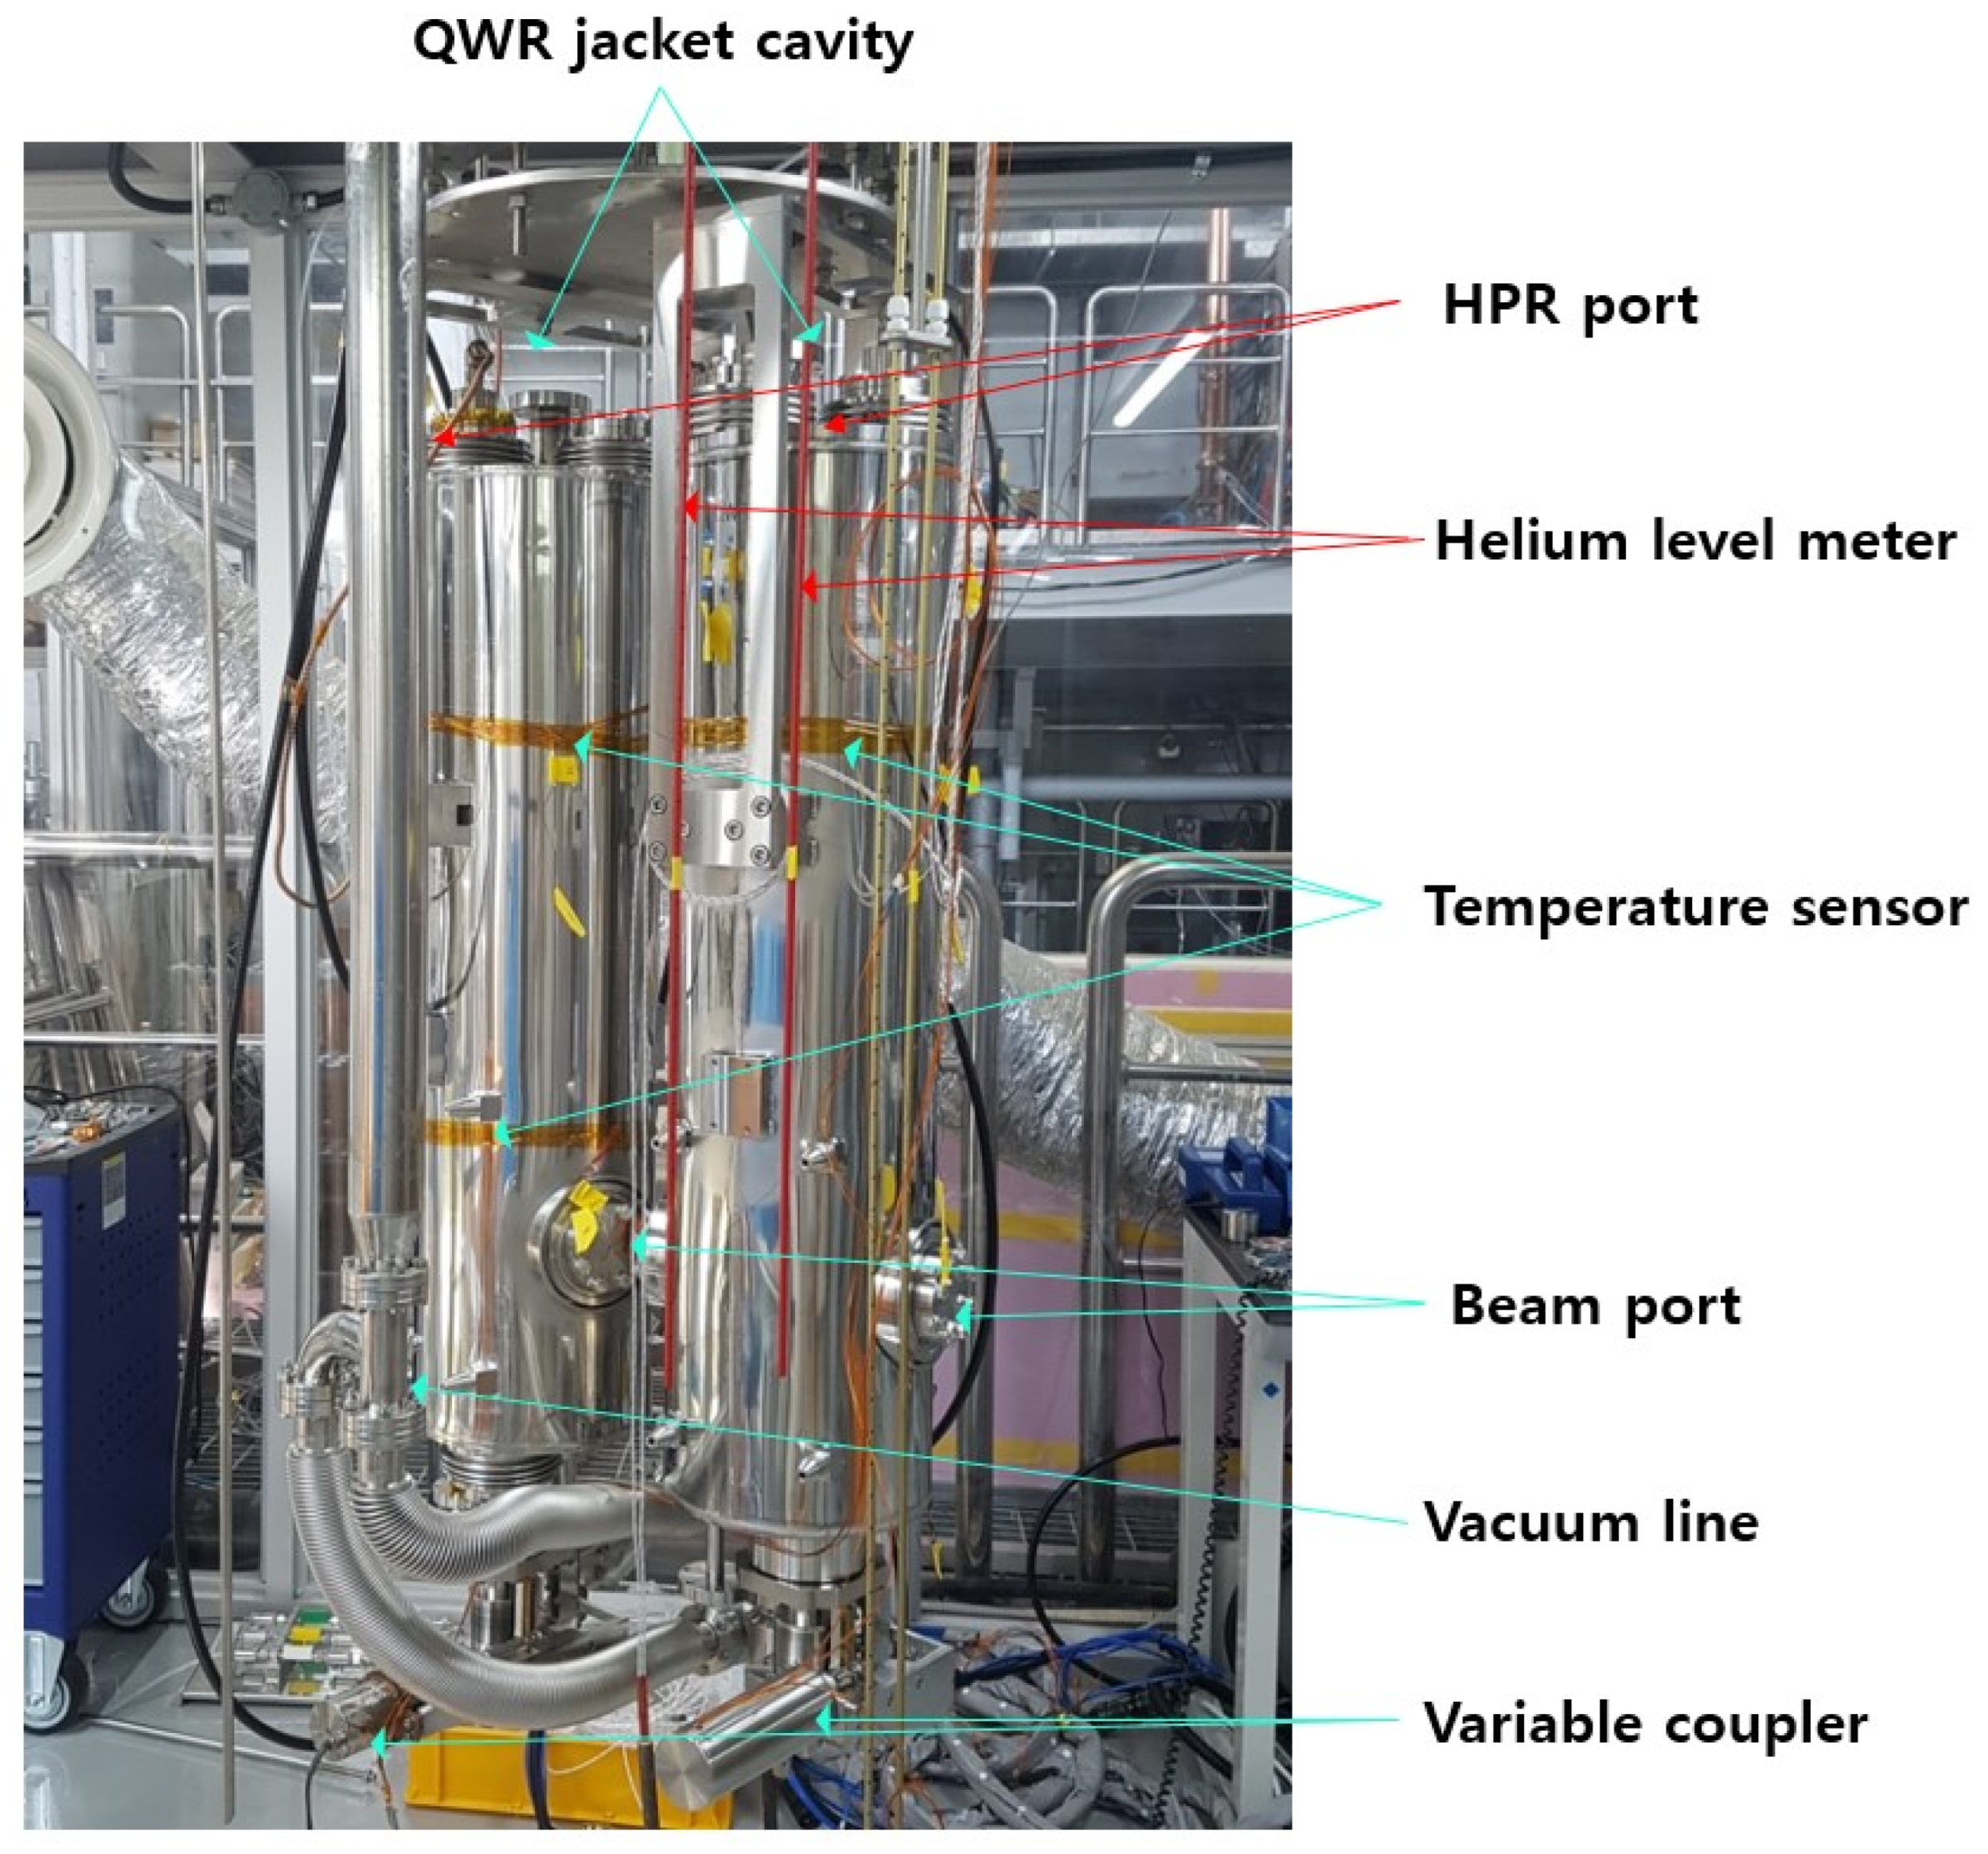
Figure 5 shows the picture of the QWR cavities during vertical test preparation. The temperature sensors, consisting of calibrated Cernox sensors, are attached with kapton tape on the QWR jacket cavities. The physical property measurement system (PPMS) is used to calibrate the Cernox sensors in the temperature range from 1.9 to 325 K [
36]. These temperature sensors monitor the temperature of the QWR cavities, while the vapor pressure of the liquid helium shows the temperature of the cavities better because the temperature reading of the sensor depends on how it contacts the cavity and if the liquid helium fills the QWR cavities completely. Two liquid helium level meters were used to monitor the liquid helium level in the cavity and liquid helium vessel.
The QWR cavities were baked at 120 °C for 48 h while a dry pump and a turbo molecular pump (TMP) were used for cavity pumping, which is called the low-temperature baking. The low-temperature baking removes the water from the cavity and is very effective in eliminating multipacting. Low-temperature baking is also necessary to obtain a high Q factor in a high-accelerating electric field.
An X-ray detector was placed outside of the cryostat. The FHZ 632 L-10 gamma detector was used to detect X-ray radiation. Liquid nitrogen and liquid helium were supplied to perform the vertical test, that is, the performance test of the superconducting cavity at 4.2 K. The superconducting cavities were cooled down fast, requiring about an hour, from 150 K to 50 K.
Cable calibration was performed at 4.2 K. Both the forward and reflected power were measured by keeping the input power at 18 dBm. The drive frequency of the Solid State Power Amplifier (SSPA) with 200 W was 81.25 MHz for the QWR cavities. The directional coupler and circulator should work well for 81.25 MHz. S11 and S22 represent the input RF return loss and output RF return loss, respectively. The S21 represents the RF transmission through the cavity. S11, S21, and S22 for each cavity were measured using the Keysight ENA Network Analyzer E5080A. The bandwidth and loaded Q were measured according to S21, S11, and S22.
RF conditioning can be started at 4.2 K. RF conditioning is a process used to clean the RF surface of the superconducting cavity in order to achieve the highest possible quality factor in the range of all possible accelerating fields. Condensed gases such as water and oxygen on the RF surface of the cavity can be removed using RF conditioning. RF conditioning starts as over-coupled, in which a variable coupler is maximally inserted into the inside of the cavity. The copper antenna of the variable coupler can be moved by about 5 cm. After watching the transmitted power, we changed the forward power and the phase of the low-level radio frequency (LLRF) with self-excited loop (SEL) mode to increase the transmitted power. The forward power and transmitted power increase together after finishing the RF conditioning. It takes about 2 h to 8 h to complete the RF conditioning process for the QWR cavity. The RF power was used from about mW to about 100 W to perform the RF conditioning. The RF power was below 50 W for a high-quality cavity. Pulsed RF conditioning and continuous wave (CW) RF conditioning were used. The pulsed RF conditioning was used for a pulse width of 0.2 s at 1 Hz. The pulsed RF conditioning required more RF power compared to the CW RF conditioning. The reflected RF power decreased to zero when the variable coupler was pulled out to the critical coupling.
The decay time at the critical coupling was measured at 1 MV/m. The decay time for the QWR cavities was about 1 s. X-rays and multipacting should not be generated while the decay time is measured. When there is multipacting, the decay time becomes very short, as in microseconds. The Qext of the pickup, obtained by using the decay time measurement, was about 1011.
The Q slope of the QWR cavities was measured from 1 MV/m to the maximum accelerating field, such as 8 MV/m. The quality factor and X-ray radiation are simultaneously measured as functions of the accelerating field. The Q value of the QWR cavities decreases as the accelerating field increases.
6. Discussions
The quarter-wave resonator (QWR) is made of Nb, whose phase transition temperature is 9.25 K [
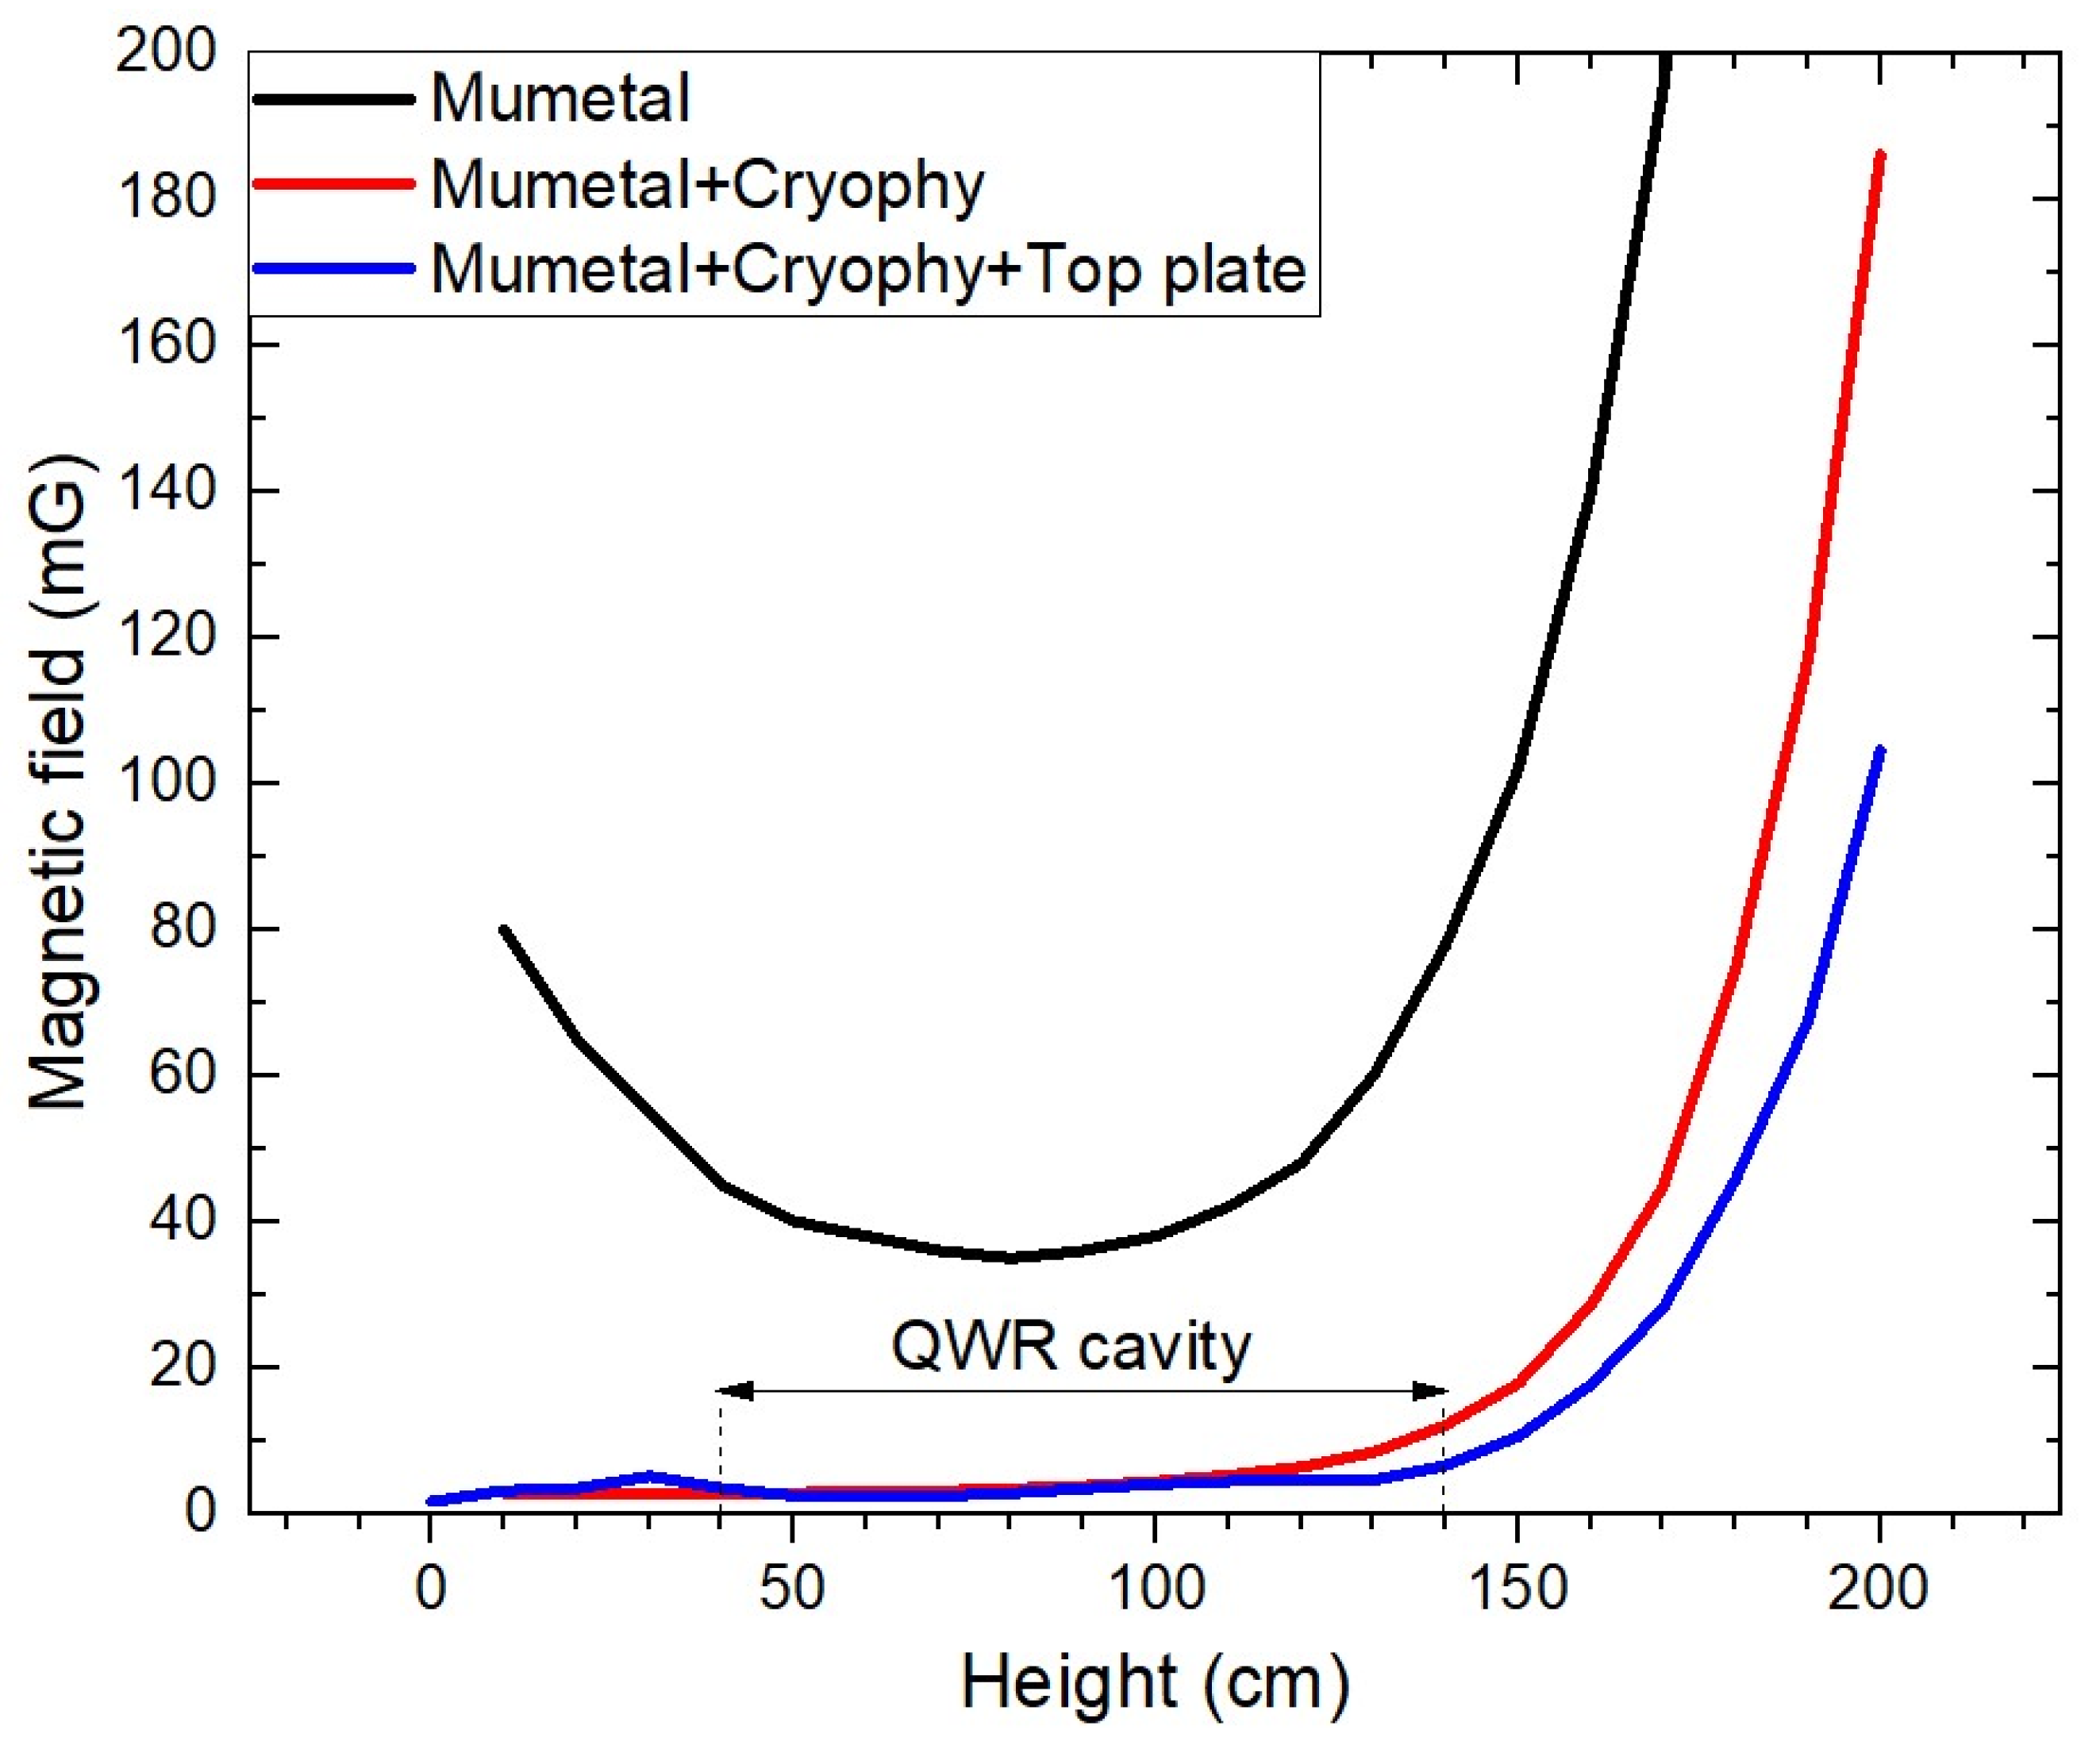
36]. The magnetic field trapping coming from the magnetic defects on the RF surface of the superconducting cavity occurs as its temperature decreases and crosses the phase transition temperature of 9.25 K. Therefore, we tried to reduce the external earth magnetic field strength while the QWR cavities were tested.
Figure 6 shows the measurement of the magnetic field strength for the cryostat. The magnetic field strength inside the cryostat is measured from the bottom at a height of 0 cm to the top at a height of 200 cm. The QWR cavity is located between 40 and 140 cm. The Mu-metal is installed outside of the cryostat, the cryophy is installed inside of the cryostat, and the top plate containing the Mu-metal and the cryophy is installed on top of the cryostat. The cryophy is effective at low temperatures, while the Mu-metal is ineffective. The magnetic field strength is measured by installing the Mu-metal, the Mu-metal and cryophy, and the Mu-metal, cryophy, and top plate. The Mu-metal is also installed on the bottom of the cryostat. The magnetic field strength at the location of the QWR cavity decreases to under 6 mG by installing the Mu-metal, the cryophy, and the top plate. The external magnetic field strength causes increased surface resistance of the Nb superconducting cavity due to trapped magnetic flux. The surface resistance is linearly proportional to the external magnetic field strength [
38]. In general, the external magnetic field strength for vertical tests is recommended to be below 10 mG. Therefore, 6 mG is sufficient to perform a vertical test.
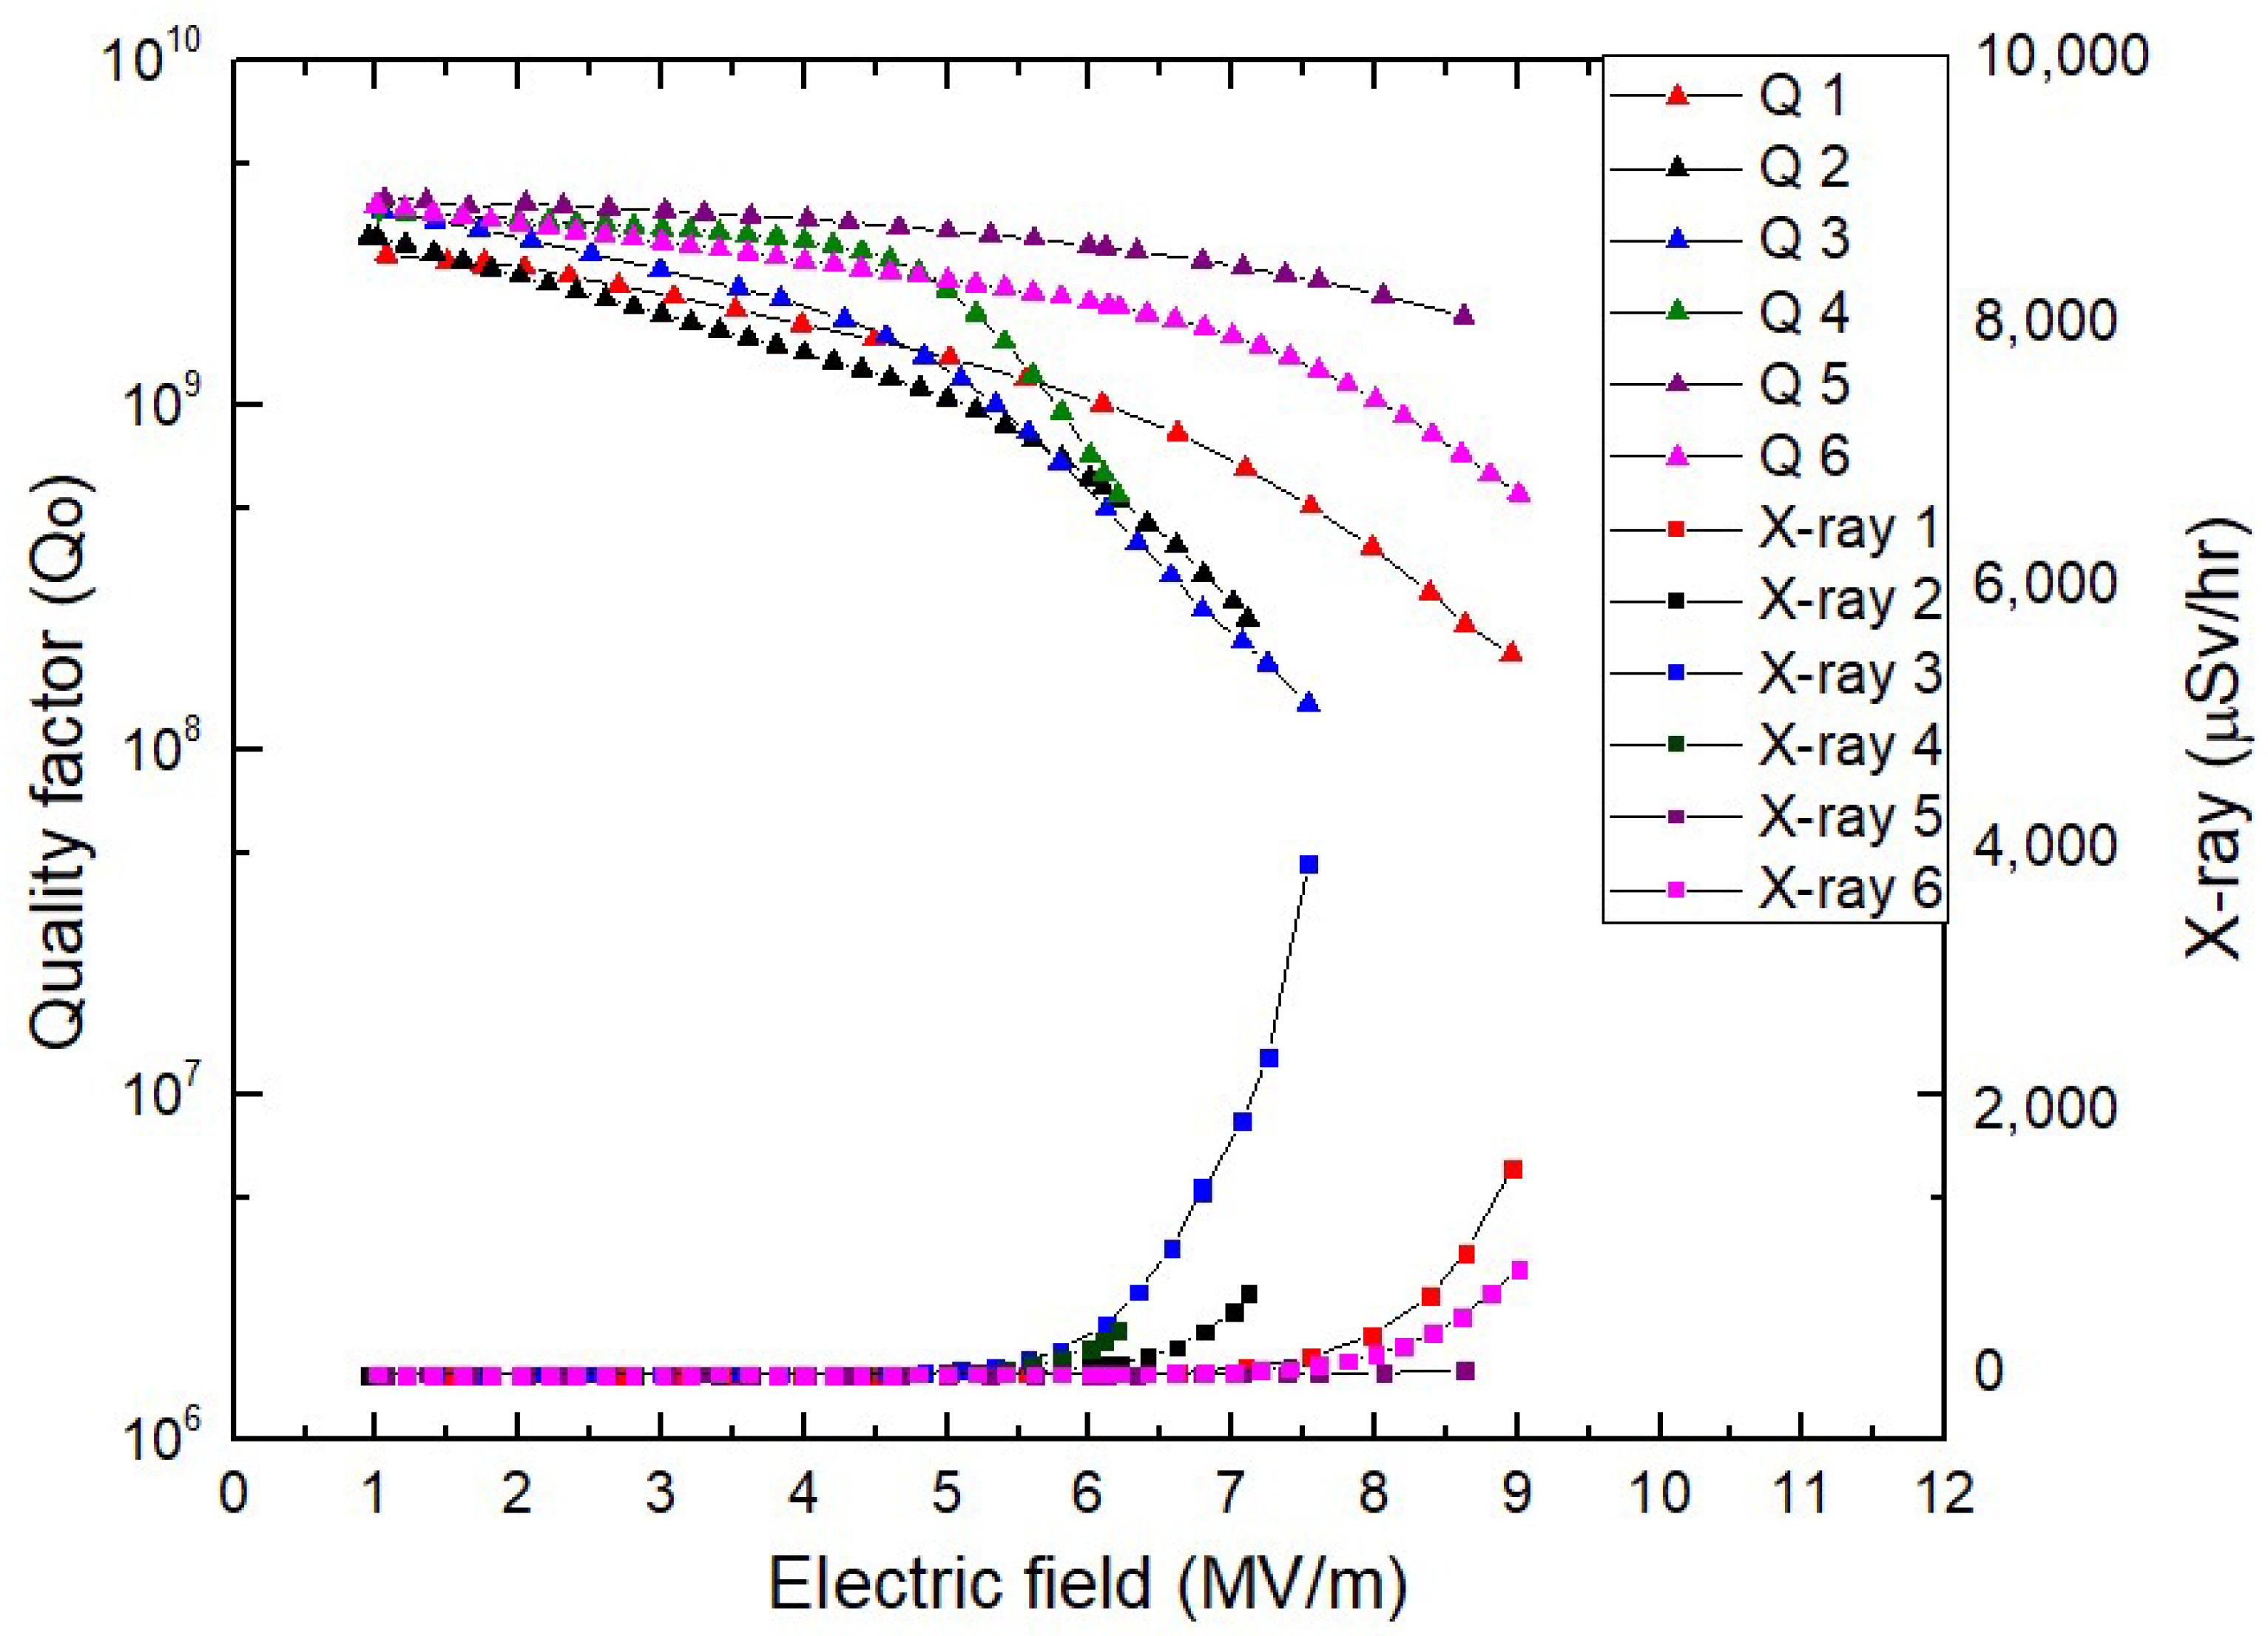
The Q slopes are measured with increasing accelerating electric fields for the quarter-wave resonator (QWR) cavities in
Figure 7. The Q factor decreases with increasing accelerating fields. The Q factor decreases more rapidly above the accelerating field in which X-ray radiation appears. The field emission effect on the superconducting cavity was investigated [
22]. The local temperature of the field emission site increases due to Joule heating, and the electrons emitted from the field emission are accelerated and generate Bremsstrahlung radiation by consuming the RF energy. Therefore, the quality factor of the superconducting cavity decreases with increasing field emission and X-ray generation.
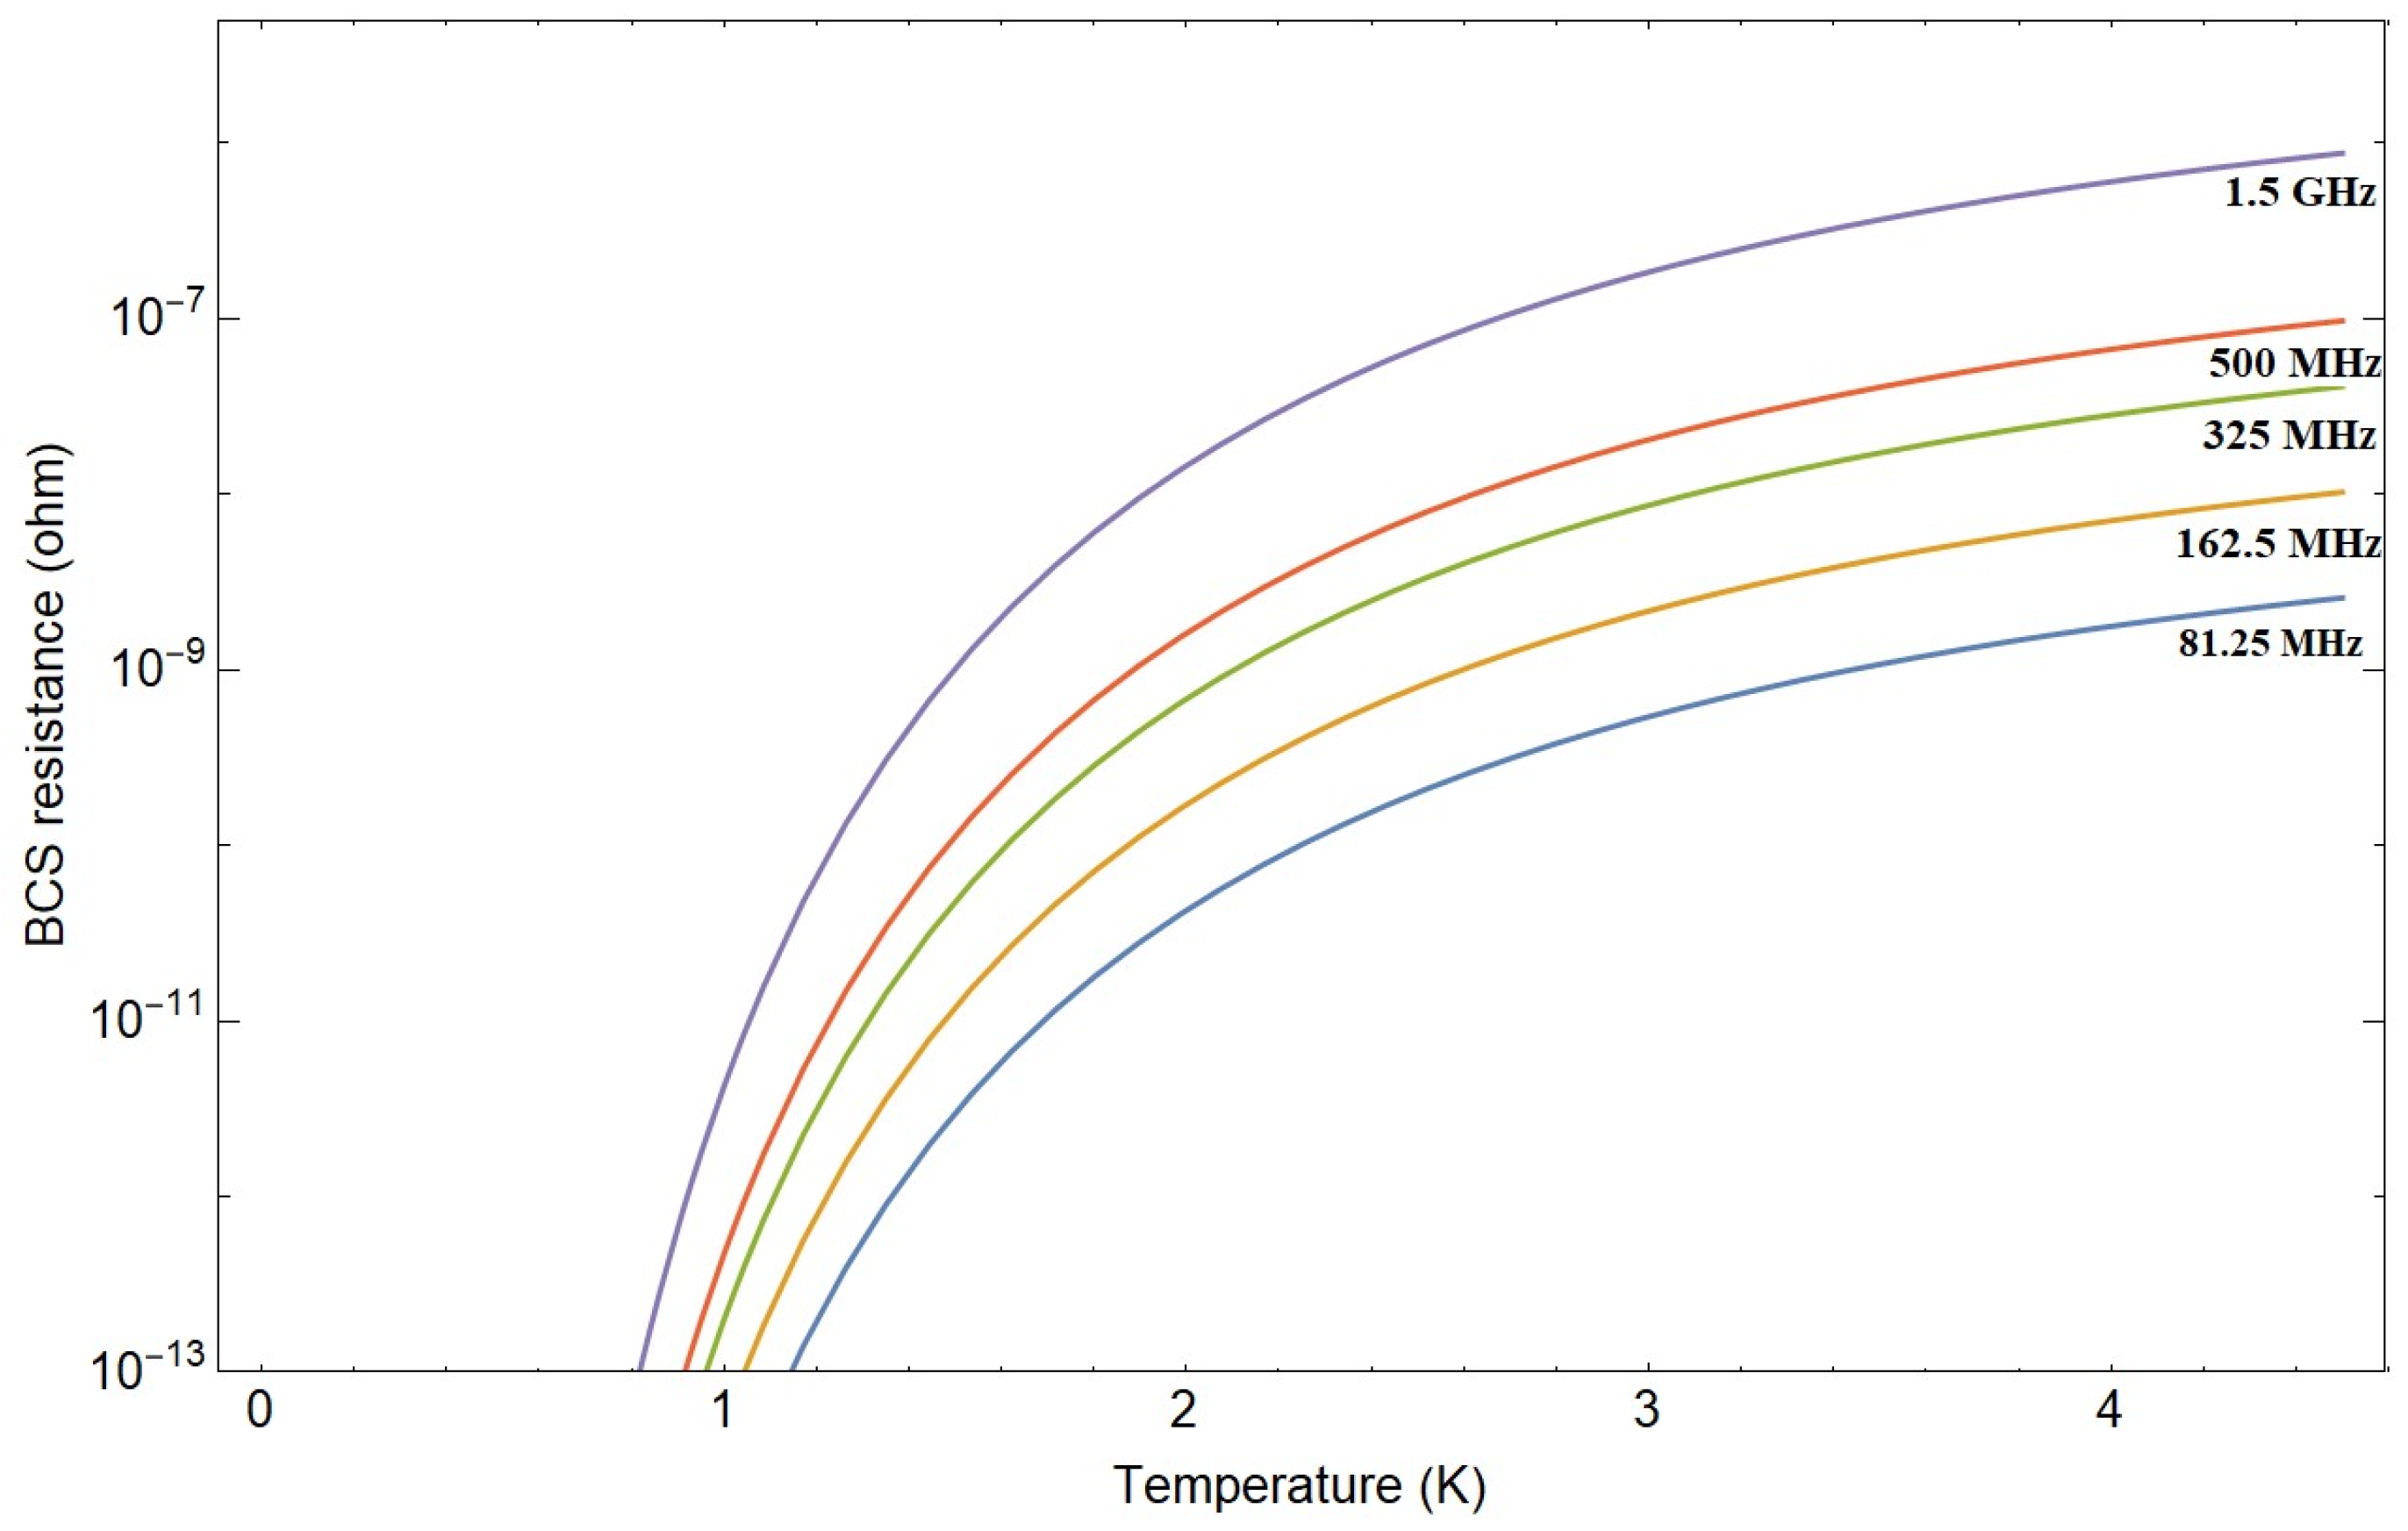
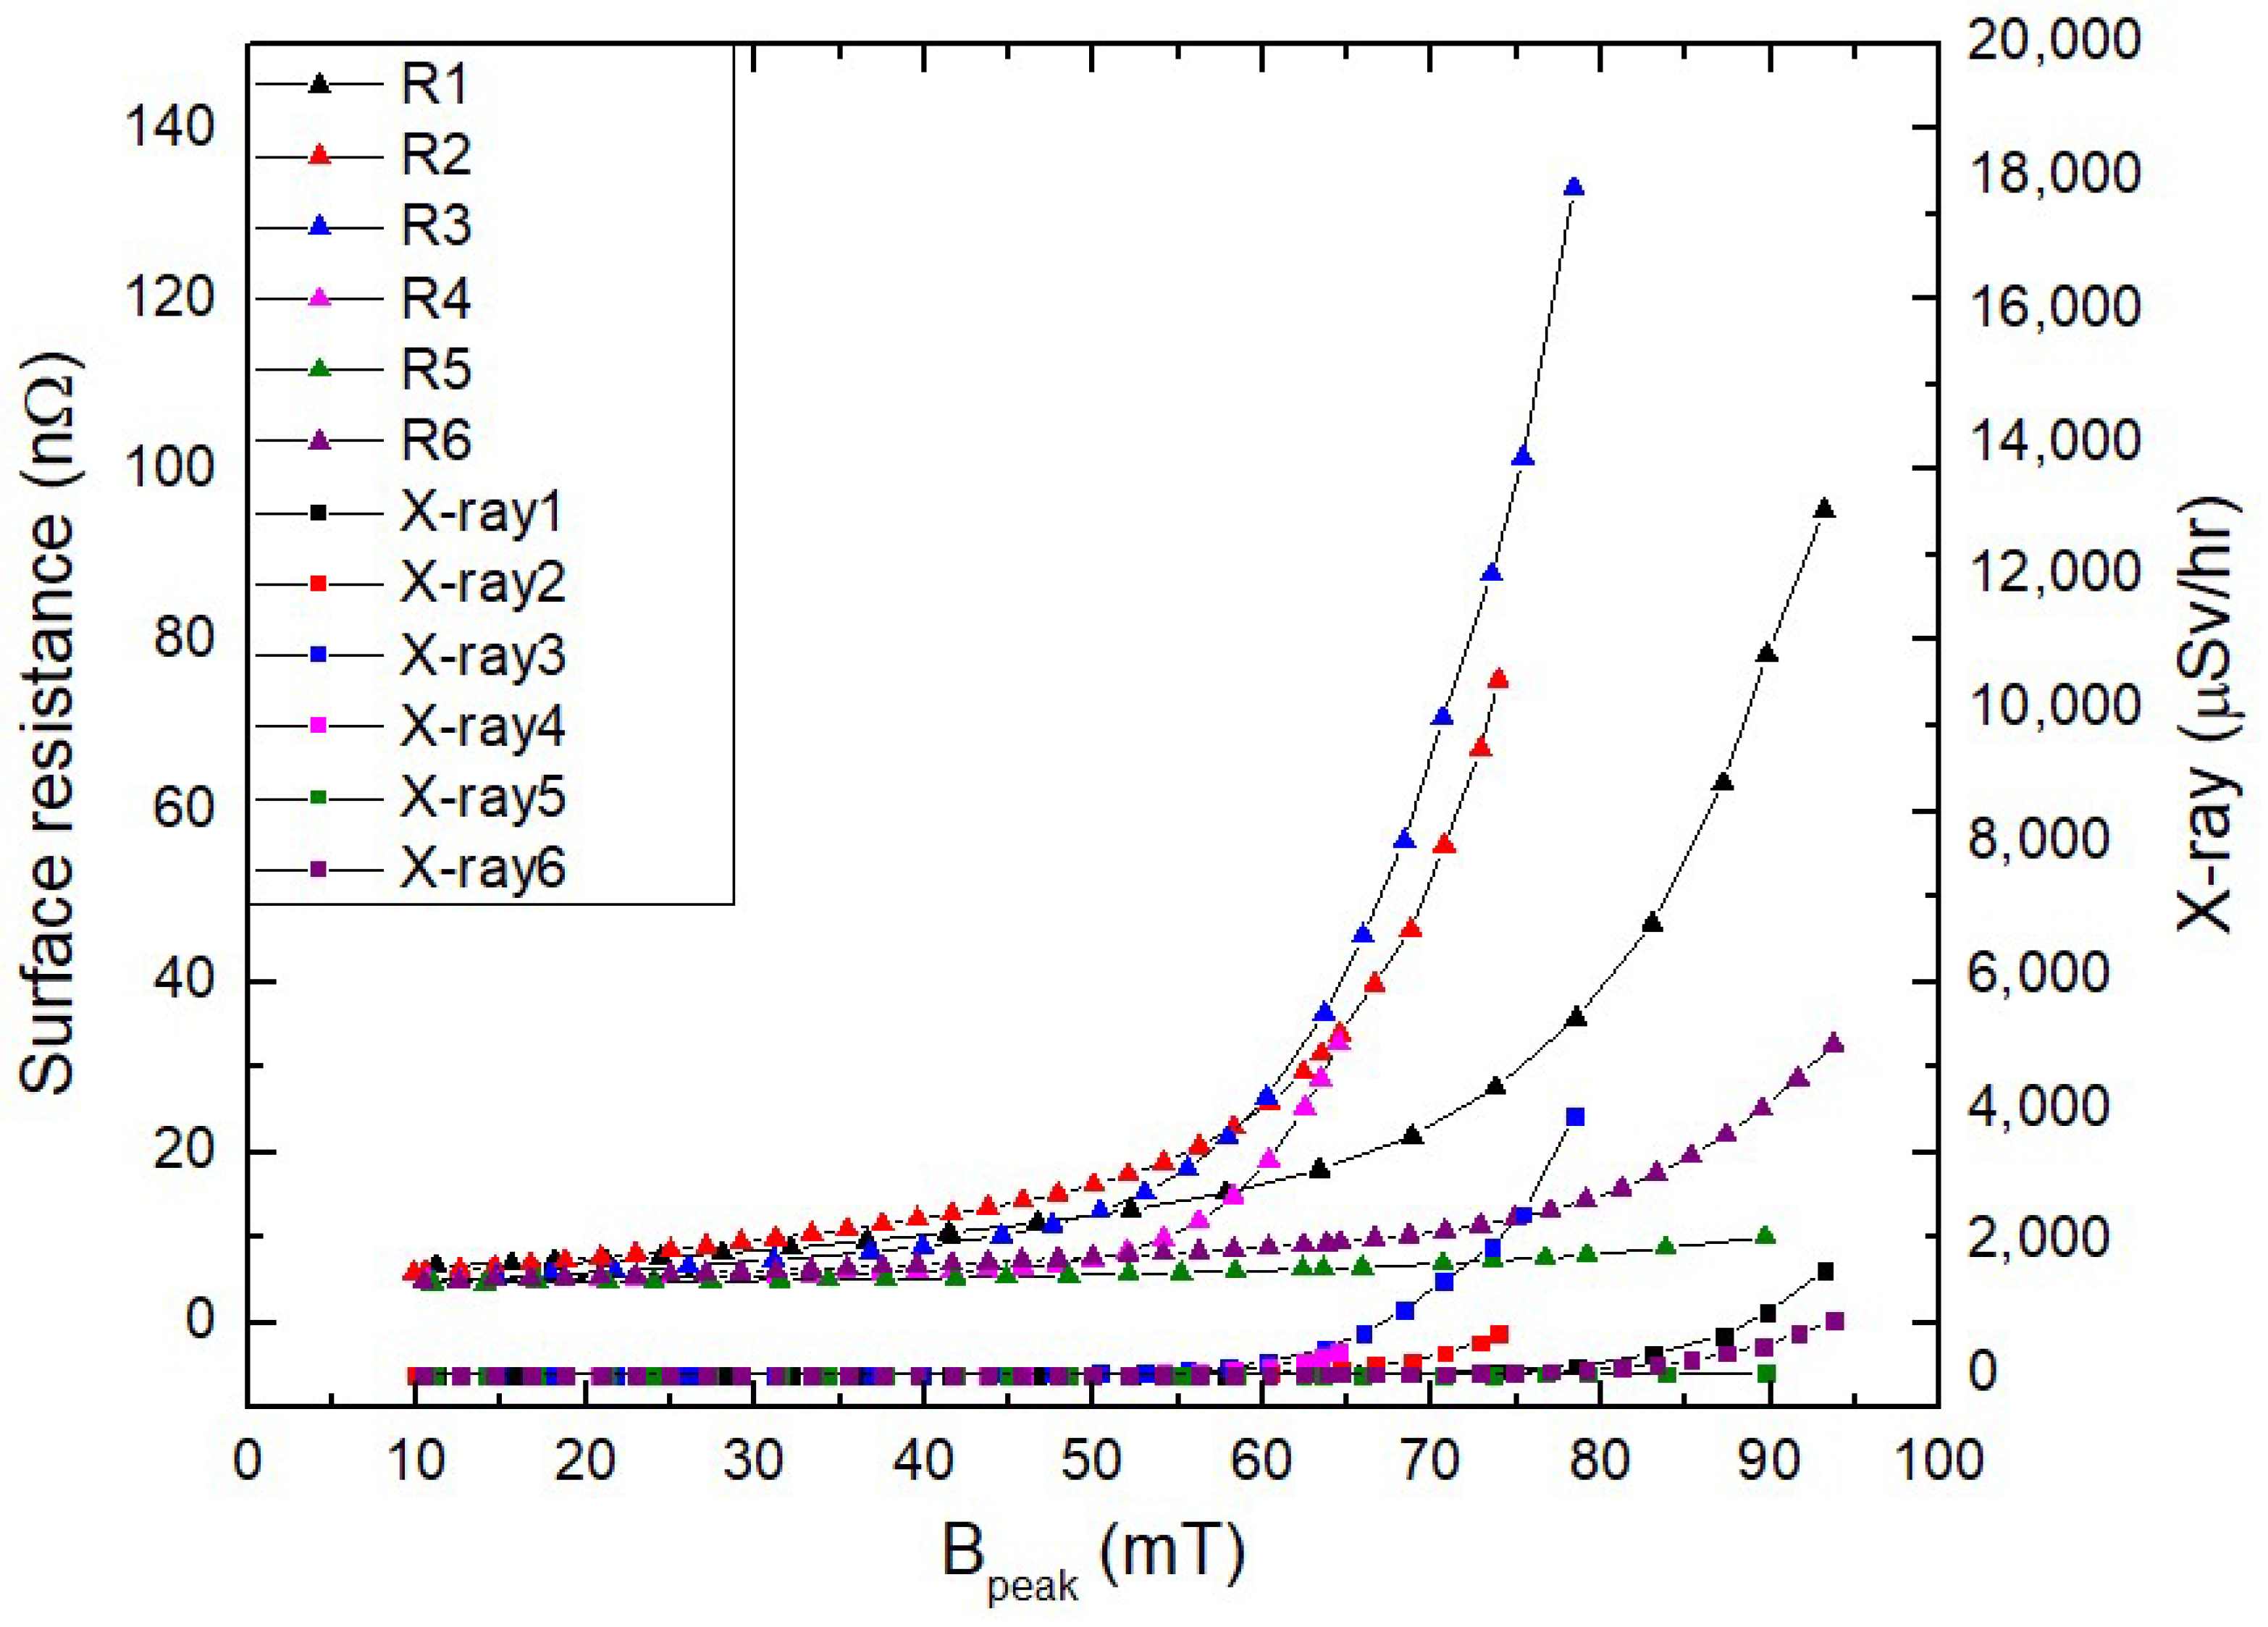
Figure 8 shows the surface resistance measurement as a function of the peak magnetic field strength for the QWR cavities. The surface resistance increases with an increasing peak magnetic field.
The quarter-wave resonator (QWR) cavities are made of niobium, which is a type II superconductor. Type I and type II superconductors are classified by their superconducting coherence length
and London magnetic field penetration depth
. The superconductor becomes the type I superconductor for
, while the superconductor becomes the type II superconductor for
. The type I superconductors, or soft superconductors, which show zero resistance under DC fields, expel magnetic fields perfectly, which is known as the Meissner effect. The type II superconductors, or hard superconductors, show the Meissner state below the RF critical magnetic field of Hc1, the vortex state, or magnetic flux trapping state, in the range of magnetic field between Hc1 and Hc2, and the normal conducting state in the range of magnetic field above Hc2. According to Equation (23), the dissipated power is proportional to the trapped magnetic field squared. In order to reduce the magnetic heating, it is important to increase the critical magnetic field of Hc1. The niobium material has a residual resistivity ratio (RRR) value of 300 for the QWR cavities. The niobium material has various impurities, which include tantalum, molybdenum, tungsten, titanium, hafnium, zirconium, carbon, nitrogen, oxygen, and hydrogen [
39,
40]. The critical magnetic field of Hc1 decreases as the defect size increases and the surface roughness increases [
41,
42,
43]. The oxide layer on the niobium surface works as the magnetic flux pinning sites [
44]. Electron-beam welding (EBW) is used to fabricate the QWR cavities. The EBW should be performed in a high-vacuum environment. The EBW was studied to measure the residual-resistivity ratio (RRR) value of Nb as a function of distance from the welding site in terms of the vacuum level, welding power, and welding speed [
45]. The defects, such as oxygen, can cause magnetic field trapping while the electron-beam welding (EBW) is performed in a low-vacuum environment. The smooth surface of the E-beam welding sites should be kept; otherwise, the rough surface of the welding site can cause magnetic field trapping.
The surface resistance for the QWR cavities is shown as a function of the peak magnetic field in
Figure 9. According to Equation (23), the dissipated power coming from the magnetic heating depends on the surface resistance and magnetic field on the superconducting surface. The magnetic heating causes a decreased quality factor. The surface resistances for the QWR cavities are fitted with the magnetic heating referenced in Equation (26). The magnetic moments for the QWR cavities from 1 to 6 are
,
,
,
,
, and
J/T, respectively. The magnetic moments for the QWR cavities are comparable to the magnetic moments of
J/T obtained from the research work [
35]. The different magnetic moments obtained in
Figure 9 can come from different welding sites, surface roughness, magnetic defects, etc. The magnetic defects of the superconducting QWR cavities cause magnetic heating, which causes the pair-breaking of the superconducting current density and increases the density of normal-state electrons. The magnetic defects causing the trapped magnetic flux can come from welding sites, material defects, surface particles, rough surfaces, etc. In order to fabricate a high-quality superconducting cavity, the magnetic defects should be reduced as much as possible.
Degradation of the Q factor results from magnetic heating and X-ray radiation. The Q factor degradation causes increased heating of the superconducting cavity, which requires increased liquid helium evaporation at the operating temperature.
There are 22 QWR cavities in total. The 22 QWR cavities all passed the vertical test, and the QWR cryomodules they were built from passed the horizontal test as well. The quality factor, static heat load, dynamic heat load, pressure sensitivity, Lorentz force detuning (LFD), cavity alignment, X-ray emission, and RF control are measured in the horizontal test. The cavity alignment is within 1 mm in the horizontal test. Following the horizontal test, all of the QWR cryomodules are installed and then cooled down in the RAON SCL3 tunnel.
It is very important to reduce microphonics to control the superconducting cavity u radio frequency (RF). The liquid helium pressure of the QWR cryomodule is around 1.28 bars in the superconducting cavity at 4.5 K. The fluctuation of helium pressure decreases by changing the flow rate, supply pressure, return pressure, and cryogenic valve control speed, etc. The low-level radio frequency (LLRF) with the self-excited loop (SEL) mode is used to obtain the performance test of the superconducting cavity in the vertical test. The low-level radio frequency (LLRF) can control the cavity with the generator-driven resonator (GDR) controller mode for the beam experiment. The loaded Q, QL, of the QWR cavity is around 5 × 10⁵, the Qext of the pickup is around 1 × 10¹¹, the bandwidth of the QWR cavity is about 150 Hz, the pressure sensitivity showing resonance frequency change against helium bath pressure is around 5 Hz/mbar, and Lorentz force detuning (LFD) is around −15 Hz/(MV/m)2. The quality factor requirement for the QWR cavity is 2.4 × 10⁸ at 6.1 MV/m. Variations in helium pressure cause the cavity’s resonance frequency to vary in terms of pressure sensitivity; however, they have no effect on the FWHM.
The total heat load for the QWR cryomodule at 6.1 MV/m is around 12 W, in which the static heat load is about 4.5 W. The tuner is used to control the resonance frequency of the cavity and changes the frequency to 81.25 MHz. The tuner is only used to change the frequency when the frequency is off by more than 10 Hz from the resonance frequency of 81.25 MHz. For the first time, the amplitude and phase of the cavity are controlled for one minute. Later, the amplitude and phase of the cavity are controlled for one hour by reducing the fluctuation of the liquid helium pressure under 5 mbar in 20 s. The helium pressure fluctuation is reduced from 20 mbar to 5 mbar in 20 s. The superconducting cavities have different pressure sensitivities; therefore, the cavities respond differently to the helium pressure fluctuation. The amplitude and phase of the cavity can be stabilized as the helium pressure fluctuation decreases. The amplitude fluctuation is less than 1%, and the phase fluctuation is also less than 1 degree for more than an hour for beam commissioning.
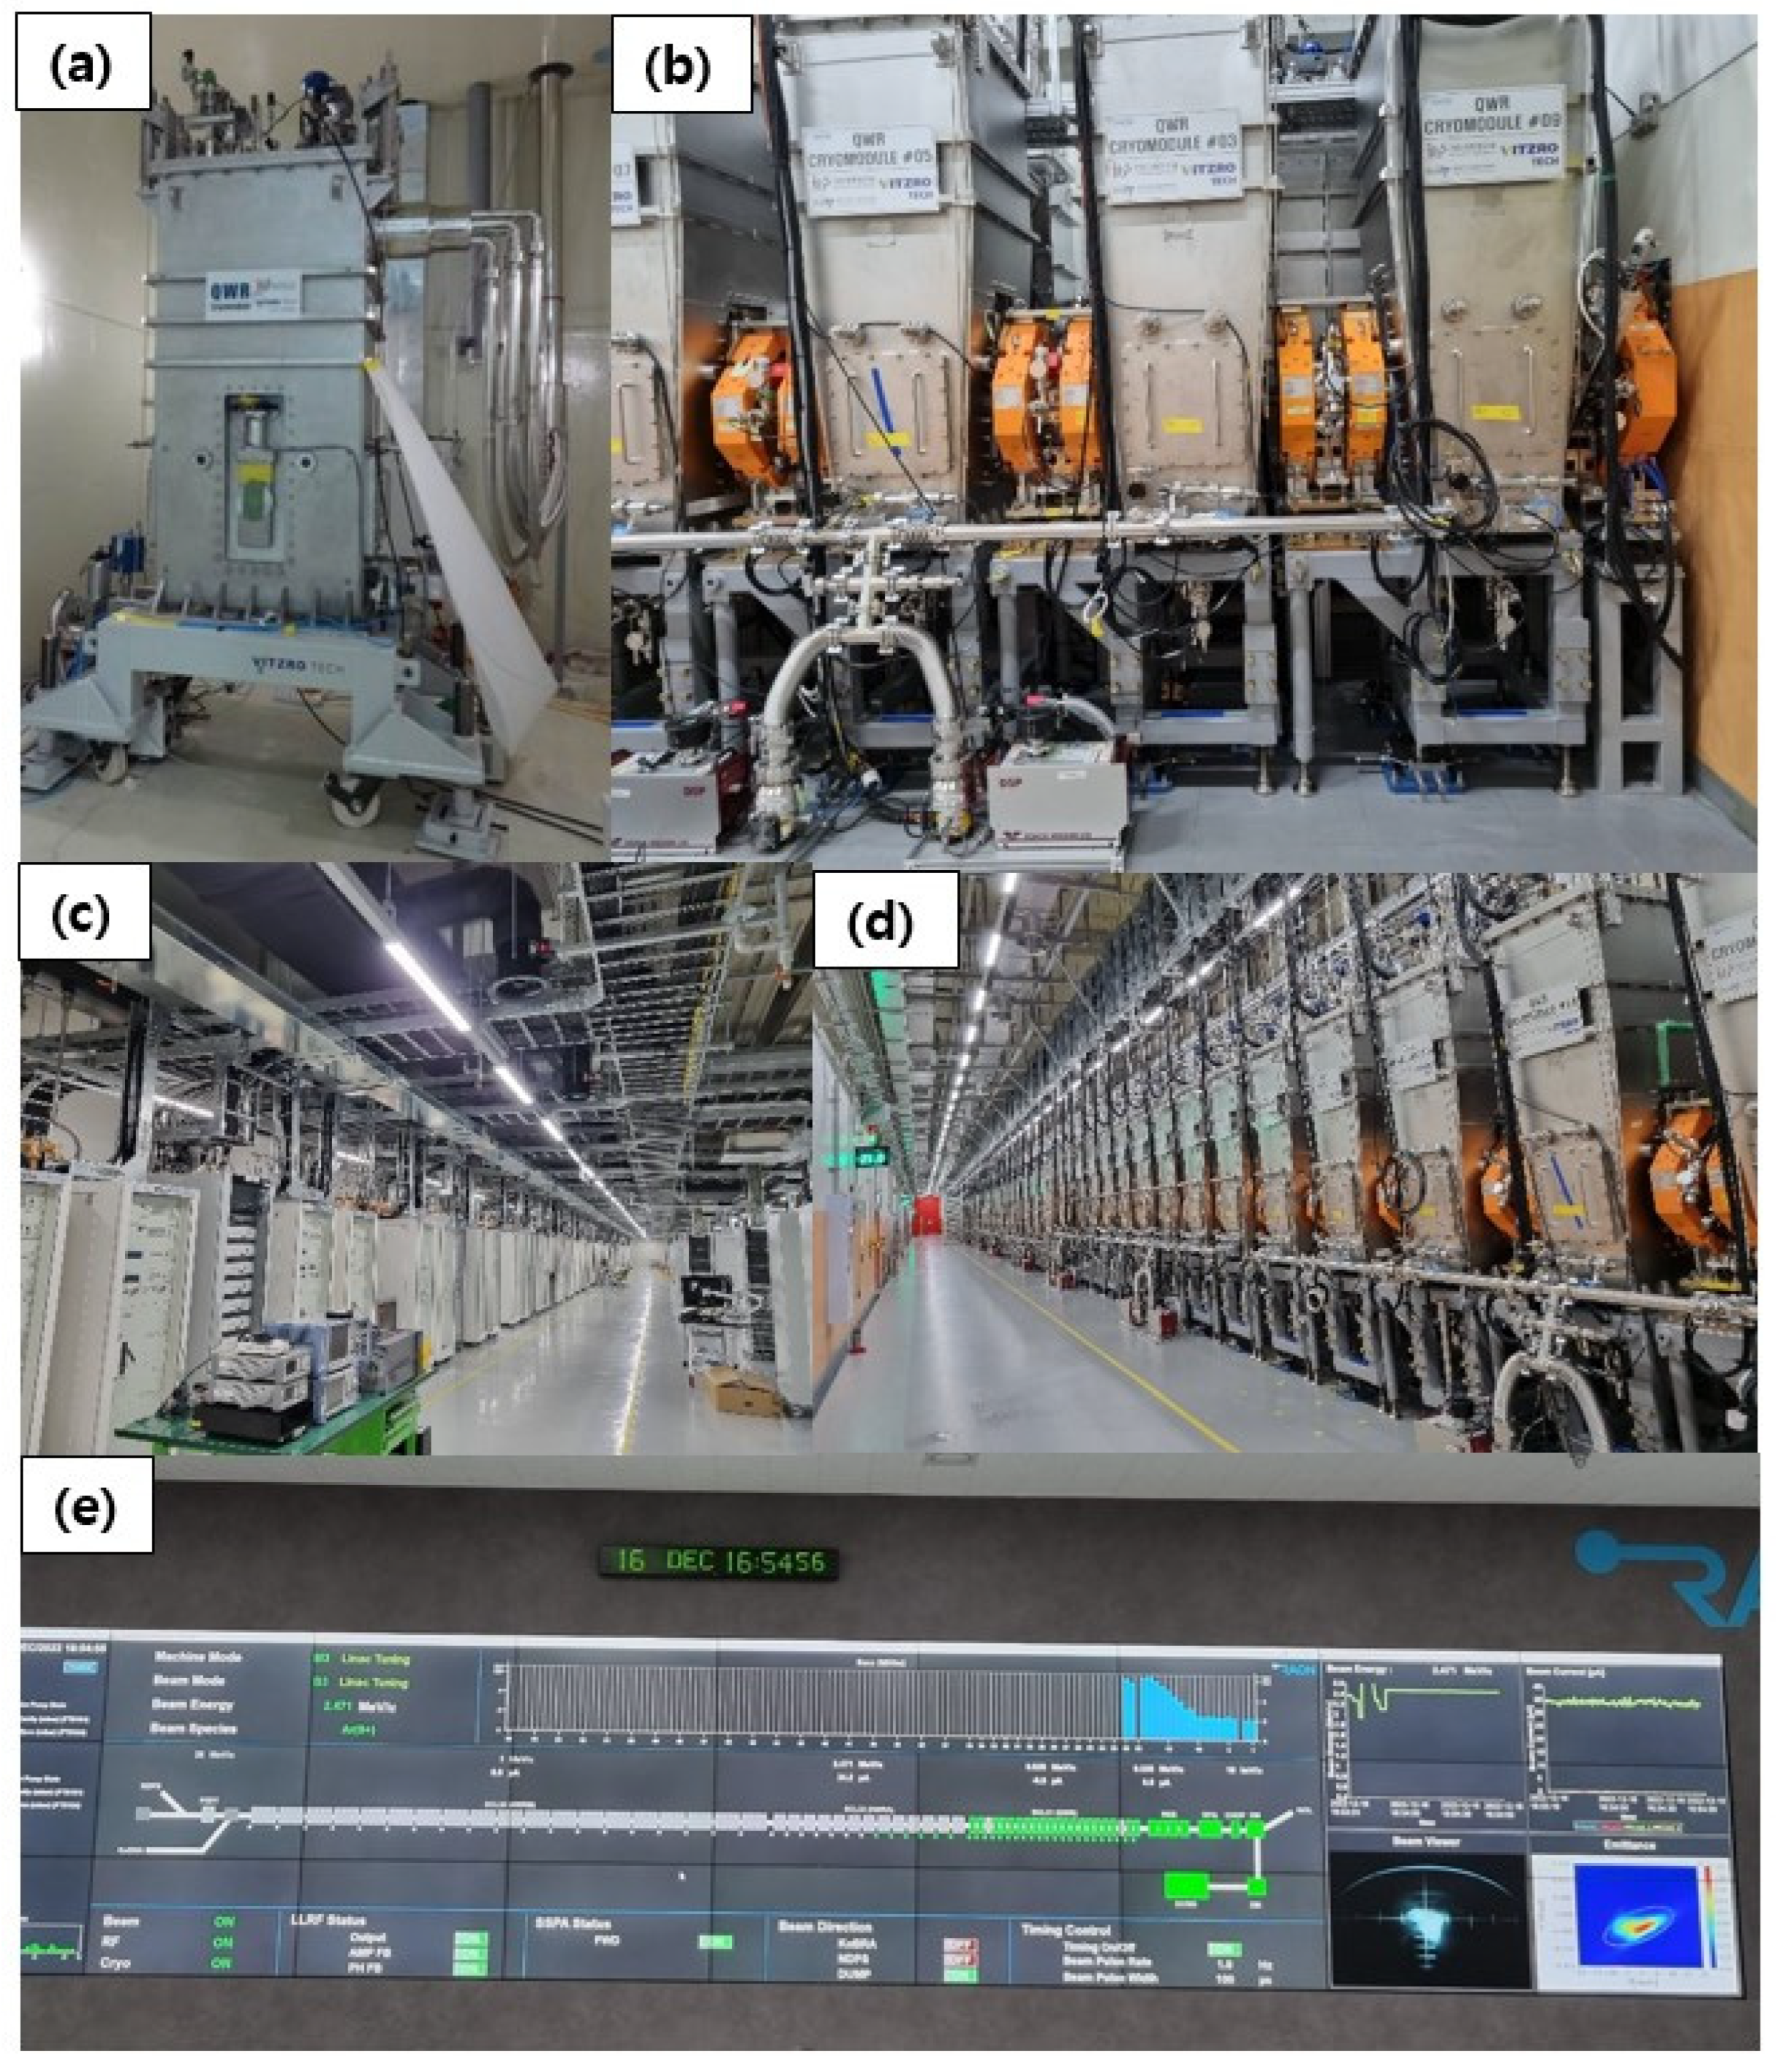
Figure 10 shows the pictures of the quarter-wave resonator (QWR) cryomodules and RAON SCL3 tunnel. For the first beam commissioning, the QWR cryomodules from 1 to 6 are used, and the beam energy of Ar
9+ is increased from 0.5 to 0.7 MeV/u with 30 µA. The second beam commissioning is performed for all QWR cryomodules from 1 to 22 in RAON SCL3, in which the energy of Ar
9+ is increased from 0.5 to 2.45 MeV/u with 30 µA. The two QWR cryomodules (CMs) for 3 and 20 are excluded because the QWR CM 3 shows the unstable RF control and the QWR CM 20 shows the off-resonance frequency even if the tuner is used at maximum range. The beam energy is determined using the time of flight measurement. For each QWR cavity in the QWR cryomodule, the accelerating amplitude and phase are determined one by one during beam commissioning. The accelerating field and phase for each cavity are kept during beam commissioning.
This research can be useful for the fabrication and testing of superconducting cavities and for understanding the magnetic degradation of the superconducting cavities.


