Article

Design Considerations of the DUCK Detector System

1
Department of Chemistry and Physics, Clayton State University, 2000 Clayton State Blvd., Morrow, GA 30260, USA
2
P. N. Lebedev Physical Institute of the Russian Academy of Sciences, 53 Leninskiy Pr., Moscow 119991, Russia
3
Physics Department, Northern Illinois University, 1425 W Lincoln Hwy., DeKalb, IL 60115, USA
4
Science Department, Community Christian School, 2001 Jodeco Rd., Stockbridge, GA 30281, USA
5
Xcision Medical Systems, 9176 Red Branch Rd STE O, Columbia, MD 21045, USA
*
Author to whom correspondence should be addressed.
Quantum Beam Sci. 2023, 7(1), 6; https://doi.org/10.3390/qubs7010006
Submission received: 15 November 2022 / Revised: 19 January 2023 / Accepted: 31 January 2023 / Published: 2 February 2023
(This article belongs to the Special Issue Advances in Cosmic Ray Physics)

Abstract

:
The article describes the development, design, and upcoming construction and deployment of core modules of DUCK (Detector system of Unusual Cosmic-ray casKades), a cosmic-rays detector system aimed to verify and further study the latest advances in the cosmic-rays field and participate in the international collaborations searching for new types of events. The primary scientific goal for the DUCK project will be an independent verification of the detection of ‘unusual’ cosmic ray events by the Horizon-T detector system. A detailed study of events of this type is a vital step towards understanding the nature of cosmic rays, their origins, and details of interaction with the nuclei in the atmosphere. Further operations as part of the CREDO collaboration will contribute to the continued monitoring of the cosmic events. Additional intellectual value includes the design of the fast detection system with high timing resolution for cosmic events detection and the study of the temporal structure of extensive air showers that would also contribute to the current simulations. All the steps are conducted with student involvement and advance excellence in providing students with real research experience and competitive knowledge.

1. Introduction

Today, several open topics remain in the field of high energy physics (HEP). The Higgs boson has been recently discovered and the neutrino oscillations are being studied extensively. Among the remaining mysteries are the origin and the nature of the ultra-high energy cosmic rays (UHECRs) that cause extensive atmosphere showers (EASs). Another current challenge in HEP and science in general is raising and training new generations of scientists capable to tackle the remaining mysteries and discovering new ones.

1.1. EAS Events with ‘Delayed’ Particle

For almost 70 years, researchers have observed EAS events with more than one pulse from the passage of particles in each detector. These events were called ‘events with a delayed particle’. The first registration of such events was described by J. Jelley and W. Whitehouse in 1953 [1]. The difference between these events and the typical EAS was the presence of the second pulse in the one or more detectors, indicating that a possible secondary disk caused by an energetic particle is being detected. While both pulses were clearly correlated, the hypothesis was introduced that a very massive particle can be born in the EAS cascade that will slow down due to its high mass in comparison with other particles constituting EASs that are highly relativistic. The decay of this massive particle will cause the secondary cascade that would be detected as a second pulse arriving with a certain delay.
Thus, the delay time between the pulses seemed a good starting point to measure these EAS events ‘with delayed particles’ in order to assess the mass of this heavy particle. Such events were studied by British and U.S. research groups in the 1960s–1980s [2,3,4]. Since the 1970s, delayed particles in EASs have been studied in Japan [5,6]. Studies of delayed particles in EASs have been carried out at Moscow State University (MSU) [7,8] and at LPI (TSHASS) [9,10] since the 1980s. Pulses with several maxima have been recorded at the facility in Yakutsk [11] since the 1990s and in the 2000s at the “Tunka” system (MSU) [12]. The results of these experiments can take too long to describe, however, there is one common trend for all the results: the conclusions of these experiments do not match. The measured heavy particle mass varies wildly as well as other conclusions by effectively each of the experiments listed. This disagreement points to the lack of understanding of the nature of events with delayed particles.

1.2. From ‘Delayed Particle’ to Multimodal Events

The notion of the delayed particles persisted for over 60 years for one simple reason: the experiments would at most detect two pulses in their detectors. The main reason for this was the time resolution for the detectors used. A typical cosmic ray experiment is operating around the order of 1 μs as the integration window for the analog to digital (ADC) conversion of the detector output. The detection of the time of the EAS arrival may be much faster on the order of a few ns, but this is the operation of the time to digital converter (TDC) that only records the time of the signal over a pre-set threshold and does not store any information about the pulse shape. This approach was reasonable as cosmic events are scarce and high-speed electronics were significantly more expensive. Only in the late 2010s did the need for more data from each detector start to arise and the cost of high-speed ADCs reduced to the point when some experiments started to upgrade their electronics to the faster ADCs, including the flash ADC (FADC), but the frequency of the recording (inverse of this frequency is the integration time of a single data point) remained in a few tens of MHz. Only in 2019 the Auger upgrade [13], with Auger being the largest cosmic ray experiment currently, it introduced the 120 MHz FADC, with the signal often being downsampled for the analysis using different filters [13].
The first experiment that widely deployed a 500 MHz FADC for the recording of the full waveform (about 20,000 points) from each detector was the Horizon-T detector system [14] that is located at the TSHASS facility at the elevation of about 3340 m above sea level. While initially this experiment was not geared toward the events with more than one pulse, the high-speed detectors and electronics used from the early prototypes provided data for the events that were later called multimodal or unusual in the most recent publications [15,16] as they had more than one maximum in data. The latest data on these events suggest that such events may be more complicated in nature, as events with even more than two pulses per event were detected [15]. An example of such an event signal from a single detector is shown in Figure 1, where the waveform from a Horizon-T detection point 9 is presented for the event from 22 h 31 m 5 s 6 April 2018 [17]. Figure 1 clearly shows five well-separated peaks. The time delay of each next peak with respect to the first one, the width of each peak (τ), and the number of particles as the corresponding particle density (ρ) are listed in this figure.
Another clear illustration of the Unusual Event is the event from 2 h 39 m30 s 7 March 2018 shown in Figure 2. The figure additionally lists: the pulse number, corresponding detection point, delay time from the first pulse, and width and number of particles as the particle density per m2 for each pulse. A zoom-in on the first three pulses is shown for clarity (the image is provided as a courtesy of Horizon-T experiment collaboration).
In this event, four detection points registered more than one pulse. Charged particle density appears to be weakly dependent on distance from the EAS axis and at large distances measured density drastically exceeds the expected from the simulation. Pulse width has no immediate dependency on the distance from the EAS axis and it is more than ten times smaller than expected. This is not possible within the regular model of EASs.
The events shown in Figure 1 and Figure 2 are part of a large dataset of the events sharing the characteristic of multimodality. The notion of multimodality expands the view of the events with only two peaks from previous experiments. As seen in these figures, the width of the pulses and their separation from each other is typically on the order of tens of ns; thus, an experiment with large integration times and slower electronics may see fewer pulses (typically 2) or miss them altogether. The idea of a delayed particle that already had little to none of the experimental support cannot be applied to the multimodal events as the probability of a massive particle appearance is inversely proportional to roughly its mass squared and the appearance of >1 of such particles is high unlikely. Moreover, such events are rather common, which does not support the explanation using a rare occurrence of the massive particle.
The high importance of this discovery of Unusual Events [17] calls for the independent verification of the Unusual Event detection and the accumulation of the data with such events for the subsequent analysis. The call to confirm and further the studies of Unusual Events is currently a main driving motivation towards the design and construction of the Detector system of Unusual Cosmic-ray casKades (DUCK) that will be constructed and deployed at Clayton State University campus, approx. 300 m above sea level. This connection to the university campus also allows us to involve students in every step of the R&D and construction, providing them with valuable real-life research experience. A further scientific endeavor for the DUCK system is to join efforts with the Cosmic Ray Extremely Distributed Observatory (CREDO) collaboration [18] in the search for Cosmic Ray Ensembles (CREs) very large, precited yet not observed particle cascades initiated above the Earth’s atmosphere. Such cascades could be formed both within classical models (e.g., products of photon–photon interactions) and exotic scenarios (e.g., the result of the decay of super heavy dark matter particles and subsequent interactions) [19].

2. Design Considerations for the DUCK System

The design of the DUCK system is based on the considerations from the EAS simulations as well as from previous experience that was reported by the Horizon-T and CREDO collaborations. The ‘standard event’ is defined as the shower generated by the EAS simulation package CORSIKA [20]. This definition encompasses the accepted theoretical understanding of the EAS processes and can be used as a reference to study the shower properties.
While the elevation for the DUCK will be around 300 m above sea level, and for the Horizon-T it is about 3400 m, most reported events of interest have been concentrating at around 45° or so from the vertical. At these angles, the mass of the air column that the EAS traverses is about the same as the vertical air column at sea level, thus the 300 m of elevation for the DUCK system is sufficient for the task. Consequently, DUCK will look for events close to the vertical that also have a smaller footprint.
The CORSIKA simulation output file lists all particles that arrive at the observation level, including their type, momentum, position on the plane, and arrival time. From this information, a histogram can be built for the particles arriving at a certain distance from the shower center. The center is defined as the point where the path of the parent particle, called the shower axis, crosses the observation level. Projected to the observation plane, all particles form a shape that is normally called an EAS, or shower disk.
Such histograms were built for the 2 m × 2 m areas along the x-axis as defined by CORSIKA from the shower center radially outwards—the virtual detectors. These histograms depict the number of particles vs. the time of their arrival at the observation level for each virtual detector. Figure 3 shows an example with four histograms for the simulated shower from the primary vertical proton with an initial energy of 1017 eV, binned every 2 ns.
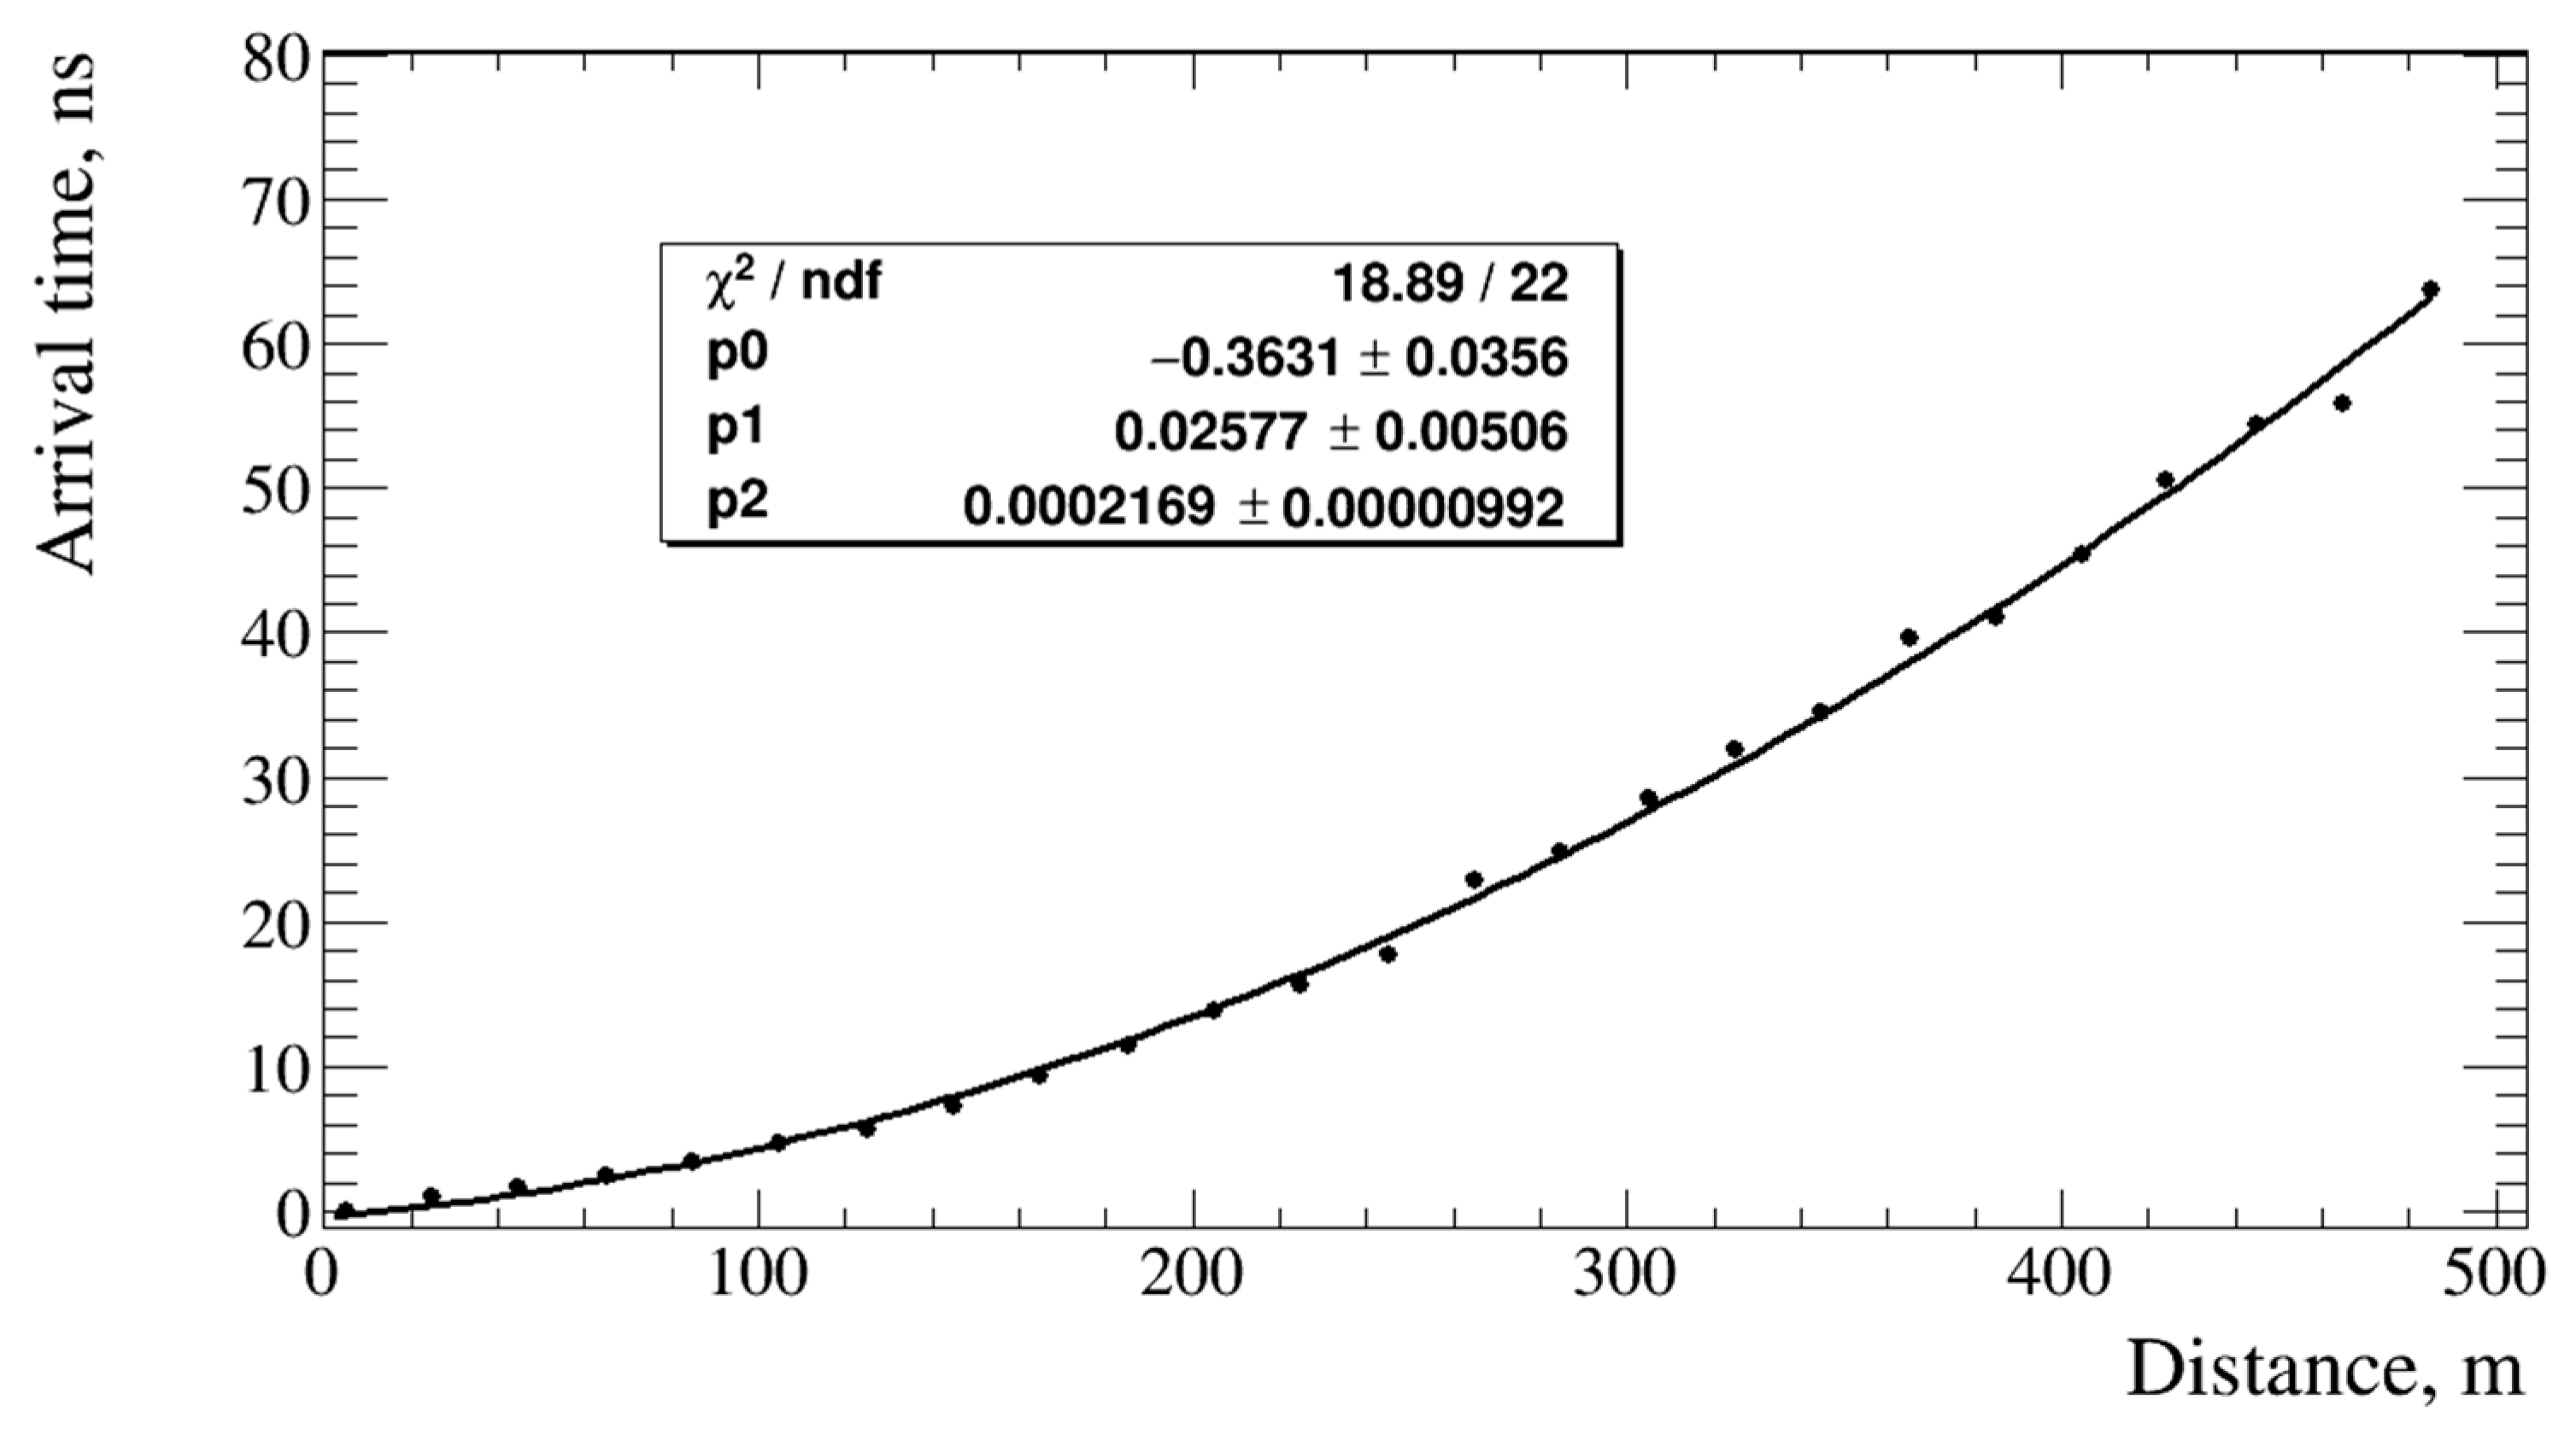
As seen from Figure 3, the total number of particles (defined as the area of each histogram) is not the only parameter that is dependent on the distance from the shower center. The arrival time, defined as the time of the maximum of each histogram, is changing with this distance. This dependence is used to measure the arrival direction of the EAS and it is also dependent on the original direction of the EAS disk (zenith and azimuthal angles). From the geometry of the particle paths from the shower center to the edges, it is expected that the dependence of the arrival time on the distance from the center should be quadratic by nature as shown in Figure 4. The fit line is added only as an illustration of quadratic dependence, and the result does not carry additional physical meaning.
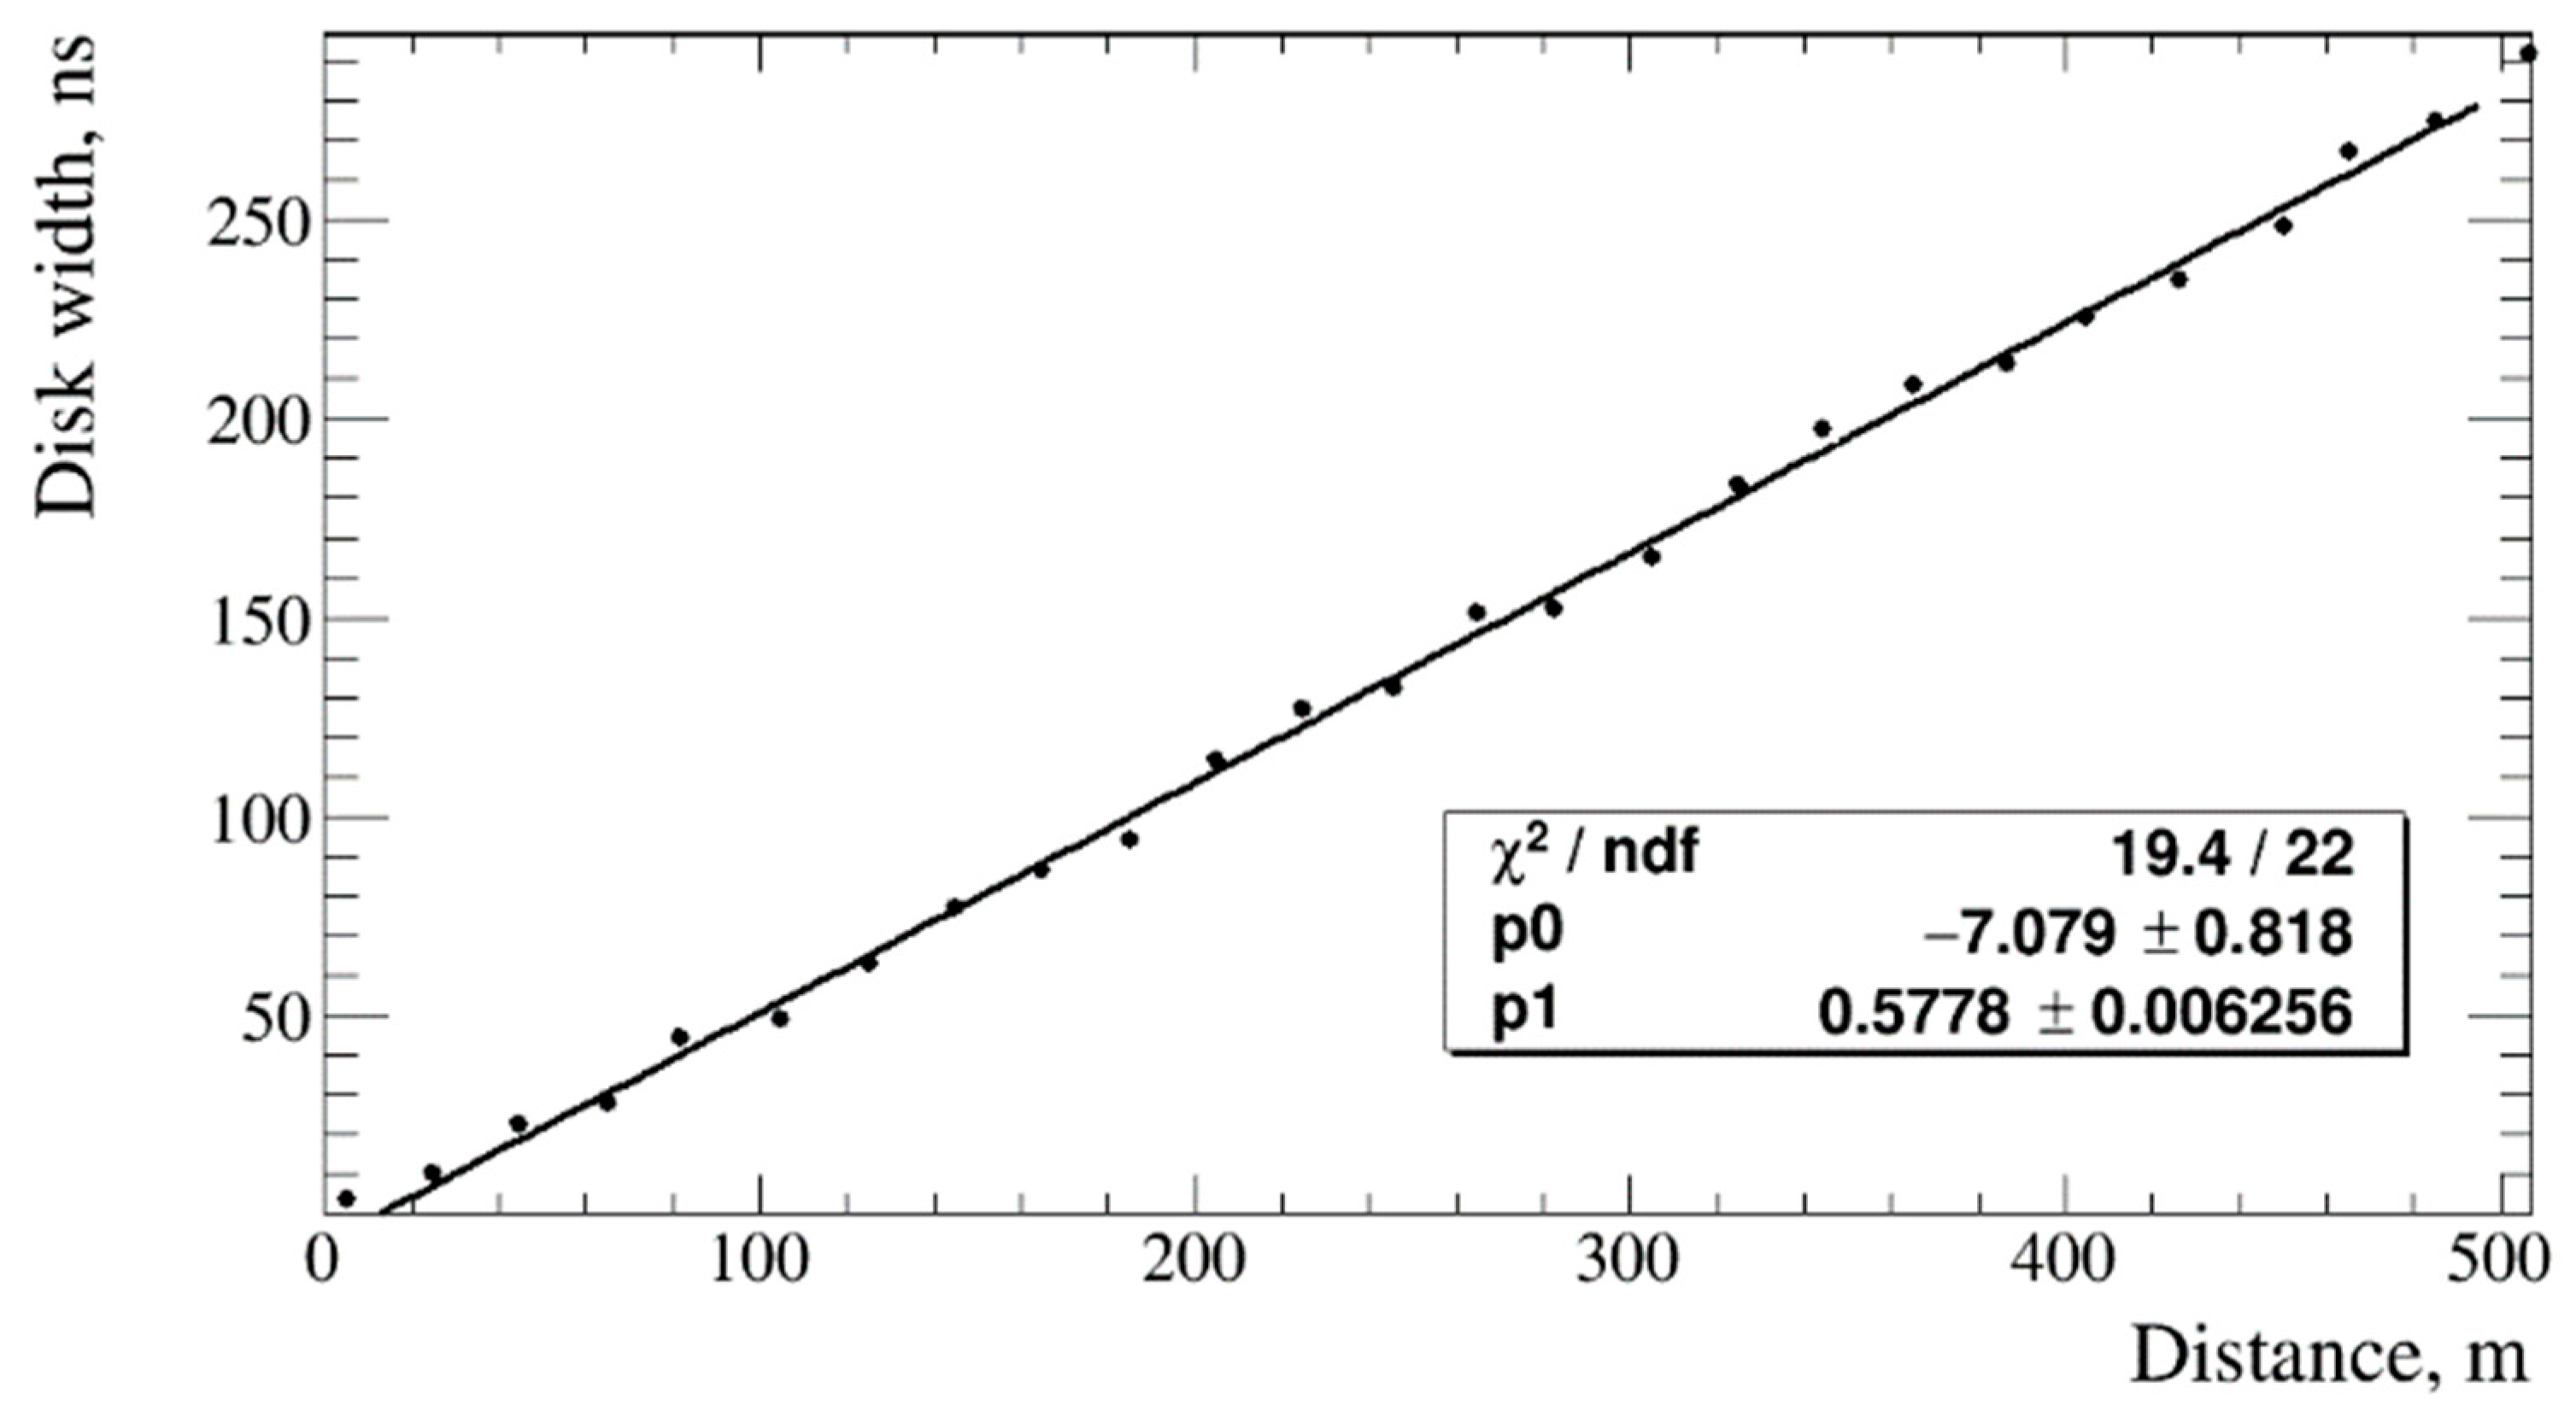
Another parameter that changes with the distance from the shower center is the width of each histogram from Figure 3, representing the thickness of the shower disk at each distance from the center. First, following the procedure from [15,16], we define the full width of each histogram as the time from the histogram’s first bin to the bin such that 80% of the histogram’s area will be encompassed between the 2. Using this definition, the width of each histogram is determined and plotted vs. the distance from the center as shown in Figure 5. As you can see from this figure, the dependence is very linear with a caveat that at large distances the number of particles falls sharply and is insufficient for creating a histogram and determining its width. Therefore, both Figure 4 and Figure 5 are limited to the distance of about 500 m from the shower center. For the showers resulting from a primary particle with higher energy, this distance increases and vice versa.
Nevertheless, the results from Figure 5 are promising and can be used for the EAS analysis to aid in determining the position of the shower center from the detector outputs. This institutes a requirement on the design of the detector system, firstly, to record the full waveform from each detector, and, secondly, to maintain the best possible time resolution for the PMT and plastic scintillator-based system in the order of a nanosecond.
Additionally, a detector system capable of measuring the shower disk thickness with a ns-level resolution is capable of studying the temporal structure of the EAS disk and to provide the checks for the simulation output, allowing for experimental testing of this particular parameter and an overall simulation performance.

3. Preliminary Design for the DUCK System

The presented design is preliminary and may be adjusted based on the system performance requirements update and funding availability. As the primary motivation for DUCK is the independent verification of the detection of Unusual Events by the Horizon-T detector system, the design of the DUCK system is mostly modeled after it with improvements and upgrades. In addition, the design is modular, so that the size and the geometry of the detector can be increased and modified in the future in order to pursue other scientific goals.
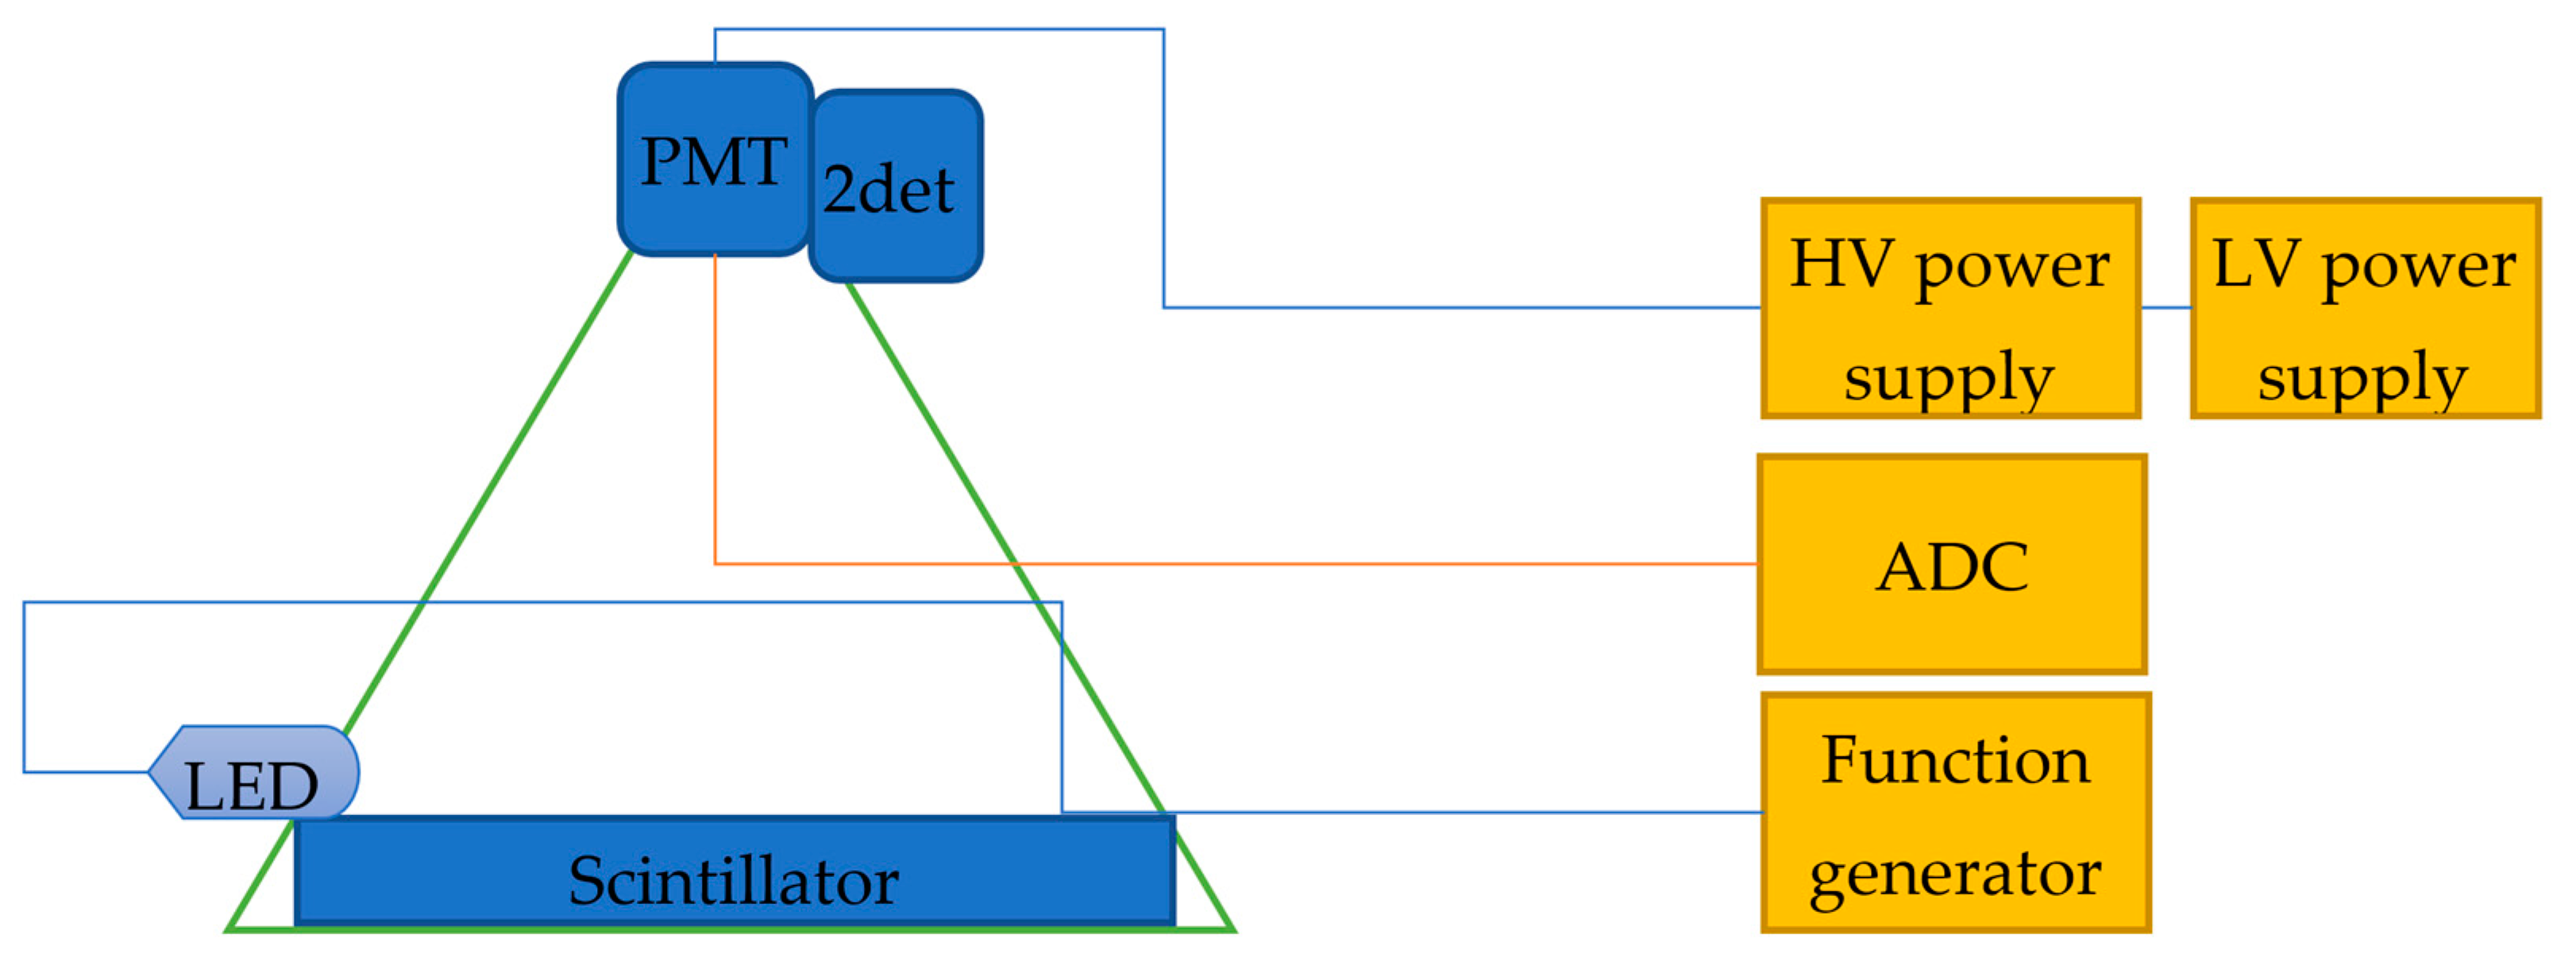
The design of a basic detector unit is simple and is an improvement of the Horizon-T detector described in [16]. Its schematic is shown on the left side of Figure 6. It includes the photomultiplier tube (PMT), the particle detection medium (i.e., scintillator), and the light-emitting diode (LED) and secondary detector (indicated as 2det) for calibration purposes in a square pyramid-shaped housing. The rest of the detector is filled with air. A housing wall, drawn by a green line, represents the light-tight and weather-tight insulation of the module. The signal waveform from a detector is recorded by the FADC. The detectors are powered by the mini-module high voltage power supplies (HV, one per detector) that connect to a common low-voltage power supply (LV in the figure). The initial design calls for the four detector units with the possible addition of units later.

System Details and Calibrations

The requirements for the PMT are the narrow output pulse and large photosensitive area. At this time, the Hamamatsu [21] R7723 PMT assembly is chosen to possess both properties: the 2-inch photocathode diameter and the shortest output pulse amount of the PMTs within the photosensitive area. Additionally, these PMTs are well matched to the plastic organic scintillator; moreover, they are used by the Horizon-T detector system.
The secondary detector is required to provide the two-fold coincidence trigger so that each detector unit can be calibrated independently using cosmic ray muons. As such, it does not have to be large and fully functional during physics runs. At this point, the Hamamatsu MPPC [22] detectors look promising but additional R&D is required.
The cosmic ray calibration with the help of the secondary detector can be conducted on the regular basis in an automated fashion, just by briefly stopping the physics run and switching the detectors to the calibration setting. This is a major improvement over the original Horizon-T design which does not have this capability. Additionally, the averaged calibration response for each detector allows for the conversion of the histograms from Figure 3 into the expected pulses from each detector.
The ADC model is currently chosen as CAEN [23] DT5730S FADC for a total of 8 channels—4 channels for the PMTs and 4 for the secondary detectors. The waveform recorded by each ADC channel consists of 5110 bins digitized every 2 ns each, for a total of 10.22 μs. The larger time ranges are possible with up to 2 million data points per event. The internal device memory is used as the event buffer that can hold up to 1024 events. The full range of 214 bins corresponds to a 2 V scale. The binary file size for one event is ~30 Kbyte. ADC is read via a USB2 connection by a PC.
A UV LED is used for the PMT voltage working point calibration and for gain monitoring by recoding PMT response to a single photoelectron (e.g., single photon detection). The LED is embedded in the scintillator and is directly exciting the wavelength shifters in the plastic, thus emulating the light created by the passing particle. The function generator powers the LED by short pulses (in the order of 10 ns) and provides the trigger to the ADC.
The design of the pyramid shape with a square base for the protective case with inner dimensions of 1 × 1 m is optimized for fast readout [24] and the optical use of the scintillator—other shapes will increase the plastic waste and reduce the total available area. Due to its availability, the Kuraray [25] SCSN-81 plastic scintillator will be used with high probability. An extensive simulation of the different detector designs was completed before the pyramid shape was chosen [24].
The ADC and the function generator will be positioned centrally. The initial deployment position of 4 detector units will be in a square shape, with units about 25–50 m from each other. Note that the effects of the longer cables on the PMT signal were studied in detail previously using the Horizon-T system [26].
This distance will be optimized both from simulations and detector performance as well as from measuring the separation curve, which is the total number of events per unit time for different distances between the detectors. The goal will be to match the energy range of the events reported by the Horizon-T detector system for the verification measurements. The lower detection energy threshold for the DUCK system would be around or above 1015 eV of the primary particle energy, depending on the final distance chosen.
The DT5730S ADC also produces the self-trigger signal from the preset conditions. The unit allows for the double coincidence within the specified window up to 2 μs for channel pairs 0–1, 2–3, 4–5, and 6–7. Moreover, coincidence between the groups is possible but only within a very limited window of 128 ns. Therefore, the trigger generation from using more than 2 detectors is possible but only for EASs arriving almost vertically, within about 14° from the vertical.
The 2 ns digitization of the ADC and the fast chosen components will be sufficient to detect the ‘unusual’ cosmic ray events with the characteristics as described in [15]. This time resolution is also appropriate to study the particle arrival time and compare it with the CORSIKA simulation output.
With the above settings and assuming the 50 m between the detectors arranged as a square, it is estimated to achieve below 36 events per hour or so from the cosmic ray power spectrum and elevation considerations. This number includes all events above 1015 eV of the primary particle energy. The rate of the detection of Unusual Events is very uncertain and is assumed at about one per day as a low bound.
In summary, the DUCK detector system is an improved design that is built on the Horizon-T experiment as a base. This is important as DUCK should be able to detect the same events as the Horizon-T, thus its design characteristics should be the same or better in order to accomplish this task. The potential for the expandability is also included in the DUCK design to support future upgrades.

4. Conclusions

The design of the planned DUCK detector system is currently optimized to provide the independent verification for the previously reported detections of unusual cosmic ray events. Upon verification, further study of such events will be conducted. Another scientific goal is a search for the CRE events as part of the CREDO collaboration. The main requirement for the CREDO is the precise event timing and ability to identify parts of very extended EASs that DUCK should be able to detect.
Additionally, the ns-level time resolution allows the DUCK system to study the temporal structure of the EAS disk for standard events, thus providing direct comparisons between the simulations and the experimental data.
The overall design of the DUCK system is flexible and allows for easy upgrades and extensions, opening up opportunities for additional research directions. The possible upgrade is to add 4 to 8 detectors at a higher distance from the detector center, about 100–200 m, thus forming the near and far periphery zones.

Author Contributions

Conceptualization, D.B. and V.A.; methodology, D.B., A.D. and V.Z.; software, O.K. and D.B.; validation, V.A. and A.I.; formal analysis, D.B. and T.K.; investigation, D.B.; resources, A.D.; writing—original draft preparation, D.B.; writing—review and editing, all co-authors. All authors have read and agreed to the published version of the manuscript.

Funding

This research is funded in part by the Clayton State University, College of Arts & Sciences UCARE grant, FY 2022-23.

Data Availability Statement

Data will be available on request until the experimental work and analysis are completed in full, and after that all data will be open access.

Conflicts of Interest

The authors declare no conflict of interest.

References

  1. Jelley, J.V.; Whitehouse, W.J. The Time Distribution of Delayed Particles in Extensive Air Showers using a Liquid Scintillation Counter of Large Area. Proc. Phys. Soc. Sect. A 1953, 66, 454–466. [Google Scholar] [CrossRef]
  2. Linsley, J.; Scarsi, L. Arrival Times of Air Shower Particles at Large Distances from the Axis. Phys. Rev. 1962, 128, 2384–2392. [Google Scholar] [CrossRef]
  3. Baxter, J.; Watson, A.; Wilson, J. Shower front structure and the properties of extensive air showers. In Proceedings of the 9th International Cosmic Ray Conference, London, UK, September 1965; Volume 1, pp. 724–726. [Google Scholar]
  4. Mincer, A.I.; Freudenreich, H.T.; Goodman, J.A.; Tonwar, S.C.; Yodh, G.B.; Ellsworth, R.W.; Berley, D. A Study of Arrival Time Structure of Low Energy Hadrons Near Air Shower Cores at Sea Level. In Proceedings of the 18th International Cosmic Ray Conference, Bangalore, India, 22 August–3 September 1983; Volume 11, pp. 264–267. [Google Scholar]
  5. Hara, T.; Hatano, Y.; Hayashida, N.; Ishikawa, F.; Jogo, N.; Kamata, K.; Yoshii, H.; Crouch, M.F.; Tanahasi, G.; Torii, R.; et al. The Akeno Air Shower Project. In Proceedings of the 16th International Cosmic Ray Conference, Kyoto, Japan, 6–18 August 1979; Volume 8, pp. 135–140. [Google Scholar]
  6. Inoue, N.; Kawamoto, M.; Misaki, Y.; Maeda, T.; Takeuchi, T.; Toyoda, Y. Structure of Air Shower Disk Near the Core. In Proceedings of the 19th International Cosmic Ray Conference (ICRC19), San Diego, CA, USA, 11–23 August 1985; Volume 7, pp. 316–319. [Google Scholar]
  7. Atrashkevich, V.B.; Vedeneev, O.V.; Garipov, G.K.; Kalmykov, N.N.; Kulikov, G.V.; Silaev, A. Delayed pulses in EAS at sea-level. Bull. Russ. Acad. Sci. Phys. 1994, 58, 98–102. [Google Scholar]
  8. Fomin, Y.A.; Garipov, G.K.; Kalmykov, N.N.; Khrenov, B.A.; Kulikov, G.V.; Kuzmichev, L.A.; Yashin, I.V.; Sulakov, V.P.; Silaev, A.A.; Shriokov, A.V.; et al. Complex EAS Array for Super-High Energy Cosmic Ray Research. In Proceedings of the 28th International Cosmic Ray Conference, Tsukuba, Japan, 31 July–7 August 2003; Volume 1, pp. 973–976. [Google Scholar]
  9. Beisembaev, R.U.; Vavilov, Y.N.; Dedenko, L.G.; Kruglov, A.V.; Stepanov, A.V.; Takibaev, Z.S. Investigation of the Arrival Time Distribution of Muons with Energy ≥5 GeV in EAS at Mountain Level (690 g/cm2). In Proceedings of the 24th International Cosmic Ray Conference, Rome, Italy, 28 August–8 September 1995; Volume 1, pp. 454–457. [Google Scholar]
  10. Beisembaev, R.U.; Vavilov, Y.N.; Vildanov, N.G.; Kruglov, A.V.; Stepanov, A.V.; Takibaev, J.S. Delayed muons in extensive air showers and double-front showers. Phys. At. Nucl. 2009, 72, 1852–1859. [Google Scholar] [CrossRef]
  11. Glushkov, A.V.; Kosarev, V.B.; Makarov, I.T.; Sleptsov, I.E.; Filippov, S.A. Temporal structure of the muon disk at large distances from the axis of extensive air showers with E 0 ≥ 6 ×10¹⁶ eV. JETP Lett. 1998, 67, 383–388. [Google Scholar] [CrossRef]
  12. Budnev, N.M.; Wishnevski, R.; Gress, O.A.; Zabolotsky, A.V.; Zagorodnikov, A.V.; Kalmykov, N.N.; Kozhin, V.A.; Korosteleva, E.E.; Kuzmichev, L.A.; Lubsandorzhiev, B.K.; et al. Tunka-133: Status 2008 and development of methods for data analysis. Bull. Russ. Acad. Sci. Phys. 2009, 73, 588–592. [Google Scholar] [CrossRef]
  13. Castellina, A. on behalf of the Pierre Auger Collaboration. AugerPrime: The Pierre Auger Observatory Upgrade. arXiv 2019, arXiv:1905.04472. [Google Scholar]
  14. Beisembaev, R.; Baigarin, K.; Beznosko, D.; Beisembaeva, E.; Vildanova, M.; Zhukov, V.; Petlenko, M.; Ryabov, V.; Sadykov, K.; Shaulov, S. The Horizon-T Cosmic Ray Experiment, NIM A; Elsevier: Amsterdam, The Netherlands, 2022; Volume 1037, p. 166901. ISSN 0168-9002. [Google Scholar] [CrossRef]
  15. Beznosko, D.; Baigarin, K.; Beisembaev, R.; Beisembaeva, E.; Gladysz-Dziadu, E.; Ryabov, V.; Sadykov, T.; Shaulov, S.; Shiltsev, V.; Stepanov, A. A Potential Probe of Fundamental Interactions Using Multi-Modal Cosmic Ray events. FERMILAB-CONF-22-361-AD and oai:inspirehep.net:2064815, 2022. Available online: https://lss.fnal.gov/archive/2022/conf/fermilab-conf-22-361-ad.pdf (accessed on 11 November 2022).
  16. Beznosko, D.; Beisembaev, R.U.; A Baigarin, K.; Batyrkhanov, A.; A Beisembaeva, E.; Beremkulov, T.; Dalkarov, O.D.; Iakovlev, A.; A Ryabov, V.; Suleimenov, N.S.; et al. Horizon-T experiment and detection of Extensive air showers with unusual structure. J. Phys. Conf. Ser. 2020, 1342, 012007. [Google Scholar] [CrossRef]
  17. Beznosko, D.; Baigarin, K.; Beisembaev, R.; Beisembaeva, E.; Gladysz-Dziadu, E.; Ryabov, V.; Sadykov, T.; Shaulov, S.; Shiltsev, V.; Stepanov, A.; et al. Probing Fundamental Physics with Multi-Modal Cosmic Ray Events. arXiv 2022, arXiv:2204.04045. [Google Scholar]
  18. Homola, P.; Alvarez Castillo, D.E.; Almeida Cheminant, K.; Beznosko, D.; Budnev, N.; Gora, D.; Gupta, A.C.; Hnatyk, B.; Kasztelan, M.; Kovacs, P.; et al. Invitation to the Cosmic Ray Extremely Distributed Observatory. In Proceedings of the 37th International Cosmic Ray Conference, Berlin, Germany, 12–23 July 2021. [Google Scholar]
  19. Verbetsky, Y.; Svanidze, M.; Ruimi, O.; Wibig, T.; Kakabadze, L.; Homola, P.; Alvarez-Castillo, D.E.; Beznosko, D.; Sarkisyan-Grinbaum, E.K.; Bar, O.; et al. First Results on the Revealing of Cognate Ancestors among the Particles of the Primary Cosmic Rays That Gave Rise to Extensive Air Showers Observed by the GELATICA Network. Symmetry 2022, 14, 1749. [Google Scholar] [CrossRef]
  20. Heck, D.; Knapp, J.; Capdevielle, J.; Schatz, G. Thouw, CORSIKA: A Monte Carlo Code to Simulate Extensive Air Showers. In Forschungszentrum Karlsruhe Report FZKA; Forschungszentrum Karlsruhe GmbH: Karlsruhe, Germany, 1998; Volume 6019. [Google Scholar]
  21. Hamamatsu Corporation. 360 Foothill Road, P.O. Box 6910, Bridgewater, NJ 08807-0919, USA; 314-5, Shimokanzo, Toyooka-village, Iwatagun, Shizuoka-ken, 438-0193 Japan. Available online: https://www.hamamatsu.com/ (accessed on 11 November 2022).
  22. Assylbekov, S.; Berger, B.E.; Berns, H.; Beznosko, D.; Bodek, A.; Bradford, R.; Buchanan, N.; Budd, H.; Caffari, Y.; Connolly, K.; et al. The T2K ND280 off-axis pi–zero detector. NIM A 2012, 686, 48–63. [Google Scholar] [CrossRef]
  23. CAEN, S.p.A. Via della Vetraia, 11, 55049 Viareggio Lucca, Italy. Available online: http://www.caen.it (accessed on 11 November 2022).
  24. Beznosko, D.; Beisembaev, R.; Beisembaeva, E.; Duspayev, A.; Iakovlev, A.; Sadykov, T.; Uakhitov, T.; Vildanova, M.; Yessenov, M.; Zhukov, V. Fast and simple glass-based charged particles detector with large linear detection range. J. Instrum. 2017, 12, T07008. [Google Scholar] [CrossRef]
  25. Kuraray America Inc. 3700 Bay Area Blvd., Suite 680, Houston, TX 77058 USA. Available online: https://kuraray.us.com/ (accessed on 11 November 2022).
  26. Beznosko, D.; Iakovlev, A.; Mosunov, V.D.; Mustafin, B.; Sabyrov, A.; Vildanova, M.I.; Zhukov, V.V. Horizon-T Experiment Detailed Calibration of Cables. arXiv 2019, arXiv:1910.09079. [Google Scholar]
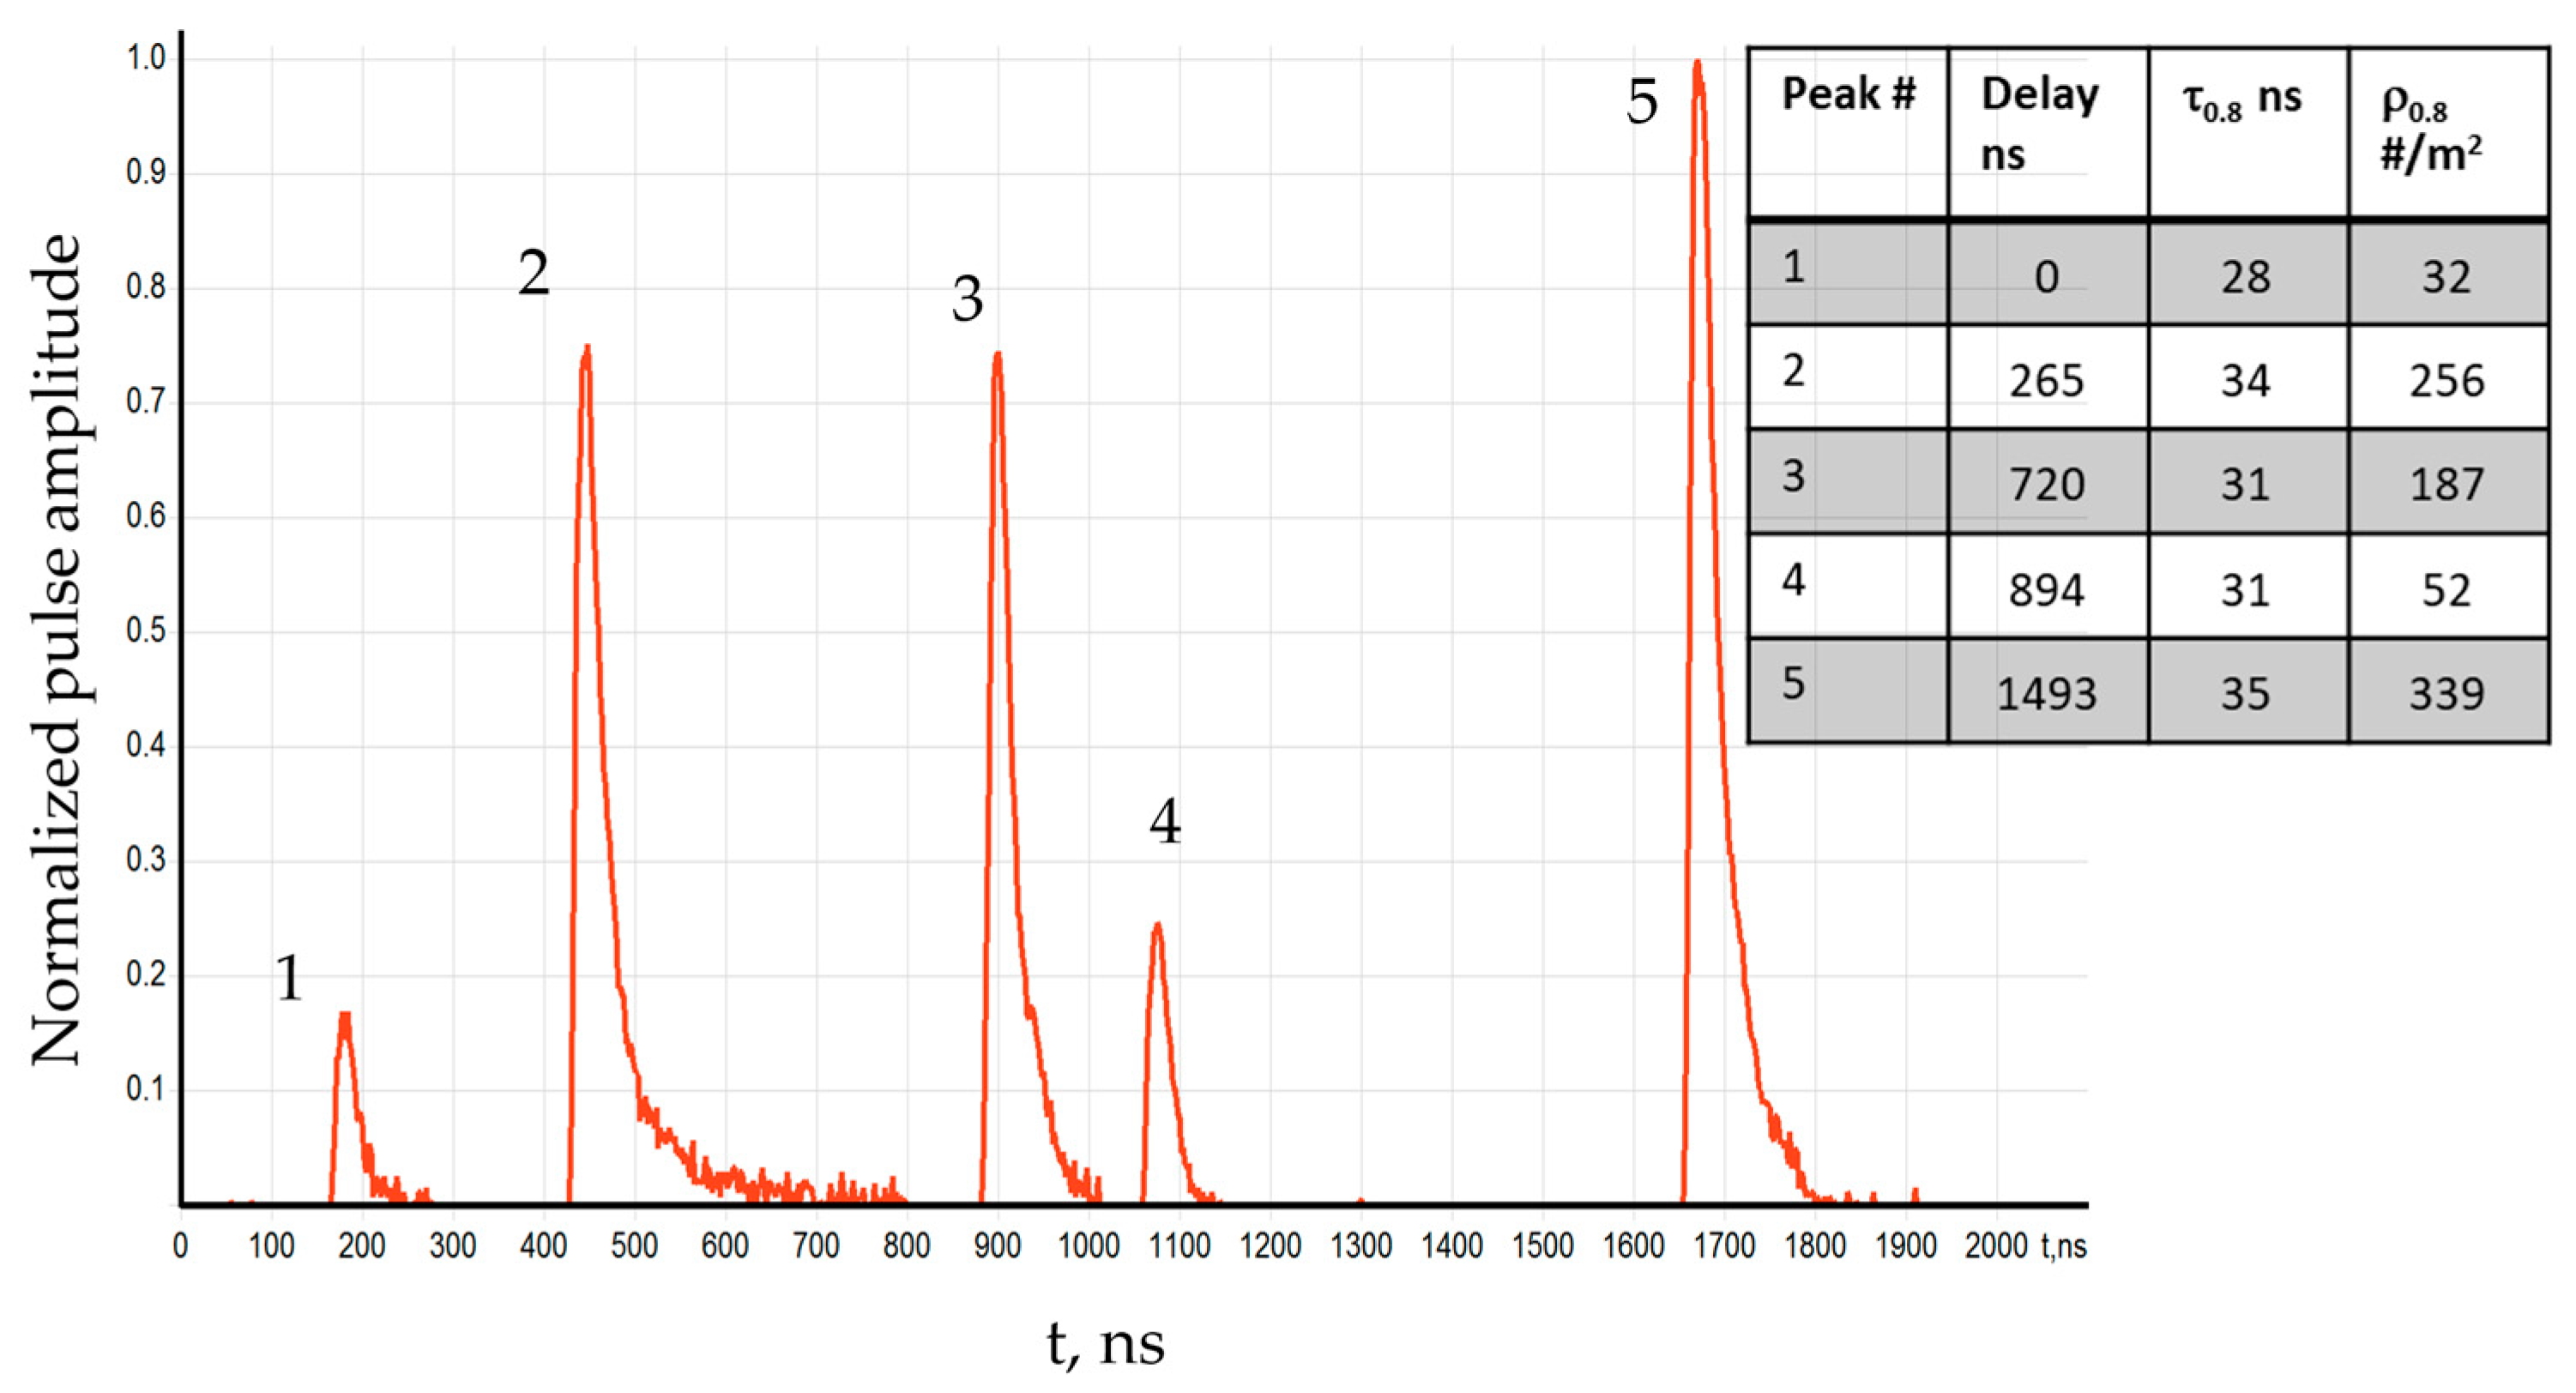
Figure 1. Unusual Event from 6 April 2018 as seen by a single detector. Corresponding delays, pulse widths, and particle density for each peak are listed.
Qubs 07 00006 g001
Figure 2. Unusual Event from 7 March 2018 as seen by Horizon-T detector system. Detection point # and corresponding color of the line, delays w.r.t first pulse, pulse widths, and particle density for each peak are listed.
Qubs 07 00006 g002
Figure 3. Number of particles arriving at the observation level per 2 ns bins for the virtual detectors placed at various distances from the shower center. Parent particle is 1017 eV proton, vertical.
Qubs 07 00006 g003
Figure 4. The dependence of the shower disk arrival time on the distance from the center for the same shower as in Figure 3. The fit function used is p0 + p1x + p2x2.
Qubs 07 00006 g004
Figure 5. The dependence of the shower disk thickness on the distance from the center for the same shower as in Figure 3. The fit function used is p0 + p1x.
Qubs 07 00006 g005
Figure 6. DUCK system basic detector unit preliminary design.
Qubs 07 00006 g006
Disclaimer/Publisher’s Note: The statements, opinions and data contained in all publications are solely those of the individual author(s) and contributor(s) and not of MDPI and/or the editor(s). MDPI and/or the editor(s) disclaim responsibility for any injury to people or property resulting from any ideas, methods, instructions or products referred to in the content.