Article

High-Transmission Neutron Optical Devices Utilizing Micro-Machined Structures

1
Institute for Quantum Computing, University of Waterloo, Waterloo, ON N2L3G1, Canada
2
Department of Physics, University of Waterloo, Waterloo, ON N2L3G1, Canada
3
National Institute of Standards and Technology, Gaithersburg, MD 20899, USA
4
Department of Materials Science and Engineering, University of Maryland, College Park, MD 20742, USA
5
Department of Chemistry, University of Waterloo, Waterloo, ON N2L3G1, Canada
6
Neutron Optics LP., Quantum Valley Investment, Waterloo, ON N2L 6R2, Canada
*
Author to whom correspondence should be addressed.
Quantum Beam Sci. 2023, 7(1), 10; https://doi.org/10.3390/qubs7010010
Submission received: 11 February 2023 / Revised: 6 March 2023 / Accepted: 8 March 2023 / Published: 13 March 2023

Abstract

:
Neutrons are a powerful probe in material science with unique penetrating abilities. A major challenge stems from the fact that neutron optical devices are limited to refractive indices on the order of n 1 ± 10 5 . By exploiting advances in precision manufacturing, we designed and constructed micro-meter period triangular grating with a high-aspect ratio of 14.3 . The manufacturing quality is demonstrated with white-light interferometric data and microscope imaging. Neutron-scattering experiment results are presented, showing agreement with refraction modelling. The capabilities of neutron Fresnel prisms and lenses based on this design are contrasted with existing neutron focusing techniques, and the path separation of a prism-based neutron interferometer is estimated.

1. Introduction

Neutrons possess the unique ability to deeply penetrate materials due to their zero charge, making them unparalleled probes of bulk material. In particular, neutron optics has established itself as an indispensable tool for measuring material properties and probing internal magnetic and phonon interactions [1,2]. In Small-Angle Neutron-Scattering (SANS) experiments, a compound refractive lens (CRL) is often used to focus an incident neutron beam. CRL devices use a series of lenses, in some cases up to 30 individual elements [3,4,5]. These devices, while effective, require large amounts of material to construct, resulting in a significant amount of beam attenuation. Alternatives to neutron CRL devices which circumvent these limitations include lenses that utilize magnetic fields [6,7,8,9,10,11,12,13], focusing capillaries [14,15], Wolter mirrors [16], and Fresnel lenses [17]. Recent work attempts to overcome the limited range of refractive indices available to neutrons by leveraging magnetic fields, structuring neutron wavefronts through the spin degree-of-freedom [18,19,20]. Other research has generated structured neutron wavefronts by applying nano-scale gratings to generate orbital angular momentum states [21].
In addition to SANS methods, neutron optics has expanded to include a wealth of techniques from polarized neutron experiments [22,23,24], single-crystal interferometers [25,26,27,28,29], and grating-based neutron interferometers [30,31,32,33]. The first neutron interferometer was built with two prisms that caused Fresnel interference by means of wave front division [34]. With this device, a path separation of only 60 μm was obtained, which was later improved to a few centimeters with a perfect crystal Mach–Zehnder interferometer relying on Bragg diffraction [35]. The perfect crystal interferometer allowed for a number of investigations on neutron properties and interactions with unprecedented precision [36,37,38,39,40] but suffered some important drawbacks, including a narrow wavelength acceptance and difficulty of fabrication [41,42,43,44].
Utilizing a diamond turning machine, we have fabricated a high aspect ratio structure of refractive prisms that deflects a neutron beam. In this work, we demonstrate a functioning triangular array refractive prism (TARP) with neutrons at the BT-5 Ultra-Small-Angle Neutron-Scattering (USANS) instrument located at the National Institute for Standards and Technology (NIST) Center for Neutron Research (NCNR) facility [45]. Experimental results are compared to theoretical predictions based on Snell’s Law. The effects of manufacturing imperfections are simulated and compared to experimental USANS results. The TARP functions as a Fresnel prism and enables prism-based neutron interferometers to create path separations larger than previously possible. The micro-prisms used in this TARP device also enable the construction of next-generation neutron-focusing devices.

2. Materials and Methods

2.1. Micro-Prism Fabrication

High-aspect ratio prisms can now be manufactured due to the availability of an ultra-high-precision machining center (Moore Nanotech 350FG [46]) which features C-axis control and live tooling. The individual prisms were fabricated from a 5052-O aluminum ring of 38 mm outer diameter (OD), 25 mm inner diameter (ID), and thickness of 250 μm that is held on an aluminum chuck. The full aluminum ring is shown, after machining was complete, in Figure 1a. This accommodates mounting by a wax (Crystal bond 509-3), allowing the aluminum ring to be dismounted via either heating or dissolving the wax in acetone. The choice of material, fully annealed 5052-O aluminum, was dictated by its strength and formability, coupled with the material’s heat resistance, allowing the aforementioned wax to be heated without damaging the finished aluminum prisms. First, the backside of the ring is turned using diamond tooling to create a flat surface with a surface finish of 20 nm roughness average (Ra). The now flat reference face is remounted to the chuck to ensure a seating of better than 3 μm parallelism with the chuck face. The remounted ring is then segmented radially by an auxiliary milling spindle into pieces 5.4 mm wide at their base and 8.5 mm wide at the prism apex, the segmented ring is shown in Figure 1b. The finishing operation involves diamond turning a flat face with a 140 μm target thickness from 25 mm ID to 29 mm OD transitioning into a conical face, starting at 29 mm OD and tapering to zero thickness at 37 mm OD.
The 2 angle of the radial cross-section of each segment has an uncertainty of 0.02 arising from two sources. The first uncertainty is due to the parallelism of the front and back faces, which was measured by the maximum variation in thickness (3 μm) at the OD of 38   m m after facing a ring without conical features, resulting in an uncertainty of 0.005 . The second, and more significant source, of uncertainty arises from the fact that the angled prism segment is machined radially, as shown by black dashed lines in Figure 1b which indicate the 2 surface. This causes the prism surface at the edge of each prism to be a hyperbolic curve, as opposed to the uniformly angled surface which would be expected of a prism. This curved surface, when fit to a straight line, will have a surface angle of 1.98 , as opposed to the 2.00 flat surface in the middle of each prism segment. Therefore, the maximum angle deviation due to the conical shape of each segment is determined to be 0.02 at the region furthest from the center line. The most unpredictable error in the deviation from a perfect prism is due to the extremely thin apex of the prisms, which deforms at the slightest pressure. Heating the chuck to release the segments showed severe buckling of all apices likely attributed to uneven rates of thermal expansion. Therefore, the piece was unmounted by dissolving the mounting wax in acetone instead of raising the temperature. After releasing the segments and gently cleaning, without agitation, the segments were assembled into the TARP device. The base of each prism (shown in Figure 1b with a base length of 5.4   m m ) was placed in an aluminum vice, stacking subsequent prisms on this flat base segment. A fine pitch screw was then used to squeeze these flat regions at the base of the prism together, resulting in an assembled TARP device.
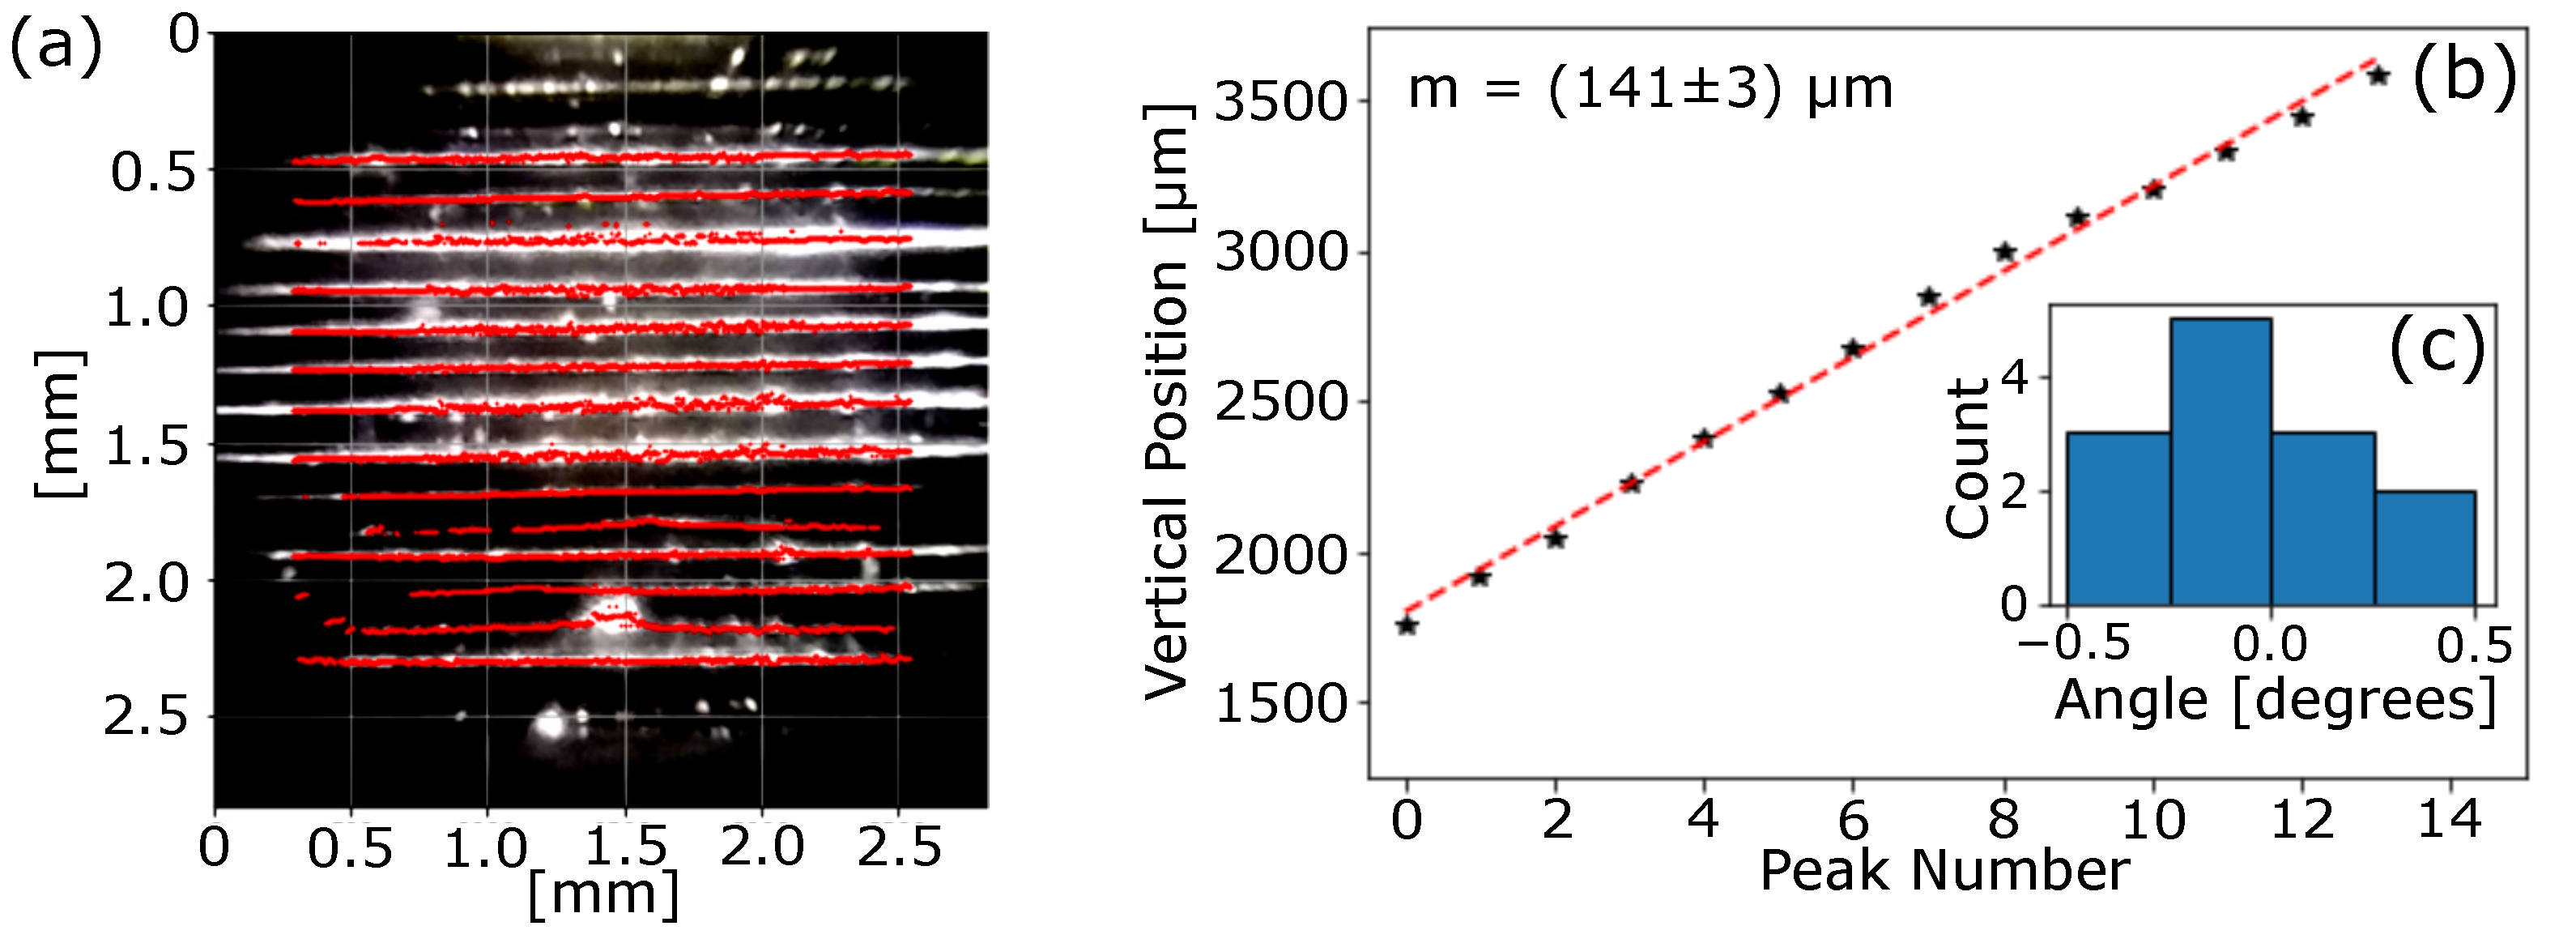
The manufacturing quality of the TARP was first evaluated using white-light interferometry and optical microscopy. Fitting sampled surface height values along the blue line in Figure 1c, we find the surface to be angled at 1 . 999 ± 0 . 001 , matching the designed surface angle of 2 . The residual of this fit, shown in Figure 1d, indicates that, within this region, surface form is straight to within ± 0.1   μ m . Once this annulus is cut and assembled, the alignment and spacing of prisms in the TARP can be measured by comparing the separation of the prism apices at different locations on the optical microscope image. Figure 2a shows red points where the prism peak is detected along each vertical slice of pixels. Each series of red points corresponding to a single prism are then linearly fit to extract a series of slopes, m i , and intercepts, b i . Figure 2b shows these y-intercepts, b i , which are again linearly fit to determine that the spacing between prism peaks is 141   μ m ± 3   μ m . The slopes, m i , show a variation in the alignment of these prisms with a standard deviation of ± 0 . 3 . A histogram of these slope values can be seen in Figure 2c. The high aspect ratio, 14.3 , suggests that the TARP prototype would be capable of deviating a neutron beam equivalent to a single prism that is 3   m m wide and 85.9   m m in height.
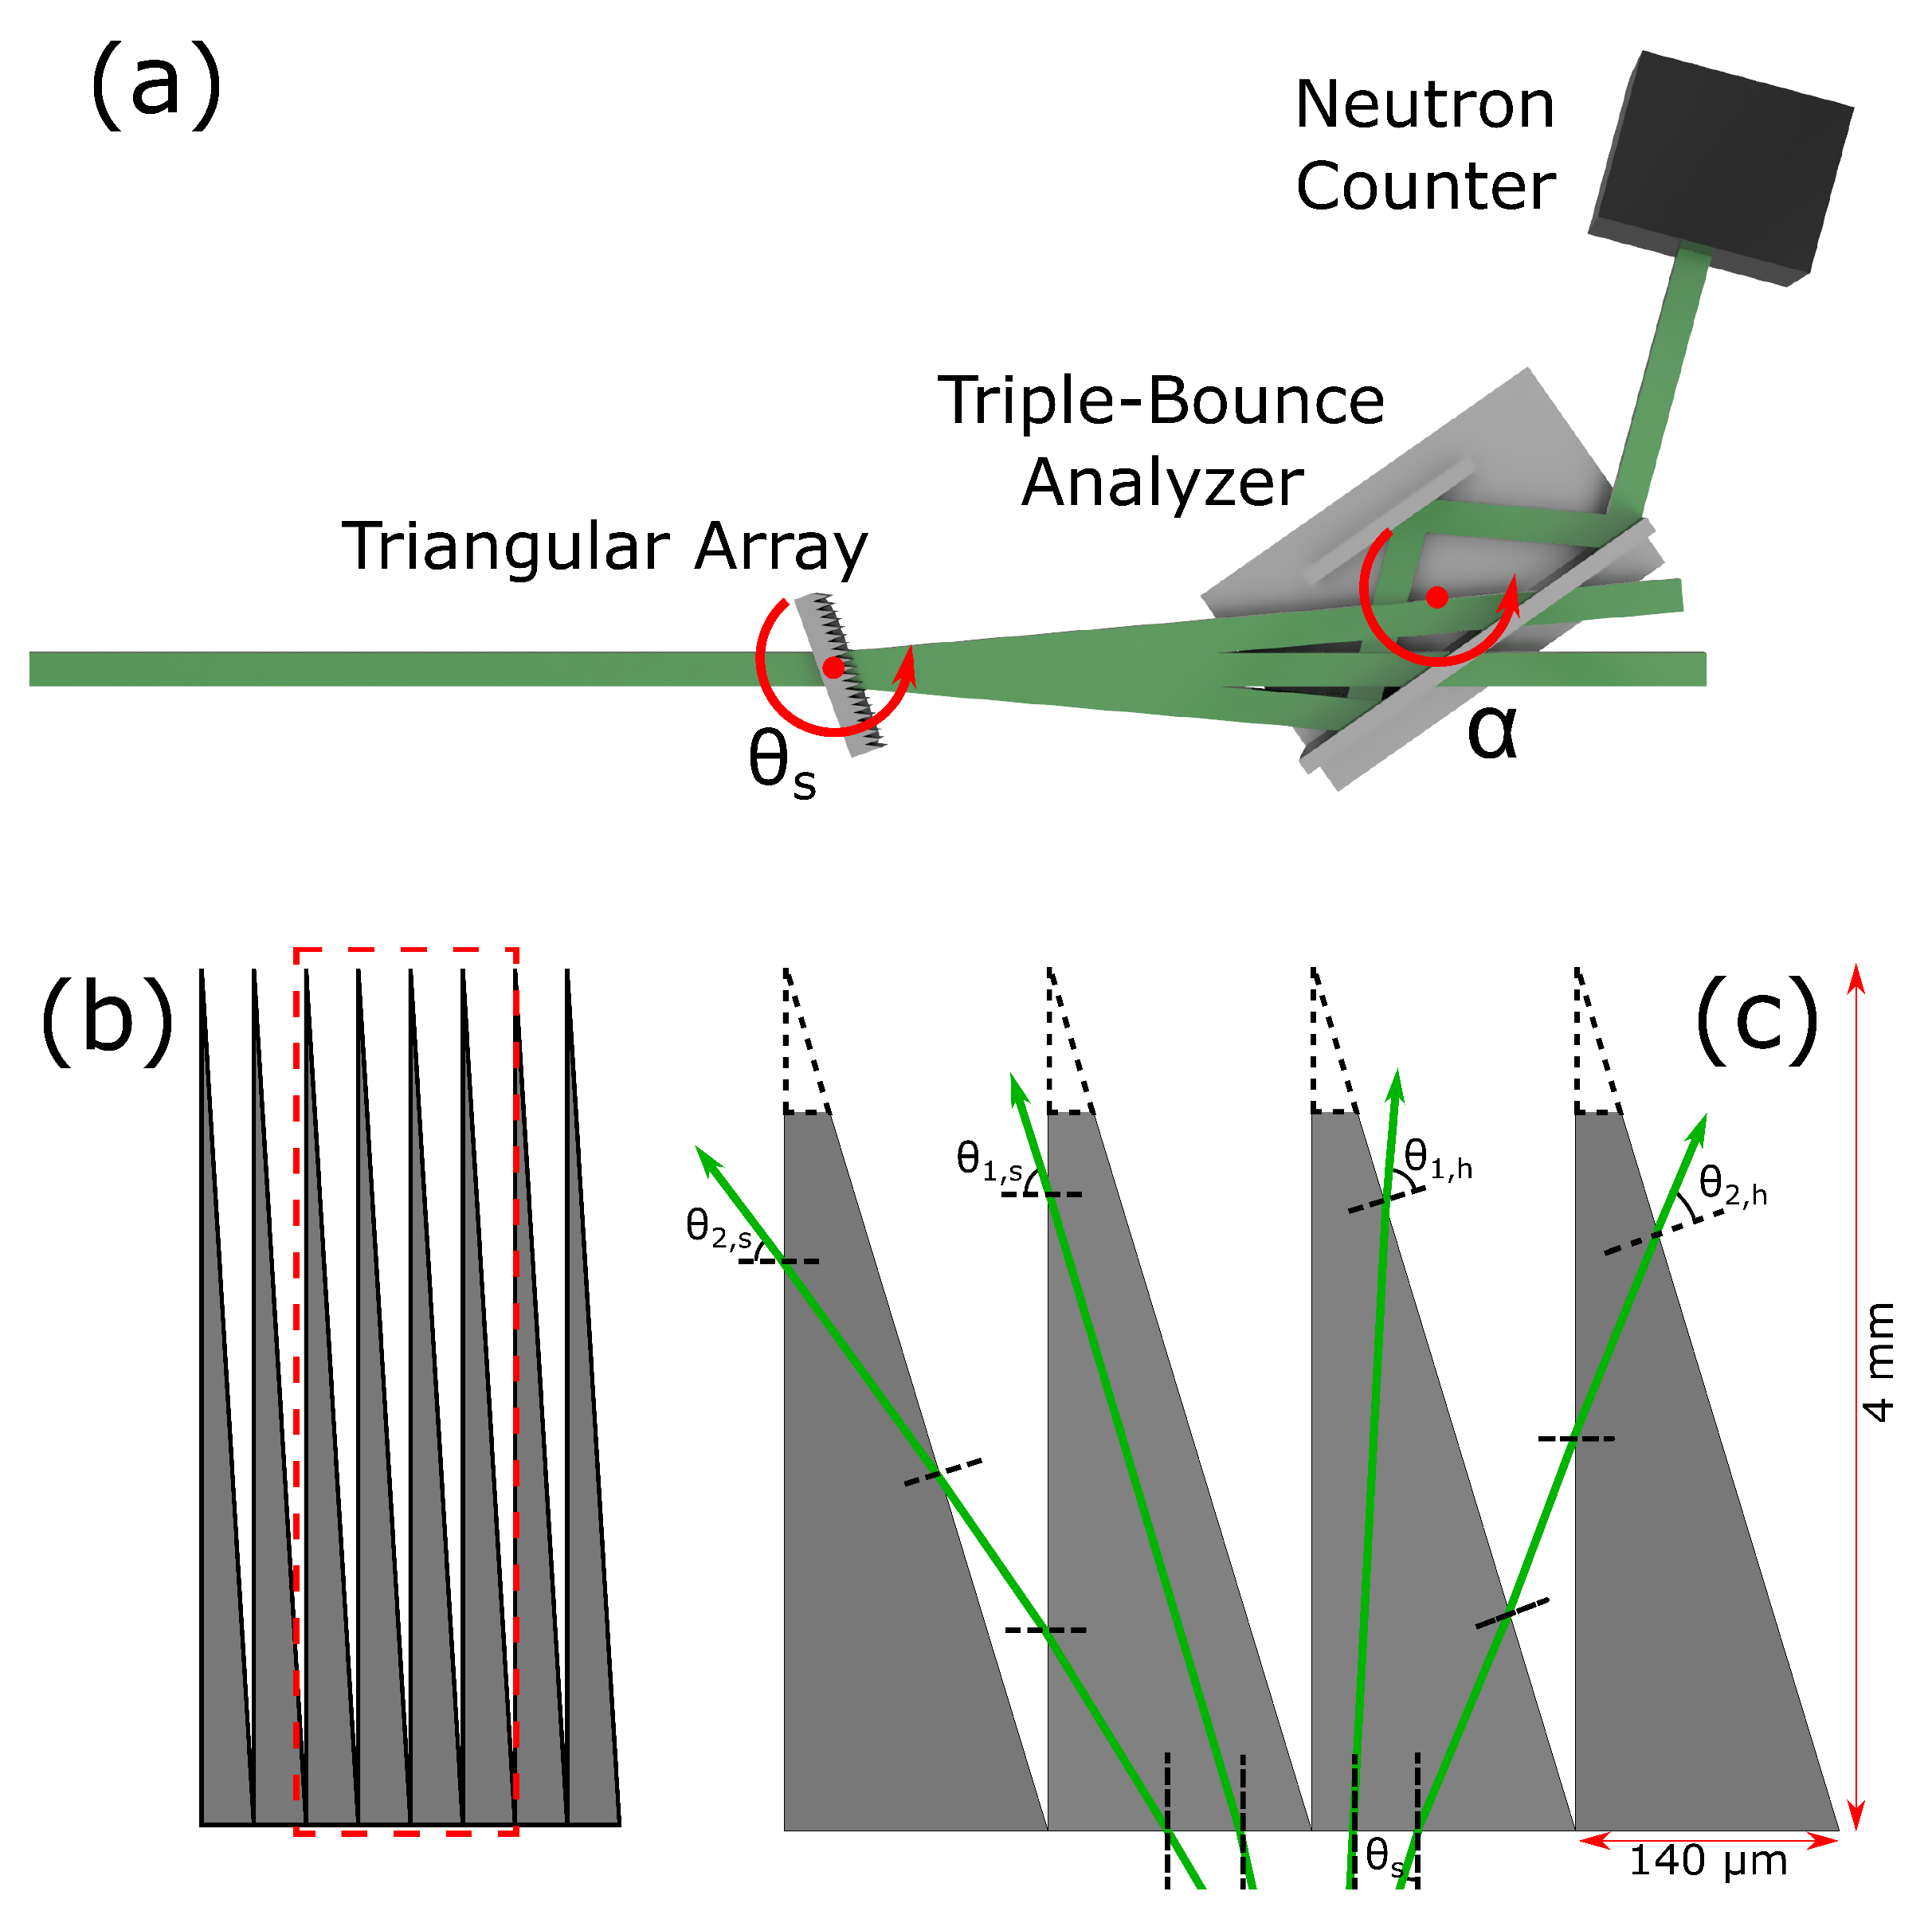
The refractive characteristics of the TARP were tested using cold neutrons at the BT-5 USANS instrument located at the NCNR facility [45]. The experimental arrangement is shown in Figure 3a.

2.2. Device Modelling

The neutron ray deflection was calculated by propagating rays across material boundaries using Snell’s Law. Taylor-expanding the resulting equations about n = 1 , we can obtain the well-known approximation for prism deflection [47]. Applying this to each side of the first and second prism that a neutron encounters, we find deflection angles, Δ θ a , i , where the subscript a indicates which prism side a neutron exits, and subscript i denotes the number of prisms a neutron has encountered.
Δ θ h , 1 ( 1 n ) [ tan ( π / 2 β θ ) + tan ( θ ) ] ,
Δ θ s , 1 ( 1 n ) [ tan ( π / 2 θ ) + tan ( θ ) ] ,
Δ θ h , 2 ( 1 n ) [ tan ( β π / 2 θ Δ θ h , 1 ) + tan ( π / 2 + θ + Δ θ h , 1 ) ] ,
Δ θ s , 2 ( 1 n ) [ tan ( π / 2 + θ + Δ θ s , 1 ) + tan ( π / 2 θ Δ θ s , 1 + β ) ] ,
For rays incident at an angle, θ , to a prism of angle β . Imperfections in the prism manufacturing will result in flat prism apices, as shown in Figure 3c, the effect of which can be modelled by applying Snell’s Law directly to neutrons which encounter these flat apex regions.
Using these approximations, we can model the TARP with neutron rays in a Monte Carlo simulation. These rays have a wavelength and initial angle that is drawn from two Gaussian distributions, corresponding to the BT-5 instrument’s wavelength range and the Darwin width of the monochromator, respectively [45]. Neutron rays possess an additional angle, correlated to its wavelength, labelled θ D , caused by a monochromator which functions via the Bragg diffraction. From here, the rays are propagated across each prism boundary, with Snell’s Law dictating the angular deflection. Prisms in this model have flat prism apices, as opposed to perfectly sharp peaks. This effect can be seen in Figure 3c, where the outline of a perfect prism apex is shown with a dotted line. The flat apex of these prisms models the effect of buckling at the thinnest region of the prisms. Neutrons may also encounter adjacent prisms after exiting the first prism. The resulting beam deviation is then the difference between the final propagation angle of each ray and the incident ray angle. As the analyzing crystal also operates via Bragg diffraction, the angle θ D is subtracted from the final angle of each ray. This procedure is repeated at each sample angle with the Gaussian distribution of initial ray angles shifted by the sample angle.

3. Results

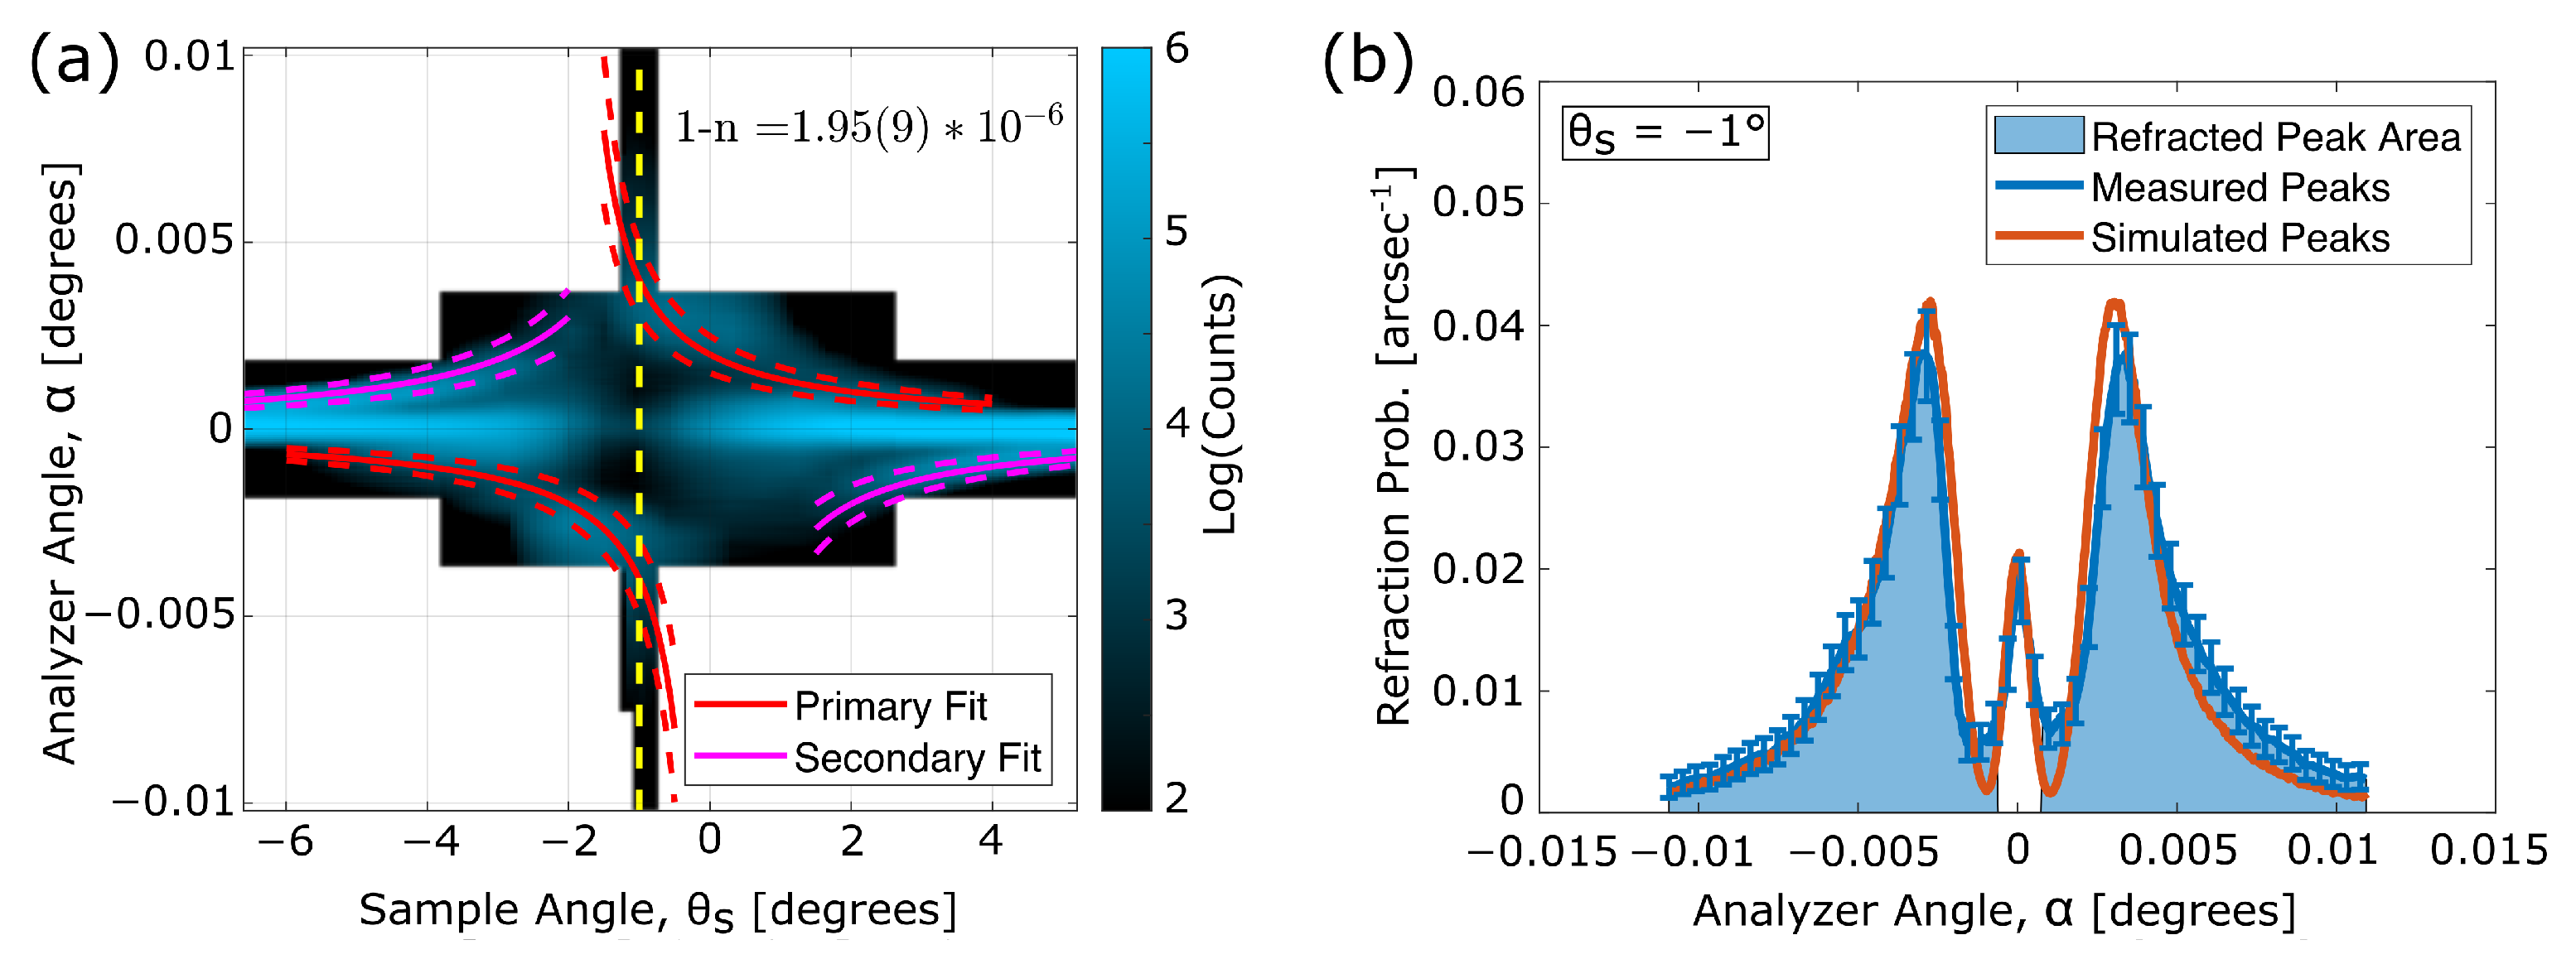
At the BT-5 instrument, three sets of USANS data were taken, each consisting of a series of rocking curves at different ranges and step sizes of both sample and analyzer angles. In total, 46 sample angle positions were measured with 213 analyzer angles. These three datasets were then combined by linearly interpolating the lower resolution scans such that all three datasets had resolutions of ( 1 · 10 4 ) in the analyzer angle and 0.1 in the sample angle. With equal resolutions, these three datasets can then be combined by averaging regions where multiple datasets overlap, producing the density plot shown in Figure 4a. In order to extract meaningful values from a fit of the approximate deviation in Equations (1) to (4), the sample angle axis of the experimental data must be aligned with θ s = 0 , as defined by the device. This can be achieved by comparing experimental plots of a constant sample angle, θ s , to the simulation. At θ = 1 for β = 2 , the primary scattering peaks are of equal magnitude and this feature can be used to align the sample. The comparison of simulation to the experiment shown in Figure 4b allows us to specify this point in the experiment as θ s = 1 ± 0.12 . Furthermore, the Lorentzian-like tails of the scattered peaks arise due to misalignment of individual prisms in the TARP, as well as variance in the neutron wavelength and incident angle at the device. The effective wavelength distribution and divergence angle of the instrument, including apertures used in the experiment, can be measured by fitting the peak shape at θ s = 1 , assuming a Gaussian distribution for both values. This results in a wavelength range of 2.38   Å ± 0.05   Å and initial ray angle of ± ( 0.38 · 10 3 ) . The central peak seen in experimental data can be modelled by accounting for neutrons which exit a prism through the flat apex shown in Figure 3c. Using a least-squares fit, the average prism apex width was w a p e x = 15.0   μ m ± 0.5   μ m .
Figure 4a shows a false-colour representation of the neutron intensity from the single-pixel detector at each sample angle, θ s , and Bragg analyzer angle, α . From the data, a central peak along α = 0 can be seen at each sample angle, with two roughly symmetric peaks diverging toward either positive or negative analyzer angles, α . Four peaks can be observed in total, with the two primary peaks nearest to θ s = 1 arising due to refraction from a single prism, while the secondary peaks arise from neutron rays that exit the initial prism and refract within the adjacent prism.
Agreement between theory and experiment can be demonstrated by comparing the theoretical material index of refraction to the value obtained by fitting Equations (1) to (4) with a free parameter ( 1 n ) . The data were fit as shown in Figure 4a, and the resulting material index value is n = 1 ( 1.95 ± 0.09 ) · 10 6 , which is within 95 % confidence agreement with the expected value of 1 n = 1.93 · 10 6 for the aluminum alloy used in these prisms.
The simulated beam deviation is shown overlaying the experimental data in Figure 4b. From this, we can see qualitative agreement between the simulated prisms and our experiment using the theoretical material index. The undeviated central peak seen in the USANS measurement is accounted for by a prism with a flat apex 15   μ m in width. We can define the relative efficiency of this manufactured TARP as the ratio between the expected beam deviation area for an ideal TARP (shaded area in Figure 4b) and the total area of the measured refraction peak. Therefore, we find that at θ s = 1 our device has a relative efficiency of η 1 = 93.2 % . Two other sample angles of interest are when θ s = β , which has η 2 = 71.5 % , and when the sample is perpendicular to the beam, η 0 = 62.9 % .

4. Discussion

We have designed and fabricated a neutron optical device which utilizes an array of high-aspect ratio micro-prisms to deviate a neutron beam with high efficiency. The TARP has been modelled with Snell’s Law and experimental data have been fit to measure material index of refraction, which agrees with the accepted value for aluminum 5052-O. The fabrication methods described here can be applied to a refractive prism neutron interferometer or to construct a Fresnel lens with micro-prisms. To compare the TARP with current state-of-the-art neutron optical devices, we plot a quality-factor, similar to the figure-of-merit in the Ref. [48], which will quantify the total beam deviation normalized to the attenuation caused by each neutron prism design.
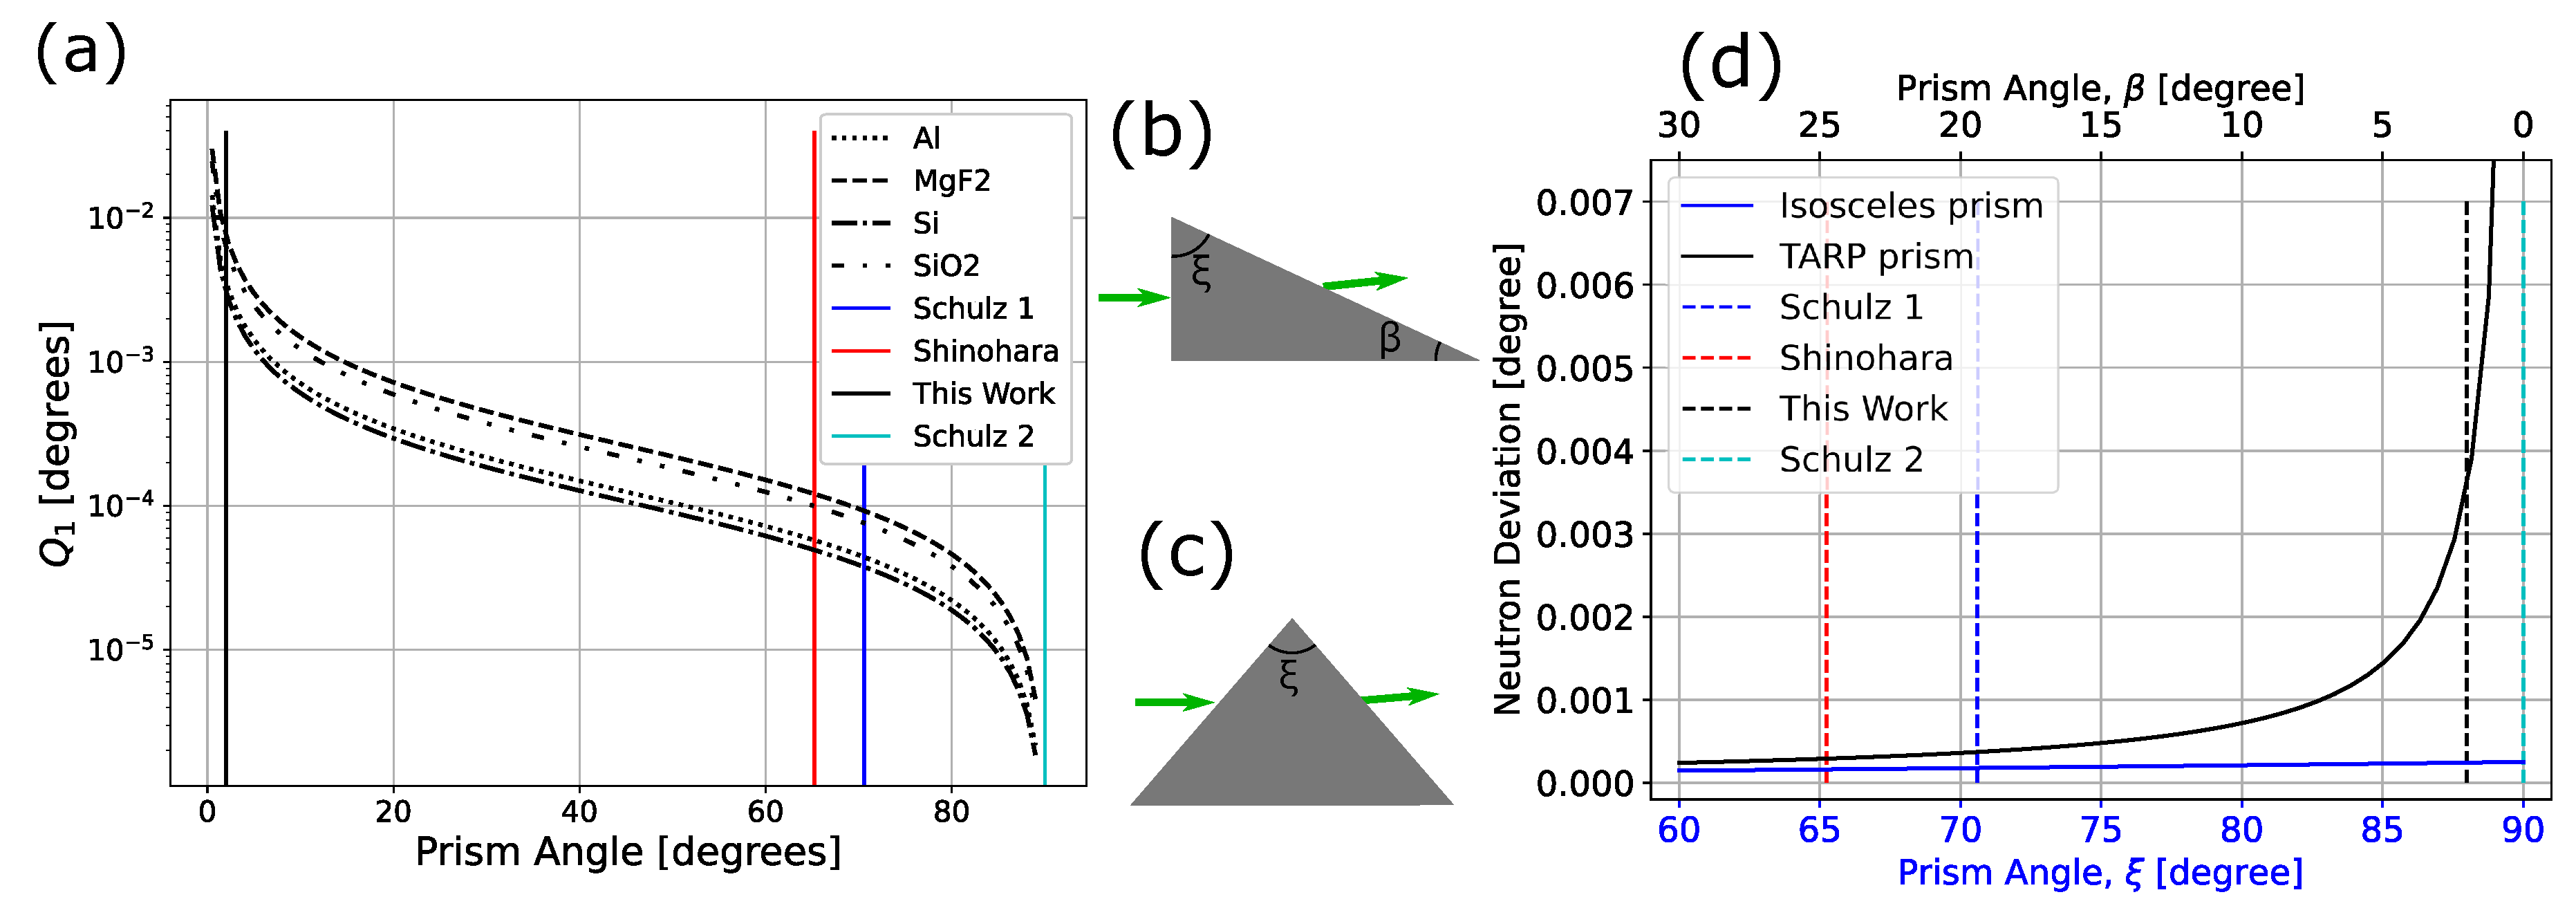
There are two obvious methods of combining the beam deviation, Δ θ , and transmission fraction, T, first these two values can be multiplied, Q 1 = Δ θ · T , and the second by dividing beam deviation by the absorption fraction, Q 2 = Δ θ 1 T . We will calculate beam attenuation using the penetration depth, δ , and the average length of material a neutron propagates through, t, thus, T = e t / δ . Assuming a constant prism base width, w, for every design, the average thickness a neutron penetrates will be given by t = w 2 tan β . Figure 5a illustrates the significant increase in prism quality-factor, Q 1 , as the prism angle decreases. Different materials are considered, and plotted as red lines of different styles (i.e., dotted, dashed). Prism angles utilized in other neutron prism experiments are shown in solid vertical lines, with the TARP shown in black. The prisms of the Ref. [49] are shown in red, and both prisms described in the Ref. [48] are shown in dark and light blue.
Our analysis thus far has considered neutrons incident to the base of a prism as in the TARP design, but there is a second case that is of interest. To describe the deviation of a neutron in the first case, as shown in Figure 5b, we can use Equation (1) to estimate a beam deviation,
Δ θ 1 1 n β ,
where the prism angle, β is again in radians. For the second case, consider a neutron incident to the side of an isosceles prism as shown in Figure 5c, where the neutron deviation is given by
Δ θ 2 2 ( 1 n ) tan ξ 2 ,
where the prism angle, ξ is in radians.
Equation (5) describes a neutron deflected by a prism in the same orientation as the TARP, therefore the prism angle, β 1 . Equation (6) applies to neutron prisms similar in design to the Refs. [48,49], and therefore has a ξ 90 . Plotted in Figure 5d is a comparison of the neutron deviation from these designs, both as a function of prism angle, ξ , as labelled in Figure 5b,c. This plot clearly shows the significantly increased neutron deviation which can be achieved using a TARP design with small prism angles.
The beam fraction deviated by the triangular array, seen in Figure 4c, indicates that this device can effectively deviate 93.2 % of the transmitted beam intensity. This demonstrates a significant increase in efficiency compared to previous neutron optical devices, such as the CRL device, whose absorption and scattering from manganese alone reduces the neutron beam down to 84.7 % transmission.
The beam deviation offered by the TARP can be used to construct a neutron interferometer. Early experiments in neutron interferometry made use of refractive prisms to coherently separate 4.4   Å neutrons by 60   μ m over a 10   m flight path [34]. Utilizing the TARP examined in this work, a separation of 870   μ m is achievable with the 2.38   Å neutrons used to test the sample, implying that a separation of 3   m m is realizable with 4.4   Å neutrons over 10   m . While the coherence properties of beams refracted by the TARP have not been studied, a neutron interferometer with a beam separation of 60   μ m could be achieved with a beam-line of less than 1   m using two TARP devices similar to what was shown here.
The fabrication methods described here can also be applied to construct a Fresnel lens of micro-prisms to achieve shorter focal lengths than what is currently accessible through neutron lenses, with an intensity gain significantly larger than existing lenses. The reduction in material thickness also significantly lowers neutron losses due to absorption and scattering, while also allowing the possibility of working with expensive materials such as Nickel isotopes or magnetic materials.

Author Contributions

Conceptualization, D.P., D.G.C. and I.T.; formal analysis, C.K., B.H. and D.P.; investigation, C.K., M.E.H., D.P., M.B. and M.G.H.; data curation, C.K.; writing—original draft preparation, C.K.; writing—review and editing, C.K., D.S., M.B., D.G.C., B.H., M.G.H., I.T. and D.P.; supervision, D.P. All authors have read and agreed to the published version of the manuscript.

Funding

This work was supported by the Canadian Excellence Research Chairs (CERC) program, the Natural Sciences and Engineering Research Council of Canada (NSERC) Discovery program, and the Collaborative Research and Training Experience (CREATE) program, the Canada First Research Excellence Fund (CFREF). Access to BT5 USANS Instrument was provided by the Center for High Resolution Neutron Scattering, a partnership between the National Institute of Standards and Technology and the National Science Foundation under Agreement No. DMR-1508249. We acknowledge the support of the National Institute of Standards and Technology, U.S. Department of Commerce, in providing the neutron research facilities used in this work and US Department of Energy, Office of Nuclear Physics, under Interagency Agreement 89243019SSC000025.

Data Availability Statement

Data available in a publicly accessible repository that does not issue DOIs. This data is available upon request or can be found here from the NCNR public data storage site: [charlotte.ncnr.nist.gov]. Data accessed on 1 November 2018.

Conflicts of Interest

The authors declare no conflict of interest.

Sample Availability

Data available upon request.

Abbreviations

The following abbreviations are used in this manuscript:
SANSSmall angle neutron scattering
CRLCompound refractive lens
TARPTriangular array refractive prism
USANSUltra-small angle neutron scattering
ODOuter diameter
IDInner diameter
RaRoughness average

References

  1. Werner, H.R.S. Neutron Interferometry: Lessons in Experimental Quantum Mechanics. Meas. Sci. Technol. 2001, 12, 355. [Google Scholar] [CrossRef]
  2. Cronin, A.D.; Schmiedmayer, J.; Pritchard, D.E. Optics and interferometry with atoms and molecules. Rev. Mod. Phys. 2009, 81, 1051–1129. [Google Scholar] [CrossRef]
  3. Eskildsen, M.R.; Gammel, P.L.; Isaacs, E.D.; Detlefs, C.; Mortensen, K.; Bishop, D.J. Compound refractive optics for the imaging and focusing of low-energy neutrons. Nature 1998, 391, 563–566. [Google Scholar] [CrossRef]
  4. Beguiristain, H.R.; Anderson, I.S.; Dewhurst, C.D.; Piestrup, M.A.; Cremer, J.T.; Pantell, R.H. A simple neutron microscope using a compound refractive lens. Appl. Phys. Lett. 2002, 81, 4290–4292. [Google Scholar] [CrossRef]
  5. Gary, C.K. Compound Refractive Lenses for Thermal Neutron Applications; Technical Report; Chicago Operations Office: Argonne, IL, USA, 2013. [Google Scholar] [CrossRef] [Green Version]
  6. Oku, T.; Shimizu, H.M. Neutron lens and prism. Phys. Condens. Matter 2000, 283, 314–317. [Google Scholar] [CrossRef]
  7. Oku, T.; Iwase, H.; Shinohara, T.; Yamada, S.; Hirota, K.; Koizumi, S.; Suzuki, J.I.; Hashimoto, T.; Shimizu, H.M. A focusing-geometry small-angle neutron scattering instrument with a magnetic neutron lens. Appl. Crystallogr. 2007, 40, s408–s413. [Google Scholar] [CrossRef]
  8. Shimizu, H.M.; Suda, Y.; Oku, T.; Nakagawa, H.; Kato, H.; Kamiyama, T.; Otani, C.; Sato, H.; Wakabayashi, T.; Kiyanagi, Y. Measurement of cold neutron-beam focusing effect of a permanent sextupole magnet. Nucl. Instrum. Methods Phys. Res. Sect. Accel. Spectrom. Detect. Assoc. Equip. 1999, 430, 423–434. [Google Scholar] [CrossRef]
  9. Shimizu, H.M.; Kato, H.; Oku, T.; Suda, Y.; Ogawa, Y.; Iwasa, H.; Kamiyama, T.; Kiyanagi, Y.; Wakabayashi, T. Cold neutron beam control using magnetic field gradient. Phys. Condens. Matter 1997, 241–243, 172–174. [Google Scholar] [CrossRef]
  10. Shimizu, H.M.; Oku, T.; Sato, H.; Otani, C.; Kato, H.; Suda, Y.; Nakagawa, H.; Kamiyama, T.; Kiyanagi, Y.; Wakabayashi, T. Magnetic neutron lens. Phys. Condens. Matter 2000, 276–278, 63–64. [Google Scholar] [CrossRef]
  11. Shimizu, H.M. Development of neutron optical devices. Appl. Phys. Mater. Sci. Process. 2002, 74, 123–129. [Google Scholar] [CrossRef]
  12. Cremer, J.T., Jr.; Filter, H.; Klepp, J.; Geltenbort, P.; Dewhurst, C.; Oda, T.; Pantell, R.H. Focusing and imaging of cold neutrons with a permanent magnetic lens. Rev. Sci. Instrum. 2020, 91, 013704. [Google Scholar] [CrossRef] [PubMed]
  13. Littrell, K.C.; Te Velthuis, S.G.; Felcher, G.P.; Park, S.; Kirby, B.J.; Fitzsimmons, M.R. Magnetic compound refractive lens for focusing and polarizing cold neutron beams. Rev. Sci. Instrum. 2007, 78, 035101. [Google Scholar] [CrossRef] [PubMed]
  14. Arzumanov, S.S.; Govor, L.I.; Morozov, V.I.; Panin, Y.N.; Strepetov, A.N. A convergent neutron lens based on glass capillaries. Instrum. Exp. Tech. 2016, 59, 650–652. [Google Scholar] [CrossRef]
  15. Kumakhov, M.A.; Sharov, V.A. A neutron lens. Nature 1992, 357, 390–391. [Google Scholar] [CrossRef]
  16. Wu, H.; Khaykovich, B.; Wang, X.; Hussey, D.S. Wolter Mirrors for Neutron Imaging. In Proceedings of the Physics Procedia, Cochin, India, 22–24 August 2017; Elsevier: Amsterdam, The Netherlands, 2017; Volume 88, pp. 184–189. [Google Scholar] [CrossRef]
  17. Oku, T.; Morita, S.; Moriyasu, S.; Yamagata, Y.; Ohmori, H.; Takizawa, Y.; Shimizu, H.M.; Hirota, T.; Kiyanagi, Y.; Ino, T.; et al. Development of a Fresnel lens for cold neutrons based on neutron refractive optics. Nucl. Instrum. Methods Phys. Res. Sect. Accel. Spectrom. Detect. Assoc. Equip. 2001, 462, 435–441. [Google Scholar] [CrossRef]
  18. Sarenac, D.; Nsofini, J.; Hincks, I.; Arif, M.; Clark, C.W.; Cory, D.; Huber, M.; Pushin, D. Methods for preparation and detection of neutron spin-orbit states. New J. Phys. 2018, 20, 103012. [Google Scholar] [CrossRef] [PubMed]
  19. Nsofini, J.; Sarenac, D.; Wood, C.J.; Cory, D.G.; Arif, M.; Clark, C.W.; Huber, M.G.; Pushin, D.A. Spin-orbit states of neutron wave packets. Phys. Rev. 2016, 94, 013605. [Google Scholar] [CrossRef] [Green Version]
  20. Sarenac, D.; Kapahi, C.; Chen, W.; Clark, C.W.; Cory, D.G.; Huber, M.G.; Taminiau, I.; Zhernenkov, K.; Pushin, D.A. Generation and detection of spin-orbit coupled neutron beams. Proc. Natl. Acad. Sci. USA 2019, 116, 20328–20332. [Google Scholar] [CrossRef] [Green Version]
  21. Sarenac, D.; Henderson, M.E.; Ekinci, H.; Clark, C.W.; Cory, D.G.; DeBeer-Schmitt, L.; Huber, M.G.; Kapahi, C.; Pushin, D.A. Experimental realization of neutron helical waves. Sci. Adv. 2022, 8, eadd2002. [Google Scholar] [CrossRef]
  22. Kardjilov, N.; Manke, I.; Strobl, M.; Hilger, A.; Treimer, W.; Meissner, M.; Krist, T.; Banhart, J. Three-dimensional imaging of magnetic fields with polarized neutrons. Nat. Phys. 2008, 4, 399–403. [Google Scholar] [CrossRef] [Green Version]
  23. Jericha, E.; Szeywerth, R.; Leeb, H.; Badurek, G. Reconstruction techniques for tensorial neutron tomography. Phys. Condens. Matter 2007, 397, 159–161. [Google Scholar] [CrossRef]
  24. Kageyama, M.; Tasaki, S.; Hino, M.; Ebisawa, T.; Yamazaki, D.; Hayashida, H.; Abe, Y. Development of neutron spin phase contrast imaging. Phys. Condens. Matter 2009, 404, 2615–2619. [Google Scholar] [CrossRef]
  25. Pushin, D.A.; Huber, M.G.; Arif, M.; Shahi, C.B.; Nsofini, J.; Wood, C.J.; Sarenac, D.; Cory, D.G. Neutron Interferometry at the National Institute of Standards and Technology. Adv. High Energy Phys. 2015, 2015, 1–7. [Google Scholar] [CrossRef] [Green Version]
  26. Sarenac, D.; Huber, M.G.; Heacock, B.; Arif, M.; Clark, C.W.; Cory, D.G.; Shahi, C.B.; Pushin, D.A. Holography with a neutron interferometer. Opt. Express 2016, 24, 22528. [Google Scholar] [CrossRef] [Green Version]
  27. Lemmel, H.; Brax, P.; Ivanov, A.N.; Jenke, T.; Pignol, G.; Pitschmann, M.; Potocar, T.; Wellenzohn, M.; Zawisky, M.; Abele, H. Neutron interferometry constrains dark energy chameleon fields. Phys. Lett. Sect. Nucl. Elem. Part. High-Energy Phys. 2015, 743, 310–314. [Google Scholar] [CrossRef]
  28. Hasegawa, Y.; Loidl, R.; Badurek, G.; Baron, M.; Rauch, H. Violation of a Bell-like inequality in single-neutron interferometry. Nature 2003, 425, 45–48. [Google Scholar] [CrossRef]
  29. Bartosik, H.; Klepp, J.; Schmitzer, C.; Sponar, S.; Cabello, A.; Rauch, H.; Hasegawa, Y. Experimental test of quantum contextuality in neutron interferometry. Phys. Rev. Lett. 2009, 103, 040403. [Google Scholar] [CrossRef] [PubMed]
  30. Sarenac, D.; Pushin, D.A.; Huber, M.G.; Hussey, D.S.; Miao, H.; Arif, M.; Cory, D.G.; Cronin, A.D.; Heacock, B.; Jacobson, D.L.; et al. Three Phase-Grating Moiré Neutron Interferometer for Large Interferometer Area Applications. Phys. Rev. Lett. 2018, 120, 113201. [Google Scholar] [CrossRef] [PubMed] [Green Version]
  31. Pushin, D.A.; Sarenac, D.; Hussey, D.S.; Miao, H.; Arif, M.; Cory, D.G.; Huber, M.G.; Jacobson, D.L.; LaManna, J.M.; Parker, J.D.; et al. Far-field interference of a neutron white beam and the applications to noninvasive phase-contrast imaging. Phys. Rev. 2017, 95, 043637. [Google Scholar] [CrossRef] [Green Version]
  32. Heacock, B.; Sarenac, D.; Cory, D.G.; Huber, M.G.; Hussey, D.S.; Kapahi, C.; Miao, H.; Wen, H.; Pushin, D.A. Angular alignment and fidelity of neutron phase-gratings for improved interferometer fringe visibility. AIP Adv. 2019, 9, 085115. [Google Scholar] [CrossRef] [Green Version]
  33. Pfeiffer, F.; Grünzweig, C.; Bunk, O.; Frei, G.; Lehmann, E.; David, C. Neutron phase imaging and tomography. Phys. Rev. Lett. 2006, 96, 215505. [Google Scholar] [CrossRef] [PubMed] [Green Version]
  34. Maier-Leibnitz, H.; Springer, T. Ein interferometer für langsame neutronen. Z. Phys. 1962, 167, 386–402. [Google Scholar] [CrossRef]
  35. Rauch, H.; Treimer, W.; Bonse, U. Test of a single crystal neutron interferometer. Phys. Lett. 1974, 47, 369–371. [Google Scholar] [CrossRef]
  36. Rauch, H.; Zeilinger, A.; Badurek, G.; Wilfing, A.; Bauspiess, W.; Bonse, U. Verification of coherent spinor rotation of fermions. Phys. Lett. 1975, 54, 425–427. [Google Scholar] [CrossRef]
  37. Werner, S.; Kaiser, H.; Arif, M.; Clothier, R. Neutron interference induced by gravity: New results and interpretations. Phys. B C 1988, 151, 22–35. [Google Scholar] [CrossRef]
  38. Clark, C.W.; Barankov, R.; Huber, M.G.; Arif, M.; Cory, D.G.; Pushin, D.A. Controlling neutron orbital angular momentum. Nature 2015, 525, 504–506. [Google Scholar] [CrossRef]
  39. Li, K.; Arif, M.; Cory, D.G.; Haun, R.; Heacock, B.; Huber, M.G.; Nsofini, J.; Pushin, D.A.; Saggu, P.; Sarenac, D.; et al. Neutron limit on the strongly-coupled chameleon field. Phys. Rev. 2016, 93, 062001. [Google Scholar] [CrossRef] [Green Version]
  40. Denkmayr, T.; Geppert, H.; Sponar, S.; Lemmel, H.; Matzkin, A.; Tollaksen, J.; Hasegawa, Y. Observation of a quantum Cheshire Cat in a matter-wave interferometer experiment. Nat. Commun. 2014, 5, 1–7. [Google Scholar] [CrossRef] [PubMed] [Green Version]
  41. Arif, M.; Brown, D.E.; Greene, G.L.; Clothier, R.; Littrell, K. Multistage position-stabilized vibration isolation system for neutron interferometry. In Proceedings of the Vibration Monitoring and Control. International Society for Optics and Photonics, San Diego, CA, USA, 28–29 July 1994; Volume 2264, pp. 20–26. [Google Scholar]
  42. Saggu, P.; Mineeva, T.; Arif, M.; Cory, D.G.; Haun, R.; Heacock, B.; Huber, M.G.; Li, K.; Nsofini, J.; Sarenac, D.; et al. Decoupling of a neutron interferometer from temperature gradients. Rev. Sci. Instrum. 2016, 87, 123507. [Google Scholar] [CrossRef] [Green Version]
  43. Shahi, C.; Arif, M.; Cory, D.; Mineeva, T.; Nsofini, J.; Sarenac, D.; Williams, C.; Huber, M.; Pushin, D. A new polarized neutron interferometry facility at the NCNR. Nucl. Instrum. Methods Phys. Res. Sect. Accel. Spectrom. Detect. Assoc. Equip. 2016, 813, 111–122. [Google Scholar] [CrossRef] [Green Version]
  44. Zawisky, M.; Springer, J.; Farthofer, R.; Kuetgens, U. A large-area perfect crystal neutron interferometer optimized for coherent beam-deflection experiments: Preparation and performance. Nucl. Instrum. Methods Phys. Res. Sect. Accel. Spectrom. Detect. Assoc. Equip. 2010, 612, 338–344. [Google Scholar] [CrossRef]
  45. Barker, J.G.; Glinka, C.J.; Moyer, J.J.; Kim, M.H.; Drews, A.R.; Agamalian, M. Design and performance of a thermal-neutron double-crystal diffractometer for USANS at NIST. J. Appl. Crystallogr. 2005, 38, 1004–1011. [Google Scholar] [CrossRef]
  46. Certain trade names and company products are mentioned in the text or identified in an illustration in order to adequately specify the experimental procedure and equipment used. In no case does such identification imply recommendation or endorsement by the National Institute of Standards and Technology, nor does it imply that the products are necessarily the best available for the purpose.
  47. Wagh, A.G.; Rakhecha, V.C. Geometric formula for prism deflection. Pramana 2004, 63, 381–385. [Google Scholar] [CrossRef]
  48. Schulz, J.; Ott, F.; Hülsen, C.; Krist, T. Neutron energy analysis by silicon prisms. Nucl. Instrum. Methods Phys. Res. Sect. Accel. Spectrom. Detect. Assoc. Equip. 2013, 729, 334–337. [Google Scholar] [CrossRef] [Green Version]
  49. Shinohara, T.; Hirota, K.; Adachi, T.; Ikeda, K.; Shimizu, H.M.; Suzuki, J.I.; Oku, T. Thermal neutron refraction by material prism. Phys. Condens. Matter 2006, 385, 1232–1235. [Google Scholar] [CrossRef]
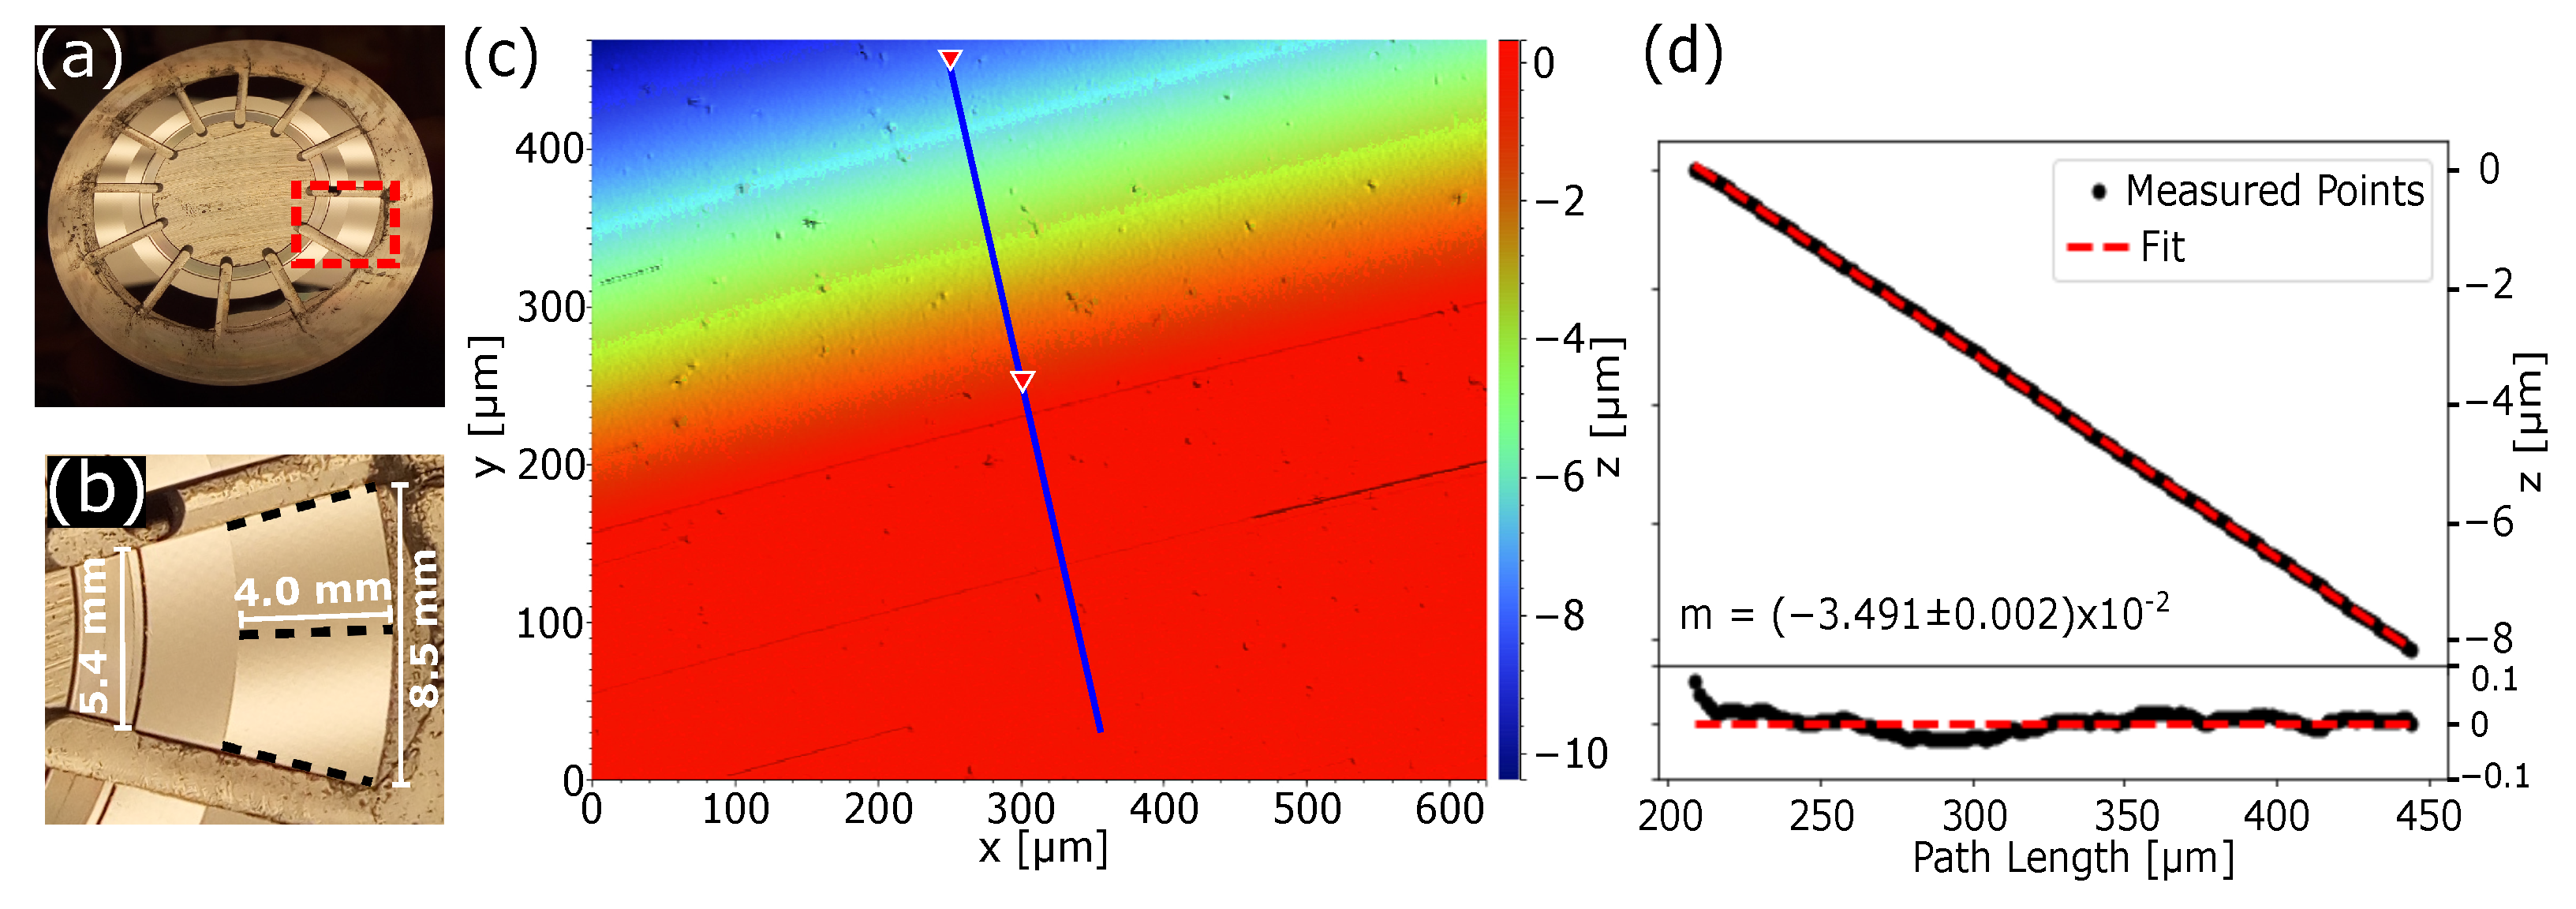
Figure 1. (a) Micro-prisms before assembly into the TARP. Here, the angled faces of each prism can be seen tapering radially, and each prism has been segmented into equal pieces. These pieces are then assembled with the non-angled section at the base of each prism. A single prism element, expanded in (d), is shown within a red box. (b) Enlarged image of a single prism segment whose angled surfaces, indicated with black dashed lines, are machined to 2 . Labels indicate prism base width, peak width, and prism height. Note that these width dimensions are the cord length of segmented rings which form the base and apex of the prism. (c) White light interferometry data showing the machined surface of the prism segment. Density plot colour shows surface height, where the flat base of the prisms is shown in red and the sloped face can be seen with varying colours. Surface imperfections can be observed which correspond to a surface finish of 20 nm roughness average (Ra). Points along the blue line were sampled to measure the angle of this surface. (d) These points show an angle of 1 . 999 ± 0 . 001 . This angle matches the designed surface angle of 2 . The residual plot shown below indicates that within this region, the surface form is straight to within ± 0.1   μ m .
Qubs 07 00010 g001
Figure 2. (a) Microscope image of assembled TARP device with peak locations labelled with red dots. Peaks are detected along each vertical slice of pixels. Peak locations along a single horizontal prism are fit to a line which is then used to determine prism spacing and alignment. (b) The y-intercepts of each linear fit from (a) are plotted and fit to a line. The slope of this line corresponds to the average spacing of the prism peaks. The y-intercept of this line indicates the position of the first prism peak relative to the top of the camera and therefore is not shown in this plot. (c) Histogram of the slope of fit lines from (a). This shows that prism alignment has a standard deviation of ± 0 . 3 .
Qubs 07 00010 g002
Figure 3. (a) Experimental apparatus used to measure beam deviation from the TARP. Small angle deviations are measured by utilizing a crystal applying Bragg diffraction to select a particular deviation angle caused by the sample. The neutron beam had a wavelength of 2.38   Å ± 0.05   Å , accounting for the reduction in wavelength at the sample due to Bragg refraction off the monochromator and the slit placed before the TARP device. The angles α and θ s correspond to the analyzer angle and sample angles, respectively. (b) Scaled schematic of TARP, where the red dashed box indicates the region which is magnified and shown with an exaggerated scale in (c). The aspect ratio shown here (>14) is correct for the prototype TARP. (c) Schematic of the TARP showing the arrangement and length scale of each prism. The neutron path and corresponding outgoing angle of the four possibilities modelled in Equations (1) to (4) are indicated as green lines. Imperfect prism apices are modelled as flat tops, shown here, with dashed lines indicating the ideal prism apex.
Qubs 07 00010 g003
Figure 4. (a) Ultra-small-angle neutron-scattering (USANS) results from the TARP where a false colour corresponds to the logarithm of counts. Scattering peaks have been fit to a Gaussian to extract the peak maximum. Red and pink lines correspond to first- and second-order theoretical scattering curves, respectively, fit to these peaks. Curves are calculated via Equations (1) to (4), accounting for the BT-5 wavelength distribution, and fit with a free-fit parameter for material index. Dashed lines show the 95 % confidence interval of this fit. This fit returns a material index of n = 1 ( 1.95 ± 0.09 ) · 10 6 . The dashed yellow line indicates a sample angle of θ s = 1 . (b) Comparison of the TARP USANS measurements (blue) with Monte Carlo simulation (red) taken at θ = 1 . The shaded area in blue denotes the region where beam deviation is expected from the simulation of an ideal TARP, with perfect apices. Uncertainty on neutron counts is shown for a subset of analyzer measurement angles. Neutron ray deviations from USANS experiments with the TARP show qualitative agreement with simulations.
Qubs 07 00010 g004
Figure 5. (a) Quality-factor, Q 1 , for a neutron prism, calculated using beam deviation and neutron transmission fraction, Q 1 = Δ θ · T , as a function of prism angle. Here, it is clear that smaller prism angles provide a significant increase in prism quality-factor. Note that this plot is shown in logarithmic y-scale. Different materials are considered, and as black lines of different style (i.e., dotted, dashed). Prism angles utilized in other neutron prism experiments are shown in solid lines, with the TARP shown in black, the prisms of the Ref. [49] shown in red, and both prisms described in the Ref. [48] shown in dark and light blue. (b) Schematic of prism orientation used in the TARP device, with both the prism angle β and complementary angle, ξ , labelled. (c) Schematic of prism orientation used in the Refs. [48,49] with prism angle, ξ , and neutron ray shown as a green arrow. (d) Comparison of neutron deviation from prism orientations shown in (b,c) plotted in blue and black, respectively.
Qubs 07 00010 g005
Disclaimer/Publisher’s Note: The statements, opinions and data contained in all publications are solely those of the individual author(s) and contributor(s) and not of MDPI and/or the editor(s). MDPI and/or the editor(s) disclaim responsibility for any injury to people or property resulting from any ideas, methods, instructions or products referred to in the content.