Review

Applications of Microbeams Produced by Tapered Glass Capillary Optics

RIKEN Nishina Center for Accelerator-Based Science, 2-1 Hirosawa, Wako, Saitama 351-0198, Japan
Quantum Beam Sci. 2020, 4(2), 22; https://doi.org/10.3390/qubs4020022
Submission received: 26 January 2020 / Revised: 15 May 2020 / Accepted: 21 May 2020 / Published: 1 June 2020
(This article belongs to the Special Issue Quantum Beams Applying to Innovative Industrial Materials)

Abstract

:
Production of ion microbeams using tapered glass capillary optics was introduced more than 10 years ago. This technique has drawn attention in terms of both its peculiar transmission features and application to ion beam analysis. The transmission mechanism based on a self-organized charge-up process for keV-energy ions was observed for the first time in an experiment using a multitude of nanometer-sized capillaries in a polymer foil. The same mechanism can be seen for the transmission of keV ions through a single tapered glass capillary. The transmission experiments with keV ions showed a delayed transmission, focusing effects, guiding effects, and formation of microbeams. Experiments using MeV-energy ions always aim at applications of microbeam irradiation for material analysis, surface modification, cell surgery, and so on. In this article, the applications of MeV ion microbeams, including the fabrication method of the glass capillary, are reviewed, as well as the experimental and theoretical studies for the transmission mechanisms of keV/MeV ions.

1. Introduction

When an ion beam accelerated by kV in vacuum enters an inlet of a glass injection needle, a so-called a tapered glass capillary, the ion beam will appear from the outlet with a peculiar delay of tens of seconds. The ion transmission through the capillary can occur even if the capillary axis is not parallel to the input beam direction. The phenomenon was found using an 8 keV Ar8+ beam and tapered glass capillary optics with an outlet of 24 μmϕ, and reported by Ikeda et al. in 2006 [1]. It was astonishing not only because of the delayed transmission, but the beam focusing, the beam bending by up to 5°, and a possibility to produce micrometer-sized beams easily. The experiment was designed based on the knowledge from two previous reports: the transmission of a 3 keV Ne7+ beam through a multitude of capillaries of 100 nmϕ fabricated in a 10 μm-thick polymer foil reported by Stolterfoht et al. in 2002 [2], and the transmission of a 2 MeV He+ beam through a tapered glass capillary whose outlet size and length were 0.8 μmϕ and ~50 mm, respectively, reported by Nebiki et al. in 2003 [3]. The experiment with 3 keV Ne7+ demonstrated the delayed transmission and beam bending, called beam guiding, while the experiment with 2 MeV He+ introduced the beam focusing and the method to produce microbeams with ease. The aforementioned transmission of an 8 keV Ar8+ beam through a tapered glass capillary retained the advantages from both experiments. Since then, the transmission of ions accelerated by kV through insulator capillaries has been intensively investigated experimentally and theoretically to elucidate the transmission mechanism in terms of the interaction of charged particles with an insulator surface.
Tapered glass capillary optics have been used with MeV ion beams to produce microbeams because MeV ions can be extracted into air and are commonly utilized for ion beam analysis. Since the fabrication method of an end window at the outlet of the glass capillary was established to maintain a vacuum inside the capillary [4], living cells cultivated in a liquid solution can be irradiated with an MeV ion microbeam. The range of MeV ions in water is comparable to a cell size of several μm. When the ion energy is modified such that the ion stops inside the cell nucleus, the damage to the DNA in the nucleus is maximized with a large stopping power of the ion, known as the so-called Bragg peak. Moreover, owing to the short distance of a few μm between the capillary outlet and the cell surface, beam broadening by multiple scattering in the liquid is almost negligible.
There have been many reports reviewing the mechanism of ion transmission through capillaries [5,6,7]. This review paper introduces mainly the applications of MeV ion microbeams produced by tapered glass capillary optics. In the next section, the history and the mechanism of the capillary transmission of ions are introduced briefly. The characteristics of the microbeams are described in Section 4, followed by the applications including other quantum beams.

2. Transmission Mechanism of Ion Beams through Insulator Capillaries

This section first describes the types of insulator capillaries. Next, the experiments introduced in the previous section are explained according to the shape of the capillary and the order of magnitude of ion energy.

2.1. Various Capillary Shapes

A number of transmission experiments have employed capillaries with different shapes and materials. The first experiment was performed with a multitude of capillaries fabricated on a foil made of polyethylene terephthalate (PET) [2]. The capillaries on the PET foil in this experiment were created by irradiation with 1 GeV Xe ions followed by chemical etching with NaOH to enhance the diameter of the ion tracks in the foil. The opening ratio over the foil surface was ~4%. The dimension of each capillary was 100 nm in diameter and 10 μm in length, which corresponded to the thickness of the foil. To avoid charge up of the front and back sides of the foil, Au films of ~30 nm thickness were evaporated under 45° on both sides. The experimental results are explained later in this paper. Other experiments employing insulator (PET, SiO2, Al2O3, polycarbonate, and mica) foils with capillaries and theoretical studies are summarized in References [5,6,7]; in particular, many microscopic photos are provided in Reference [5]. For example, Figure 1a is a photo of a PET foil with capillaries whose diameter was 200 nm and density was 4 × 106 cm−2 [8]. Figure 1b is of well-aligned capillaries in a SiO2 membrane with a thickness of 25 μm [9]. The 100 nm diameter capillaries were 1.4 μm apart from each other.
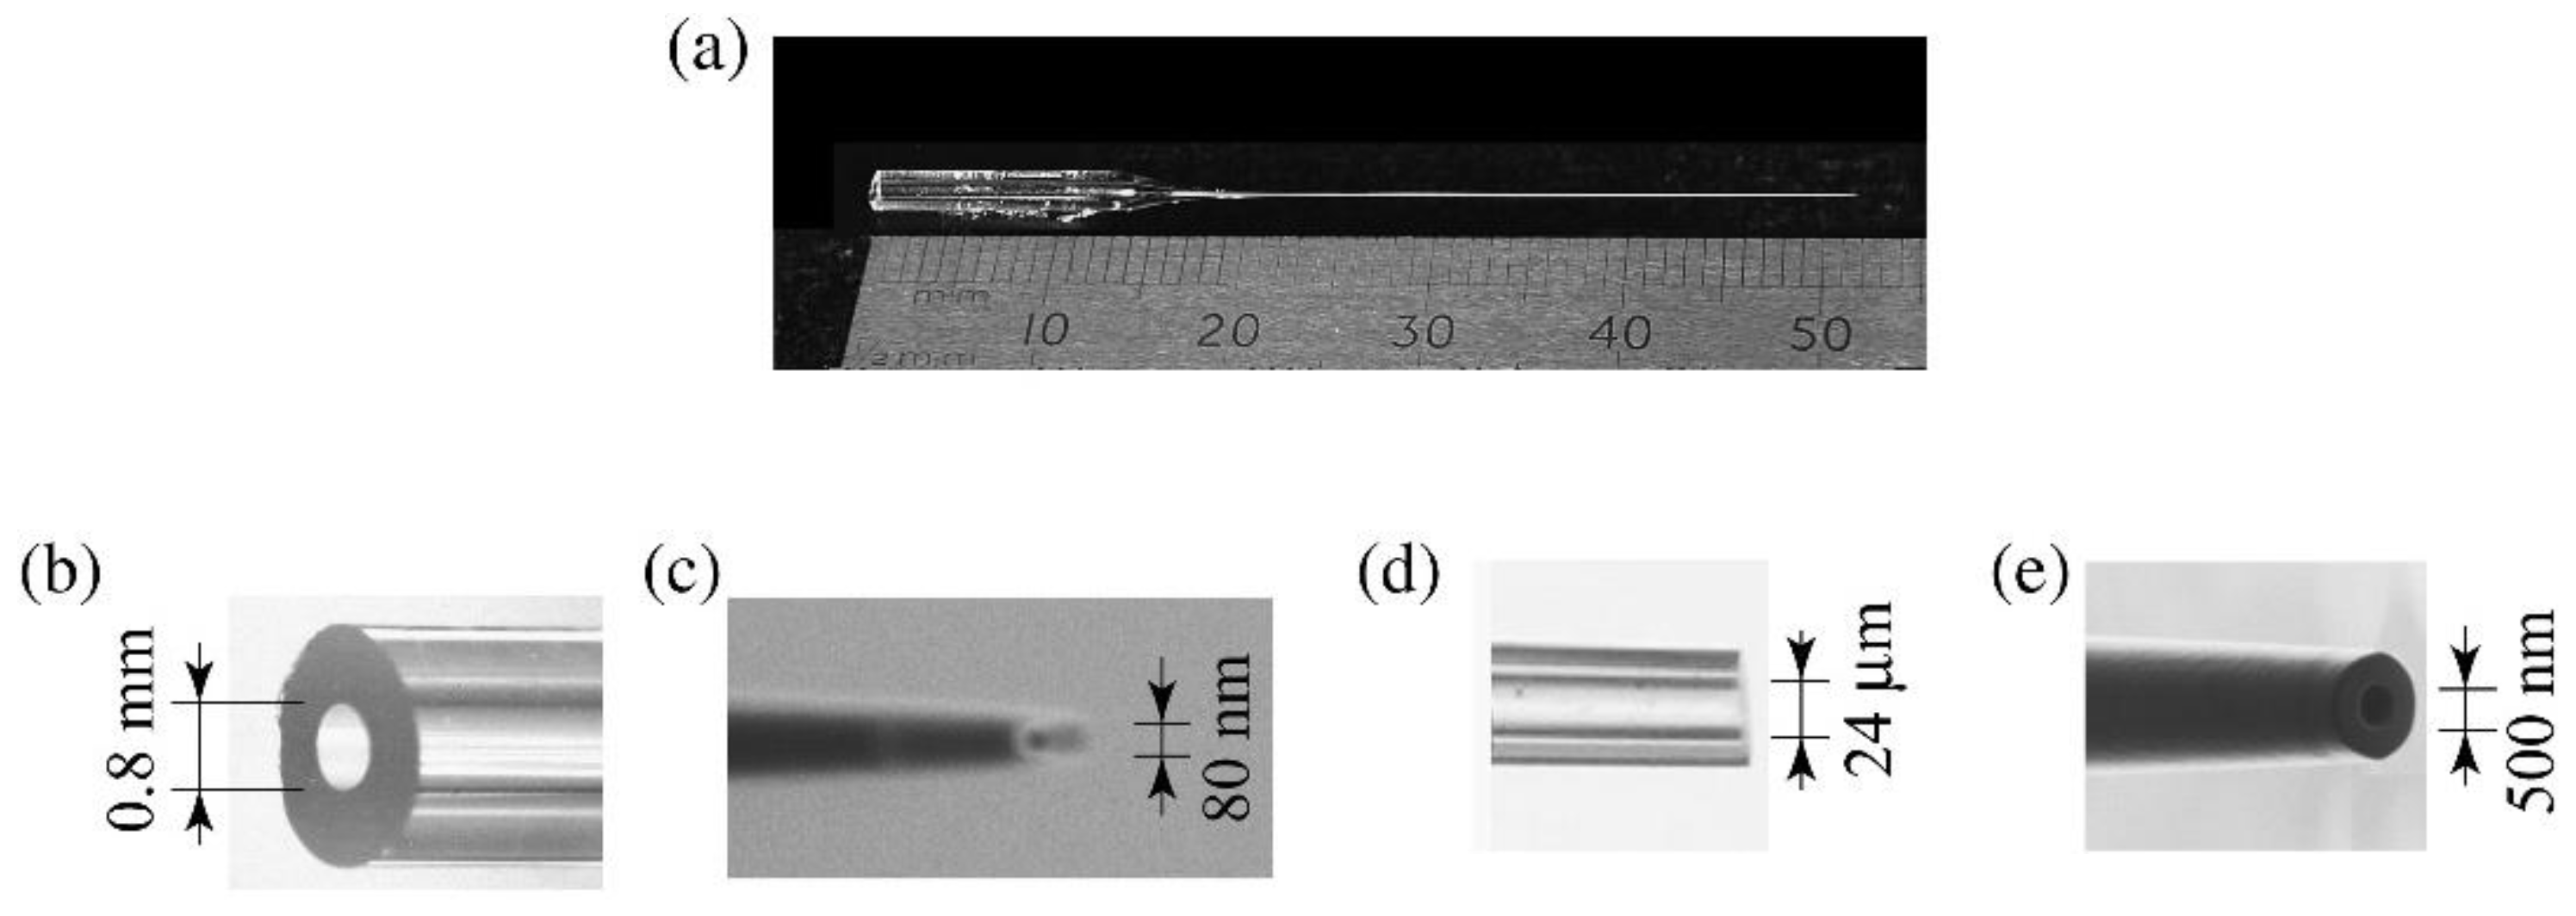
The capillaries for the above studies are called “nanocapillaries” in an insulator foil, while single capillaries with outlet sizes of μm to 1 mm are called “macro-size capillaries” [7]. An example of a tapered glass capillary is shown in Figure 2 [10]. The total length and the inlet diameter were about 50 mm and 0.8 mm, respectively (Figure 2a,b). Although the typical total length is from 50 to 100 mm, a capillary consists of a straight part and a taper part. The straight part is used to support the capillary itself in the setup and its length depends on experiments.
As mentioned in the introduction section, one of the advantages of the single tapered glass capillary is to produce microbeams. Depending on the target size, the outlet diameter can be selected by users. Figure 2c–e are photos of the outlets of the capillaries. Figure 2c shows an outlet in the smallest level of around 100 nmϕ. Figure 2d,e shows the modified outlets by cutting the taper part.
Some pioneering works using these capillaries are listed in Table 1 according to the types of capillary (multitude/single) and quantum beams. Not only ion beams, but the transmission of a visible light laser employing the same type of single tapered glass capillary was also investigated by Jin et al. from Toho University, Japan, to create micron-sized laser spots [11].

2.2. Difference in Transmission Mechanism between keV and MeV Ions

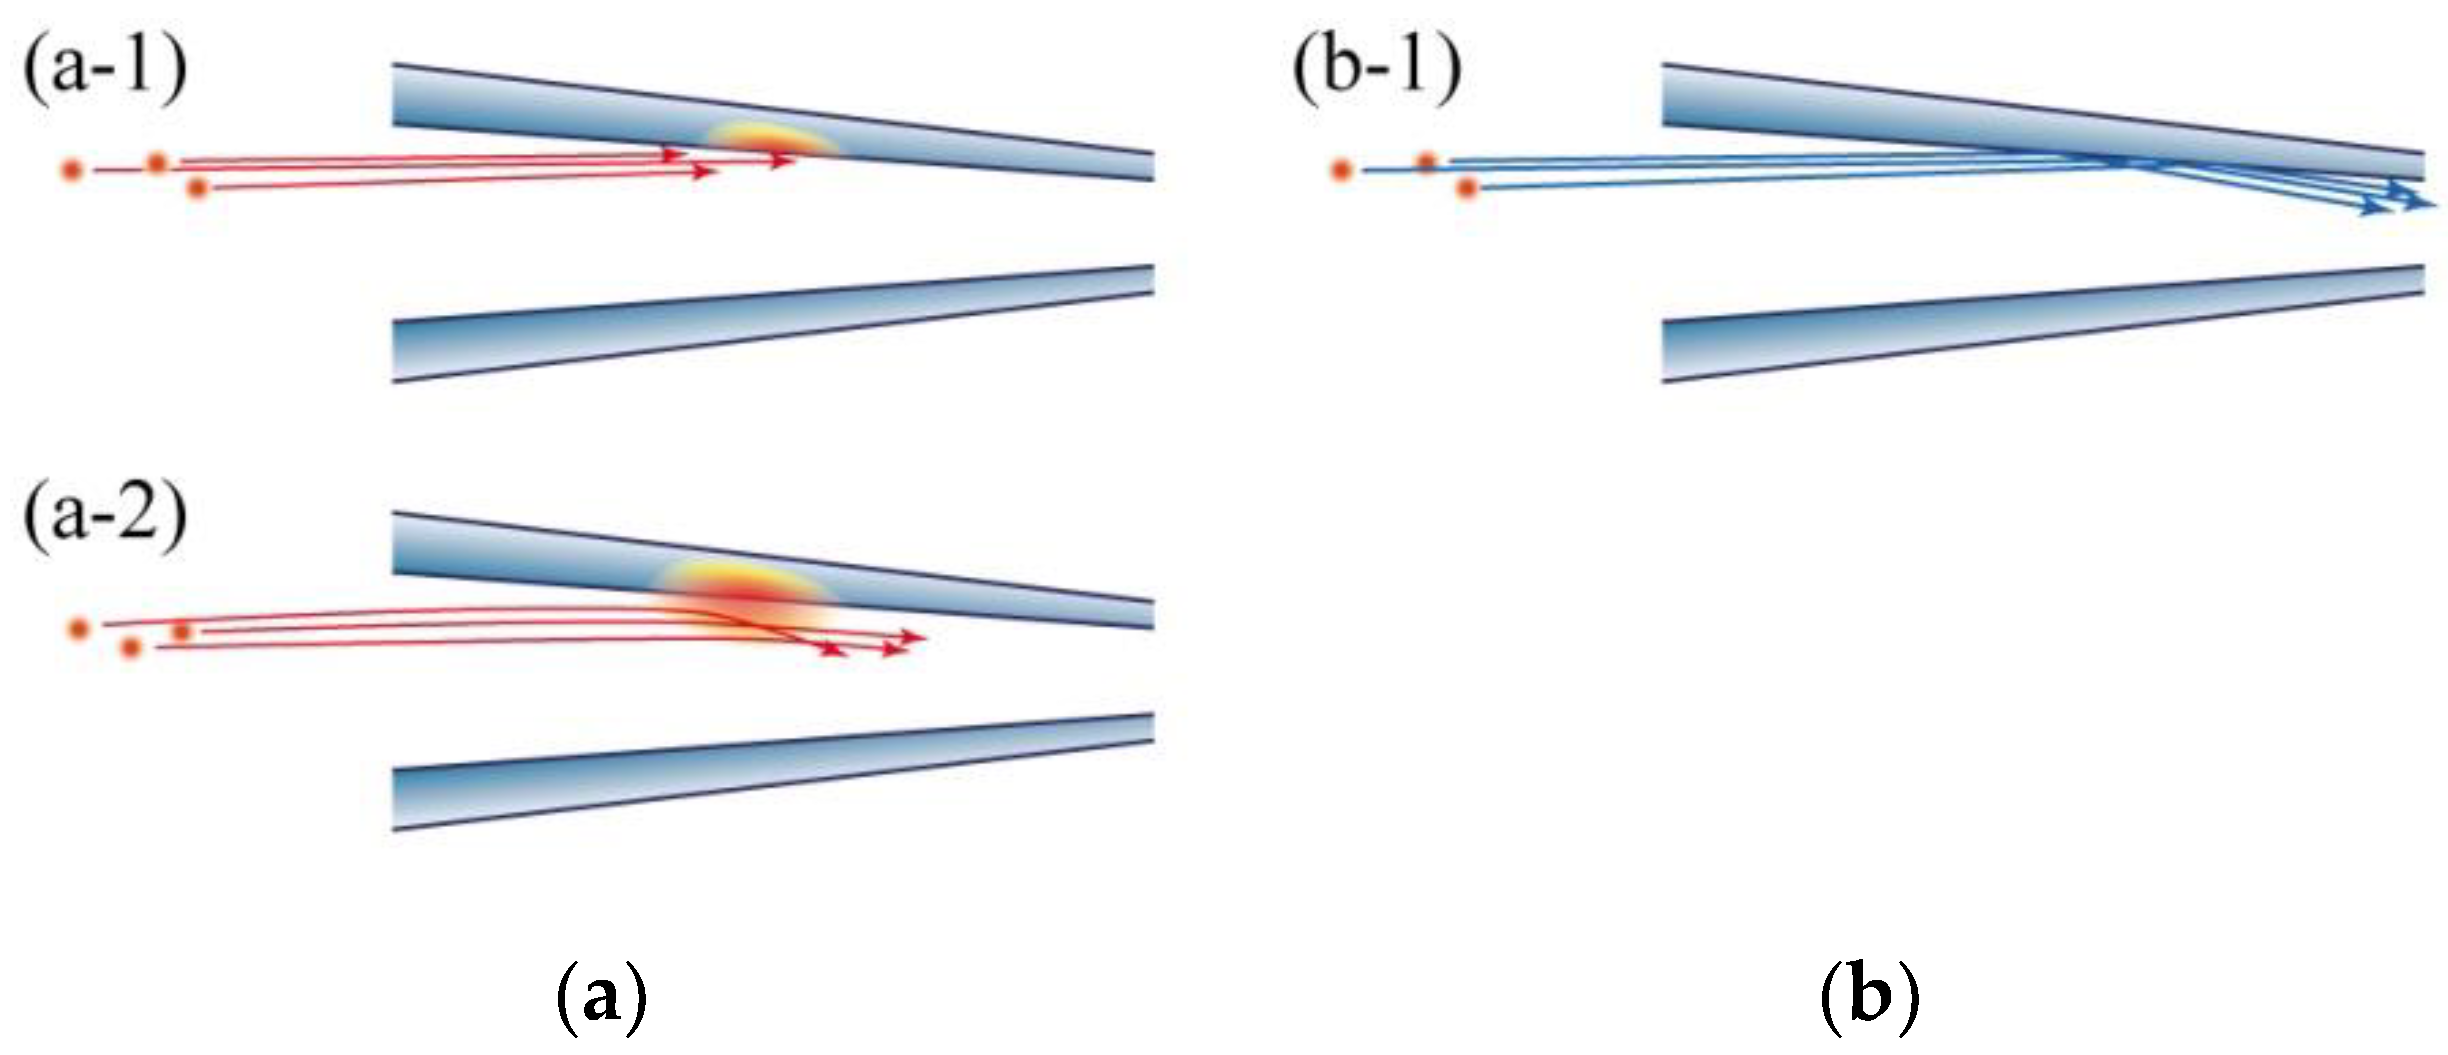
The transmission mechanism should be considered according to the acceleration voltage of the ion beam, not the type of capillary. As listed in Table 1, the ion energy is classified into two parts: kV and MV accelerated (positively charged) ions. Figure 3 explains the mechanism of the ion transmission. The blue tapered channels represent a taper part of the insulator capillary. When positive ions enter a capillary inlet, most of ions touch the inner wall if the capillary inner diameter is small, as shown in Figure 3(a-1). In the case of ions accelerated by kV, any ions touching the wall stop or capture electrons at the hitting points and the points will be positively charged. The charged part, called the “charge patch”, provides a charge-up potential after the repetition of the ion hitting. Finally, the following ions are reflected by the charge patch area when the charge-up potential becomes strong enough as shown in Figure 3(a-2). Even for the multitude of capillaries in an insulator foil, the mechanism is the same. Since the potential is created automatically by the input beam itself as the beam is transmitted through the capillary, the transmission is attributed to a “self-organized charge-up effect.” The lower-charged ions and neutralized atoms caused by the electron capture from the wall continue to travel. The neutralized atoms are not affected by the charge-up potential and possibly exit from the capillary outlet.
The charge-up potential induced by the charge patch is not high enough to reflect MeV energy ions. An MeV energy ion directly interacts (Rutherford scattering) with an atom on the inner surface of the wall as shown in Figure 3(b-1). There is no delay of the transmission because the charge patch formation does not affect the ion approach to the surface. Since the probability to exit from the outlet after scattering is small, the density enhancement of the extracted beam for MeV ions is known to be at most two. The details of the experiments using keV and MeV ions in Table 1 are described in the following.

2.3. The First Report of Delayed Transmission and Beam Guiding

The first transmission experiment with kV accelerated ions employing insulator capillaries [2] at the Ionenstrahl-Labor of the Hahn-Meitner-Institut Berlin demonstrated the delayed transmission and the beam bending. The authors obtained the charge state distribution of the transmitted ions and confirmed that Ne7+ was dominant. After the PET foil was tilted by 10°, a beam of 1.3 nA was directed onto the foil. The transmitted ions were measured by means of an electrostatic analyzer which was positioned in the same direction of the capillary axis of 10°. Figure 4a shows normalized transmission intensity of 3 keV Ne7+ ions through PET capillaries as a function of time. The transmitted ions increased exponentially with a time constant of 2.5 min. The time for transmission intensity to saturate (around 9 min) corresponds to the time to establish an optimized charge patch distribution on the inner surface. A continuous beam was injected for 10 min. The charge in the patches was expected to decrease due to the small leak current through the insulator. Utilizing a short pulsed beam after the continuous beam phase, the time constant of the discharge was measured to be 40 min. The time constants of charge and discharge are significant pieces of information to understand the charge balance to maintain the ion transmission based on the input charge from the beam and the conductivity of the insulator (See Section 4.1).
Figure 4b shows the transmitted beam profiles according to the tilting angles. The transmitted Ne7+ ions were measured when the PET foil was tilted from −20° to +20° with a step of 5°. The solid lines represent Gaussian functions fitted to the data. The distinct peaks near 0° were obtained using capillaries covered with Ag. The transportation of the ions through a tilted capillary is called the “guiding effect”, where the guiding angle should be larger than the divergence of the incoming beam. Although the beam profiles under the tilting conditions show lower intensities, the beam widths are almost the same as that of the no tilting case. The authors suggested that the incoming beam was bent at the inlet region of each capillary, and then transported through the rest part.

2.4. The First Demonstration of an Easy Production Method of a Microbeam

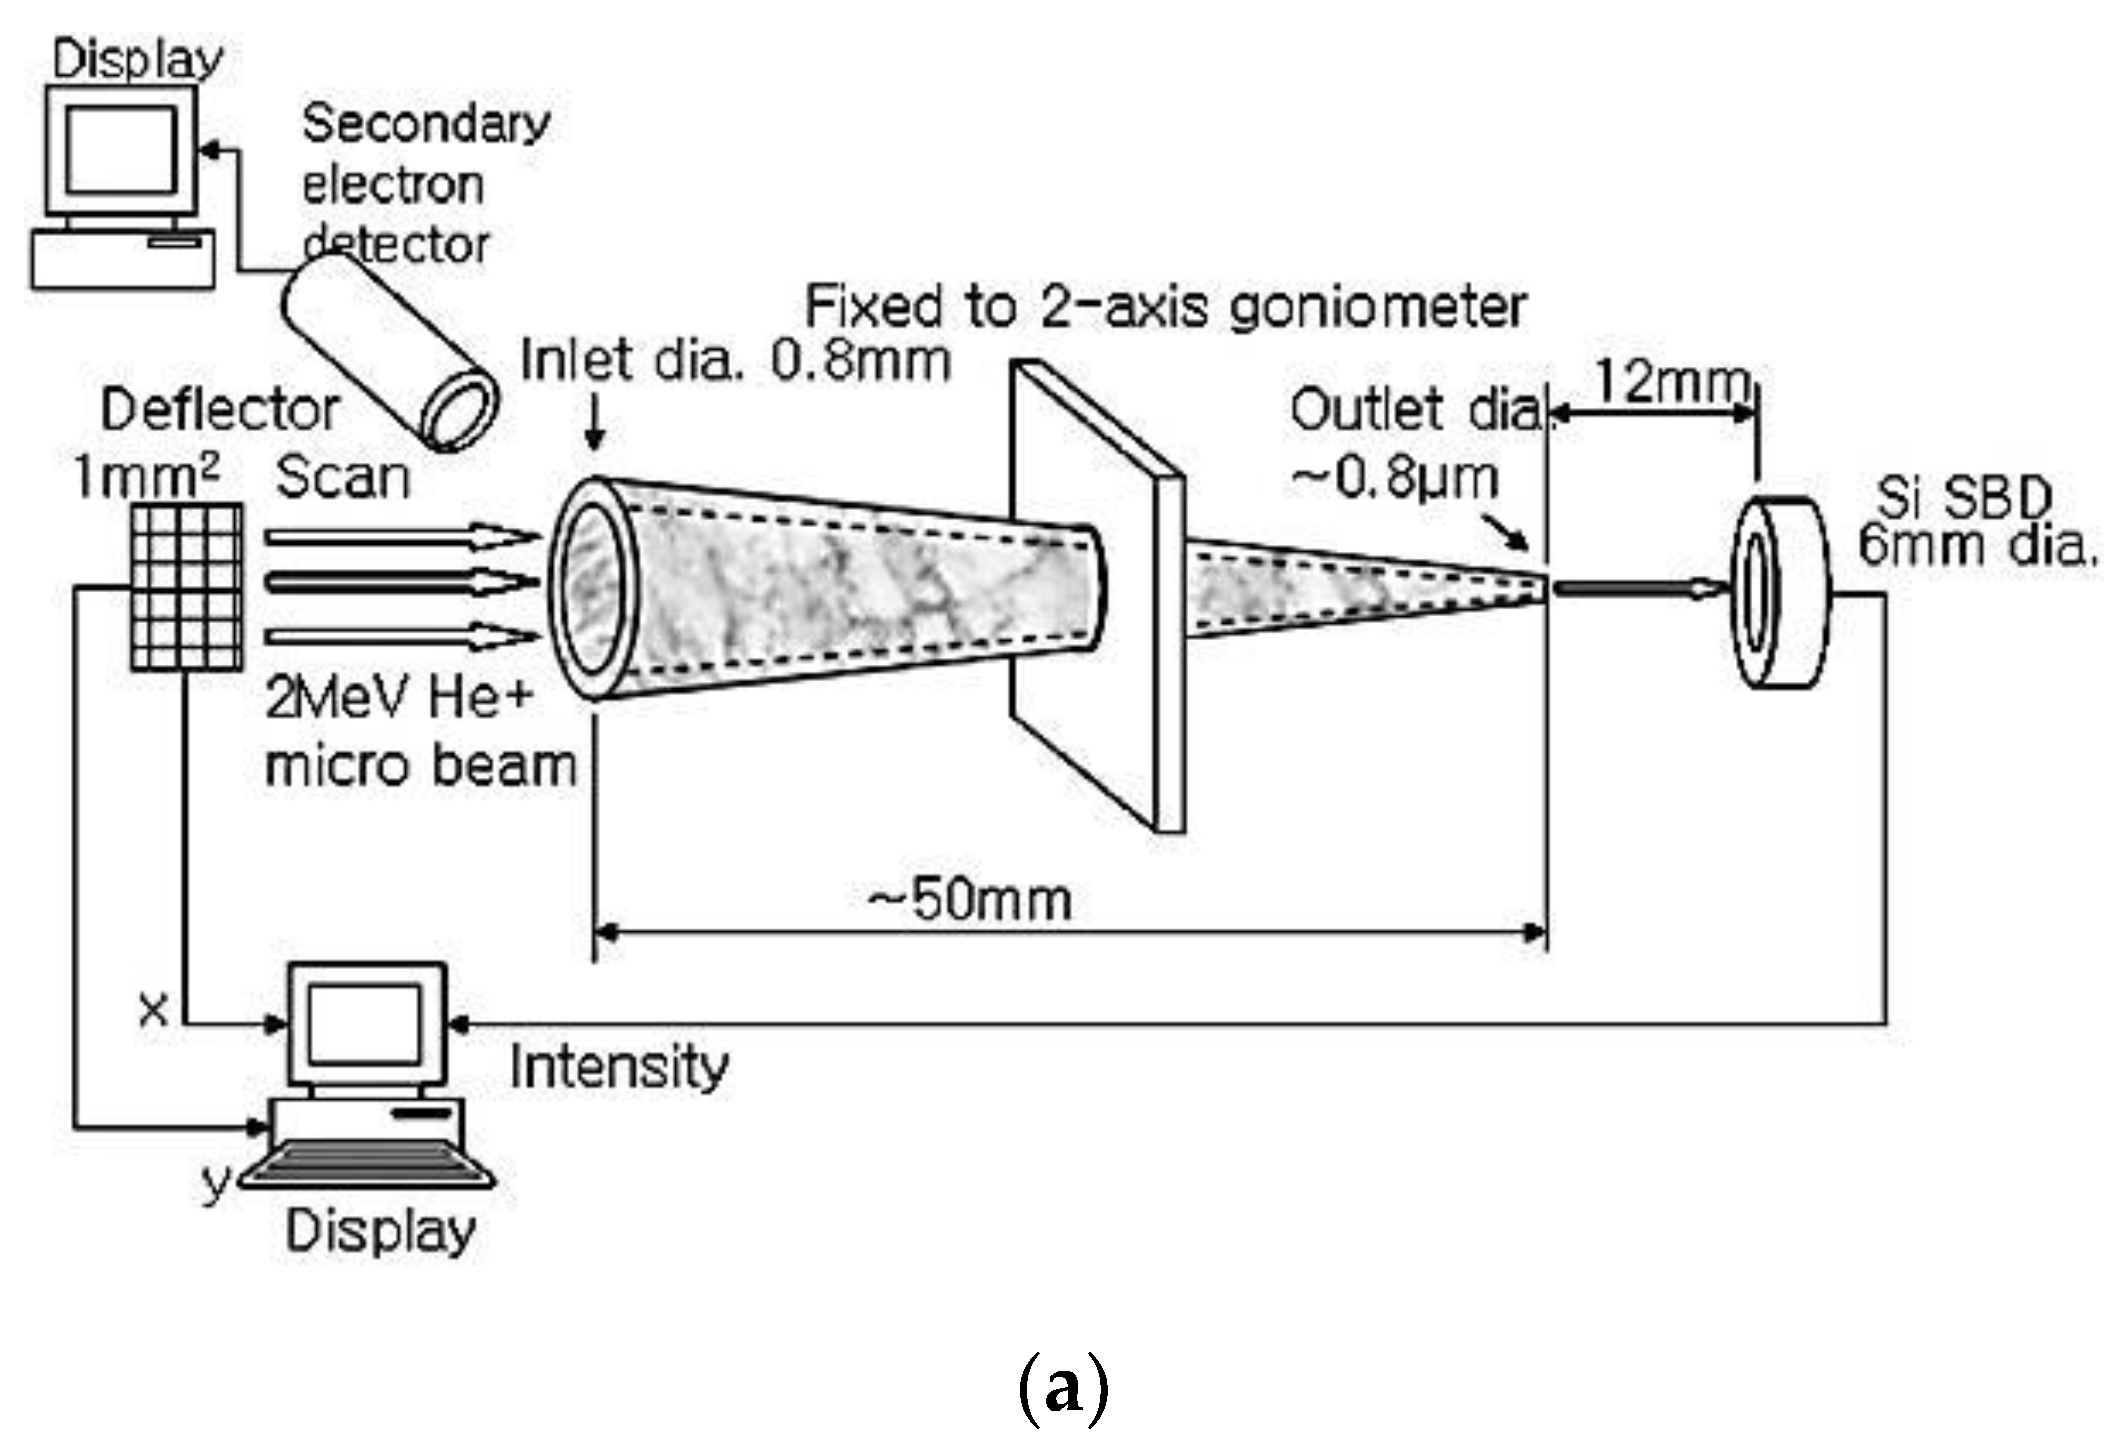
A single tapered glass capillary optic was fabricated to produce an ion microbeam for the first time by the Narusawa group from Kochi University of Technology, Japan [3]. The transmission measurement was performed with an input beam of 2 MeV He+. The authors used a 3 μmϕ microbeam as the input beam to find the best path inside the capillary for giving the maximum transmission rate. The density of the input beam was 7 × 10⁴ ions/s/mm2. The tapered capillary was approximately 50 mm in length and its inlet and outlet diameters were 0.8 mm and 0.8 μm, respectively. Figure 5a explains the measurement system of transmitted ion energy. Figure 5b shows the energy spectrum of the transmitted ions. The strong peak at 2 MeV was obtained and is shown inset with a magnified horizontal scale. The full width at half maximum (FWHM) was approximately 20 keV, which corresponded to the energy resolution of the Si surface barrier detector (SBD). The population in the regions from (a) to (e) is negligibly small, due to the ions scattering on the inner wall or penetrating the capillary glass wall.
As shown in Figure 5a, a microbeam (3 μmϕ) was injected to the capillary inlet (0.8 mmϕ). The position of the microbeam was scanned over the inlet to find the position where the highest transmission of 1.8% was recorded. However, if the input beam is, for example, a 100 μm beam instead of a microbeam, the total transmission is much lower than 1.8%.
This experiment proposed, for the first time, a simple method of beam focusing (See Section 4.2) and generation of microbeam.

2.5. The First Microbeam of keV Ions Produced by Single Tapered Glass Capillary Optics

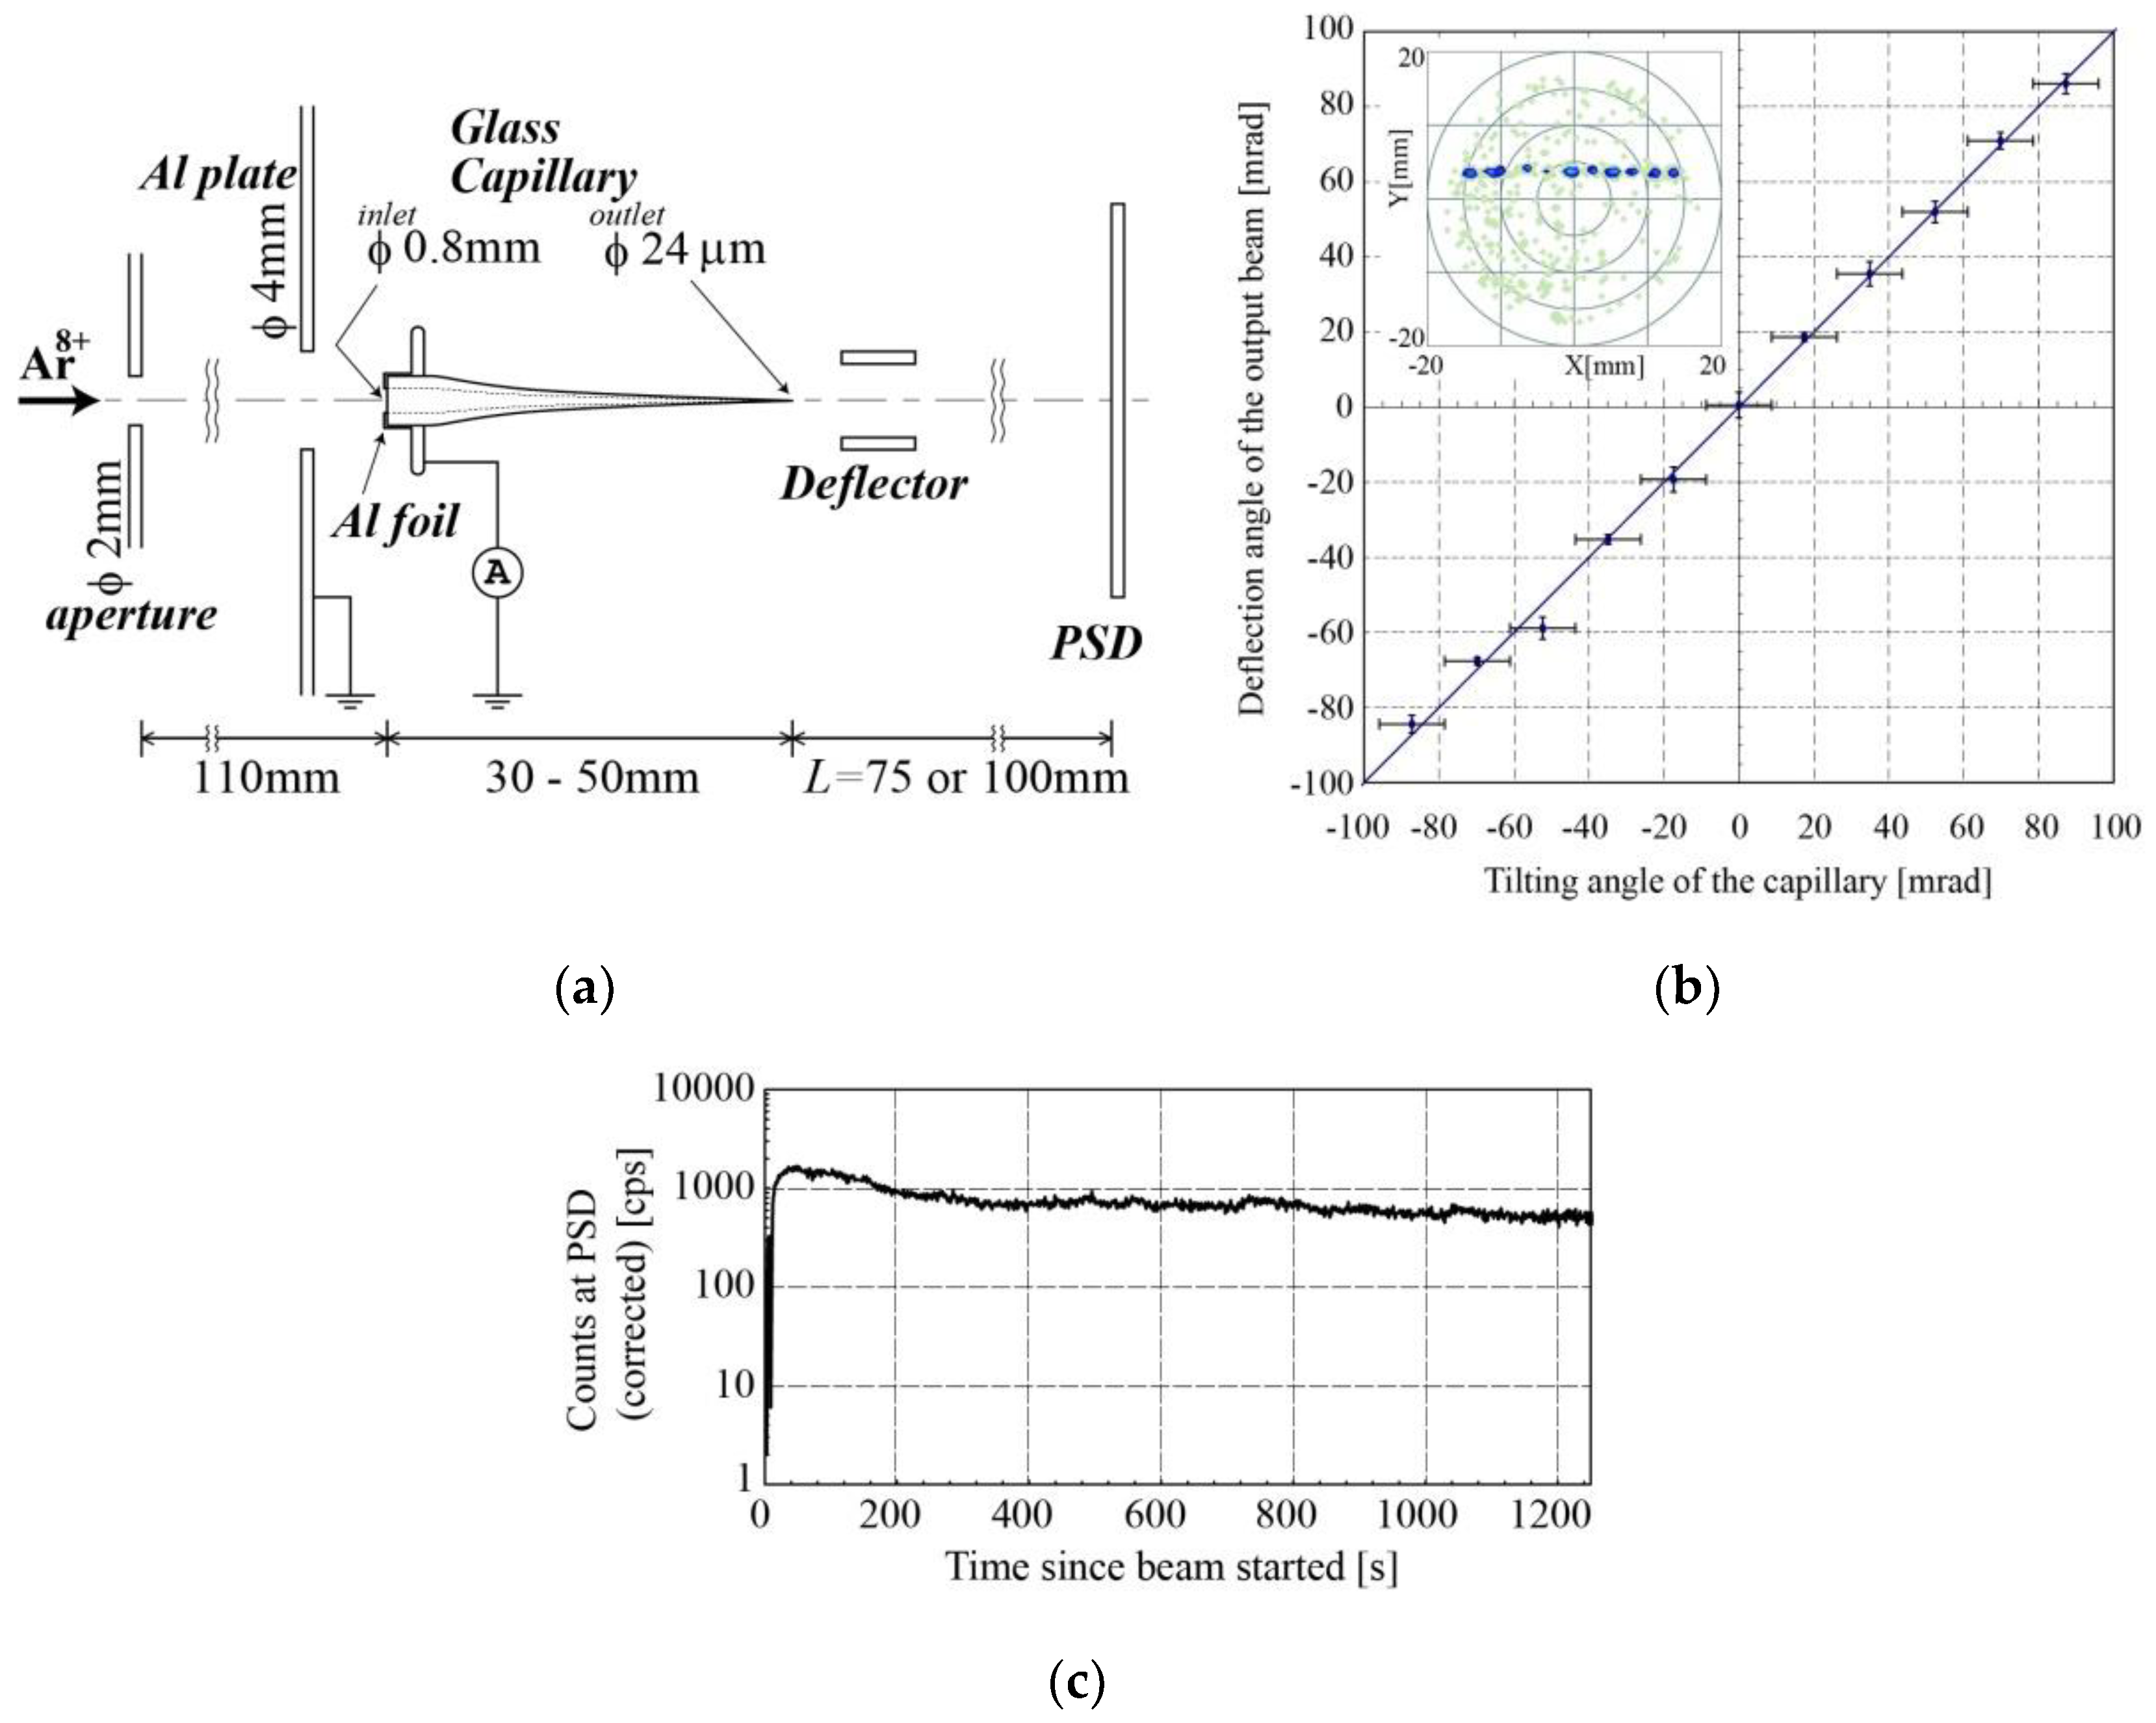
The transmission of keV ions through the single tapered glass capillary was observed at RIKEN [1]. The capillary was fabricated by the group of Kochi University of Technology. An Ar8+ beam extracted from an electron cyclotron resonance (ECR) ion source was accelerated by 1 kV and entered the glass capillary optics whose length was 50 mm, and inlet and outlet diameters were 0.8 mm and 24 μm, respectively, as shown in Figure 6a. The intensity of the input beam was less than 5 pA during measurements. The transmitted ions were counted by a position sensitive detector (PSD) consisting of a stack of multichannel plates and a wedge-and-strip-type anode. The position information was used to reject background events observed far away from the microbeam spot. A deflector was installed between the capillary outlet and the PSD to examine the charge state of the transmitted ions. There was no other charge state than Ar8+ in the transmitted beams when the input current was 0.3 pA.
To confirm the guiding effect, the transmitted beam positions were measured under the capillary tilting conditions from −5° to +5° with a step of 1°, where the input beam intensity was ~0.01 pA and the divergence was at most ± 3 mrad. Figure 6b shows the deflection angle of the transmitted beam as a function of the tilting angle (from −87 to +87 mrad). The beam was well guided to the direction of the capillary tilted by as large as 100 mrad. If the cross section of the capillary along its axis is assumed to be trapezoid, it is noted that the deflection angle is considerably larger than the half opening angle (~8 mrad) of the tapered capillary. The transmitted beam spots at the PSD according to the tilting angles are shown inset.
Figure 6c shows the time evolution of the number of transmitted ions, where the intensity of the input ions was 1.5 × 10⁵/s with a stability of ~10%. The time for transmission to saturation was approximately 50 s, which corresponds to the time taken to establish the charge patch distribution by self-organizing manner. At the highest transmitted intensity of 1600 counts per s, the density enhancement of 10 was obtained (focusing effect).
This experiment proved an easy way to produce microbeams with a higher density enhancement factor compared to those of the capillary microbeam of MeV ions. Similar to the 3 keV Ne7+ transmission through a PET foil [2], the delayed transmission and the guiding effect were also observed. Although the transmission was observed for more than 1200 s, the intensity decreased gradually because of the excess of the incoming charge onto the inner glass wall. The transmission properties observed in this experiment, including the instability, influenced other groups studying ion beam transmission through capillaries.

2.6. Various Shapes of Single Macro-Sized Capillary Optics for keV Ion Beams

The transmission of keV ions is based on the charge patch formation. To investigate the dynamics of the charge patch formation and obtain the stable transmission for future applications, various shapes of single macro-size capillaries have been examined, as listed in Table 2.
A single straight glass capillary with an inner diameter of 170 μm and a length of 11.4 mm was fabricated by a group of the Institute of Nuclear Research of the Hungarian Academy of Sciences (ATOMKI). Transmission of 4.5 keV Ar9+ ions was observed in Vienna and reported in 2009 (Bereczky and Kowarik et al. [12,13]). This study focused on the transmission through a capillary that was free from the collective effect (the effect from neighboring capillaries in the case of a multitude of nanocapillaries).
Kojima et al. at RIKEN demonstrated the transmission of 8 keV Ar8+ ions through a curved Teflon tube [14]. The authors proposed flexible insulator tubes to deliver highly charged ions of keV energy inside a complicated structure without any electro- or magnetic-beam elements. The setup at RIKEN is shown in Figure 7a,b. An 8 keV Ar8+ beam extracted from an ECR ion source entered an inlet of a Teflon tube whose inner diameter and total length were 1 mm and approximately 50 mm, respectively. The transmitted beam current I t was measured by a pico-ammeter. The current through the holder I h was also measured. The total current was defined as a summation of I t + I h , which means the beam current passing through the 2 mm diameter aperture of the shield. The bending angles were 0°, 9.6°, 17.5°, and 26.7°, where the total length varied from 49 to 51 mm depending on the angles, as shown in Figure 7c,d. Transmission was observed for the three tubes with bending angles up to 26.7° and a maximum total current of 200 pA, although the transmission current for the 0° tube vanished when the 0° tube was tilted by only 7°. The authors suggested it may open a way to develop a new scheme of flexible ion beam deflector systems akin to fiber optic guides.
Zhou et al., in a group of the Centre de recherche sur les ions, les matériaux et la photonique (CIMAP) in Caen, France, performed an experiment to examine the transmission properties using two types of tapered glass capillary [15]. One was the capillary fabricated in RIKEN [1] and another was a newly introduced capillary, whose taper angle was constant along its length, produced in the Eidgenössische Technische Hochschule (ETH) Zürich Laboratory in Zurich, Switzerland. To identify each shape, capillaries from RIKEN and ETH were called funnel- and conical-shaped, respectively. The experiment used the input beam of 27 keV Ar9+ ions with intensities of 1, 5, and 10 pA. The outlet size of the capillary was ~22 μm. They found that less or no transmission phases (blocking effect) for the funnel capillary were observed after rather short charging times, whereas, transmission and guiding occurred continuously for the conical capillary. Blocking of the funnel capillary was attributed to a potential barrier that was established by charge collection at the funnel section (larger taper angle part) of the capillary.

3. Materials of Glass Capillary Optics and the Fabrication Methods

This review paper focuses on applications of microbeams using single tapered glass capillary optics. The details of the material of the glass and the fabrication methods are the key points for users to start their experiments.

3.1. Determination of Taper Angle and Outlet Size: Puller and Microforge

The material of the capillaries used at RIKEN is mainly borosilicate glass. The glass is similar to Pyrex, a product of Corning Inc. The typical components of the chemical compounds for borosilicate are 80.3% SiO2, 12.9% B2O3, 3.8% Na2O, 2.2% Al2O3, and 0.4% K2O [16]. The volume resistivity at 25 °C is 1015 Ω cm and the softening temperature is 821 °C. Fused quartz glass might be better for a hard capillary. However, the softening temperature of fused glass (>1600 °C) is much higher than that of borosilicate. Thus, shaping with borosilicate is much easier than with fused quartz.
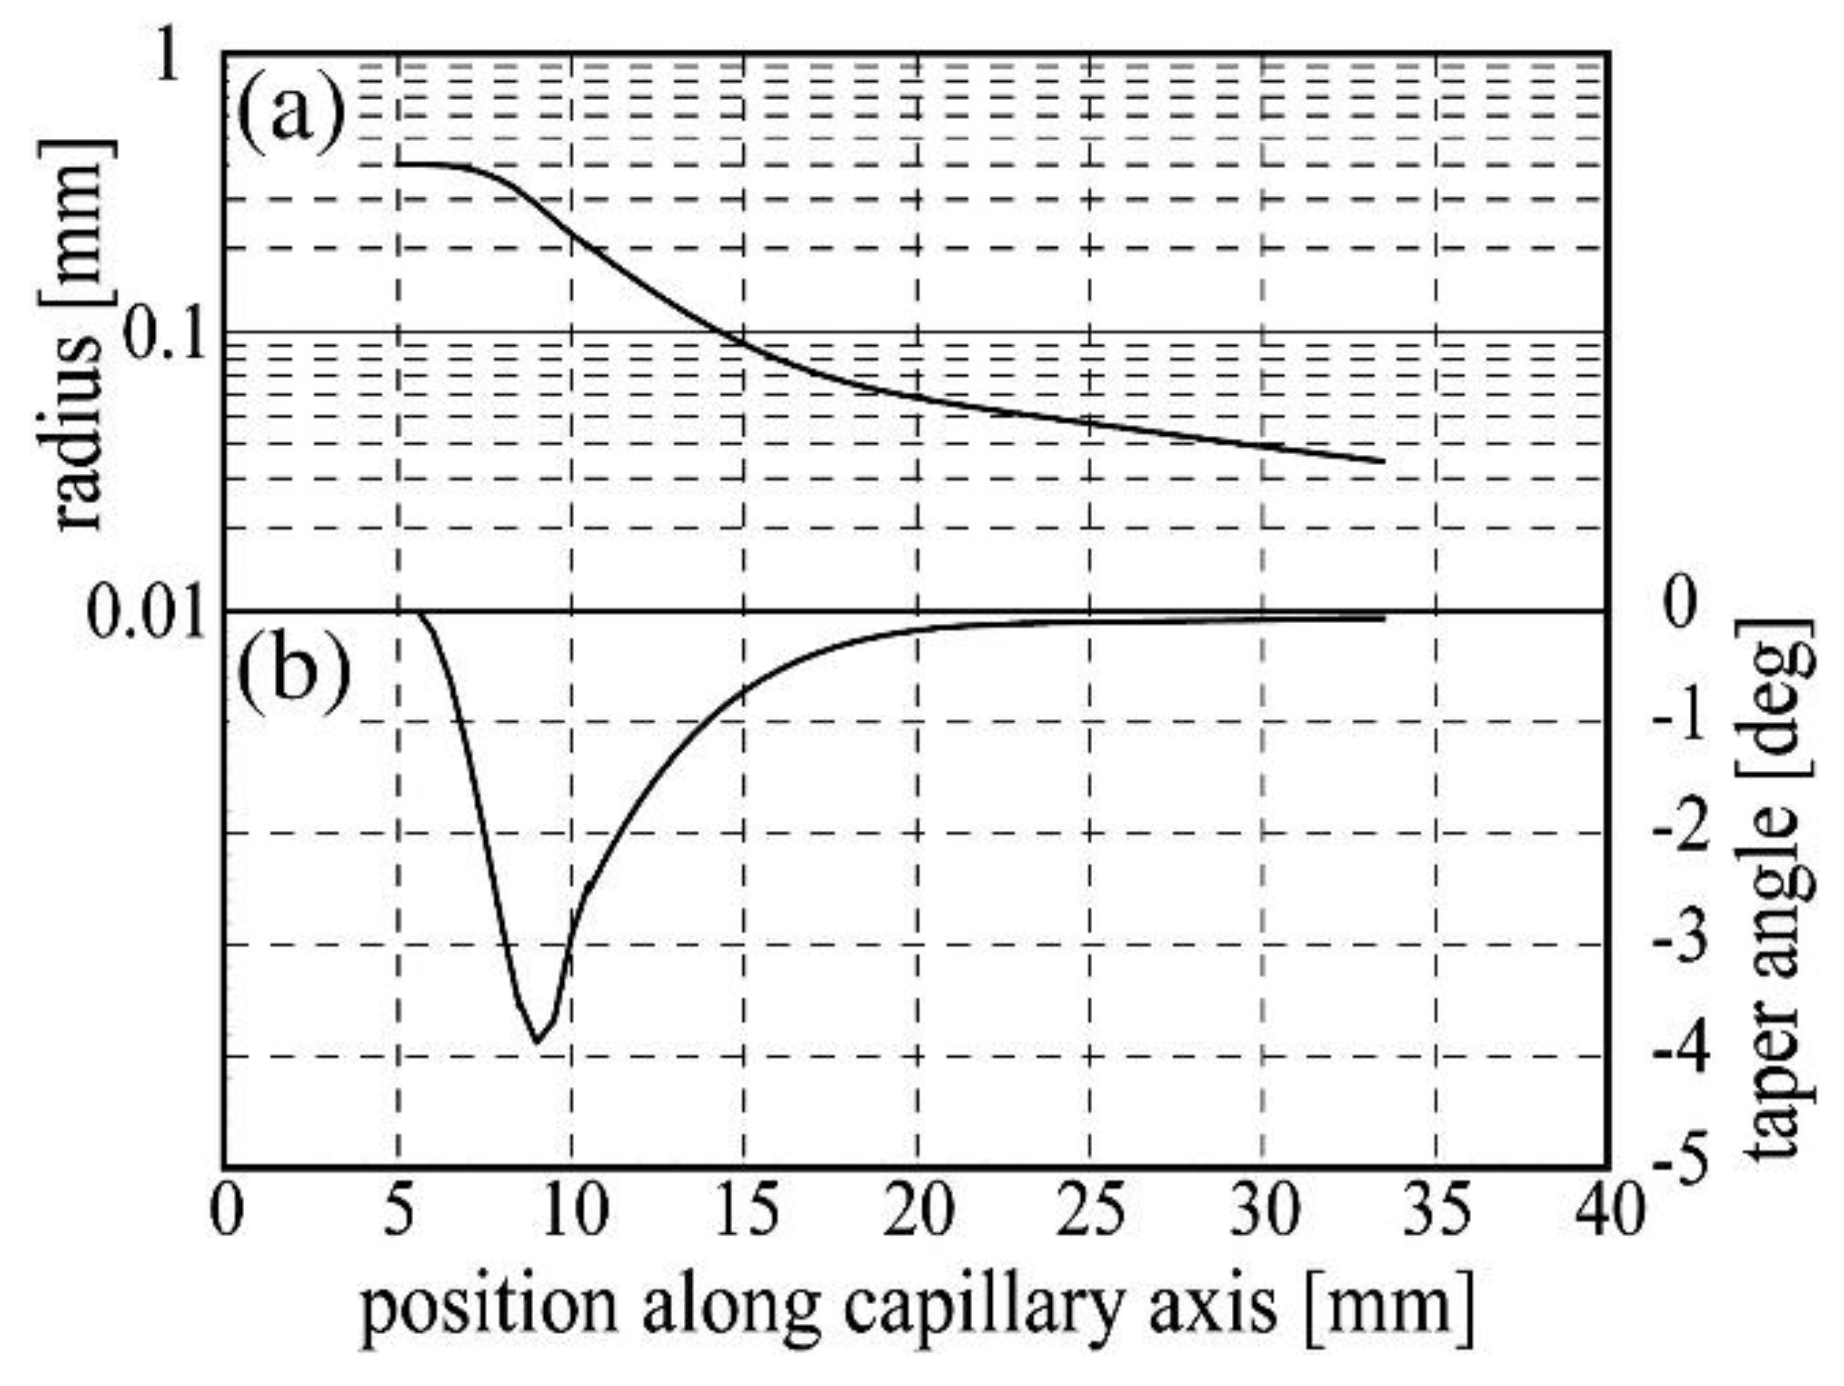
The tapered capillary was prepared by heating a straight glass tube, and then stretching it by pulling both ends with a constant force. The taper angle can be controlled by tuning the temperature and the force [1]. The process is automatically done by a puller (e.g., Narishige PE-21 or PE-22 [16]). The inner radius and the taper angle were measured as a function of position along the capillary axis, where the outer and inner inlet diameters of the capillary were 2 and 0.8 mm, respectively, as shown in Figure 8 [10]. The inner radius of less than 30 μmϕ was not measured due to the resolution of the microscope.
As shown in Figure 8b, the taper angle ranges from almost zero to 4° (funnel-shaped). When the heater coil of the puller is long enough, the taper is expected to be more constant (conical-shaped, used in Reference [15]). The outlet sizes depend on the size of the irradiated targets. Although the capillary outlet size just after the pulling process is around 100 nm (Figure 2c), it is impossible to observe the outlet by an optical microscope. The outlet size is obtained by cutting the taper part of the capillary. A microforge (Narishige MF-900 [16]) is used for cutting and provides an outlet, as shown in Figure 2d. If one needs an outlet size less than 1 or 2 μm, a commercial manufacturing device, a focused ion beam (FIB), is available for cutting [10]. The FIB provides Ga+ beam of ~40 keV. The scanning parameters of the Ga+ beam, e.g., scanning directions, interlace rate, and scanned region, are tuned to prevent the Ga+ beam from being bent due to the charging around the capillary outlet. An example is shown in Figure 2e with the outlet size of 500 nm.
Glass surface roughness after the pulling process is expected to be on the order of less than 1 μm, as shown in Figure 2c,e. This is one of the advantages of using glass as a capillary material. When metal is used, it is impossible to achieve such a low level of roughness by machining. There are no reports on surface roughness after beam transmission experiments. Although the capillary glass surface must suffer from modification by MeV ion beams, beam transmission does not show any deterioration. Researchers do not want to observe the inner surface of the capillary, which still works well. To estimate the life of a glass capillary, the condition of the capillary inner surface after the transmission experiments should be studied. Moreover, an intense beam introduces heat into the glass. Depending on the beam energy and ion species, researchers must pay attention to the beam intensity to avoid melting the glass capillaries.
In experiments with keV ion beams in vacuum, beam transmission characteristics may change due to the change of surface conductivity. It depends on the treatment of the glass capillary before the experiment. If the glass surface has contamination, the surface condition changes as the beam sputtering progresses. Bulk conductivity can also be affected by irradiation. A high electric field due to charging may cause a dielectric breakdown of the glass. When a breakdown occurs, the conductivity is constantly increased or switched depending on the current electric field.

3.2. End Window at an Outlet

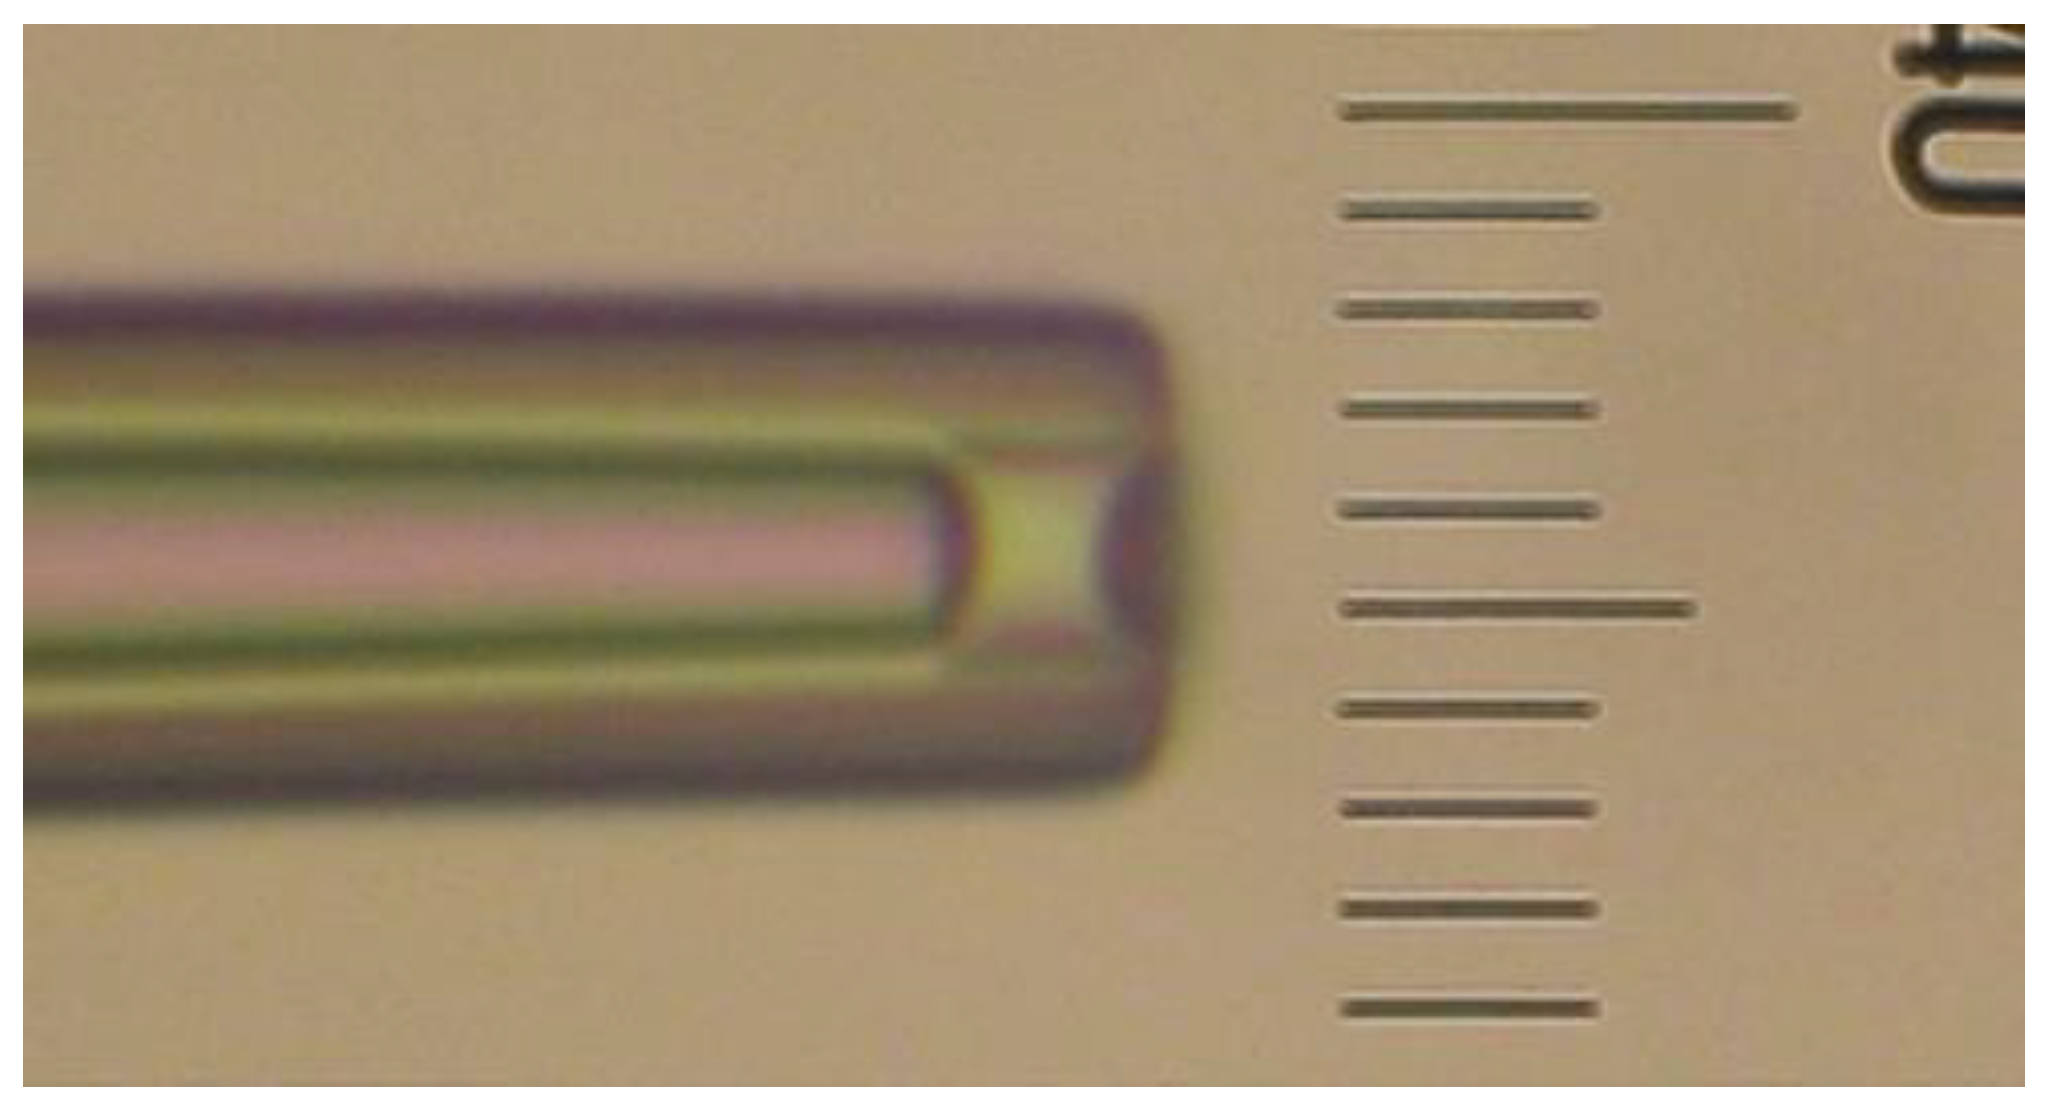
Figure 9 shows a photo of a plastic scintillator end window at a capillary outlet. The window diameter and the thickness are 5 μm and ~4 μm, respectively [17]. The thickness is less than the ranges for H and He ions of a few MeV in water. To irradiate a sample in liquid solution by such ions, the outlet of the capillary requires a close approach to the sample because of their short ranges. In this case, the capillary outlet needs an end window to maintain the vacuum inside the capillary.
The end window is fabricated using a microforge and commercially available plastic microbeads whose diameters are slightly smaller than or equal to the inner diameter of the capillary outlet. One of the microbeads is picked up and put into the capillary outlet [4]. This process is done with a microforge. Then the plastic bead is melted carefully by the heater of the microforge.
If plastic scintillator is used as the material of the microbeads, scintillation light can be measured depending on the stopping power of individual ions, realizing the ion counting [4]. The light travels through an objective lens of the microscope used in the microbeam irradiation, and is measured by a photon sensor such as a photomultiplier tube.

4. Characteristics of Microbeams Produced by Glass Capillary

In this section, some efforts to understand the transmission characteristics and to obtain stable microbeams are introduced.

4.1. Ions with keV Energy

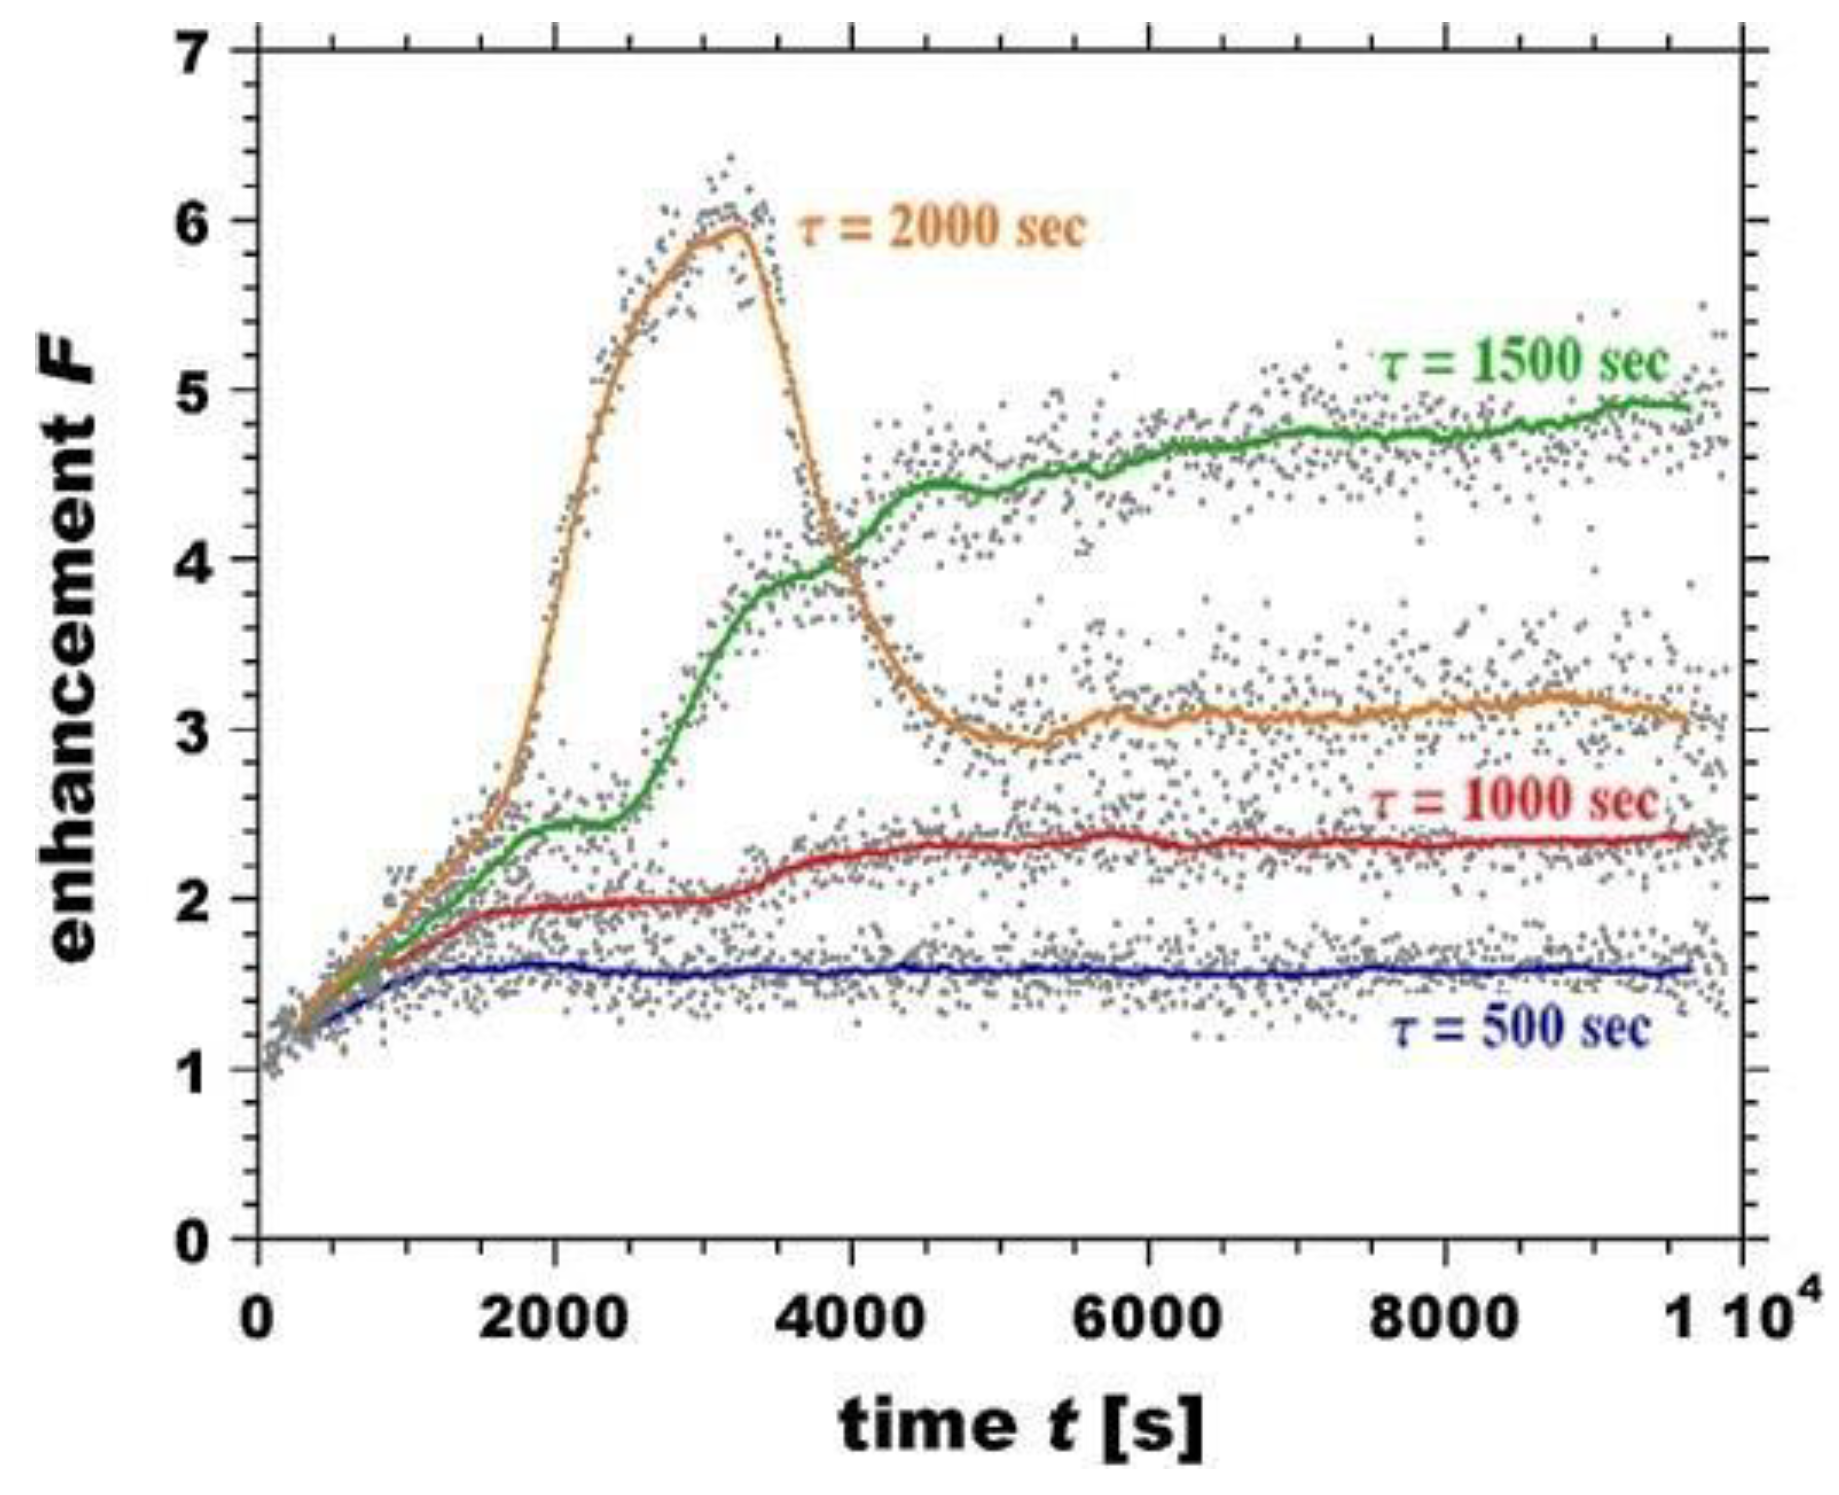
In order to describe the dynamics of the charge patch, Schweigler et al. at Technische Universität (TU) Wien introduced parameters such as discharge time constant, surface charge density, specific resistivity, and dielectric constant in the simulation of an experimental result [18]. The simulation assumed an input beam of 0.13 pA of 8 keV Ar8+ ions, and inlet and outlet diameters of 0.8 mm and 100 μm, respectively, which are similar to the conditions of the first experiment in RIKEN including the geometrical condition of the funnel-shaped capillary [1]. Figure 10 shows the time evolution of the density enhancement predicted from the simulation according to the various discharge time constant from 500 to 2000 s. A slow discharge (τ = 2000 s) results in higher enhancement, however blocking starts soon in the process. In the cases of short discharge (τ = 500, 1000 s), the density enhancement is not high.
The simulation tried to examine the difference in the density enhancement between funnel- and conical-shapes. Although this work required simplifications, a realistic scenario was provided, at least at the qualitative level. Zhou et al. at CIMAP performed an experimental examination [15]. An experimental time evolution of the transmission intensity was reported by Cassimi et al. in the same laboratory in 2012 [19]. An input beam of 230 keV Xe23+ with intensity of ~20 pA was injected into a borosilicate glass capillary made at RIKEN. In this experiment, the discharge from the capillary was also measured. These three works (Schweigler, Zhou, and Cassimi) were for highly charged ions. Singly charged ions can be generated by simple ion sources.
Giglio et al. at CIMAP used singly charged ion beams and introduced a series of studies on combining accurate simulation and experimental data. In 2015, they reported the measured time evolution of transmitted 1 keV N+ through a funnel-shaped capillary with inlet and outlet diameters of 6 and 0.4 mm, respectively, performed at Missouri University of Science and Technology, USA [20]. They found various time evolution features for such a large outlet depending on the input current ranging from 2.0 to 4.5 pA and the simulated results showed the same tendency. Then, Giglio et al. measured the time evolution of the electric potential of the whole capillary at the CIMAP laboratory. They used an ion gun producing 3 keV Ar+ ions with intensities between 0.4 and 16 pA and a conical-shaped capillary whose total length was 75 mm, and inlet and outlet diameters were 860 and 26 μm, respectively [21]. The electric potential and the transmitted beam intensity were successfully monitored simultaneously by the original electrometer. It was found that, although the tapered glass capillary is neutralized due to stray electrons, the capillary is able to accumulate enough charge to generate electric potentials that go beyond 600 V. They also described the focusing effect induced by self-organized potential [22]. The capillary focusing due to the charge patch potential is distinguished between a non-axis-symmetric and axis-symmetric charge deposition, which correspond to “compression by the transverse field for a tilted capillary” and “compression by the radial component of the electric field for a non-tilted capillary”, similar to an Einzel lens, respectively. The experiment employed 2.3 keV Ar+ ions and a capillary with a total length of 74 mm, and inlet and outlet diameters of 1.05 mm and 144 μm, respectively. The capillary folder was able to monitor the total charge stored in the capillary at each moment, which was helpful for the comparison with a result by its original numerical code, called INCA4D. They reported that the potential inside the capillary had to reach about 70% of the extraction potential of the ion source for sufficient focusing without capillary tilting. The density enhancement increased with the injected beam intensity (75–210 fA), where the enhancement of 10 was obtained for 210 fA. However, the injected current less than 120 fA was necessary to avoid the blocking. These experimental observations, including the time scale, were well reproduced by the simulation quantitatively. A useful method for advancing the alignment of the capillary with the beam axis employed a position sensitive detector located 270 mm downstream of the capillary to obtain the beam profiles. After deflecting the transmitted Ar+ ions upward, a profile of the neutralized atoms appeared on the detector. Some neutrals included in the initial beam indicate a small spot on the detector. The neutrals caused by electron capture at the ion hitting points on the capillary wall created a ring image. The fine-tuning of the capillary alignment was performed until the spot and the center of the ring were at the same position. This method provided an alignment within an error bar of ± 0.05°. The theoretical study of the relaxation dynamics of charge patches was also reported by them in 2019 [23]. The calculation assumed a cylindrically shaped glass capillary whose length is H, inner and outer radii are R1 and R2, respectively, and dielectric constant is ε r . The entrance, exit, and outer capillary surface are electrically grounded. Under a capillary tilt condition, the injected beam deposits charge patches on the inner wall near the entrance. The dynamics of the surface charge density on the inner surface is given by a surface continuity equation, which takes into account the surface and bulk conductivities, as well as the injected current. The electric field to guide the ions and drive the charge deposition is also included. They succeeded in deducing an analytical solution of the continuity equation in the form of a linear combination of surface charge moments that satisfy the given boundary condition. The authors emphasize that the relaxation dynamics of the charge patches strongly depends on the dimensions and electrical properties, such as the conductivities, of the capillary. It means this technique is applicable to conical-shaped capillaries and also the multitude of nanocapillaries in an insulator foil used in [2]. They demonstrated an example of a borosilicate glass tube (H = 43 mm, R1/R2 = 0.19/2.75 mm, and ε r = 4.6) to predict the discharge as a function of time according to different surface relaxation rates ranging from 0 to 630 mHz.
Transmission of higher energy ions (90 keV O6+) through a single tapered glass capillary was examined by Chen et al. at the Institute of Modern Physics, Chinese Academy of Sciences, Lanzhou, China [24]. The input current (approximately 2 nA/mm2) was also higher than other experiments because a Faraday cup was used as a detector. The original detector was called the 64-channel Distribution Sensitive Faraday Cup, which had a position resolution of 0.3 mm and an acceptance angle of 5.4°. The used capillary was 14 mm in length and 0.6/0.2 mm in inlet/outlet diameters, respectively. They obtained a focusing effect with a density enhancement of 4.5 even for medium energy ions.
In 2009, as described in Section 2.6, Bereczky and Kowarik et al. [12,13] performed experiments using straight capillaries (170 μmϕ, 11.4 mmL) with 4.5 keV Ar9+ in Vienna. They demonstrated a guiding effect with the tilting angles of −4.0°, 2.0°, 0.6°, and 3.8°. The FWHM of the initial beam was around 2.2°. The FWHMs of the transmitted beams for any tilting angles were approximately 3.3°. Using the original capillary holder with temperature control system in Vienna [25], Gruber et al. at TU Wien reported temperature dependence of the maximum angle of the guiding effect, for the first time [26]. The input beam of 4.5 keV Ar7+ with the flux of 5000 counts/s was injected into a straight glass capillary with total length of 11.4 mm, and inner and outer diameters of 160 and 300 μm, respectively. They obtained the angular limits of the guiding effect depending on the capillary temperature between −25 and +75 °C, as well as on the input current intensity.
They introduced a temperature-dependent critical angle ϕ C ( T ) determined by the 1 / e drop of the intensity; exp [ ϕ 2 / ϕ C 2 ( T ) ] , where ϕ is the tilt angle of the capillary. The critical angle was measured to be 3.5° for near room temperature (22 °C). When it increased to +75 °C, ϕ C decreased to the geometrical limitation ( ± 0.8°). This experiment showed that the guiding effect is controllable by changing glass conductivity through the capillary temperature.
The difference in conductivity was measured by Kulkarni et al. at Clemson University, USA, utilizing steel and glass capillaries with a 1 keV Rb+ beam [27]. The three straight capillaries used were: (1) steel (2.3 mmϕ, 21.0 mmL), (2) glass (5.4 mmϕ, 35.5 mmL), and (3) glass (5.4 mmϕ, 21.0 mmL). A tapered glass capillary (inlet/outlet = 5.4/2.3 mmϕ, 19.6 mmL) was also used. The transmitted current through the insulating capillaries was not constant, while the metal capillary showed stable transmission. They noted the instability was due to the dynamic formation of the charge patches.
An Ar ion beam with higher current density (600 μA/mm2) was injected into capillaries in an experiment performed by Maurya et al. at the Indian Institute of Technology by extracting the ions from a plasma column directly [28]. The extraction bias was 10 kV. They prepared a straight glass capillary (860 μmϕ, 7.5 mmL) and tapered glass capillaries (inlet/outlet = 860 μmϕ/20–500 μmϕ, 7.5 mmL). The ion beam was guided by up to 5° in tilt angle. They proved the maximum density enhancement of 700 was obtained with a 20 μmϕ capillary for the extraction voltage of −10 kV.
When an input beam with relatively higher current is used in transmission experiments, oscillating transmission currents have been observed [8,14,15,27]. The phenomenon was explained by Ikeda et al. with experimental data and a theoretical model introducing “resistive switching” [29]. They used 104 keV Ar8+ as an input beam whose intensity varied between 53 and 130 pA. The beam was injected into a thin gap (0.1 mm) of a pair of soda lime glass plates with a thickness of 0.9 mm. The transmitted beam through the gap was measured by a metal plate connected to a pico-ammeter. The glass plate pair was slightly tilted upward keeping the entrance position so that the guided transmission occurred only when the charge patch was established on the inner surface of the lower plate by the incoming beam itself. When the glass conductivity jumped up due to an excess of the induced potential, the charge patch disappears, resulting in no transmission. They observed a slowly and regularly oscillating transmission current during an injection of a steady ion beam. The oscillation frequency was almost proportional to the input beam intensities. This phenomenon can be attributed to the charge–discharge iteration cycle with dynamic resistive switching of the glass plate. The model calculation based on such cyclic resistive switching well reproduced the experimental observation. It should be emphasized that resistive switching was observed even for such a thick insulator plate.
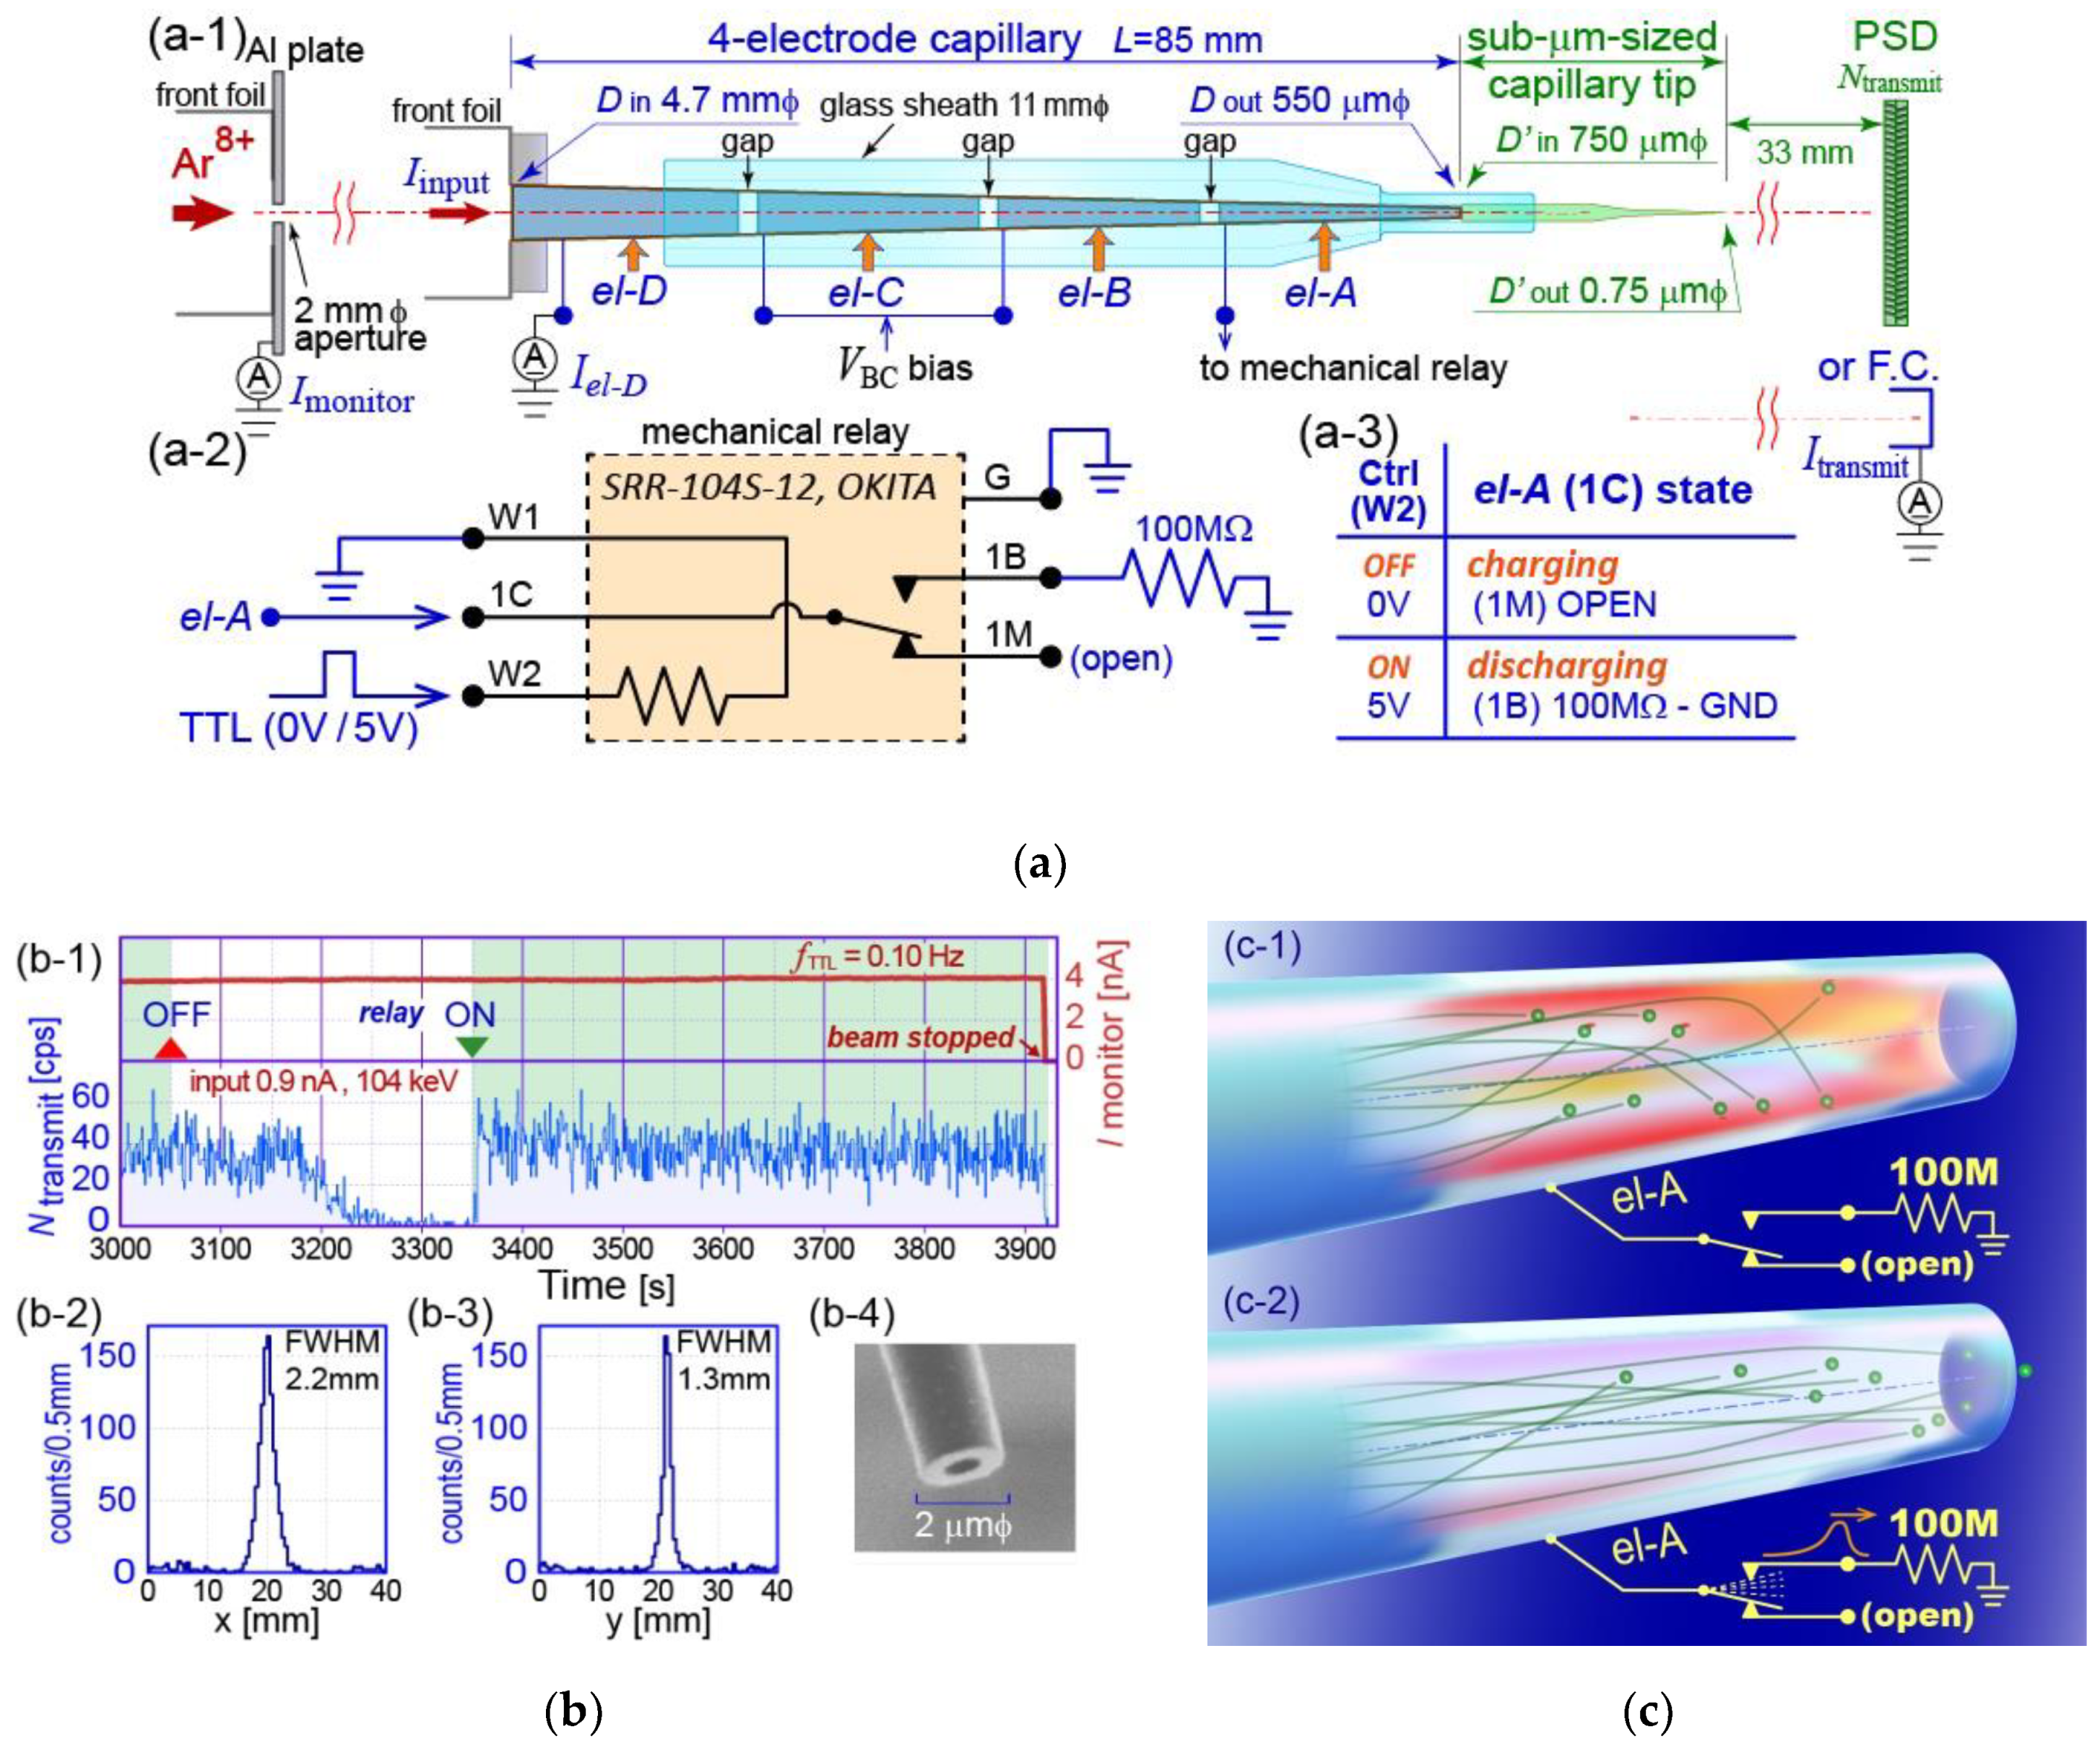
Next, they designed a transmission experiment based on an “active discharge” method to realize a stable transmission for sub-micron-sized ion beams produced by a single tapered glass capillary [30]. Figure 11a shows the experimental arrangement. The tandem capillary consisted of a sub-μm-sized capillary tip and a four-electrode capillary. They demonstrated the stable transmission of a 104 keV Ar8+ beam through the tandem capillary with an outlet diameter of 0.75 μm (photo in Figure 11(b-4)) employing artificial and periodic discharge through an electrode el-A connected to a mechanical relay as shown in Figure 11 (a-2,a-3). The periodic discharge was done by Transistor-Transistor Logic (TTL) signals with a frequency of 0.1 Hz. Figure 11(b-1) shows the time evolution of the number of transmitted ions with an input current of 0.9 nA. The horizontal time range was a part of a long transmission measurement. The periodic discharge stopped at 3050 s and started again at 3350 s. During the time with the periodic discharge, the transmission was stable. However, the transmission was unstable or there was no transmission without the periodic discharge. Moreover, transmission intensity after 3350 s was almost the same as that before 3050 s. To avoid the counting of background events, only the ions arriving in the transmitted beam spot were counted. The spot is shown in Figure 11(b-2 and b-3). The active discharging is explained as the following. As observed by many experimental groups, transmission blocking occurs when the potential induced by charge patches becomes strong, as shown in Figure 11(c-1). During the mechanical relay ON, the charge in the charge patches immediately flows to ground level through a resistance of 100 M Ω , as shown in Figure 11 (c-2). The electrode el-A was on the outer surface of the four-electrode capillary, including the outlet surface, which was connected slightly to the inner surface of the capillary. The time of the discharge was set to 2 ms and the repetition was in the order of 0.01–0.1 Hz. It was found that the frequency did not affect the stable transmission. The amount of the discharge might be automatically determined by the rearrangement of the charge patch distribution with a self-organized manner so that the stable transportation is maintained.
Although positively charged ions have been used by many experimental groups, Pan et al. at Lanzhou University reported on the transmission of negatively charged ions (14 keV O) in 2019 [31]. They used a single tapered glass capillary whose length was 45 mm, and inlet and outlet diameters were 580 and 68 μm, respectively. The intensity of the input beam was 25,300 counts/s. The transmitted ions were counted by a two-dimensional position-sensitive micro-channel plate detector (2D-PSD) to identify the charge states of the ions combining a parallel-plate electrostatic analyzer between the capillary and the 2D-PSD. They found a focusing effect with a density enhancement factor of 5.5, even for negative ions.

4.2. Ions with MeV Energy

Since the Narusawa group reported the transmission of MeV ions through a single tapered glass capillary [3], beam profiles have been intensively studied.
Hasegawa et al. at the Tokyo Institute of Technology, Japan, reported a precise measurement of the transmitted beam profiles for 2 MeV H+ ions through tapered glass capillaries with outlets of 20 μmϕ [32]. Figure 12a shows a schematic representation of the setup. They prepared three capillaries whose taper angles were 2.1, 3.4, and 4.9 mrad.
Figure 12b shows three irradiation patterns recorded on imaging plates according to the taper angles. A smaller taper angle capillary shows a smaller spot. It was found that the profile has two components; one is the “core”, corresponding to the ions without touching the capillary inner wall, and the other is the “halo”, induced by ions suffering from the scattering on the wall or penetrating the wall. Figure 12b also shows a cross-sectional view of the profile for the capillary with a taper angle of 2.1 mrad. They reproduced the “core” and “halo” by simulation with good agreement. Using the simulation code, they estimated a possible maximum density enhancement of 2 or 3 depending on the capillary shape.
The density enhancement was also tested by Hespeels et al. at the University of Namur, Belgium, for 1.7 MeV H+ ions [33]. They compared the capabilities of three different passive collimation devices to produce micrometer-sized beams: (1) classical platinum transmission electron microscopy (TEM)-like collimators (20 or 50 μmϕ), (2) straight glass capillaries (20 or 50 μmϕ, 40 mmL), and (3) tapered glass capillaries (40 mmL). The tapered capillaries (funnel-shape) were fabricated at RIKEN and had an inlet diameter of 0.8 mm and outlet diameters of 20 or 50 μm. The transmitted ions were detected by a Passivated Implanted Planar Silicon (PIPS) detector for ion energies and a solid state nuclear track detector (CR-39) for the beam profiles. A density enhancement factor of 2 was obtained by method (3), the tapered capillary. However, they described, taking into account the time to align the capillaries, that the collimators of method (1) were an easy way to produce a microbeam in the case of such sizes.
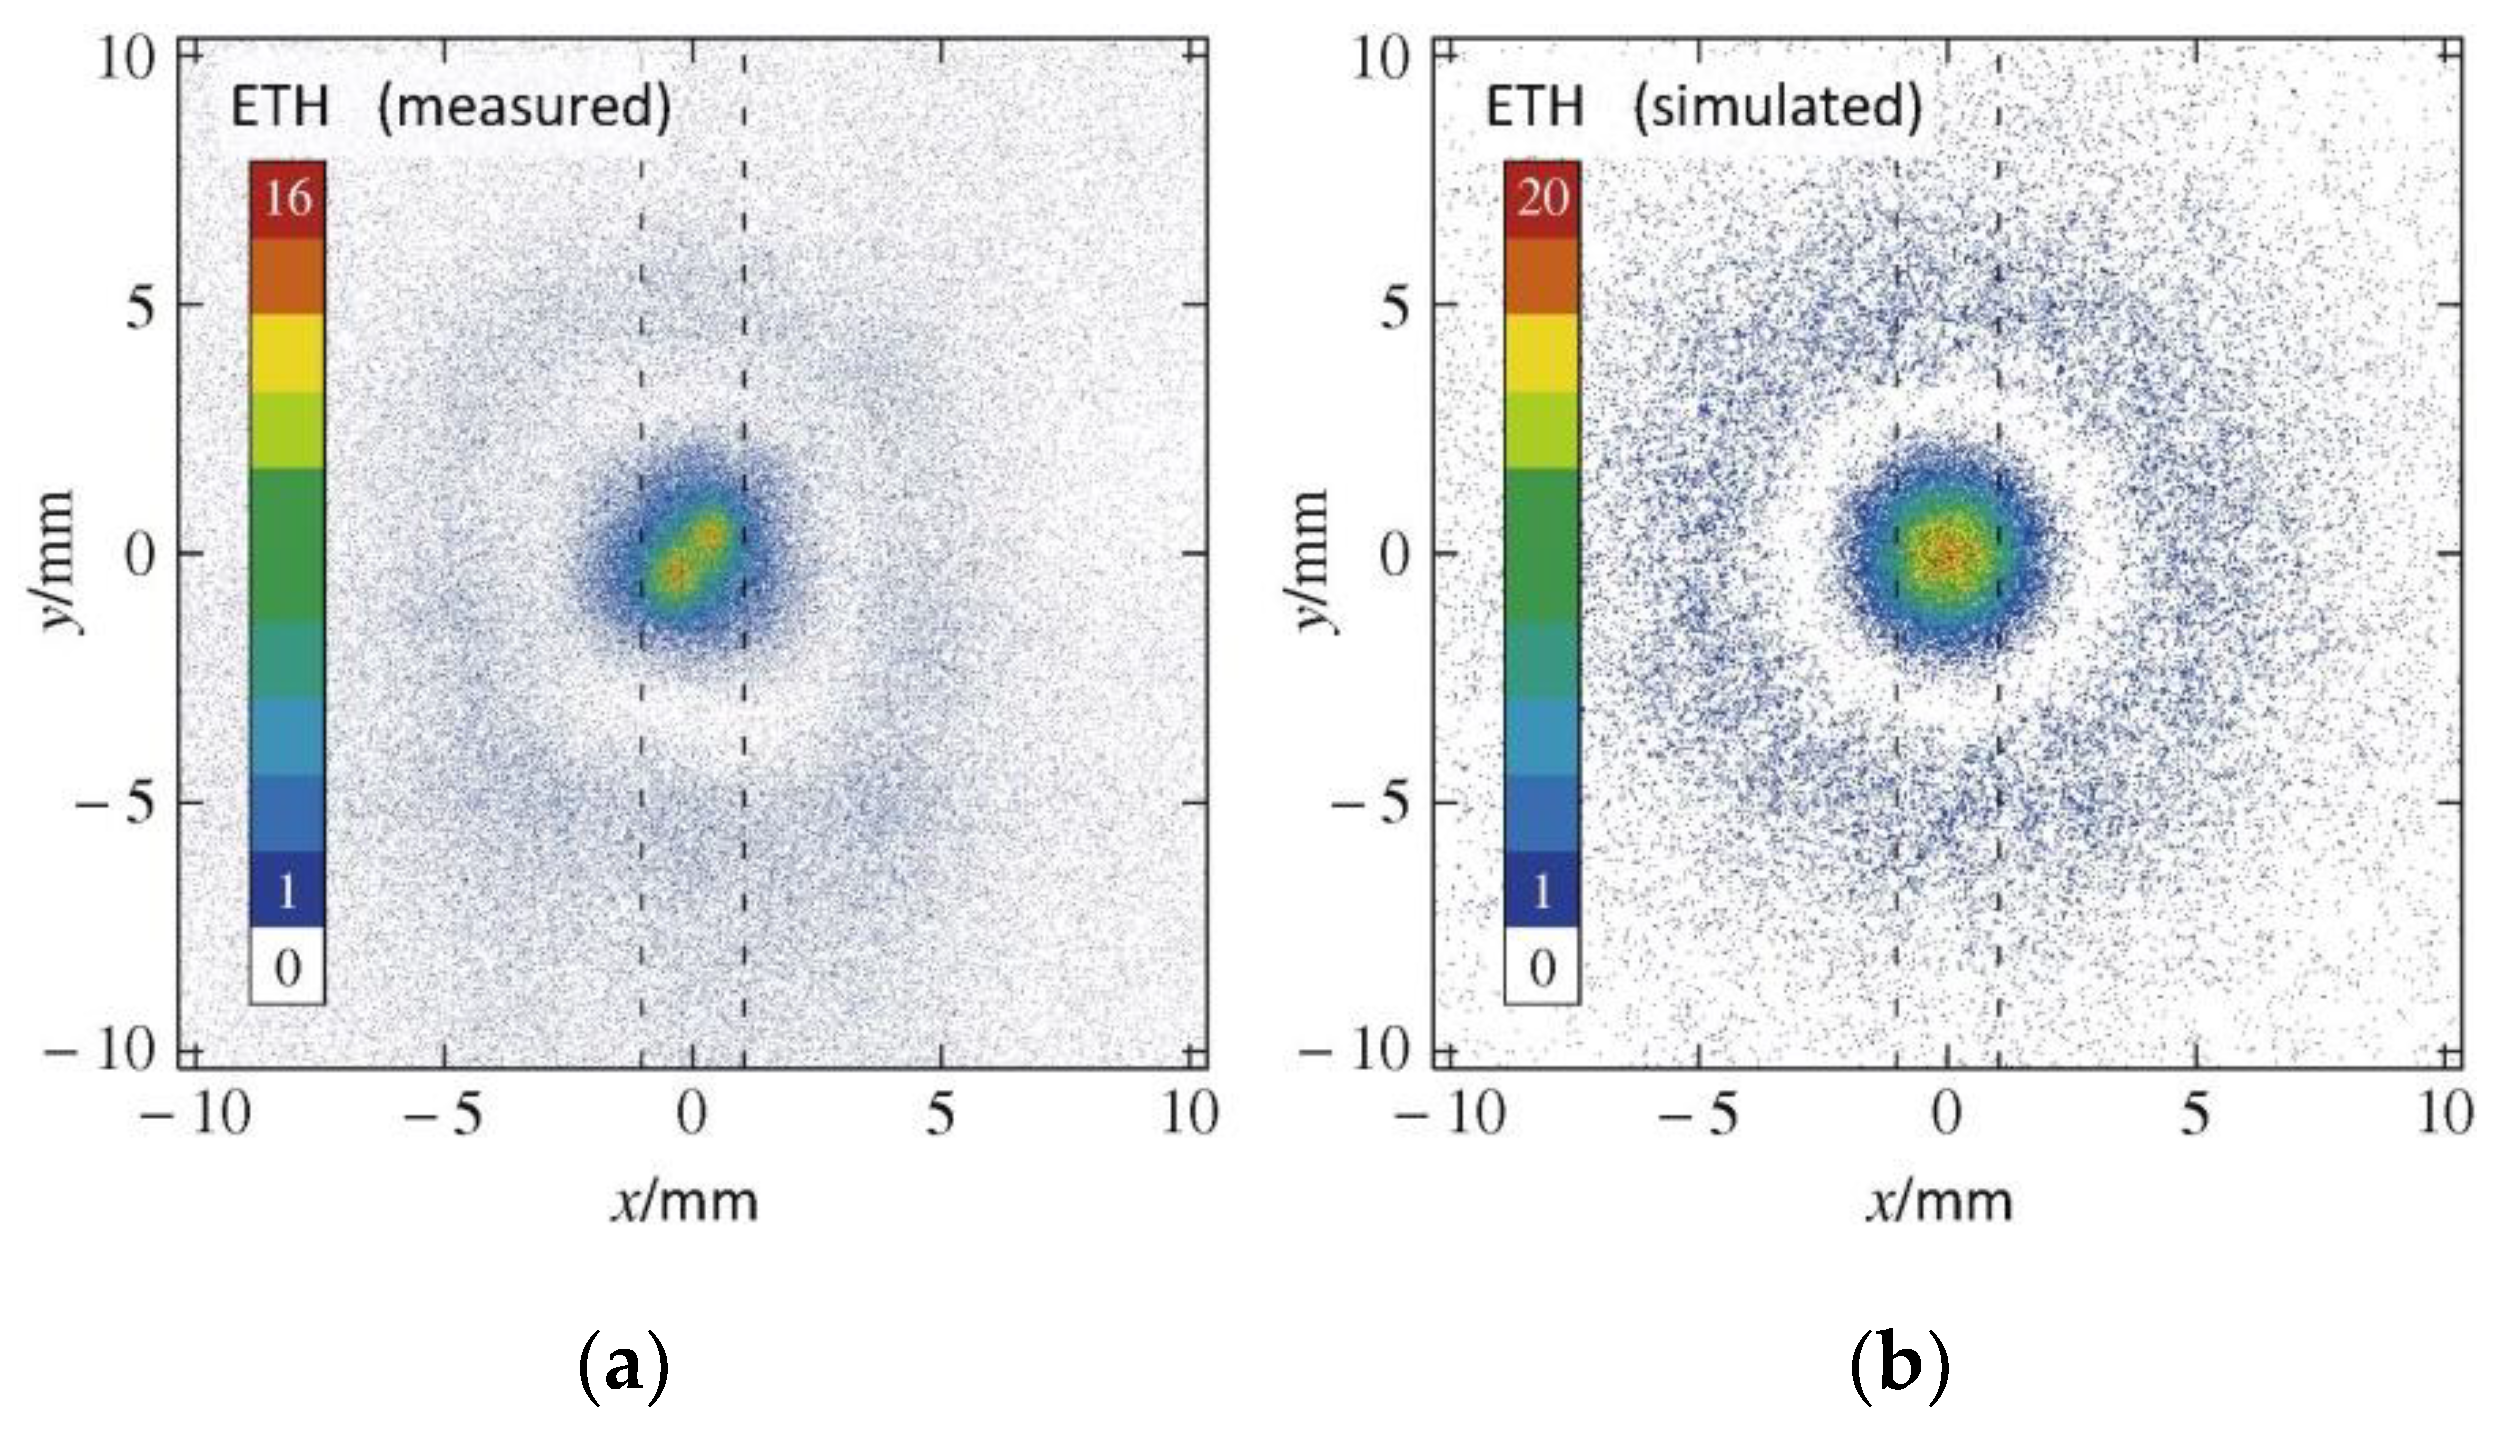
The density enhancement for conical-shaped capillaries was examined by Simon et al. at ETH, with 1 MeV He+ and 71 MeV Xe19+ ions [34]. The capillaries were fabricated at ETH and had an inlet diameter of 0.86 mm, outlet diameters of 0.7–8.6 μm, and lengths of 40–50 mm. The experiments were performed at ETH for 1 MeV He+ (0.25 MeV per nucleon) beam, and at GANIL, Caen, France for 71 MeV Xe19+ (0.54 MeV per nucleon) beam. The density enhancement factors for capillaries with 1 MeV He+ ions were measured to be between 1 and 2, which were consistent with the simulation results. Figure 13a,b shows the measured and simulated beam profiles for 71 MeV Xe19+ ions, respectively. Both profiles show the core and halo components clearly. The simulated profiles reproduced the measured profiles for both ETH and RIKEN capillaries (RIKEN data are not shown here).
The density enhancement is based on the scattered ions with the inner surface, which are extracted through the outlet or penetrate the thin glass wall near the outlet. The majority of such ions are expected to be included in the halo component. Since they are generated by inelastic collision or penetrating the glass wall, the energies of the most ions fall. Even if the density enhancement is more than unity, the halo events may not be able to affect the target. This problem is more serious for a few MeV H ion beams. The situation is better if a He ion beam is used. In the cases of heavier ions, a longer range is needed to go through the capillary end window. Depending on experiments, lower energy ions cannot be used to damage or excite the target. Capillary users need to be aware of the lower energy events, as well as the beam spread by the halo component.
The profiles of MeV H+ ion microbeams produced by a glass capillary with an end window were measured in atmosphere by Ikeda et al. at the RIKEN Pelletron facility [35]. The inlet and outlet diameters of the capillary were 1.8 mm and approximately 10 μm, respectively. The thickness of the plastic end window was approximately 9 μm. The energy of the ion beam was 2.8 MeV, and its range in water after the end window was around 100 μm. The ion microbeam will be used in a planned irradiation experiment which needs a spot size of 40 μm at an irradiation distance of 1 mm. After suppression of most ions in the halo component by inserting a stack of 11 μm-thick Al-degrader foils between the capillary outlet and the sample, the beam profiles were measured by two methods: one was a 2D-imaging detector (CR-39) mainly to detect the halo, and the other was a knife-edge method to determine the core size. It was found that the measured beam size was almost the same as the required value.
The microbeam properties in atmosphere were studied by Fujita et al. at Nara Women’s University, Japan. They used two tapered glass capillaries without an end window: capillary-A with an outlet diameter of 50 μm, taper part length of 18 mm corresponding to the taper angle of 0.72°, and capillary-B with these values of 50 μm, 25 mm, and 0.51° [36]. The energy spectra of the transmitted ions were obtained for 3 MeV H+ with capillary-A, and 5 MeV He2+ with capillaries-A and -B. The peak in the spectrum for He2+ with capillary-B was more shifted to the lower energy side than that for capillary-A. The researchers explained the larger energy loss was induced by smaller taper angle or longer taper part because of the conductance for the air flow coming into the capillary outlet. They also measured the microbeam profiles for 3 MeV H+ with a tapered capillary with inlet/outlet diameters of 2 mm/200 μm, respectively, fabricated at RIKEN [37]. The measurement utilized the Particle Induced X-ray Emission (PIXE) technique. A copper wire with a diameter of 25 μm was used as a target and scanned with an automatic stage. The profiles were determined by counting the characteristic X-ray from the copper wire. The calculated profiles well reproduced the measured profiles. Asamura et al., in the same laboratory, found an enhancement in transmission intensity of 2 MeV H+ ions through a tapered glass capillary with outlet diameter of 100 μm without an end window [38]. There was an air flow from the outlet to inside the capillary in their setup. When the capillary was filled with He gas, some components of the air were replaced with He atoms. Due to the less scattering by the He atoms, transmission intensity was observed to be enhanced depending on the input intensity.
Although the transmission characteristic for MeV ion beams has been mainly explained by Rutherford scattering, Nagy et al. at ATOMKI performed an experiment to try to observe the beam deflection by the charge-up potential, which is known for the transmission of keV ion beams [39]. The incident beam was a 1 MeV H+ with intensity ranging from 8 to 150 pA, which was focused down to 2 × 2 μm2 with a beam divergence of less than 0.3°. The focused beam entered a Teflon straight capillary, whose inlet diameter and length were 0.8 and 44.5 mm, respectively. After tilting the capillary by 1°, they found that the transmission efficiency increased from 25% to 90% as a function of time. The transmission at the beginning must have been due to Rutherford scattering. However, the increase in transmission intensity is similar to the delayed transmission for the keV-energy ion transmission. They also added data showing that the time until the saturation of the transmission seems to be inversely proportional to the incident beam current. The experiment was followed by a similar experiment with an image recording technique [40]. The Faraday cup in [39] was replaced with a fluorescent screen to visualize the beam position and obtain the brightness map in the profile related to the current density distribution. The beam spot on the screen was found to move from the lower bending position up to the highest bending position corresponding to 1.4° and stay finally at the highest bending position. The time evolution of the increase in the bending angle corresponding to the spot position is similar to the increase in the transmission efficiency reported in Reference [39]. The authors also described the focusing/defocusing phenomena extracted from a brightness analysis of the image data.

5. Applications of MeV Ion Microbeams

MeV ion beams have been utilized for sample analysis, surface modification, etc. There are a number of attempts to employ single tapered glass capillary optics for those purposes. In this section, applications of MeV ion microbeams produced by the capillaries are introduced.

5.1. Creation of Point-Like X-Ray Source

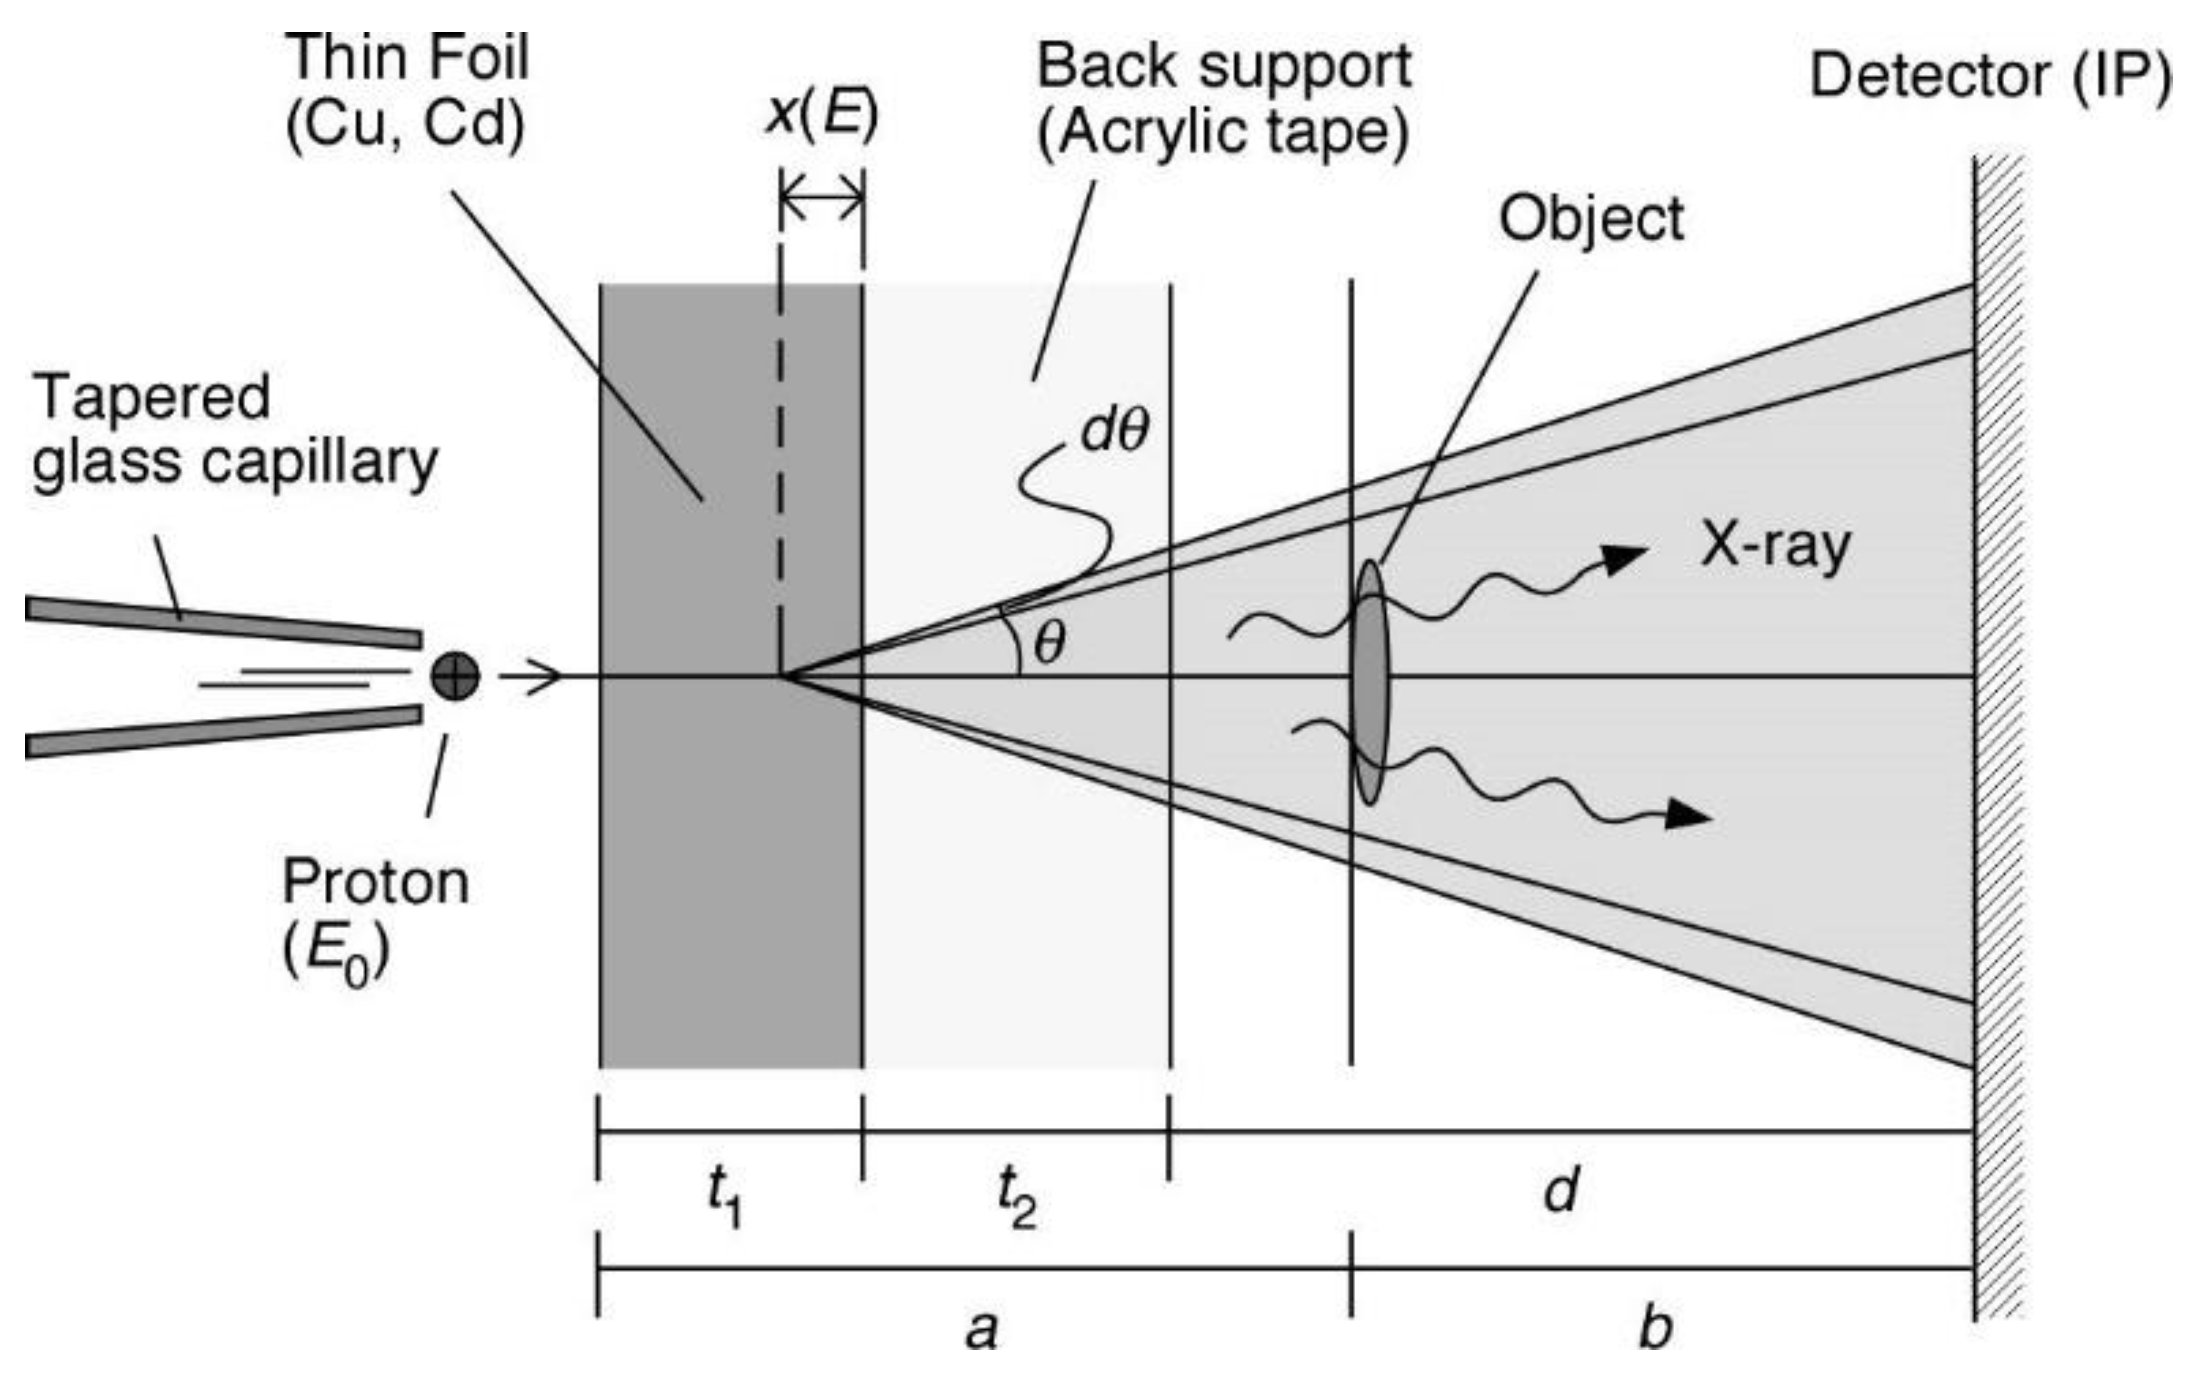
Hasegawa et al. (Tokyo Institute of Technology) examined the applicability of ion microbeams generated by a tapered glass capillary to high-contrast radiography based on proton-induced quasi-monochromatic X-rays [41]. A 2–3 MeV H+ beam was injected into a capillary whose inlet diameter was 0.8 mm and outlet diameter ranged 8–63 μm. Figure 14 shows the experimental setup to induce X-rays from a thin Cu or Cd foil (t1) placed 2–3 mm downstream of the capillary outlet. Back support was an acrylic tape of 65 μm in thickness against the atmospheric pressure. The tape worked also as a beam dumper. Proton-induced X-ray emission toward the backside of the foil was used in air for imaging. The detector was an imaging plate (IP). The spatial resolution of the IP was limited to 60 μm. They applied a magnified imaging technique to the observation of objects having micron-order scales, where the distances a and b were 1 and 9 mm, respectively, to obtain a magnification of 10. They demonstrated a magnified imaging using Cu K X-rays, where the capillary outlet diameter was 25 μm. A small object (a thin wire of 20 μm in thickness) was able to be recognized.

5.2. Micro-PIXE and Other Analysis Methods

Capillary microbeams have been used in material analysis such as PIXE, scanning transmission ion microscopy (STIM), nuclear reaction analysis (NRA), and time-of-flight secondary ion mass spectrometry (TOF-SIMS).
The first application to PIXE analysis was reported by Nebiki et al. (Kochi University of Technology) [42] in 2006. A 2 or 4 MeV He2+ ion beam with an intensity of 10 nA was injected to the glass capillaries with an inlet diameter of 0.8 mm and outlet diameters of 10–20 μm. The capillaries were not closed by an end window. The conductance of a 10 μm-outlet capillary for the air flow was roughly estimated to be in the order of 10−6 L/s, which was small enough to employ the differential pumping. They obtained in-air PIXE spectra for samples of GaInNAs, dried and wet seabed sludge with an output microbeam intensity of 200 pA. The same samples were measured in vacuum for comparison.
Hasegawa et al. also developed a micro-PIXE system in vacuum [43]. An input beam of 2 MeV H+ ions was injected into tapered glass capillaries whose inlet/outlet diameters were 0.8 mm/10–20 μm, respectively. Analyzing the micro-PIXE spectra for a mesh-structure sample, the microbeam profiles were examined and compared with simulated results. They revealed a spot size of approximately 20 μm on a target located 1 mm downstream of the capillary outlet. Although the outer region of the spot was expected to be from ions of the halo component, the ions had energy strong enough to induce X-rays from the target. They suggested the halo component is a source of the spot broadening, but plays an important role for the beam density enhancement. In the case of micro-PIXE measurement, the better position resolution is obtained for shorter distances between the capillary outlet and the sample.
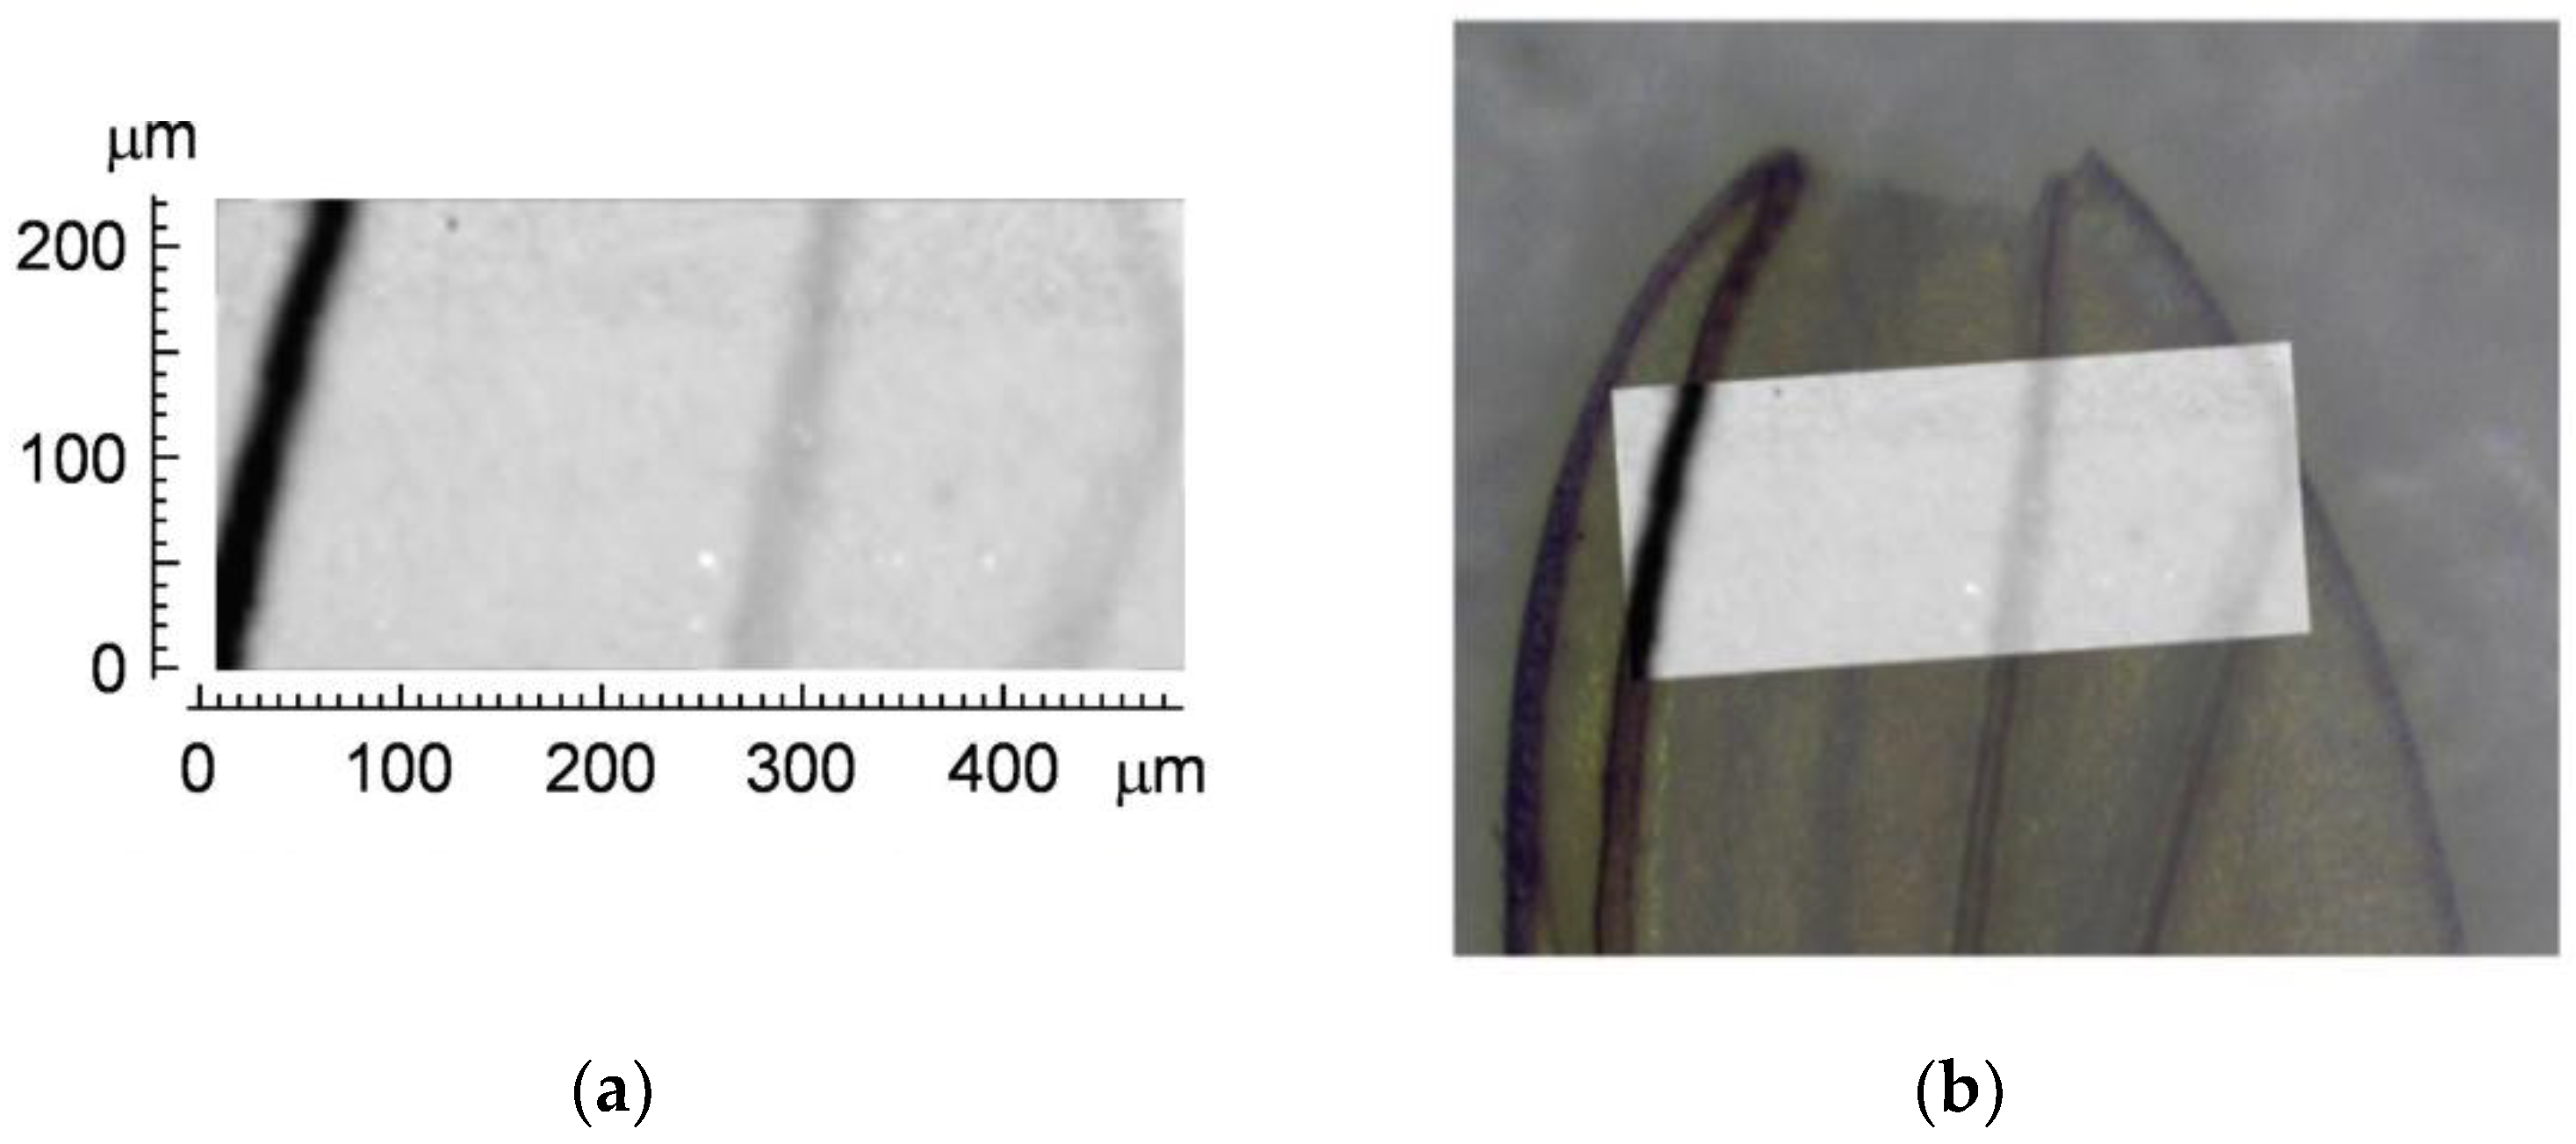
Singkarat et al. reported a micro-beam generator based on glass capillary optics at Chiang Mai University, Thailand, in 2017, and also applied micro-PIXE technology to plant vein samples [44]. It was found that the capillary microbeam normally had a relatively higher beam current due to a focusing effect compared with an aperture microbeam, e.g., at the same beam size of 100 μm, the microbeam from the capillary had a current of several nA whereas that from the aperture had approximately 1 nA for a 2 MeV H+ beam. The beam from the aperture created a more homogeneous beam spot, however, while that from the capillary had a halo component. Therefore, for high-quality lithography, the aperture microbeam was applied, while for fast but not very high-quality lithography, the capillary microbeam was applied. A 1D-PIXE mapping with a 150-μm step was performed for the leaf sample. The image was reconstructed for each element such as Al, S, Cl, K, Ca, Sc, and Fe.
Simon et al. at ETH presented an in-air STIM system as well as an in-air PIXE measurement in 2012 [45]. They used home-made capillaries which were conical-shaped with a constant taper angle of approximately 1°. Although the capillaries (<10 μmϕ) were installed in atmosphere without an end window, the vacuum level of the upstream beamline was maintained in the order of 10−4 Pa by a turbo molecular pump of 190 L/s. A PIN photodiode was used for the capillary alignment and replaced with gas ionization detector because the gas ionization detector has an energy resolution which is comparable to that of a silicon detector and is completely radiation hard, i.e., STIM measurements can be performed for hours at a few tens of kHz count rate on the same micron-sized spot on the detector window without the slightest loss of performance. Figure 15a,b shows the STIM image of a part of a mosquito wing produced with a 1 MeV H+ beam through a capillary with an outlet of 8 μmϕ. The raster size was 500 × 230 μm with a step size of 5 μm. The dwell time on each of the 100 × 47 pixels was approximately 1 s. The total acquisition time for a STIM frame was about 2 h. A spectrum of in-air PIXE for a bronze sample was also obtained, where a 2 MeV H+ microbeam of 25 pA was extracted from a capillary with an outlet diameter of 8 μm. The induced X-ray was detected by a silicon drift diode placed 10 mm from the sample.
Heavier MeV ion beams were also extracted by tapered capillaries. Brajković et al. reported a new TOF-SIMS setup utilizing 8 MeV Si4+ ions at the Ruđer Bošković Institute in Zagreb, Croatia, in 2019 [46]. The first spectra were obtained from the samples of thin Phthalocyanine blue (PB15:1, C32H16CuN8, m/q 576.1 Da) and leucine (C6H13NO2, m/q 131.2 Da) layers. The sample layers were evaporated on Si3N4 windows whose sizes were 1.5 × 1.5 mm and thickness was 100 nm. The capillary was fabricated at ETH, with inlet and outlet diameters of 0.86 mm and ~5 μm, respectively. The microbeam characteristics for various ion species and energies were described in detail.
Microbeam NRA for 3D-mapping of hydrogen distribution employing 6 MeV 15N2+ ions was performed by Sekiba et al. at University of Tokyo, Japan [47]. This method uses the emitted 4.43 MeV γ-ray due to the resonance nuclear reaction H 1 ( N 15 ,   α γ ) C 12 at 15N energy of 6.385 MeV. The γ-ray was detected by a BGO (Bi14Ge3O12) scintillator in this experiment. They displayed the results of the NRA measurements in vacuum and 103 Pa N2 atmosphere. The irradiated samples were thin Pd and Y layers because both Pd and Y films were expected to be hydrogenated when 105 Pa H2 was loaded onto the samples. The hydrogen concentrations in the two metals were 0.6~0.7 and ~3 atomic ratios for Pd and Y, respectively. The yield of the γ-ray from Pd–H and Y–H systems as a function of the beam energy was obtained with the 15N2+ microbeam from a capillary with an outlet of 100 μmϕ. The experimental data indicated that the resolution at the depth of tens of nm corresponded to ~6 nm for Pd and ~14 nm for Y layers. These values were considerably better than the typical depth resolution of ~70 nm at the surface in the elastic recoil detection analysis (ERDA) technique.

5.3. Fast Carbon Cluster and C60 Beams

In 2012, the transmission properties of fast cluster ions (Cn+ (n = 2–4) with velocities ranging from 0.89 to 1.79 in atomic unit (a.u.)) through a single tapered capillary with an outlet diameter of 13.7 μm were reported by Tsuchida et al. at Kyoto University, Japan [48]. It was found that the non-fragmented primary cluster fraction after the transmission clearly correlates with projectile velocity—the fraction increases with decreasing velocity. They also found that the transmitted cluster beams had a smaller beam divergence compared with atomic beams. This property is advantageous for realizing beam-implantation into desired irradiation areas. This cluster-microbeam method is applicable as a new probe for micro-ion-beam material analyses, including micro-SIMS or ion beam microfabrication.
In 2015, Nomura et al., also at Kyoto University, reported on the effects of the radical scavenger ascorbic acid on water radiolysis, where a tapered glass capillary with an outlet diameter of approximately 11 μm was used for the input 4.0 MeV C2+ microbeams [49]. A liquid target jet consisting of aqueous solutions of ascorbic acid was produced by effusion from a nozzle with an outlet diameter of 24 μm at a flow rate of 0.4 mL/min. The ion microbeam was irradiated accurately onto the jet target and secondary ions emitted from aqueous solutions of ascorbic acid of different concentrations were measured. By developing a model of the chemical equilibria in the solutions, the emission yield of H3O+ was estimated as a function of ascorbic acid concentration. The model calculation was in good agreement with the experimental results. For a similar experiment, the setup was used and reported in 2017 [50].
Tsuchida et al. applied the capillary microbeam generator for the C60 fullerene projectiles in the velocity range between 0.14 and 0.2 a.u. at the Japan Atomic Energy Agency (JAEA)/Takasaki (current name: the Takasaki Advanced Radiation Research Institute, National Institutes for Quantum and Radiological Science and Technology (QST)) [51]. The C60 transmission properties through two different types of capillaries were studied: (1) borosilicate glass capillary with an outlet diameter of 5.5 μm, and (2) multitude of capillaries in an Al2O3 foil with a pore size of about 70 nm and a high aspect ratio of about 750. They measured the transmitted particle composition. For the experiments with the single capillary, the main transmission component was found to be primary C60 beams that were focused in the area equal to the capillary outlet diameter. Minor components were charge-exchanged C60 ions and charged or neutral fragments (fullerene-like C60-2m and small Cn particles), and their fractions decreased with decreasing the projectile velocity. They concluded that the C60 transmission fraction was high for both types of the capillaries in the used velocity range.

5.4. Irradiation to Mammalian Cells

When a biological target in liquid solution needs to be irradiated by a few-MeV ions, their short range (1–100 μm in water) should be considered. A single tapered glass capillary with an end window can solve the problem of the short range in water because it is possible for the capillary outlet to closely approach the target in liquid.
In 2008, Iwai et al. at RIKEN reported a new cell surgery scheme involving selective inactivation or disruption of the cellular structure using a microbeam produced by a tapered glass capillary with an end window [52]. The end window made of glass for this experiment was 9.6 μm in diameter and 7.3 μm in thickness. The objects were HeLa cells (a standard cancer cell) provided by a biology team (Cellular Dynamics Lab.) at RIKEN and the irradiation was performed at Kochi University of Technology. The authors demonstrated a stopping power distribution in liquid scintillator followed by the cell irradiation. The target cells had nuclei labeled with histone H2B-GFP (green fluorescent protein). The GFP in the nuclei was damaged artificially by the bombardment of a 4 MeV He2+ microbeam, resulting in the partial bleaching of the GFP in the nuclei.
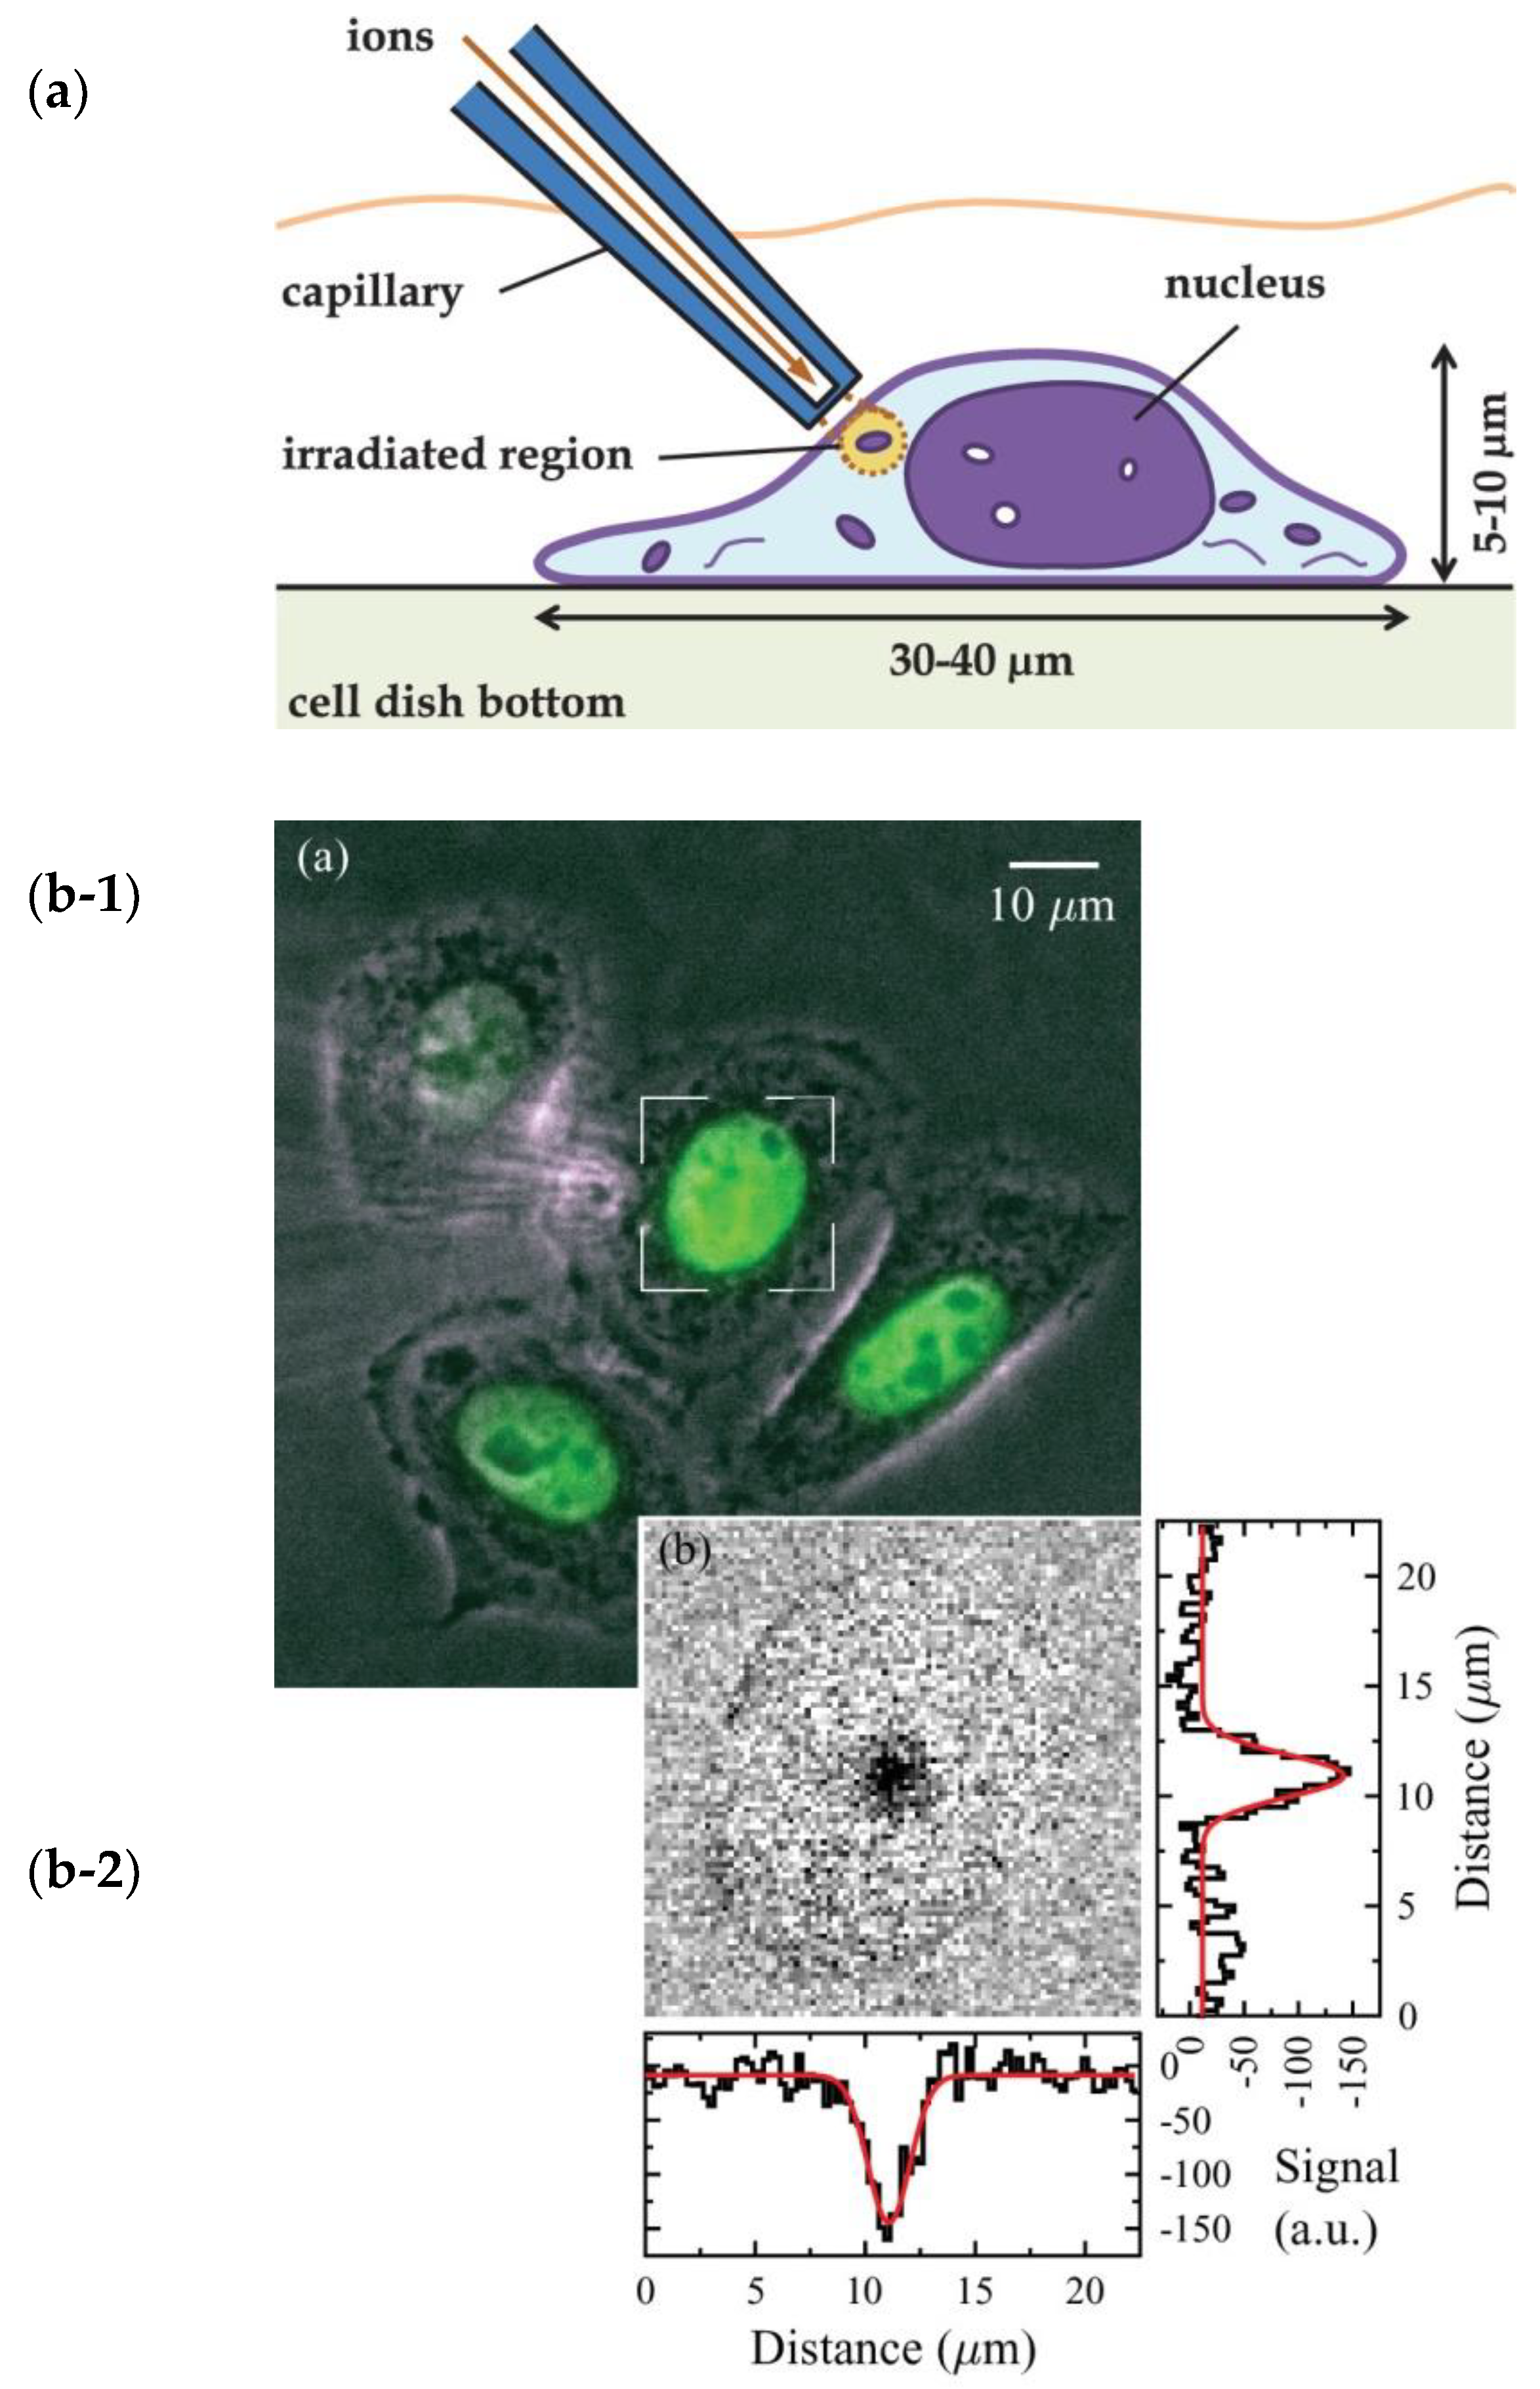
In 2014, an improved system for microbeam cell irradiation at RIKEN was reported by Mäckel et al. [53]. The capillary was connected to a beamline tilted vertically by 45°, which allowed for easy immersion of the extracted ions into a liquid environment within a standard cell culture dish. An inverted microscope was used for simultaneously observing the samples as well as the capillary tip, while a stage-top incubator provided an appropriate environment for the samples. Figure 16a is a schematic drawing of the irradiation setup. After passing through the polystyrene end window, the ions irradiated a selected μm3 volume of the cell. Prior to irradiation, the range of the ions in water was set by choosing the corresponding ion energy for pin-point damage.
Figure 16(b-1) is a merged phase contrast and fluorescence image, where HeLa cells together with the outlet of the capillary (left top) are seen. The capillary had an end window of 1.5 μm in thickness, and aimed at the center of the cell nucleus marked by the white square. Figure 16(b-2) shows a difference image prepared by subtracting the fluorescence images taken before and after irradiation of the nucleus by approximately 10,000 H+ ions of 1 MeV. The irradiated region is visible as a dark spot. The horizontal and vertical projections have a width of 2.3 μm, comparable with the inner diameter of the capillary outlet of 2.4 μm. Mäckel et al. also reported the development of the single proton counting method for dose estimation of the microbeam irradiation in 2015 [54].
Puttaraksa et al. at RIKEN reported an irradiation of fluorescent, ubiquitination-based cell cycle indicator (Fucci)-expressing HeLa cells with a 1 MeV H+ microbeam for examining the effect on the cell cycle after the bombarding [55]. By using the cells, the irradiation effect on the cell cycle can directly be observed through the fluorescent color changes. This enables real time, continuous, and non-destructive measurements of the delay in the cell cycle of each irradiated cell. They used capillaries whose end windows were ~4 μm in average thickness and ~6 μm in typical diameter. The distance between the capillary outlet and the irradiated cell was set to ~14 μm. In this case, 1 MeV H+ ions lose around ~480 keV in the polystyrene end window and the medium before reaching the cell. The change from red (G1 phase) to green (S, G2, and M phases) fluorescence in the cell cycle seemed not to be affected when the cells were irradiated with up to 10,000 ions. The cell irradiated with 100,000 ions died in red fluorescence at ~4 h after irradiation.

5.5. Artificial DNA Damage and Its Repair Process

The RIKEN microbeam facility was also used for observation of an ion track in a cell nucleus to estimate the damaged volume along the ion track. Figure 17a,b shows the cross-sectional and bottom views of a nucleus of an irradiated HeLa cell with a 3 MeV He2+ ion microbeam, which were reported by Ikeda et al. at RIKEN [56]. The capillary was installed with an angle of 45° as shown in Figure 16a, so that the extracted microbeam was going in the same direction. The diameter and thickness of the end window were 3 and 4 μm, respectively. The range of the ions was 12 μm in water or cells after the end window. The double strand breaks (DSB) as DNA damage due to the irradiation were fluorescent-labeled. The bright line with an angle of 45° within the nucleus in Figure 17a corresponds to the ion track. However, an irradiation with 3 MeV H+ ions did not generate any ion track, but rather, generated clouded regions [57].
Figure 17b is one of a set of 11 sliced photos taken by changing the z-position (height from the dish bottom). From the entire set, a 3D distribution of photo pixel brightness was mapped. After extraction of the 3D equation of the ion track, the ion track direction was transformed to the new z’-axis. Figure 17c–e are brightness distributions on new x’-y’ planes (thickness = 3 μm for each), Figure 17c shows the distribution of the highest brightness points (red circles: brightness = 70–90), where the orange region is the cross section of the ion track. The points are concentrated on the ion track. However, the second-highest points (green circles: brightness = 50–70, Figure 17d) and the middle-level points (blue circles: brightness = 30–50, Figure 17e) show the ring shape surrounding the ion track axis. If the brightness corresponds to the density of DNA damage, the brightness selection can be regarded as a selection of lateral dose. This analysis needs more experimental data.

5.6. Irradiation to Bacteria

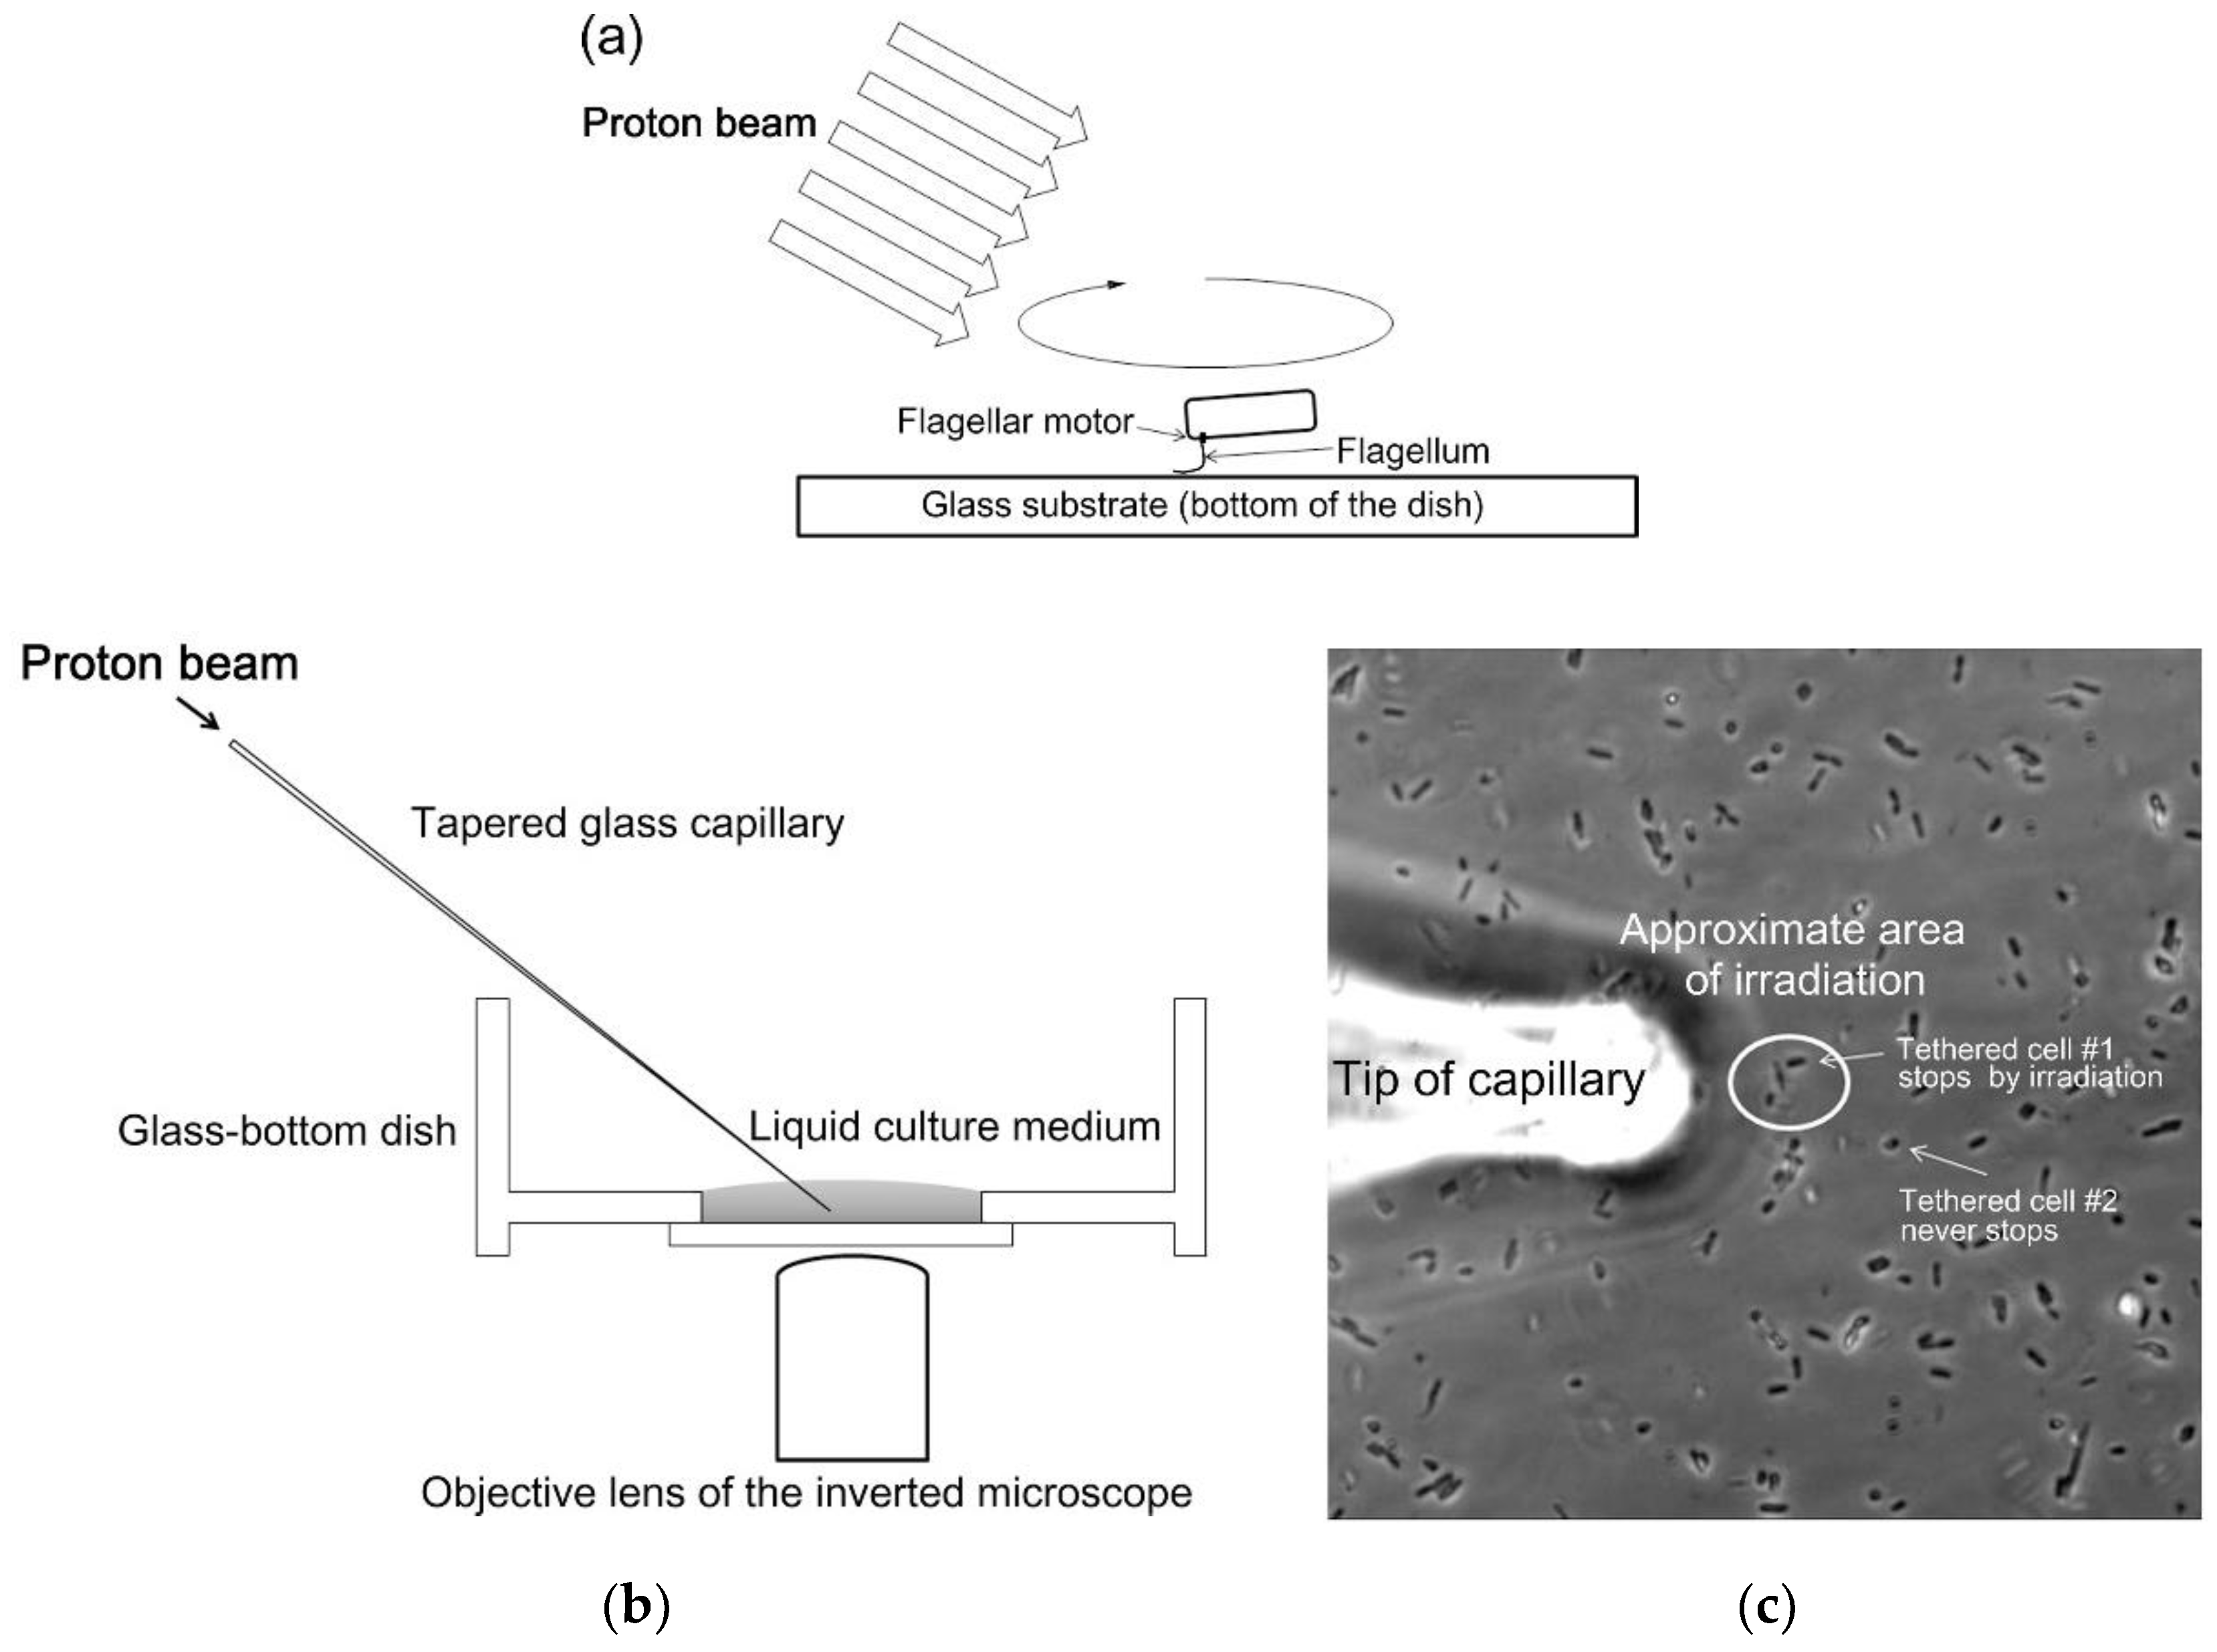
Kato et al. at Osaka Prefecture University, Japan, performed the irradiation of 2 MeV H+ microbeams to Escherichia coli cells in order to measure the minimum dose to stop the flagellar motor and to evaluate the effect on cell growth in real time [58]. The microbeam was provided at RIKEN utilizing a tapered glass capillary with an end window whose diameter and thickness were 11 and 10 μm, respectively. After most of the flagella were sheared, the cells were spread on a glass substrate (bottom of a dish). Some of the cells were tethered to the glass surface by a single flagellum, showing the rotation resulting from a single flagellar motor as shown in Figure 18a. The glass-bottom dish was placed on the microscope stage, and the microbeam was applied from an angle above via the glass capillary (Figure 18b). The dose of irradiation required to stop the flagellar motor was evaluated by monitoring several bacterial cells. A typical irradiation is shown in Figure 18c. The cells within the ellipse were irradiated and other cells in the microscope view were negative controls. The average ion fluence needed to stop the flagellar motor of the tethered cells was 2.0 × 10¹² H+/cm2. This corresponds to approximately 60 kGy, which is sufficient to kill virtually all living organisms. The results suggested a surprising robustness of the bacterial flagellar motor against the irradiation.

5.7. Surface Modification in Liquid

Kobayashi et al. at RIKEN reported the surface modification of polymers in liquid by 3 MeV H+ microbeams generated by a glass capillary whose outlet diameter was 200 μm [59]. The outlet was closed by a thin polyimide film with a thickness of 7 μm. The polymer samples were polyethylene (PE, [ CH 2 CH 2 ] n ) and polytetrafluoroethylene (PTFE, [ CF 2 CF 2 ] n ). The sample was irradiated in liquid of an aqueous acrylic acid (AAc, CH 2 CHCO 2 H ) solution in concentrations between 0 and 10 wt.%. The irradiation distance between the polyimide film and the sample surface was approximately 100 μm. The range in water after the polyimide film and the ion energy at the surface were calculated to be 140 μm and 1.3 MeV, respectively. A microbeam scan on the PE sample was performed at a speed of 2 μm/s with microbeam intensity in the order of 1 nA. It was found that the irradiated surfaces, which were originally hydrophobic, became hydrophilic due to the surface layer formed by the acrylic acid polymer. The authors concluded that the deposited layer was stable and showed good adhesion to the base polymer, thereby showing promise as a novel surface modification method.

6. Other Quantum Beams

The transmission experiments began with keV and MeV ions. In addition to the interest in the transmission mechanism, density enhancement (focusing effect), guiding effect, and microbeam generation draw attention in terms of practical use. In particular, density enhancement with tapered capillary optics or tapered shape optics (tapered “large” capillary) can be a new focusing scheme for quantum beams of poor emittance. In this section, the focusing of muons is introduced, and the cases of electrons, positrons, W+ ions, X-rays, and visible light are briefly summarized.
Kojima et al. at RIKEN reported on the density enhancement of muon beams with this method for the first time in 2007 [60]. They examined with single tapered glass tubes whose length, inlet, and outlet were 100–400 mm, 46 mmϕ, and 3–20 mmϕ, respectively, using positively and negatively charged muons at Port 2 of the RIKEN-RAL Muon Facility at Rutherford Appleton Laboratory, U.K. A pulsed 54 MeV/c muon beam transmitted through the capillary, and was detected by a photomultiplier tube (PMT) with a plastic scintillator. The output signals were averaged and compared to the output signals without the capillary. The ratio of the comparison corresponded to the focusing factor. It was found that the factor can be increased up to almost two for both positively and negatively charged muon beams. The results were well reproduced by Monte Carlo simulations, which also suggested the use of a heavy metal instead of glass for more density enhancement.
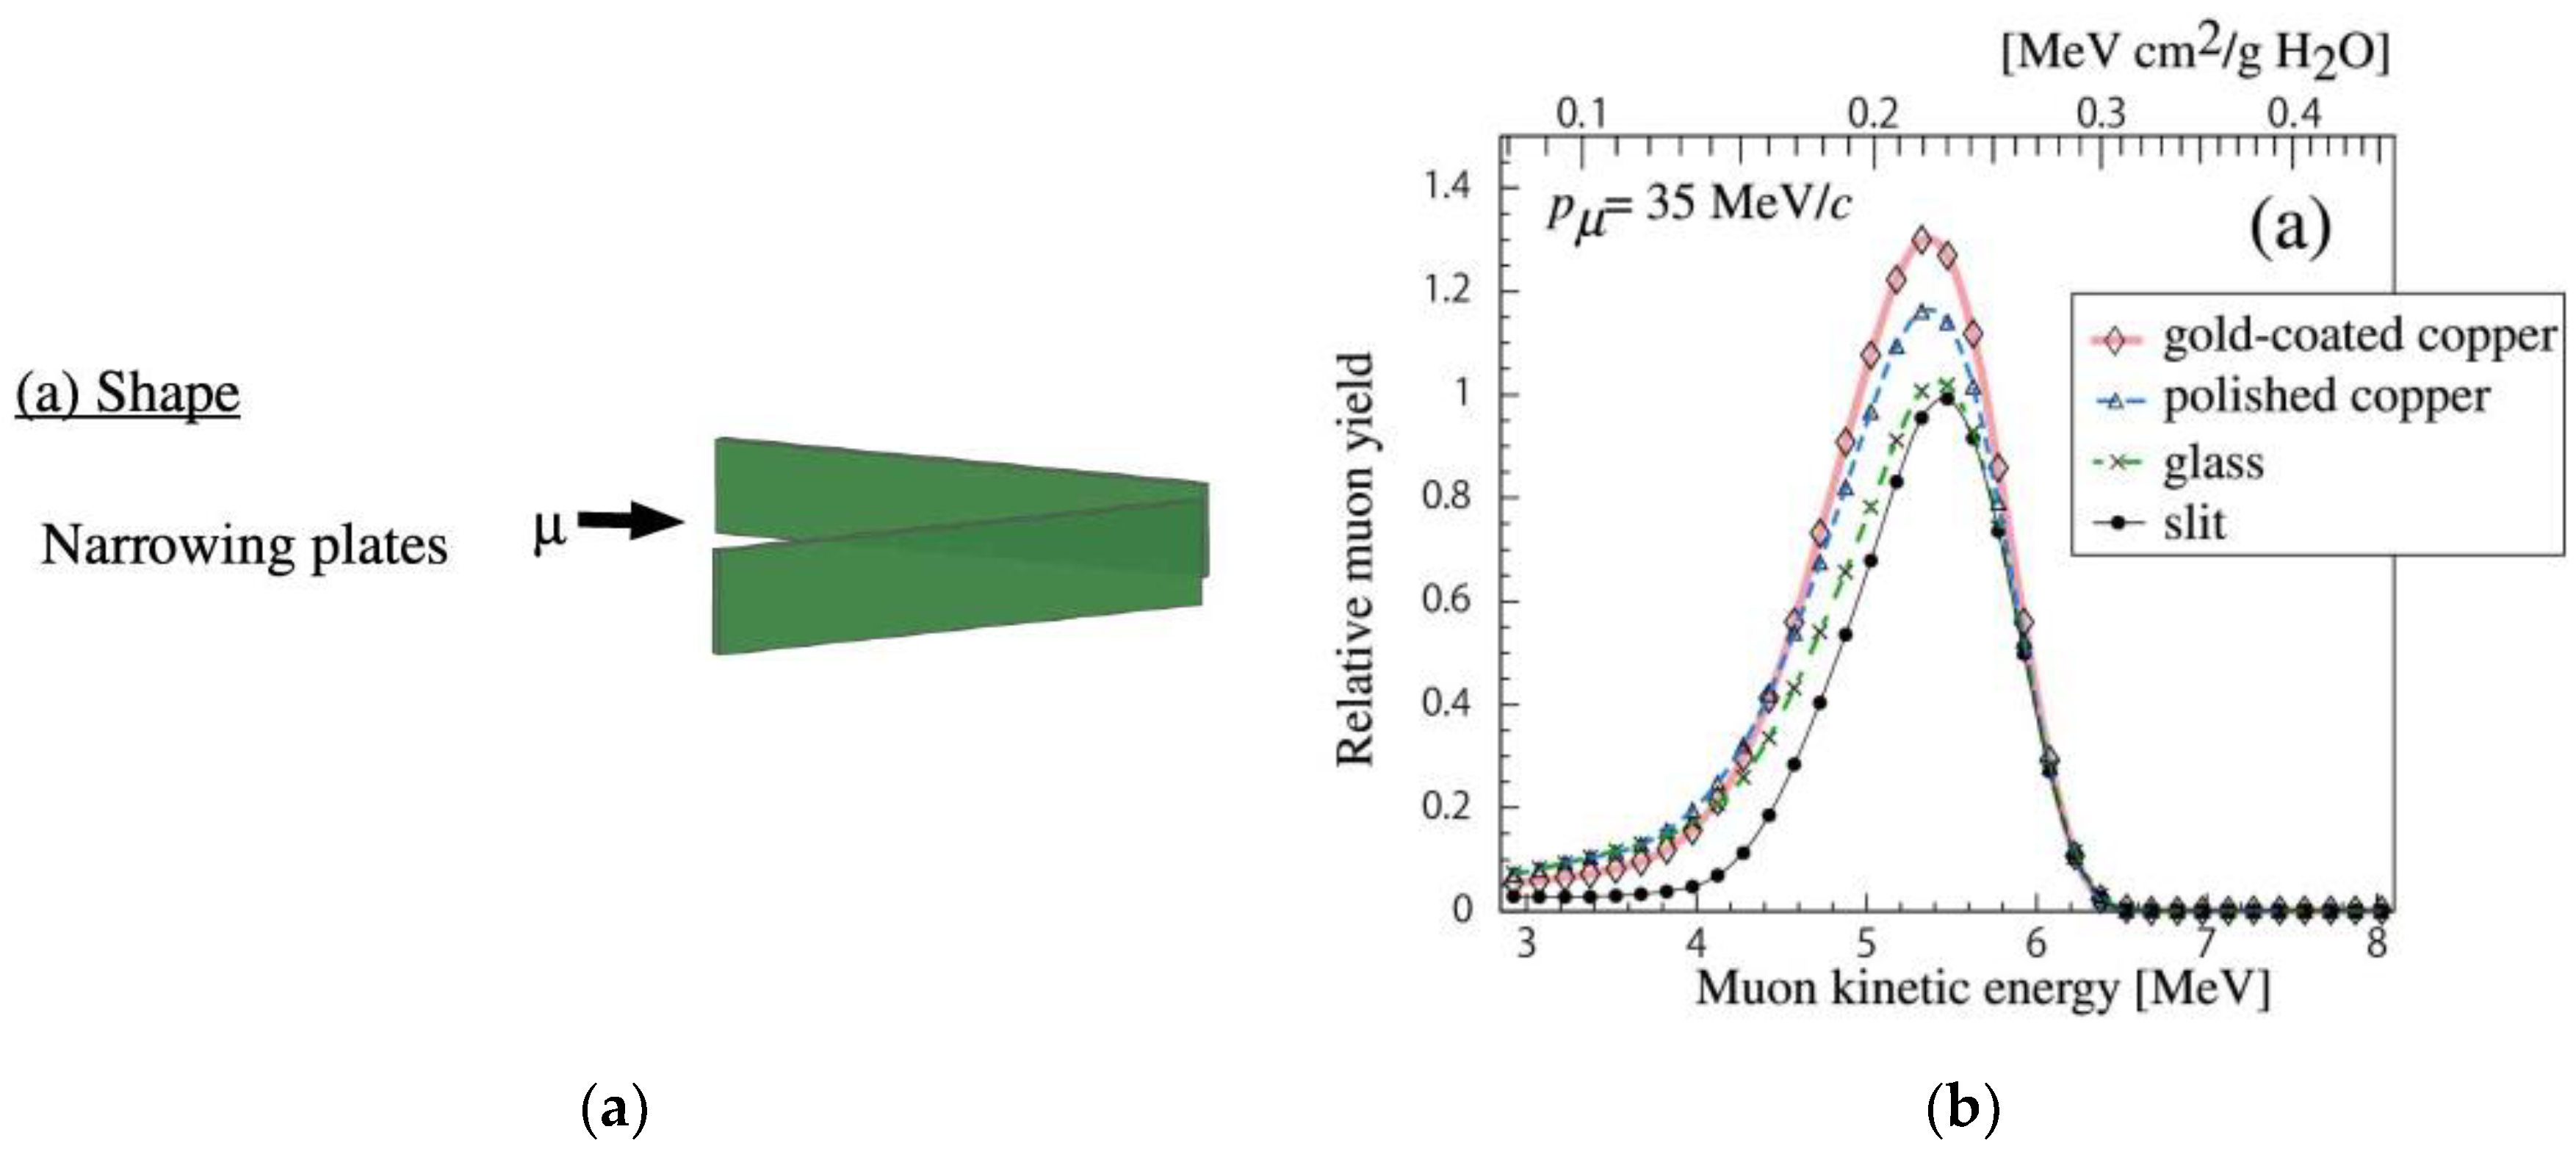
Tomono et al. at RIKEN reported on the next phase of muon focusing by capillaries [61]. As suggested by the simulation [60], they performed another experiment at TRIUMF, Canada, where a detailed particle-by-particle study was available. Positively charged muons of 30–45 MeV/c penetrated the start scintillation counter, entered a single tapered glass tube, and were detected by a surface barrier detector. The detector could stop muons with a momentum up to 51 MeV/c. Instead of a tapered glass tube, a pair of narrowing vertical plates and a trapezoid tube were tested. Figure 19a shows a pair of narrowing vertical plates whose material was glass or copper. In the case of copper, the plates had a gold-coated or polished surface. Figure 19b shows the energy distribution of the transmitted muons at an initial momentum of 35 MeV/c (corresponding kinetic energy is 5.6 MeV) when the gold-coated copper plates, polished copper plates, glass plates, and a corresponding slit were inserted. The corresponding slit represented the muon density without any plates. The energy spectra for all plates were normalized by the spectrum for the slit. The enhancement with the gold-coated copper plates was the largest and an enhancement factor of 1.3 was obtained. The second largest enhancement was observed by the polished copper plates. When a copper narrowing tube was installed, the enhancement was measured as up to 1.7. The measured divergence of the transmitted muon beams and the demonstration of a muon spin rotation and relaxation (μSR) experiment employing the focused muon beams were introduced in the report.
Electron transmission was examined by Wickramarachchi et al. at Western Michigan University, USA [62,63]. They used electron beams with energies of 512 and 1024 eV, which entered a capillary with inlet and outlet diameters of 0.8 mm and 100 μm, respectively, fabricated at RIKEN. An electrostatic parallel-plate analyzer coupled to a channel electron multiplier was used as the spectrometer to determine the energy and to count the number of transmitted electrons. They reported that the transmission was observed when the capillary was tilted by several degrees. The elastic and inelastic contribution to the electron transmission was discussed.
Vokhmyanina et al. at Belgorod State University, Russia, reported an electron transmission experiment for the energy of 10 keV [64]. The dimension of their single tapered capillary was 42 mm in length, with 1.11 ± 0.02 mm/57 ± 5 μm inlet/outlet diameters, respectively. They discussed unstable transmission and a guiding effect under tilting condition.
Positron beam guiding was also studied by Oshima et al. at the National Institute of Advanced Industrial Science and Technology (AIST), Japan [65]. They prepared a 10 keV positron beam with a divergence of 3 mrad. The beam entered a single straight glass tube whose inner diameter was 1.8 mm and length was 54 mm. The transmitted positrons were detected by micro channel plates (MCPs) with a phosphor screen. The positron profile on the phosphor screen was recorded by a charge-coupled device (CCD) camera. The profile of the transmitted positrons was still obtained when the straight tube was tilted by 43.6 mrad.
Mironov et al. at the Russian Academy of Sciences, Russia, demonstrated that a quartz tapered capillary with a 100 nm outlet was used for collimating a W+ ion beam [66]. The W+ ions were generated by an intense laser radiation to a tungsten sharp electrode mounted inside the capillary. They applied this technique to develop a new concept for scanning probe microscopy.
Focusing of photon beams was also tried using single tapered glass capillaries. Unlike ion beams, conventional focusing tools for visible light, UV, and X-ray are already available. However, focusing by single tapered glass capillary has some advantages. For example, capillary optics is relatively low cost even if a precise alignment system is included. Easy finding of the irradiation point is also good for users. The capillary outlet is usually close to the target, enabling the use of the smallest spot size because the generated microbeam has a divergence.
Wang et al. at Beijing Normal University, China, reported an application of a single tapered glass capillary to the focusing of X-rays generated by a commercially available X-ray source in 2019 [67]. They proposed a new type of capillary with a nested structure. The glass capillary was embedded in the outer glass tube to ensure the straightness and thickness of the tube wall. The X-ray source with a Cu anode was operated by a 23 kV electron beam of 0.15 mA. The X-ray was generated from an 8 μm spot at the Cu anode, entered a 30 mm long collimating tube with a diaphragm, and was then transmitted through the glass capillary. The output X-ray size was measured by a knife-edge method employing a Si drift X-ray detector. When the diaphragm size was 10 μm and the outlet of the capillary was 12.1 μm in diameter, the X-ray spot size was measured to be 9.1 μm at FWHM at 1.5 mm downstream from the capillary outlet corresponding to the focal point.
Jin et al. at Toho University reported the focusing of visible laser light with the wavelengths of 488 and 633 nm in 2015 [11]. They aimed at the development of a multi-quantum (laser + ions) microbeam through a glass capillary to realize a laser sight prior to ion microbeam irradiation. The laser microspot and the target point of the ion microbeam were almost the same size and at the same point. The capillaries fabricated in their laboratory had an inlet diameter of 1.8 mm and outlet diameters of 22–100 μm. The 488 and 633 nm light from an Ar+ laser and He-Ne laser sources, respectively, were used. The transmitted laser power was measured by a photodiode. The transmission efficiency defined as the ratio of the transmission power to that through a straight tube was obtained as 1–15% according to the outlet sizes and the wavelength. They developed an original simulation code including a measured map of the capillary shape. The simulation reproduced the transmission efficiency and predicted the better capillary shapes for more transmission. Koushima et al. in the same group developed an estimation method of the laser microspot size utilizing a 2 μm thick fluorescent screen [68].

7. Summary and Outlook

We reviewed the topic of quantum beam transmission through insulator capillary. The key words for keV ion beams are the delayed transmission, the focusing effect, the guiding effect, and microbeam production, which are based on a self-organized charge-up process. For MeV ion beams, the key words are the focusing effect, microbeam production, and applications of microbeam irradiation. The first three reports in Section 2.3, Section 2.4 and Section 2.5 describe how the observation of the above effects and the microbeam applications began. During the past decade, a great number of experimental and theoretical works to elucidate the transmission mechanisms have been reported. For a stable transmission of keV ions, the resistivity (or conductivity) of the insulator material plays an important role to maintain the charge balance on the surface. The shape of the capillary is also one of the indispensable points. Future experiments in the keV-energy region may require theoretical support. To obtain a good spatial resolution in MeV ion microbeam irradiation, the existence of a halo component should be considered.
In this review paper, the materials of the capillaries and the fabrication method of the tapered glass capillary are described for those who wish to apply a capillary microbeam. As shown in Section 5, for applications of MeV ion microbeams, several institutes with tandem accelerators have introduced material analysis using the capillary microbeam in recent years. Such an approach has the advantages of irradiation in liquid with close approach to the sample (less broadening beam), easy determination of the irradiation point under a microscope observation, and suppression of the cost of the apparatus. The focusing effect with a density enhancement factor between 1 and 2 (or more) is also helpful according to measurements, especially for long-term measurements. New applications employing capillary microbeams are expected.

Funding

The works performed in RIKEN were partially supported by JSPS KAKENHI Grant Numbers JP17654079, JP20510119, JP23656225, JP17H01071, and JP18H03892, and by the RIKEN Incentive Research Projects 2008 and 2015, and by Microbeam Project of RIKEN Nishina Center for Accelerator-Based Science 2013–2019.

Acknowledgments

The author greatly appreciates the valuable help from Yasunori Yamazaki, Yasuyuki Kanai, Takao M. Kojima, Tomohiro Kobayashi, Yoshio Iwai, Walter Meissl, Volkhard Mäckel, and Nitipon Puttaraksa, who were members of the Atomic Physics Laboratory at RIKEN; Tomoko Abe, Masako Izumi, and Tomonari Hirano, who are in the Ion Beam Breeding Team at RIKEN; Hiromi Sato and Manabu Hamagaki, of the Detector Team at RIKEN; and Wei-Guo Jin at Toho University.

Conflicts of Interest

The authors declare no conflict of interest.

References

  1. Ikeda, T.; Kanai, Y.; Kojima, T.M.; Iwai, Y.; Kambara, T.; Yamazaki, Y.; Hoshino, M.; Nebiki, T.; Narusawa, T. Production of a microbeam of slow highly charged ions with a tapered glass capillary. Appl. Phys. Lett. 2006, 89, 163502. [Google Scholar] [CrossRef] [Green Version]
  2. Stolterfoht, N.; Bremer, J.-H.; Hoffmann, V.; Hellhammer, R.; Fink, D.; Petrov, A.; Sulik, B. Transmission of 3 keV Ne7+ Ions through Nanocapillaries Etched in Polymer Foils: Evidence for Capillary Guiding. Phys. Rev. Lett. 2002, 88, 133201. [Google Scholar] [CrossRef]
  3. Nebiki, T.; Yamamoto, T.; Narusawa, T.; Breese, M.B.H.; Teo, E.J.; Watt, F. Focusing of MeV ion beams by means of tapered glass capillary optics. J. Vac. Sci. Technol. A 2003, 21, 1671–1674. [Google Scholar] [CrossRef] [Green Version]
  4. Japan Patent 5794501. Available online: https://www.j-platpat.inpit.go.jp/c1800/PU/JP-2011-161568/8388596826FC4AD129975A2873E22DC6AF17AEA7FF2E74738C1A523FBC1E9763/10/en (accessed on 22 May 2020).
  5. Lemell, C.; Burgdörfer, J.; Aumayr, F. Interaction of charged particles with insulating capillary targets—The guiding effect. Prog. Surf. Sci. 2013, 88, 237–278. [Google Scholar] [CrossRef]
  6. Stolterfoht, N.; Yamazaki, Y. Guiding of charged particles through capillaries in insulating materials. Phys. Rep. 2016, 629, 1–107. [Google Scholar] [CrossRef]
  7. Kojima, T.M. Ion guiding in macro-size insulating capillaries: Straight, tapered, and curved shapes. J. Phys. B At. Mol. Opt. Phys. 2018, 51, 042001. [Google Scholar] [CrossRef]
  8. Stolterfoht, N.; Hellhammer, R.; Bundesmann, J.; Fink, D.; Kanai, Y.; Hoshino, M.; Kambara, T.; Ikeda, T.; Yamazaki, Y. Guiding of slow Ne7+ ions through nanocapillaries in insulating polyethylene terephthalate: Incident current dependence. Phys. Rev. A 2007, 76, 022712. [Google Scholar] [CrossRef]
  9. Zhang, Q.H.; Skog, P.; Schuch, R. Guiding of slow highly charged ions through insulating nano-capillaries. J. Phys. Conf. Ser. 2009, 163, 012092. [Google Scholar]
  10. Ikeda, T.; Kanai, Y.; Iwai, Y.; Kojima, T.M.; Maeshima, K.; Meissl, W.; Kobayashi, T.; Nebiki, T.; Miyamoto, S.; Pokhil, G.P.; et al. Glass capillary optics for producing nanometer sized beams and its applications. Surf. Coat. Technol. 2011, 206, 859–863. [Google Scholar] [CrossRef]
  11. Jin, W.-G.; Minowa, T.; Ikeda, T. Transmission of Laser Beam Through Tapered Glass Capillaries for Light Microbeams. J. Phys. Soc. Jpn. 2015, 84, 114301. [Google Scholar] [CrossRef]
  12. Bereczky, R.J.; Kowarik, G.; Aumayr, F.; Tőkési, K. Transmission of 4.5 keV Ar9+ ions through a single glass macro-capillary. Nucl. Instrum. Methods B 2009, 267, 317–320. [Google Scholar] [CrossRef]
  13. Kowarik, G.; Bereczky, R.J.; Aumayr, F.; Tőkési, K. Production of a microbeam of slow highly charged ions with a single microscopic glass capillary. Nucl. Instrum. Methods B 2009, 267, 2277–2279. [Google Scholar] [CrossRef]
  14. Kojima, T.M.; Ikeda, T.; Kanai, Y.; Yamazaki, Y.; Esaulov, V.A. Ion beam guiding with straight and curved Teflon tubes. J. Phys. D 2011, 44, 355201. [Google Scholar] [CrossRef]
  15. Zhou, C.L.; Simon, M.; Ikeda, T.; Guillous, S.; Iskandar, W.; Méry, A.; Rangama, J.; Lebius, H.; Benyagoub, A.; Grygiel, C.; et al. Transmission of slow highly charged ions through glass capillaries: Role of the capillary shape. Phys. Rev. A 2013, 88, 050901. [Google Scholar] [CrossRef]
  16. Narishige Group. Available online: https://narishige-group.com/ (accessed on 22 May 2020).
  17. Ikeda, T.; Meissl, W.; Meissl, E.; Kojima, T.M.; Kobayashi, T.; Yamazaki, Y. Development of a dose evaluation method for cell irradiation using glass capillaries with end-windows. J. Phys. Conf. Ser. 2012, 388, 142028. [Google Scholar] [CrossRef]
  18. Schweigler, T.; Lemell, C.; Burgdörfer, J. Simulation of transmission of slow highly charged ions through insulating tapered macro-capillaries. Nucl. Instrum. Methods B 2011, 269, 1253–1256. [Google Scholar] [CrossRef]
  19. Cassimi, A.; Ikeda, T.; Maunoury, L.; Zhou, C.L.; Guillous, S.; Mery, A.; Lebius, H.; Benyagoub, A.; Grygiel, C.; Khemliche, H.; et al. Dynamics of charge evolution in glass capillaries for 230-keV Xe23+ ions. Phys. Rev. A 2012, 86, 062902. [Google Scholar] [CrossRef]
  20. Giglio, E.; DuBois, R.D.; Cassimi, A.; Tőkési, K. Low energy ion transmission through a conical insulating capillary with macroscopic dimensions. Nucl. Instrum. Methods B 2015, 354, 82–85. [Google Scholar] [CrossRef]
  21. Giglio, E.; Guillous, S.; Cassimi, A.; Zhang, H.Q.; Nagy, G.U.L.; Tőkési, K. Evolution of the electric potential of an insulator under charged particle impact. Phys. Rev. A 2017, 95, 030702. [Google Scholar] [CrossRef]
  22. Giglio, E.; Guillous, S.; Cassimi, A. Ion-beam focusing by self-organized axis-symmetric potentials in insulating capillaries. Phys. Rev. A 2018, 98, 052704. [Google Scholar] [CrossRef]
  23. Giglio, E.; Tőkési, K.; DuBois, R.D. Relaxation dynamics of charge patches formed inside an insulating capillary by ion impact. Nucl. Instrum. Methods B 2019, 460, 234–239. [Google Scholar] [CrossRef]
  24. Chen, J.; Xue, Y.; Liu, J.; Wu, Y.; Ruan, F.; Wang, W.; Yu, D.; Cai, X. Focusing of 90 keV O6+ ions through a single tapered glass macrocapillary. Nucl. Instrum. Methods B 2012, 281, 26–29. [Google Scholar] [CrossRef]
  25. Bereczky, R.J.; Kowarik, G.; Tőkési, K.; Aumayr, F. Sample holder for studying temperature dependent particle guiding. Nucl. Instrum. Methods B 2012, 279, 182–185. [Google Scholar] [CrossRef]
  26. Gruber, E.; Kowarik, G.; Ladinig, F.; Waclawek, J.P.; Schrempf, D.; Aumayr, F.; Bereczky, R.J.; Tőkési, K.; Gunacker, P.; Schweigler, T.; et al. Temperature control of ion guiding through insulating capillaries. Phys. Rev. A 2012, 86, 062901. [Google Scholar] [CrossRef] [Green Version]
  27. Kulkarni, D.D.; Lyle, L.A.M.; Sosolik, C.E. Ion transport through macrocapillaries—Oscillations due to charge patch formation. Nucl. Instrum. Methods B 2016, 382, 54–59. [Google Scholar] [CrossRef] [Green Version]
  28. Maurya, S.K.; Barman, S.; Paul, S.; Bhattacharjee, S. Charge dissipation and self focusing limit in high current density ion beam transport through a micro glass capillary. J. Phys. D 2019, 52, 055205. [Google Scholar] [CrossRef]
  29. Ikeda, T.; Iwai, Y.; Kojima, T.M.; Onoda, S.; Kanai, Y.; Yamazaki, Y. Resistive switching induced on a glass plate by ion beam irradiation. Nucl. Instrum. Methods B 2012, 287, 31–34. [Google Scholar] [CrossRef]
  30. Ikeda, T.; Kojima, T.M.; Natsume, Y.; Kimura, J.; Abe, T. Stable transmission of slow highly charged ions through tapered glass capillary with active discharging method for sub-micron sized beams. Appl. Phys. Lett. 2016, 109, 133501. [Google Scholar] [CrossRef] [Green Version]
  31. Pan, P.; Niu, S.T.; Song, H.Y.; Chen, X.M.; Qiu, X.Y.; Shao, J.X. Transmission of keV O ions through a single tapered glass capillary. Nucl. Instrum. Methods B 2019, 450, 332–336. [Google Scholar] [CrossRef]
  32. Hasegawa, J.; Jaiyen, S.; Polee, C.; Chankow, N.; Oguri, Y. Transport mechanism of MeV protons in tapered glass capillaries. J. Appl. Phys. 2011, 110, 044913. [Google Scholar] [CrossRef]
  33. Hespeels, F.; Tonneau, R.; Ikeda, T.; Lucas, S. Comparison of experimental and Monte-Carlo simulation of MeV particle transport through tapered/straight glass capillaries and circular collimators. Nucl. Instrum. Methods B 2015, 362, 72–79. [Google Scholar] [CrossRef]
  34. Simon, M.J.; Zhou, C.L.; Döbeli, M.; Cassimi, A.; Monnet, I.; Méry, A.; Grygiel, C.; Guillous, S.; Madi, T.; Benyagoub, A.; et al. Measurements and 3D Monte Carlo simulation of MeV ion transmission through conical glass capillaries. Nucl. Instrum. Methods B 2014, 330, 11–17. [Google Scholar] [CrossRef]
  35. Ikeda, T.; Ikekame, M.; Hikima, Y.; Mori, M.; Kawamura, S.; Minowa, T.; Jin, W.-G. Profile measurements of MeV ion microbeams in atmosphere extracted from single tapered glass capillaries with an end window. Nucl. Instrum. Methods B 2020, 470, 42–47. [Google Scholar] [CrossRef]
  36. Fujita, N.; Ishii, K.; Ogawa, H. Transmission properties of glass capillaries for MeV proton and alpha particles. Phys. Scr. 2011, T144, 014033. [Google Scholar] [CrossRef]
  37. Fujita, N.; Yamaki, A.; Ishii, K.; Ogawa, H. Measurements of an ion beam diameter extracted into air through a glass capillary. Nucl. Instrum. Methods B 2013, 315, 332–335. [Google Scholar] [CrossRef]
  38. Asamura, M.; Fukunaga, Y.; Ishii, K.; Ogawa, H. Inlet MeV ion beam dependence of transmission property for a glass capillary filled with He gas. Nucl. Instrum. Methods B 2019, 460, 220–223. [Google Scholar] [CrossRef]
  39. Nagy, G.U.L.; Rajta, I.; Bereczky, R.J.; Tőkési, K. Incident beam intensity dependence of the charge-up process of the guiding of 1 MeV proton microbeam through a Teflon microcapillary. Eur. Phys. J. D 2015, 69, 102. [Google Scholar] [CrossRef]
  40. Nagy, G.U.L.; Giglio, E.; Rajta, I.; Tőkési, K. Transmission dynamics of 1 MeV H+ microbeam guided through an insulating macrocapillary. Nucl. Instrum. Methods B 2019, 460, 216–219. [Google Scholar] [CrossRef]
  41. Hasegawa, J.; Shiba, S.; Fukuda, H.; Oguri, Y. A compact micro-beam system using a tapered glass capillary for proton-induced X-ray radiography. Nucl. Instrum. Methods B 2008, 266, 2125–2129. [Google Scholar] [CrossRef]
  42. Nebiki, T.; Kabir, M.H.; Narusawa, T. In-air PIXE analysis by means of glass capillary optics. Nucl. Instrum. Methods B 2006, 249, 226–229. [Google Scholar] [CrossRef] [Green Version]
  43. Hasegawa, J.; Jaiyen, S.; Polee, C.; Oguri, Y. Development of a micro-PIXE system using tapered glass capillary optics. Nucl. Instrum. Methods B 2011, 269, 3087–3090. [Google Scholar] [CrossRef]
  44. Singkarat, S.; Puttaraksa, N.; Unai, S.; Yu, L.D.; Singkarat, K.; Pussadee, N.; Whitlow, H.J.; Natyanum, S.; Tippawan, U. Development of economic MeV-ion microbeam technology at Chiang Mai University. Nucl. Instrum. Methods B 2017, 404, 58–64. [Google Scholar] [CrossRef]
  45. Simon, M.J.; Döbeli, M.; Müller, A.M.; Synal, H.-A. In-air STIM with a capillary microprobe. Nucl. Instrum. Methods B 2012, 273, 237–240. [Google Scholar] [CrossRef]
  46. Brajković, M.; Barac, M.; Cosic, D.; Bogdanović Radović, I.; Siketić, Z. Development of MeV TOF-SIMS capillary microprobe at the Ruđer Bošković Institute in Zagreb. Nucl. Instrum. Methods B 2019, 461, 237–242. [Google Scholar] [CrossRef]
  47. Sekiba, D.; Yonemura, H.; Nebiki, T.; Wilde, M.; Ogura, S.; Yamashita, H.; Matsumoto, M.; Kasagi, J.; Iwamura, Y.; Itoh, T.; et al. Development of micro-beam NRA for 3D-mapping of hydrogen distribution in solids: Application of tapered glass capillary to 6 MeV 15N ion. Nucl. Instrum. Methods B 2008, 266, 4027–4036. [Google Scholar] [CrossRef]
  48. Tsuchida, H.; Tomita, S.; Nishimura, K.; Murakoshi, R.; Naitoh, M.; Sasa, K.; Ishii, S.; Yogo, A.; Itoh, A. Properties of fast carbon cluster microbeams produced with a tapered capillary. Nucl. Instrum. Methods B 2012, 293, 6–10. [Google Scholar] [CrossRef] [Green Version]
  49. Nomura, S.; Tsuchida, H.; Furuya, R.; Miyahara, K.; Majima, T.; Itoh, A. Effects of radical scavengers on aqueous solutions exposed to heavy-ion irradiation using the liquid microjet technique. Nucl. Instrum. Methods B 2015, 365, 611–615. [Google Scholar] [CrossRef] [Green Version]
  50. Nomura, S.; Tsuchida, H.; Kajiwara, A.; Yoshida, S.; Majima, T.; Saito, M. Dissociation of biomolecules in liquid environments during fast heavy-ion irradiation. J. Chem. Phys. 2017, 147, 225103. [Google Scholar] [CrossRef]
  51. Tsuchida, H.; Majima, T.; Tomita, S.; Sasa, K.; Narumi, K.; Saitoh, Y.; Chiba, A.; Yamada, K.; Hirata, K.; Shibata, H.; et al. Transmission properties of C60 ions through micro- and nano-capillaries. Nucl. Instrum. Methods B 2013, 315, 336–340. [Google Scholar] [CrossRef]
  52. Iwai, Y.; Ikeda, T.; Kojima, T.M.; Yamazaki, Y.; Maeshima, K.; Imamoto, N.; Kobayashi, T.; Nebiki, T.; Narusawa, T.; Pokhil, G.P. Ion irradiation in liquid of μm3 region for cell surgery. Appl. Phys. Lett. 2008, 92, 023509. [Google Scholar] [CrossRef] [Green Version]
  53. Mäckel, V.; Meissl, W.; Ikeda, T.; Clever, M.; Meissl, E.; Kobayashi, T.; Kojima, T.M.; Imamoto, N.; Ogiwara, K.; Yamazaki, Y. A novel facility for 3D micro-irradiation of living cells in a controlled environment by MeV ions. Rev. Sci. Instrum. 2014, 85, 014302. [Google Scholar] [CrossRef] [PubMed]
  54. Mäckel, V.; Puttaraksa, N.; Kobayashi, T.; Yamazaki, Y. Single proton counting at the RIKEN cell irradiation facility. Rev. Sci. Instrum. 2015, 86, 085103. [Google Scholar] [CrossRef]
  55. Puttaraksa, N.; Mäckel, V.; Kobayashi, T.; Kojima, T.M.; Hamagaki, M.; Imamoto, N.; Yamazaki, Y. Irradiation of Fucci-expressing HeLa cells using a tapered glass capillary microbeam. Nucl. Instrum. Methods B 2015, 348, 127–130. [Google Scholar] [CrossRef]
  56. Ikeda, T.; Izumi, M.; Mäckel, V.; Kobayashi, T.; Bereczky, R.J.; Hirano, T.; Yamazaki, Y.; Abe, T. Ion track observation in cell nucleus irradiated by 3 MeV He ion microbeams produced with glass capillaries. RIKEN Accel. Prog. Rept. 2015, 48, 315. Available online: http://www.nishina.riken.jp/researcher/APR/APR048/pdf/315.pdf (accessed on 22 May 2020).
  57. Ikeda, T.; Izumi, M.; Mäckel, V.; Kobayashi, T.; Ogiwara, K.; Hirano, T.; Yamazaki, Y.; Abe, T. Observation of unrepairable lesions at DNA by using 3-MeV proton microbeams produced by glass capillaries. RIKEN Accel. Prog. Rept. 2014, 47, 282. Available online: http://www.nishina.riken.jp/researcher/APR/APR047/pdf/282.pdf (accessed on 22 May 2020).
  58. Kato, M.; Meissl, W.; Umezawa, K.; Ikeda, T.; Yamazaki, Y. Real-time observation of Escherichia coli cells under irradiation with a 2-MeV H+ microbeam. Appl. Phys. Lett. 2012, 100, 193702. [Google Scholar] [CrossRef]
  59. Kobayashi, T.; Miyamoto, S.; Ikeda, T.; Kojima, T.M.; Ogiwara, K.; Yamazaki, Y. Surface modification of polymers by ion irradiation at the solid–liquid interface. Nucl. Instrum. Methods B 2012, 272, 405–408. [Google Scholar] [CrossRef]
  60. Kojima, T.M.; Tomono, D.; Ikeda, T.; Ishida, K.; Iwai, Y.; Iwasaki, M.; Matsuda, Y.; Matsuzaki, T.; Yamazaki, Y. Density Enhancement of Muon Beams with Tapered Glass Tubes. J. Phys. Soc. Jpn. 2007, 76, 093501. [Google Scholar] [CrossRef] [Green Version]
  61. Tomono, D.; Kojima, T.M.; Ishida, K.; Ikeda, T.; Iwai, Y.; Tokuda, M.; Kanazawa, Y.; Matsuda, Y.; Matsuzaki, T.; Iwasaki, M.; et al. Focusing Effect of MeV Muon Beam with a Tapered Capillary Method. J. Phys. Soc. Jpn. 2011, 80, 044501. [Google Scholar] [CrossRef]
  62. Wickramarachchi, S.J.; Ikeda, T.; Dassanayake, B.S.; Keerthisinghe, D.; Tanis, J.A. Incident energy and charge deposition dependences of electron transmission through a microsized tapered glass capillary. Nucl. Instrum. Methods B 2016, 382, 60–66. [Google Scholar] [CrossRef]
  63. Wickramarachchi, S.J.; Ikeda, T.; Dassanayake, B.S.; Keerthisinghe, D.; Tanis, J.A. Electron-beam transmission through a micrometer-sized tapered-glass capillary: Dependence on incident energy and angular tilt angle. Phys. Rev. A 2016, 94, 022701. [Google Scholar] [CrossRef]
  64. Vokhmyanina, K.A.; Pokhil, G.P.; Zhukova, P.N.; Irribarra, E.; Kubankin, A.S.; Levina, V.S.; Nazhmudinov, R.M.; Oleinik, A.N.; Kishin, I.A. Guiding of a beam of 10keV electrons by micro size tapered glass capillary. Nucl. Instrum. Methods B 2015, 355, 307–310. [Google Scholar] [CrossRef]
  65. Oshima, N.; Iwai, Y.; Kojima, T.M.; Ikeda, T.; Kanazawa, Y.; Hoshino, M.; Suzuki, R.; Yamazaki, Y. Guiding of a Slow Positron Beam with a Glass Capillary. Mater. Sci. Forum 2009, 607, 263–265. [Google Scholar] [CrossRef] [Green Version]
  66. Mironov, B.N.; Aseyev, S.A.; Chekalin, S.V. Ion transmission through a dielectric hollow tip for scanning probe microscopy. Micron 2019, 116, 61–65. [Google Scholar] [CrossRef] [PubMed]
  67. Wang, X.; Li, Y.; Luo, H.; Ye, L.; Zhou, M.; Duan, J.; Lin, X. Study on the manufacturing process and transmission performance of a nested tapered single capillary X-ray lens. Nucl. Instrum. Methods A 2019, 947, 162762. [Google Scholar] [CrossRef]
  68. Koushima, M.; Ikeda, T.; Matsubara, M.; Masuyama, T.; Minowa, T.; Jin, W.-G. Development of laser target sight-on system based on multiple transmission through a tapered glass capillary for ion microbeam irradiation. J. Phys. Conf. Ser. 2017, 875, 112004. [Google Scholar] [CrossRef] [Green Version]
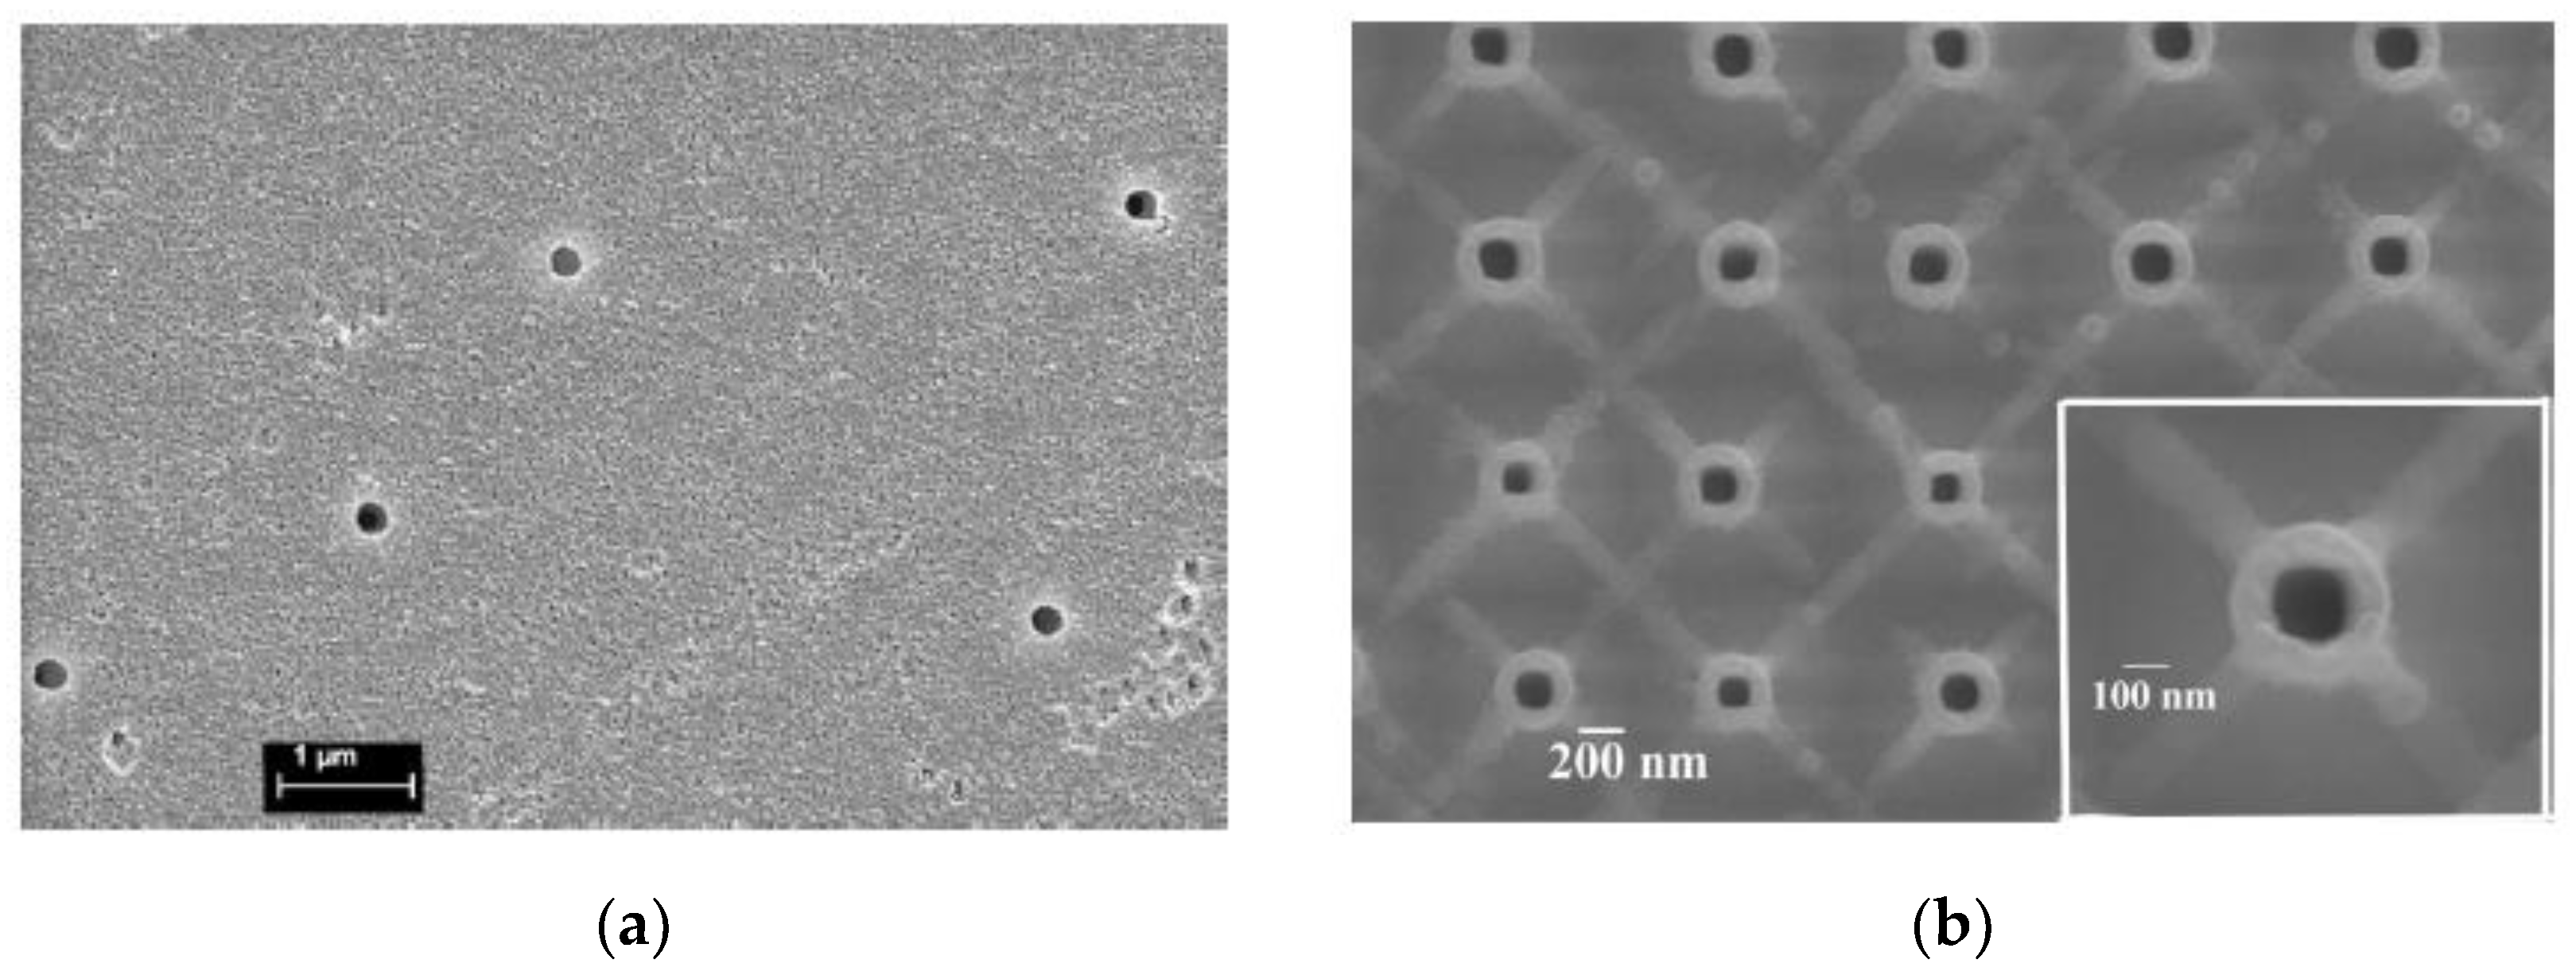
Figure 1. Examples of various capillaries in insulator foils: (a) a polyethylene terephthalate (PET) foil with capillaries whose diameter was 200 nm and density was 4 × 106 cm−2 (reprinted figure with permission from [8] Copyright 2007 by the American Physical Society) and (b) well-aligned capillaries in a SiO2 membrane with a thickness of 25 μm [9]. The 100 nm diameter capillaries were 1.4 μm apart from each other (from [9], Copyright 2011, with permission from Elsevier).
Qubs 04 00022 g001
Figure 2. Photos of single tapered glass capillary optics: (a) whole glass capillary; (b) beam inlet; (c) outlet of the smallest level; and (d,e) outlet after cutting (from [10], Copyright 2011, with permission from Elsevier).
Qubs 04 00022 g002
Figure 3. The transmission mechanism for: (a) kV accelerated ions and (b) MV accelerated ions.
Qubs 04 00022 g003
Figure 4. (a) Time evolution of normalized transmission intensity of 3 keV Ne7+ ions through PET capillaries (reprinted figure with permission from [2] Copyright 2002 by the American Physical Society); (b) the transmitted beam profiles according to the tilting angles (reprinted figure with permission from [2] Copyright 2002 by the American Physical Society).
Qubs 04 00022 g004
Figure 5. (a) Schematics of the experimental arrangement (reprinted with permission from [3]. Copyright 2003, American Vacuum Society) and (b) energy spectrum of the transmitted ions measured by surface barrier detector (SBD) (reprinted with permission from [3]. Copyright 2003, American Vacuum Society).
Qubs 04 00022 g005aQubs 04 00022 g005b
Figure 6. (a) Experimental setup (reprinted from [1], with the permission of the American Institute of Physics (AIP) Publishing); (b) guiding effect (reprinted from [1], with the permission of AIP Publishing); and (c) time evolution of the number of the transmitted ions (reprinted from [1], with the permission of AIP Publishing).
Qubs 04 00022 g006
Figure 7. (a) Experimental arrangement to measure the transmitted beam current through a flexible Teflon tube. (b) Front view without the shield. (c) Photo of the inside of the holder used in the experiment. A straight channel was fabricated below the four Teflon tubes. This channel was used to determine the initial beam direction. (d) Photo of the holder. (Figures from [14]. Copyright IOP Publishing, Ltd. All rights reserved.).
Qubs 04 00022 g007
Figure 8. (a) Capillary inner radius measured as a function of the position along the axis and (b) extracted taper angle from (a) (from [10], Copyright 2011, with permission from Elsevier).
Qubs 04 00022 g008
Figure 9. Plastic scintillator end window at a capillary outlet (2.8 μm/div.). The inner diameter and the thickness are 5 and ~4 μm, respectively.
Qubs 04 00022 g009
Figure 10. Time evolution of density enhancement factor, F, for ion transmission for different discharge times, τ. (From [18], Copyright 2011, with permission from Elsevier).
Qubs 04 00022 g010
Figure 11. (a) Experimental arrangement. The tandem capillary consisted of a sub-μm-sized capillary tip and a four-electrode capillary; (b) time evolution and the profiles of the transmitted beam through the outlet of 0.75 μmϕ; (c) explanation of the active discharging. (Figures reprinted from [30], with the permission of AIP Publishing).
Qubs 04 00022 g011
Figure 12. (a) Schematic representation of the setup (reprinted from [32], with the permission of AIP Publishing); (b) three irradiation patterns recorded on imaging plates according to the taper angles and a cross-sectional view showing “core” and “halo” (reprinted from [32], with the permission of AIP Publishing).
Qubs 04 00022 g012
Figure 13. An Eidgenössische Technische Hochschule (ETH) capillary was used in an experiment with 71 MeV Xe19+: (a) measured profile and (b) simulated profile (figures reprinted from [34], Copyright (2014), with permission from Elsevier).
Qubs 04 00022 g013
Figure 14. A schematic of quasi-monochromatic X-ray imaging using the glass-capillary-based micro-beam generator (reprinted from [41], Copyright (2008), with permission from Elsevier).
Qubs 04 00022 g014
Figure 15. (a) Scanning transmission ion microscopy (STIM) image (100 × 47 pixel) of a part of a mosquito wing; (b) raster image is overlaid on photograph of the wing. (Reprinted from [45], Copyright (2012), with permission from Elsevier).
Qubs 04 00022 g015
Figure 16. (a) A schematic drawing of the capillary-based micro-irradiation setup. After passing through the end window, ions irradiate a selected μm3 volume of the cell. (b-1) HeLa cells together with the outlet of the capillary (left top). Shown is the merged phase contrast and fluorescence image. The capillary aims at the center of the cell nucleus marked by the white square. (b-2) The irradiated region is visible as a dark spot. (Reprinted from [53], with the permission of AIP Publishing).
Qubs 04 00022 g016
Figure 17. Fluorescent lines corresponding to the ion track in a HeLa cell nucleus: (a) cross-sectional view of the irradiated cells at the green horizontal line in the bottom view [56]; (b) bottom view of the cell [56]; and (ce) pixel distributions with selected brightness.
Qubs 04 00022 g017
Figure 18. (a) Illustration of the tethered cell; (b) horizontal view of the apparatus; and (c) a typical irradiation. The cells within the ellipse were irradiated and other cells in the microscope view were negative controls. (Reprinted from [58], with the permission of AIP Publishing).
Qubs 04 00022 g018
Figure 19. (a) Narrowing plates were used instead of a single tapered tube [61]. (b) Energy spectra for all plates were normalized by the spectrum for the slit. The enhancement with the gold-coated copper plates was the largest; an enhancement factor of 1.3 was obtained. (Reprinted figures from [61]).
Qubs 04 00022 g019
Table 1. Examples of transmission experiments using capillaries.
kV Accelerated IonsMV Accelerated IonsPhotons
Multitude of nanocapillaries3 keV Ne7+: a PET foil with capillaries (100 nmϕ, 10 μmL) 1 [2] 22
Single capillary8 keV Ar8+: a tapered glass capillary (24 μmϕ outlet) [1]2 MeV He+: a tapered glass capillary (0.8 μmϕ outlet) [3]laser (488, 633 nm): a tapered glass capillary (22 μmϕ outlet) [11]
1 μmL represents μm in length. 2 The experiments are not treated in this report.
Table 2. Example experiments of various single capillaries.
Non-Tapered CapillaryTapered Capillary
StraightCurvedFunnel TypeConical Type
Single capillary4.5-keV Ar9+: a glass capillary (170 μmϕ, 11.4 mmL) 1 [12,13]8-keV Ar8+: a Teflon tube (1 mmϕ, 51 mmL, 26.7° bending) [14]Refs [1,3,15]27-keV Ar9+: a glass capillary (22 μmϕ outlet) [15]
1 mmL represents mm in length.