Article

Distinct Recrystallization Pathways in a Cold-Rolled Al-2%Mg Alloy Evidenced by In-Situ Neutron Diffraction

1
Neutron Scattering Division, Oak Ridge National Laboratory, Oak Ridge, TN 37831, USA
2
Electrical and Electronics Systems Research Division, Oak Ridge National Laboratory, Oak Ridge, TN 37831, USA
3
Lujan Center, Los Alamos National Laboratory, Los Alamos, NM 87545, USA
4
Materials Science and Technology Division, Oak Ridge National Laboratory, Oak Ridge, TN 37831, USA
5
Computational Sciences and Engineering Division, Oak Ridge National Laboratory, Oak Ridge, TN 37831, USA
6
Department of Physics, University of Tennessee, Knoxville, TN 37996, USA
7
Department of Physics, City University of Hong Kong, Hong Kong, China
*
Author to whom correspondence should be addressed.
Quantum Beam Sci. 2018, 2(3), 17; https://doi.org/10.3390/qubs2030017
Submission received: 4 May 2018 / Revised: 8 September 2018 / Accepted: 14 September 2018 / Published: 18 September 2018
(This article belongs to the Special Issue Strain, Stress and Texture Analysis with Quantum Beams)

Abstract

:
The time-of-flight neutron diffraction data collected in-situ on Oak Ridge National Laboratory’s (ORNL, Oak Ridge, TN, USA) VULCAN and Los Alamos National Laboratory’s (LANL, Los Alamos, NM, USA) High-Pressure-Preferred-Orientation (HIPPO) diffractometers have been analyzed complementarily to show the texture evolution during annealing of a cold-rolled Al-2%Mg alloy. The texture analysis aimed to identify the components present in the initial rolling (or deformation) texture and in the thermally-activated recrystallization texture, respectively. Using a quasi-Monte-Carlo (QMC) approach, a new method has been developed to simulate the weighted texture components, and to obtain inverse pole figures for both rolling and normal directions. As such, distinct recrystallization pathways during annealing in isochronal conditions, can be revealed in terms of the evolution of the texture components and their respective volume fractions. Moreover, the recrystallization kinetics associated with the cube and random texture components are analyzed quantitatively using a similar approach developed for differential scanning calorimetry (DSC).

1. Introduction

The recrystallization (RCX) texture in cold-rolled Al-alloys has been extensively studied in the literature [1,2,3,4,5,6,7,8,9,10,11,12,13,14] using advanced characterization techniques, including X-ray diffraction, transmission electron microscopy, electron backscattered diffraction (EBSD), and neutron diffraction. These investigations, aiming to improve the materials performance, are indicative of the influence of the initial plastic deformation state [1], as well as, the presence of precipitates or hard particles [2,3,11] on the RCX. Identifying the texture components when evolving from a deformation (DF) texture to a RCX texture upon annealing is an essential task for controlling the material properties. An early X-ray diffraction study of cold rolled CuZn alloys [12] has identified the DF texture components to be the β- and α-fibers for different strain levels, and showed their subsequent evolution, away from a homogeneous fiber, for much higher strain levels. However, the models on the texture evolution during thermo-mechanical treatments—which are related to nucleation, abnormal grain growth, stagnation of growth, grain-boundary (GB) properties, or cube texture formation—are still somewhat inconsistent [2,3,4,5,6,7,8]. As a thermally activated process, the onset of the RCX requires a threshold temperature and a critical deformation state that enable nucleation of new grains. For example, the strain level due to prior deformation determines the grain size and orientation, which, in the subsequent annealing, will lead to different RCX rates. Thus, the final RCX texture is a result of the competition between different possible nucleation sites [13] present in the deformed grains: between the deformation bands, at the shear bands, or at the large particles. Detailed analysis of plastic deformation during rolling of face-centered-cubic (FCC) alloys [14] has revealed that deformation banding plays a key role in both the DF texture development and the subsequent RCX texture formation. Some studies on nucleation have concluded [15] that the favorable nucleation sites are the grains exhibiting largest orientation gradients such that the nuclei would have the same orientation as the deformed grains. Another point of view is that the RCX texture is determined by the faster-growing nuclei [16]; this happens when a GB misorientation of 30–40° about the closest <111> axis exists between the growing nuclei and the deformed matrix. The impurities or precipitates (either pre-existing or nucleated during heating) can also change the RCX kinetics [17], but it is not clear if the nucleation is delayed or the GB mobility is reduced. It was also shown [18,19] that a higher heating rate applied would suppress the recovery step, and is expected to influence the RCX kinetics and the final texture.
The most common DF texture present in cold-rolled Al-alloys is the β-fiber, containing at least three ideal components usually indexed as: Copper, Cu {112}<111>, Brass, Bs {011}<211>, and S-component {123}<634>. However, annealing of a cold-rolled alloy that has a medium to high stacking fault energy, such as the present Al-alloy, would result in a recrystallization texture whose main component is a cube texture, {100}<001> [20,21,22,23,24,25]. Cube grains could be formed as long narrow bands by bulging [23], or at the transition bands having large orientation gradients [24]. The subsequent preferential RCX of these grains may result from their favorable misorientation of ~40° about the closest <111> axis toward the main deformation texture component: S {123}<634> [16]. It was found that a critical amount of cube grains must be present to facilitate the development of the cube component upon annealing. The texture evolution simulations [26] showed that the β-fiber belonging to DF texture is transformed during annealing in cube-oriented RCX texture, while the S-components were retained and the copper components disappeared.
Modeling deformation textures appears to be far more successful compared to modeling the texture evolution during annealing. The attempts to predict the texture transformations due to thermo-mechanical processing [27] were focused on grain-boundary properties, nucleation and grain growth mechanisms during recovery/recrystallization, and their dependence on grain orientations. The finite-element simulations were used [27,28,29] to create a deformation subgrain network and a recrystallization texture considered as an abnormal subgrain growth, with two distinct nuclei formation mechanisms: strain-induced boundary migration (SIBM) [27] and particle-simulated nucleation (PSN) [28]. In these simulations, before recrystallized nuclei can be formed, a recovery of the dislocation substructure is assumed to take place. Other simulations of the RCX textures [30] assume the dominance of the orientation selection during annealing, via oriented nucleation, oriented growth or both. In growth selection, the model considers that more nuclei have a <111> 40° orientation relation with the deformed matrix grains. In the oriented nucleation, it is believed that the controlling parameter is the stored energy of plastic deformation.
While high energy X-ray diffraction techniques are well suited for in-situ studies of the RCX kinetics [30,31,32], particularly for Al alloys [33,34], in-situ neutron diffraction measurements also demonstrated great potential to probe the thermo-mechanical properties of materials in bulk, providing altogether an important amount of structural information, which challenges the tools available for data analysis. Previous studies of RCX in ferritic steels [35] were promoted because of the development of dedicated tools for probing in-situ the texture evolution at pulsed neutron sources [36]. This proved to be a successful approach, with steady progress up to date, as demonstrated by a recent study of RCX in a nanostructured ferritic alloy [37]. Moreover, by analyzing the line broadening from the data obtained in-situ in neutron experiments, Christien et al. [38] developed a method to monitor RCX and demonstrated the similarities to the DSC method. Here, we propose a new approach for analyzing in-situ neutron diffraction data recorded for a cold-rolled Al-2%Mg alloy upon annealing, in an effort to understand the recrystallization kinetics associated with various texture components.

2. Material and Methods

The present study was focused on the neutron diffraction measurements of an Al alloy containing 2% Mg, in order to determine the kinetics of recrystallization by ex situ and in-situ annealing. The experiments were conducted on two time-of-flight (TOF) neutron diffraction instruments: the engineering diffractometer (VULCAN) at Oak Ridge National Laboratory (ORNL, Oak Ridge, TN, USA) [39], and at the high-pressure-preferential orientation (HIPPO) at Los Alamos National Laboratory (LANL, Los Alamos, NM, USA) [40,41,42]. The detailed analysis included the texture characterizations of DF and RCX along with developing a new method for texture decomposition. The proposed procedure allows to identify the texture components based on a Gaussian distribution of orientations around an ideal orientation assigned to a specific texture component.

2.1. Samples Preparation

The Al-2%Mg, an Al alloy with a solute addition of 2 wt % Mg, was cast and symmetrically cold-rolled to a reduction of 80%. The process of cold rolling was as follows: The Al alloy strip of 25.4 mm thickness was cold-rolled down to 12.7 mm thickness, then again cold-rolled down to 8.255 mm, then annealed at 360 °C for 18 min, and, finally, cold-rolled to 3.2 mm thickness. Rectangular plates of 20 × 20 × 2 mm cut from the rolled strip were used for the ex situ and in-situ neutron diffraction experiments. In-situ annealing up to the recrystallization temperature was done either in a vacuum chamber or using induction heating with custom coils. A reference sample with the same composition and a random texture was prepared by annealing the scrap particles (removed from a rolled plate of Al-2%Mg alloy) for 25 min at 360 °C. The reference was then measured in the same conditions as the studied samples in ex situ and in-situ neutron diffraction experiments in order to characterize the preferential grain orientations of the cold-rolled and annealed samples via pole figures (PFs) and inverse pole figures (IPFs).

2.2. Neutron Diffraction Texture Characterizations

The in-situ neutron experiments aiming to assess the texture evolution of Al-2%Mg alloy from DF to RCX were conducted in both isothermal and isochronal annealing treatments. Given the fact that optical microscopy showed a fully recrystallized structure after annealing for 20 min at 360 °C, the in-situ isothermal annealing treatments were performed in the temperature range from 250 to 360 °C, and the annealing times from 20 to 210 min. The in-situ isochronal annealing was performed at two TOF neutron diffractometers, HIPPO and VULCAN, for two heating rates with nominal values of 2 °C/min and 7 °C/min, and in the temperature span from room temperature to 400 °C. HIPPO is a TOF instrument dedicated for texture measurements [40,41,42,43,44,45,46], while at VULCAN engineering diffractometer, the texture characterizations and the corresponding data analysis were developed as a complementary capability [47,48].
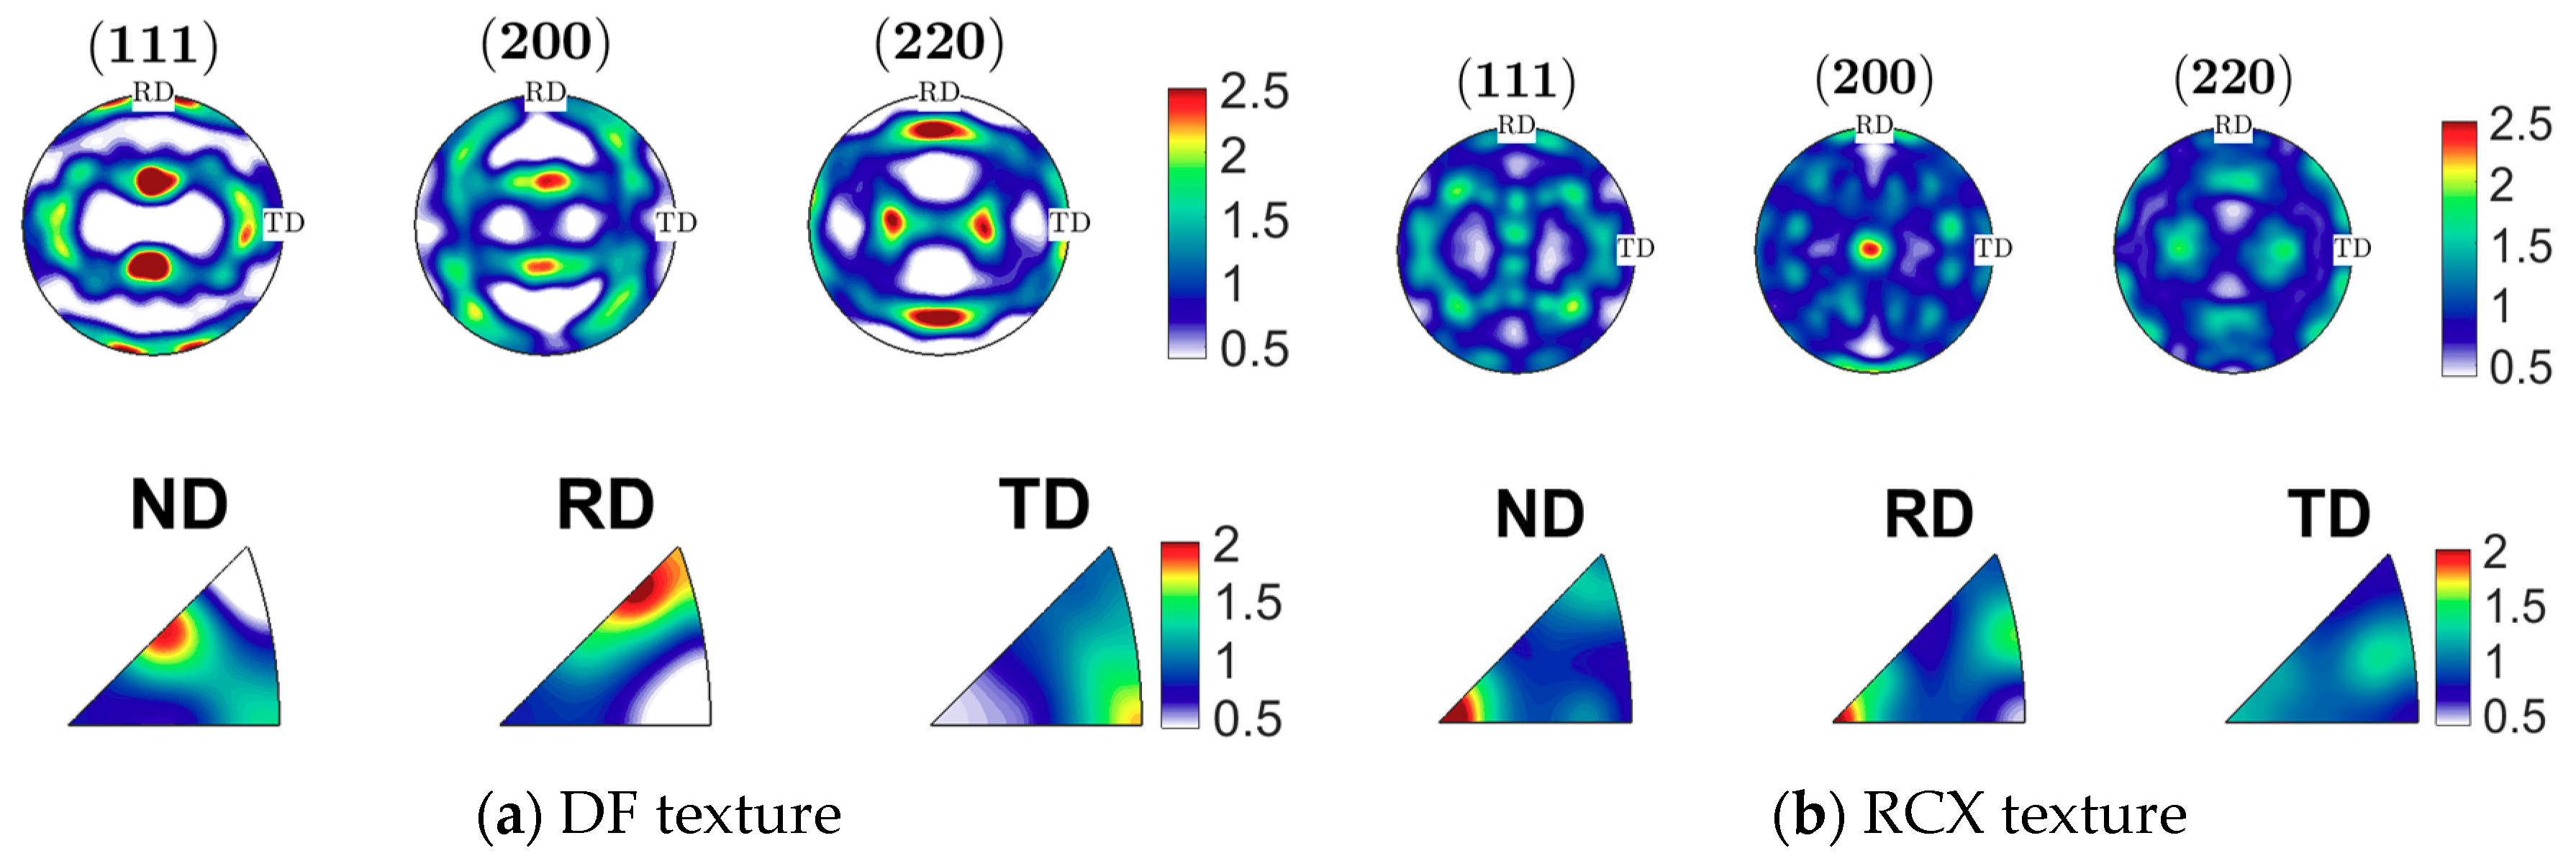
The cold-rolled Al alloy samples were characterized at HIPPO for all stages of texture evolution: Initial plastic deformation texture by cold-rolling, the texture during annealing and the final recrystallized texture. The spectra were recorded at different diffraction angles (10°, 20°, 40°, 90° and 150°) for d-spacing in the range of 0.5–2.5 Å. To obtain the whole-pattern spectra with a good pole figure coverage, the data were recorded for the sample rotation about a vertical axis at 4 angles, 0°, 45°, 67.5° and 90°. Rietveld texture analysis using the Material Analysis Using Diffraction (MAUD) software [43,44,45] calculated the orientation distribution functions (ODFs) by simultaneous fitting of multiple diffraction patterns recorded by different detector banks for different sample orientations. The PFs for a set of (hkl) planes, familiar in conventional texture analysis, are also provided, as well as the IPFs corresponding to the main sample directions: normal (ND), rolling (RD) and transversal direction (TD). An example is given in Figure 1, where the PFs and IPFs for the initial DF and the final RCX textures of a sample in-situ annealed to 350 °C for 75 min are represented. The initial DF texture (Figure 1a) of β-fiber is transformed rather abruptly after annealing above 300 °C (Figure 1b) into a RCX containing a cube {100}<001> component.
The same samples as in Figure 1 were ex situ characterized at VULCAN using only two detector banks and rotating the sample about two perpendicular axes, horizontal and vertical [47,48]. Full pole figures were generated from integral intensities of different hkl diffraction lines over a regular network of 5° by 15°. The first three pole figures, (111), (200) and (220), were used to calculate the ODF through MTEX software [49]. This procedure allows representing both PFs and IPFs by projecting ODF. The results are shown in Figure 2 for direct comparison with HIPPO patterns. The PFs from Figure 1 show certain shifts of texture features as compared with those from Figure 2, likely due to misalignment of the sample and the averaging effect of the multiple Rietveld fit procedure used in data analysis at HIPPO. However, the main features are similar in both figures except some details with a different contrast (the color scale is logarithmic in Figure 1 and linear in Figure 2). As the IPFs in both figures are recalculated from the corresponding ODFs, the misalignment errors will also affect the accuracy of IPFs from Figure 1.
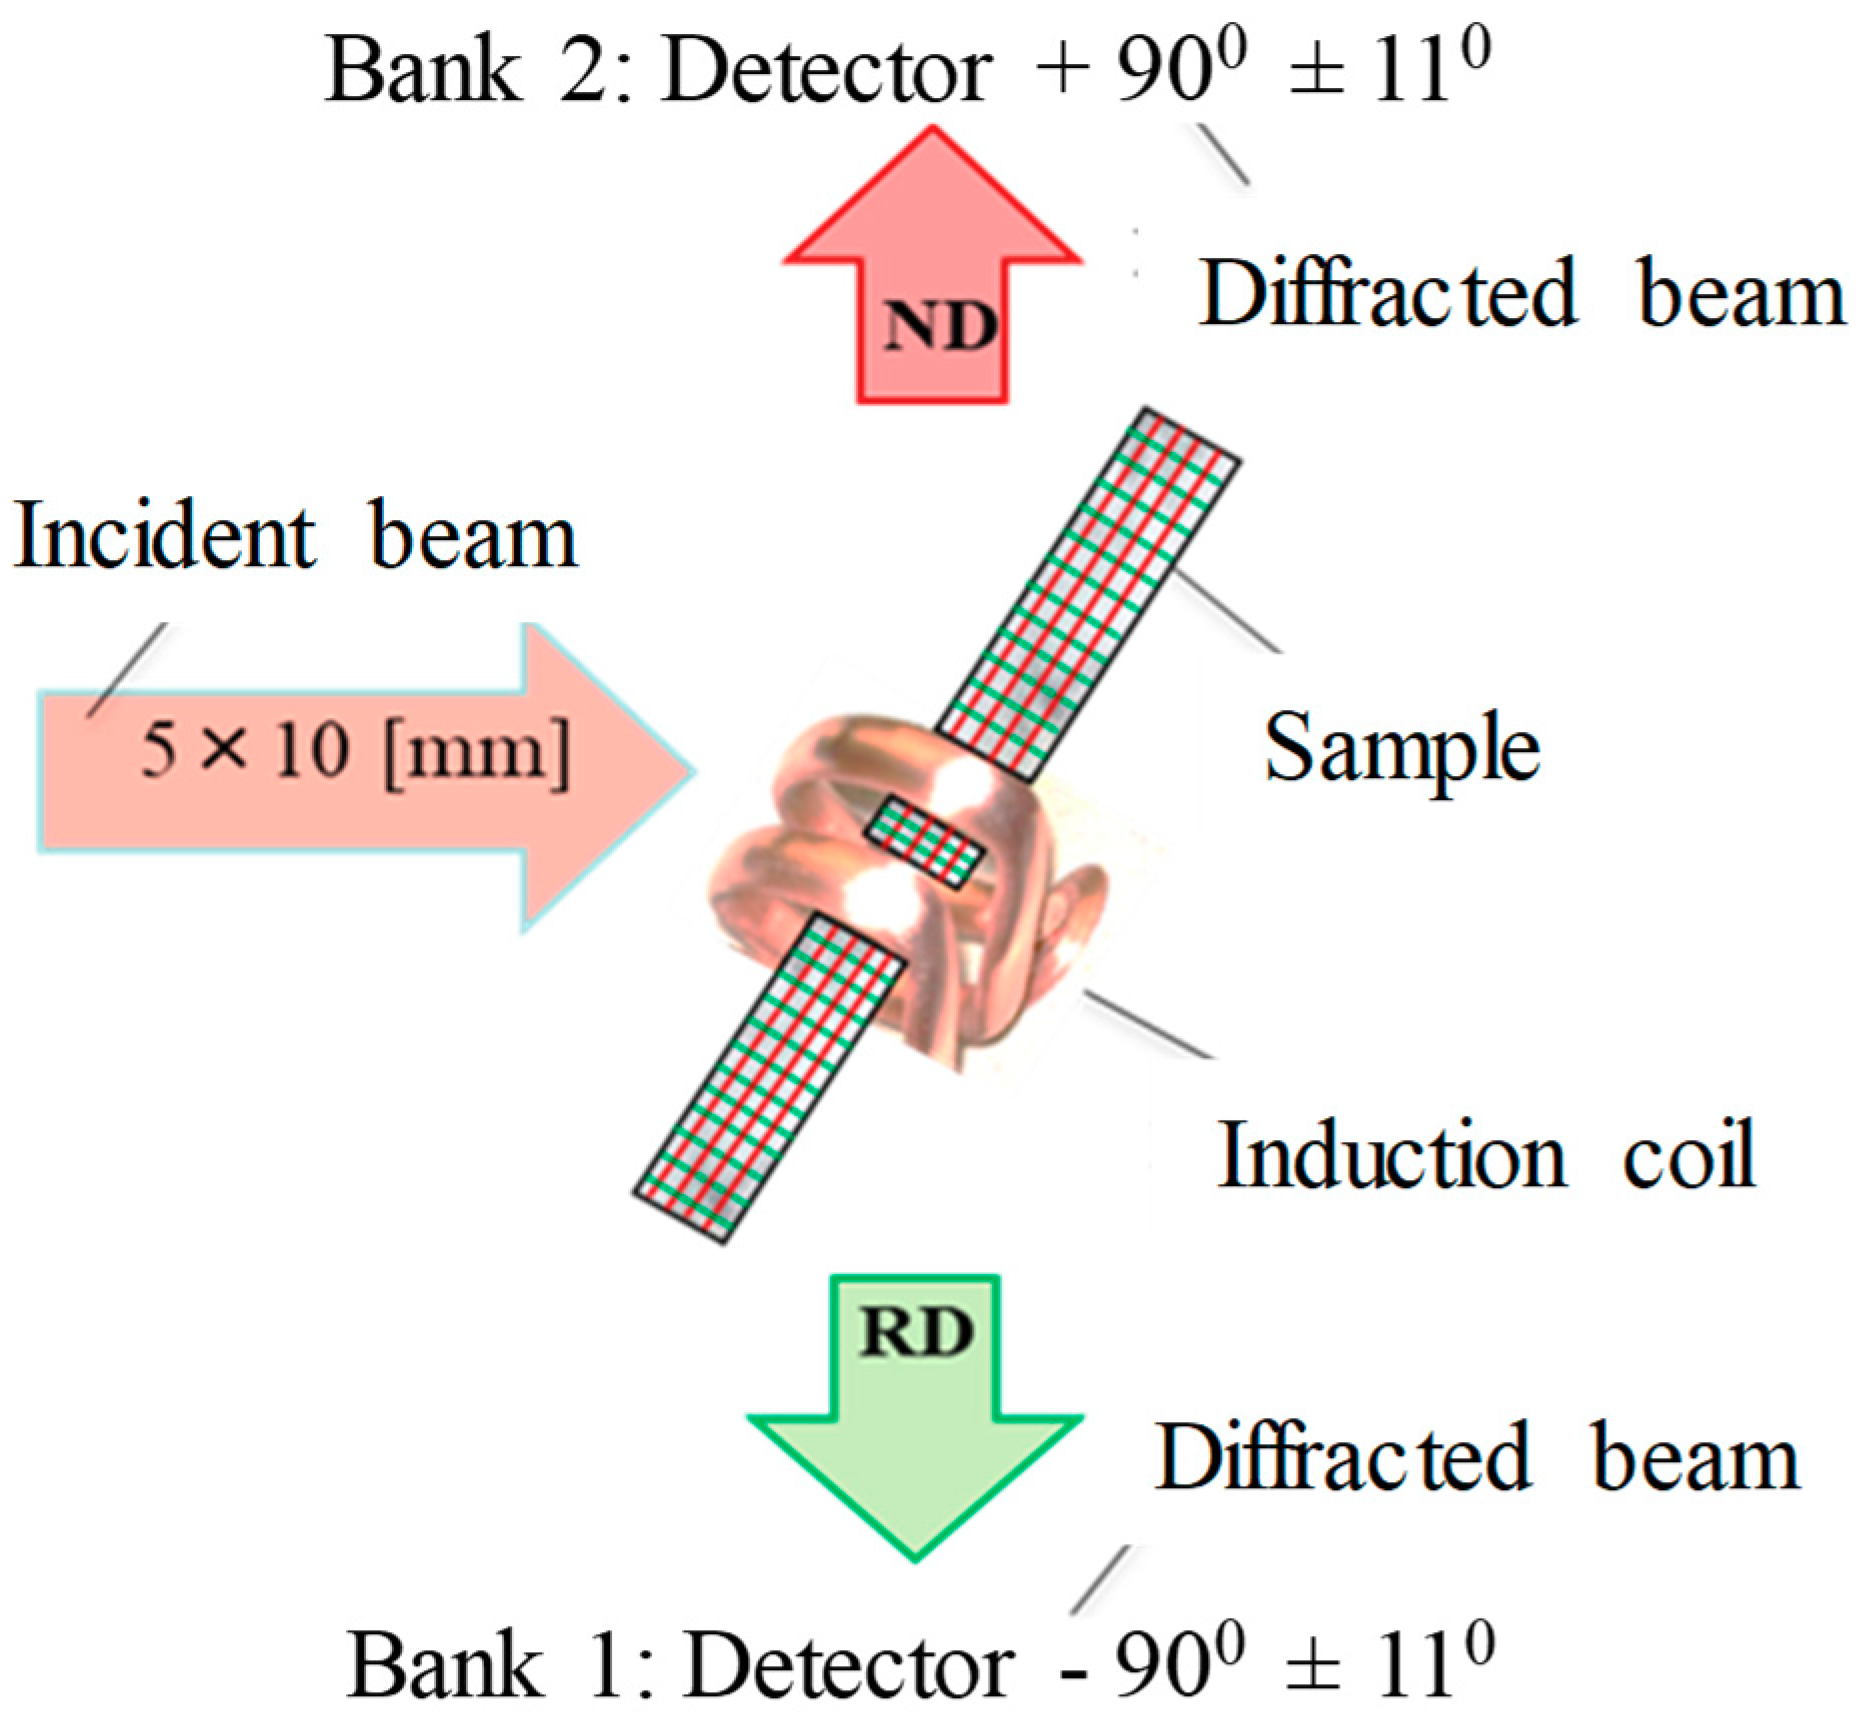
In order to assess the texture components evolution from DF to RCX, the in-situ neutron experiments were conducted at VULCAN in both isothermal and isochronal conditions using the experimental setup represented in Figure 3.
The experiments were carried out in the high-resolution mode, with the chopper running at 30 Hz and 60 Hz, respectively. The central wavelength and the bandwidth were λ = 2.4 Å, ∆λ = 2.88 Å, respectively. The neutron incident beam of 5 × 10 mm reached the sample positioned with the RD and ND directions at ±45° about the incident beam. The diffracted intensities were recorded with two scintillation detectors banks, Bank 1 and Bank 2, located at ±90° diffraction angles, and, consequently, the grains diffracting toward the detectors are approximately aligned with a specific <hkl> direction along ND or RD direction, respectively.
The in-situ isochronal experiments at VULCAN were conducted to reveal the heating rate influence on the texture components evolution and on the RCX processes. The temperature range was chosen between 200 °C up to 420 °C. A complete transformation of texture from DF to RCX was observed at 350 °C. The event mode data reduction was performed using VDRIVE software [50] based on single-peak-fitting with the SMARTSW [51]. A quasi-Monte Carlo (QMC) method, outlined in [47], was further used to obtain the IPFs from the experimental data. The resulting averaged IPFs values, or experimental texture indexes, t j exp , associated to a reciprocal space direction j (space holder for the measured <hkl> direction) and a specific sample direction can be estimated using a simple equation:
t j exp = ( I j exp I j r e f ) / w i I i exp I i r e f
In this equation, the measured integral intensities of diffraction peaks, I j exp , are divided to the integral intensities of the corresponding peaks produced by a collection of randomly oriented grains of a reference sample of the same material, I j r e f . For FCC symmetry, the weighted sum used for normalization extends over eight directions in the fundamental triangle, selected for providing reasonable intensity, and relatively well spaced and without contaminations from other directions (i.e., <111>, <001>, <011>, <113>, <133>, <012>, <112>, <135>). The weighting factors, w j , were calculated by QMC method [47] using a randomly oriented population of grains and the real angular aperture of VULCAN detector banks.

3. Results

3.1. Texture Decomposition Method

The QMC method was extended in the present work to include specific texture components and, based on the standard Gaussian distribution introduced by Matthies et al. [52], the texture decomposition was obtained for both deformation and recrystallization textures. The argument of the Gauss function is defined in the orientation space as the orientation distance between an arbitrary location and the point in the Euler space corresponding to the ideal texture component. If a point in orientation space is described by a certain axis of rotation, n , and its rotation angle, ω , about that axis, then the distance between two points [ n 1 ; ω 1 ] and [ n 2 ; ω 2 ] stands for the rotation angle, ω , about the axis n 1 × n 2 , which transforms one point into another. Using this notation, the standard Gaussian function is defined as:
f ( ω ˜ ) = N e B c o s ω ˜ ;   N = [ I 0 ( B ) I 1 ( B ) ] 1
where I n ( B ) are modified Bessel functions: I n ( B ) = 1 π 0 π exp ( B c o s θ ) cos ( n θ ) d θ . The full width at half maximum (FWHM) of this function corresponds to b = 4arcsin ( l n 2 2 B ) , which means that f = 1 when B = 1 2 l n 2 and b = 2 π ; and f = δ ( ω ) (Dirac delta function) when B and b 0 . The ODF decomposition in texture components described by Gauss functions was successfully implemented with various techniques of minimization (as examples see [53,54]). For these calculations we used the code for simulating neutron transmission described in [55]. The code was modified to allow selecting the direction of the diffracted beam, as this is not necessary for transmission simulations. In the present approach, the standard Gaussian distribution around an ideal texture component was used to generate a set of 10,000 grain orientations. For each <hkl>, the total number of orientations compatible to a specific detector bank (corresponding to ND or RD) was counted, and a set of t j m values was generated (where index m is a place holder for the texture component {hkl}<uvw>).
Thus, for a specific makeup of texture components, the ideal IPF value would be obtained by weighting the t j m with the volume fractions, cm:
t j i d = m c m t j m
In principle, we need to find a unique set of volume fractions to match the experimental IPF values: t j i d t j exp . As the experimental errors in t j exp are unavoidable, as well as our approximate evaluation of t j m , the weighted sum of square differences should be minimized, with the condition that the volume fractions are positive. As the initial and final states are known, the list of texture components should include both DF and RCX types of components. To characterize the initial DF by cold-rolling, the classical choice of Cu, Bs and S texture components was tested. However, as the stable Cu texture component was not reached for 80% reduction by cold rolling processing, the Dillamore (Taylor) texture component, D {4,4,11}<11,11,8>, was chosen to replace Cu component, based on our own testing of the meta-stable variants previously observed in various aluminum alloys. Another necessary component found in the process of analyzing the initial texture was the X-component, {114}<311>, which is also located close to the β-fiber characteristic path in the orientation space. Other contributions were attributed to the Goss component, G {011}<100>, present in both DT and RCX textures [4] and to the Q-component, Q {310}<123> often observed in RCX [7]. For the recrystallized texture, the only necessary addition, beside the random texture, was the Cube component, Cube {001}<100>. The other texture components along the θ-fiber, as {001}<110> or {001}<120> have a negligible effect.
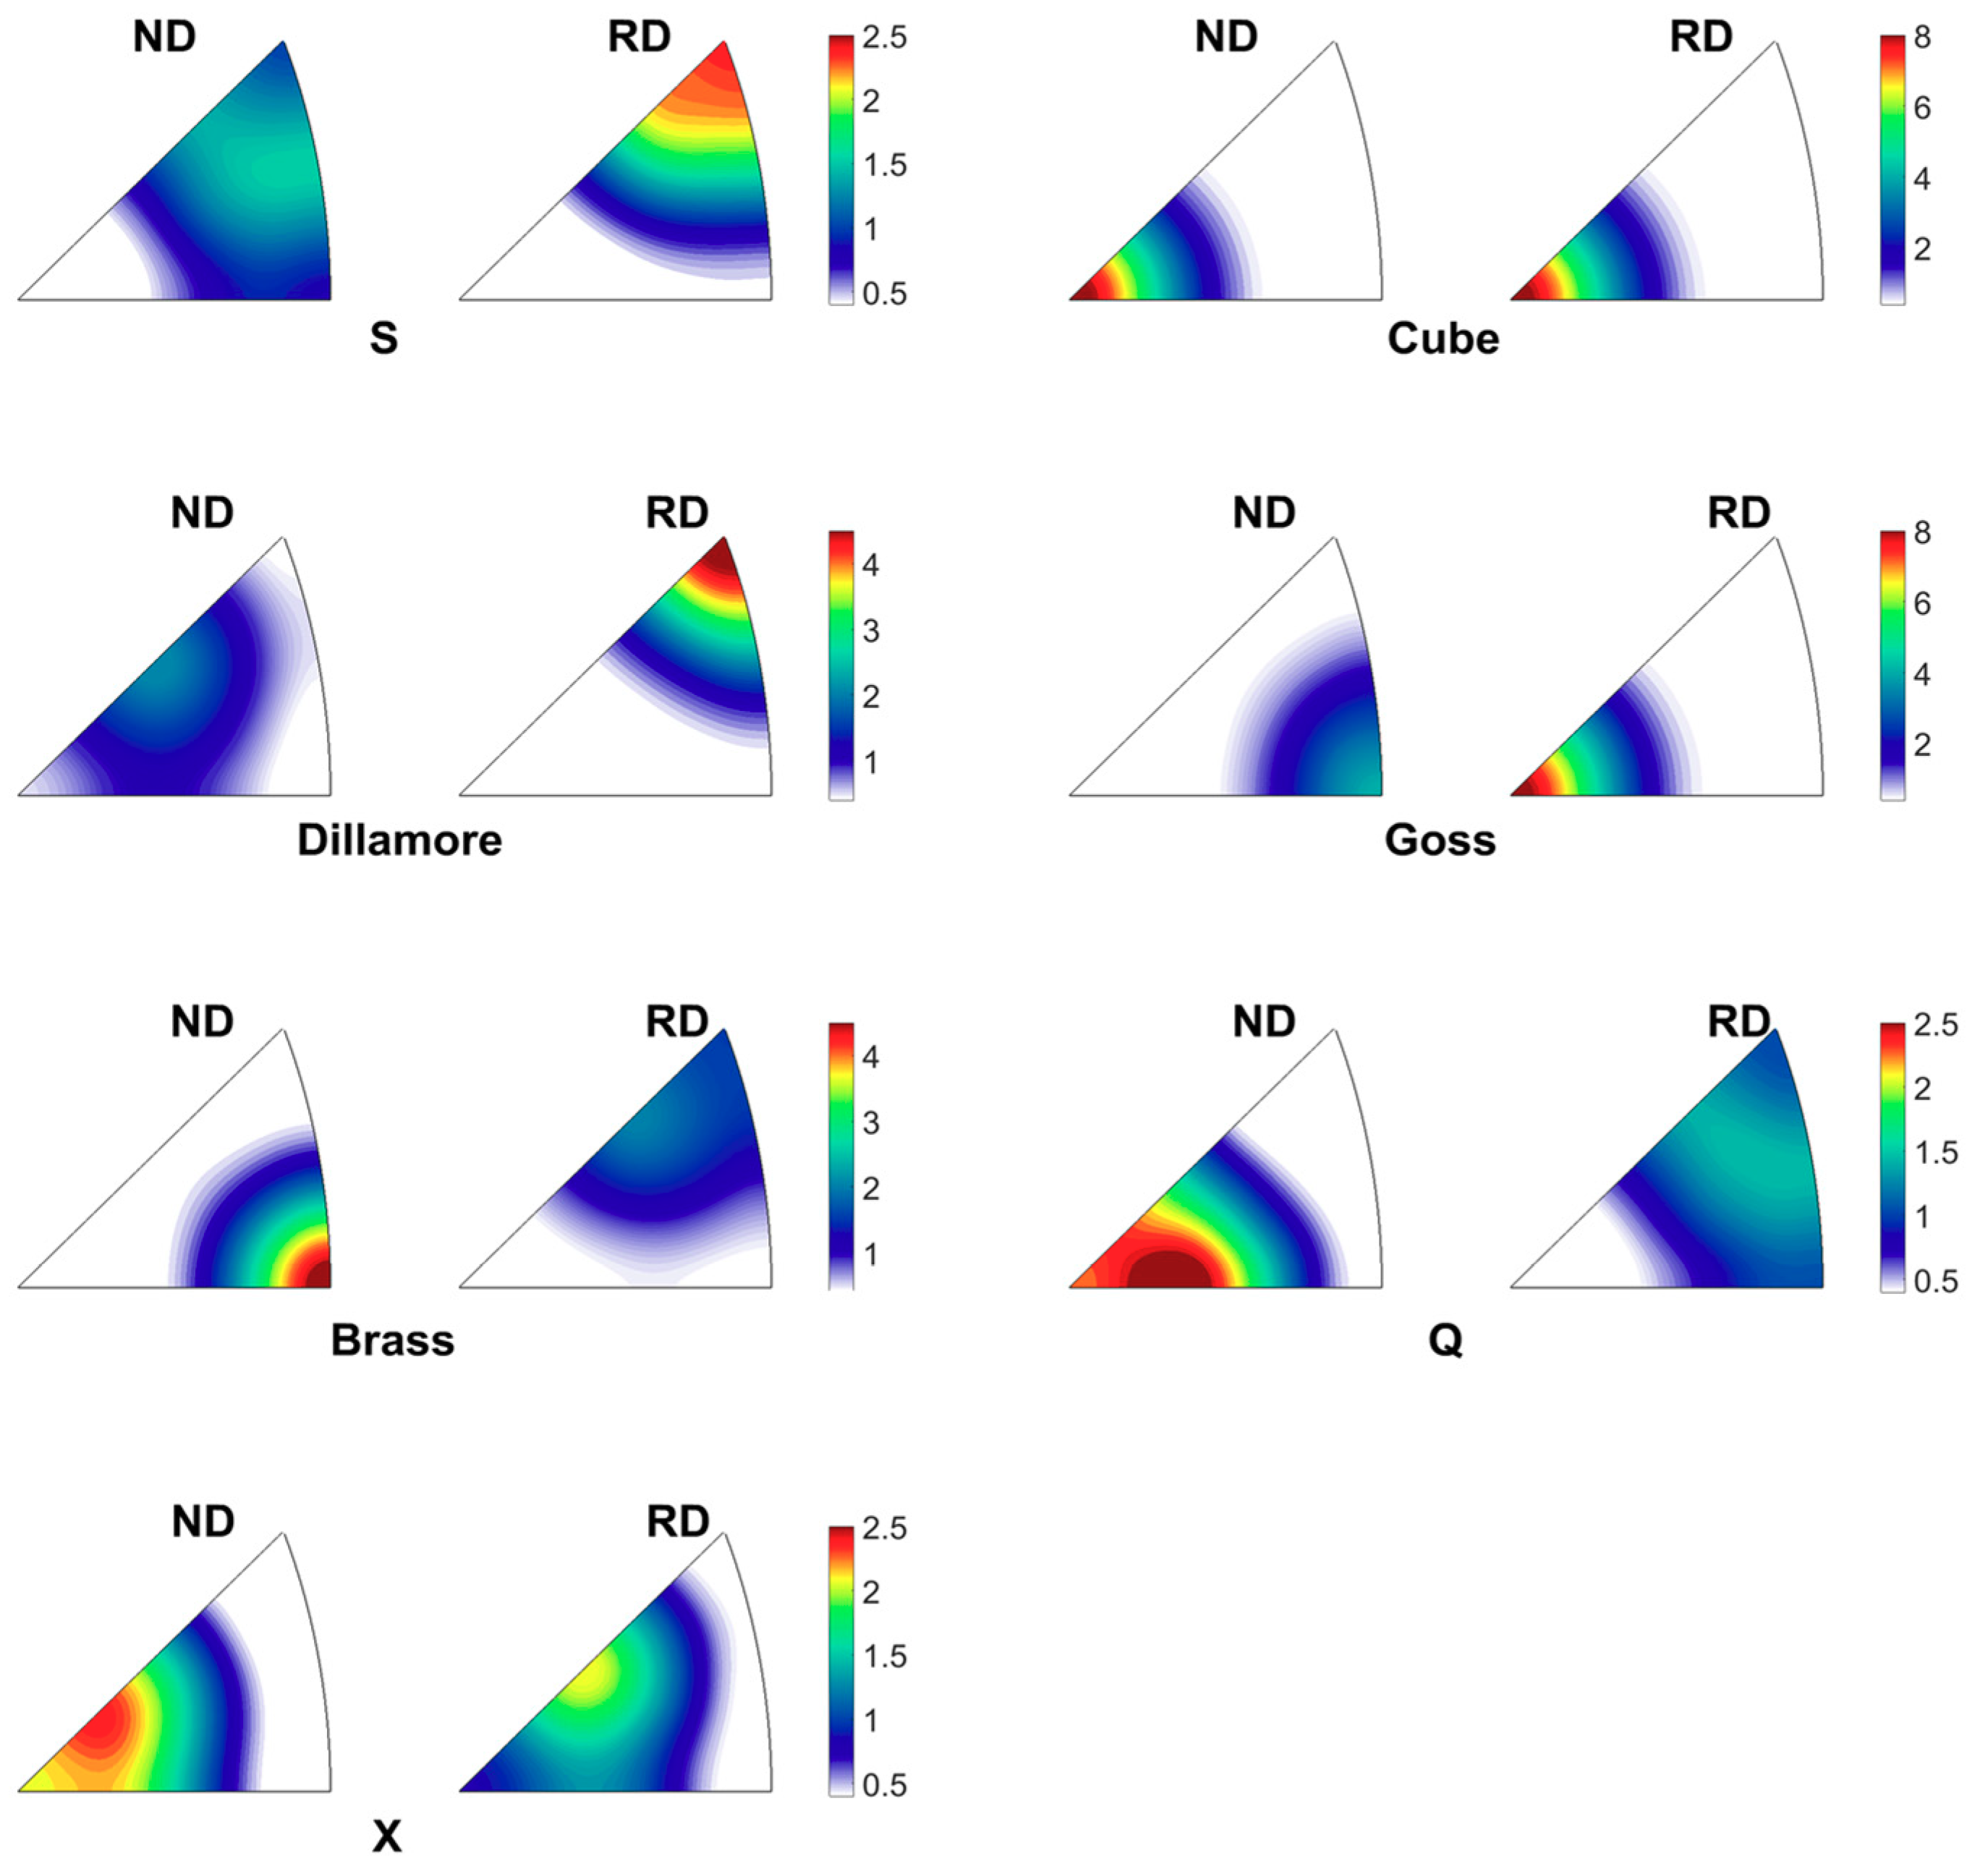
In the process of fitting the t j i d over t j exp , the broadening of the texture component was also optimized and the best choice for FWHM (symbol b introduced after Equation (2)) was found to be 25 degrees. The IPFs in Figure 4 show the texture components for the actual grain orientations generated with QMC method [47] and are represented using MTEX software [49]. These IPFs are considered in the following analysis. The corresponding t j m values used for RD and ND directions are listed in Table 1 and Table 2, respectively.
As mentioned previously, the procedure of estimating t j exp requires the random reference sample data. In dealing with measurements at high temperature, the whole-pattern approach involves considering the thermal factors as free parameters together with texture model parameters. As high temperature reference sample data are missing, it is necessary to correct the measured diffracted intensities for the thermal factor corresponding to the measurement temperature. The initial portion of the temperature ramp was used to estimate the temperature dependence of the thermal factors and these values were extrapolated in the higher temperature range. Additionally, the peak broadening analysis was used in an attempt to evaluate the effect of recovery, but the diffraction data were not accurate enough to distinguish between heating rates and this type of analysis will not be discussed in the following sections.
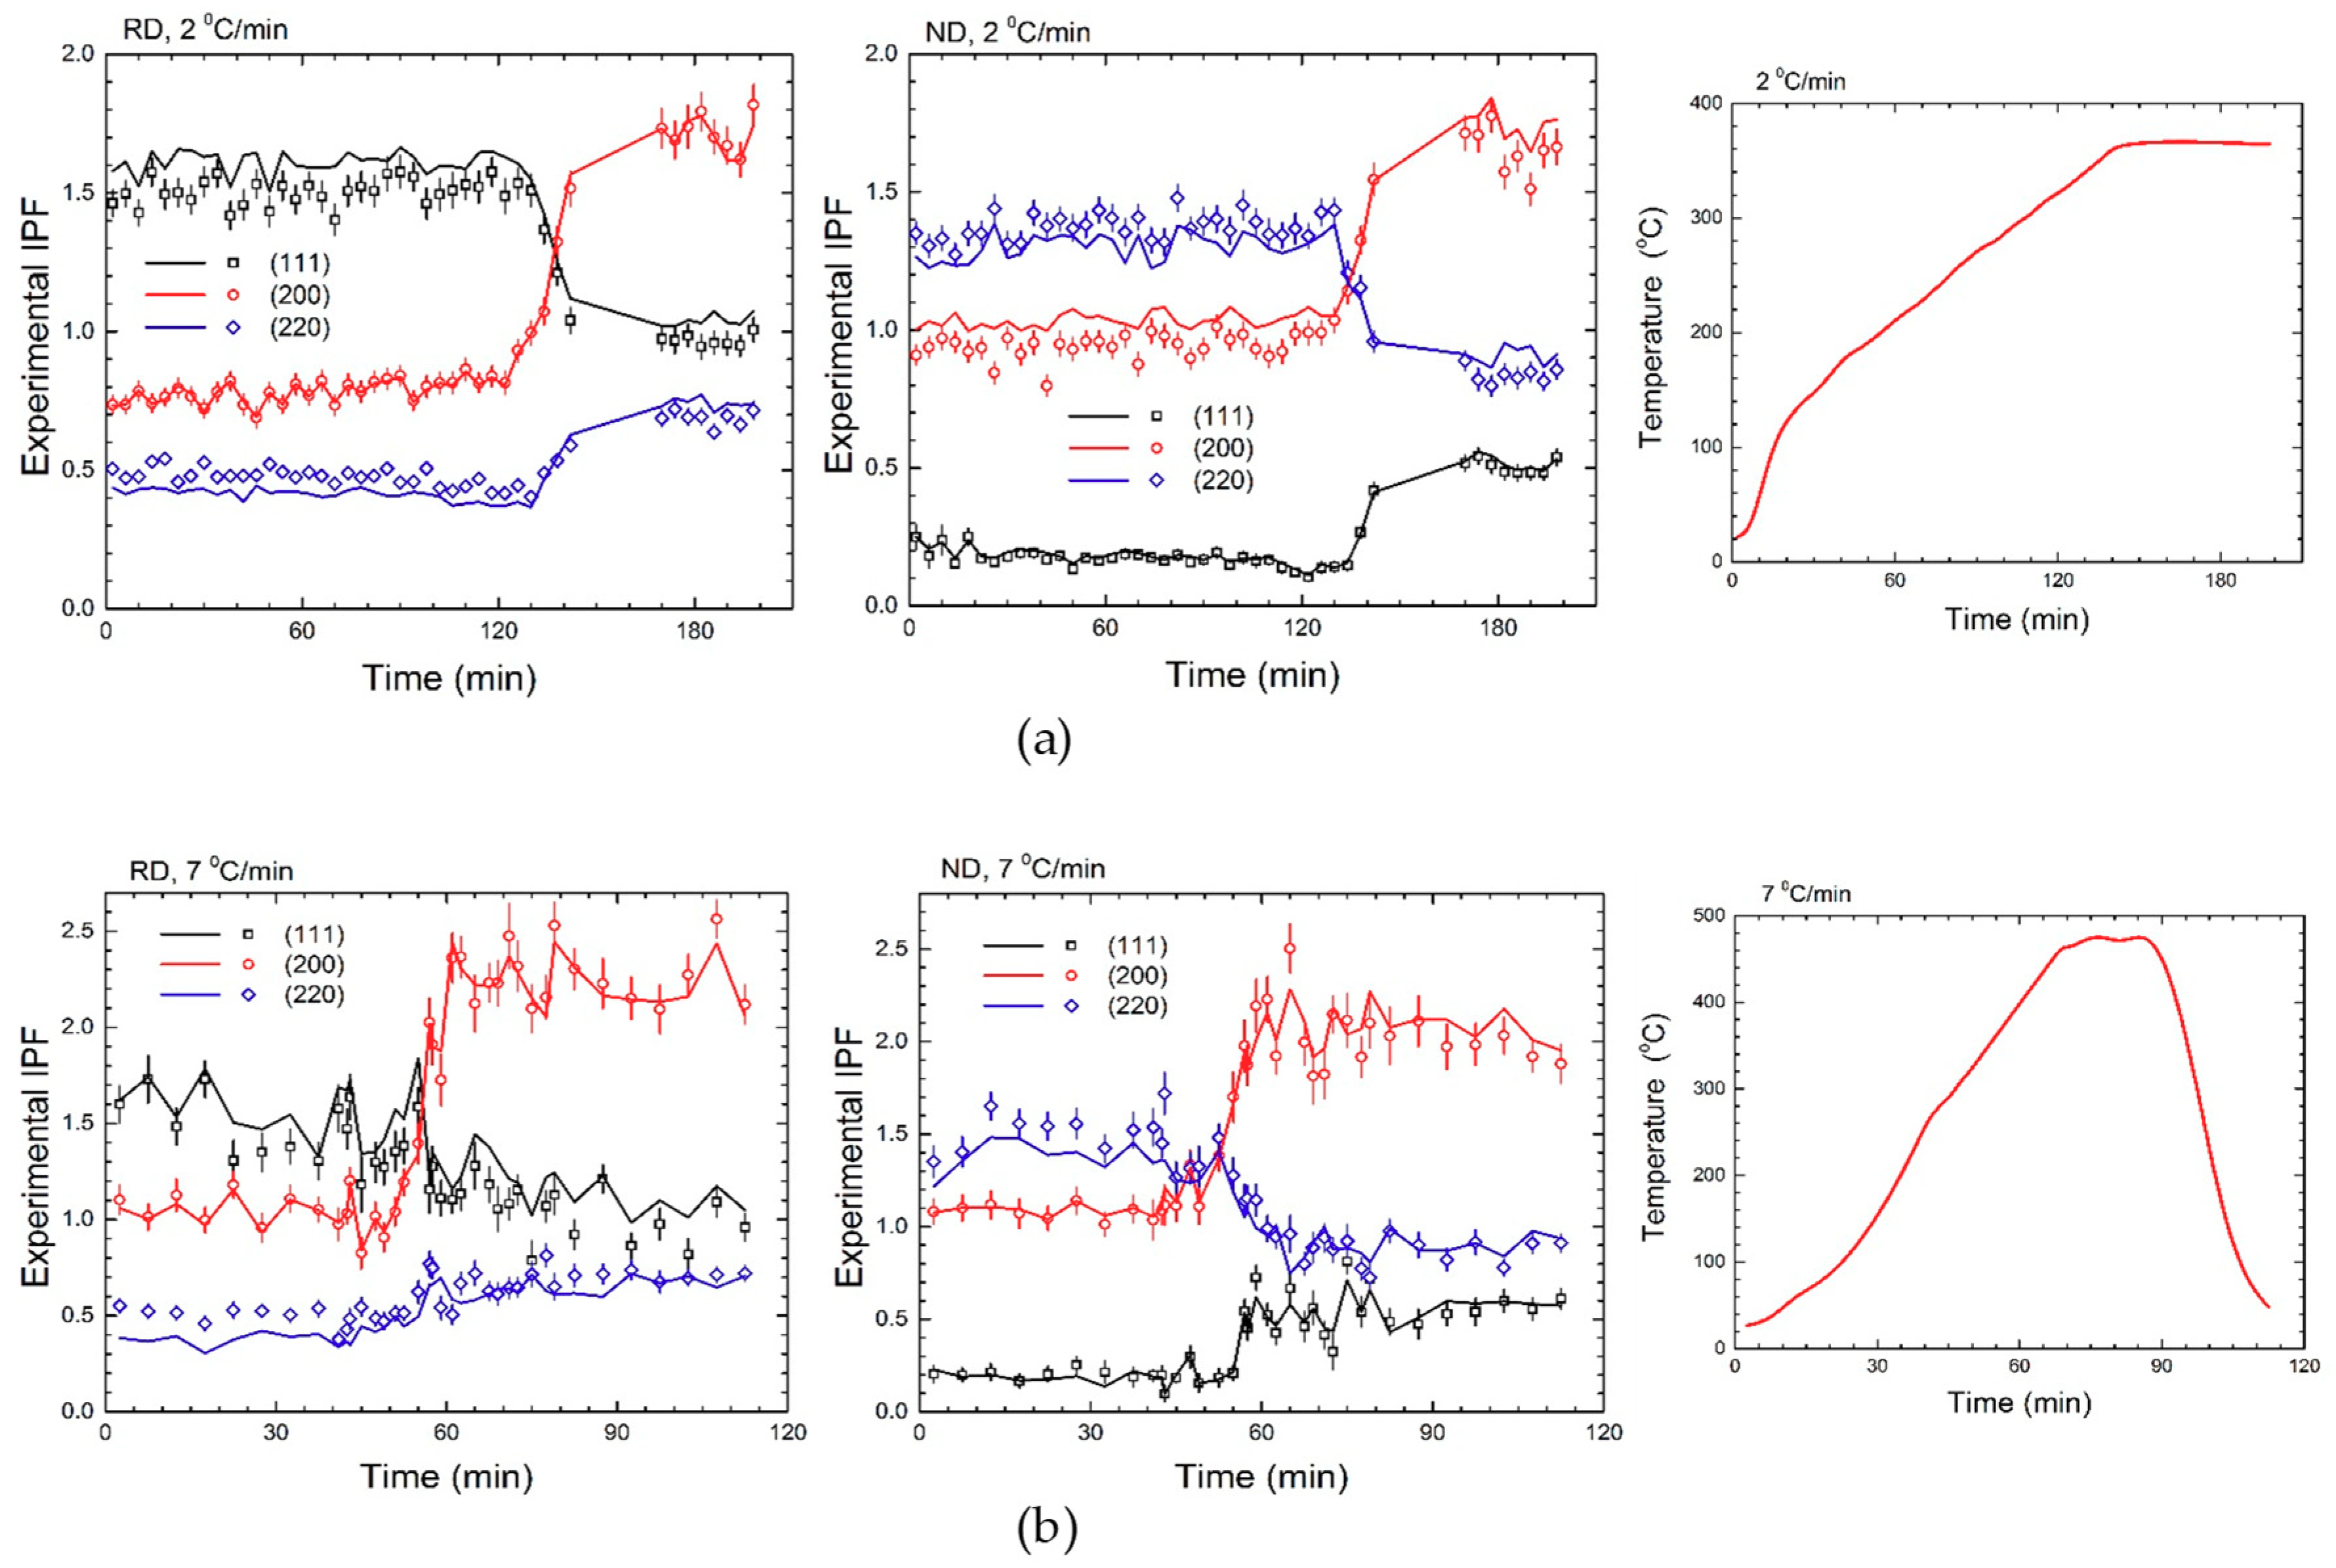
Finally, to illustrate the feasibility of our approach, Figure 5 shows the matching of t j exp and t j i d on three reciprocal space directions, <111>, <001> and <011>, which display a dramatic change during isochronal heating.
In Table 3 are given the volume fractions of texture components obtained for initial and final states of the 2 samples, A and B, annealed under isochronal condition with 2 °C/min and 7 °C/min heating rates, respectively. In the initial state, the cube texture is virtually absent in sample A, whereas sample B shows a small content (2.5%) of cube texture. Thus, the initial state may also influence the kinematics of texture evolution.
The results of texture component decomposition are summarized in Figure 6.
The volume fraction dependence of temperature for β-fiber (S, Bs, D, X) show a dramatic reduction from over 70% to less than 20% at the end of annealing, independent of heating rate. This reduction was mainly compensated by the growth of random (Rd) and cube components, with the relative contribution of the cube component increasing from 10 to 19% when the heating rate is increased from ~2 °C/min to ~7 °C/min. The S, G and Q components show little variation from initial to final state, thus, their volume fraction was kept constant throughout the QMC fit.

3.2. The Recrystallization Kinetics

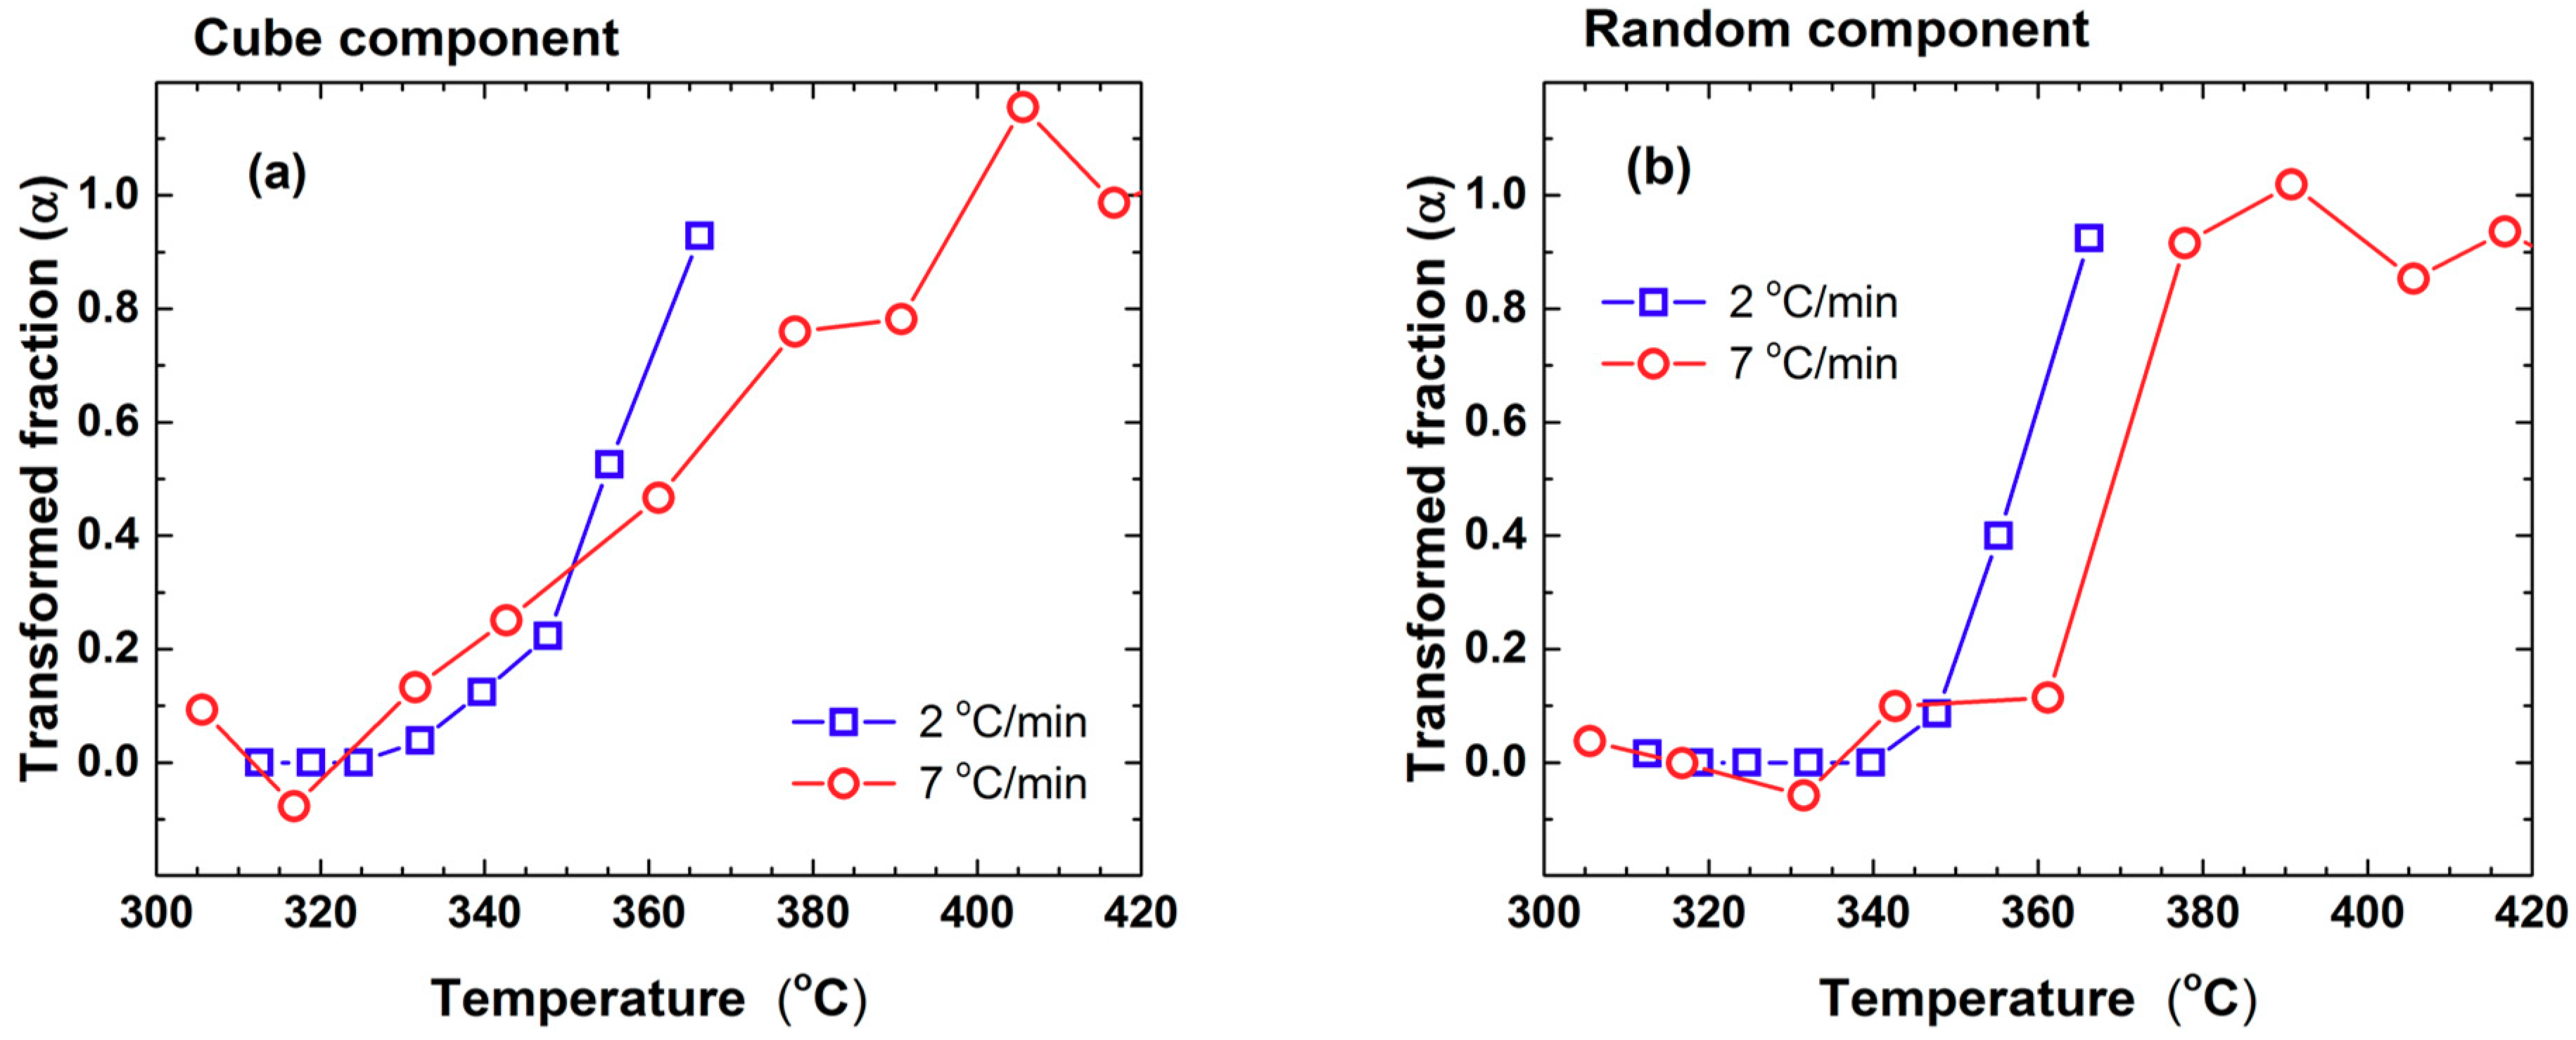
To further analyze the kinetics of growth, Rd and cube texture components volume fractions were transformed in recrystallized fractions, α, and represented in Figure 7a,b, respectively. Although the number of data points is not high enough to conclude about the growth profile, the heating rate-induced temperature shift is clearly visible.
The kinetics of recrystallization is a challenging subject requiring a detailed analysis of the single crystal grain microstructure and environment [56], but our experimental approach is limited to average macroscopic level. At this level, the kinetics of recrystallization can be treated in a phenomenological way and using the analytical approach developed for differential scanning calorimetric (DSC) measurements (see for example [57]).
The main assumption of the analytical approach is that the rate of a transformation process is solely determined by the product of two independent factors: A model function of transformed fraction, α, and a thermal factor, k(T), assumed to follow the Arrhenius law: k ( T ) = k 0 exp ( E / R T ) , where E is the activation energy [58]. Formulated in a differential way, the equation of transformed fraction during annealing with a constant heating rate, Φ , becomes:
α T = ( k 0 Φ ) e E R T f ( α )
This formulation allows for a modeless estimation of the activation energy by comparing the l n ( Φ d α d T ) values recorded at the same α and different Φ (Friedman method [59]). In an integral formulation, Equation (4) takes the following shape:
g ( ) = d d T d T = k 0 E Φ R P ( E R T ) ,
where P ( y ) is the temperature integral [58,59,60]. Different ways to approximate the temperature integral are reviewed in [58] and most of them can be reduced to the following closed form: P ( y ) y κ exp ( A y + B ) . The most used approximation, although not optimal, corresponds to ( A = 1 ,   B = 0 ,   κ = 2 ), and implies that l n ( Φ T 2 ) depends linearly on 1/T for a constant transformed fraction. By comparing the two methods to estimate the activation energy, it is interesting to observe that T 2 d α d T should be an invariant for a given degree of transformation in isochronal annealing. This indicates that that the relative change in recrystallization rate due to the change in heating rate should be twice the relative shift of temperature at a fixed transformation fraction. As the shift in temperature tends to be small, a similar small change in slope will be expected. From the two texture components, only the random component seems to follow this rule, and a value over 300 kJ/mol can be estimated as an apparent activation energy. For the cube texture kinetics under 7 °C/min heating rate, the presence of a sizeable volume fraction in the initial state promotes an early start of recrystallization, while the nucleation stage is surpassed. This early start may explain also why the final volume fraction exceeds the cube recrystallization with a factor of 2 under 2 °C/min.

4. Discussion

As a technological process, recrystallization is used to control the grains structure, as well as, for softening the metals, which lost their ductility when plastically deformed by cold working. A strong anisotropy in mechanical properties is introduced in the cold-rolled sheets, especially for large reduction, when a typical β-fiber texture is generated [61]. Assuming that a heterogeneous recovery during annealing of a largely deformed metallic alloy generates recrystallization nuclei, one has to determine the variables influencing the recrystallization and grain growth. The local crystallographic orientations of the grains, stored energy, substructure morphology and local microstructural environment are variables influencing the recovery kinetics and need to be understood for predicting the specific crystal orientations that nucleate and grow during the annealing of materials.
The Al-2%Mg experimental alloy is a good candidate for studying RCX kinetics from two points of view: (1) Being largely plastically deformed by cold rolling has a high density of dislocations, which are efficient sites for nucleation (dislocation-stimulated RCX); and (2) Having Mg addition in Al matrix it contains precipitates, which are effective nucleation sites as well (particle-stimulated RCX) [14]. A large rolling reduction of 80% and above, rotates the grains toward a stable 3D-deformation texture, β-fiber, which does not have an orientation axis, and is rather a skeleton connecting three texture components: B, S and C, or, in the medium stage of deformation: B, S and D. The source of cube RCX texture is generally considered to be in the intermediary bands (or cube bands) located between differently oriented deformation bands generated by different slip systems inside a grain during cold rolling. The preferential growth of cube-oriented grains is facilitated by their special orientation relative to the main texture components. In particular, the GBs between the cube orientation and S-deformation component with 40° rotation about a <111> axis are known to have higher mobility and lower energy, and, consequently, are prone for nucleation of RCX grains. However, our results show that the volume fraction of S, G and Q components are not changing during annealing, whereas the other components of β-fiber are consumed. That means that the S-component may be transformed into R {124}<211> component, which cannot be effectively distinguished from S-components [7]. In this respect, our approach is quite restrictive. First, the texture components are considered to be located at the same central position in the orientation space throughout the whole process. This implies that the grains are not rotating and the gradient of RCX rate across the distribution is insignificant. Second, the broadening of the distribution stays the same. This is true assuming that the transformation rate (growth or decay) is constant over the entire distribution. In fact, the same distribution was considered to describe all texture components. To remove at least part of these restrictions we need more diffraction information, either by adding more detectors and/or by dividing the detector areas in smaller regions. It is clear, however, that our approach was facilitated by the fact that the cube texture component is clearly separated by the deformation texture, even on the IPF projection (see Table 1 and Table 2 and Figure 4). However, the initial texture was rather weak and too complex to allow a good initial separation. The G and Q components, which may be considered as RCX components as well [7] may be retained, though with low certainty, by continuous RCX. Further simulations could help in designing an experimental path able to improve the orientation selection and texture components decomposition.
In neutron diffraction, the Rietveld refinement analysis makes the golden standard. Although restricted initially to powders, it underwent tremendous efforts to include more and diverse microstructural information. The MAUD software is a well-established package that allows researchers to analyze the neutron diffraction data, including texture. As such, a legitimate question arises: Why develop alternatives to an already successful approach? However, treating real materials as quasi-powders, in spite of clever averaging procedures, may become questionable in the long run. The state-of-the-art simulations of thermomechanical behavior of materials start from grain or sub-grain level, whereas the polycrystalline samples are treated in diffraction theory as objects with fictional scattering properties, which eventually obey to some symmetry laws. It may be worth looking at the diffracting objects as real polycrystalline aggregates and treat each grain as a single crystal. Such a method could be considered extremely time consuming, but at some moment it will become competitive and may offer a direct link between the structural simulations and the diffraction data. Our present approach may be considered a small step, however important, in that direction.

5. Conclusions

(a)
The ex situ and in-situ neutron diffraction measurements performed at HIPPO and VULCAN on an Al(2%Mg) alloy allowed for identification of the main texture components characterizing the deformation and recrystallization textures.
(b)
A new QMC method of analyzing the diffraction data recorded along ND and RD allowed the texture decomposition in standard components and provided their volume fractions evolution during isochronal heating.
(c)
The kinetics of recrystallization for random texture component can be analyzed using an analytic method to estimate the apparent activation energy.
(d)
Due to the presence of an initial content of cube texture, the sample annealed under 7 °C/min displayed an early start and more RCX at the end of the process.
(e)
The new QMC method of neutron diffraction data analysis may be extended to other instruments with more complex detector arrangements and may include texture component-dependent peak profile contributions as well.

Authors Contributions

B.R., S.B.G., and X.-L.W. conceived and designed the experiments; G.M. performed the material processing; S.C.V. and G.M.S. performed experiments at HIPPO and analyzed the data; G.M.S., A.D.S., K.A. and D.M. performed the experiments at Vulcan; G.M.S., L.L.D. and A.D.S. analyzed the data; G.M.S. and A.D.S. wrote the paper.

Funding

The present research was sponsored by the Laboratory Directed Research and Development Program of Oak Ridge National Laboratory (ORNL), managed by UT-Battelle, LLC, for the U.S. Department of Energy under the contract No. De-AC05-00OR22725. The data were obtained at the Spallation Neutron Source at ORNL, sponsored by the Scientific User Facilities Division, Office of Basic Energy sciences, U.S. Department of Energy. The work at HIPPO neutron diffractometer has benefited from the use of the Lujan Neutron Scattering Center at LANSCE, which is funded by the Office of Basic Energy Sciences, U.S. Department of Energy. Los Alamos National Laboratory is operated by Los Alamos National Security LLC under DOE Contract No. DE-AC52-06NA25396. The United States Government retains and the publisher, by accepting the article for publication, acknowledges that the United States Government retains a non-exclusive, paid-up, irrevocable, world-wide license to publish or reproduce the published form of this manuscript, or allow others to do so, for United States Government purposes. The Department of Energy will provide public access to these results of federally sponsored research in accordance with the DOE Public Access Plan (http://energy.gov/downloads/doepublic-access-plan). X.-L.W. acknowledges the support by a grant from the Research Grants Council of the Hong Kong Special Administrative Region [CityU 11215917].

Acknowledgments

All authors are addressing special thanks to Harley D. Skorpenske, Rebeca Mills of Oak Ridge National Laboratory, and Douglas Fielden of University of Tennessee, Knoxville for the professional and continuous support during experiments. G.M.S. would like to thank Edward Andrew Payzant of Oak Ridge National Laboratory for fruitful discussions and help.

Conflicts of Interest

The authors declare no conflict of interest.

References

  1. Hjelen, J.; Orsund, R.; Nes, E. On the origin of recrystallization textures in aluminium. Acta Metall. Mater. 1991, 39, 1377–1404. [Google Scholar] [CrossRef]
  2. Lucke, K.; Engler, O. Effects of particles on development of microstructure and texture during rolling and recrystallisation in fcc alloys. Mater. Sci. Technol. 1990, 6, 1113–1130. [Google Scholar] [CrossRef]
  3. Radhakrishnan, B.; Sarma, G.; Weiland, H.; Baggethun, P. Simulations of deformation and recrystallization of single crystals of aluminium containing hard particles. Model. Simul. Mater. Sci. Eng. 2000, 8, 737–750. [Google Scholar] [CrossRef]
  4. Engler, O.; Lucke, K. Mechanisms of recystallization texture formation in aluminium alloys. Scr. Metall. Mater. 1992, 27, 1527–1532. [Google Scholar] [CrossRef]
  5. Engler, O.; Vatne, H.E.; Nes, E. The roles of oriented nucleation and oriented growth on recrystallization textures in commercial purity aluminium. Mater. Sci. Eng. 1996, 205, 187–198. [Google Scholar] [CrossRef]
  6. Nes, E.; Vatne, H.E. The 400<111> orientation relationship in recrystallization. Z. Metallkd. 1996, 87, 448–453. [Google Scholar]
  7. Engler, O. On the origin of the R orientation in the recrystallization textures of aluminum alloys. Metall. Mater. Trans. A 1999, 30, 1517–1527. [Google Scholar] [CrossRef]
  8. Duckham, A.; Engler, O.; Knutsen, R.D. Moderation of the recrystallization texture by nucleation at copper-type shear bands in Al-1Mg. Acta Mater. 2002, 50, 2881–2893. [Google Scholar] [CrossRef]
  9. Liu, W.C.; Li, Z.; Man, C.-S. Effect of heating rate on the microstructure and texture of continuous cast AA 3105 aluminum alloy. Mater. Sci. Eng. A 2008, 478, 173–180. [Google Scholar] [CrossRef]
  10. Wang, W.X.; Zhang, J.X.; Wang, Z.J.; Liu, W.C. A comparative study of the transformation kinetics of recrystallization texture of CC and DC 3003 aluminum alloys. Mater. Charact. 2018, 141, 412–422. [Google Scholar] [CrossRef]
  11. Kumar, R.; Gupta, A.; Kumar, A.; Chouhan, R.N.; Khatirkar, R.K. Microstructure and texture development during deformation and recrystallisation in strip cast AA8011 aluminum alloy. J. Alloys Compd. 2018, 742, 369–382. [Google Scholar] [CrossRef]
  12. Hirsch, J.; Lücke, K. Mechanism of deformation and development of rolling textures in polycrystalline F.C.C. metals—I. Description of rolling texture development in homogeneous CuZn alloys. Acta Metall. 1988, 36, 2863–2882. [Google Scholar] [CrossRef]
  13. Liu, W.C.; Li, J.; Yuan, H.; Yang, Q.X. Effect of recovery on the recrystallization texture of an Al–Mg alloy. Scr. Mater. 2007, 57, 833–836. [Google Scholar] [CrossRef]
  14. Smallman, R.E.; Lee, C.S. Advances in the theory of deformation and recrystallization texture formation. Mater. Sci. Eng. 1994, 184A, 97–112. [Google Scholar] [CrossRef]
  15. Hutchinson, W.B. Nucleation of recrystallization. Scr. Metall. 1992, 27, 1471–1475. [Google Scholar] [CrossRef]
  16. Liebmann, B.; Lucke, K.; Masing, G. Orientation dependency of the rate of growth during primary recrystallization of A1 single crystals. Z. Metallkd. 1956, 47, 57–63. [Google Scholar]
  17. Humphreys, F.J. Characterisation of fine-scale microstructures by electron backscatter diffraction (EBSD). Scr. Mater. 2004, 51, 771–776. [Google Scholar] [CrossRef]
  18. Schafer, C.; Mohles, V.; Gottstein, G. Modeling the effect of heating rate on recrystallization texture evolution in AA3103. Adv. Eng. Mater. 2010, 12, 981–988. [Google Scholar] [CrossRef]
  19. Attallah, M.M.; Strangwood, M.; Davis, C.L. Influence of the heating rate on the initiation of primary recrystallization in a deformed Al–Mg alloy. Scr. Mater. 2010, 63, 371–374. [Google Scholar] [CrossRef]
  20. Li, S.; Zhao, Q.; Li, F. A review of texture evolution mechanisms during deformation by rolling in aluminum alloys. J. Mater. Eng. Perform. 2018, 27, 3350–3373. [Google Scholar] [CrossRef]
  21. Nes, E.; Solberg, J.K. Growth of cube grains during recrystallization of aluminium. Meter. Sci. Technol. 1986, 2, 19–21. [Google Scholar] [CrossRef]
  22. Bailey, J.E.; Hirsch, P.B. The recrystallization process in some polycrystalline metals. Proc. R. Soc. Lond. 1962, 267, 11–30. [Google Scholar] [CrossRef]
  23. Dillamore, I.L.; Katoh, H. The Mechanisms of Recrystallization in Cubic Metals with Particular Reference to Their Orientation-Dependence. Met. Sci. 1974, 8, 73–83. [Google Scholar] [CrossRef]
  24. Umezawa, A.; Inagaki, H. Formation of cube recrystallized grains in high purity aluminum. Z. Metallkd. 2006, 97, 49–58. [Google Scholar] [CrossRef]
  25. Miszczyk, M.M.; Paul, H.; Driver, J.H.; Poplewska, J. The influence of deformation texture on nucleation and growth of cube grains during primary recrystallization of AA1050 alloy. Acta Mater. 2017, 129, 378–387. [Google Scholar] [CrossRef]
  26. Radhakrishnan, B.; Sarma, G. Coupled simulations of texture evolution during deformation and recrystallization of fcc and bcc metals. Mater. Sci. Eng. 2008, 494, 73–79. [Google Scholar] [CrossRef]
  27. Radhakrishnan, B.; Sarma, G. The effect of coarse non-deformable particles on the deformation and static recrystallization of aluminium alloys. Philos. Mag. E 2004, 84, 2341–2366. [Google Scholar] [CrossRef]
  28. Sarma, G.B.; Radhakrishnan, B. Modeling microstructural effects on the evolution of cube texture during hot deformation of aluminum. Mater. Sci. Eng. A 2004, 385, 91–104. [Google Scholar] [CrossRef]
  29. Sidor, J.J.; Petrov, R.H.; Kestens, L.A.I. Modeling the crystallographic texture changes in aluminum alloys during recrystallization. Acta Mater. 2011, 59, 5735–5748. [Google Scholar] [CrossRef]
  30. Wang, Y.D.; Wang, X.-L.; Stoica, A.D.; Almer, J.D.; Lienert, U.; Haeffner, D.R. Separating the recrystallization and deformation texture components by high-energy X-rays. J. Appl. Cryst. 2002, 35, 684–688. [Google Scholar] [CrossRef]
  31. Liss, K.D.; Clemens, H.; Bystrzanowski, S.; Stark, A.; Buslaps, T.; Schimansky, F.P.; Gerling, R.; Scheu, C.; Schreyer, A. Recrystallization and phase transitions in a γ-TiAl-based alloy as observed by ex situ and in-situ high-energy X-ray diffraction. Acta Mater. 2006, 54, 3721–3735. [Google Scholar] [CrossRef]
  32. Liss, K.D.; Schmoelzer, T.; Yan, K.; Reid, M.; Peel, M.; Dippenaar, R.; Clemens, H. In-situ study of dynamic recrystallization and hot deformation behavior of a multiphase titanium aluminide alloy. J. Appl. Phys. 2009, 106, 113526. [Google Scholar] [CrossRef]
  33. Lauridsen, E.M.; Poulsen, H.F.; Nielsen, S.F.; Jensen, D.J. Recrystallization kinetics of individual bulk grains in 90% cold-rolled aluminium. Acta Mater. 2003, 51, 4423–4435. [Google Scholar] [CrossRef]
  34. Poulsen, S.O.; Lauridsen, E.M.; Lyckegaard, A.; Oddershede, J.; Gunlach, C.; Curfs, C.; Jensen, D.J. In-situ measurements of growth rates and grain-averaged activation energies of individual grain during recrystallization of 50% cold-rolled aluminium. Scr. Mater. 2011, 64, 1003–1006. [Google Scholar] [CrossRef]
  35. Branger, V.; Mathon, M.H.; Baudin, T.; Penelle, R. “In-situ” neutron diffraction study of the cube crystallographic texture development in Fe53%-Ni alloy during recrystallization. Scr. Mater. 2000, 43, 325–330. [Google Scholar] [CrossRef]
  36. Lonardelli, I.; Gey, N.; Wenk, H.R.; Humbert, M.; Vogel, S.C.; Lutterotti, L. In-situ observation of texture evolution during α → β and β → α phase transformation in titanium alloys investigated by neutron diffraction. Acta Mater. 2007, 55, 5718–5727. [Google Scholar] [CrossRef]
  37. Aydogan, E.; El-Atwani, O.; Takajo, S.; Vogel, S.C.; Maloy, S.A. High temperature microstructural stability and recrystallization mechanisms in 14WT alloys. Acta Mater. 2018, 148, 467–481. [Google Scholar] [CrossRef]
  38. Christien, F.; Telling, M.T.F.; Knight, K.S.; Le gall, R. A method for the monitoring of metal recrystallization based on the in-situ measurement of the elastic energy release using neutron diffraction. Rev. Sci. Instrum. 2015, 86, 053901. [Google Scholar] [CrossRef] [PubMed] [Green Version]
  39. Wang, X.L.; Holden, T.M.; Rennich, G.Q.; Stoica, A.D.; Liaw, P.K.; Choo, H.; Hubbard, C.R. VULCAN—The engineering diffractometer at the SNS. Phys. B Condens. Matter 2006, 385, 673–675. [Google Scholar] [CrossRef]
  40. Vogel, S.C.; Hartig, C.; Lutterotti, L.; Von Dreeele, R.B.; Wenk, H.R.; Williams, D.J. Texture measurements using the new neutron diffractometer HIPPO and their analysis using the Rietveld method. Powder Diffr. 2004, 19, 65–68. [Google Scholar] [CrossRef]
  41. Reiche, H.M.; Vogel, S.C. A versatile automated sample changer for texture measurements on the high-pressure preferred orientation neutron diffractometer. Rev. Sci. Instrum. 2010, 81, 093302. [Google Scholar] [CrossRef] [PubMed]
  42. Reiche, H.M.; Vogel, S.C.; Mosbrucker, P.; Larson, E.J.; Daymond, M.R. A furnace with rotating load frame for in-situ high temperature deformation and creep experiments in a neutron diffraction beam line. Rev. Sci. Instrum. 2012, 83, 053901. [Google Scholar] [CrossRef] [PubMed]
  43. Lutterotti, L.; Matthies, S.; Wenk, H.R.; Schultz, A.J.; Richardson, J. Combined texture and structure analysis of deformed limestone from time-of-flight neutron diffraction spectra. J. Appl. Phys. 1997, 81, 594–600. [Google Scholar] [CrossRef]
  44. Wenk, H.R.; Lutterotti, L.; Vogel, S. Texture analysis with the new HIPPO TOF diffractometer. Nucl. Instrum. Methods Phys. Res. A 2003, 515, 575–588. [Google Scholar] [CrossRef]
  45. Wenk, H.R.; Lutterotti, L.; Vogel, S.C. Rietveld texture analysis from TOF neutron diffraction data. Powder Diffr. 2010, 25, 283–296. [Google Scholar] [CrossRef]
  46. Xu, P.G.; Harjo, S.; Ojima, M.; Suzuki, H.; Ito, T.; Gong, W.; Vogel, S.C.; Inoue, J.; Tomota, Y.; Aizawa, K.; et al. High stereographic resolution texture and residual stress evaluation using time-of-flight neutron diffraction. J. Appl. Phys. 2018, 51, 746–760. [Google Scholar] [CrossRef] [PubMed]
  47. Stoica, G.M.; Stoica, A.D.; An, K.; Ma, D.; Wang, X.L. Extracting grain-orientation-dependent data from in-situ time-of-flight neutron diffraction. I. Inverse pole figures. J. Appl. Cryst. 2014, 47, 2019–2029. [Google Scholar] [CrossRef]
  48. Ma, D.; Stoica, A.D.; Wang, Z.; Beese, A.M. Crystallographic texture in an additively manufactured nickel-base superalloy. Mater. Sci. Eng. A 2017, 684, 47–53. [Google Scholar] [CrossRef]
  49. Bachmann, F.; Hielscher, R.; Schaeben, H. Texture Analysis with MTEX–Free and Open Source Software Toolbox. Solid State Phenom. 2010, 160, 63–68. [Google Scholar] [CrossRef]
  50. An, K. VDRIVE—Data Reduction and Interactive Visualization Software for Event Mode Neutron Diffraction; ORNL Report No. ORNL-TM-2012-621; Oak Ridge National Laboratory: Oak Ridge, TN, USA, 2012. [Google Scholar]
  51. Clausen, B. SMARTSWare Los Alamos National Laboratory Report; LAUR-04-6581; Los Alamos National Laboratory: Los Alamos, NM, USA, 2003. [Google Scholar]
  52. Matthies, S.; Vinel, G.W.; Helmig, K. Standard Distributions in Texture Analysis; Akademie-Verlag: Berlin, Germany, 1987; Volumes I–III, pp. 1987–1990. [Google Scholar]
  53. Tarasiuk, J.; Wierzbanowski, K.; Bacroix, B. Texture decomposition into Gauss-shaped functions: Classical and genetic algorithm methods. Comput. Mater. Sci. 2004, 29, 179–186. [Google Scholar] [CrossRef]
  54. Bohlke, T.; Haus, U.; Schulze, V. Crystallographic texture approximation by quadratic programming. Acta Mater. 2006, 54, 1359–1368. [Google Scholar] [CrossRef] [Green Version]
  55. Dessieux, L.L.; Stoica, A.D.; Bingham, P.R. Single crystal to polycrystal neutron transmission simulation. Rev. Sci. Instrum. 2018, 89, 025103. [Google Scholar] [CrossRef] [PubMed] [Green Version]
  56. Radhakrishnan, B.; Sarma, G.B.; Zacharia, T. Modeling the kinetics and microstructural evolution during static recrystallization—Monte Carlo simulation of recrystallization. Acta Mater. 1998, 46, 4415–4433. [Google Scholar] [CrossRef]
  57. Benchabane, G.; Boumerzoug, Z.; Gloriant, T.; Thibon, I. Microstructural characterization and recrystallization kinetics of cold-rolled copper. Phys. B Condens. Matter 2011, 406, 1973–1976. [Google Scholar] [CrossRef]
  58. Starink, M.J. The determination of activation energy from linear heating rate experiments: A comparison of the accuracy of isoconversion methods. Thermochim. Acta 2003, 404, 163–176. [Google Scholar] [CrossRef]
  59. Friedman, H.I. Kinetics of thermal degradation of char-forming plastics from thermogravimetry. J. Polym. Sci. Part C 1964, 6, 183–195. [Google Scholar] [CrossRef]
  60. Liu, F.; Sommer, F.; Bos, C.; Mittemeijer, E.J. Analysis of solid state phase transformation kinetics: Models and recipes. Int. Mater. Rev. 2007, 52, 192–212. [Google Scholar] [CrossRef]
  61. Sidor, J.; Miroux, A.; Petrov, R.; Kestens, L. Microstructural and crystallographic aspects of conventional and asymmetric rolling processes. Acta Mater. 2008, 56, 2495–2507. [Google Scholar] [CrossRef]
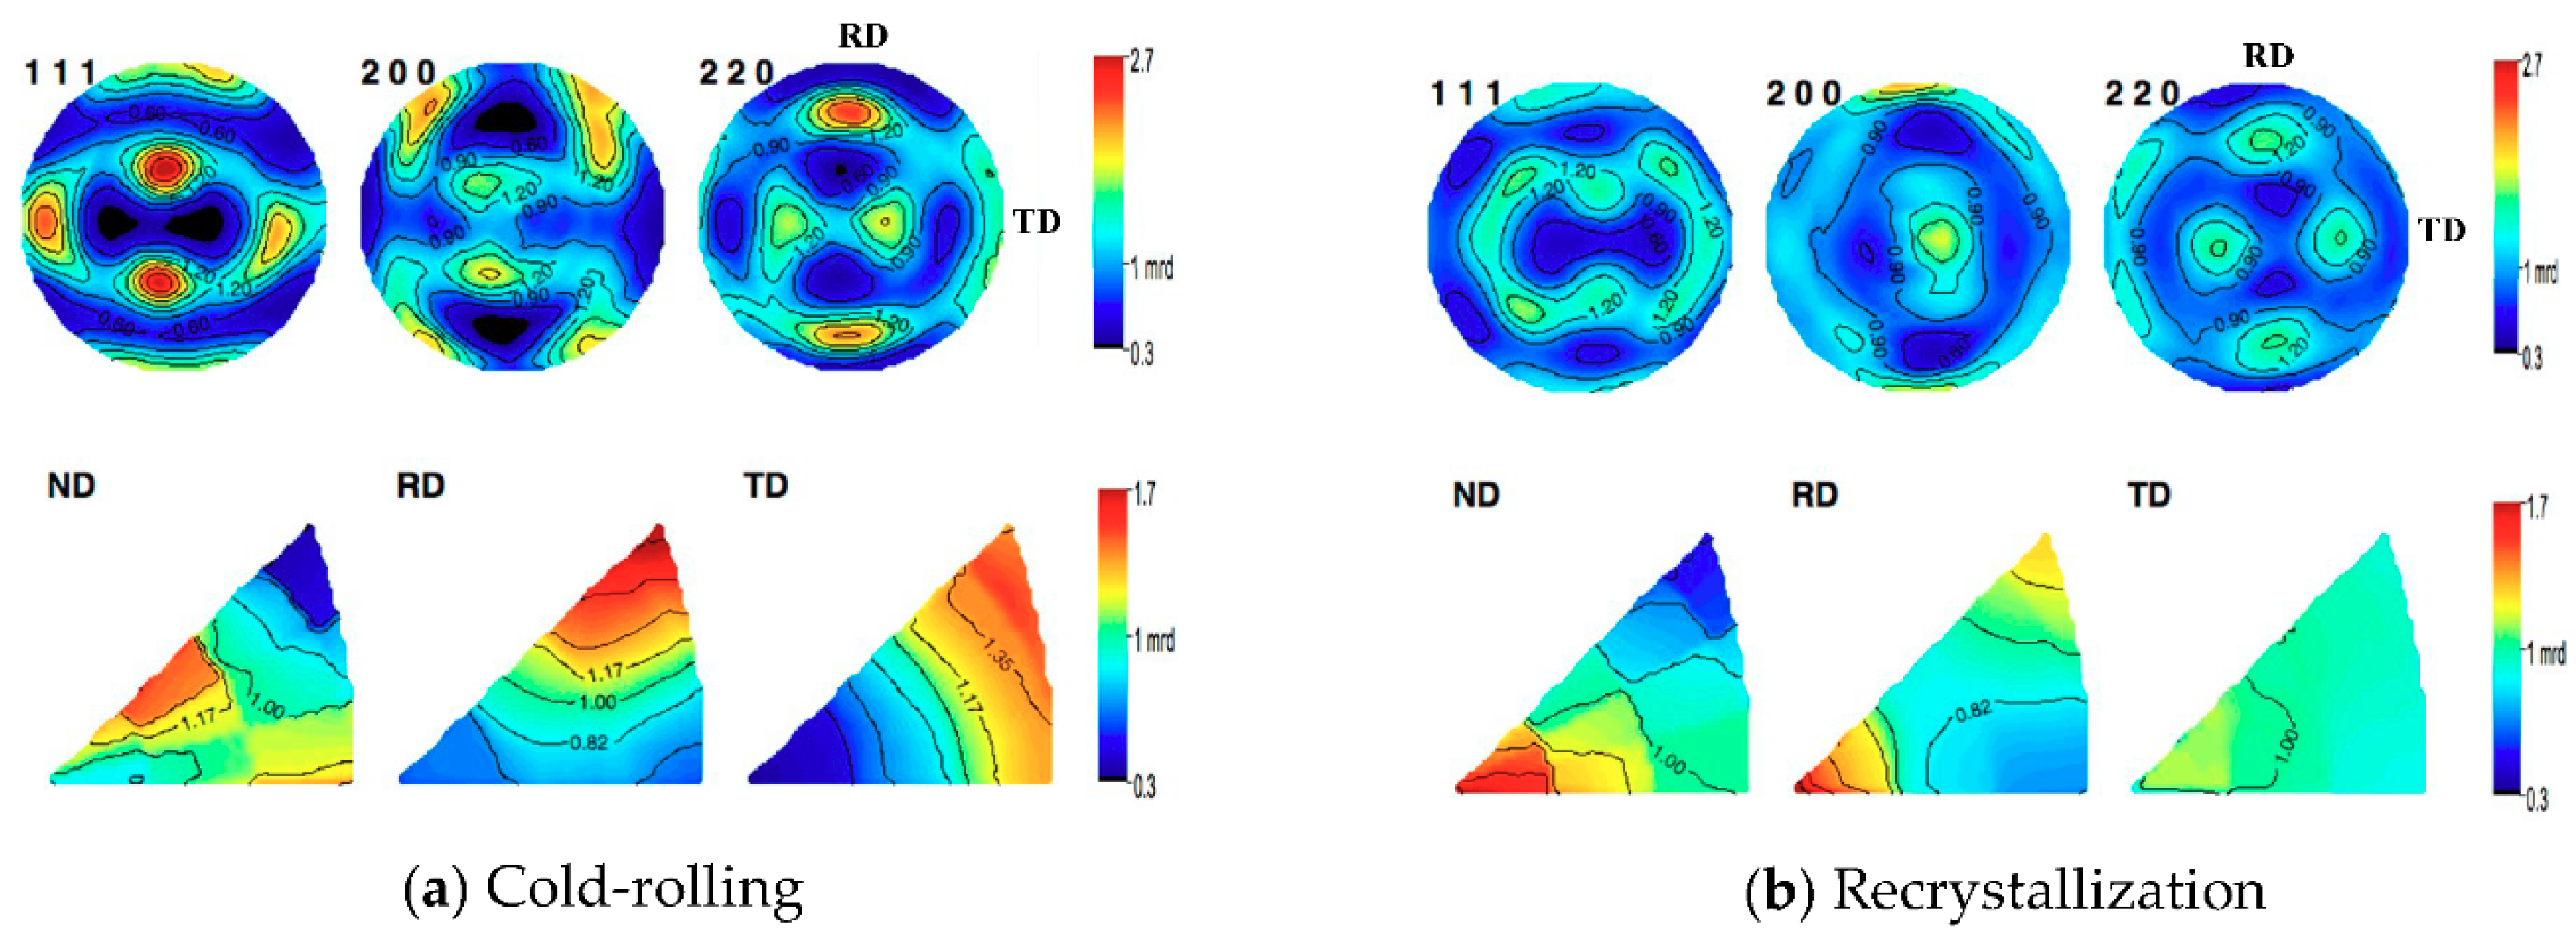
Figure 1. Ex situ textures (pole figures (PFs) and inverse pole figures (IPFs)) of Al-2%Mg alloy measured at room temperature at HIPPO neutron diffractometer for (a) DT by cold-rolling and (b) recrystallization (RCX) after annealing at 350 °C. ND: normal direction; RD: rolling direction; TD: transversal direction; mrd: multiples of random distribution.
Qubs 02 00017 g001
Figure 2. Ex situ textures (PFs and IPFs) of Al-2%Mg alloy measured at room temperature at VULCAN neutron diffractometer: (a) Cold-rolling deformation and (b) recrystallization after annealing at 350 °C. DF: deformation.
Qubs 02 00017 g002
Figure 3. The experimental setup at VULCAN neutron diffractometer for in-situ heating experiments; two detector banks, Bank 1 and Bank 2, are recording data from two perpendicular sets of sample planes, RD and ND.
Qubs 02 00017 g003
Figure 4. Inverse pole figures of the texture components simulated with quasi-Monte-Carlo (QMC) method.
Qubs 02 00017 g004
Figure 5. Comparison between experimental IPFs (square symbols) and QMC fit (red lines) representing the temporal evolution of texture components in AL-2%Mg ally during in-situ annealing at VULCAN up to 350 °C with heating rates of (a) 2 °C/min, and (b) 7 °C/min.
Qubs 02 00017 g005
Figure 6. Kinetics of texture components in Al-2%Mg alloy in-situ annealed at VULCAN with heating rates of (blue) and 2 °C/min and (red) and 7 °C/min for (a) total rolling components; (b) random component; and (c) cube component. Data acquisition duration for each point was 2 min.
Qubs 02 00017 g006
Figure 7. Kinetics of texture components in Al-2%Mg alloy in-situ annealed at VULCAN with heating rates of (blue) 2 °C/min, and (red) 7 °C/min for (a) cube component and (b) random component. Data acquisition duration for each point was 2 min.
Qubs 02 00017 g007
Table 1. The texture indexes, t j i d , calculated with QMC-method for each texture component, j, in RD.
RDRandom
mrd
S
{123}<634>
Dillamore
{4411}<11118>
Brass
{110}<112>
X
{114}<311>
Cube
{001}<100>
Goss
{011}<100>
Q
{310}<123>
<111>12.734.701.840.310.000.000.94
<001>10.030.000.160.777.227.230.18
<011>10.430.230.250.180.010.021.09
<113>10.880.451.442.100.890.851.08
<133>11.221.220.850.390.010.011.42
<012>10.380.100.471.010.630.640.66
<112>11.911.842.231.560.100.111.46
<135>10.800.470.901.000.200.201.17
Table 2. The texture indexes, t j i d , calculated with QMC-method for each texture component, j, in ND.
NDRandom
mrd
S
{123}<634>
Dillamore
{4411}<11118>
Brass
{110}<112>
X
{114}<311>
Cube
{001}<100>
Goss
{011}<100>
Q
{310}<123>
<111>10.840.250.050.050.000.110.01
<001>10.050.390.011.777.170.022.10
<011>11.070.374.650.160.014.140.34
<113>10.972.030.211.920.840.261.38
<133>11.530.511.980.170.012.040.17
<012>10.691.071.411.280.631.341.65
<112>11.441.470.200.740.100.270.41
<135>11.181.151.460.830.191.430.85
Table 3. Volume fractions of texture components before (DF) and after annealing (RCX) for 2 heating rates, 2 °C/min and 7 °C/min.
RandomSDillamoreBrassXCubeGossQ
DF at 2 °C/min0.000.110.150.150.310.000.070.21
DF at 7 °C/min0.020.150.120.150.310.030.070.16
RCX at 2 °C/min0.430.110.020.000.060.100.070.21
RCX at 7 °C/min0.380.150.050.000.000.190.070.16