Article

Selective State DOT Lane Width Standards and Guidelines to Reduce Speeds and Improve Safety

1
Department of City and Metropolitan Planning, College of Architecture + Planning, University of Utah, 375S 1530E, Salt Lake City, UT 84112, USA
2
Urban Policy and Administration, Incheon National University, 119 Academy-ro, Yeonsu-gu, Incheon 22012, Republic of Korea
3
STV Inc., 1600 Perimeter Park Dr., Suite 225, Morrisville, NC 27560, USA
*
Author to whom correspondence should be addressed.
Infrastructures 2024, 9(9), 141; https://doi.org/10.3390/infrastructures9090141
Submission received: 28 July 2024 / Revised: 20 August 2024 / Accepted: 21 August 2024 / Published: 26 August 2024

Abstract

This research investigates the lane width standards and guidelines implemented by various State Departments of Transportation (DOTs) to reduce vehicle speeds and enhance road safety. Lane width reduction is often perceived as a strategy to mitigate speed and improve safety. Still, its effectiveness and implications vary across different contexts, including regions, urban/rural settings, or other geometric design features. Drawing from interviews with five State DOTs and a review of their road design manuals, this study aims to identify suggested lane widths depending on the contexts, design exception process when narrowing or widening lane widths, and introduce representative before/after studies. The findings indicate that State DOTs tend to have lower recommended lane widths in urban areas than in rural areas. Moreover, lane width standards among these states vary due to several factors, including the geographical location of roadways (urban or rural areas), design or posted speeds, traffic volume, road classification, and geometric road design features. Design exceptions are required if the existing or proposed design element is incompatible with both AASHTO and department governing criteria. In conclusion, the findings will provide valuable insights and recommendations for policymakers, transportation planners, and road engineers to inform optimal lane width and decision-making processes.

1. Introduction

Reducing vehicle lane widths is frequently employed to reduce vehicle speed, improve road safety, and make room for other design elements such as bike lanes and raised medians. According to the comprehensive street design guide jointly published by the American Society of Civil Engineers (ASCE), the National Association of Home Builders (NAHB), the Urban Land Institute (ULI), and the Institute of Transportation Engineers (ITE), designers are advised to choose the minimum lane width that can reasonably meet all practical needs. This approach minimizes construction and maintenance costs while maximizing the livability of the community. Moreover, previous studies have shown that decreased vehicle lane widths on residential streets result in fewer injury crashes [1,2,3,4].
However, more recent articles found that the relationship between lane width and crashes can vary depending on the geographical context of examined roads. In rural settings, some studies reported a significant correlation between collision risk and characteristics associated with road widths [5,6,7]. In contrast, a study of nonfreeway urban roads found that wider vehicle lanes are associated with decreases in roadside and midblock collisions [8]. Reducing lane width in urban settings may result in lower travel speeds and, consequently, affect traffic volumes.
In addition to traffic conditions, the effects of narrowing lane width are conditional depending on roadside factors, such as roadway curvature, median type, roadside objects, and development. For example, if objects such as trees, buildings, and parked cars are close to a driver, they provide the driver with reference points to judge how fast they are moving, which tends to slow them down. If the same fixed objects are set far from the road, drivers lack reference points and are likelier to speed. In a complex urban setting, a higher risk of pedestrian–vehicle crashes is mainly due to driver behavior caused by parked vehicles on the street. On roads with parked cars, drivers typically face higher levels of stress, reduce their speed, and position their vehicles farther from the centerline to avoid oncoming traffic [9]. Solowczuk et al. investigated the changes in traffic volume and speed before and after the implementation of lane narrowing in the city of Szczecin, Poland. Their findings indicated that lane narrowing on urban dual carriageways may not be an effective measure. It is crucial to consider certain parameters, such as the layout and profile of the existing road and the location of intersections, which can significantly influence the achievement of the desired speed distribution [10]. Nevertheless, there needs to be more consensus on the optimal lane width vis-a-vis traffic conditions and roadway factors. While lane width reduction is often seen as a strategy to reduce speed and improve safety, its effectiveness and implications vary across different contexts, including regions, urban/rural settings, or other geometric design features. A comprehensive study specifically focusing on these practical implications is limited within the context of the United States.
As a companion paper, we investigated the connection between lane width, speed, and crash rates to understand road safety and transportation impacts [11]. Data from 320 urban arterial sections in Utah were analyzed. The results consistently support reducing minimum lane widths in Utah, indicating that narrower lanes on urban arterials can reduce vehicle speeds without increasing crash rates. Narrower lanes in urban areas led to lower speeds, with each foot of reduction resulting in just over one mph speed decrease. Additional factors influencing urban arterial speeds include the number of lanes, median presence, on-street parking density, roadside objects, and block length. Safety modeling showed no direct relation between lane width and total crash counts per mile in both urban areas. However, injury crash counts on urban arterials were positively related to lane width and speed, with wider lanes and higher speeds increasing the likelihood of injury crashes. Other significant factors for crash counts were the number of lanes and the annual average daily traffic per lane in thousands. In conclusion, this study supports reducing lane widths to enhance road safety and optimize transportation infrastructure in urban areas. Decision-makers and transportation agencies can use these findings to improve road safety and performance.
Although lane width reduction is often perceived as a strategy to mitigate speed and improve safety, still, its effectiveness and implications vary across different contexts, including regions, urban/rural settings, or other geometric design features. A comprehensive study specifically focusing on these practical implications is limited within the context of the United States.
Therefore, this study aims to identify the lane width standards and guidelines implemented by State Departments of Transportation (DOTs) based on the geographical and roadway contexts. It also examines the design exception processes for narrowing or widening lane widths and introduces representative before-and-after studies. The research addresses the following research questions: (1) How do lane width standards vary across different DOTs? (2) What conditional factors determine different lane widths? (3) How do State DOTs narrow or widen lane widths through design exception processes? By answering these research questions, it will identify suggested lane widths depending on the contexts, and design exception processes when narrowing or widening lane widths.
For the analysis, we conducted in-depth, semi-structured qualitative interviews with State DOTs to address these research questions. Additionally, design manuals and guidelines obtained from each interviewee were systematically reviewed to extract suggested lane widths based on contexts and underlying rationales embedded within the standards and guidelines.

2. Methods

2.1. Research Context

The research context encompasses an in-depth examination of lane width standards and guidelines established by State Departments of Transportation (DOTs) across various geographic regions. It examines the regulatory frameworks, policy documents, and design guidelines that dictate lane width standards in each state. By situating the research within the broader scope of transportation policy and infrastructure development, the study identifies the factors influencing lane width decisions and their impacts on road safety and traffic management. Through a comparative analysis of different DOT practices and standards, the research seeks to identify patterns, trends, and variations in lane width standards, thereby providing insights into the diverse contexts that influence lane width standards.

2.2. Interviews with State Department of Transportation

We selected five State DOTs known for their progressive policies. In a diverse range of transportation environments, selecting DOTs with exemplary narrow lane width policies required a systematic approach. Leveraging the prior experience of our research team alongside comprehensive internet searches, we identified five DOTs representing both urban and rural contexts across the East and West Coasts of the United States. We conducted comprehensive, semi-structured qualitative interviews with the Vermont Agency of Transportation (VTrans), the Oregon Department of Transportation (ODOT), Caltrans (California), the Florida Department of Transportation (FDOT), and the Delaware Department of Transportation (DelDOT) to answer our research questions.
These interviews highlighted that lane width standards are shaped by the geographic characteristics of the roadways and various roadway conditions, such as speed limits, traffic volume, the presence of roadside objects, medians, and roadway types. Additionally, city walkability and the need for bike lanes significantly influence the preferred minimum lane widths.
Within the interview, questions mainly focused on design criteria, design exceptions, and completed projects on urban and suburban roadways involving lane width reduction. In the case of available reduced lane width design, the project motives were analyzed, and written reports on the before–after analysis of these projects were acquired. Additionally, any obstacles or drawbacks experienced by reducing lane width were investigated. Some of the sample questions that were discussed during interviews are as follows:
According to the standards under what circumstances do you use narrow lanes? What is your default lane width for arterials, both urban and rural?”.
When you reduce lanes, through reconstructing or resurfacing a road and narrow lanes by foot from 12 to 11. What do you typically do with that extra foot per lane?”.
Have you done any studies to see how lane narrowing, and maybe the addition of sidewalk and/or a bike lane on each side has affected either speed, or safety, or capacity, or pedestrian traffic or traffic?”.
Do you have a program for reducing lane width or do you have a practice of reducing lane width? And have you done before and after studies to see how the narrower lanes performed with respect to crash rates and in speeds 85th percentile speeds? Is that something that Florida has done once, twice? Maybe multiple times?”.
The interviews directed us to various documents that inform the decision-making process regarding lane width on state highways and streets.

2.3. Document Reviews

A qualitative analysis revealed patterns, trends, and insights into lane width standards and their impact on road safety and traffic management. The initial step involved collecting documents outlining lane width standards and guidelines from various State DOTs, including regulatory documents, design manuals, and policy guidelines.
Next, the collected documents were systematically reviewed to identify commonalities, differences, and emerging themes across different DOTs. Document analysis, a qualitative analysis method, was utilized to review and interpret these documents, which is the most efficient way of gaining access to lane width standards and guidelines. Using pre-existing documents as data offers benefits, such as fewer ethical concerns over other qualitative methods [12]. To accomplish this, we extracted all text related to lane width and lane narrowing by conducting multiple keyword searches within the collected PDFs. The extracted content was then compiled into a comprehensive database. This database was subsequently analyzed to identify the most salient guidelines and standards concerning lane width reduction. It is important to note that, to ensure the accuracy and relevance of our findings, we exclusively reviewed the most recent versions of standards, guidelines, and manuals, thereby minimizing potential conflicts in the data.
Lastly, the analysis extended to examining completed projects that implemented lane width reductions on urban and suburban roadways, aiming to uncover insights into the practical effects of narrower lanes. By synthesizing findings from documents and projects, the study aimed to offer valuable insights and recommendations for policymakers, transportation planners, and road engineers to inform optimal lane width and decision-making processes.

3. Statewide Roadway Design Standards, Manuals, and Policies for Lane Widths

Interviews with DOTs confirmed that they all have multiple statewide roadway design standards, manuals, and policies that regulate vehicle lane widths and limit the reduction of vehicle lane widths.

3.1. Florida Department of Transportation (FDOT)

FDOT recommends 10 feet as the minimum design criterion for urban conditions and 11 feet for rural areas. However, various factors like speed limits, annual average daily traffic (AADT), and truck volume may necessitate wider lanes. Safety considerations are critical in selecting the appropriate lane width for a roadway. For instance, 10-foot lanes on rural roads with a 60 mph speed limit tend to increase crash rates. However, FDOT employs a context classification system in its road design process, which allows for local needs to be considered, ensuring the most suitable road design criteria are applied (Interview quotes should be here. An engineer from FDOT stated).
Florida Design Manual (FDM) establishes geometric design criteria and procedures for new construction, reconstruction, and resurfacing projects on state and national highway systems [13]. These criteria are mandatory for designing FDOT projects unless specific Design Exceptions or Variations are approved per the manual’s procedures. The FDM prescribes lane width standards for arterial and collector roads within Florida’s highway system. For interstates, freeways, and expressways, a minimum lane width of 12 feet is required.
According to the FDM, lane width selection is based on design speeds. Roads and streets are classified by context, which helps define target speeds. This context classification is a design control that dictates essential design elements for arterials and collectors. The target speed is the maximum speed at which vehicles should operate on a particular thoroughfare, considering the specific context. The appropriate street design aims to achieve the target speed and ensure safety, mobility, and efficiency. Ideally, the target speed should align with the design speed, especially when speeds are 45 mph or lower.
FDM highlights lane narrowing as a strategy for speed management strategy, noting that
The use of narrow lanes (less than 12 feet) alone has a limited impact on operating speeds. However, this effect can be enhanced as traffic volumes increase. Visible lane narrowing can serve as a transitional device to signal a change in context. For example, narrowing two 12-foot lanes to 11-foot or 10-foot lanes by adjusting the lane lines and creating a hatch in the newly formed edge space has proven effective in alerting drivers to changing conditions. To maximize effectiveness, lane narrowing should be combined with other low-speed strategies, such as adding parking, creating medians, or introducing chicanes”.
FDM recommends using the following mitigation strategies for lane width exceptions and variations, including
  • The optimal combination of shoulder and lane width to enhance safety.
  • Advanced signage indicating changes in lane width.
  • The use of sensory tools to delineate lanes.
  • Designing safe shoulders and edges for vehicles that may leave the lane.
  • Reducing crash severity through safe design on road shoulders.
If the new design value has safety aspects, FDOT mandates a benefit and cost analysis. This analysis considers the reduced crashes and aggregated costs during the project’s lifespan. The state roadway design engineer reviews requests for design exceptions, and depending on the project’s scope, the chief engineer, state structures engineer, planning office, and FHWA may also be involved. Approval is required at the district level for design variations. Specifically, FDOT necessitates approval from the state roadway design engineer for lane width design exceptions.
From our interviews, we learned the following:
One of the things that we’ve recognized in our literature reviews and discussions is that simply changing or reducing the lane width solely, by itself, doesn’t have much effect. We’ve been doing some speed management, where we’ve introduced horizontal or vertical deflection we have more impact on speeds. Vertical deflection has become common as with raised crosswalks on the state highway system. We didn’t used to allow them. But horizontal deflection has been very effective. One of our worst corridors with the highest fatalities in the state, we kind of, if you will, put in every countermeasure. What we found is that doing lane narrowing alone, not coupled with other features, that give that sense of canopy or tightness with the trees doesn’t in itself have a huge effect”.
Regarding their findings on narrowing lane widths FDOT engineers shared
What we found is that they (decision makers) embraced the context classifications because they love the idea of being able to do 10-foot lanes downtown somewhere, and where it was supposed to be low speed. And they (decision makers) love the idea that they could say yes to that project downtown but say no to this other 10-foot lane in an urban or rural setting, before they had no way to justify why they were saying yes to one and no to the other. And so, they said no to everything”.

3.2. Vermont Agency of Transportation (VTrans)

Vermont State Design Standards, adopted by the Vermont Agency of Transportation (VTrans) in 1997, provide flexible technical guidelines for designing transportation projects in Vermont [14]. These standards aim to ensure that transportation projects align with the social context of the state, minimize environmental impacts, and maximize public benefits. They guide the physical design of roadways and bridges, sometimes supplementing standards previously used by VTrans and the American Association of State Highway and Transportation Officials (AASHTO). Key factors such as speed, traffic volume, and functional classifications of roadways determine lane width standards.
Index 3.5 and Index 4.5 of the Design Standard document outline lane width recommendations for urban and rural Principal Arterials and Minor Arterials, respectively. Due to the significant differences between urban and rural settings, the manual does not provide a table of values but instead offers the following guidelines for both contexts:
  • Principal Arterials in Urban and Village Areas: Lane widths may range from 10 to 12 feet, with appropriate curb offsets.
  • Highly Restricted Areas with Minimal Truck Traffic: 10-foot lane widths are suitable.
  • Urban and Village Principal Arterials: 11-foot lanes are typically used for street designs.
  • High-Speed, Free-Flowing Principal Arterials: 12-foot lane widths are recommended.
Additionally, the standards include specific provisions for narrower lane widths in urban and village arterial settings. According to the document,
Under interrupted-flow conditions at low speeds (up to 45 mph), narrower lane widths are generally adequate and offer certain advantages. Reduced lane widths enable more lanes within restricted right-of-ways and make pedestrian crossings easier due to the reduced crossing distance. They are also more economical to build. An 11-foot lane width is sufficient for through lanes, continuous two-way left-turn lanes, and lanes adjacent to a painted median. A 10-foot width is acceptable for left-turn or combination lanes for parking and traffic during peak hours”.
Indexes 3.6 and 4.6 of the Vermont State Design Standards provide tabulated lane width standards for rural principal and minor arterials, ranging from 11 to 12 feet. The lane width for urban and village collectors is detailed in the subsequent chapter, and according to Index 5.5, it varies from 9 to 11 feet. The manual specifies
9-foot lane widths are suitable for areas with severe space constraints and minimal truck traffic. Conversely, 11-foot lanes are typically applied to higher-speed, free-flowing Collectors”.
Index 6.4 addresses lane width standards for local streets in urban and village areas, which can vary from 7 to 11 feet. Specifically,
  • 7 to 8 Feet: These widths are ideal for areas with severe space limitations and minimal vehicular activity.
  • 9 to 11 Feet: These widths cater to areas requiring more flexibility and where higher speeds or increased vehicle flow are anticipated.
The standards aim to accommodate diverse roadway contexts while ensuring safety and functionality.
From our interviews with VTrans engineers, we learned
So, while there were abilities to go down below 12 or 11 feet, again, that was really focused on speed and traffic volumes to make those types of decisions. One of the reasons our highway safety design engineering instruction was developed to formalize the ability to have more flexibility and ability to recognize the benefits of having more widths for different uses on our roadways”.
Regarding the VTrans approach towards lane narrowing they shared
The engineering instruction basically sets our lane width to 11 feet (instead of 12 feet) for the state system. The primary reason was more of a complete street bicyclist accommodation approach, and it was thought to be the flexibility that was allowed within our state standards and now within the Greenbook even more, however wasn’t necessarily being utilized in all cases. And there’s increased demand for the limited footprint that we have to make it accommodating for all users and especially on our rural roads, that was challenging. So, the engineering instruction was more of a systematic type of approach, where if we have a resurfacing job, more of that kind of three R’s (resurfacing, restoration, and rehabilitation) type approach. It allows us to better utilize the space to accommodate bicyclists and traffic without, the larger scale investment of widening”.

3.3. Oregon Department of Transportation (ODOT)

Blueprint for Urban Design (BUD), introduced in 2020, was developed to integrate the latest urban design criteria into the Oregon Department of Transportation (ODOT) projects [15]. This update responds to significant changes in urban design principles since the last revision of the Highway Design Manual (HDM) in 2012. The BUD enhances the application of HDM standards to maximize corridor potential and align with long-term objectives. It is now the primary design document for all urban projects during the planning, scoping, or initiation stages. Approval of the Urban Design Concurrence document establishes project context and design criteria and records design decisions, which is a crucial step in the final Design Acceptance Package process.
Expanding upon the HDM, the BUD offers detailed design guidelines tailored to six urban contexts, inspired by the National Cooperative Highway Research Program (NCHRP) Report 855: An Expanded Functional Classification System for Highways and Streets. Notably, it acknowledges rural communities—small, often unincorporated areas that may meet federal urban classification criteria despite populations under 5000. Although classified as rural arterials, these communities often display urban characteristics and should be designed with an urban context in mind.
The BUD provides recommended design elements for each urban context, including lane widths. The recommended travel lane widths generally range from 11 to 12 feet across all contexts, except for the Traditional Downtown/Central Business District (CBD) context, where an 11-foot width is suggested.
Through interviews with ODOT engineers, we learned the following:
We suggest flexible cross-sections rather than absolute numbers. While our preferred measurement is 11 feet, the BUD allows for a range of 11 to 12 feet due to discussions with our freight community. We initially excluded 10 feet from the range, although our chief engineer does not oppose it. It requires a design exception based on appropriateness and route needs”.
Regarding the applicability of lane narrowing they mentioned
The state’s highway design approach differs from local jurisdictions prioritizing their grid and specific needs. The state must consider long-term, extensive mobility. We cannot permit 9-foot road lanes where 25% of the traffic is trucks. Decisions are made based on appropriateness for the specific location, relying on flexibility in project-level decision-making processes”.
Any departure from the lane width design standards outlined by the 2020 BUD or the 2023 ODOT Highway Design Manual necessitates a design exception. Specifically, travel lane widths below 11 feet require additional approvals. These design exceptions must be approved by the State Traffic-Roadway Engineer and require signatures from the Engineer of Record (EOR) and the State Traffic-Roadway Engineer. In certain cases, such as for “High Speed” NHS Roadways, approval from the Federal Highway Administration (FHWA) may also be required. The design exception process involves detailed data, including a summary of the proposed exception, its impact on other standards, compatibility with adjacent sections, and cost implications for building to the standard.

3.4. California Department of Transportation (Caltrans)

The Department of Transportation (Caltrans) set the Highway Design Manual (HDM). According to Index 301.1 of HDM, the standard minimum lane width for two-lane and multilane highways, ramps, collector roads, distributor roads, and other related roadways is generally set at 12 feet, with specific exceptions [16]. Caltrans strives to create a cohesive and efficient transportation network that supports walking, biking, transit, and passenger rail, offering integrated, complete street facilities that are comfortable, convenient, and connected for all users.
Exceptions to the 12-Foot Standard:
  • Conventional State Highways: For highways with posted speeds of 40 miles per hour or less and average annual daily truck traffic (AADTT) below 250 per lane in urban areas, city or town centers, and rural main streets, the minimum lane width is reduced to 11 feet.
  • Right-Turn Channelization: Section 405.3 of the HDM permits the reduction of right-turn lane width to 10 feet in urban, city, or town centers (and rural main streets) where posted speeds are below 40 miles per hour, space is severely constrained, and truck or bus volumes are low.
  • Standard Lane Widths and Exceptions (Index 301.1):
  • Conventional State Highways: For urban, city, or town centers and rural main streets with speeds ≤ 40 mph and AADTT < 250 per lane, the minimum lane width is 11 feet, while 12 feet is preferred.
  • Interchanges: Where a two-lane conventional State highway connects to a freeway within an interchange, the lane width must be 12 feet. The outermost lane in each direction must also be 12 feet for multilane State highways connecting to freeways.
  • Curve Radii: For highways, ramps, and roads with curve radii of 300 feet or less, additional width must be considered to accommodate vehicle off-tracking and minimize conflicts with bicycles.
Additional lane width considerations for roads under the jurisdiction of other entities, such as city streets and county roads, are addressed in Index 308.1. Index 405.2 specifies that the lane width for single and double left-turn lanes on State highways should be 12 feet for both left-turn and right-turn channelization. However, in urban, city, or town centers and rural main streets with posted speeds ≤ 40 mph and AADTT < 250 per lane, a minimum lane width of 11 feet is permissible.
During interviews, the Caltrans engineers mentioned
We created policies to provide additional design flexibility for the lowest speed, lower truck volume to allow the use of 11 feet in the urban and the Town Center. So, the 11 feet provide the flexibility for a bike lane or the other feature so they can have an additional room without widening the way to fit the other feature with the existing roadway; that’s the goal of that”.
Caltrans District 6 engineer also shared
So, where we have slower speeds, even 40 miles per hour and lower, I have absolutely no problem going with 10-foot lanes. We don’t have a lot of 10-foot lanes right now, as I mentioned before, these are projects in the works. We had a conventional highway; it was by Highway 168 but by Fresno State. And there were some right-of-way concerns. And to get bus bays, and dual left turn lanes, we went down from 12-foot lanes down to 10-foot lanes. And this was a conventional highway that had a 40 mile per hour speed limit. So, wherever we had these very long left turn pockets, which were 400 feet long. And this is a very busy roadway 50,000 ADT, but we went down to 10-foot lanes with no issues. I mean, no collision history related to the lanes in this new urban environment; you’re always kind of getting to get the congestion-related crashes, the rear ends. But as far as the Sideswipe experience, None. But we relinquished that facility, gosh, close to 20 years ago”.

3.5. Delaware Department of Transportation (DelDOT)

The Delaware Road Design Manual is based on its road design regulations on the AASHTO Green Book and tries to remain consistent [17]. The typical lane width in Delaware is between 10 to 12 ft, which complies with the Green Book. The design guidelines for lane width, promulgated by the DelDOT, state that:
  • 12-Foot Lanes: These are recommended for new construction and reconstruction projects on roadways with 55 mph or higher design speeds.
  • 11-Foot Lanes: These are advised for roadways with design speeds ranging from 35 to 50 mph, particularly when adjacent to bike lanes.
  • 10-Foot Lanes: These should be used for roadways with design speeds below 35 mph but should be avoided on transit routes and roads with heavy truck traffic.
The manual emphasizes that the appropriate lane width should be determined based on the specific needs and conditions of each project, utilizing engineering judgment. Most new designs start with a 12-foot lane and adjust as necessary to fit existing conditions, making an 11-foot lane a common, non-exceptional choice in many cases. This flexibility is especially relevant in Delaware’s dense transportation network, where spatial constraints often necessitate redesigns. Reducing lane widths from 12 to 11 feet can create additional space for other uses, such as bike lanes, without requiring a formal design exception.
Applications of Reduced Lane Widths:
  • Pavement Rehabilitation Projects: Extra space gained from lane width reduction is often allocated to broader shoulders or bike lanes.
  • Urban Road Diets: In urban areas, the additional space might be utilized for parking or other purposes.
  • Intersection Improvements: Reducing lane widths can help create additional turn lanes, enhancing roadway capacity.
During interviews with DelDOT engineers, it was noted that there is no significant impact on traffic operations, including crash rates and speeds, when comparing 11-foot and 12-foot lanes. From a driver’s perspective, the lane width reduction by 1 foot is generally not perceptible, and no complaints have been received about lanes being “too narrow”. While 10-foot lanes are rare and primarily found in rural areas, they are not recommended for routes with high truck volume or high-speed corridors due to potential operational limitations for transit vehicles.
DelDOT engineers mentioned
We’ve had a lot of projects where we’ve gone from 12-foot lanes down to 11-foot lanes just to squeeze it in, and I’ve never heard one person say these lanes are too narrow. I’ve never seen like we were having negative effects from an operational or safety perspective”.
Regarding the use of an extra foot per lane that is obtained from lane narrowing, they also shared
I think it depends on the context of the project. In a pavement rehab type of environment, it’s either just going to a wider shoulder or a bike lane…. sometimes we’ll even do the road diets where we can reduce the number of travel lanes, and we have to figure out what to do with that excess space. There are some urban areas where it would go to maybe parking but often, it’s going to shoulder or bike lane”.
DelDOT is preparing to release an updated version of its roadway design manual. In this new manual, the default lane width will be standardized at 11 feet. This represents a shift from previous guidelines, where an 11-foot lane width was only acceptable under specific conditions. The new guidelines also specify road classifications where 11-foot lanes can be utilized, reflecting a broader regulatory and terminological alignment with the Manual on Uniform Traffic Control Devices (MUTCDs).
The revisions aim to enhance safety and manage traffic speeds through lane width reductions. The agency has implemented several “Road Diet” or “Road Reconfiguration” projects, resulting in reduced speed and crash rates on various corridors due to new roadway layouts. In some pavement rehabilitation projects that added bike lanes, an observed increase in average speeds was attributed to the smoother new pavement despite the narrower lanes.

3.6. Summary

Table 1 summarizes the review of lane width standards, which are conditional on geographical contexts and other road geometry factors.

4. Before and after Studies

In our interviews, only one implemented before and after the study of lane width reduction was cited, the case of Powerline Road in Fort Lauderdale, Florida. However, other State DOTs mentioned upcoming before and after studies that will be described in this section.

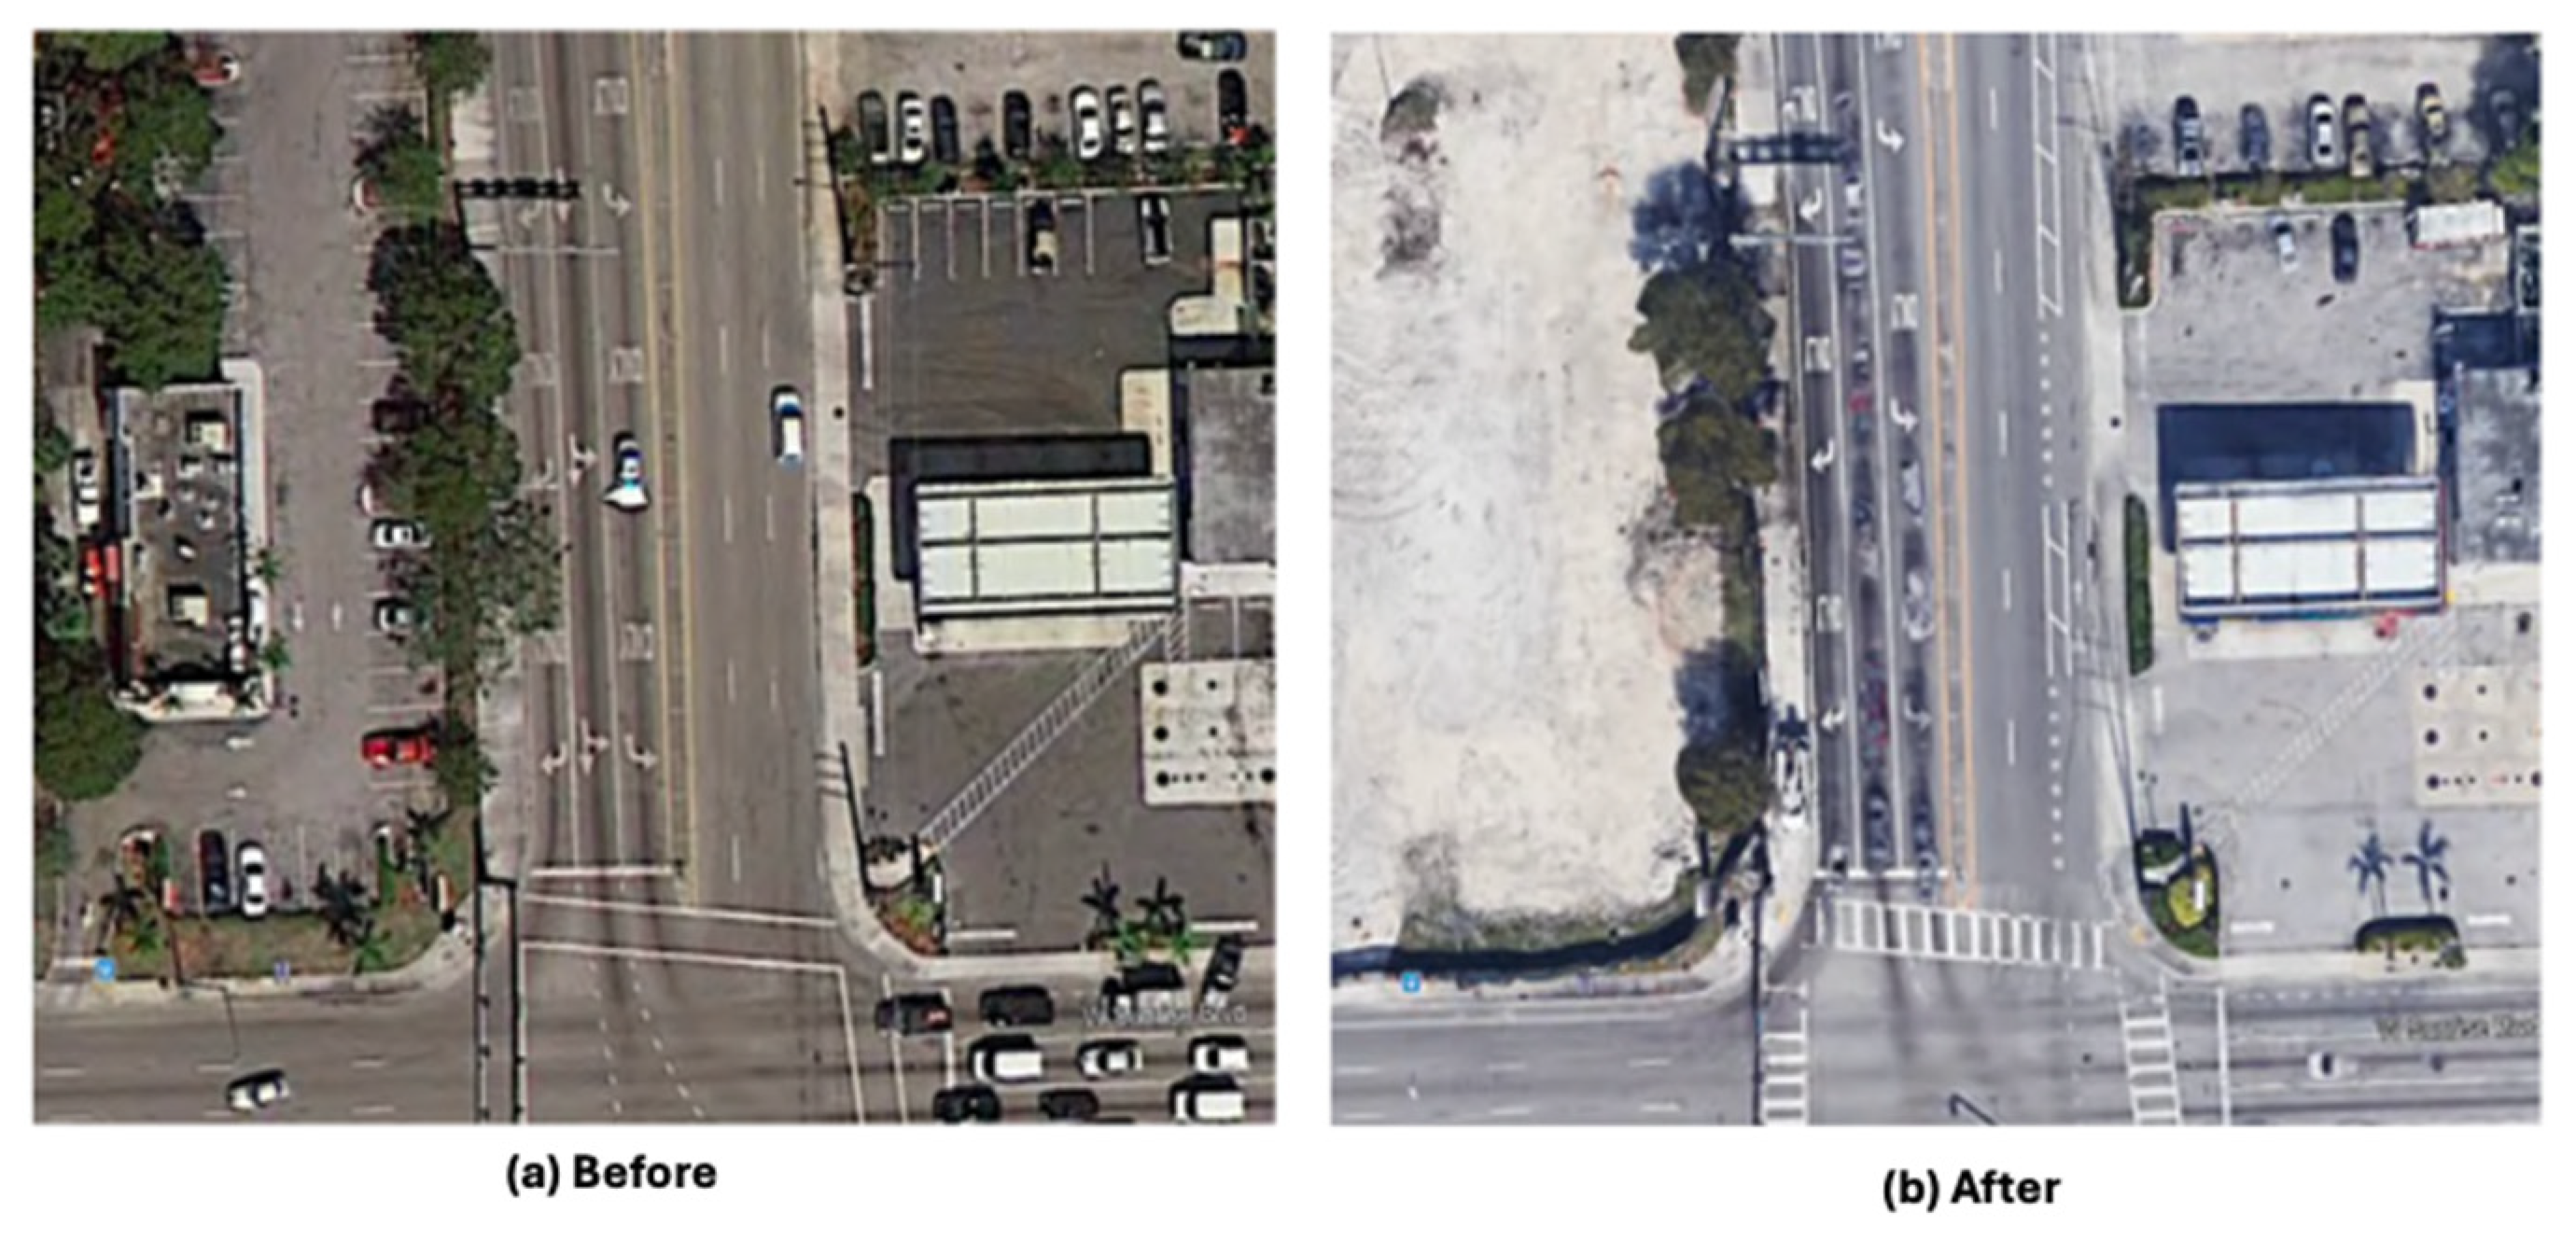
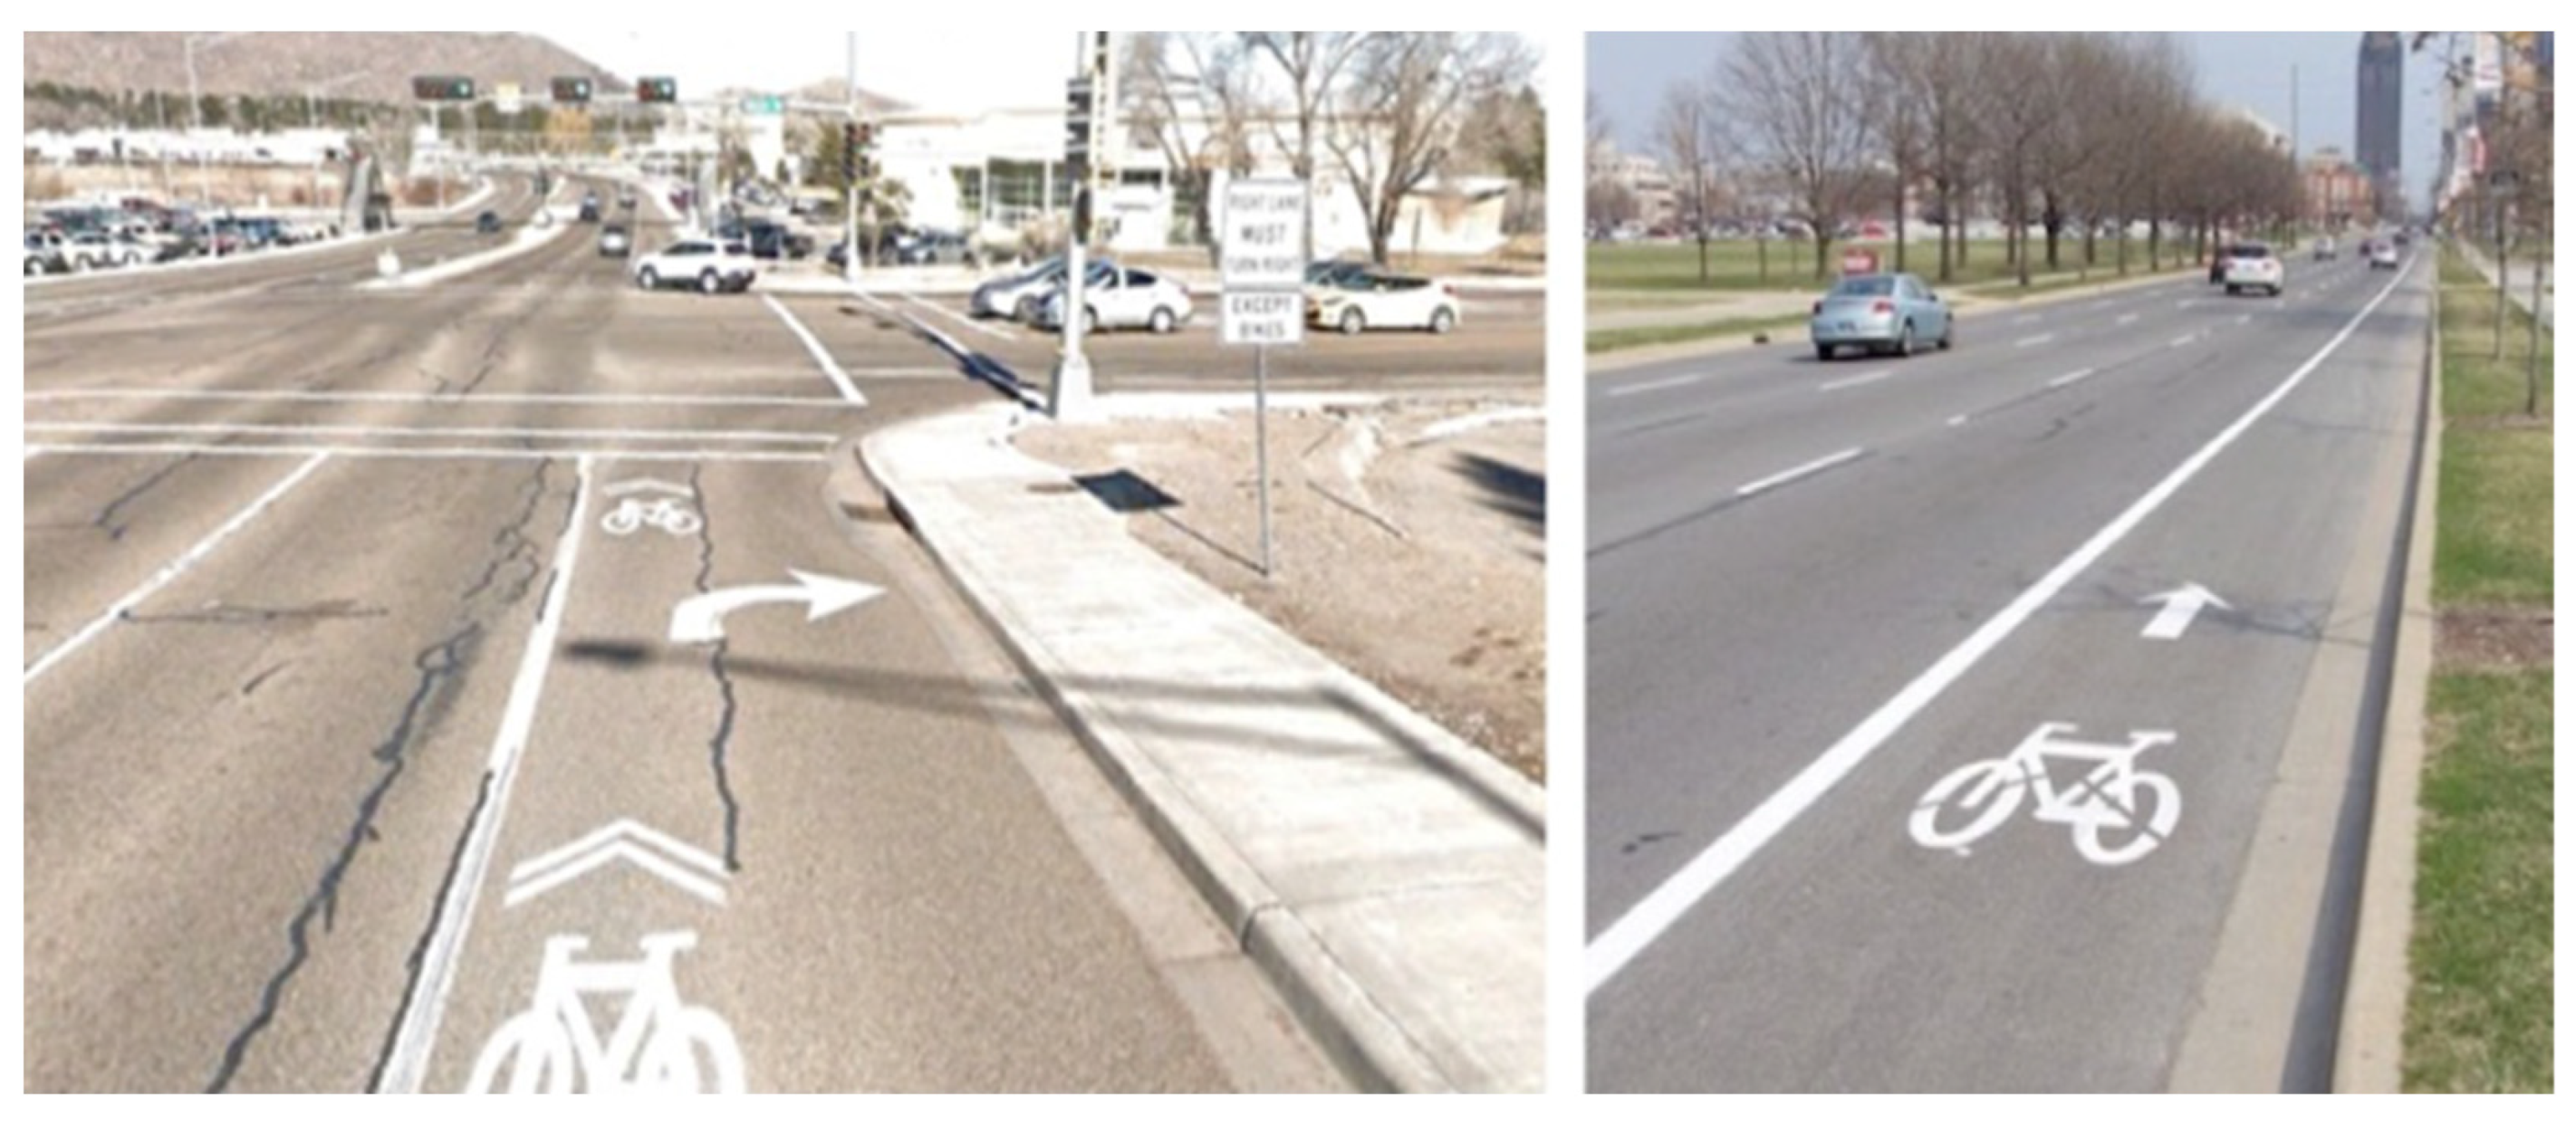
4.1. Powerline Road Project (Fort Lauderdale, Florida)

The Powerline Road Project in Fort Lauderdale, Florida, aimed to enhance infrastructure by establishing dedicated bike lanes along N.W. 19th Street, spanning from State Road 7 (SR7) to Powerline Road [18]. This initiative, detailed by the Florida Department of Transportation in 2021, strategically accommodated cyclists along Powerline Road, a pivotal north–south minor urban arterial paralleling Interstate 95 and Andrews Avenue within Fort Lauderdale and Wilton Manors.
The project encompassed various enhancements: 4-foot-wide bike lanes were implemented by reducing traffic lane widths from 12 feet to 10 feet through pavement milling, resurfacing, and selective widening from SR7 to N.W. 29th Avenue, as well as from N.W. 24th Avenue to N.W. 15th Avenue. Further along the route, from N.W. 29th Avenue to N.W. 24th Avenue and from N.W. 15th Avenue to Powerline Road, 5-foot-wide bike lanes featuring 3-foot-wide buffers were established by converting outer traffic lanes into buffered bike lanes, achieved through pavement milling, resurfacing, and restriping efforts (see Figure 1).
In addition, the project included retrofitting several existing curb ramps to comply with current Americans with Disabilities Act (ADA) standards, enhancing bicycle signage and pavement markings, and installing new pedestrian countdown signals at all signalized intersections. The comprehensive improvements were executed at an estimated cost of approximately USD 3.5 million.
The Powerline Road Lane Repurposing Before and After Study, focusing on the period from 2014 to 2019, analyzed various metrics to assess the impact of lane repurposing on this key transportation corridor in Fort Lauderdale, Florida. Commencing construction in January 2017 and completing in June 2017, the study designated 2014–2016 as the before-construction period, 2017 as the construction year, and 2018–2019 as the after-construction period.
Average Annual Daily Traffic (AADT) along Powerline Road saw a moderate increase from 22,500 vehicles in 2014 to 25,000 vehicles in 2019, indicating an 11% growth over the six years. Comparable growth rates were observed on adjacent roads, ranging from 4% to 17%. During peak hours, both morning and evening, slight decreases in volume were noted, contrasting with minor increases on nearby thoroughfares like W Sunrise Boulevard and W Oakland Park Boulevard.
Before the lane repurposing, average daily travel speeds on Powerline Road were 27 miles per hour (mph) in both directions. Post-construction speeds slightly decreased, averaging 25 mph in 2018 and rebounding to around 26 mph in 2019. Despite reduced capacity, the impact on travel speeds was minimal, aligning closely with speeds observed prior to the project initiation.
However, the compliance rate with posted speed limits declined by 9% across the study corridor and adjacent areas, potentially influencing travel times, which showed a slight increase, especially during peak periods. Instances of nonrecurring longer travel times within monthly data cycles were also more prevalent post-repurposing, reflecting heightened traffic demands.
Although delays for vehicles increased after lane reduction, the Level of Service (LOS) for the corridor remained stable at “C”, except for a minor segment of adjacent roads experiencing a downgrade to LOS “F”. The study also assessed the impact on bicyclists using the Level of Traffic Stress (LTS), revealing a reduction from the highest stress level (4) to one, indicative of improved comfort for cyclists, consistent with project objectives. Conversely, LTS for pedestrians remained unchanged at level 2, as pedestrian-specific enhancements were not implemented.
Regarding safety, the project demonstrated notable success in reducing crashes and enhancing overall roadway safety. Decreases were observed in crashes involving injuries and fatalities, although there was an increase in pedestrian injuries. Conversely, injuries to bicyclists decreased, with a smaller proportion of total crashes involving cyclists.
Economically, the project positively impacted property values in the study area, which increased by 65% over six years, exceeding the 49% rise observed in adjacent regions. This underscores the broader economic benefits associated with infrastructure improvements.
In conclusion, while the lane repurposing project on Powerline Road did not compromise auto traffic mobility or corridor throughput, it achieved its primary objectives of enhancing cyclist safety, maintaining traffic flow, and stimulating local economic growth.

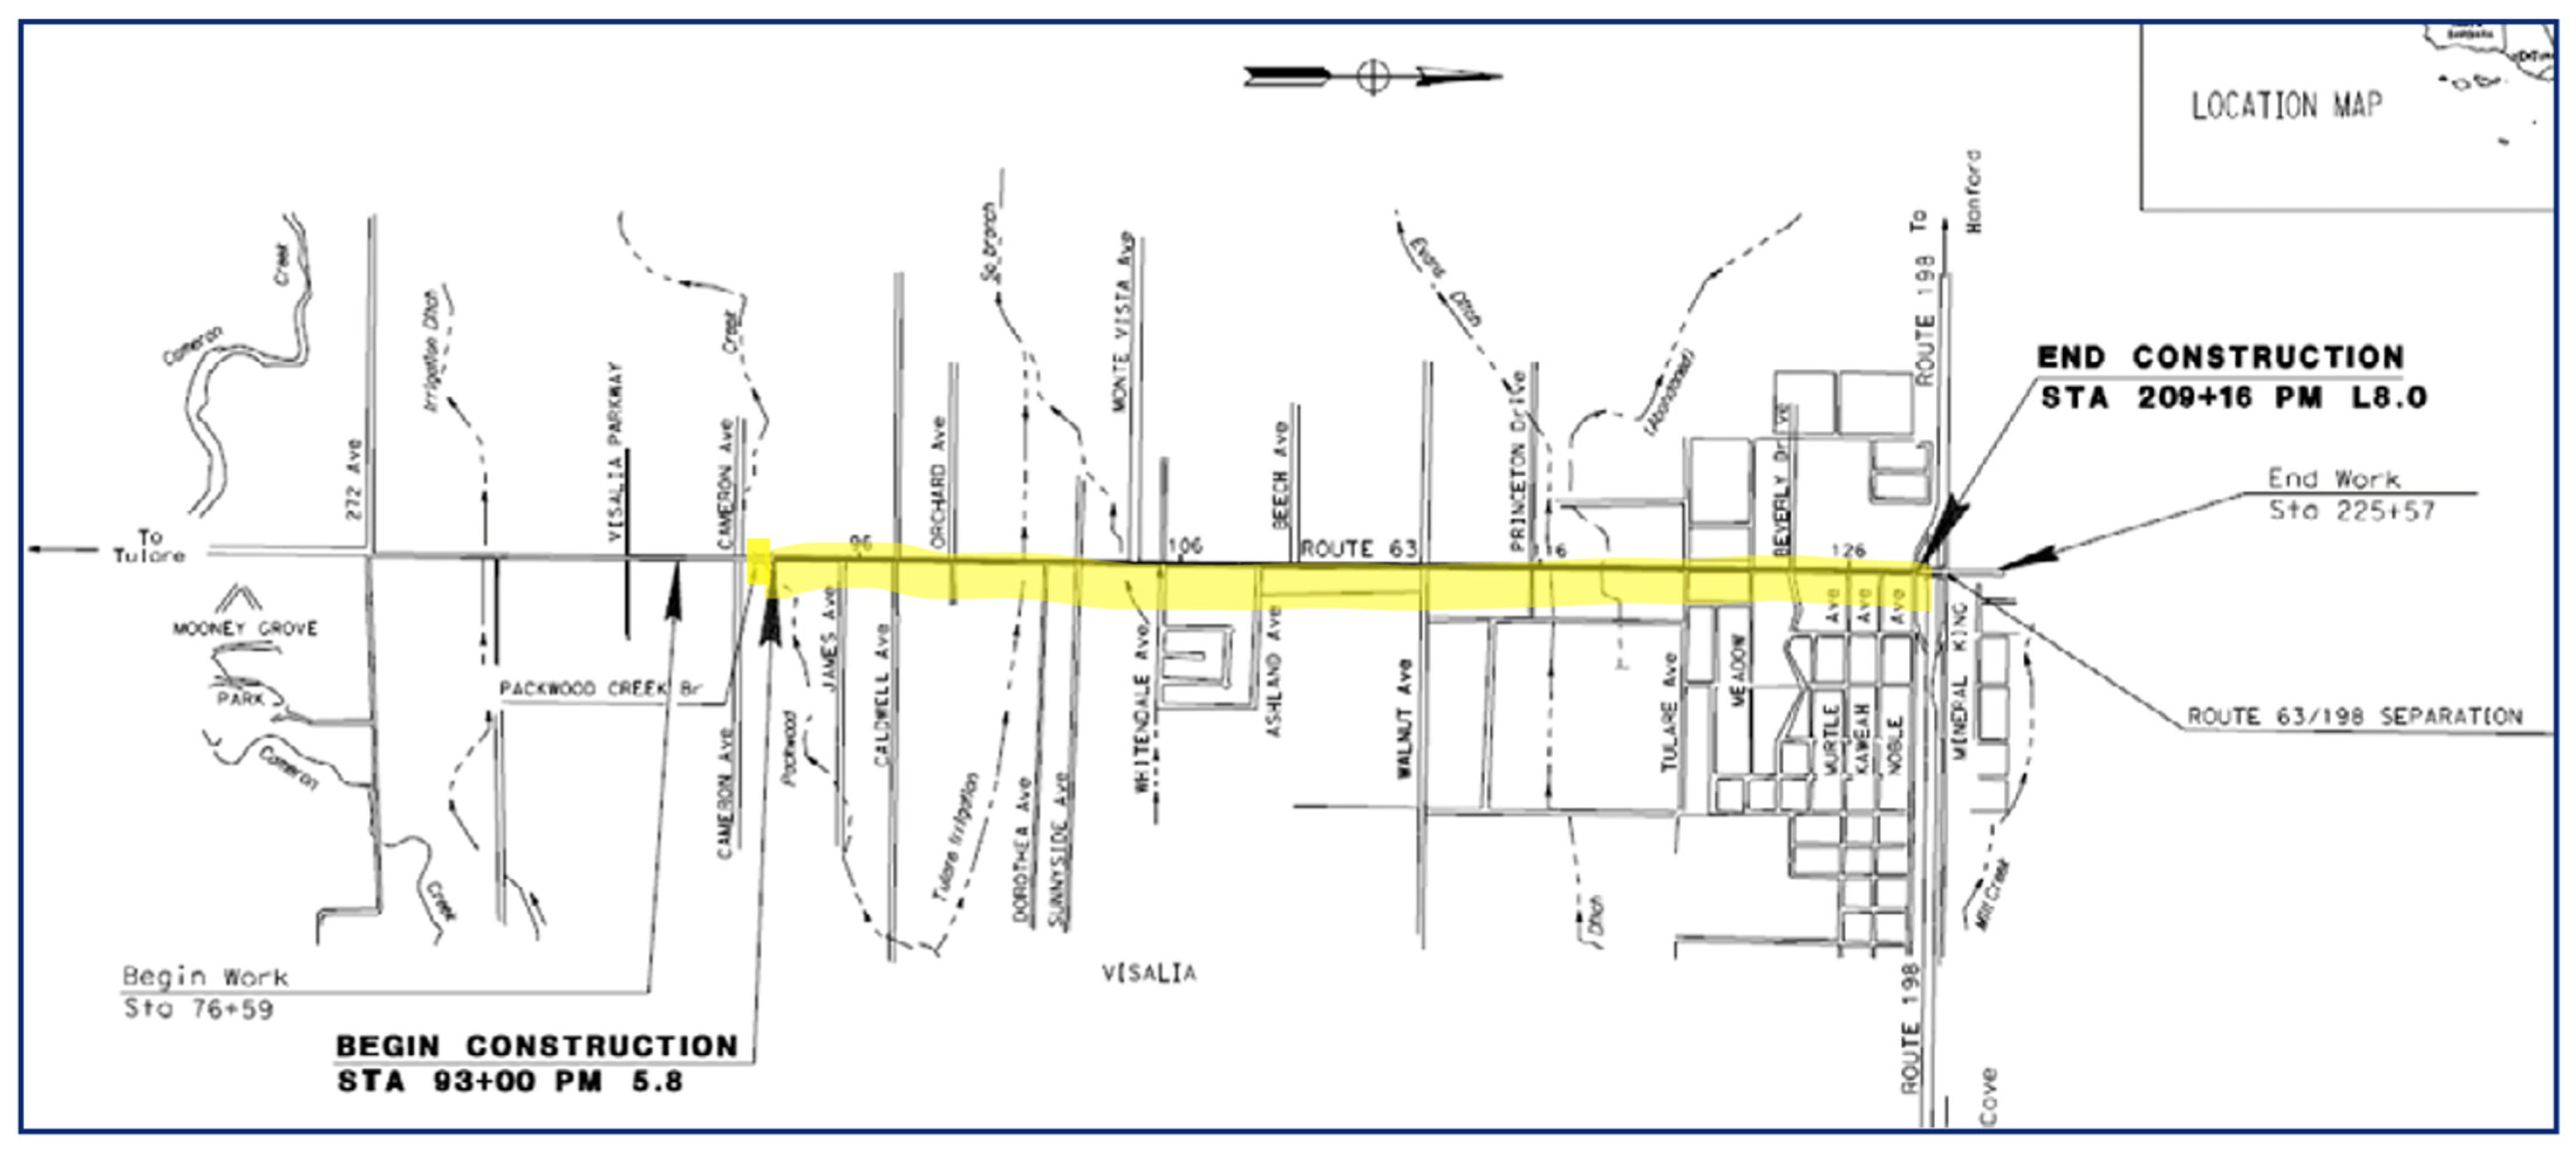
4.2. State Route 63 Redesign (Mooney Blvd, California)

State Route 63 (S.R. 63) is a north–south state highway in the Central Valley, starting adjacent to Tulare at Route 137, running north through the city of Visalia and the towns of Cutler and Orosi, and then ending 8 miles (13 km) north of Orange Cove. The primary aim of the State Route 63 project is to implement continuous dedicated bike lanes to enhance bicyclist safety. Historically, this highway featured standard 5-foot bike lanes, green paint in conflict zones, and shared lane markings (arrows) within narrow right-turn lanes, posing hazards to cyclists (Figure 2).
Figure 3 illustrates the project area map showing the location where construction starts on a 2.2-mile segment of Mooney Blvd. The construction cost is estimated at around USD 11.8 million, with the schedule for the fall of 2023. As part of this segment, the width of existing travel lanes will be reduced from 12 feet to a narrower width of 10 or 11 feet. This modification enables the integration of 5-foot Class II bike lanes, supplemented with green markings in locations where possible conflicts may occur. Figure 4 depicts the planned configuration of bike lanes over a 0.8-mile section of N Dinuba Blvd, extending from W Houston Avenue to W Robin Drive. Additional project elements include upgrading traffic signals, installing sign panels, and providing curb ramps. The width of travel lanes will be narrowed from 12 feet to 10–11 feet, and green paint will be applied where conflicts may occur to establish 5-foot Class II bike lanes as planned.

5. Discussion and Conclusions

In summary, lane width standards are critical in roadway design, impacting safety, traffic flow, and infrastructure development. Variability among state DOTs underscores the need for context-specific guidelines. This study highlights the importance of understanding the nuanced impacts of lane width adjustments. These adjustments can influence traffic flow and driving behavior, with variations observed across different geographical and transportation contexts. For instance, in congested urban settings, narrowed lanes can calm traffic and improve pedestrian environments, while in rural areas, wider lanes may be needed to ensure the efficient movement of heavy vehicles [11].
Evidence-based transportation practices, informed by the effects of lane width adjustments, are essential for efficient road designs and improved safety measures. This study’s insights can aid transportation planners and engineers to make informed decisions tailored to diverse geographical contexts and user needs.
However, this study acknowledges several limitations, including its limited sample size and relatively short data collection period. These constraints may influence the conclusions drawn, as they could limit the ability to capture long-term trends and broader variability inherent in roadway design and usage across different regions. As such, generalizability beyond the findings may be limited due to regional variations in infrastructure and governance structures.
In addition, the study primarily relies on qualitative data, lacking robust quantitative analysis to precisely measure the safety impacts of lane width standards or establish statistical significance across jurisdictions. Furthermore, reliance on existing DOT manuals and policies may overlook emerging mobility trends like micromobility and autonomous vehicles, necessitating dedicated lane provisions.
Future research should address these limitations by incorporating more quantitative data and broadening the study’s scope across diverse states and regions. In addition, State DOTs frequently implement lane-narrowing projects but do not analyze and document their impacts. With substantial improvement in data collection, we will be able to find empirical evidence to support the actual impact of lane-narrowing projects on speed reduction and crash rates. Moreover, considering the implications of evolving mobility technologies will be crucial for developing comprehensive and adaptable lane width standards that effectively meet future transportation needs.

Author Contributions

Conceptualization, R.E.; investigation, W.Y., J.K., N.T. and N.S.P.; data curation, W.Y., J.K., N.T. and N.S.P.; writing—original draft preparation, W.Y., J.K., N.T. and N.S.P.; writing—review and editing, R.E. and W.Y.; supervision, R.E.; funding acquisition, R.E. All authors have read and agreed to the published version of the manuscript.

Funding

This research was funded by the Utah Department of Transportation, grant number 22-8095—“Transportation benefits and costs of reducing lane widths on urban and rural arterials”.

Data Availability Statement

Dataset available on request from the authors.

Acknowledgments

The authors express gratitude to the interviewees from FDOT, VTrans, ODOT, Caltrans, and DelDOT for participating in the interviews and providing resources for the analyses.

Conflicts of Interest

Author Noshin Siara Promy was employed by the company Traffic Engineering Specialist, STV Inc. The remaining authors declare that the research was conducted in the absence of any commercial or financial relationships that could be construed as a potential conflict of interest..

References

  1. Swift, P.; Painter, D.; Goldstein, M. Residential Street Typology and Injury Accident Frequency; Congress for the New Urbanism: Denver, CO, USA, 1997. [Google Scholar]
  2. Hauer, E.; Council, F.M.; Mohammedshah, Y. Safety Models for Urban Four-Lane Undivided Road Segments. Transp. Res. Rec. 2004, 1897, 96–105. [Google Scholar] [CrossRef]
  3. Potts, I.B.; Harwood, D.W.; Richard, K.R. Relationship of Lane Width to Safety on Urban and Suburban Arterials. Transp. Res. Rec. 2007, 2023, 63–82. [Google Scholar] [CrossRef]
  4. Strathman, J.G.; Dueker, K.J.; Zhang, J.; Williams, T. Analysis of Design Attributes and Crashes on the Oregon Highway System. 2001. Available online: https://rosap.ntl.bts.gov/view/dot/22811 (accessed on 14 November 2023).
  5. Ahmed, M.; Huang, H.; Abdel-Aty, M.; Guevara, B. Exploring a Bayesian Hierarchical Approach for Developing Safety Performance Functions for a Mountainous Freeway. Accid. Anal. Prev. 2011, 43, 1581–1589. [Google Scholar] [CrossRef]
  6. Ande, A.; Abdel-Aty, M. A Novel Approach for Analyzing Severe Crash Patterns on Multilane Highways. Accid. Anal. Prev. 2009, 41, 985–994. [Google Scholar] [CrossRef]
  7. Zhu, S.; Levinson, D.; Liu, H.X.; Harder, K. The Traffic and Behavioral Effects of the I-35W Mississippi River Bridge Collapse. Transp. Res. Part A Policy Pract. 2010, 44, 771–784. [Google Scholar] [CrossRef]
  8. Dumbaugh, E. Design of Safe Urban Roadsides an Empirical Analysis. Transp. Res. Rec. 2006, 1961, 74–82. [Google Scholar] [CrossRef]
  9. Edquist, J.; Rudin-Brown, C.M.; Lenné, M.G. The Effects of On-Street Parking and Road Environment Visual Complexity on Travel Speed and Reaction Time. Accid. Anal. Prev. 2012, 45, 759–765. [Google Scholar] [CrossRef] [PubMed]
  10. Sołowczuk, A.B.; Kacprzak, D. Effect of Lane Narrowing Implemented on an Urban Dual Carriageway on Speed Reduction and Acoustic Environment. Buildings 2021, 12, 31. [Google Scholar] [CrossRef]
  11. Azin, B.; Ewing, R.; Yang, W.; Promy, N.S.; Hannaneh, A.K.; Tabassum, N. Urban Arterial Lane Width versus Speed and Crash Rates: A Comprehensive Study of Road Safety. J. Urban Plan. Dev. 2024, in press. [Google Scholar]
  12. Merriam, S.B.; Tisdell, E.J. Qualitative Research and Case Study Applications in Education: Six Common Research Designs; John Wiley and Sons: San Francisco, CA, USA, 2016; Volume 2, pp. 1–38. [Google Scholar]
  13. Florida Department of Transportation. FDOT Design Manual: Development and Processes. 2022. Available online: https://www.fdot.gov/roadway/fdm/2022-FDM (accessed on 16 October 2023).
  14. Vermont Department of Transportation. Vermont State Design Standards. 1997. Available online: https://vtrans.vermont.gov/sites/aot/files/highway/documents/publications/VermontStateDesignStandards.pdf (accessed on 16 October 2023).
  15. Oregon Department of Transportation. Oregon Department of Transportation: Highway Design Manual: Engineering: State of Oregon. Update for Urban Design Criteria and Supplement to Design Manuals. 2020; pp. 54–57. Available online: https://www.oregon.gov/odot/Engineering/Documents_RoadwayEng/Blueprint-for-Urban-Design_v1.pdf. (accessed on 16 October 2023).
  16. California Department of Transportation. Highway Design Manual. 2019. Available online: https://dot.ca.gov/programs/design/manual-highway-design-manual-hdm (accessed on 16 October 2023).
  17. Delaware Department of Transportation. Delaware Department of Transportation Road Design Manual. 2022. Available online: https://roaddesignmanual.deldot.gov/index.php/Manual (accessed on 18 October 2023).
  18. Florida Department of Transportation. Powerline Road Lane Repurposing Before and After Study. 2021. Available online: https://www.google.com/url?sa=i&url=https%3A%2F%2Ffdotwww.blob.core.windows.net%2Fsitefinity%2Fdocs%2Fdefault-source%2Fplanning%2Ffto%2Fmobility%2Fpowerlinerd-beforeafter.pdf%3Fsfvrsn%3Dc18c7084_2&psig=AOvVaw2bRk03JKd4zD9IVESLjkrG&ust=1724406509771000&source=images&cd=vfe&opi=89978449&ved=0CAQQn5wMahcKEwjIh-mCqYiIAxUAAAAAHQAAAAAQBA (accessed on 6 November 2023).
Figure 1. Powerline Road, Fort Lauderdale, Florida (left: (a) Before—before lane width reduction, right: (b) After—after lane width reduction).
Infrastructures 09 00141 g001
Figure 2. Previous Bike Lanes on State Route 63.
Infrastructures 09 00141 g002
Figure 3. SR 63 Mooney Road Plan.
Infrastructures 09 00141 g003
Figure 4. S.R. 63 Mooney Blvd before and after the project (left: (a) Before: before lane width reduction, right: (b) After: after lane width reduction).
Infrastructures 09 00141 g004
Table 1. Summary of Lane Width Standards.
State DOTDesign ManualSuggested Lane WidthContextConditional Factors
FDOTFlorida Design Manual10–12 feetUrban/suburban
-
Design speed
-
ADT (vehicle per day)
-
Travel lanes
-
Turn-lanes and passing lanes
11–12 feetRural
VTransVermont State Design Standards10–12 feetUrban/Rural Principal Arterials
-
Design speed
-
ADT
-
Turn-lanes
-
Median
11 feetUrban/Rural Principal Streets
12 feetHigh-speed, free-flowing Principal Arterials
11–12 feetRural Principal Arterials,
Rural Minor Arterials
9–11 feetUrban/Rural Collectors
9–11 feetRural Collectors
7–11 feetRural Local Streets
ODOTBlueprint for Urban Design (BUD)11 feetUrban
Traditional downtown/CBD
-
Turn-lanes
-
Median (raised median or median curb)
11–12 feetUrban Mix,
Commercial corridor,
Residential corridor
11–12 feetRural community, suburban fringe
CaltransHighway Design Manual11–12 feetUrban, city, or town centers
-
Posted speeds
-
AADTT (annual average daily truck traffic) per lane
-
Two-lane and multilane highways, ramps, collector, distributor roads, and other appurtenant roadways
-
Right-turn channelization
11 feetRural main streets
10 feetUrban, city, or town centers, rural main streets
-
Posted speeds (less than 40 miles per hour)
-
Truck or bus volume (low)
DelDOTDelaware Road Design Manual12 feetDesign speeds ≥ 55 mph
-
Design speeds
-
Bike lanes
11 feetDesign speeds 35–50 mph
10 feetDesign speeds < 35 mph
11 feetAdjacent to bike lanes
Disclaimer/Publisher’s Note: The statements, opinions and data contained in all publications are solely those of the individual author(s) and contributor(s) and not of MDPI and/or the editor(s). MDPI and/or the editor(s) disclaim responsibility for any injury to people or property resulting from any ideas, methods, instructions or products referred to in the content.

