Article

Deep Learning-Based Flood Detection for Bridge Monitoring Using Accelerometer Data

1
Smart Mobility and Infrastructure Lab, College of Engineering, University of Georgia, Athens, GA 30602, USA
2
Department of Civil and Construction Engineering, Kennesaw State University, Marietta, GA 30060, USA
*
Author to whom correspondence should be addressed.
Infrastructures 2024, 9(9), 140; https://doi.org/10.3390/infrastructures9090140
Submission received: 24 July 2024 / Revised: 16 August 2024 / Accepted: 23 August 2024 / Published: 25 August 2024

Abstract

Flooding and consequential scouring are the primary causes of bridge failures, making the detection of such events crucial for structural safety. This study investigates the characteristics of accelerometer data from bridge pier vibrations and proposes a flood detection method with deep learning-based models based on ResNet18 and 1D Convolution architectures. These models were comprehensively evaluated for (1) detecting vehicles passing on bridges and (2) detecting flood events based on axis-specific accelerometer data under various traffic conditions. Continuous Wavelet Transform (CWT) was employed to convert the accelerometer data into richer time-frequency representations, enhancing the detection of passing vehicles. Notably, when vehicles are passing over bridges, the vertical direction exhibits a magnified and more sustained energy distribution across a wider frequency range. Additionally, under flooding conditions, time-frequency representations from the bridge direction reveal a significant increase in energy intensity and continuity compared with non-flooding conditions. For detection of vehicles passing, ResNet18 outperformed the 1D Convolution model, achieving an accuracy of 97.2% compared with 91.4%. For flood detection without vehicles passing, the two models performed similarly well, with accuracies of 97.3% and 98.3%, respectively. However, in scenarios with vehicles passing, the 1D Convolution model excelled, achieving an accuracy of 98.6%, significantly higher than that of ResNet18 (81.6%). This suggests that high-frequency signals, such as vertical vibrations induced by passing vehicles, are better captured by more complex representations (CWT) and models (e.g., ResNet18), while relatively low-frequency signals, such as longitudinal vibrations caused by flooding, can be effectively captured by simpler 1D Convolution over the original signals. Consequentially, the two model types are deployed in a pipeline where the ResNet18 model is used for classifying whether vehicles are passing the bridge, followed by two 1D Convolution models: one trained for detecting flood events under vehicles-passing conditions and the other trained for detecting flood events under no-vehicles-passing conditions. This hierarchical approach provides a robust framework for real-time monitoring of bridge response to vehicle passing and timely warning of flood events, enhancing the potential to reduce bridge collapses and improve public safety.

1. Introduction

Flooding and induced scouring are major concerns for highway bridges and are known to be the leading cause of bridge failure in the United States, accounting for almost 53% of all failures [1]. During flooding, increased flow rates and velocities can erode sediment around bridge piers, weakening their foundations and increasing the risk of scour failures. Prompt detection of flooding, which is associated with scouring, is crucial for issuing early warnings and implementing emergency measures such as reinforcing piers, deploying protective barriers, or restricting traffic. These actions help mitigate the risk of bridge collapse and protect lives and properties. Moreover, detecting the cessation of flooding allows for immediate post-event inspections, avoiding delays that can exacerbate damage. Additionally, systematic monitoring and data collection from flood events aid in analyzing flood patterns and trends, providing a scientific basis for improving bridge design and maintenance. Therefore, advancing flood detection research is essential for ensuring the resilience and safety of infrastructure, supporting both immediate risk management and long-term preventative strategies.
Flood events are a critical factor in the risk assessment of bridges. Ahamed et al. [2] proposed a comprehensive fragility analysis framework that incorporates flow discharges and scour depths to assess the vulnerability of bridges to flooding in real time. Bento et al. [3] introduced a risk-based methodology that combines uncertainty with an averaging approach to define design floods and assess scour at bridge foundations, particularly under extreme flood conditions. Lamb et al. [4] analyzed data from over 50 railway bridge failures during flood events to construct fragility curves that quantify the probability of failure. Prendergast et al. [5] developed calibrated numerical models to reproduce structural responses and assess bridge performance under flooding and seismic actions. Additionally, floods significantly alter the hydrodynamics around bridge piers, necessitating adjustments in the calculation and assessment of scour depth. Mehta and Yadav [6] evaluated scour profiles under various flood events, using flow velocity to estimate scour depths. Link et al. [7] studied local scour and sediment deposition at bridge piers during flood waves to explore the impacts of different flow and sediment regimes. Zhang et al. [8] developed a numerical solver to simulate bridge failures under extreme flood hazards, while Pizarro and Tubaldi [9] demonstrated that scour depth is highly sensitive to the parameters describing the flood hydrograph. The literature above highlighted the importance of the fact that sudden increase in flow and scour depth may cause bridge failure. Because of this, timely and accurate detection of floods is essential for calculating bridge scour depths and assessing overall bridge risk, underscoring the importance of precise and reliable flood monitoring systems.
Numerous scholars have focused their research on flood detection, predominantly using water level measurements. Miau and Hung [10] developed a deep learning model that integrates the strengths of Convolutional Neural Network (CNN) and Gated Recurrent Unit architectures to extract complex features of river water levels, enabling the detection and forecasting of flood phenomena in Taiwan. Lin et al. [11] designed an early warning system that employs the Mask R-CNN deep learning model to monitor real-time changes in bridge scour depth during floods. Pally and Samadi [12] created a Python package utilizing various deep learning models, such as YOLOv3 and Fast R–CNN, to estimate and classify flood water levels, assessing aspects like depth, severity, and risk. Additionally, alternative methods for flood detection have been explored. Cao et al. [13] introduced an iteratively multi-scale chessboard segmentation-based tile selection method for unsupervised flood detection across large areas using Synthetic Aperture Radar data. Tanim et al. [14] combined Random Forest, Support Vector Machine (SVM), and Maximum Likelihood Classifier with data from road closure reports and satellite imagery to develop a machine learning model for flood detection in San Diego, CA, USA. Qundus et al. [15] proposed a wireless sensor network decision model based on SVM for flood disaster detection, incorporating data on air pressure, wind speed, water level, temperature, humidity, and precipitation. Despite extensive research, many existing methods rely heavily on water level indicators or require complex, high-volume data, which lacks simplicity and efficiency. As an alternative, this paper proposes a novel flood detection method utilizing vibrations from bridge piers, offering a straightforward and practical solution that complements traditional water level and rainfall monitoring techniques.
Amid the rapid advancements in artificial intelligence, an increasing number of researchers are leveraging machine learning and deep learning techniques for processing and analyzing infrastructure monitoring data. For instance, Meixedo et al. [16] analyzed response data from a large bridge subjected to train-induced vibrations, employing K-means clustering to classify damage-sensitive features. Deng et al. [17] developed a fatigue damage prognosis method using Long Short-Term Memory networks, validated with steel deck response data from a bridge under traffic load. Similarly, Ni, Zhang, and Noori [18] utilized a one-dimensional Convolutional Neural Network (1D CNN) to detect abnormal behaviors in bridge structures, corroborated by data from a Structural Health Monitoring system in China. Shi et al. [19] introduced a real-time damage detection method using deep support vector domain description, tested with data from laboratory shake table experiments. These studies underscore the significant potential of machine learning algorithms in the realm of infrastructure monitoring. Specifically, the challenge of flood detection based on vibration data from bridge piers represents a time-series classification problem. Numerous machine learning algorithms are suitable for this task, among which 1D CNN is particularly preferred due to its simplicity, robust feature extraction, and low computational footprint. For example, Sony et al. [20] implemented a windowed 1D CNN to classify multiclass damage in bridges using vibration response data. Chen et al. [21] developed a method for diagnosing rolling bearing faults using a 1D CNN, achieving an accuracy of 99.2%. Ince [22] applied shallow and adaptive 1D CNN for the real-time detection and classification of broken rotor bars in induction motors. Abdoli, Cardinal, and Koerich [23] designed a neural network architecture based on 1D CNN to classify environmental sounds, which was capable of handling audio signals of varying lengths. Furthermore, Ragab et al. [24] explored a 1D CNN combined with Bayesian optimization and ensemble learning for environmental sound classification. Given these previous studies, exploring the application of 1D CNN for flood detection based on bridge pier vibrations holds considerable promise for enhancing the reliability and effectiveness of infrastructure safety measures.
Another common approach for processing time-series data is the use of Continuous Wavelet Transform (CWT) to derive rich time-frequency representations. Unlike the Hilbert Transform, which primarily focuses on phase and amplitude information, the Continuous Wavelet Transform (CWT) can capture signal details across multiple scales. This makes CWT particularly well-suited for analyzing bridge vibrations, which are often influenced by a variety of sources operating at different frequencies and timescales. Moreover, this transformation allows the flood detection task to be framed as an image classification problem. Among various algorithms for image classification, ResNet18 is a popular choice due to its relatively deep architecture enhanced by residual connections, which enable the model to retain important features from earlier layers and effectively learn complex representations with improved training efficiency. ResNet18 has been widely utilized across diverse fields due to its high accuracy and generalization capability. Numerous studies have demonstrated the effectiveness of ResNet18 in medical applications. For instance, Jing et al. [25] developed an improved ResNet18 model for classifying electrocardiogram signals, achieving a model accuracy of 96.5%. Liu, She, and Chen [26] applied ResNet18 combined with Magnetic Resonance Imaging to diagnose femoral head necrosis, attaining an accuracy of 99.27%. Sarwinda et al. [27] utilized ResNet18 to detect colorectal cancer using images of colon glands, with an accuracy exceeding 80%. Odusami et al. [28] implemented a finetuned ResNet18 network to diagnose early symptoms of Alzheimer’s disease, achieving over 99% accuracy in tests on neuroimaging from 138 patients. Furthermore, Liu, Fan, and Yang [29] introduced a 3D ResNet18 Dual Path Faster R-CNN model for lung nodule detection, demonstrating high performance. These examples underscore the high efficacy of ResNet18 in special image classification tasks, which inspired us to investigate its application in flood detection using CWT images derived from bridge vibrations.
This paper proposes a deep learning-based flood detection method using bridge vibration data collected via in situ accelerometers on a bridge in the U.S. The remainder of the paper is organized as follows: Section 2 introduces and discusses the characteristics of accelerometer data used in this study. Section 3 presents the methodology and architectural details of the proposed models. Section 4 details the experiments conducted and the results obtained. Finally, the conclusions are drawn in Section 5.

2. Characteristics

2.1. Bridge Pier Vibration Monitoring Data

To obtain the bridge pier vibration monitoring data, a bridge located in western Georgia, US, was selected, and an accelerometer sensor was deployed on the bridge pier to collect the 3-axial vibration data, covering the river flow direction, the bridge direction, and the vertical direction. As shown in Figure 1, the sensor was securely attached to the pier structure. The sampling frequency for data acquisition was set at 60 Hz, ensuring adequate temporal resolution for capturing the dynamic response of the bridge to various stimuli.
The continuous accelerometer data of the bridge pier were collected during both non-flooding conditions (gathered on 17 April 2024) and flooding conditions (gathered on 10 March 2024). A 10 min sample of the data is plotted in Figure 2.
As depicted in Figure 2, there is a slight offset in the accelerometer data in both the river flow and bridge directions during the flood event. Additionally, the range of acceleration fluctuations across the river flow, bridge, and vertical directions during flooding is marginally greater than those of non-flooding conditions.

2.2. CWT and Time-Frequency Representations

CWT is an effective technique for the time-frequency analysis of dynamic signals. Unlike the Fourier Transform, which decomposes signals into sinusoidal components with static frequencies, the CWT utilizes wavelet functions that can be scaled and translated, providing a detailed local view of how frequencies evolve over time. The CWT is defined as:
W f a , b = f t 1 a ψ t b a d t
where f ( t ) is the vibration monitoring data of the bridge pier; ψ ( t ) is the mother wavelet function; a is the scale parameter of the wavelet, affecting the wavelet’s width (inversely related to frequency); b is the translation parameter, determining the position of the wavelet within the signal; W f a , b represents the wavelet coefficients at scale a and translation b .
The Morlet wavelet is commonly used for its Gaussian envelope and sinusoidal component, offering an excellent balance between time and frequency localization. This allows for precise detection of frequency variations and transient features in signals, making it desirable for detailed time-based frequency analysis. Additionally, its smoothness enhances continuity in the wavelet transform, crucial for identifying subtle signal changes that may indicate structural issues or degradation. Given these advantages, the Morlet wavelet was selected for analyzing the accelerometer data of the bridge pier in this study.
As an example, CWT analysis was performed on a 10 s segment of accelerometer monitoring data collected during the non-flood event, resulting in the time-frequency representations shown in Figure 3.
Figure 3a shows a series of transient, high-intensity signals along the river flow direction primarily between 5 Hz and 25 Hz, indicating periodic oscillations with moderate stability over time. Figure 3b shows the CWT results along the bridge direction, which is similar to the river flow direction. The signals appear slightly more variable, suggesting different or additional sources of vibrational energy in this orientation. Figure 3c shows a more pronounced distribution of energy across the lower frequencies, particularly evident below 5 Hz, which might indicate vertical movements of structural responses due to traffic load dynamics.
Figure 4 shows the time-frequency representations of a 10 s segment of accelerometer monitoring data collected during the non-flood event when a vehicle passes through the bridge. Compared with Figure 3, there is a slightly increased energy concentration around the mid-frequency range (approximately 5 to 10 Hz) with more pronounced transient peaks compared with the no-vehicle condition. This suggests that the river flow direction experiences fewer dynamic responses when subjected to vehicle loads. In the bridge direction, a significant enhancement in signal intensity is visible in the 5 to 20 Hz range during the passing of vehicles, highlighted by an intense and distinct bright vertical streak around the 3 s mark. This is markedly different from the more uniform distribution observed under no-vehicle-passing conditions, indicating that the bridge direction is particularly sensitive to load changes caused by vehicle movements. Similarly, the vertical direction shows a more intense response in the lower frequency range (below 15 Hz), with clear, continuous high-energy bursts due to the passing of vehicles. This contrasts with the more sporadic and less intense vibrations observed during the no-vehicle conditions. Comparing Figure 4b with Figure 4c, it can be observed that the vertical direction exhibits a broader and more sustained energy distribution across a wider frequency range, suggesting that the vertical motion of the bridge pier is significantly influenced by the weight and movement of vehicles. Based on this characteristic, the CWT-processed time-frequency representations of the vertical direction can be utilized to discern whether vehicles are passing the bridge. This differentiation can be utilized to categorize the accelerometer monitoring data of bridge vibrations into two distinct categories: with and without vehicles passing, which can minimize confounding influences in the dataset. By separating the specific impacts of vehicular loads, the machine learning model can more effectively learn the characteristics and patterns unique to each category without interference from mixed signals, and this finally leads to a more robust performance by the model.
Figure 5 shows the time-frequency representations of the bridge pier vibration during the flood without passing of vehicles. Compared with Figure 3, it can be found that during the flood event, the river flow direction shows stronger and more prolonged energy at lower frequencies (below 3 Hz), potentially due to the lower lateral stiffness of the bridge pier. In the bridge direction, the flood event image exhibits intense energy at higher frequencies (between 5 Hz and 25 Hz) for shorter durations, suggesting quicker, but less sustained, vibrational responses, possibly resulting from higher longitudinal stiffness of the bridge pier.

3. Methodology

3.1. Flood Detection Method Based on Bridge Pier Vibrations

With the advancement of artificial intelligence, machine learning has demonstrated robust performance across diverse fields. In this paper, a deep learning-based flood detection method based on bridge pier vibrations is proposed, as depicted in Figure 6.
As outlined in Figure 6, the process consists of two stages: detection of vehicles passing on bridges and detection of flood events. The overall pipeline is decomposed into four components, as denoted in Figure 6 and described below.
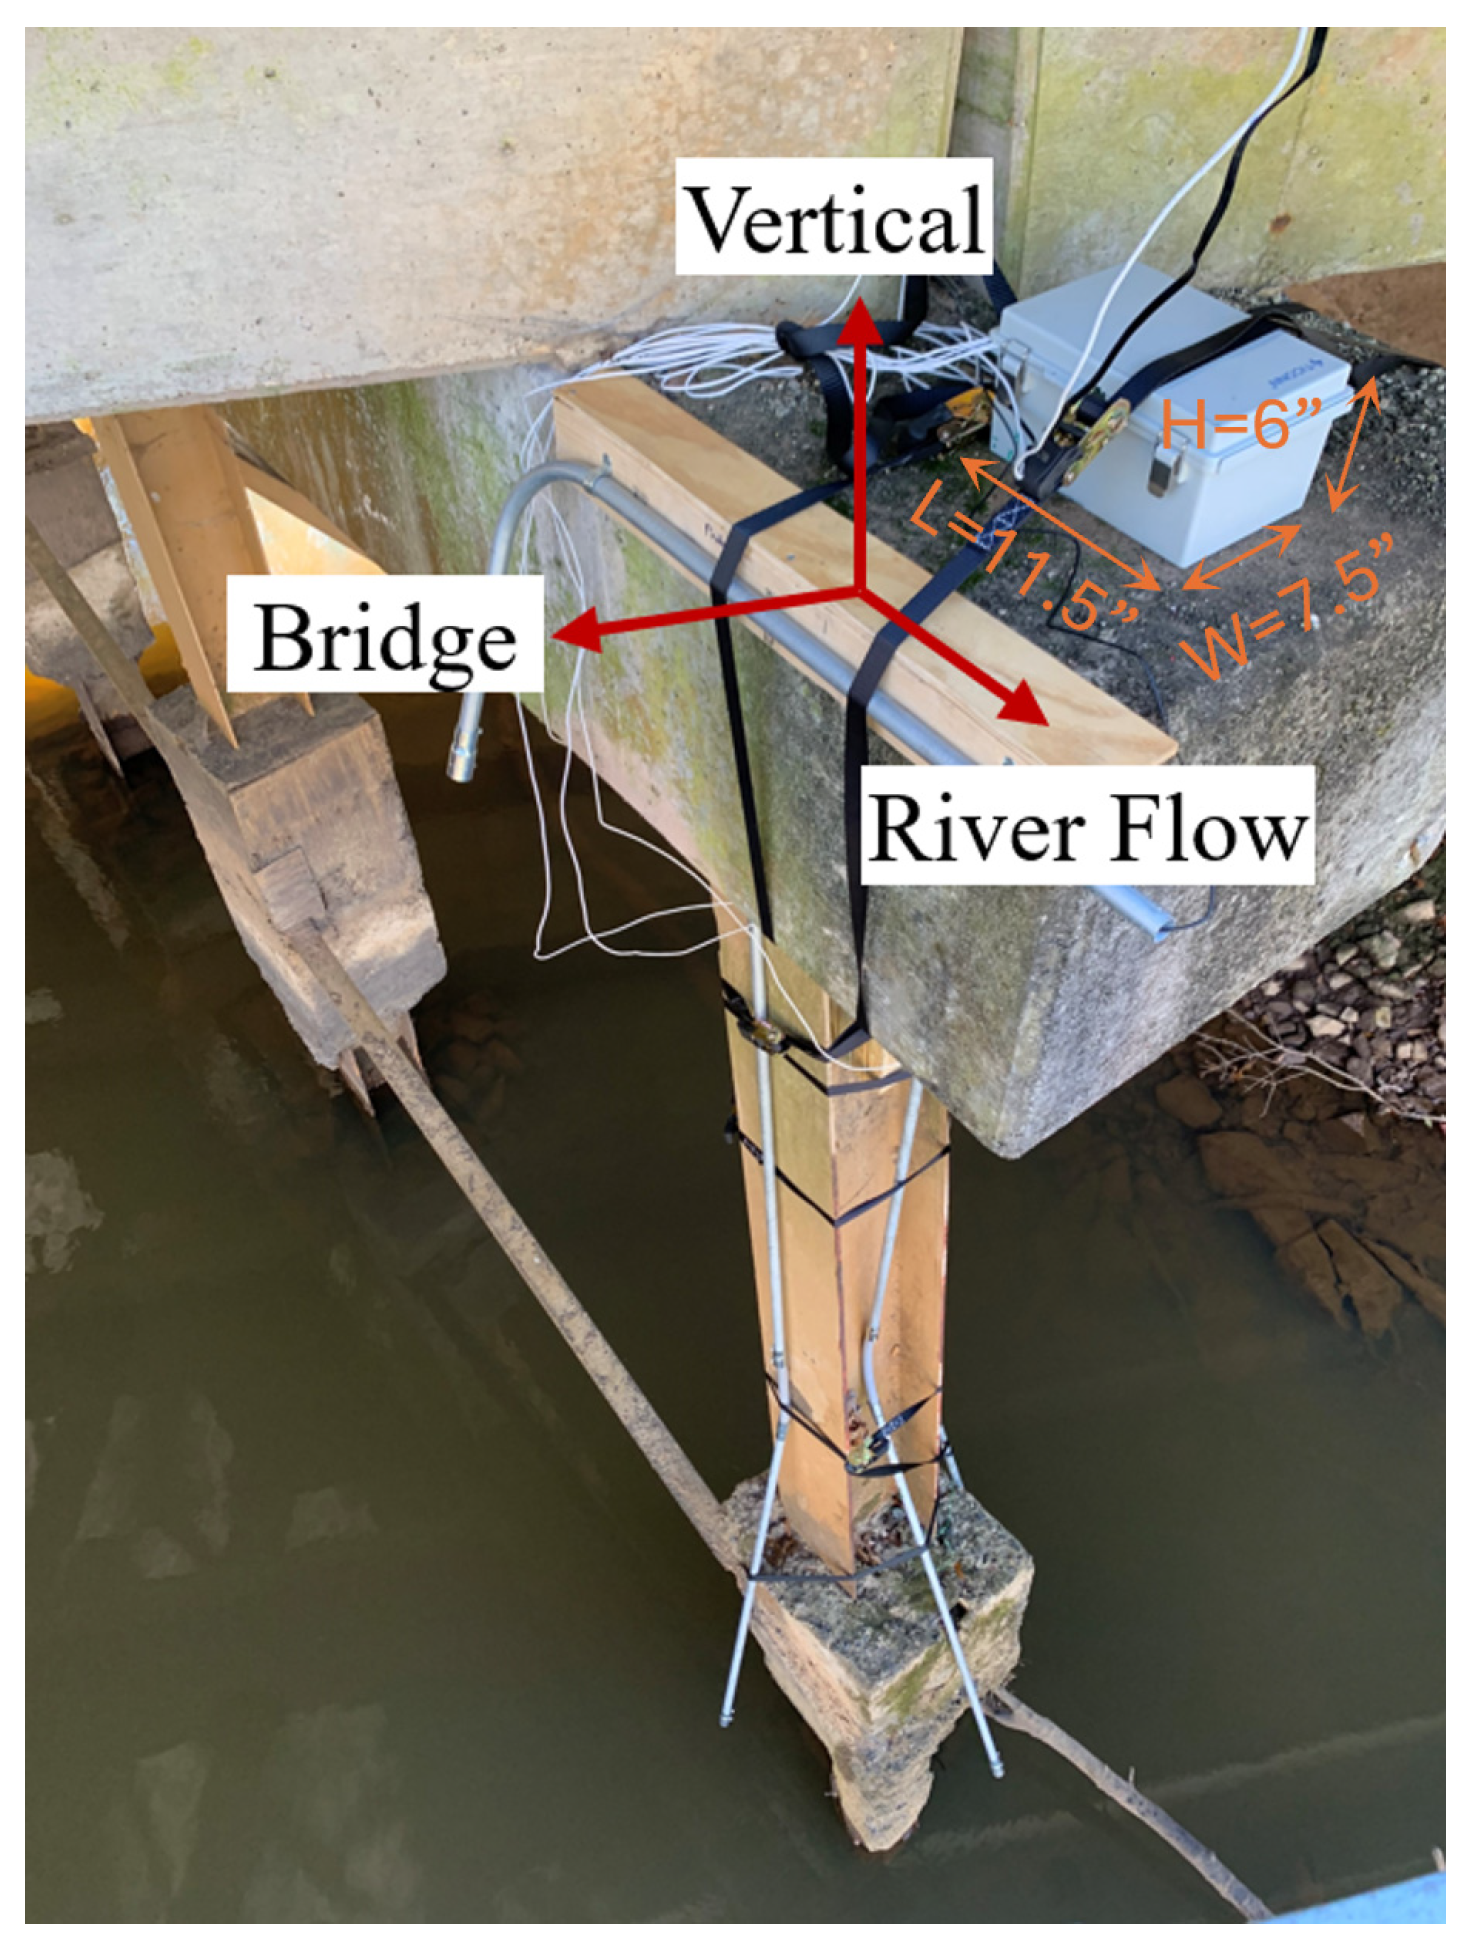
(1) Data collection. Accelerometers are installed on the bridge pier to capture 10 s segments of vibrational data in the river flow, bridge, and vertical directions. This foundational data collection is critical for analyzing the bridge’s response under different environmental conditions.
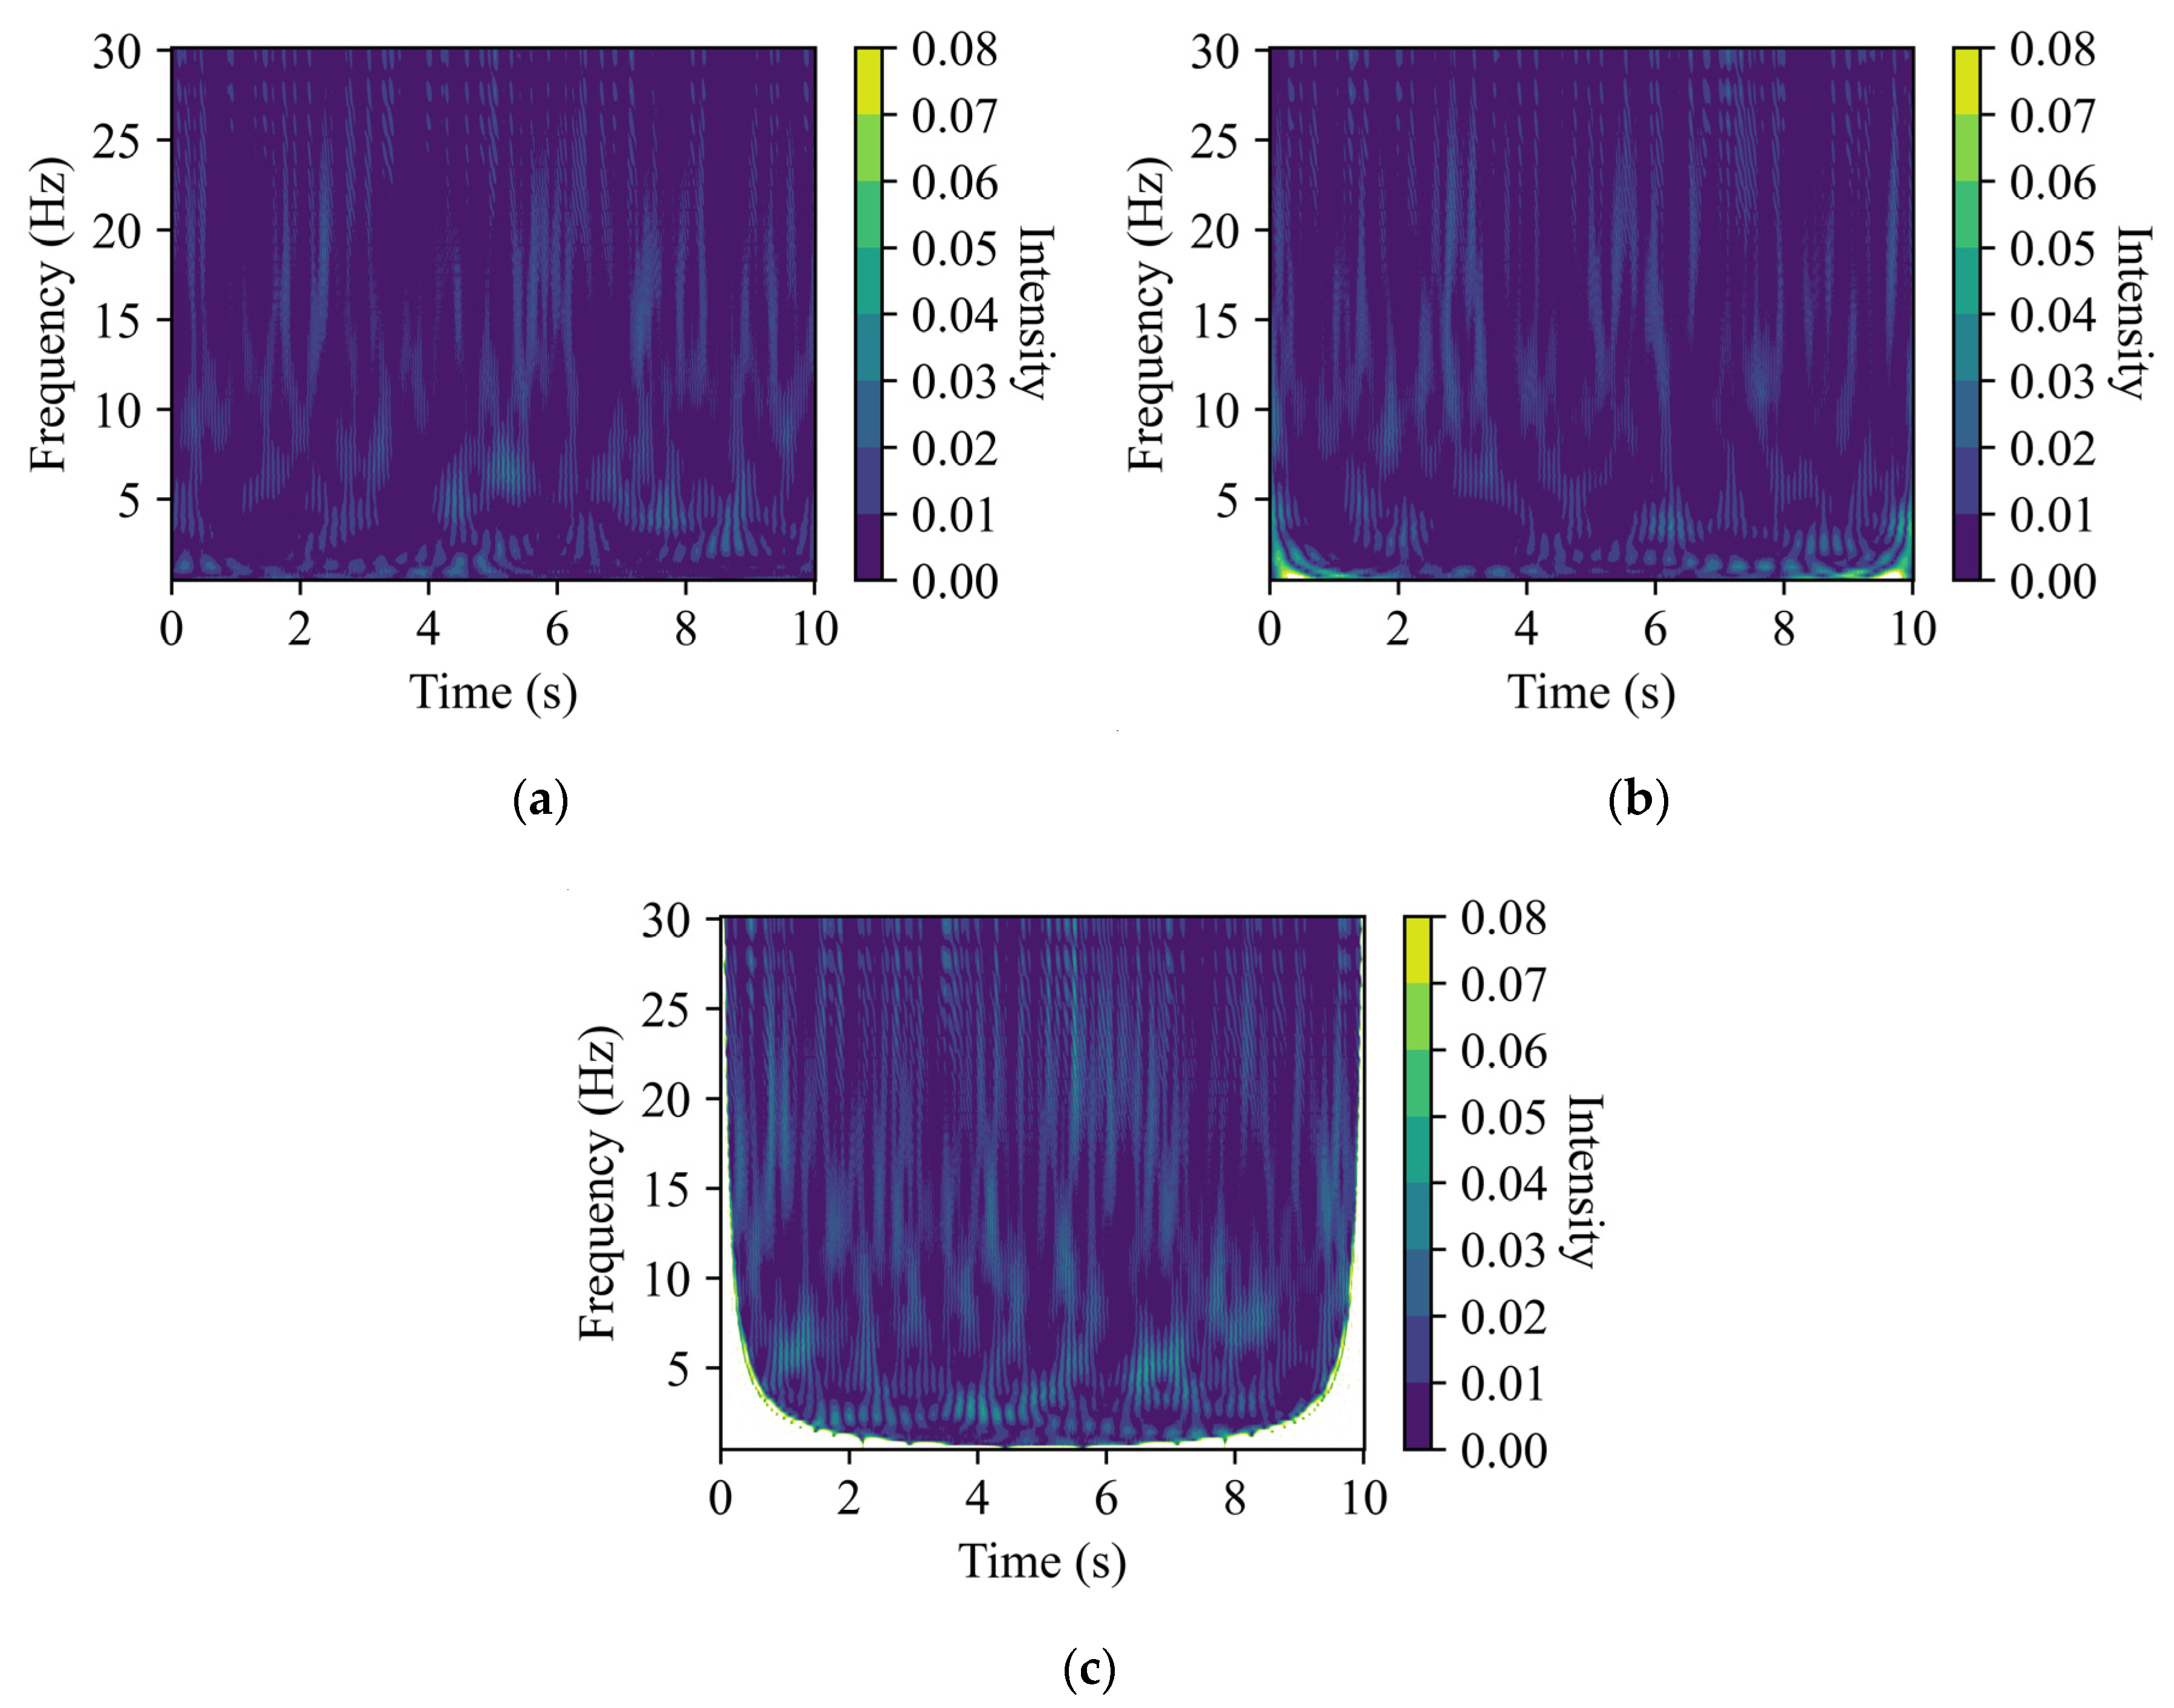
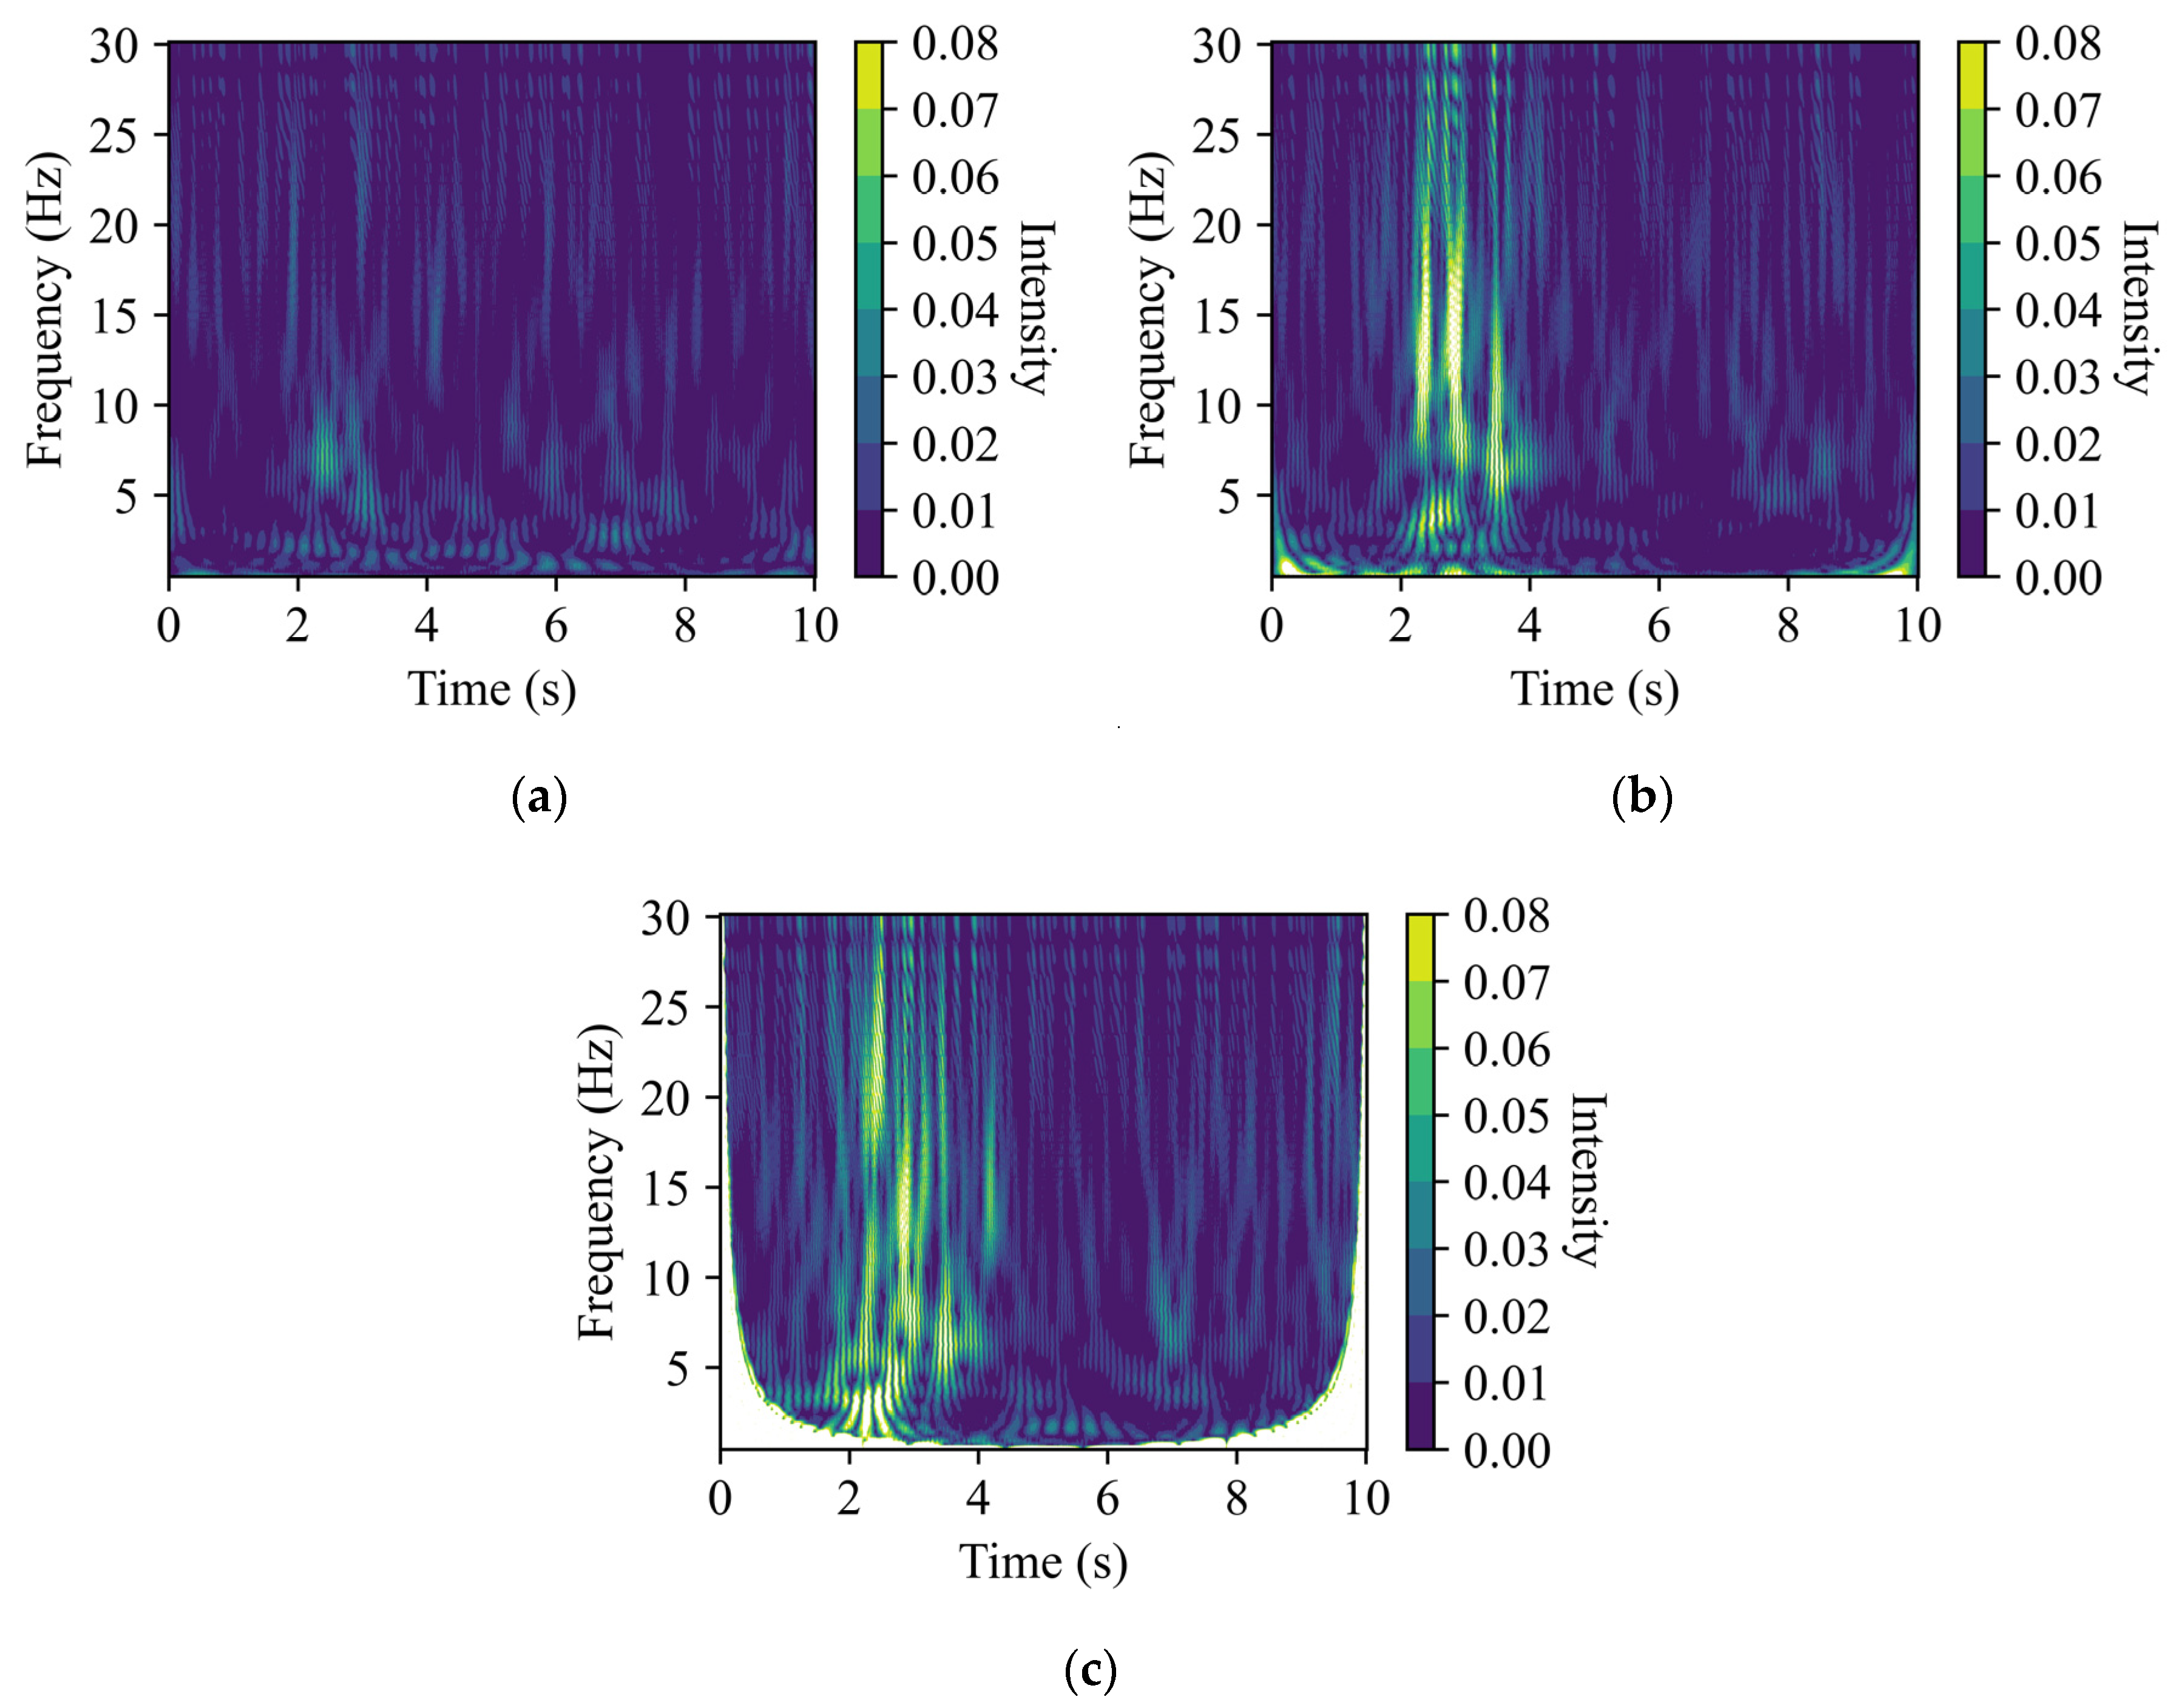
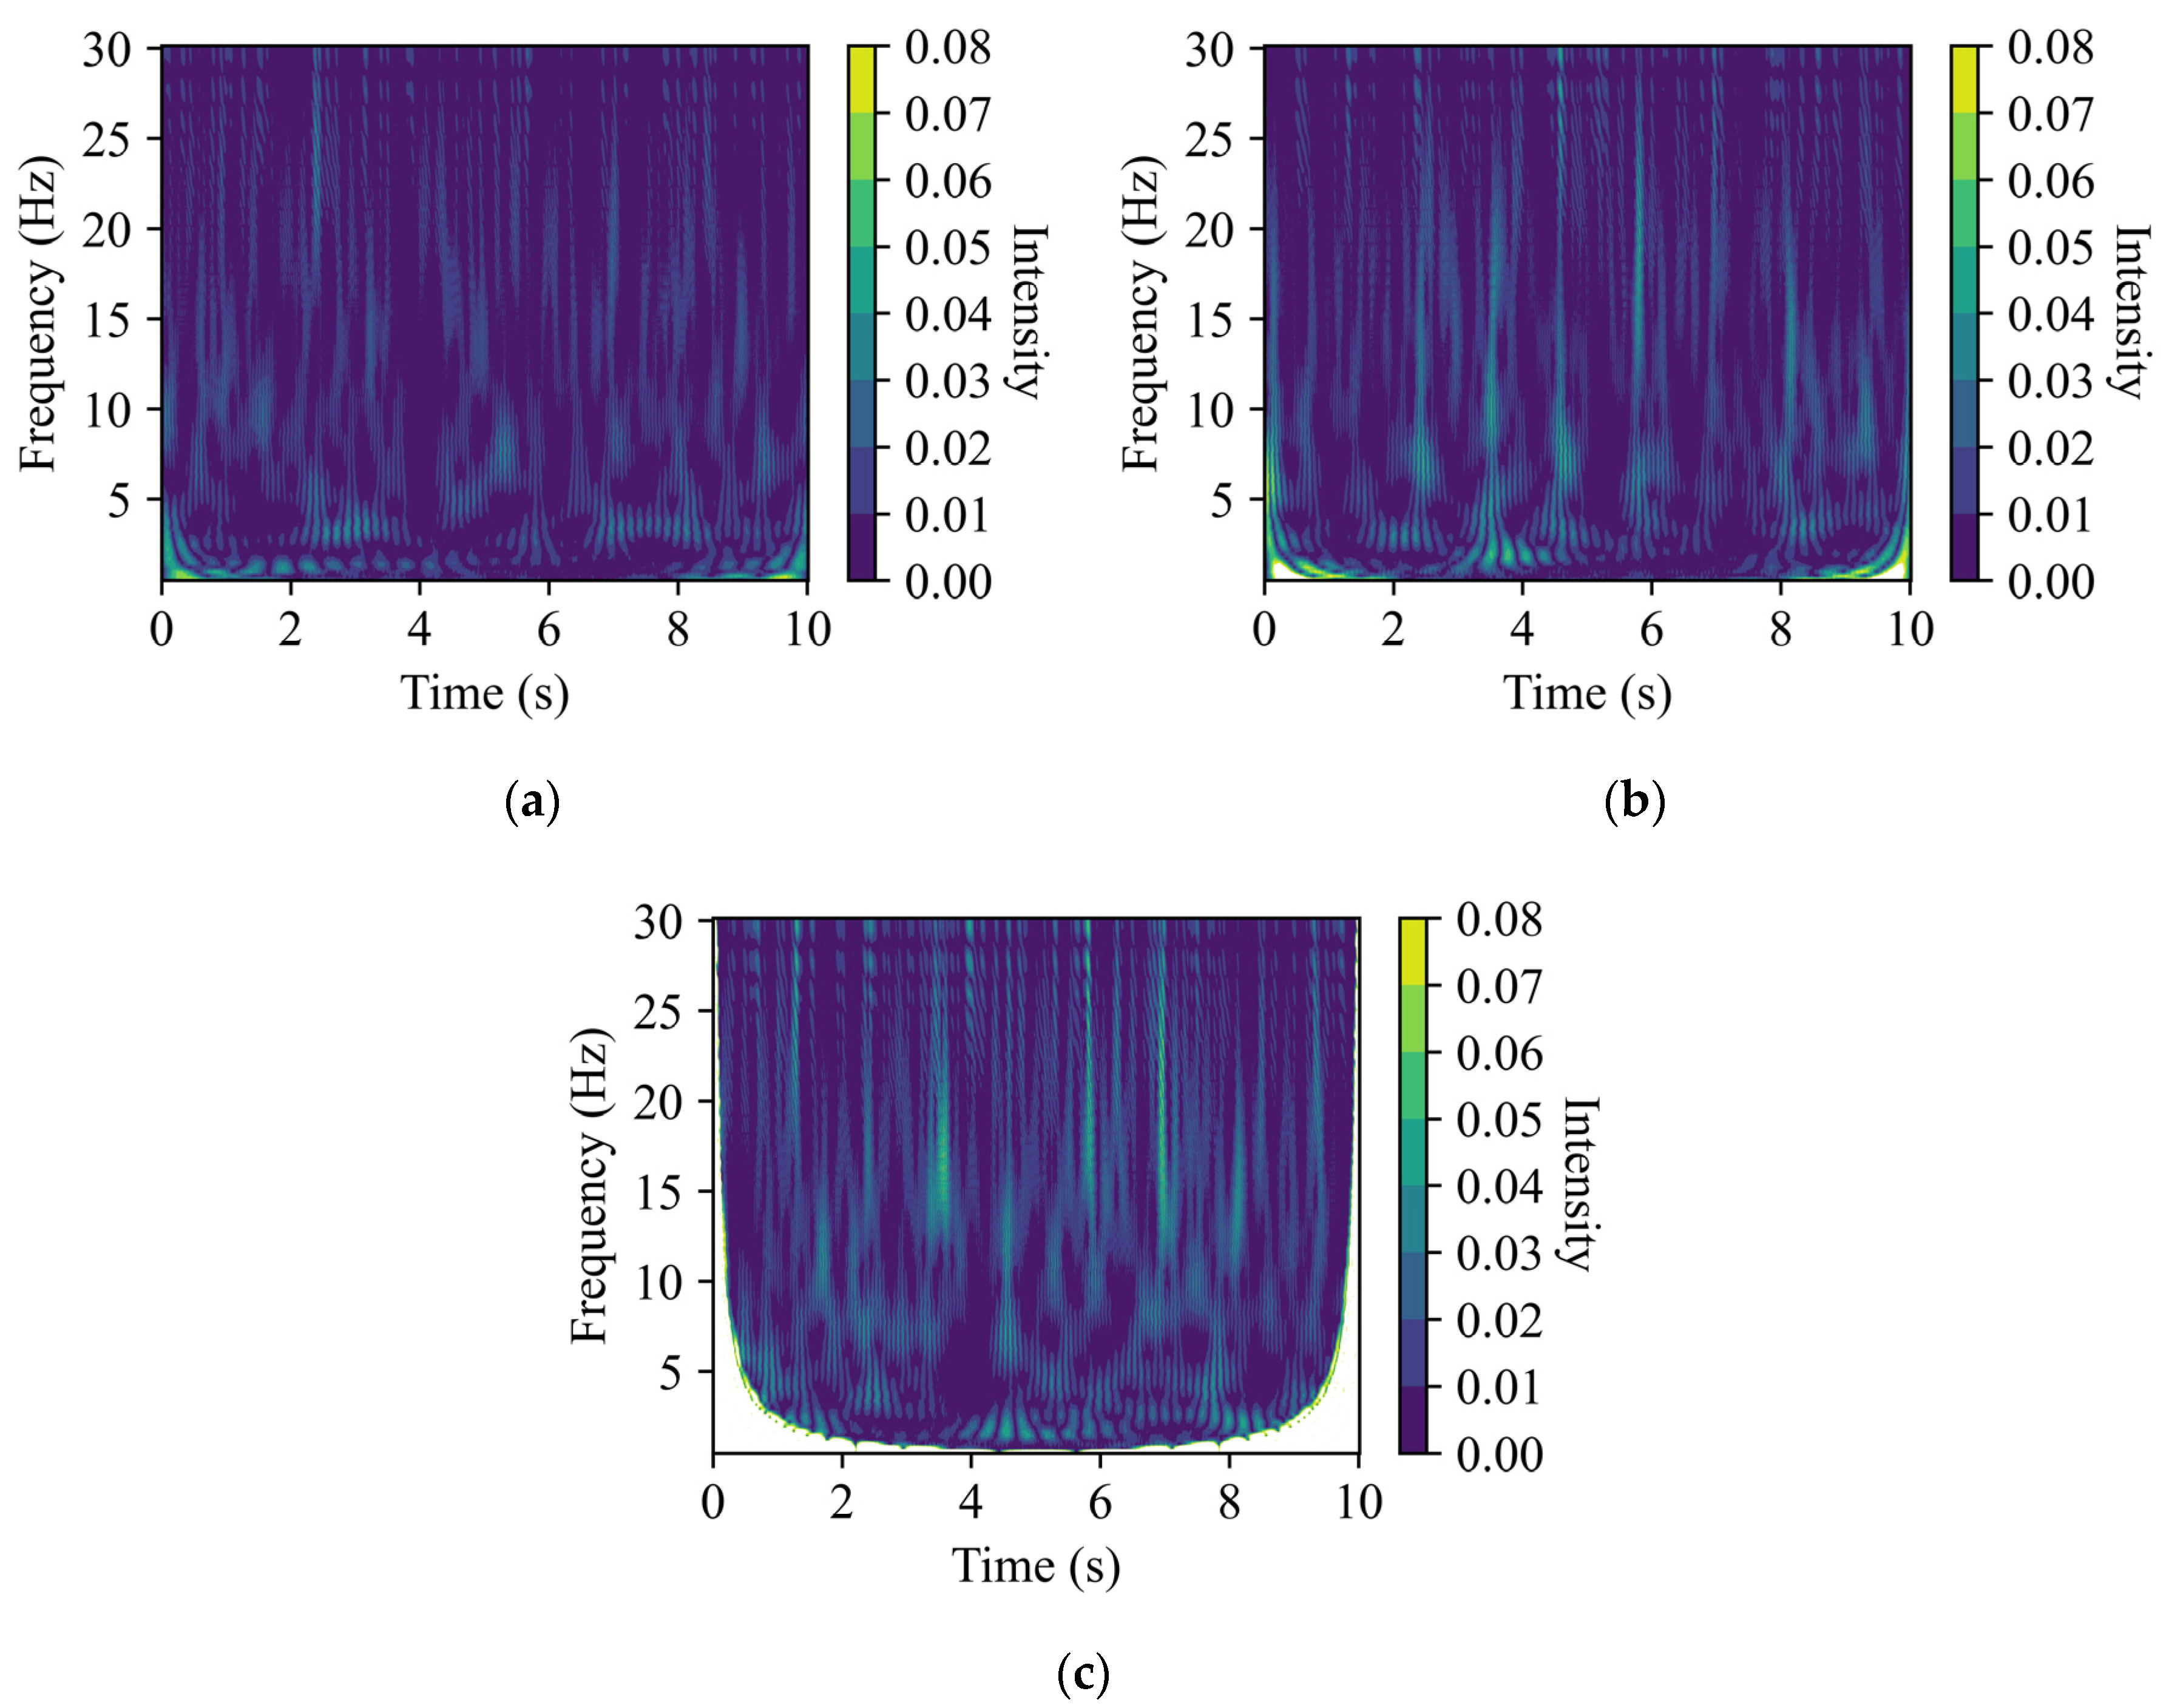
(2) CWT analysis and vehicles passing detection. Given that the vertical direction’s time-frequency representation shows a broader and more sustained energy distribution across a wider frequency range during the passing of vehicles, this direction is specifically chosen for initial analysis to classify two bridge situations: without and with passing of vehicles. First, the data undergoes CWT to obtain a time-frequency representation. This transformed data is then fed into a pre-trained ResNet18 model to determine the passing of the vehicles. Depending on the classification outcome, the process will progress to the third stage or the fourth stage, as described below.
(3) Flood detection without vehicles passing. In scenarios without vehicular movement, the river flow and bridge direction data, which are influenced by flood events, are analyzed using a trained 1D Convolution model. This model, trained exclusively on datasets without vehicles passing, minimizes confounding influences and focuses on detecting flood-induced vibrational patterns.
(4) Flood detection with vehicles passing. When vehicles are passing the bridge, the vibration data from the river flow and bridge directions are processed by another 1D Convolution model trained solely on datasets with vehicles passing. This segmentation ensures that flood detection is tailored to the specific dynamic conditions induced by vehicle movements.
Upon successful detection of flood events, the system will transmit an alert, enabling timely notifications for necessary preemptive actions to ensure bridge safety.
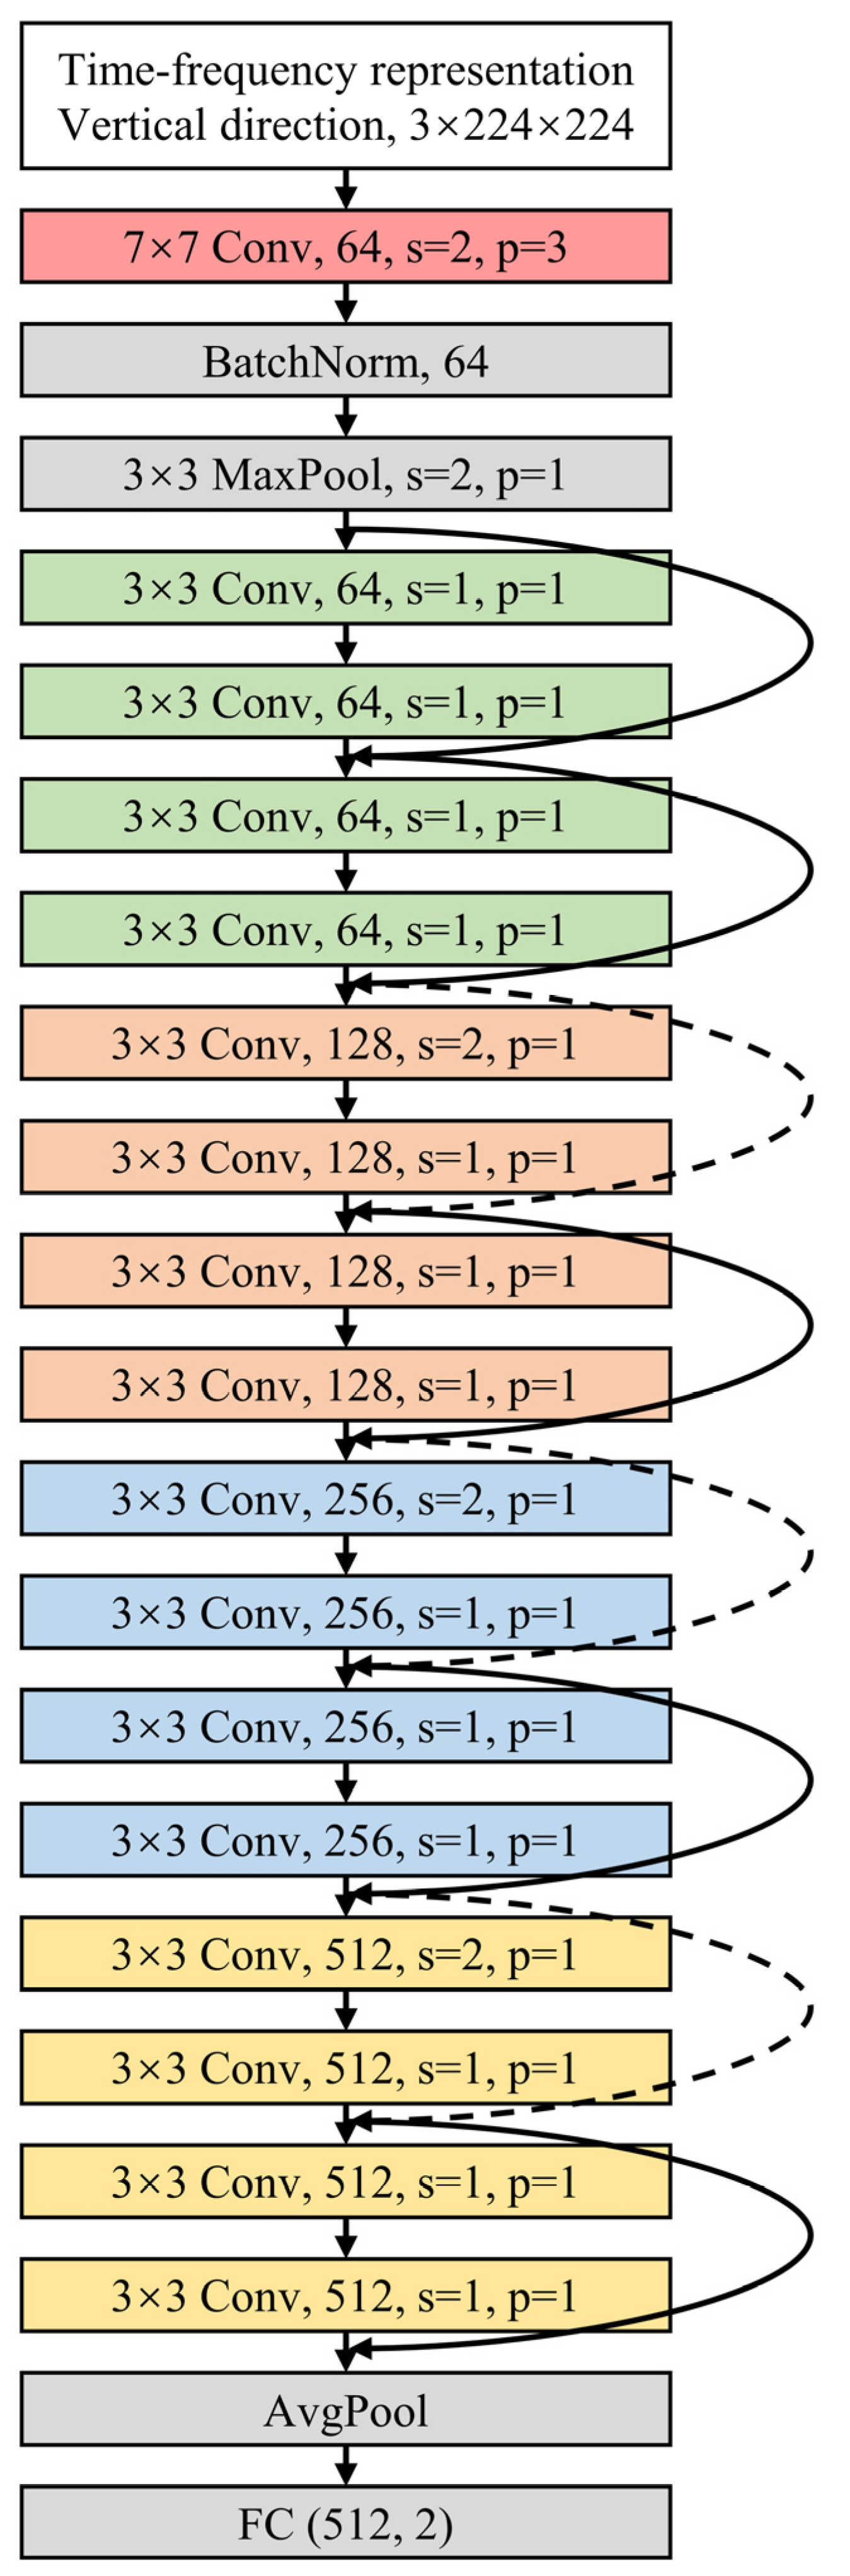
3.2. ResNet18 Model

ResNet18 is a seminal architecture in deep learning architectures, designed to enhance performance in deep networks while maintaining computational efficiency. The model features an 18-layer structure, incorporating convolutional layers, batch normalization, activation layers, and more importantly, residual blocks. These blocks include shortcut or skip connections that bypass one or more layers to permit identity mapping, addressing the vanishing gradient problem by facilitating gradient flow during backpropagation, enabling effective learning in deeper networks [30]. Given the excellent performance of ResNet18 in image classification tasks, this study investigates its application in the specific context of detecting the passing of vehicles on the bridge.
Figure 7 illustrates the adapted ResNet18 architecture employed for detecting the passing of vehicles over bridges. The input to the network is a time-frequency representation of vibration data from the accelerometer sensor in the vertical direction on a bridge pier. The time-frequency representation takes the shape of (Channel: 3; Height: 224; Width: 224). The final stages of the network involve an average pooling layer that reduces the feature dimensionality, followed by a fully connected layer that maps the extracted features to a binary outcome: with or without passing of vehicles on the bridge.

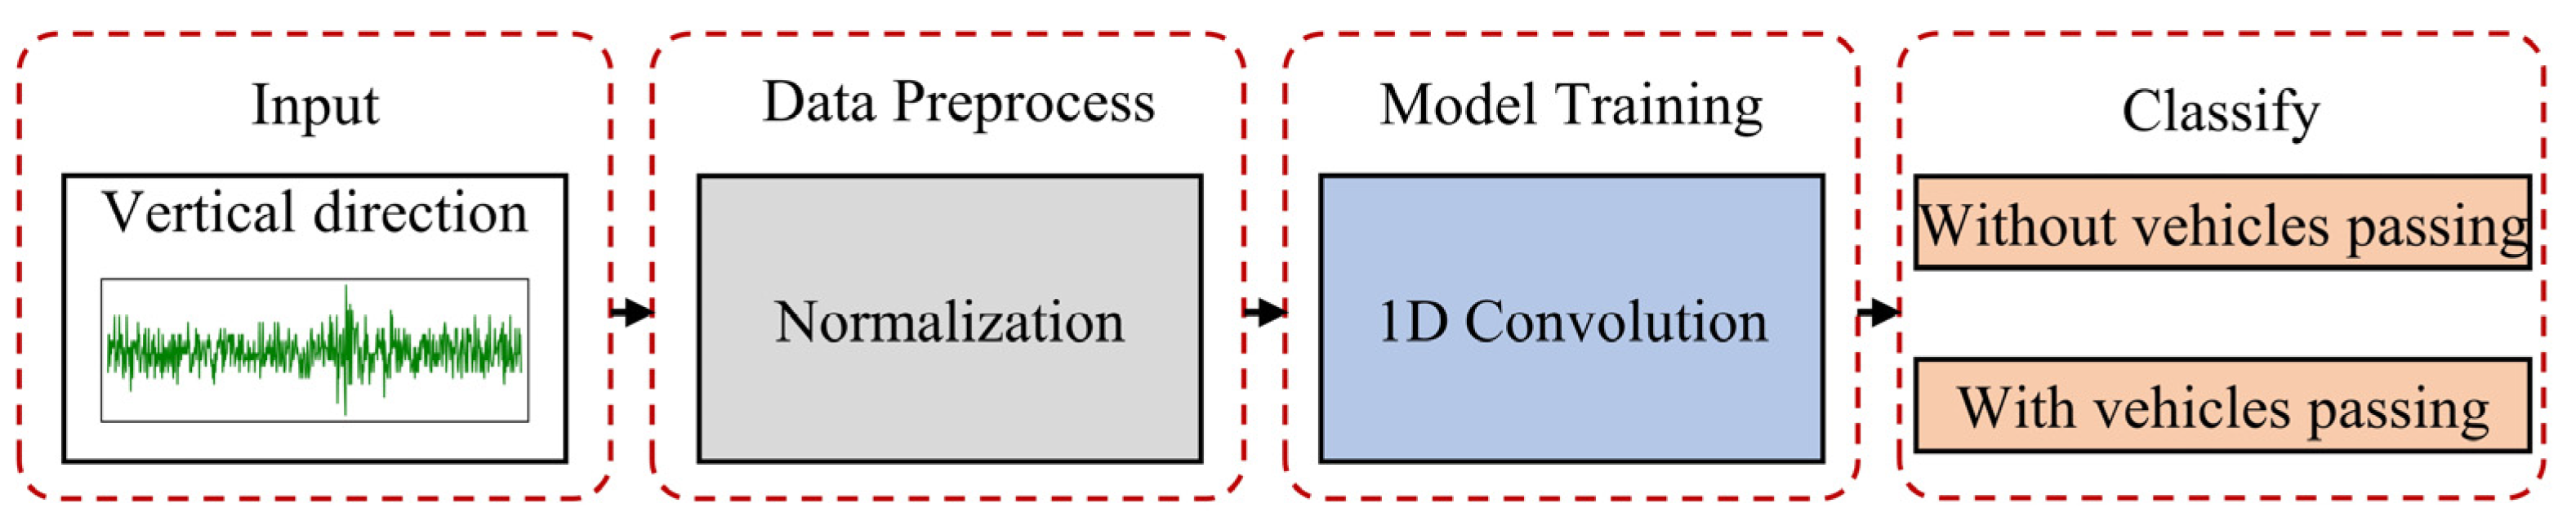
3.3. 1D Convolution Model

1D Convolution is a mathematical operation widely utilized in the analysis of temporal or sequential signals. In the field of signal processing, 1D Convolution operates by sliding a kernel over the temporal dimension of the data, effectively extracting features by computing the dot product between the kernel and local regions of the input. This technique is particularly advantageous for time-series data, such as accelerometer data for structural monitoring, where the key features or motifs are often encoded along the temporal dimension. This study also investigates the performance of 1D Convolution for the classification task of flood detection.
Figure 8 is the architecture employing a 1D Convolutional Neural Network designed to classify flood events from accelerometer data on the bridge pier. The input consists of dual-axis vibrations (river flow and bridge directions) recorded over 10 s, providing two channels of 600 samples each. The architecture encompasses two 1D Convolutional layers, each followed by a ReLU activation for introducing non-linearity. The outputs are flattened and fed to a fully connected layer to classify two categories: presence or absence of flood events.

4. Experiments

4.1. Dataset Preparation

Accelerometer data were collected from the bridge pier in three axes: river flow, bridge, and vertical directions during both non-flood and flood events. The data were segmented into 10 s intervals and each segment was processed using CWT to obtain a time-frequency representation. Due to the fact that there would be an intense response with clear, continuous high-energy bursts caused by the passing of vehicles in the time-frequency representation of the vertical direction, the data were divided into two datasets: with and without vehicles passing for both non-flood and flood events, and the size of each dataset is shown in Table 1.
In the model training phase, the Adam optimizer was chosen for its efficient computation, low resource requirement, and robust convergence properties. Each dataset was further partitioned into training, validation, and testing sets with ratios of 8:1:1, respectively. Meanwhile, the cross-entropy loss function was employed to measure the discrepancy between the predicted probabilities and the true class labels, which is computed by Equation (2).
Cross - e ntropy   Loss = 1 N j = 1 N i = 1 n y j i log p j i
where n is the number of classes (2 in this study); y j i is a binary indicator (0 or 1) that specifies whether class label i is the correct classification for sample j ; p j i is the predicted probability that sample j belongs to class i ; N is the batch size which was set to 128 to ensure a reliable gradient estimation per iteration while maintaining manageable memory requirements.

4.2. Model for Detecting the Passing of Vehicles

4.2.1. ResNet18

As shown in Figure 9, the dataset, composed of time-frequency images from the accelerometer data of the bridge pier in the vertical direction, was divided into training, validation, and testing subsets in an 8:1:1 ratio, with each image resized to 224 × 224 pixels to align with the input requirements of the ResNet18 architecture shown in Figure 7. The ResNet18 model underwent an initial training phase with a learning rate of 5 × 10⁻⁶ for the first three epochs, followed by a reduction to 1 × 10⁻⁸ for subsequent epochs. The training loss, validation loss, and validation accuracy are plotted in Figure 10.
As shown in Figure 10, both training and validation losses rapidly decrease within the first three epochs and stabilize near 0.07. The validation accuracy quickly reaches a high level of approximately 97% by the third epoch and remains stable throughout the subsequent epochs. This model achieved a classification accuracy of 97.2% on the testing set, demonstrating its high effectiveness in correctly detecting the passing of vehicles on the bridge based on vertical vibrational signals.

4.2.2. 1D Convolution

The application of 1D Convolution for the detection of vehicles passing on bridges was also investigated. The workflow, as illustrated in Figure 11, utilized original accelerometer data captured in the vertical direction as the input to the model. The 1D Convolution architecture employed is consistent with that depicted in Figure 8, with adaptation to a single channel to align with the data collected in the vertical direction. The dataset was segmented into training, validation, and testing sets with proportions of 8:1:1. The training process was conducted in two phases with varied learning rates. An initial rate of 1 × 10⁻³ was used for the first three epochs, followed by a reduced rate of 1 × 10⁻⁴ for subsequent epochs. The training loss, validation loss, and validation accuracy are plotted in Figure 12.
The training and validation losses for the 1D Convolution model, as shown in Figure 12, exhibit a rapid decline during the initial epochs, leveling off to a steady state. The validation accuracy quickly peaks near 91% by the third epoch and maintains this level through the remaining epochs. The model achieved a classification accuracy of 91.4% on the test dataset. By contrast, the ResNet18 model achieved a classification accuracy of 97.2%, suggesting that the ResNet18 model is more suitable for detecting the passing of vehicles on the bridge. This is expected as the amplified energies in the time-frequency CWT representation for the vertical direction, due to vehicles passing, serve as a strong feature to differentiate it from conditions where there are no vehicles passing on the bridge.

4.3. Flood Detection Model with or without Passing of Vehicles

4.3.1. ResNet18

The application of the ResNet18 model for flood detection was investigated, and the performance of the model was evaluated on two distinct datasets: one consisting entirely of samples without passing of vehicles, and the other composed exclusively of instances with passing of vehicles. The training procedure for the flood detection task mirrored that employed in the development of the ResNet18 for detecting vehicles passing, with an adaptation in the input dimensions. Specifically, two time-frequency representations, derived from the river flow and bridge directions using CWT, were utilized as inputs to the ResNet18 model, as shown in Figure 13. The training loss, validation loss, and validation accuracy on the datasets without and with passing of vehicles on the bridge are displayed in Figure 14 and Figure 15.
For the dataset without passing of vehicles, both the training and validation losses decreased sharply and stabilized at lower losses within the initial epochs, as shown in Figure 14. Correspondingly, the validation accuracy swiftly reached a plateau of more than 95% by the third epoch and remained constant afterward. The testing accuracy for this model achieved an impressive 97.3%. In contrast, the model trained on the dataset with vehicles passing exhibited a slower convergence in both training and validation losses, as shown in Figure 15, with a steady-state validation loss slightly higher than that seen in the model without vehicles passing. Validation accuracy for this dataset plateaued at about 80%, a notable decrease compared with the model trained on the dataset without vehicles passing. The testing set accuracy of 81.6% further illustrates the challenges and reduced predictive capability when there are vehicles passing on the bridge, which introduces variability and entangled vibration signals.

4.3.2. 1D Convolution

Figure 16 illustrates the workflow for training a flood detection model using 1D Convolution, applied to the same two distinct datasets: one consisting of data without passing of vehicles, and the other composed of data only with passing of vehicles. The training process for this flood detection task mirrors that of the vehicles passing detection, employing the same 1D Convolution architecture except a modification of input dimensions involving the simultaneous use of raw vibrational data from both the river flow and bridge directions. The model architecture is shown in Figure 8, and the training loss, validation loss, and validation accuracy on the datasets without and with vehicles passing are displayed in Figure 17 and Figure 18.
The performances of the two 1D Convolution models trained on datasets with and without vehicles passing are depicted in Figure 17 and Figure 18, respectively. Both models demonstrate a rapid decrease in training and validation losses during the early epochs, leveling off to steady states. Validation accuracies for both models quickly reach near 98%, indicating effective learning and generalization capabilities for the flood detection. For the dataset without vehicles passing, the 1D Convolution model achieved a testing accuracy of 98.3%, matching the high performance seen with the ResNet18 model, which also performed well under similar conditions. However, in the dataset with vehicles passing, the 1D Convolution model performed better than the ResNet18 model, achieving a testing accuracy of 98.6% in contrast to 81.6% for ResNet18.
These findings illustrate that both the 1D Convolution and ResNet18 models provide robust solutions for detecting conditions when no vehicles are passing the bridge. However, the 1D Convolution model offers a significant advantage in scenarios when vehicles are passing the bridge. This implies the improved generalization of the simpler model (1D Convolution) as opposed to the more complex one (ResNet18), which tends to overfit to the vibrational signals induced by the passing of vehicles on the bridge.

4.4. Testing of Models

The performance of the ResNet18 and 1D Convolution models has been comprehensively assessed across two tasks: vehicles passing detection and flood detection. The latter task was also evaluated under two conditions: with and without passing of vehicles. The accuracies of each model under different tasks are summarized in Table 2.
Overall, ResNet18 proves to be more suitable for detecting the passing of vehicles on bridges, achieving a higher accuracy of 97.2% compared with 91.4% for 1D Convolution. Conversely, in the context of flood detection, under both conditions of with and without passing of vehicles, the 1D Convolution model demonstrates superior performance, with accuracies of 98.3% and 98.6%, respectively, outperforming the ResNet18 model especially when vehicles are passing the bridge.

5. Discussion

Vibration-based techniques have been widely used for bridge health monitoring, but their application in flood monitoring, which is closely related to scour assessment, remains underdeveloped. One major challenge is the difficulty in isolating vibration signals to accurately differentiate between influences from flooding, wind, vehicles, and other factors.
This study addresses this challenge by proposing an effective flood detection method that combines CWT and deep learning techniques, utilizing accelerometer data from bridge pier vibrations. CWT analysis reveals that accelerometer data in both the vertical and bridge directions are significantly affected by vehicle passage. This effect is characterized by short-duration, high-intensity motifs in the CWT-processed time-frequency representations, which markedly contrast with patterns observed in the absence of vehicles. This clear difference in CWT representations explains the superior performance of both the ResNet18 and 1D Convolutional models in detecting vehicle passages.
However, the flood detection task becomes complex when considering mixed scenarios involving the presence or absence of passing vehicles. To effectively address the unique characteristics of each scenario, two lightweight 1D Convolution models have been developed, each serving as a specialized expert for its respective condition.

6. Conclusions

In this study, the characteristics of accelerometer monitoring data from the bridge pier vibration were investigated. The comprehensive evaluation of the ResNet18 and 1D Convolution models across two specific tasks were undertaken: vehicles passing detection, and flood detection under various traffic conditions. The flood detection method based on bridge pier vibration data was validated. The major conclusions of this study are summarized below.
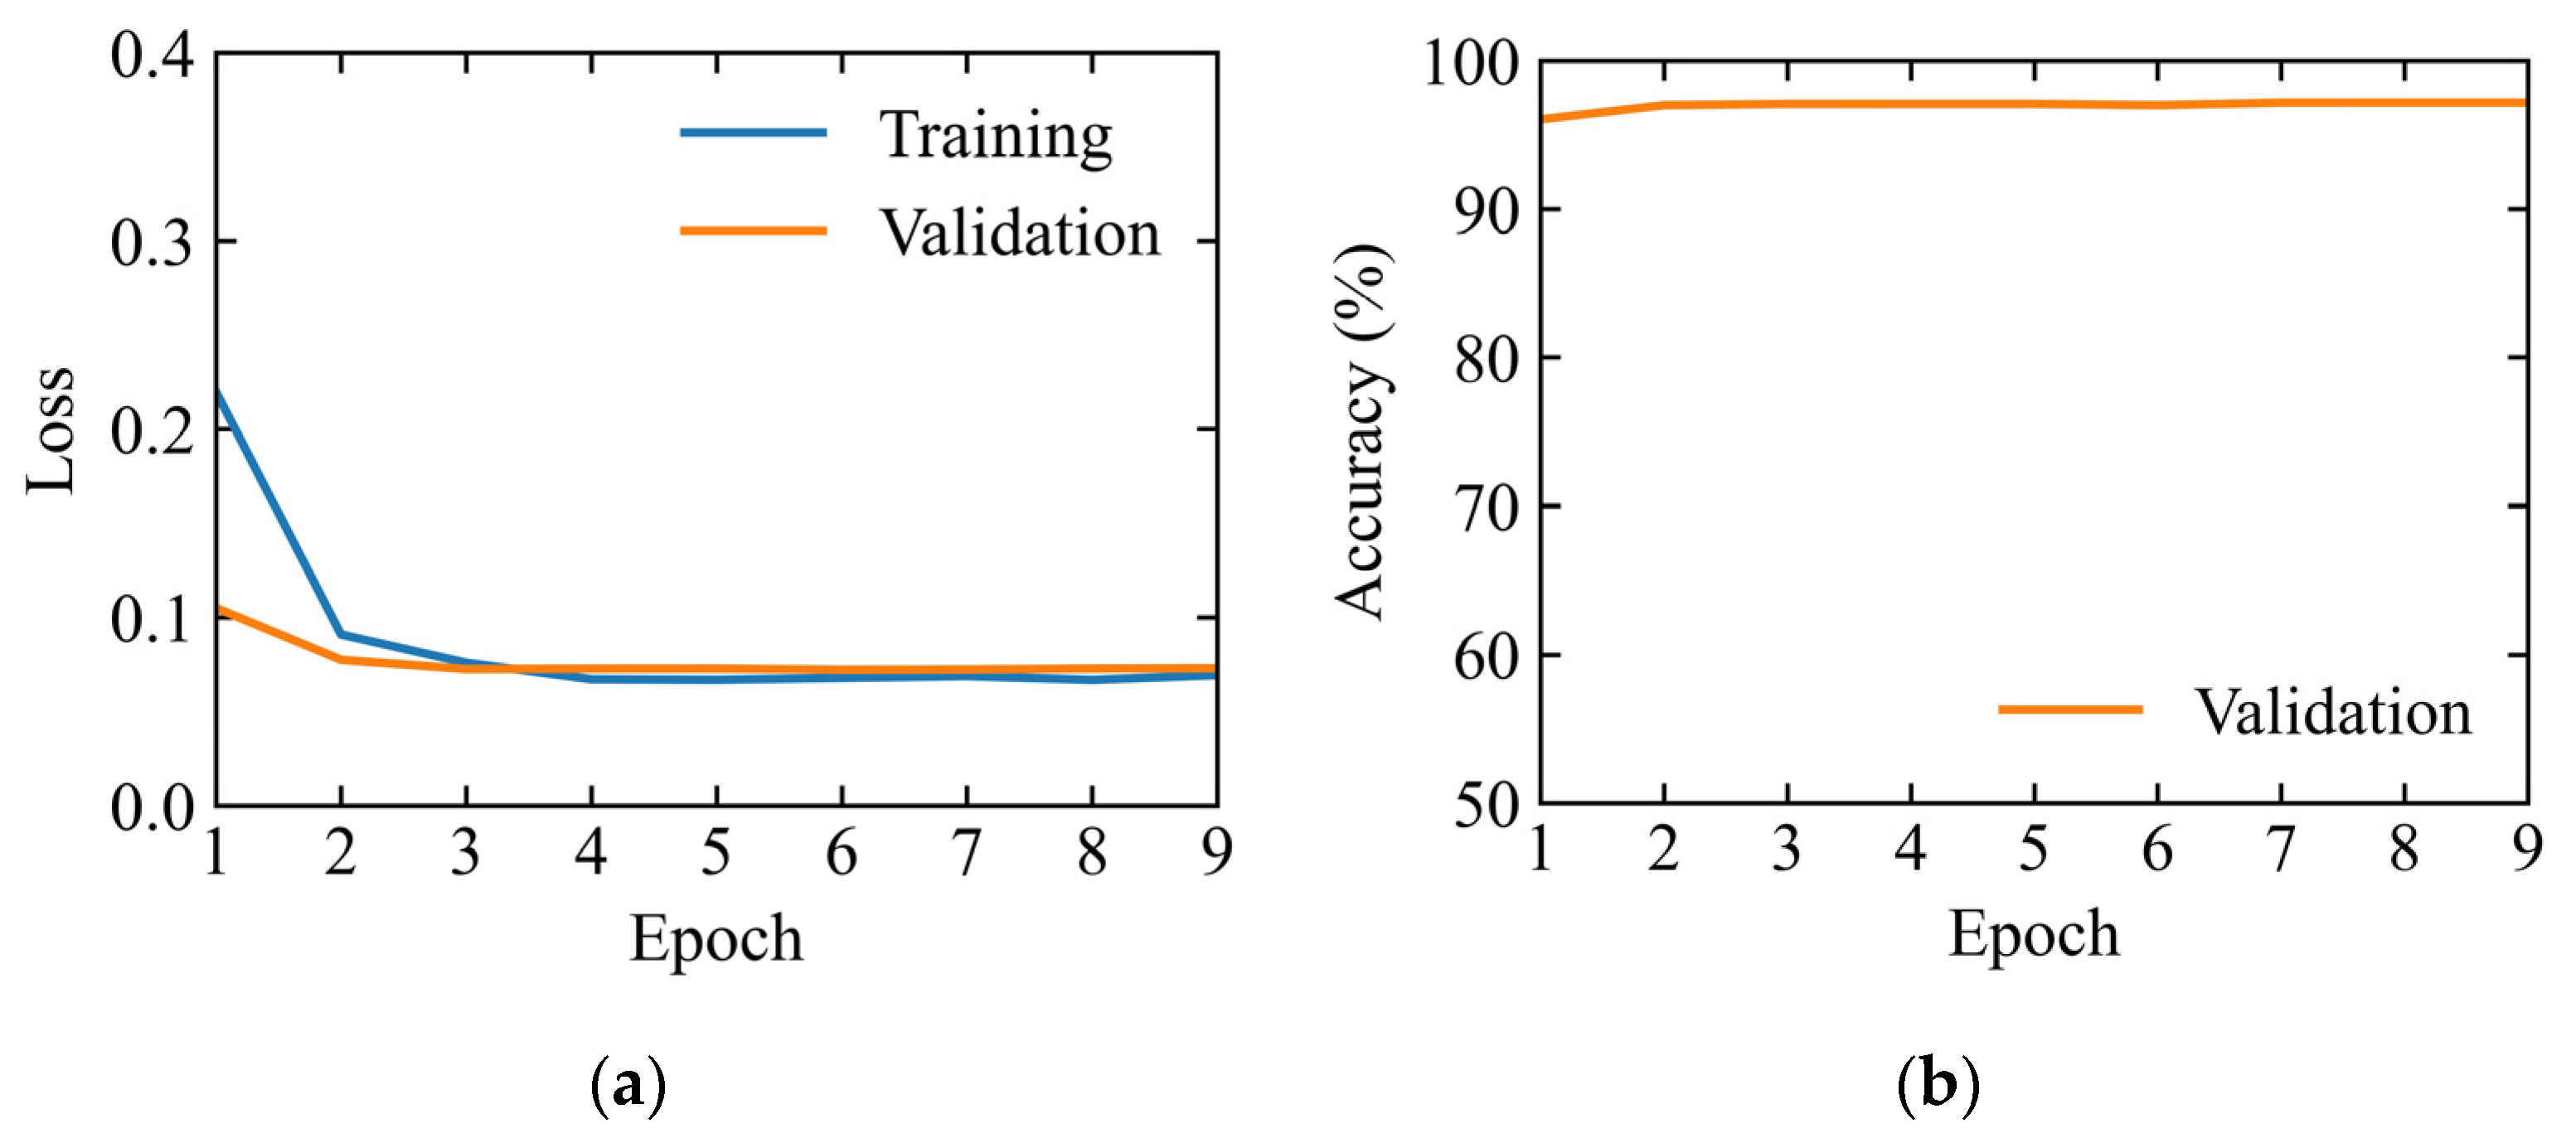
CWT was utilized to transform the accelerometer data into time-frequency representations, which facilitated the detection of vehicles passing on a bridge. It was observed that when vehicles are passing on a bridge, the time-frequency CWT representation from the vertical direction exhibited a broader and more sustained energy distribution across a wider frequency range compared with the river flow and bridge directions. Additionally, for the bridge direction, the time-frequency representations under flooding conditions showed a noticeable increase in intensity and continuity of energy across the spectrum compared with non-flooding conditions.
In terms of detecting the passing of vehicles, the ResNet18 model outperformed the 1D Convolution model, achieving an accuracy of 97.2% compared with 91.4%. This highlights the importance of CWT representation in capturing the amplified signals in the vertical direction across both time and frequency domains of vibrational signals, due to the passing of vehicles.
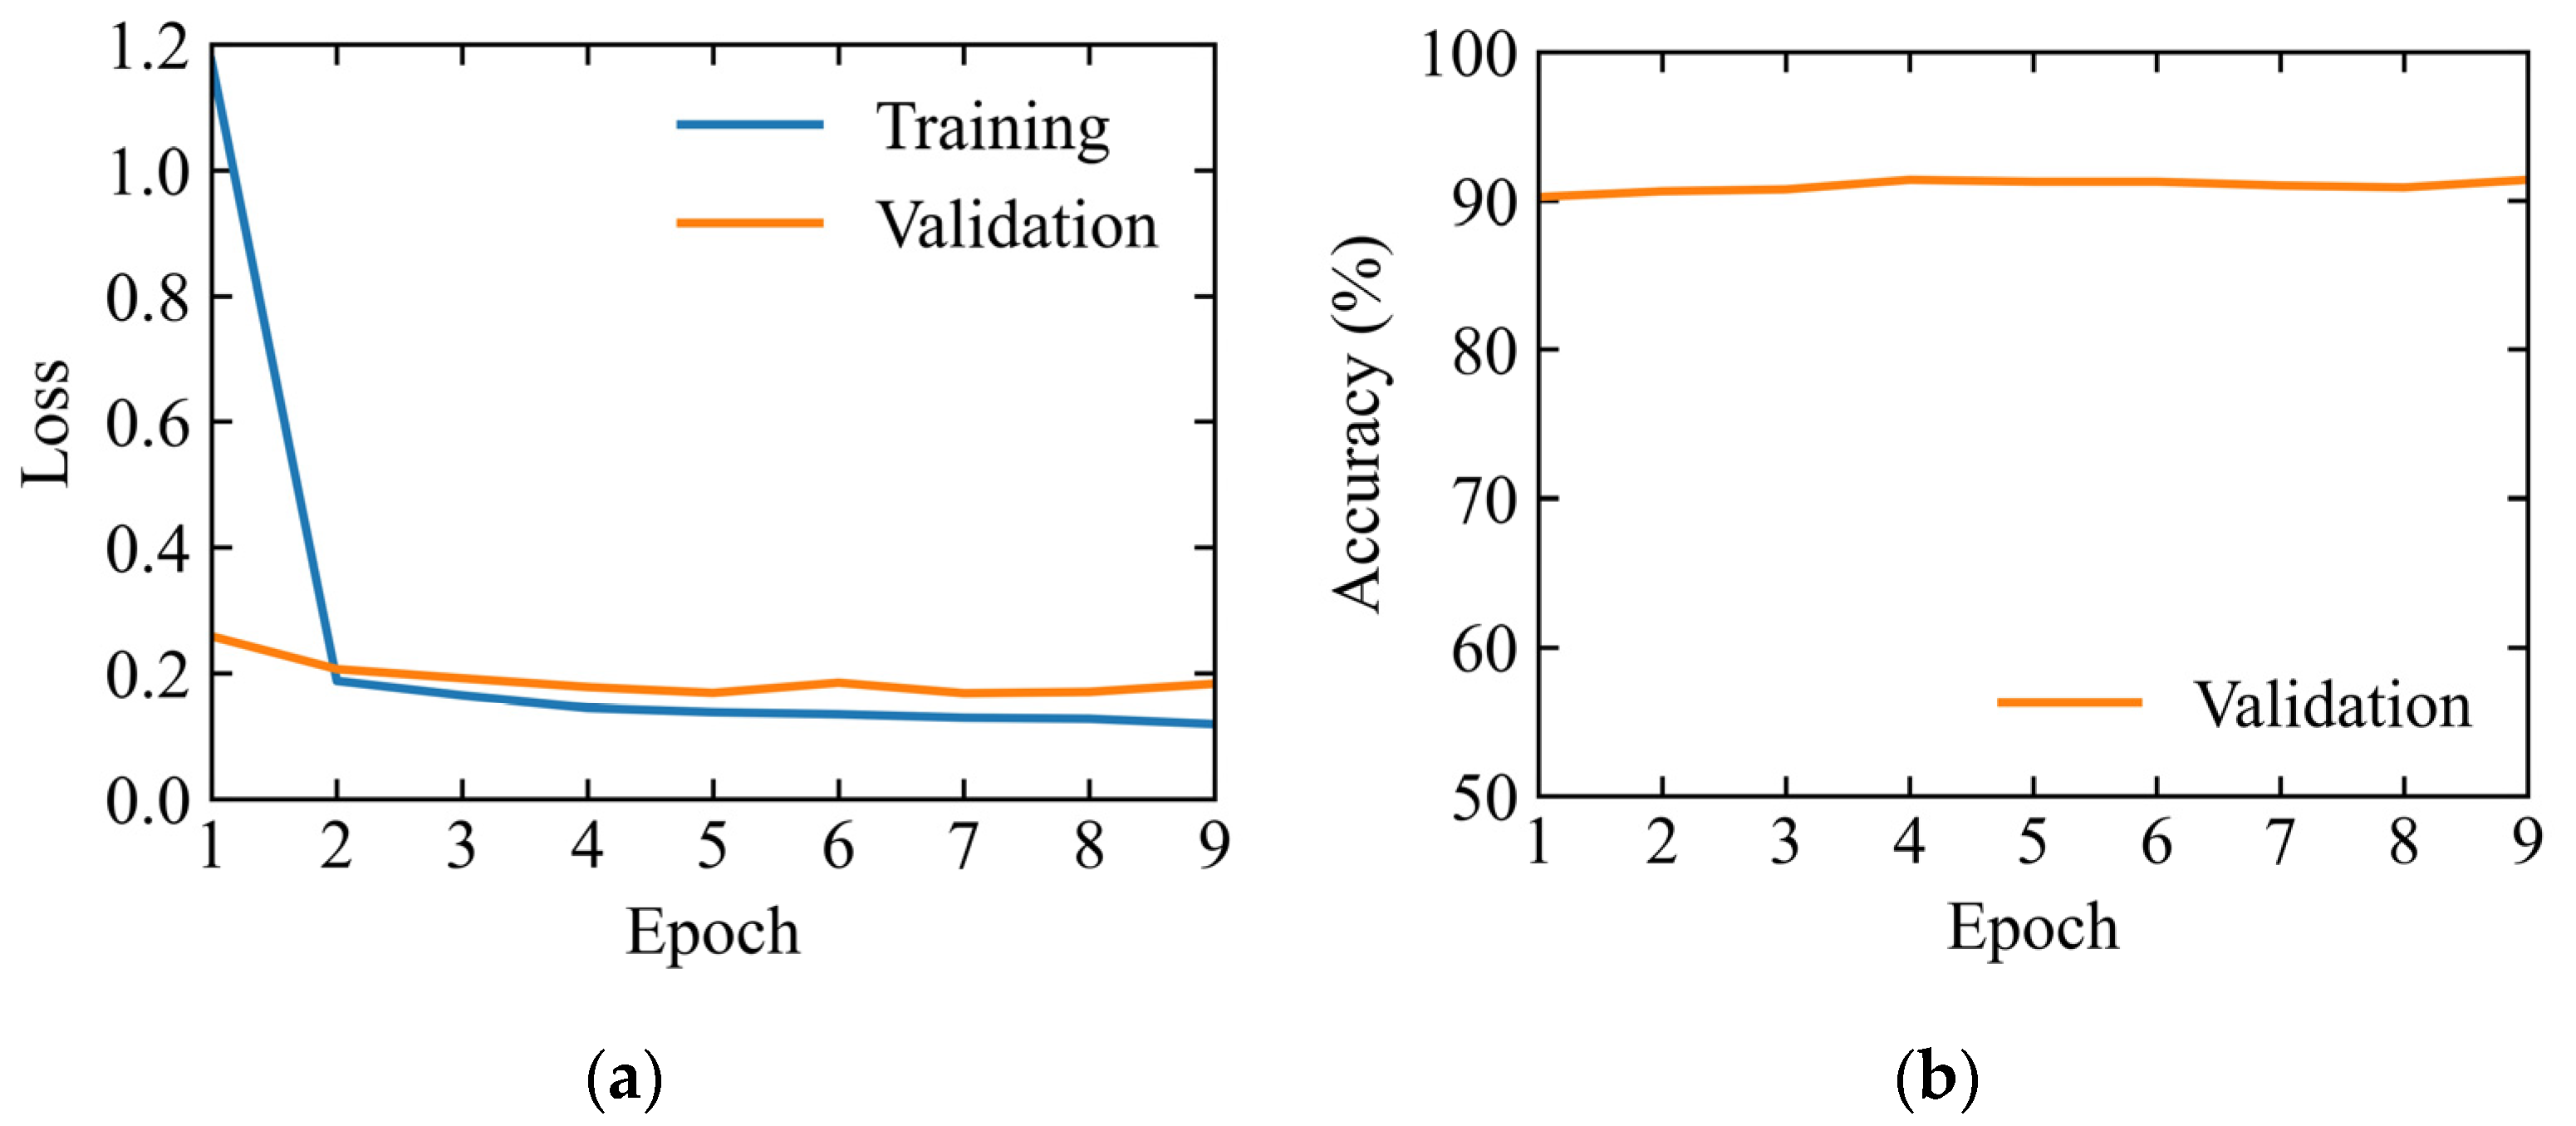
For flood detection without passing of vehicles, the ResNet18 and 1D Convolution models performed comparably well, achieving accuracies of 97.3% and 98.3%, respectively. However, in scenarios of flood detection with passing of vehicles, the 1D Convolution model significantly outperformed ResNet18, achieving an accuracy of 98.6%, while the latter only sustained an accuracy of 81.6%. This indicates the generalization gain of the simpler 1D Convolution model compared with the more complex ResNet18 model. The latter has a tendency of overfitting to the nonessential vibrational signals induced by the passing of vehicles on the bridge. In summary, this study proposes a two-stage process for flood detection using low-cost accelerometers. The first stage aims to detect whether vehicles are passing on bridges, which serves as a “screening” process for selecting the appropriate model that was trained under each specific situation for flood detection in the second stage.
Regardless of the superior performance of the proposed method in flood detection, several limitations are noted. Firstly, the datasets used for training the models were relatively small; future studies could benefit from utilizing larger training sets to potentially enhance model performance. Secondly, this study only considered accelerometer data. Future work may be directed to the fusion of multisource, multimodal data for enhancing the robustness of flood detection as well as extending the approach to quantify the flooding severity. Thirdly, while this research focused on the performance of the ResNet18 and 1D Convolution models, future investigations could explore a broader array of models and evaluate their effectiveness in detecting and quantifying flood events.

Author Contributions

Conceptualization: P.D. and J.J.Y.; Methodology: P.D. and J.J.Y.; Validation: P.D. and J.J.Y.; Formal analysis: P.D.; Resources: J.J.Y. and T.Y.; Data Curation: P.D.; Writing—Original Draft Preparation: P.D.; Writing—Review and Editing: J.J.Y. and T.Y.; Visualization: P.D.; Supervision: J.J.Y.; Funding Acquisition: T.Y. and J.J.Y. All authors have read and agreed to the published version of the manuscript.

Funding

The work presented in this paper is part of a research project (RP 22-19) sponsored by the Georgia Department of Transportation, United States. The contents of this paper reflect the views of the authors, who are solely responsible for the facts and accuracy of the data, opinions, and conclusions presented herein. The contents may not reflect the views of the funding agency or other individuals. The authors would like to acknowledge the financial support from the Georgia Department of Transportation in the United States.

Data Availability Statement

The data presented in this study are available on request from the corresponding author, subject to the permission of the Georgia Department of Transportation in the United States.

Conflicts of Interest

The authors declare no conflicts of interest.

References

  1. Wardhana, K.; Hadipriono, F.C. Analysis of Recent Bridge Failures in the United States. J. Perform. Constr. Facil. 2003, 17, 144–150. [Google Scholar] [CrossRef]
  2. Ahamed, T.; Duan, J.G.; Jo, H. Flood-fragility analysis of instream bridges—Consideration of flow hydraulics, geotechnical uncertainties, and variable scour depth. Struct. Infrastruct. Eng. 2021, 17, 1494–1507. [Google Scholar] [CrossRef]
  3. ABento, M.; Gomes, A.; Viseu, T.; Couto, L.; Pêgo, J.P. Risk-based methodology for scour analysis at bridge foundations. Eng. Struct. 2020, 223, 111115. [Google Scholar] [CrossRef]
  4. Lamb, R.; Garside, P.; Pant, R.; Hall, J.W. A Probabilistic Model of the Economic Risk to Britain’s Railway Network from Bridge Scour During Floods. Risk Anal. 2019, 39, 2457–2478. [Google Scholar] [CrossRef]
  5. Prendergast, L.J.; Limongelli, M.P.; Ademovic, N.; Anžlin, A.; Gavin, K.; Zanini, M. Structural Health Monitoring for Performance Assessment of Bridges under Flooding and Seismic Actions. Struct. Eng. Int. 2018, 28, 296–307. [Google Scholar] [CrossRef]
  6. Mehta, D.J.; Yadav, S.M. Analysis of scour depth in the case of parallel bridges using HEC-RAS. Water Supply 2020, 20, 3419–3432. [Google Scholar] [CrossRef]
  7. Link, O.; García, M.; Pizarro, A.; Alcayaga, H.; Palma, S. Local Scour and Sediment Deposition at Bridge Piers during Floods. J. Hydraul. Eng. 2020, 146, 04020003. [Google Scholar] [CrossRef]
  8. Zhang, R.; Xiong, W.; Ma, X.; Cai, C.S. Progressive bridge collapse analysis under both scour and floods by coupling simulation in structural and hydraulic fields. Part I: Numerical solver. Ocean Eng. 2023, 273, 113849. [Google Scholar] [CrossRef]
  9. Pizarro, A.; Tubaldi, E. Quantification of Modelling Uncertainties in Bridge Scour Risk Assessment under Multiple Flood Events. Geosciences 2019, 9, 445. [Google Scholar] [CrossRef]
  10. Miau, S.; Hung, W.-H. River Flooding Forecasting and Anomaly Detection Based on Deep Learning. IEEE Access 2020, 8, 198384–198402. [Google Scholar] [CrossRef]
  11. Lin, Y.-B.; Lee, F.-Z.; Chang, K.-C.; Lai, J.-S.; Lo, S.-W.; Wu, J.-H.; Lin, T.-K. The Artificial Intelligence of Things Sensing System of Real-Time Bridge Scour Monitoring for Early Warning during Floods. Sensors 2021, 21, 4942. [Google Scholar] [CrossRef]
  12. Pally, R.J.; Samadi, S. Application of image processing and convolutional neural networks for flood image classification and semantic segmentation. Environ. Model. Softw. 2022, 148, 105285. [Google Scholar] [CrossRef]
  13. Cao, H.; Zhang, H.; Wang, C.; Zhang, B. Operational Flood Detection Using Sentinel-1 SAR Data over Large Areas. Water 2019, 11, 786. [Google Scholar] [CrossRef]
  14. Tanim, A.H.; McRae, C.B.; Tavakol-Davani, H.; Goharian, E. Flood Detection in Urban Areas Using Satellite Imagery and Machine Learning. Water 2022, 14, 1140. [Google Scholar] [CrossRef]
  15. Al Qundus, J.; Dabbour, K.; Gupta, S.; Meissonier, R.; Paschke, A. Wireless sensor network for AI-based flood disaster detection. Ann. Oper. Res. 2022, 319, 697–719. [Google Scholar] [CrossRef]
  16. Meixedo, A.; Santos, J.; Ribeiro, D.; Calçada, R.; Todd, M.D. Online unsupervised detection of structural changes using train–induced dynamic responses. Mech. Syst. Signal Process. 2022, 165, 108268. [Google Scholar] [CrossRef]
  17. Deng, P.; Cui, C.; Cheng, Z.; Zhang, Q.; Bu, Y. Fatigue damage prognosis of orthotropic steel deck based on data-driven LSTM. J. Constr. Steel Res. 2023, 202, 107777. [Google Scholar] [CrossRef]
  18. Ni, F.; Zhang, J.; Noori, M.N. Deep learning for data anomaly detection and data compression of a long-span suspension bridge. Comput.-Aided Civ. Infrastruct. Eng. 2020, 35, 685–700. [Google Scholar] [CrossRef]
  19. Shi, S.; Du, D.; Mercan, O.; Kalkan, E.; Wang, S. A novel unsupervised real-time damage detection method for structural health monitoring using machine learning. Struct. Control Health Monit. 2022, 29, e3042. [Google Scholar] [CrossRef]
  20. Sony, S.; Gamage, S.; Sadhu, A.; Samarabandu, J. Multiclass Damage Identification in a Full-Scale Bridge Using Optimally Tuned One-Dimensional Convolutional Neural Network. J. Comput. Civ. Eng. 2022, 36, 04021035. [Google Scholar] [CrossRef]
  21. Chen, C.-C.; Liu, Z.; Yang, G.; Wu, C.-C.; Ye, Q. An Improved Fault Diagnosis Using 1D-Convolutional Neural Network Model. Electronics 2021, 10, 59. [Google Scholar] [CrossRef]
  22. Ince, T. Real-time broken rotor bar fault detection and classification by shallow 1D convolutional neural networks. Electr. Eng. 2019, 101, 599–608. [Google Scholar] [CrossRef]
  23. Abdoli, S.; Cardinal, P.; Koerich, A.L. End-to-end environmental sound classification using a 1D convolutional neural network. Expert Syst. Appl. 2019, 136, 252–263. [Google Scholar] [CrossRef]
  24. Ragab, M.G.; Abdulkadir, S.J.; Aziz, N.; Alhussian, H.; Bala, A.; Alqushaibi, A. An Ensemble One Dimensional Convolutional Neural Network with Bayesian Optimization for Environmental Sound Classification. Appl. Sci. 2021, 11, 4660. [Google Scholar] [CrossRef]
  25. Jing, E.; Zhang, H.; Li, Z.; Liu, Y.; Ji, Z.; Ganchev, I. ECG Heartbeat Classification Based on an Improved ResNet-18 Model. Comput. Math. Methods Med. 2021, 2021, 1–13. [Google Scholar] [CrossRef]
  26. Liu, Y.; She, G.; Chen, S. Magnetic resonance image diagnosis of femoral head necrosis based on ResNet18 network. Comput. Methods Programs Biomed. 2021, 208, 106254. [Google Scholar] [CrossRef]
  27. Sarwinda, D.; Paradisa, R.H.; Bustamam, A.; Anggia, P. Deep Learning in Image Classification using Residual Network (ResNet) Variants for Detection of Colorectal Cancer. Procedia Comput. Sci. 2021, 179, 423–431. [Google Scholar] [CrossRef]
  28. Odusami, M.; Maskeliūnas, R.; Damaševičius, R.; Krilavičius, T. Analysis of Features of Alzheimer’s Disease: Detection of Early Stage from Functional Brain Changes in Magnetic Resonance Images Using a Finetuned ResNet18 Network. Diagnostics 2021, 11, 1071. [Google Scholar] [CrossRef]
  29. Liu, L.; Fan, K.; Yang, M. Federated learning: A deep learning model based on resnet18 dual path for lung nodule detection. Multimed. Tools Appl. 2023, 82, 17437–17450. [Google Scholar] [CrossRef]
  30. He, K.; Zhang, X.; Ren, S.; Sun, J. Deep Residual Learning for Image Recognition. 2016, pp. 770–778. Available online: https://openaccess.thecvf.com/content_cvpr_2016/html/He_Deep_Residual_Learning_CVPR_2016_paper.html (accessed on 4 July 2024).
Figure 1. Deployment of accelerometer sensors (sensor box dimensions: L = 11.5 in; W = 7.5 in; H = 6 in).
Infrastructures 09 00140 g001
Figure 2. Accelerometer data of the first 10 min sampled: (a) during non-flooding conditions; (b) during flooding conditions.
Infrastructures 09 00140 g002
Figure 3. Time-frequency representations without vehicles passing under non-flooding conditions: (a) river flow direction; (b) bridge direction; (c) vertical direction.
Infrastructures 09 00140 g003
Figure 4. Time-frequency representations with vehicles passing during non-flooding conditions: (a) river flow direction; (b) bridge direction; (c) vertical direction.
Infrastructures 09 00140 g004
Figure 5. Time-frequency representations without vehicles passing during flooding conditions: (a) river flow direction; (b) bridge direction; (c) vertical direction.
Infrastructures 09 00140 g005
Figure 6. Schematic of two-stage flood detection based on bridge pier vibrations.
Infrastructures 09 00140 g006
Figure 7. The architecture for vehicles passing detection on a bridge based on ResNet18.
Infrastructures 09 00140 g007
Figure 8. The architecture for flood detection based on 1D Convolution.
Infrastructures 09 00140 g008
Figure 9. Workflow for training the vehicles passing detection model (ResNet18).
Infrastructures 09 00140 g009
Figure 10. Loss and accuracy for training of the ResNet18 model: (a) training and validation losses; (b) validation accuracy.
Infrastructures 09 00140 g010
Figure 11. Workflow for training the vehicles passing detection model (1D Convolution).
Infrastructures 09 00140 g011
Figure 12. Loss and accuracy for training of the 1D Convolution model: (a) training and validation losses; (b) validation accuracy.
Infrastructures 09 00140 g012
Figure 13. Workflow for training the flood detection model (ResNet18).
Infrastructures 09 00140 g013
Figure 14. Loss and accuracy during model training using ResNet18 on the dataset without passing of vehicles: (a) training and validation losses; (b) validation accuracy.
Infrastructures 09 00140 g014
Figure 15. Loss and accuracy during model training using ResNet18 on the dataset with passing of vehicles: (a) training and validation losses; (b) validation accuracy.
Infrastructures 09 00140 g015
Figure 16. Workflow for training the flood detection model (1D Convolution).
Infrastructures 09 00140 g016
Figure 17. Loss and accuracy during model training using 1D Convolution on the dataset without passing of vehicles: (a) training and validation losses; (b) validation accuracy.
Infrastructures 09 00140 g017
Figure 18. Loss and accuracy during model training using 1D Convolution on the dataset with passing of vehicles: (a) training and validation losses; (b) validation accuracy.
Infrastructures 09 00140 g018
Table 1. Data size of different classes for training models.
Dataset SizeWithout Vehicles PassingWith Vehicles PassingTotal
Non-flooding conditions342325635986
Flooding conditions232031805500
Total5743574311,486
Table 2. The accuracy for each model and task.
ResNet18 (%)1D Convolution (%)
Vehicles passing detection97.291.4
Flood detection (without vehicles passing)97.398.3
Flood detection (with vehicles passing)81.698.6
Note: bold indicates better performance for each task.
Disclaimer/Publisher’s Note: The statements, opinions and data contained in all publications are solely those of the individual author(s) and contributor(s) and not of MDPI and/or the editor(s). MDPI and/or the editor(s) disclaim responsibility for any injury to people or property resulting from any ideas, methods, instructions or products referred to in the content.

