1. Introduction
Single-vehicle accidents represent almost one-third of all road fatalities in Europe [
1]. Passenger car occupants account for approximately 61%, i.e., 3840 passengers are killed every year. 66% of single-vehicle accidents occur on motorways or rural roads. In a single-vehicle accident, the vehicle runs off the carriageway and collides with an object at the roadside. In order to mitigate or prevent these accidents, road restraint systems, such as concrete barriers or guardrails, are used to shield road sections with dangerously distributed objects, i.e., potential hazards extending over a greater length of the roadside (e.g., embankments, ditches, rock face cuttings, forest and closely spaced trees, etc.). Crash cushions, on the other hand, are set up at selective hazard points (e.g., tunnel lay-bys, tunnel portals, gore points). Concrete safety barriers, guardrails, and crash cushions must meet the requirements defined in the EN 1317 standard in order to be allowed to be installed in Europe [
2,
3,
4]. The main criteria for the protection level of passenger car occupants are the ASI (Acceleration Severity Index) and THIV (Theoretical Head Impact Velocity). The PHD (Post-Impact Head Deceleration) is no longer considered in EN 1317 since edition 2011. In the Manual for Assessing Safety Hardware (MASH), ASI, THIV, and PHD are not required [
5]. Nevertheless, testing agencies are encouraged to calculate these criteria. Assessment criteria in MASH are determined based on the flail space model of Michie [
6], namely OIV (Occupant Impact Velocity) and ORA (Occupant Ridedown Acceleration). These metrics have in common that they are based on the vehicle body acceleration near the vehicle’s centre of gravity and the yaw rate. Even though they are indicators of occupant loads, no assessment based on anthropometric test devices (ATD) is currently considered.
In contrast, for the development of vehicles, ATD is used for the assessment of occupant loads and injury risk [
7,
8,
9]. Thereby, different metrics all over the body regions are captured and put in relation to biomechanical injury risk curves.
Some studies summarised in
Table 1 compared occupant criteria (from ATC) with road safety criteria (e.g., ASI, THIV, etc.) [
10,
11,
12,
13,
14,
15,
16,
17,
18]. Except for Gabauer and Thomson [
16,
17], all other studies used vehicles with the same weight according to EN 1317 or MASH test conditions to compare road safety criteria with occupant criteria. Gabauer and Thomson, however, analysed occupant responses from crash tests from the NHTSA (National Highway Traffic Safety Administration) with different vehicles and vehicle weights. Compared with the other studies, the collision speed was significantly lower, and the collision angle also differed significantly. Ziegler et al. [
17] used vehicles with 1100 kg and 2100 kg, which do not correspond to test vehicles in EN 1317. Some studies used finite element simulations or Madymo simulations for their analysis [
12,
14,
18,
19]. In these studies, the collision speed and the collision angle were varied.
Of the studies mentioned, only Gabauer and Thomson [
16] considered the effect of the occupant restraint systems (seat belt, airbag). However, this was based on crash test data, which were used to evaluate the safety performance of vehicles, and occupant restraint systems are of decisive importance for occupant protection. A direct comparison of occupant criteria and road safety criteria under EN 1317 impact conditions was not carried out, even though airbags, belt pretensioners, or seat belt load limiters have a huge impact on the risk of injury [
22,
23,
24,
25]. The safety performance of occupant restraint systems is not considered in EN 1317 since no ATD, equipped with respective sensors, is used, and an ATD is not even placed in all test vehicles. Furthermore, for the evaluation of road safety according to EN 1317, vehicles used are typically very old, in particular for the passenger car test condition (TB11), which has a mass of 900 kg, including an 80 kg ATD. An analysis of test data at the testing laboratory of the Vehicle Safety Institute at Graz University of Technology showed that the average age of light and medium-weight passenger cars is more than 20 years [
26]. Even though the vehicles must meet some basic requirements, it is not necessary for them to be state-of-the-art. If the passenger cars are equipped with airbags, they are switched off for the safety of the test personnel.
5. Discussion
For the conducted tests, the analysed road safety criteria are mostly quite significantly above the limits according to the certification test conditions of EN 1317 or MASH. This is mainly caused by the higher impact speed compared with the certification tests according to EN 1317-3 [
3] for the investigated crash cushion. In particular, the road safety criteria for offset impacts are significantly worse for both vehicles compared with the full overlap configuration.
However, the occupant safety criteria evaluated in this work do not exceed the limits. Corresponding limits for the occupant criteria according to specifications for frontal impact in Euro NCAP [
7] or FMVSS 208 [
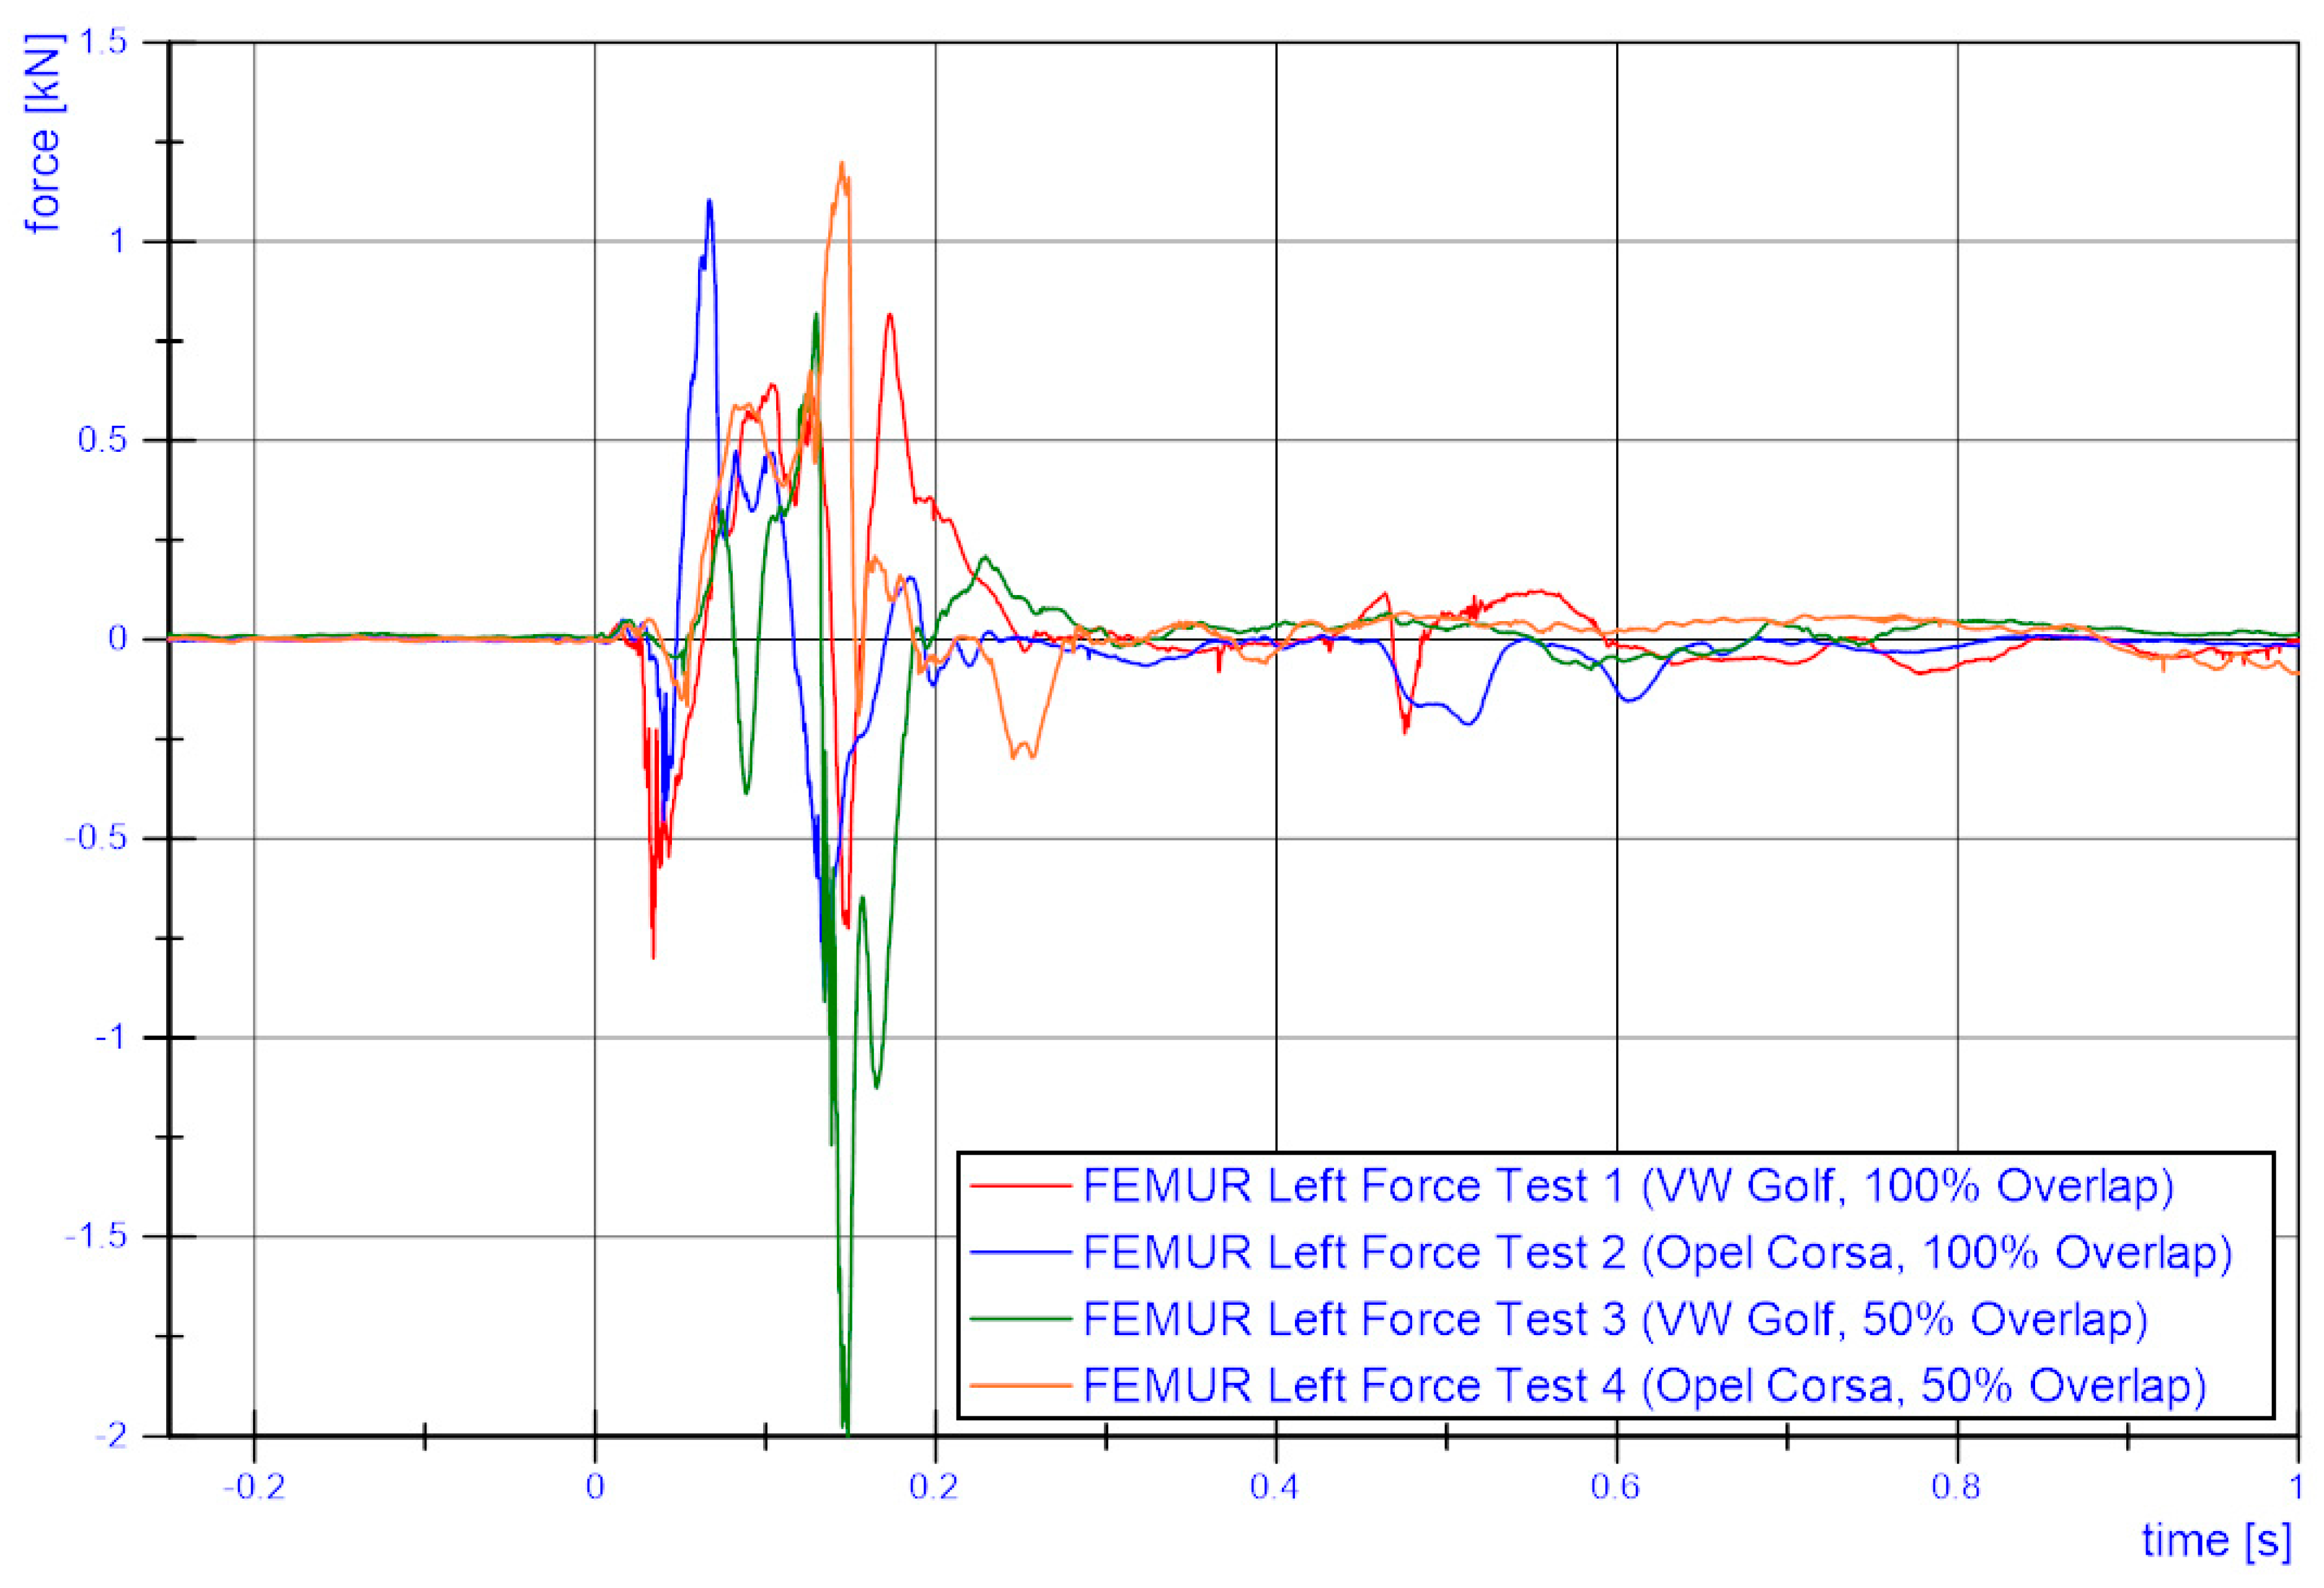
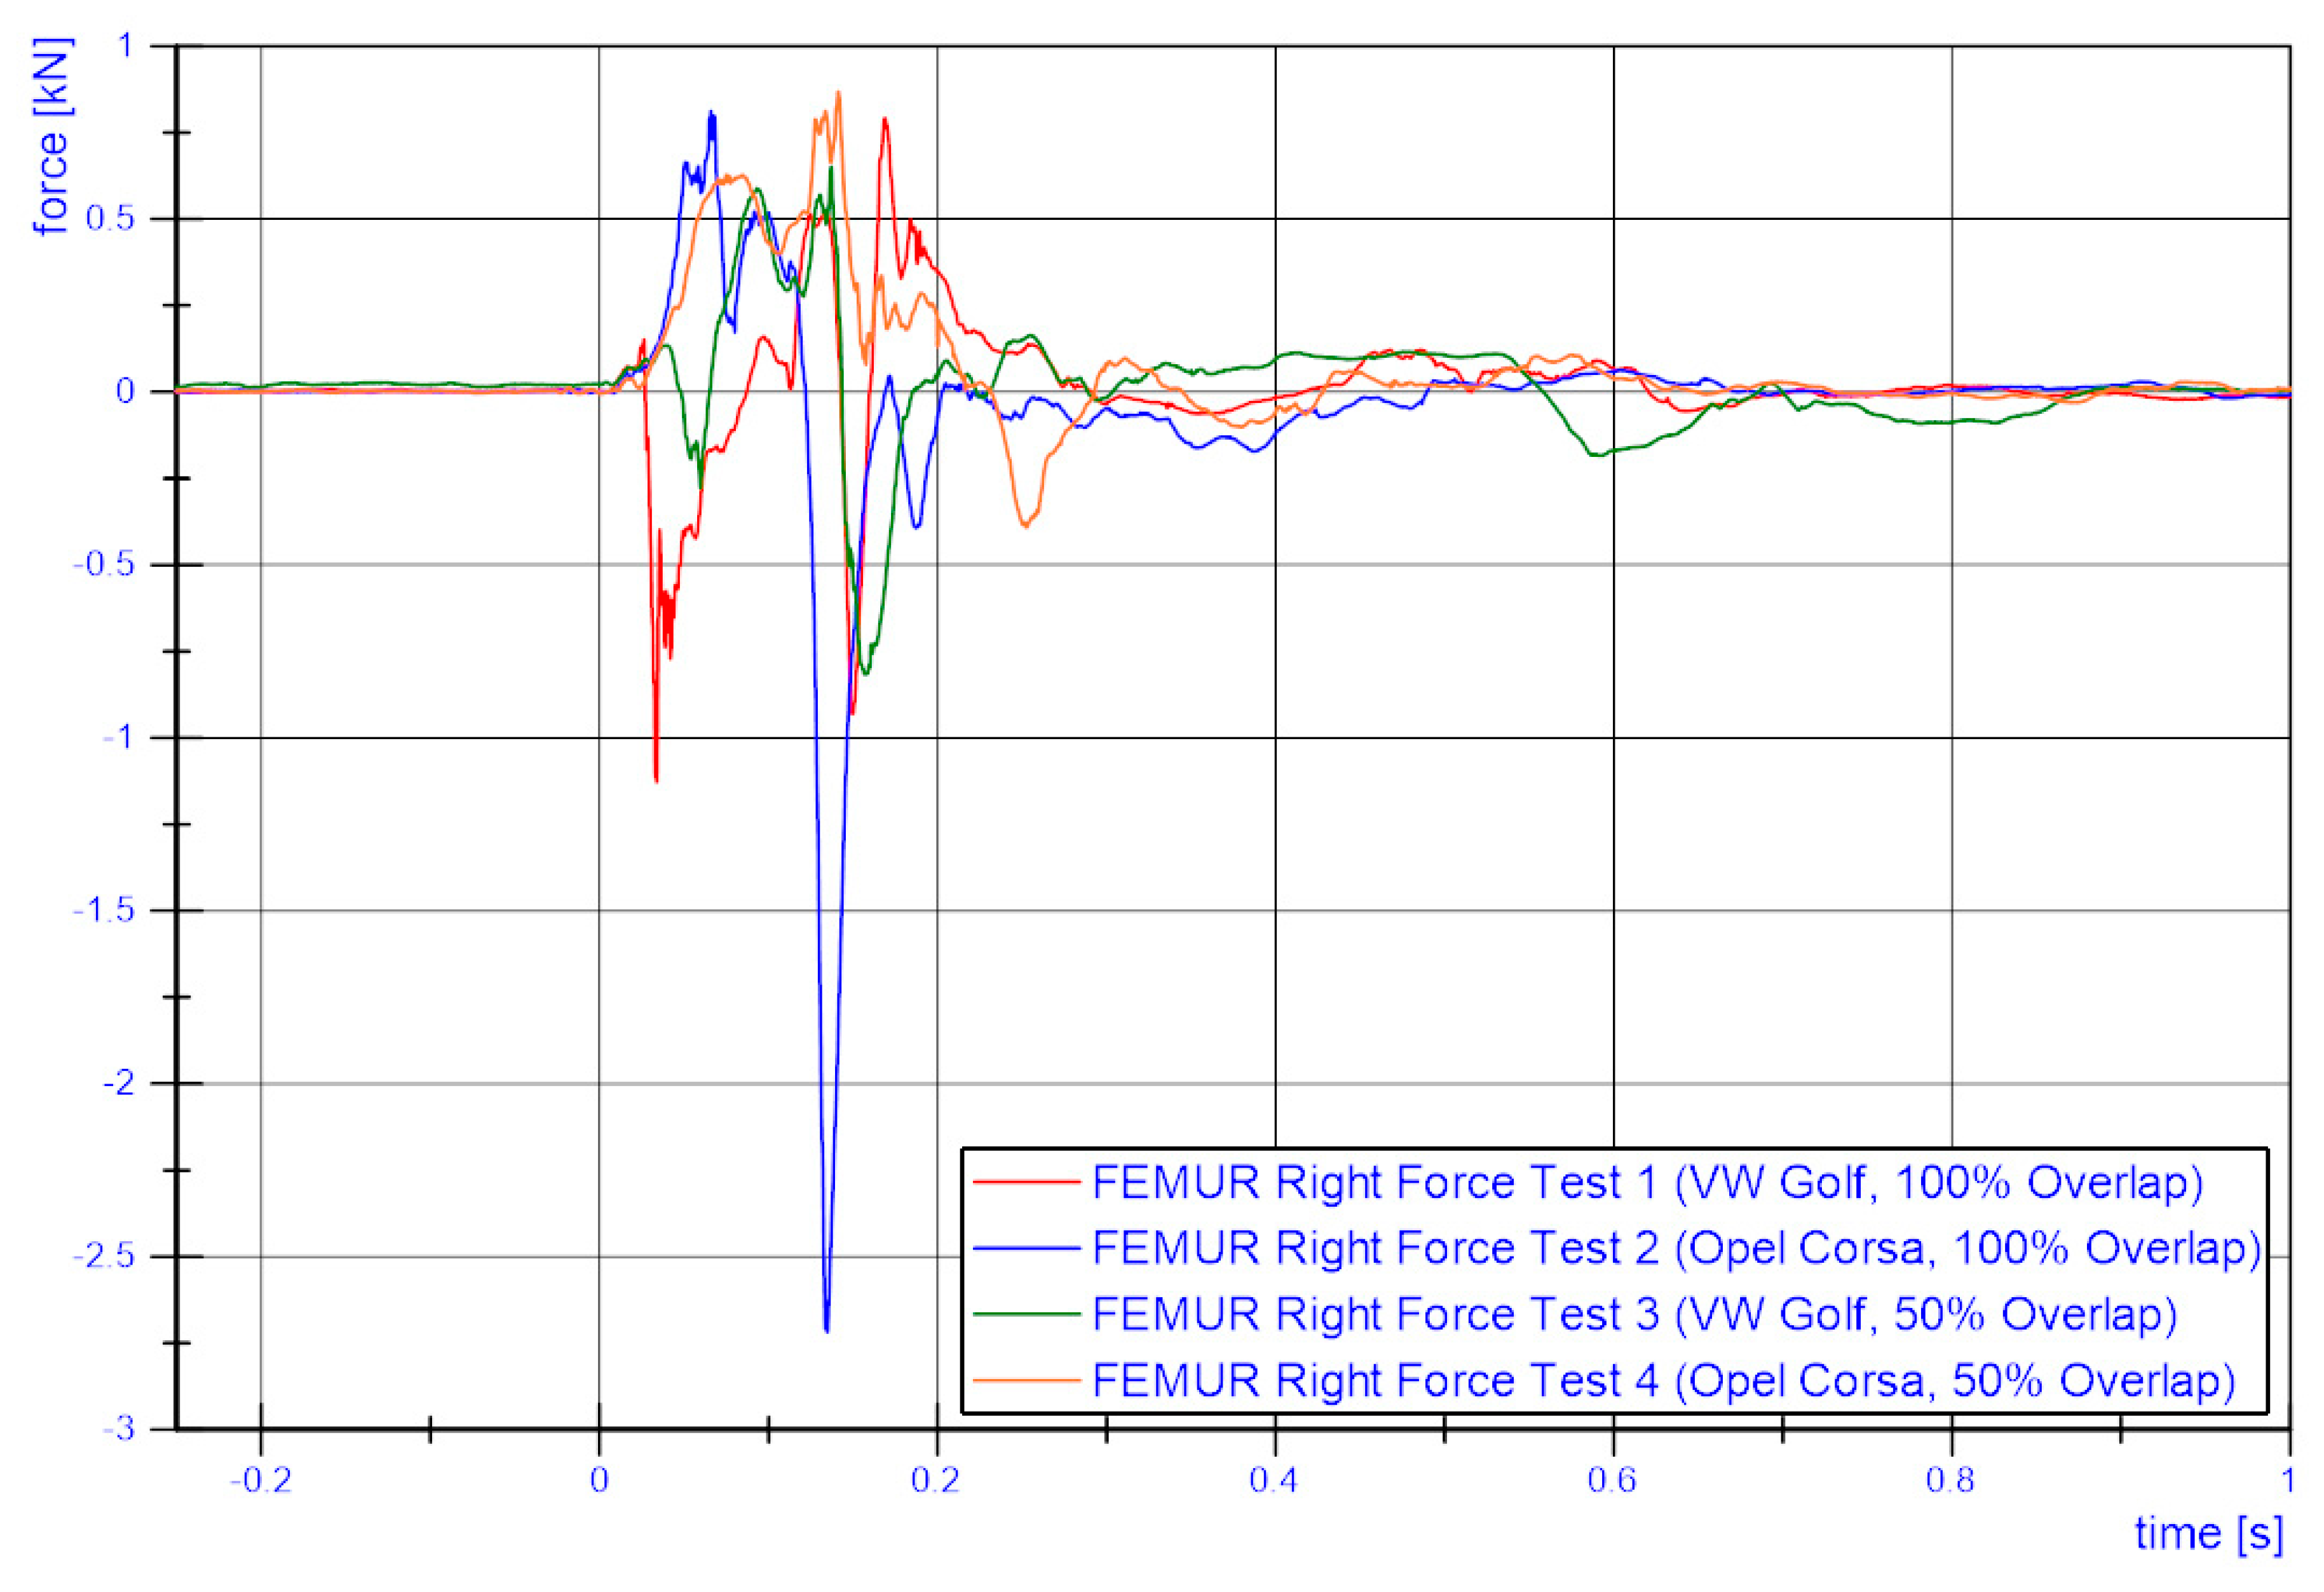
8] are largely undercut. A vehicle with improved safety equipment (airbag, load limiter, etc.) has clear advantages compared with a vehicle conventionally used for EN 1317 tests. This is true for the full overlap as well as for the offset impact.
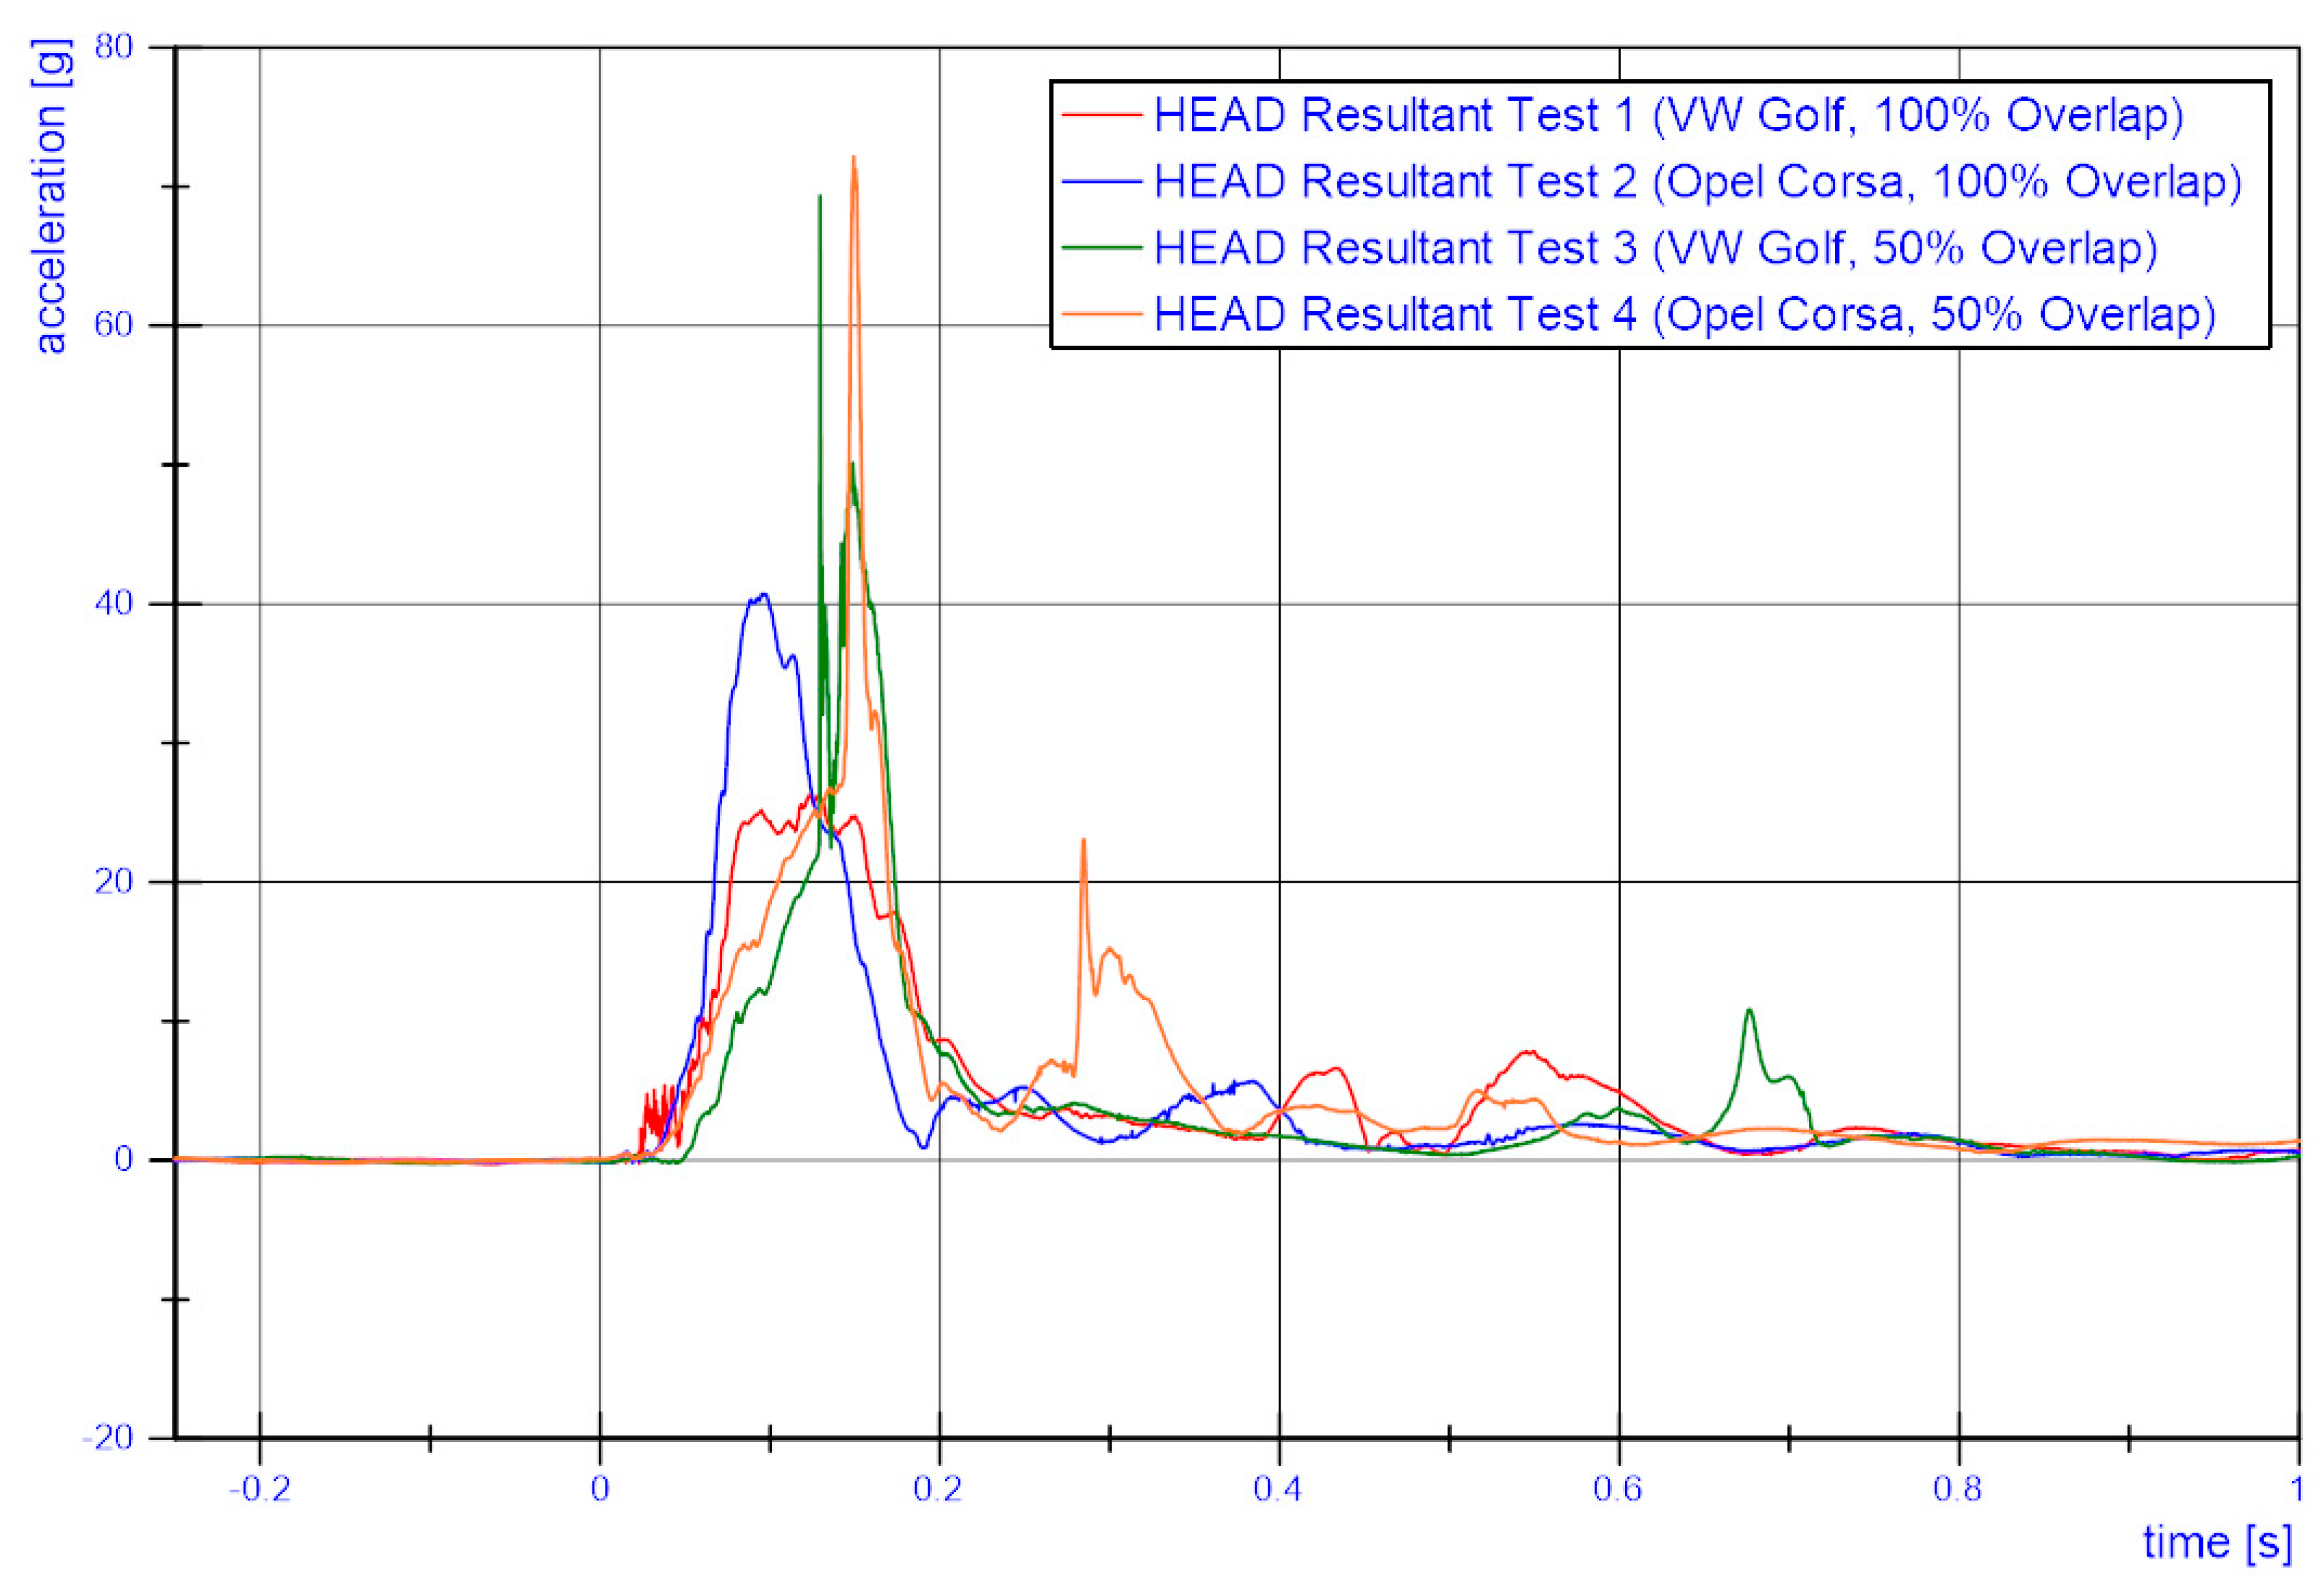
Even though only a small number of experiments were conducted, correlations between individual variables were calculated. While the ASI of the two vehicles in the full overlap is comparable, the HIC15 in the Opel Corsa is approximately three times higher than in the VW Golf. In the case of the offset impact, the ASI and the HIC are much higher compared with the full overlap but do not differ that much between vehicles. The much higher ASI for this impact configuration is a result of the hard impact against the concrete backup of the crash cushion after penetrating the cushion bag. The relatively high HIC in the VW Golf can be explained by the lack of protection provided by the airbag in the offset impact test. The airbag deploys just before the head hits the steering wheel. Therefore, the HIC15 for the VW Golf and the Opel Corsa is not that different. The HIC15 shows a positive correlation with the ASI (r = 0.9,
p = 0.099). However, the HIC15 does not come close to the limits of the regulations under consideration [
7,
8], while the ASI is in some cases significantly above the respective limits [
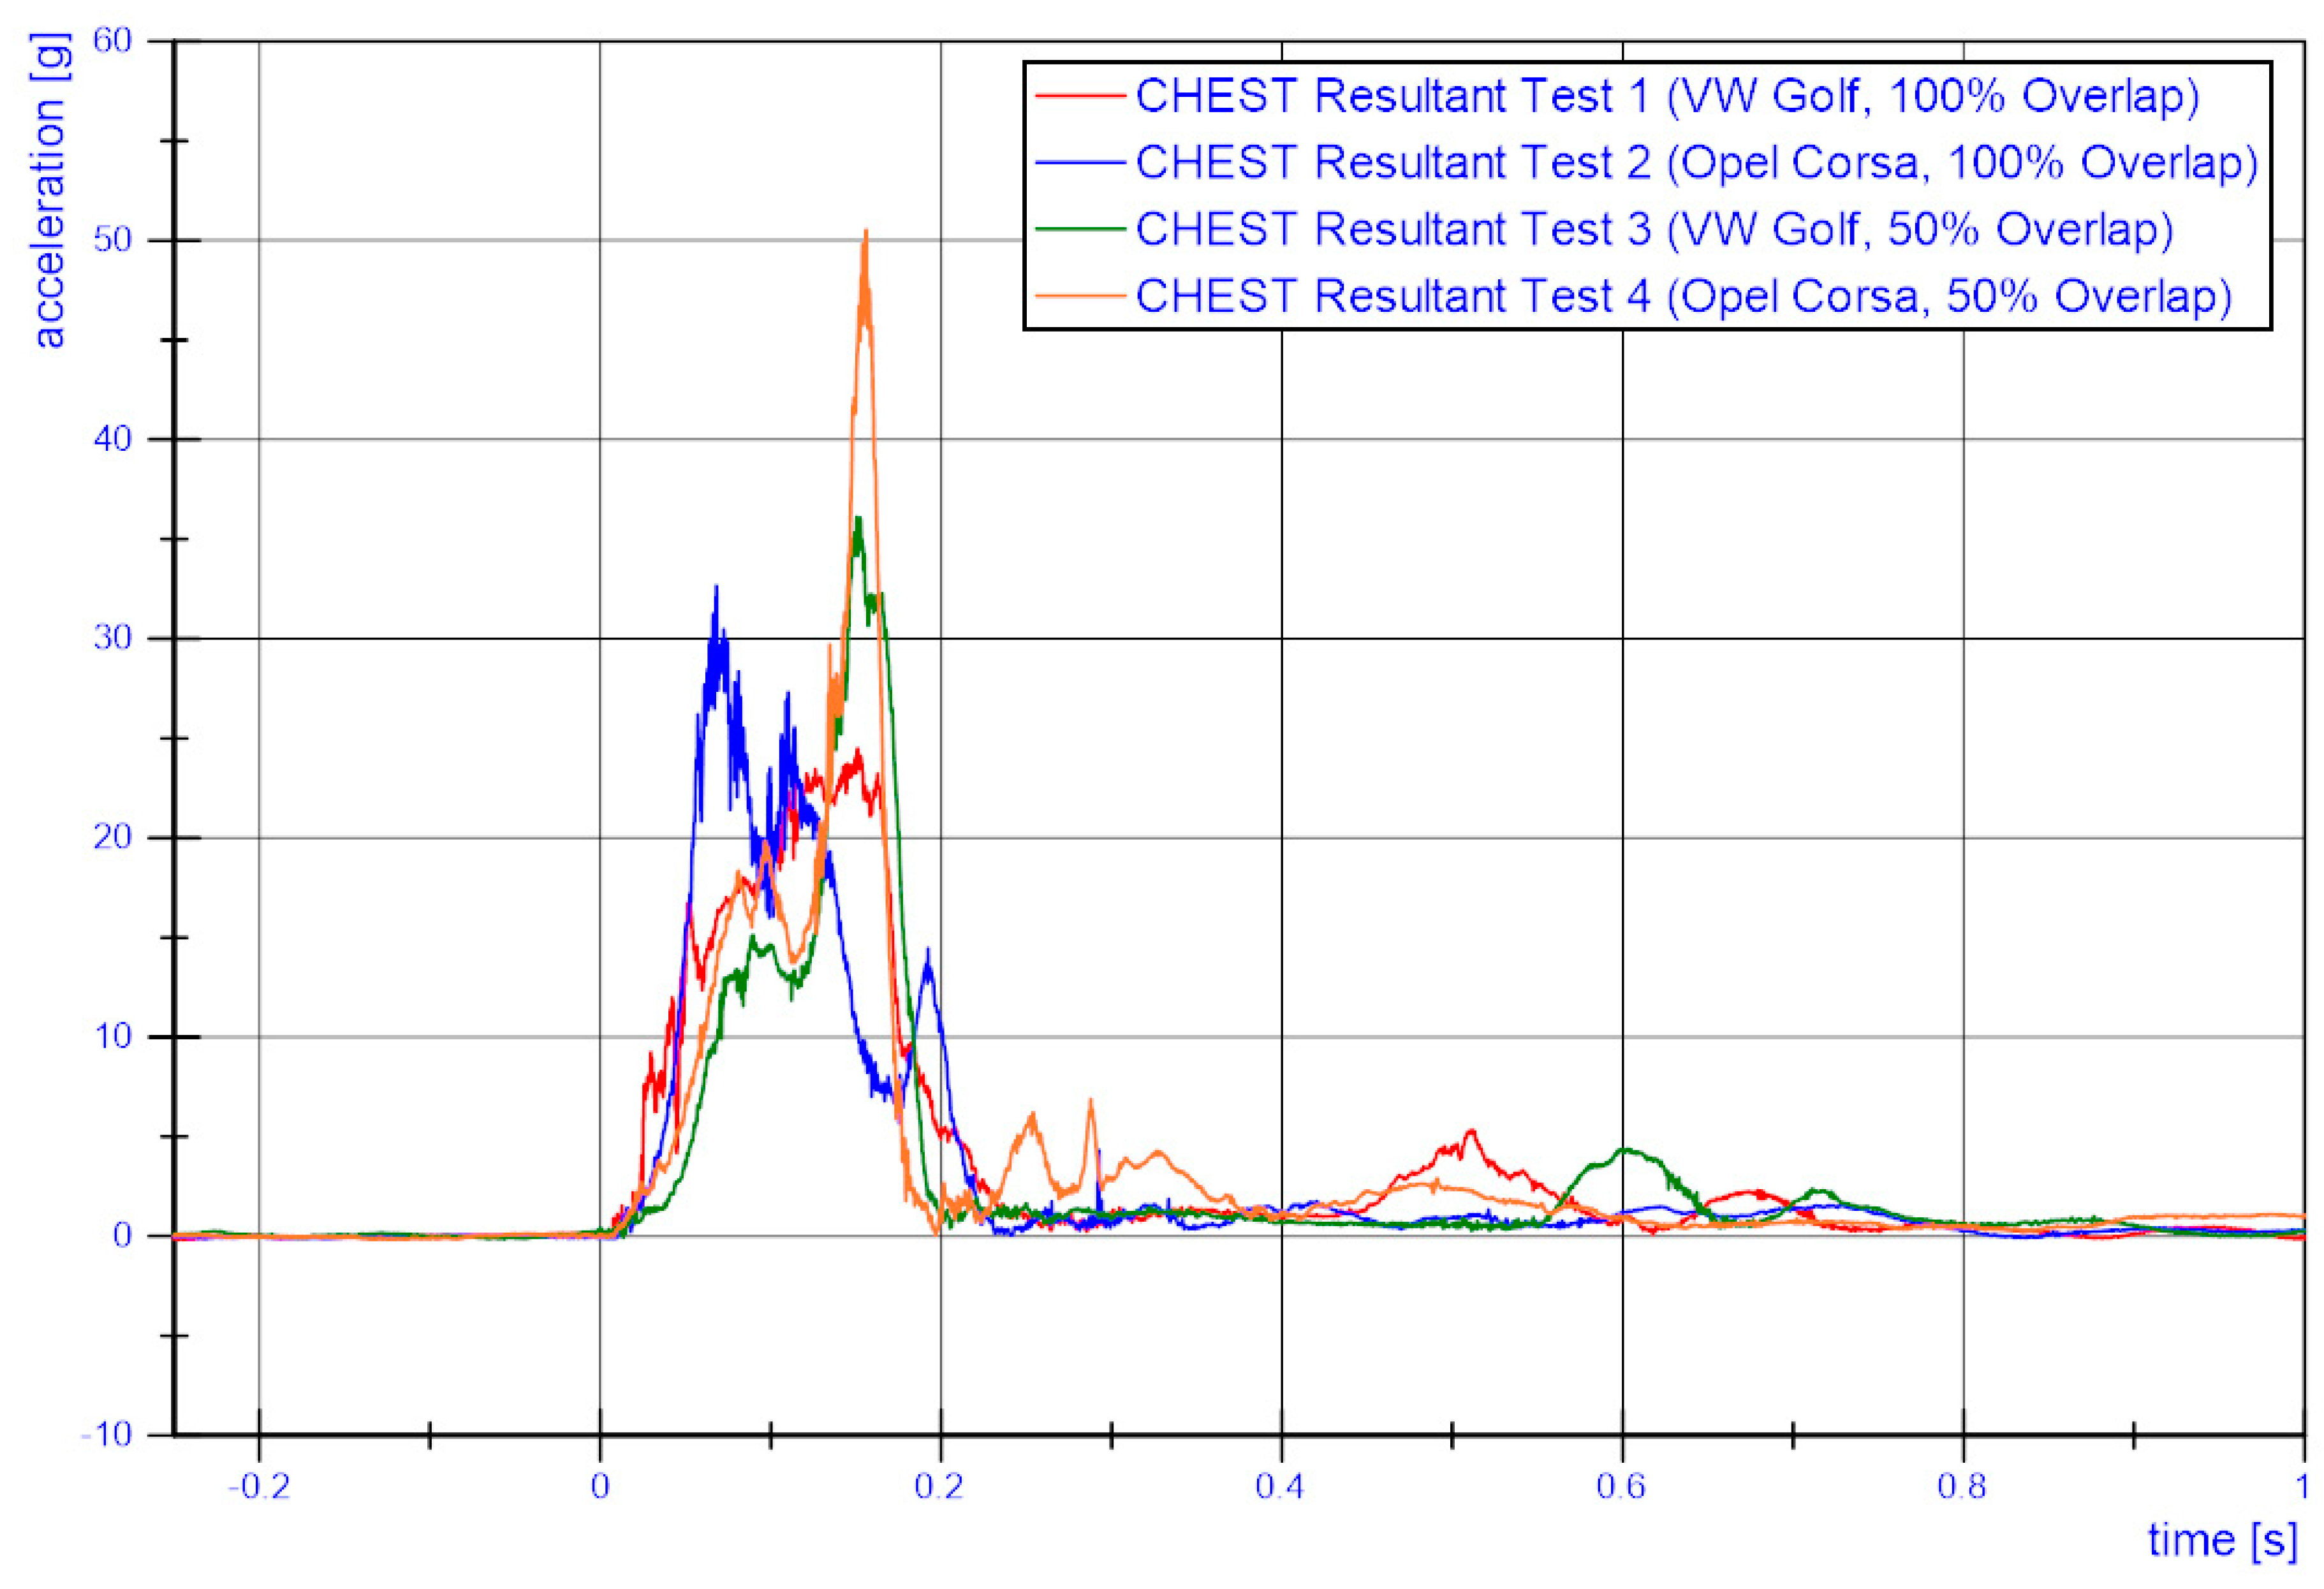
3]. Similar results for the ASI could also be found for the correlation of the HIC15 with PHD and ORA. As for HIC15, correlations were also found between ASI and a3ms head acceleration, a3ms chest acceleration, viscous criterion, as well as femur forces. The strongest correlation, however, was observed for the a3ms chest acceleration of the examined occupant injury criteria (e.g., ASI: r = 0.99,
p = 0.014).
There are only a few studies in the literature on the correlation of ASI with occupant criteria such as HIC on experimental tests. From the data of Shojaati and Schüler [
10,
11], one could assume an exponential relationship between ASI and HIC (r = 0.82). Due to the lack of experimental results in the study, the data for calculating the correlation coefficient were retrieved manually from the image material. Furthermore, the authors did not describe whether HIC15 or HIC36 were calculated, but it is assumed that they calculated HIC36. The correlation between Sturt and Fell [
12] and Ziegler et al. [
17] yields an exponential r of greater than 0.9 and is comparable with Shojaati and Schüler [
10,
11]. However, only three real experiments from each study were available. In the present study, an exponential correlation between ASI and HIC36 would result in an r of 0.51 and be of a much lower magnitude. In other studies [
13,
15,
21], which established a correlation between ASI and HIC, the correlations are comparable with the present results. Even from Gabauer and Thomson [
16], who analysed only frontal collisions, only a very low exponential correlation with an r of 0.36 can be observed (values retrieved manually from the images). Numerical calculations by Klootwijk et al. [
14] yield an exponential correlation between ASI and HIC15 with an r of 0.88 or a linear correlation with an r of 0.9 (values retrieved manually from the images). In Sturt and Fell [
12], an exponential correlation coefficient of 0.93 was obtained. Li et al. [
18] yield an exponential correlation between ASI and HIC15 of 0.91 (values retrieved manually from the images). The exponential correlation between ASI and HIC15 in Meng et al. [
20] is of a lower magnitude (r = 0.47).
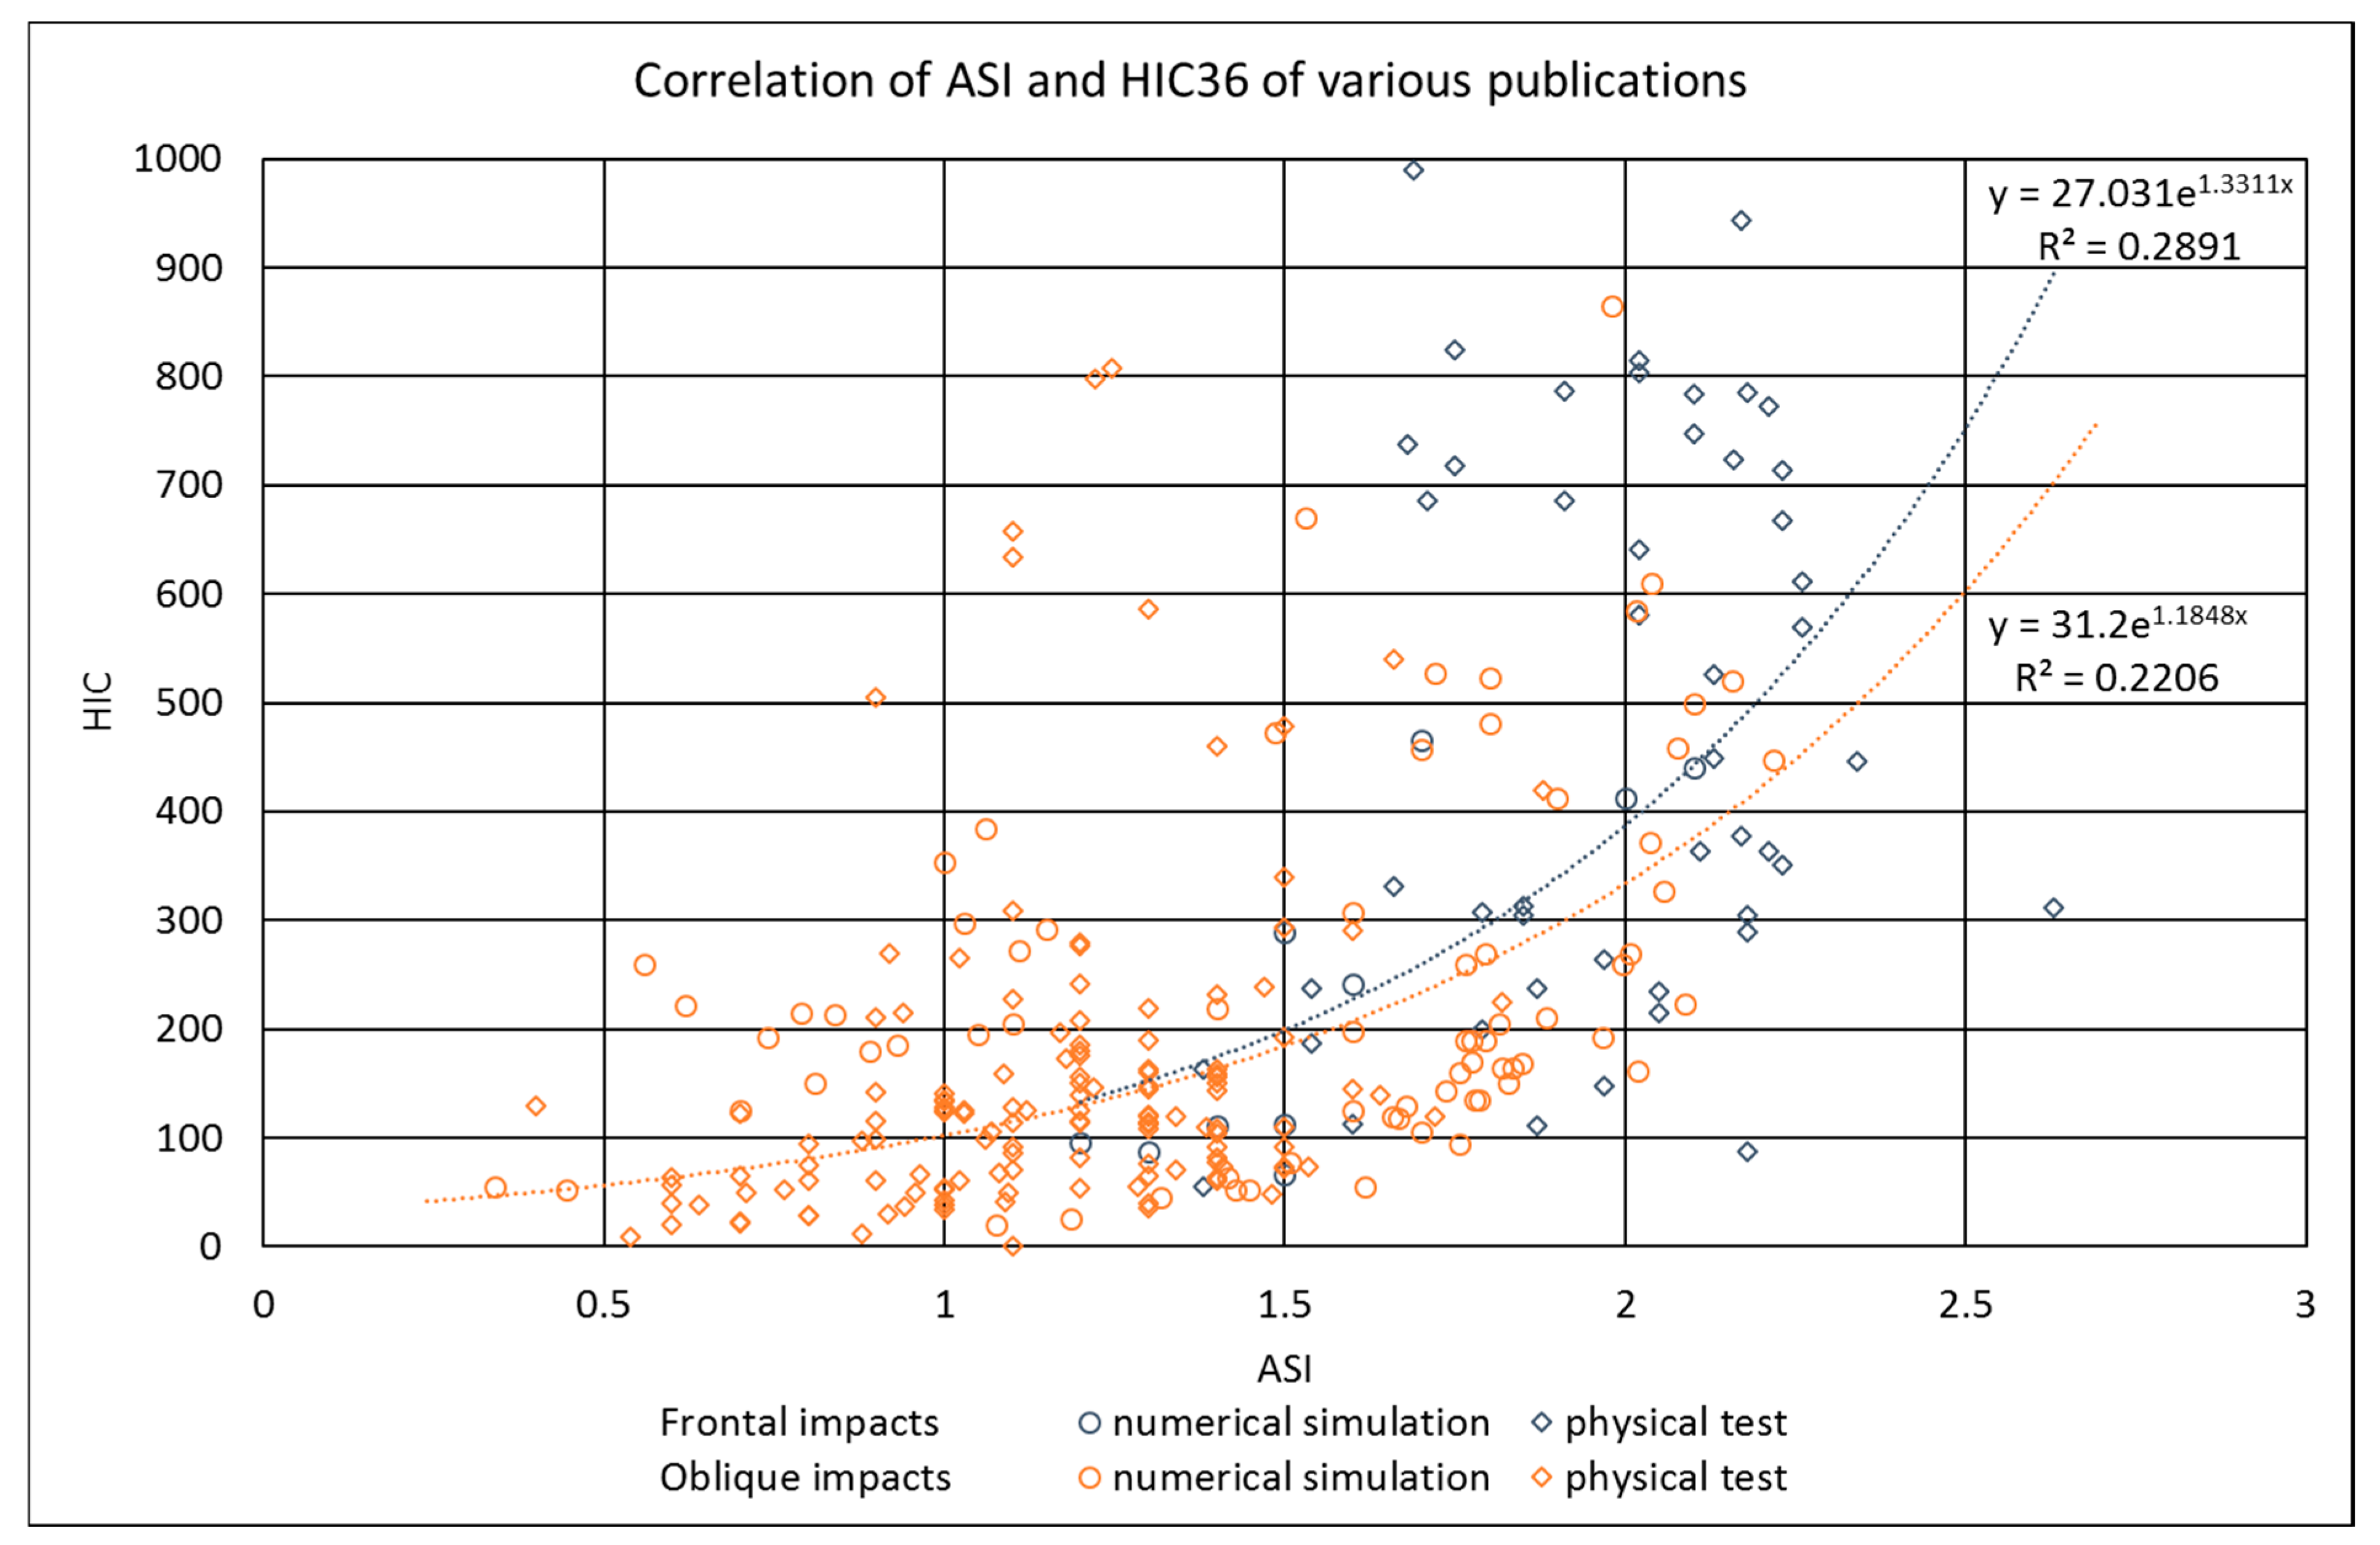
If all available studies on ASI and HIC are analysed, a minor exponential correlation can be observed (
Figure 4). The test data are divided into frontal impacts (r = 0.54) and oblique impacts (r = 0.47), with a further distinction made between numerical simulation and physical tests.
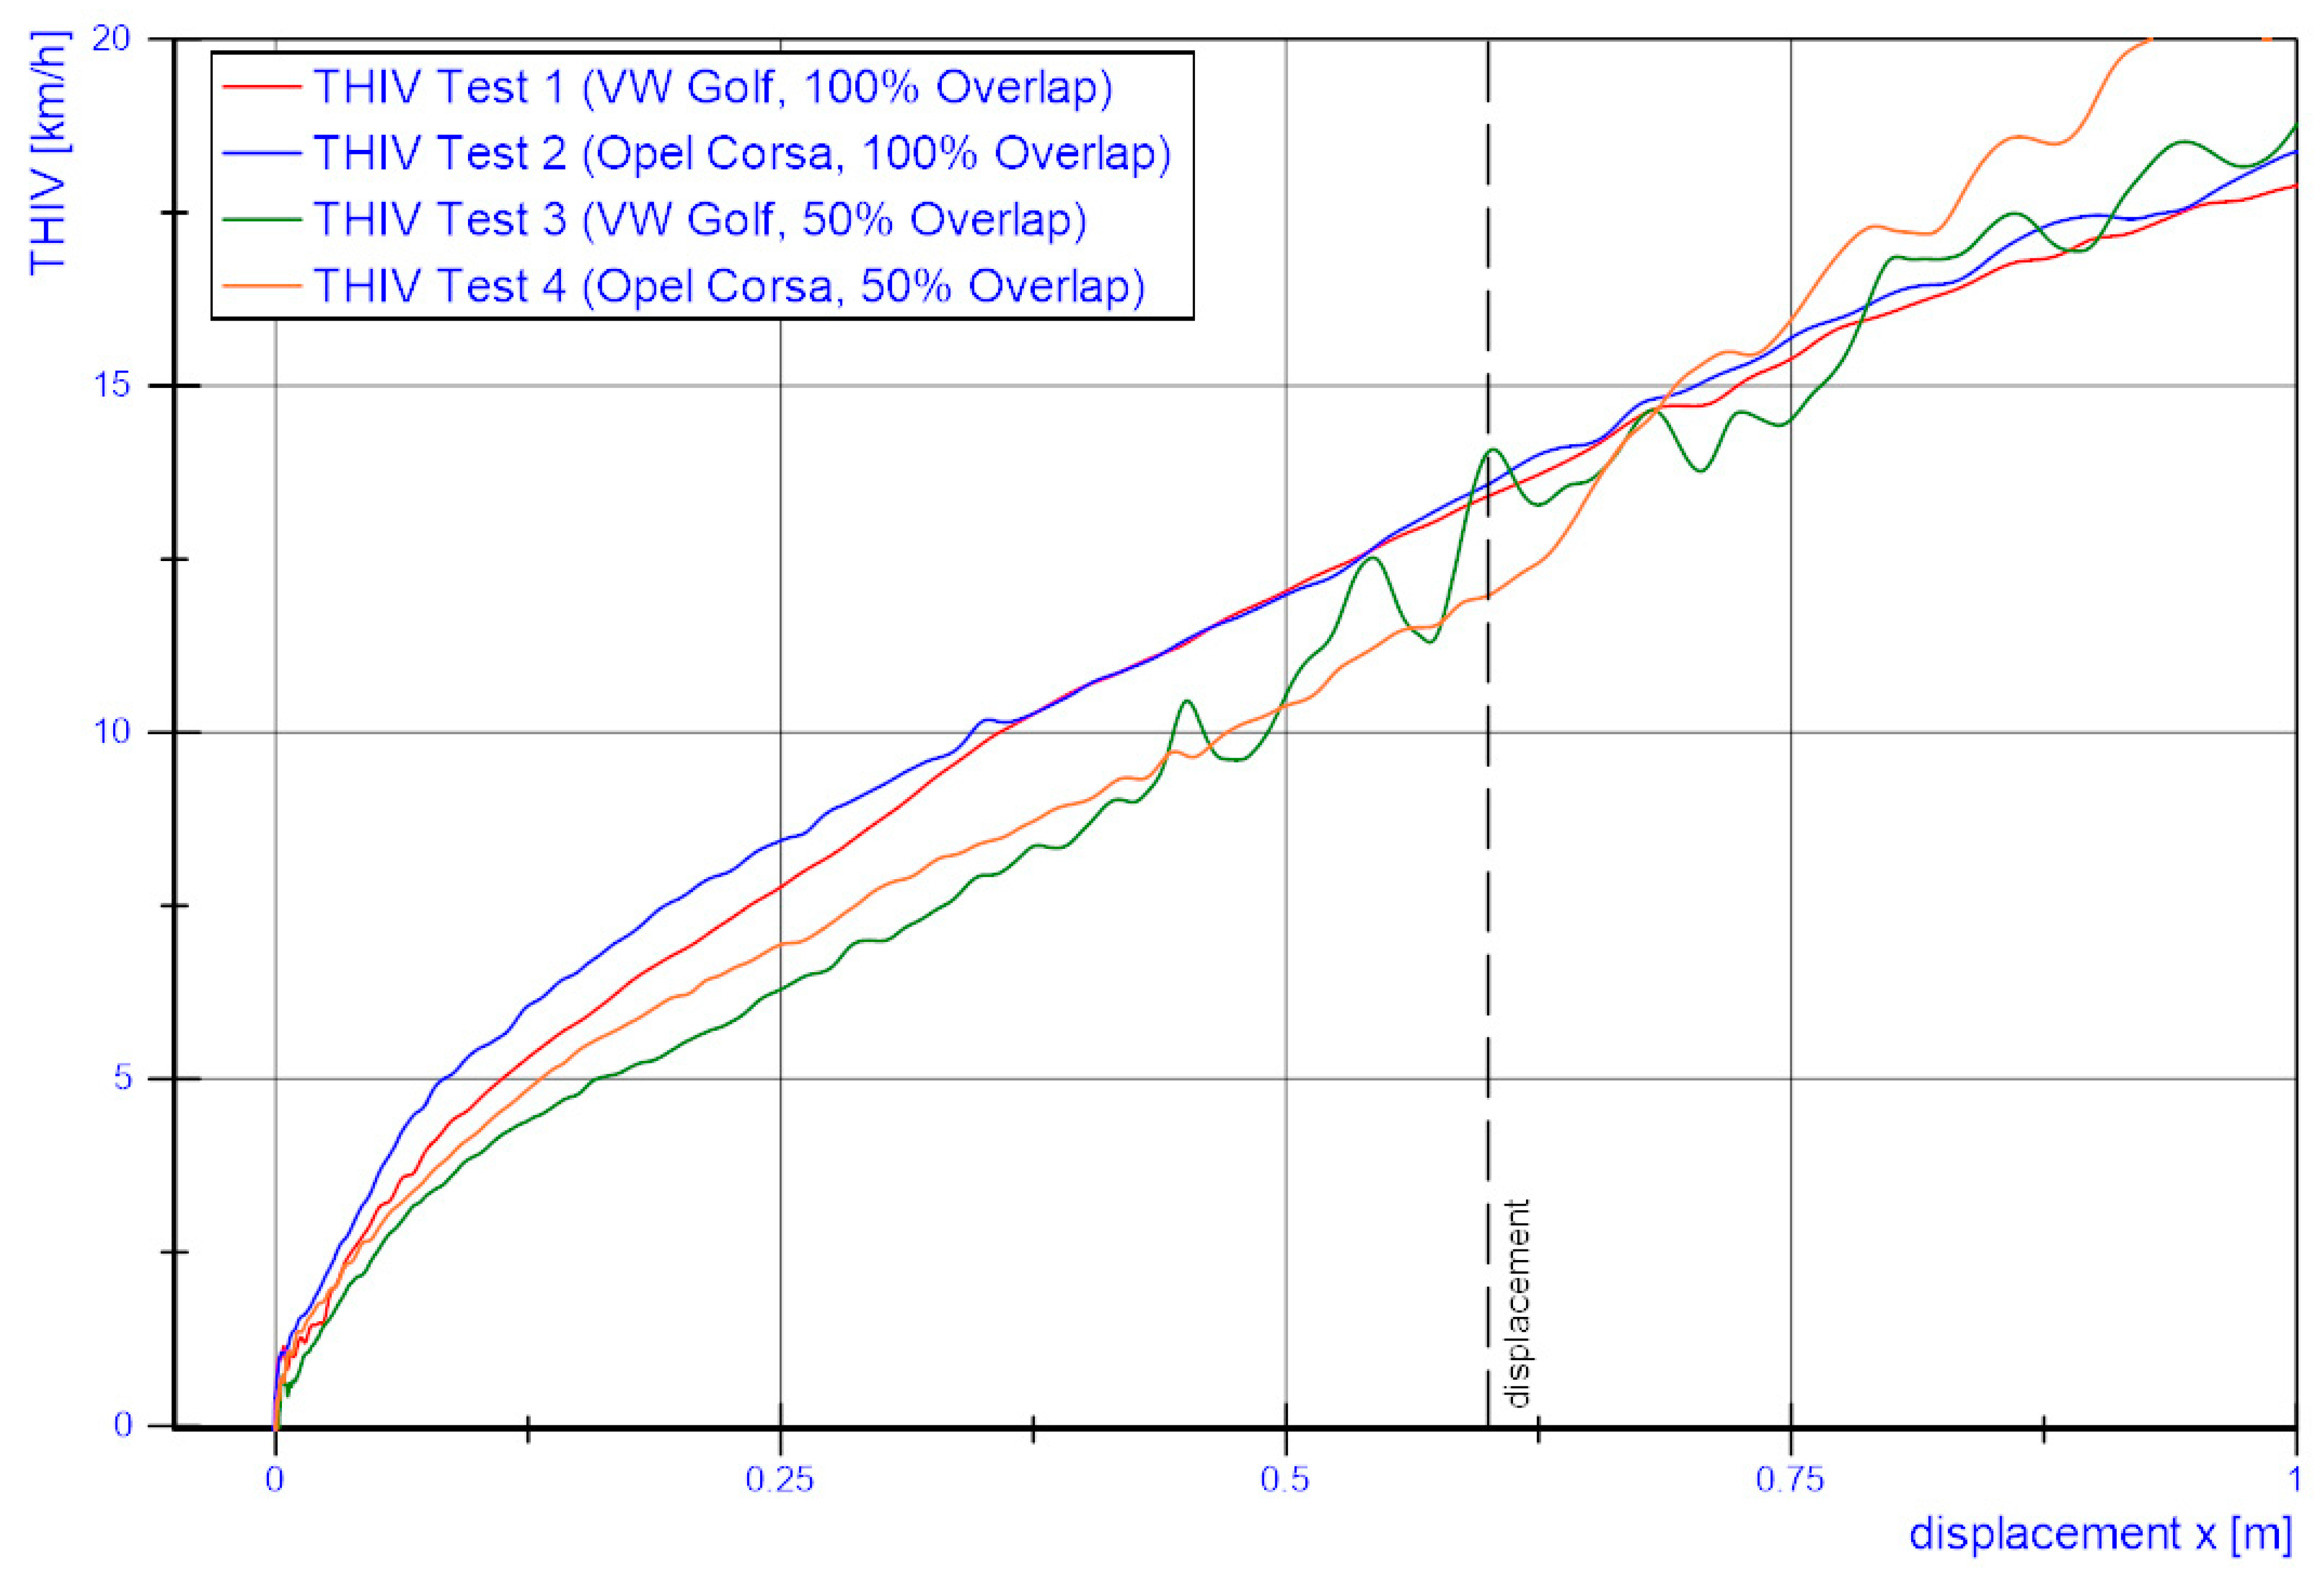
Even though there is a significant spread of head loads (HIC15, a3ms) in the four Entsprechende Kurven zu den Kriterien sind im Anhang.tests, THIV and OIV show only minor variance between the results. The correlation of HIC15 with THIV and OIV, however, is negative (r = −0.43,
p = 0.572, and r = −0.73,
p = 0.271). This is curious because the THIV and OIV are used to assess the head injury risk. In Sturt and Fell [
12], an exponential correlation between THIV and HIC could be assumed (r = 0.95), but information on some of the individual values is missing, and the data were manually extracted from the image material. Gabauer and Thomson [
16] found a negative linear correlation between the OIV and the HIC. Within the analysed tests, at the same collision speed, OIV correlated negatively with HIC (25 mph: r = −0.07; 30 mph: −0.61; 35 mph: −0.29). These correlations are comparable to the findings in the current study. In Meng et al. [
20], there is no correlation between THIV and HIC15 (r = 0.07). In contrast, the numerical simulation in Li et al. [
18] yields an exponential correlation of r = 0.95 between THIV and HIC15. However, both the speed and the impact angle were varied in this study, which can have a major influence on the values. It was observed that HIC increased much more than THIV. Ziegler et al. [
17] conclude that the THIV is actually inappropriate for assessing the head injury risk. Chell et al. [
15] also conclude that the THIV does not adequately represent real head impact velocity.
From the literature, only the study by Gabauer and Thomson [
16] is comparable with the present results. Gabauer and Thomson were the only authors who analysed frontal collisions. They found a negative linear correlation between THIV and HIC if impact velocities were clustered. In the other studies (Li et al. [
18], Meng et al. [
20], Ziegler et al. [
17]), different impact angles were considered, and the collision velocity was also varied and therefore not directly comparable.
The reason for the negative correlation between the HIC and the THIV is possibly due to the calculation method. The HIC is calculated directly from the measured accelerations in the head of the ATD [
35], and the THIV is based on the flail space model of Michie [
6]. In this model, it is assumed that the occupant collides with a part of the vehicle after moving in free flight (“flail”). The THIV corresponds to the speed after this free-flight motion.
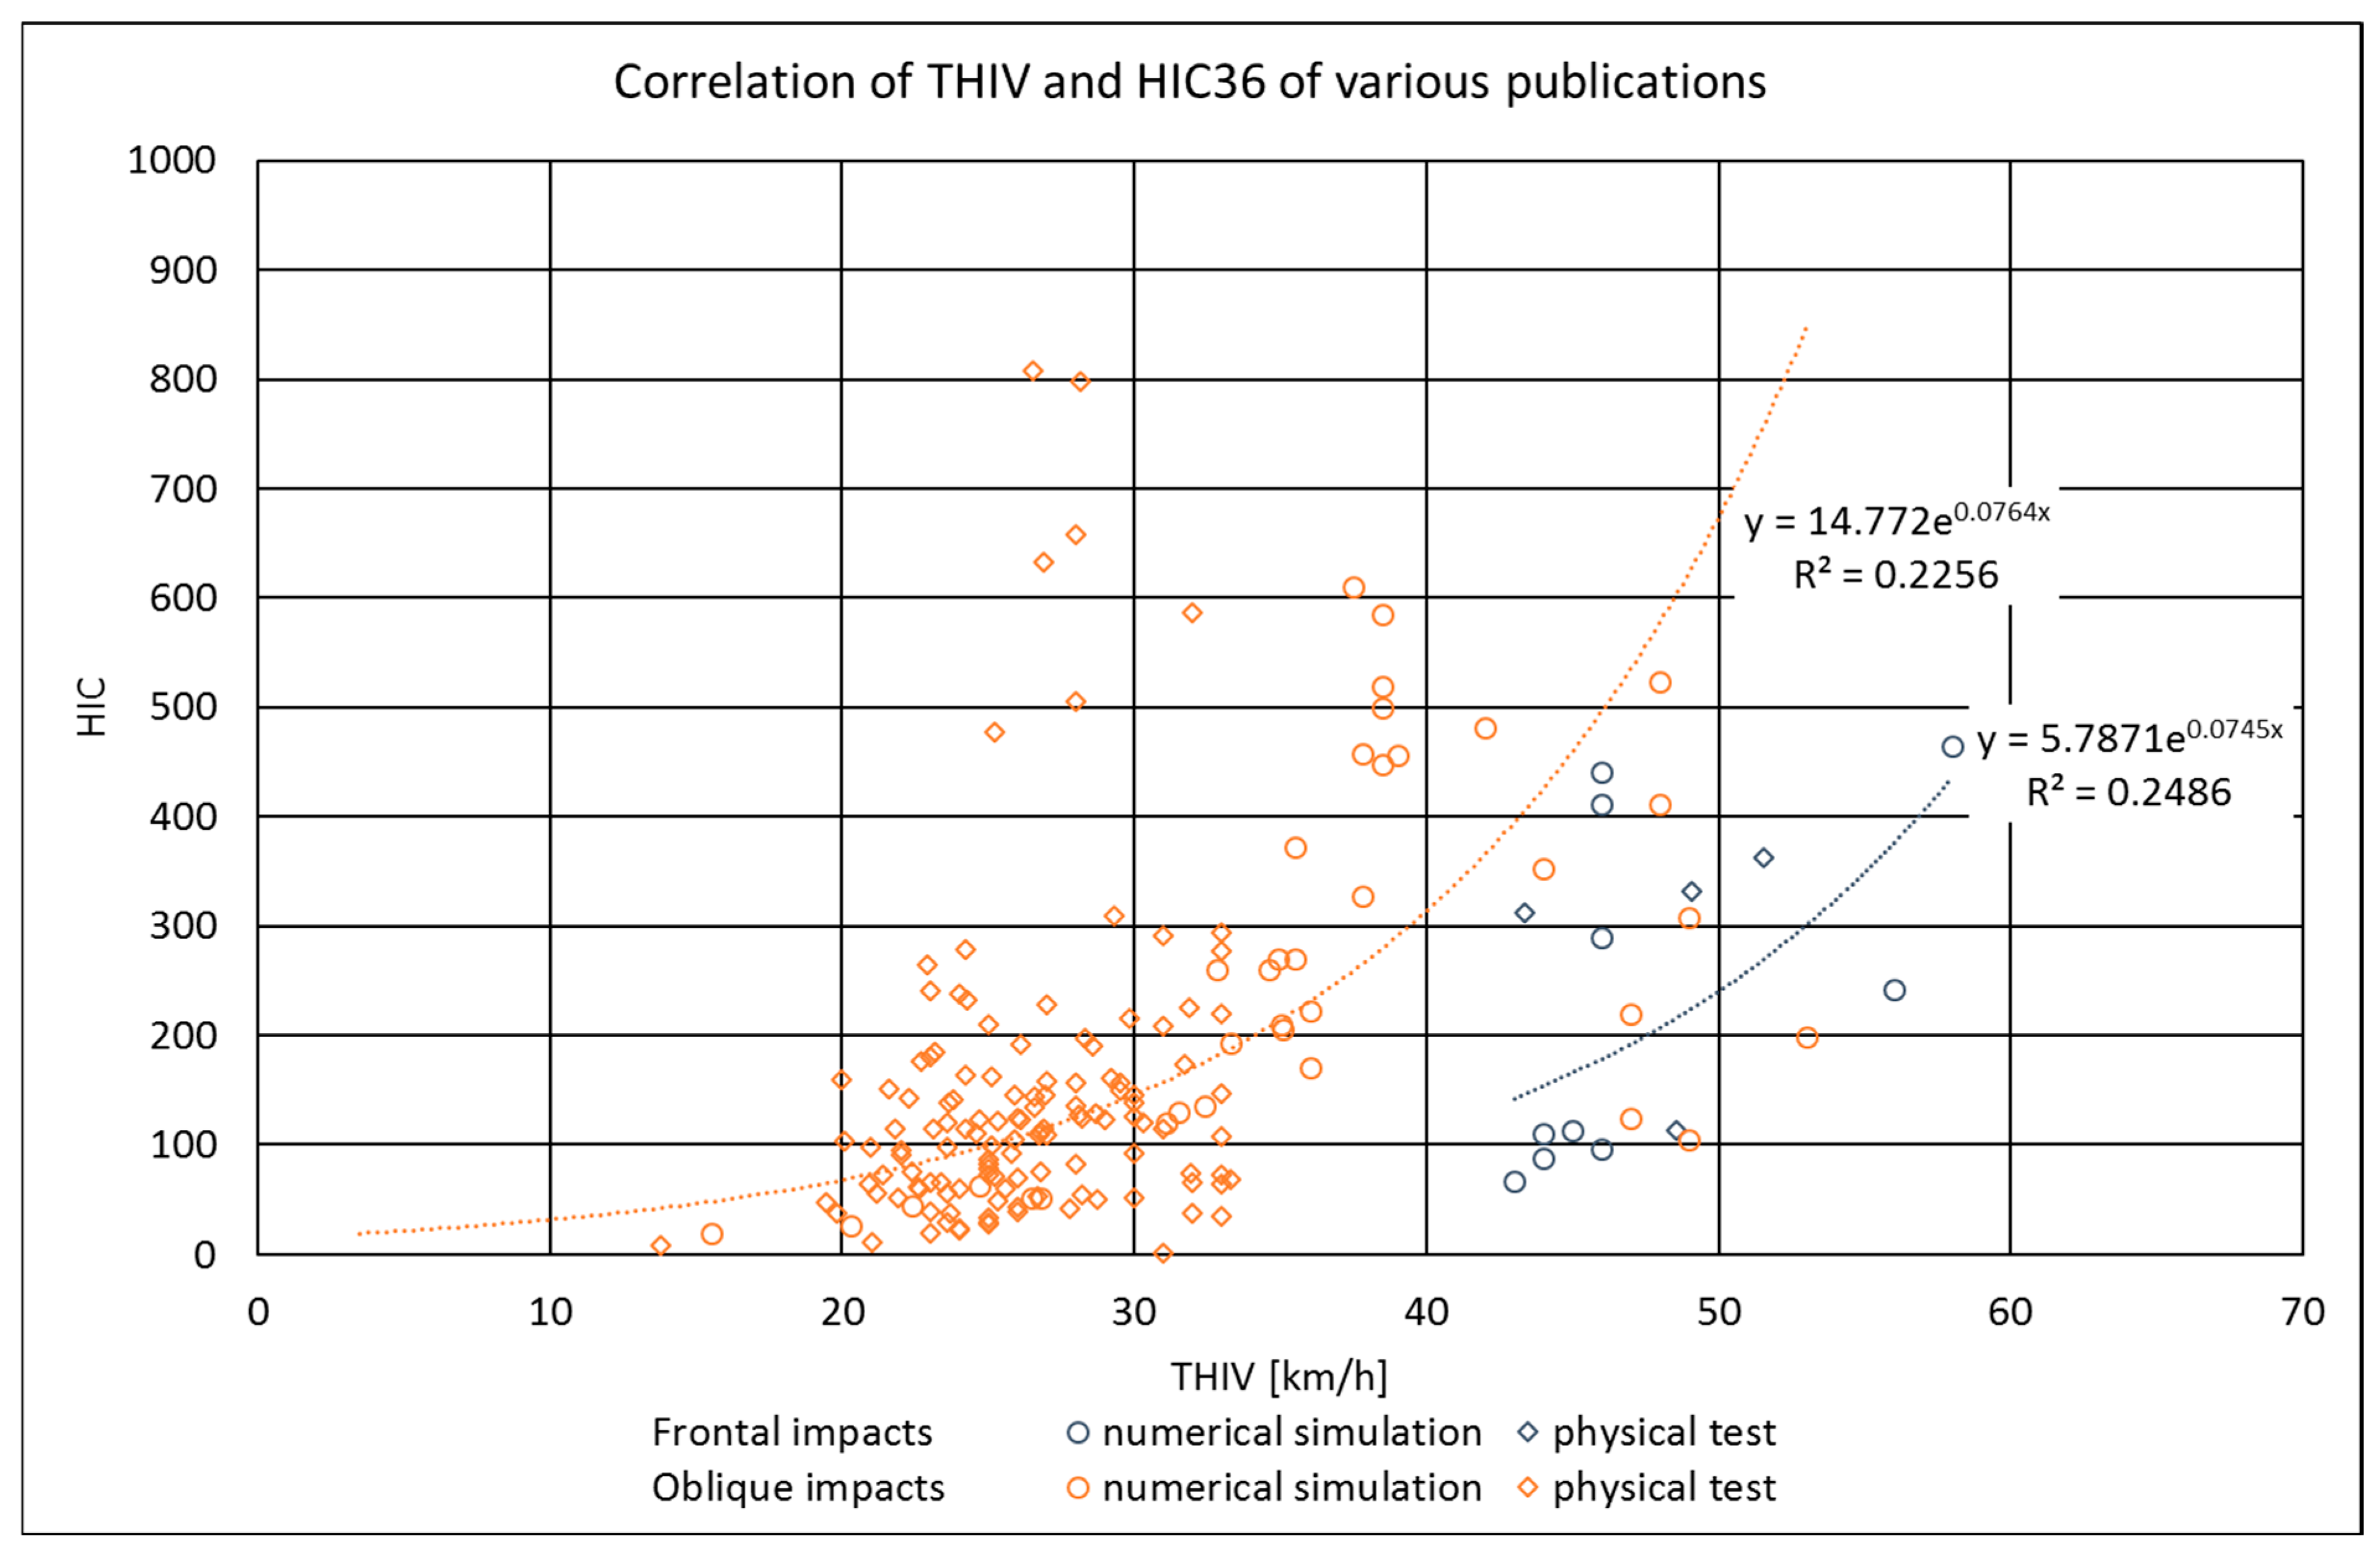
Figure 5 summarises all available studies on the correlation of THIV and HIC36. A minor exponential correlation is found for frontal test configurations (r = 0.50) and oblique impacts (r = 0.48).
The other injury criteria also correlate negatively with THIV or OIV. An exception is the OIV with Nij and the THIV with neck extension. In Ziegler et al. [
17], a strong correlation between THIV and a3ms chest acceleration is identified. This correlation is highly related to the impacts of concrete barriers.
According to the accident analysis, in the case of a car collision with a vehicle restraint system, the main body regions affected are the head and face, the chest, the spine, specifically the cervical spine, and the extremities [
17,
52]. With increasing injury severity, the head and thorax are by far the most frequently affected, with the extremities increasingly losing significance in terms of injury [
52]. Consequently, for tests according to EN 1317, it makes sense to supplement ASI and THIV by evaluating corresponding body regions. The most promising body region might be the head. Head acceleration can be used to calculate the HIC and the a3ms head acceleration. Chell et al. [
15] have already proposed instrumentation of the dummy head with accelerometers. Injury criteria such as HIC, chest criteria, etc. are very strongly dependent on the occupant restraint system [
16] and can significantly contribute to minimising the risk of injury [
22,
23,
24,
25]. Consequently, for a comparable assessment of occupant loads at impacts against different crash cushions or guardrails, evenly equipped test vehicles have to be used. Otherwise, the worse performance of the restraint system could be overcompensated by a well-performing occupant protection system.
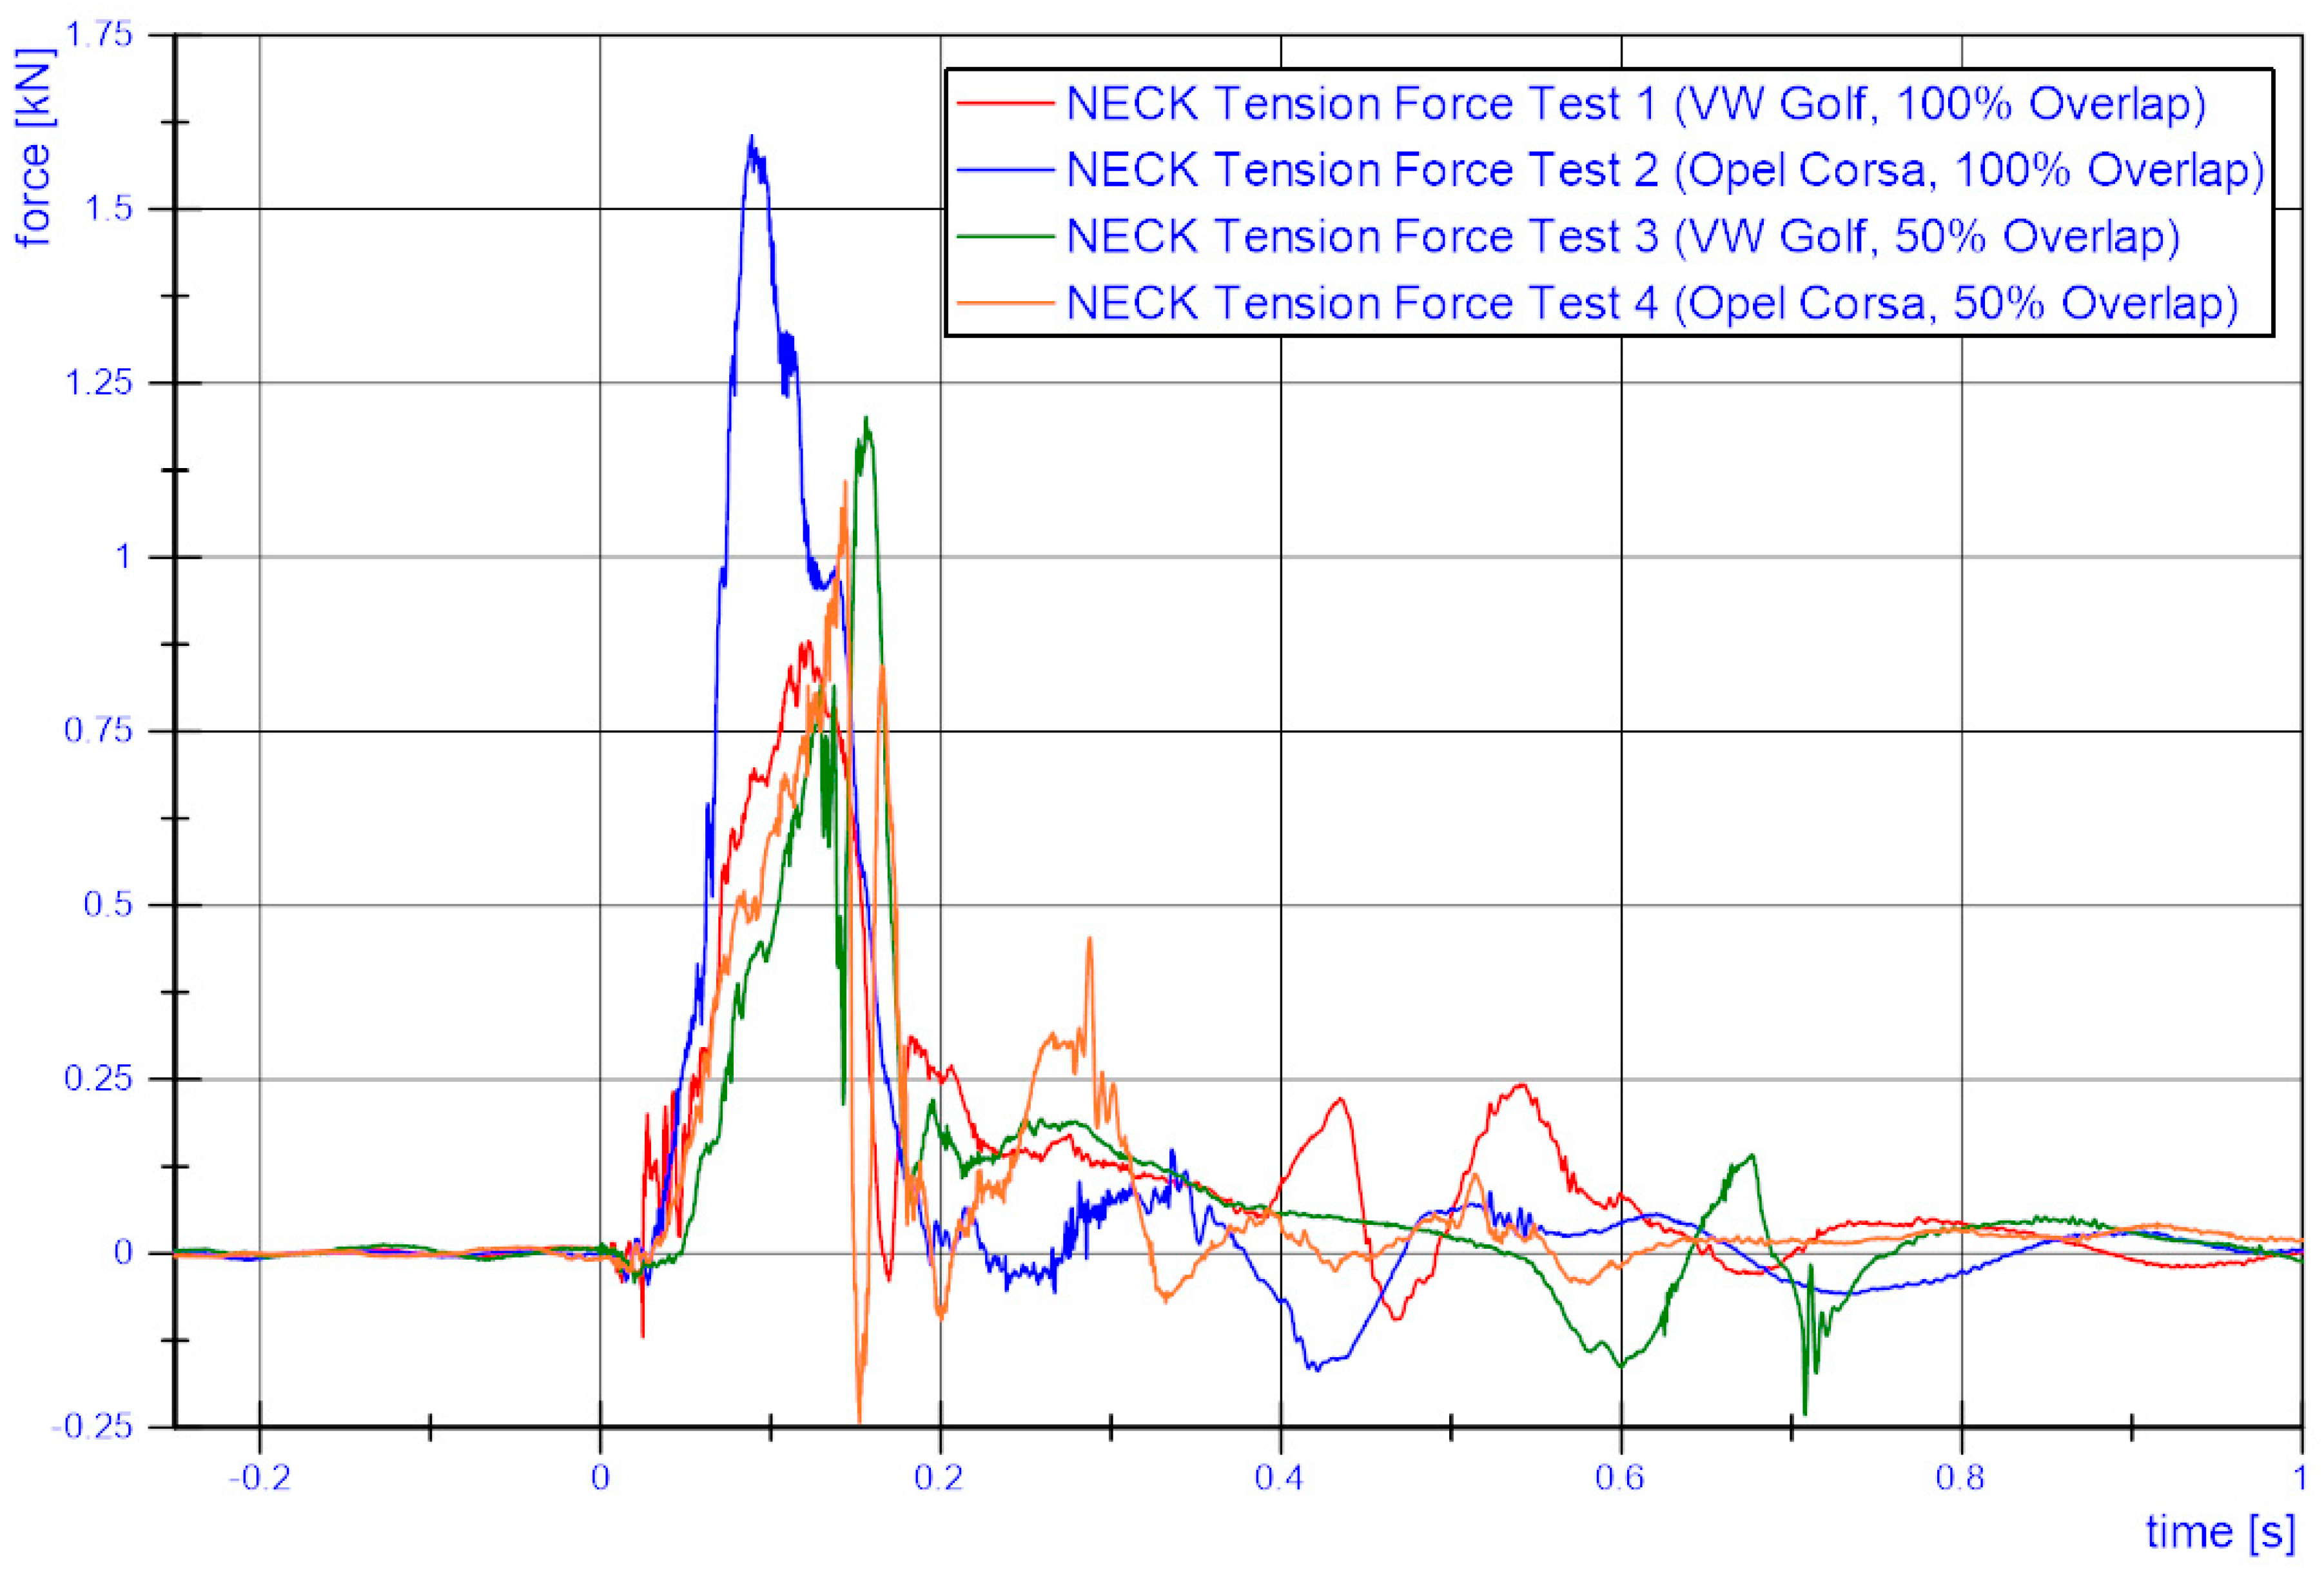
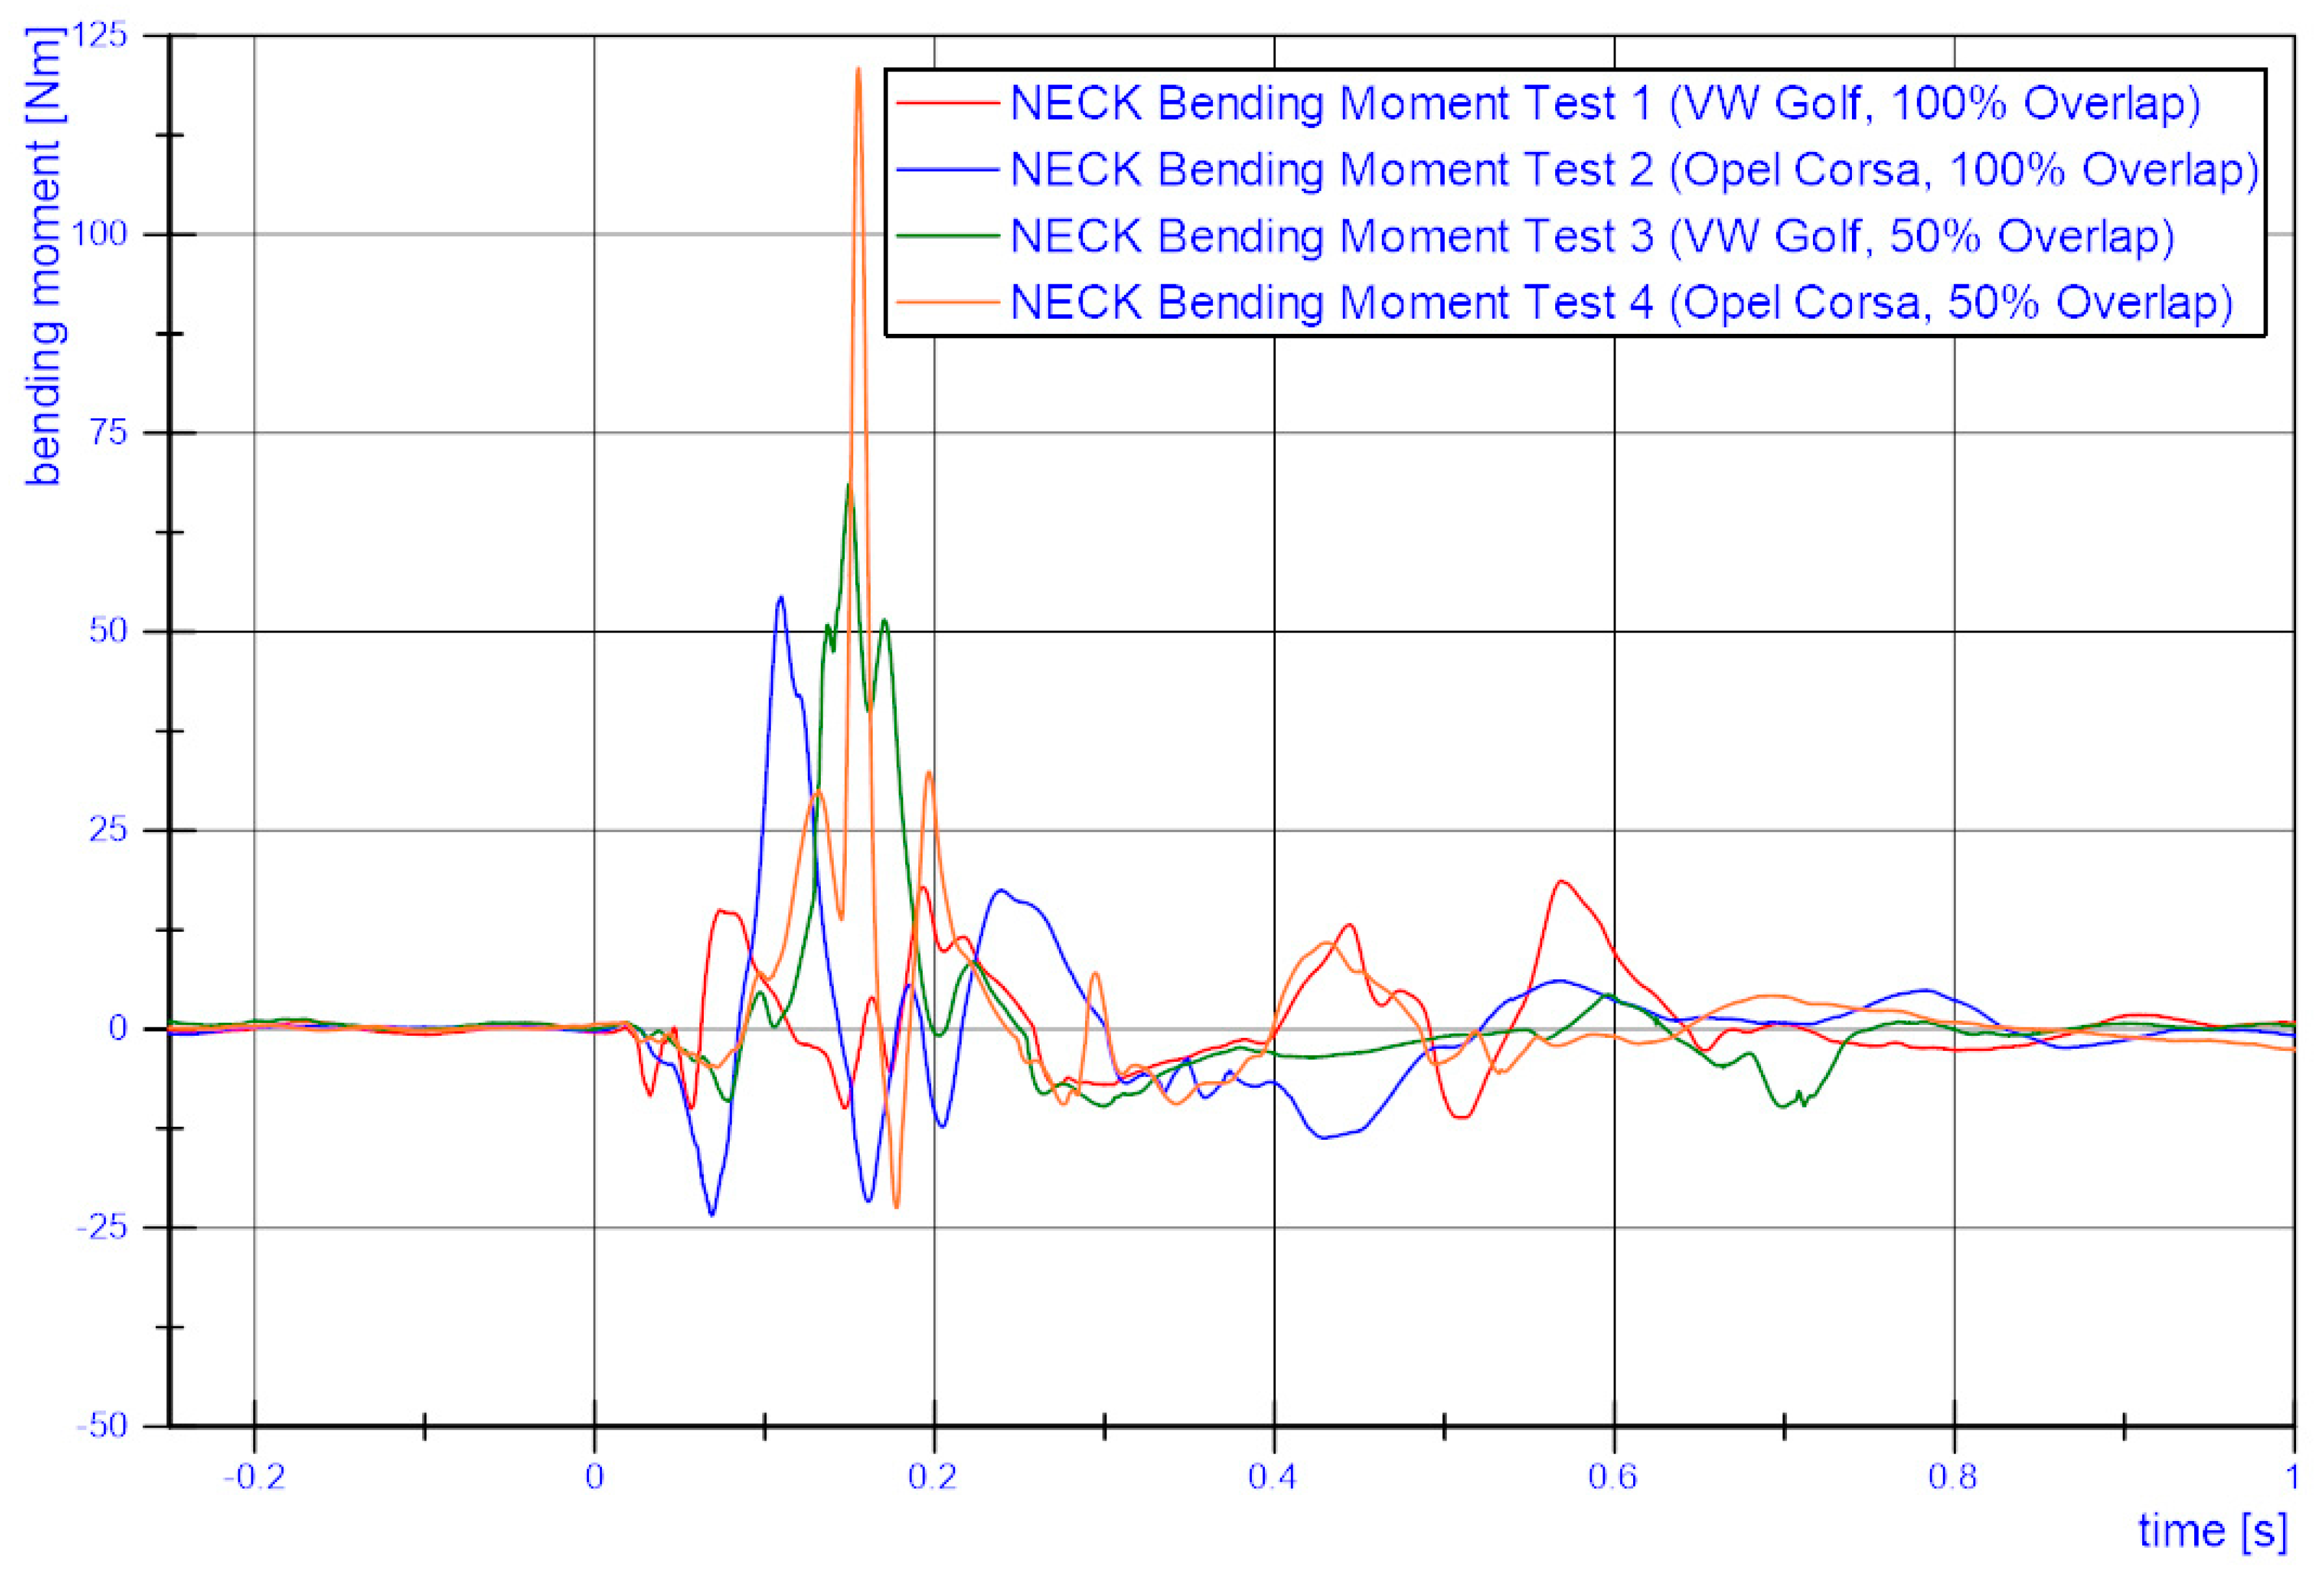
Furthermore, according to Chell et al. [
15], neck injury criteria such as the Nij should also be considered when evaluating vehicle restraint systems. Approximately 25% of injuries involve the cervical spine [
17]. Although whiplash-associated disorders have low injury severity, they are a major economic burden on European society and account for four billion euros annually [
53].
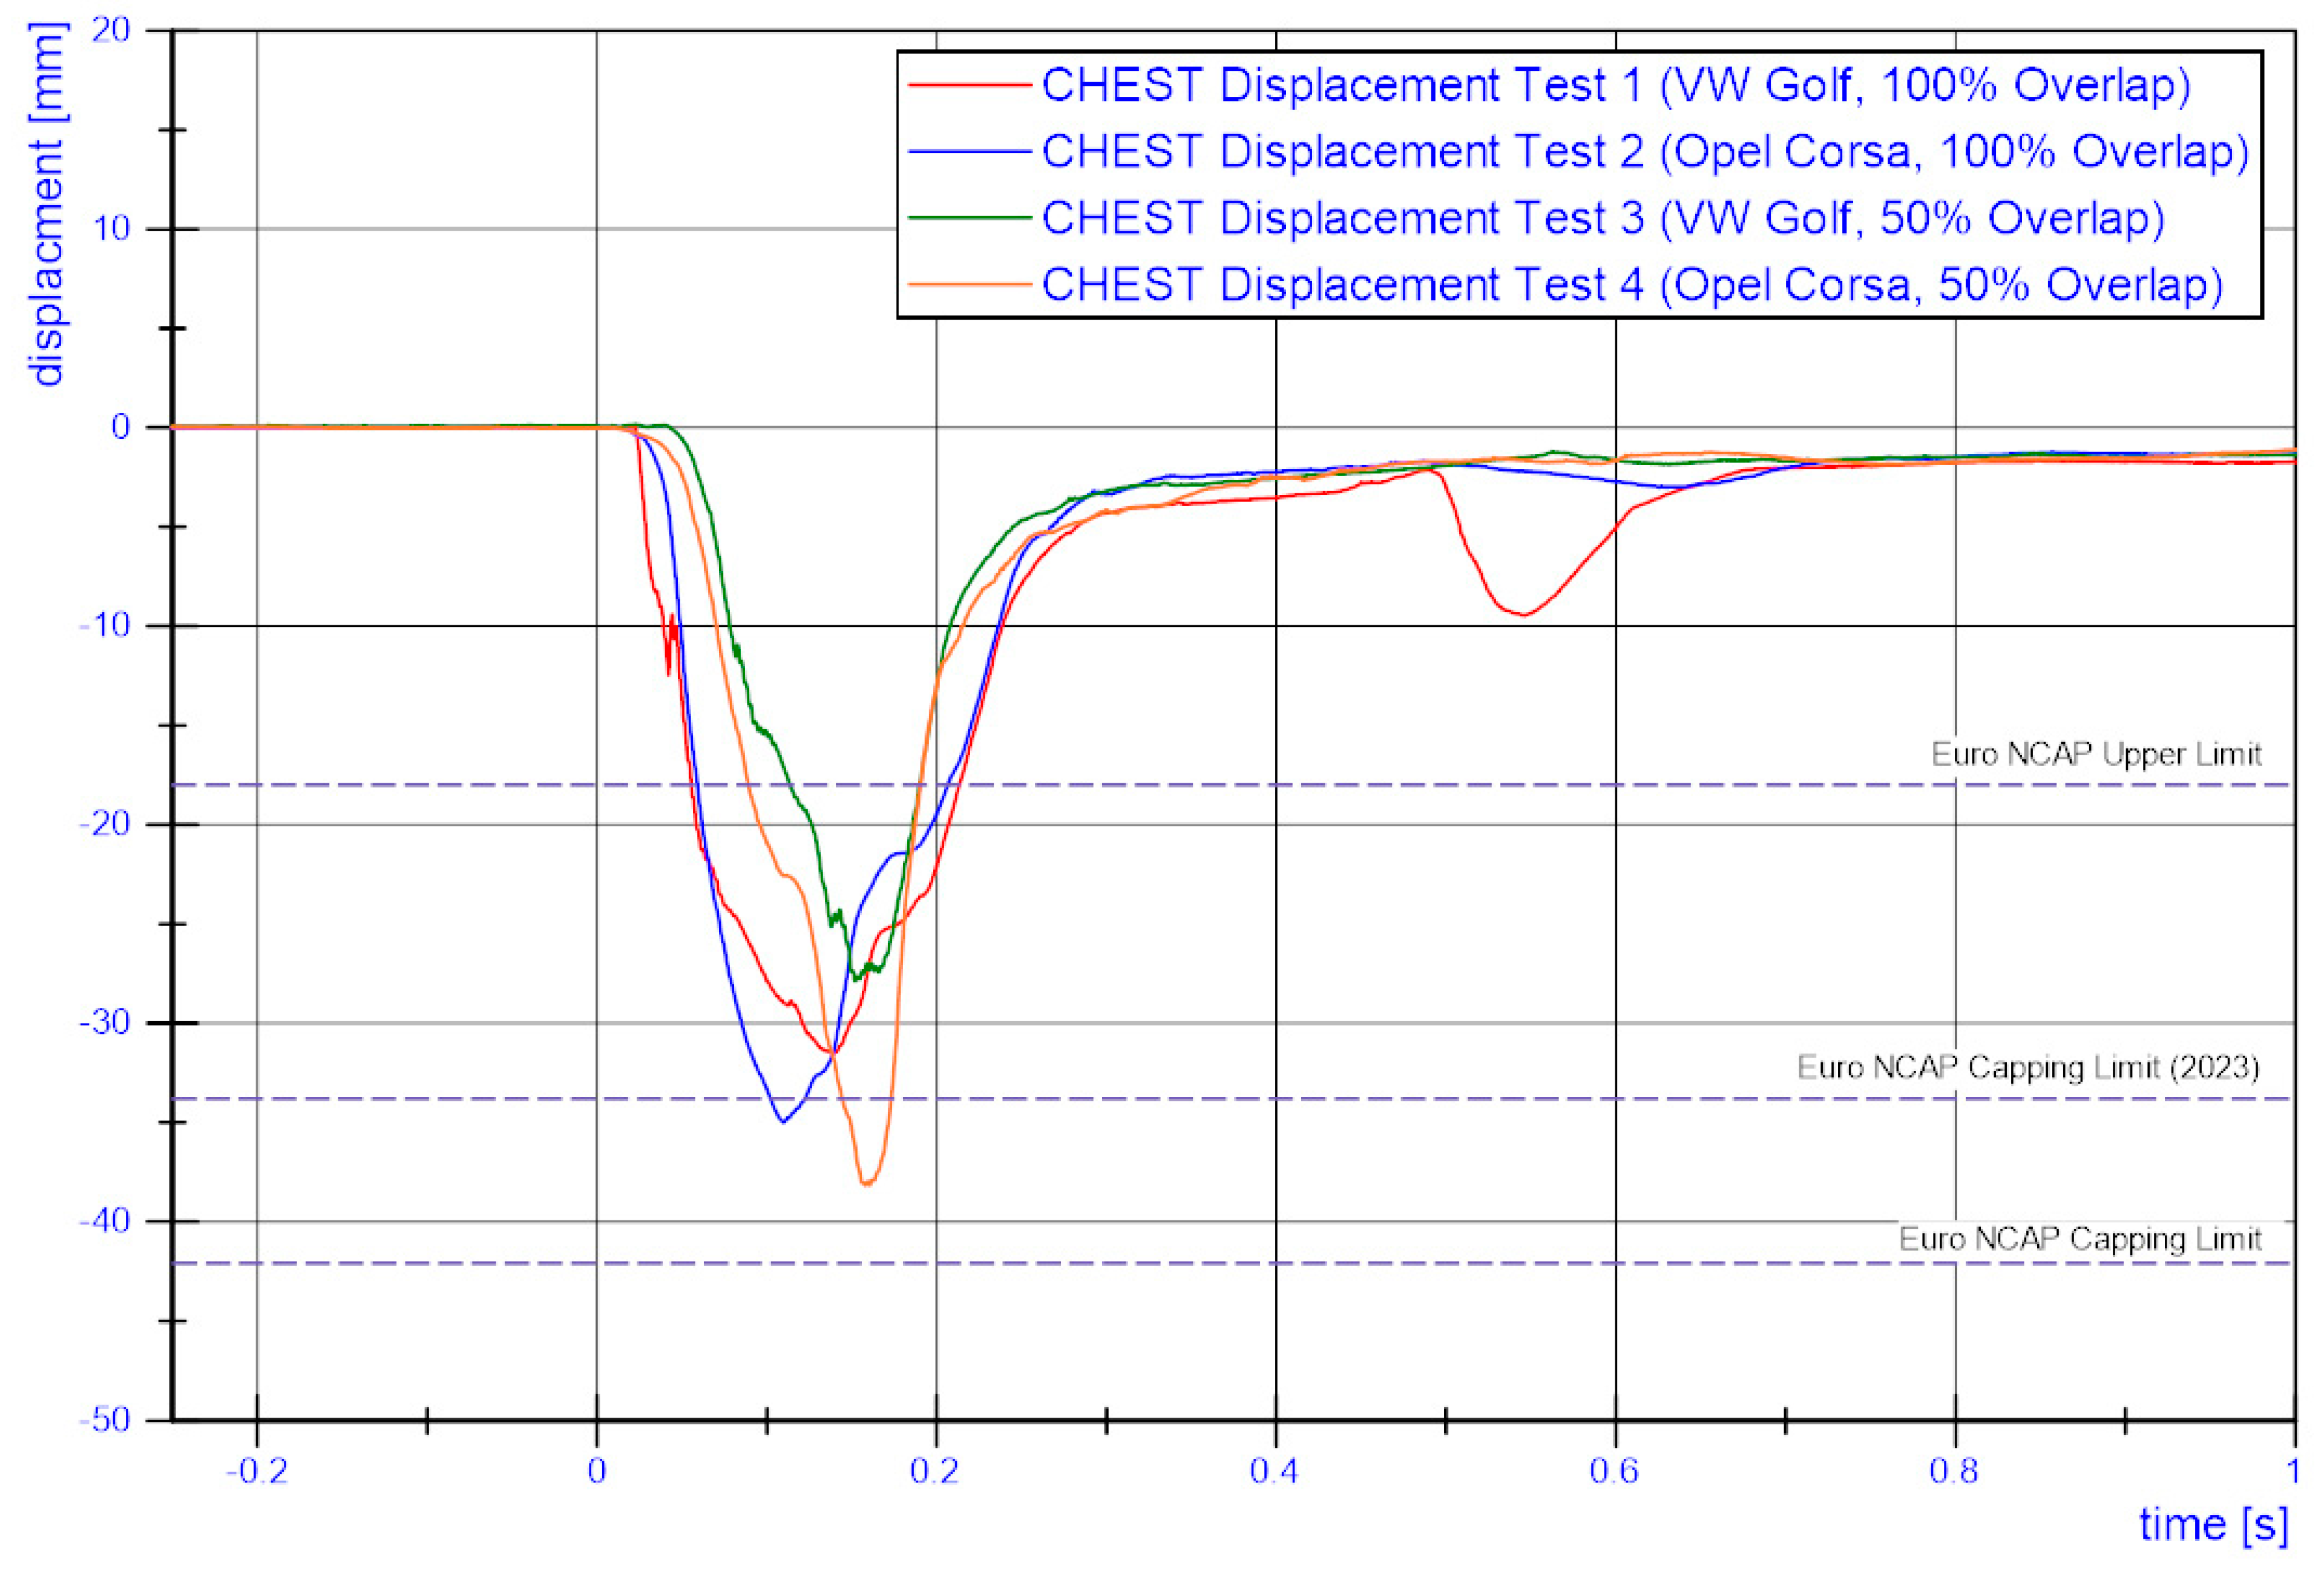
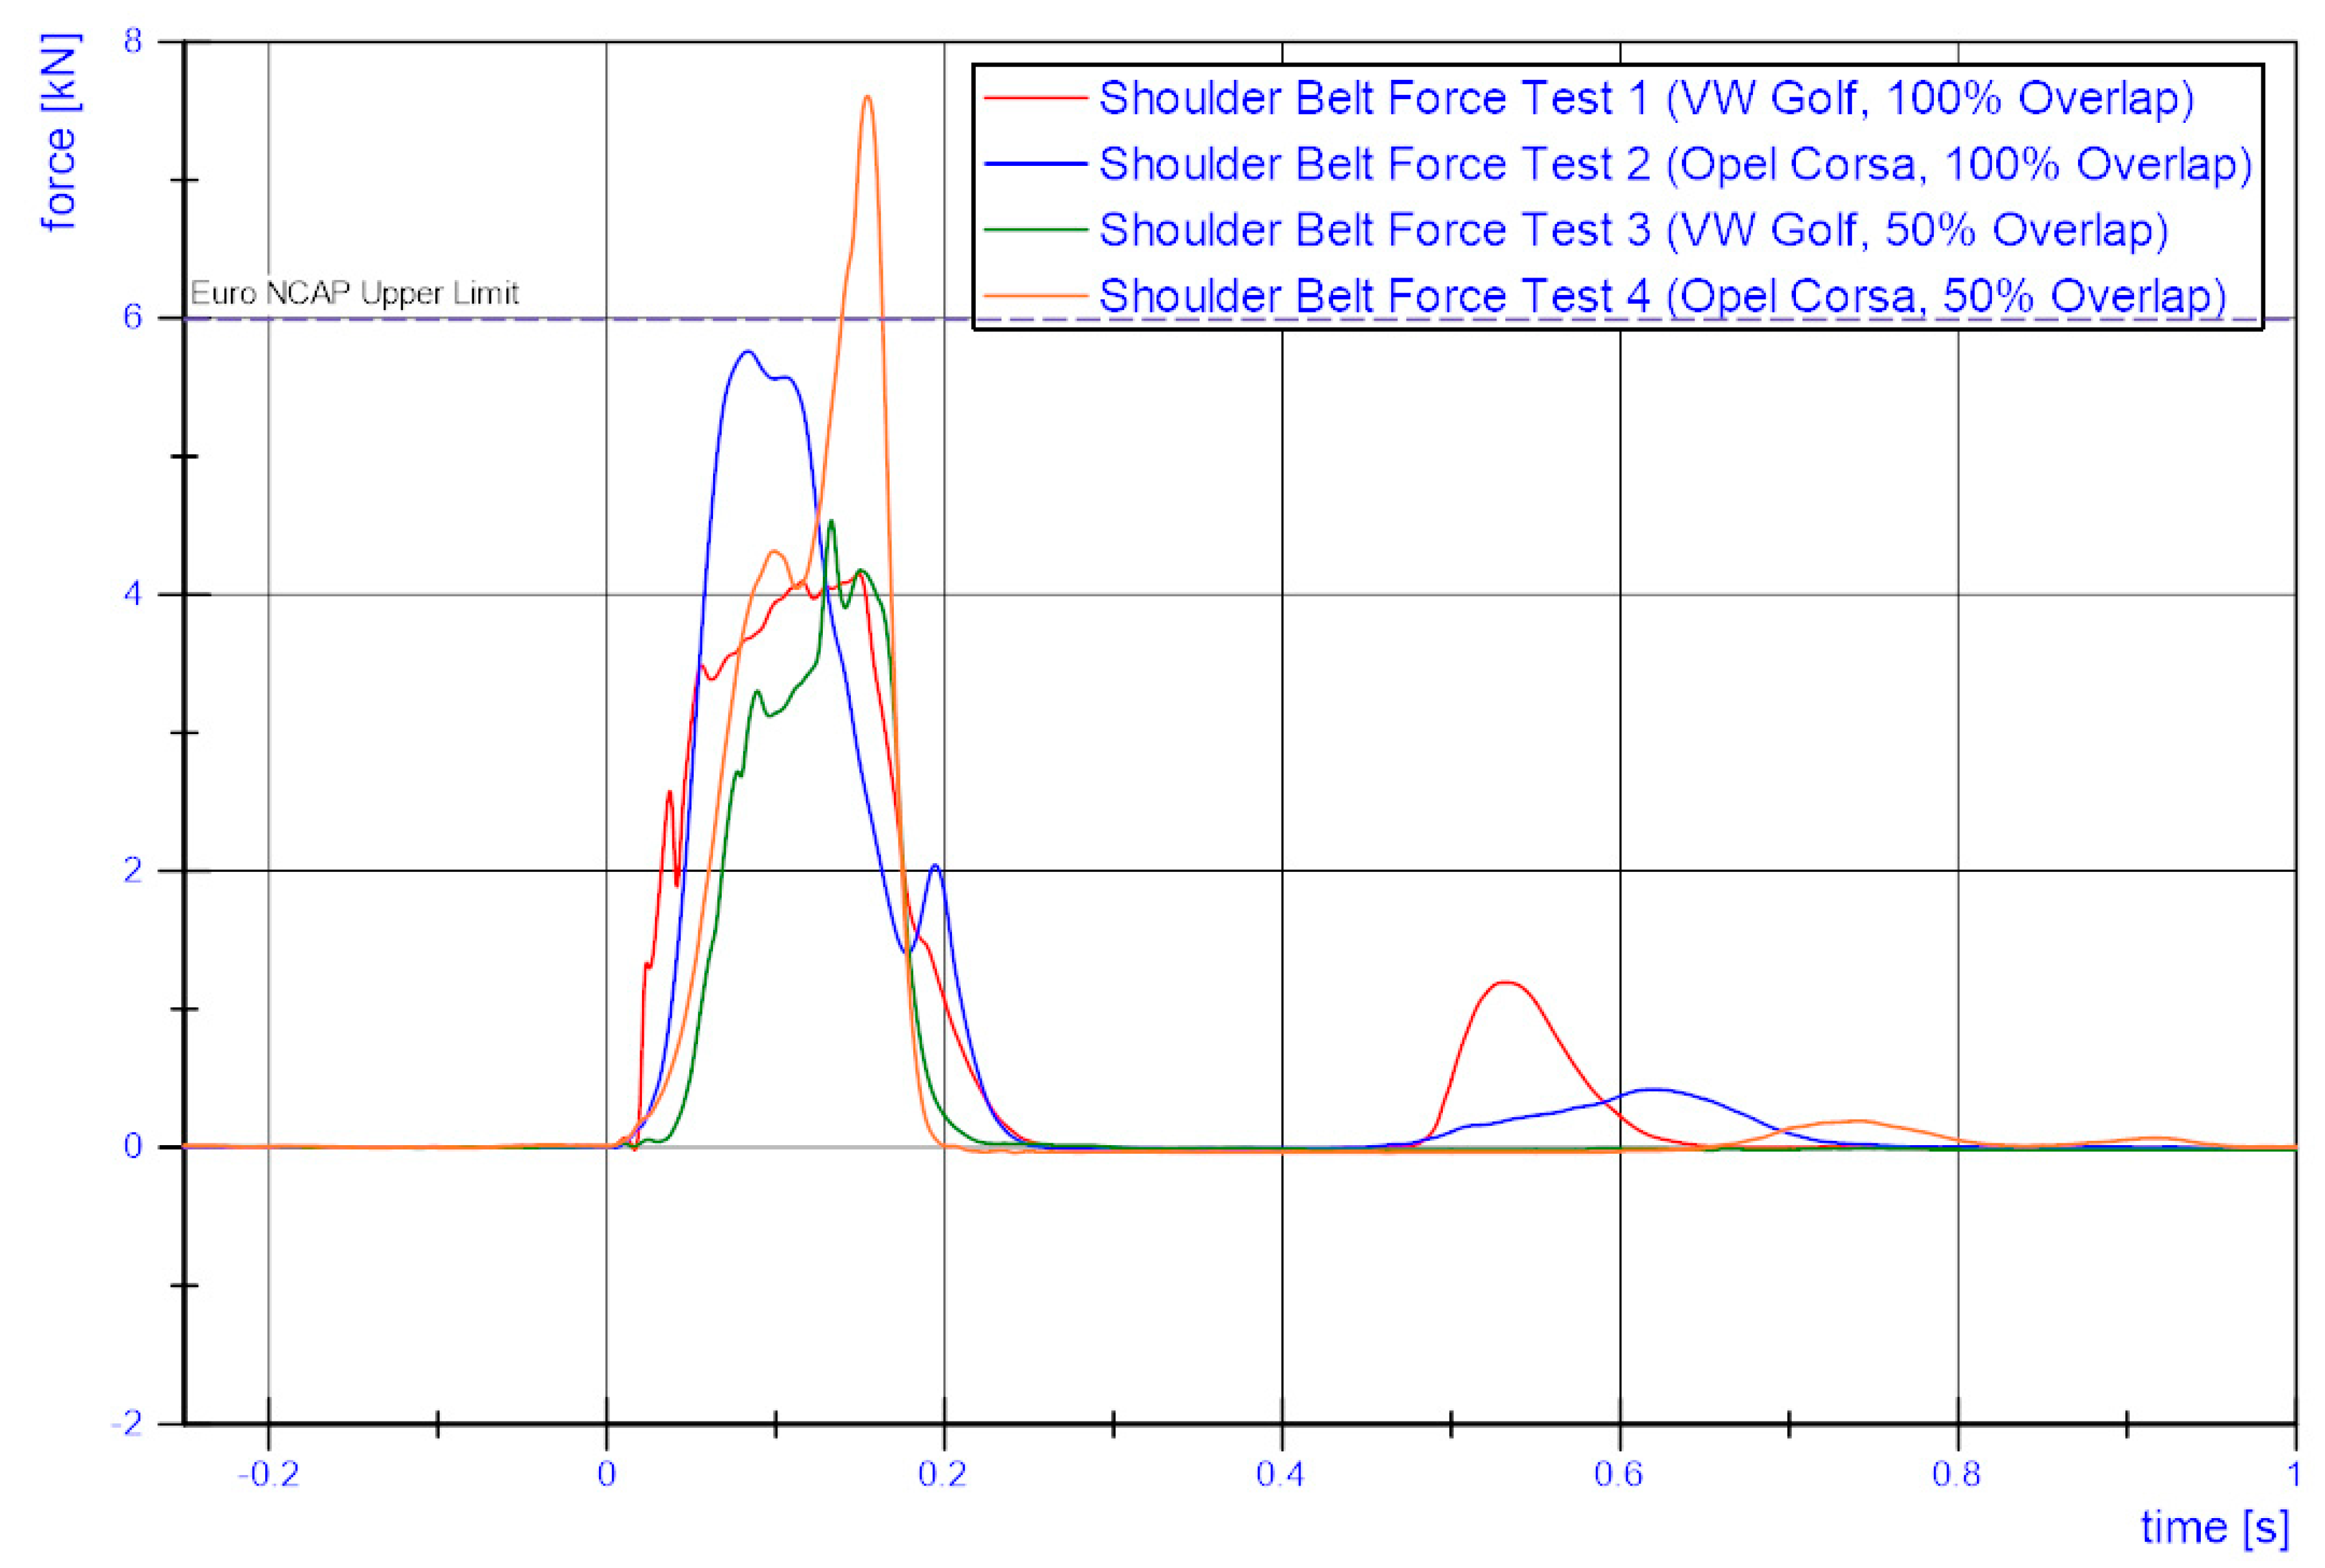
Although the chest is also clearly relevant regarding injuries, vehicles with improved safety equipment (e.g., seat belt force limiters) have significantly lower chest compressions and significantly lower shoulder belt forces. It is to be expected that the same applies to other vehicles with belt-force limiters. The more stringent requirements for frontal collisions in Euro NCAP [
7] from 2023 onwards will lead to an additional reduction in the risk of injury to the chest. Therefore, there might be no need for data recording of chest characteristics.
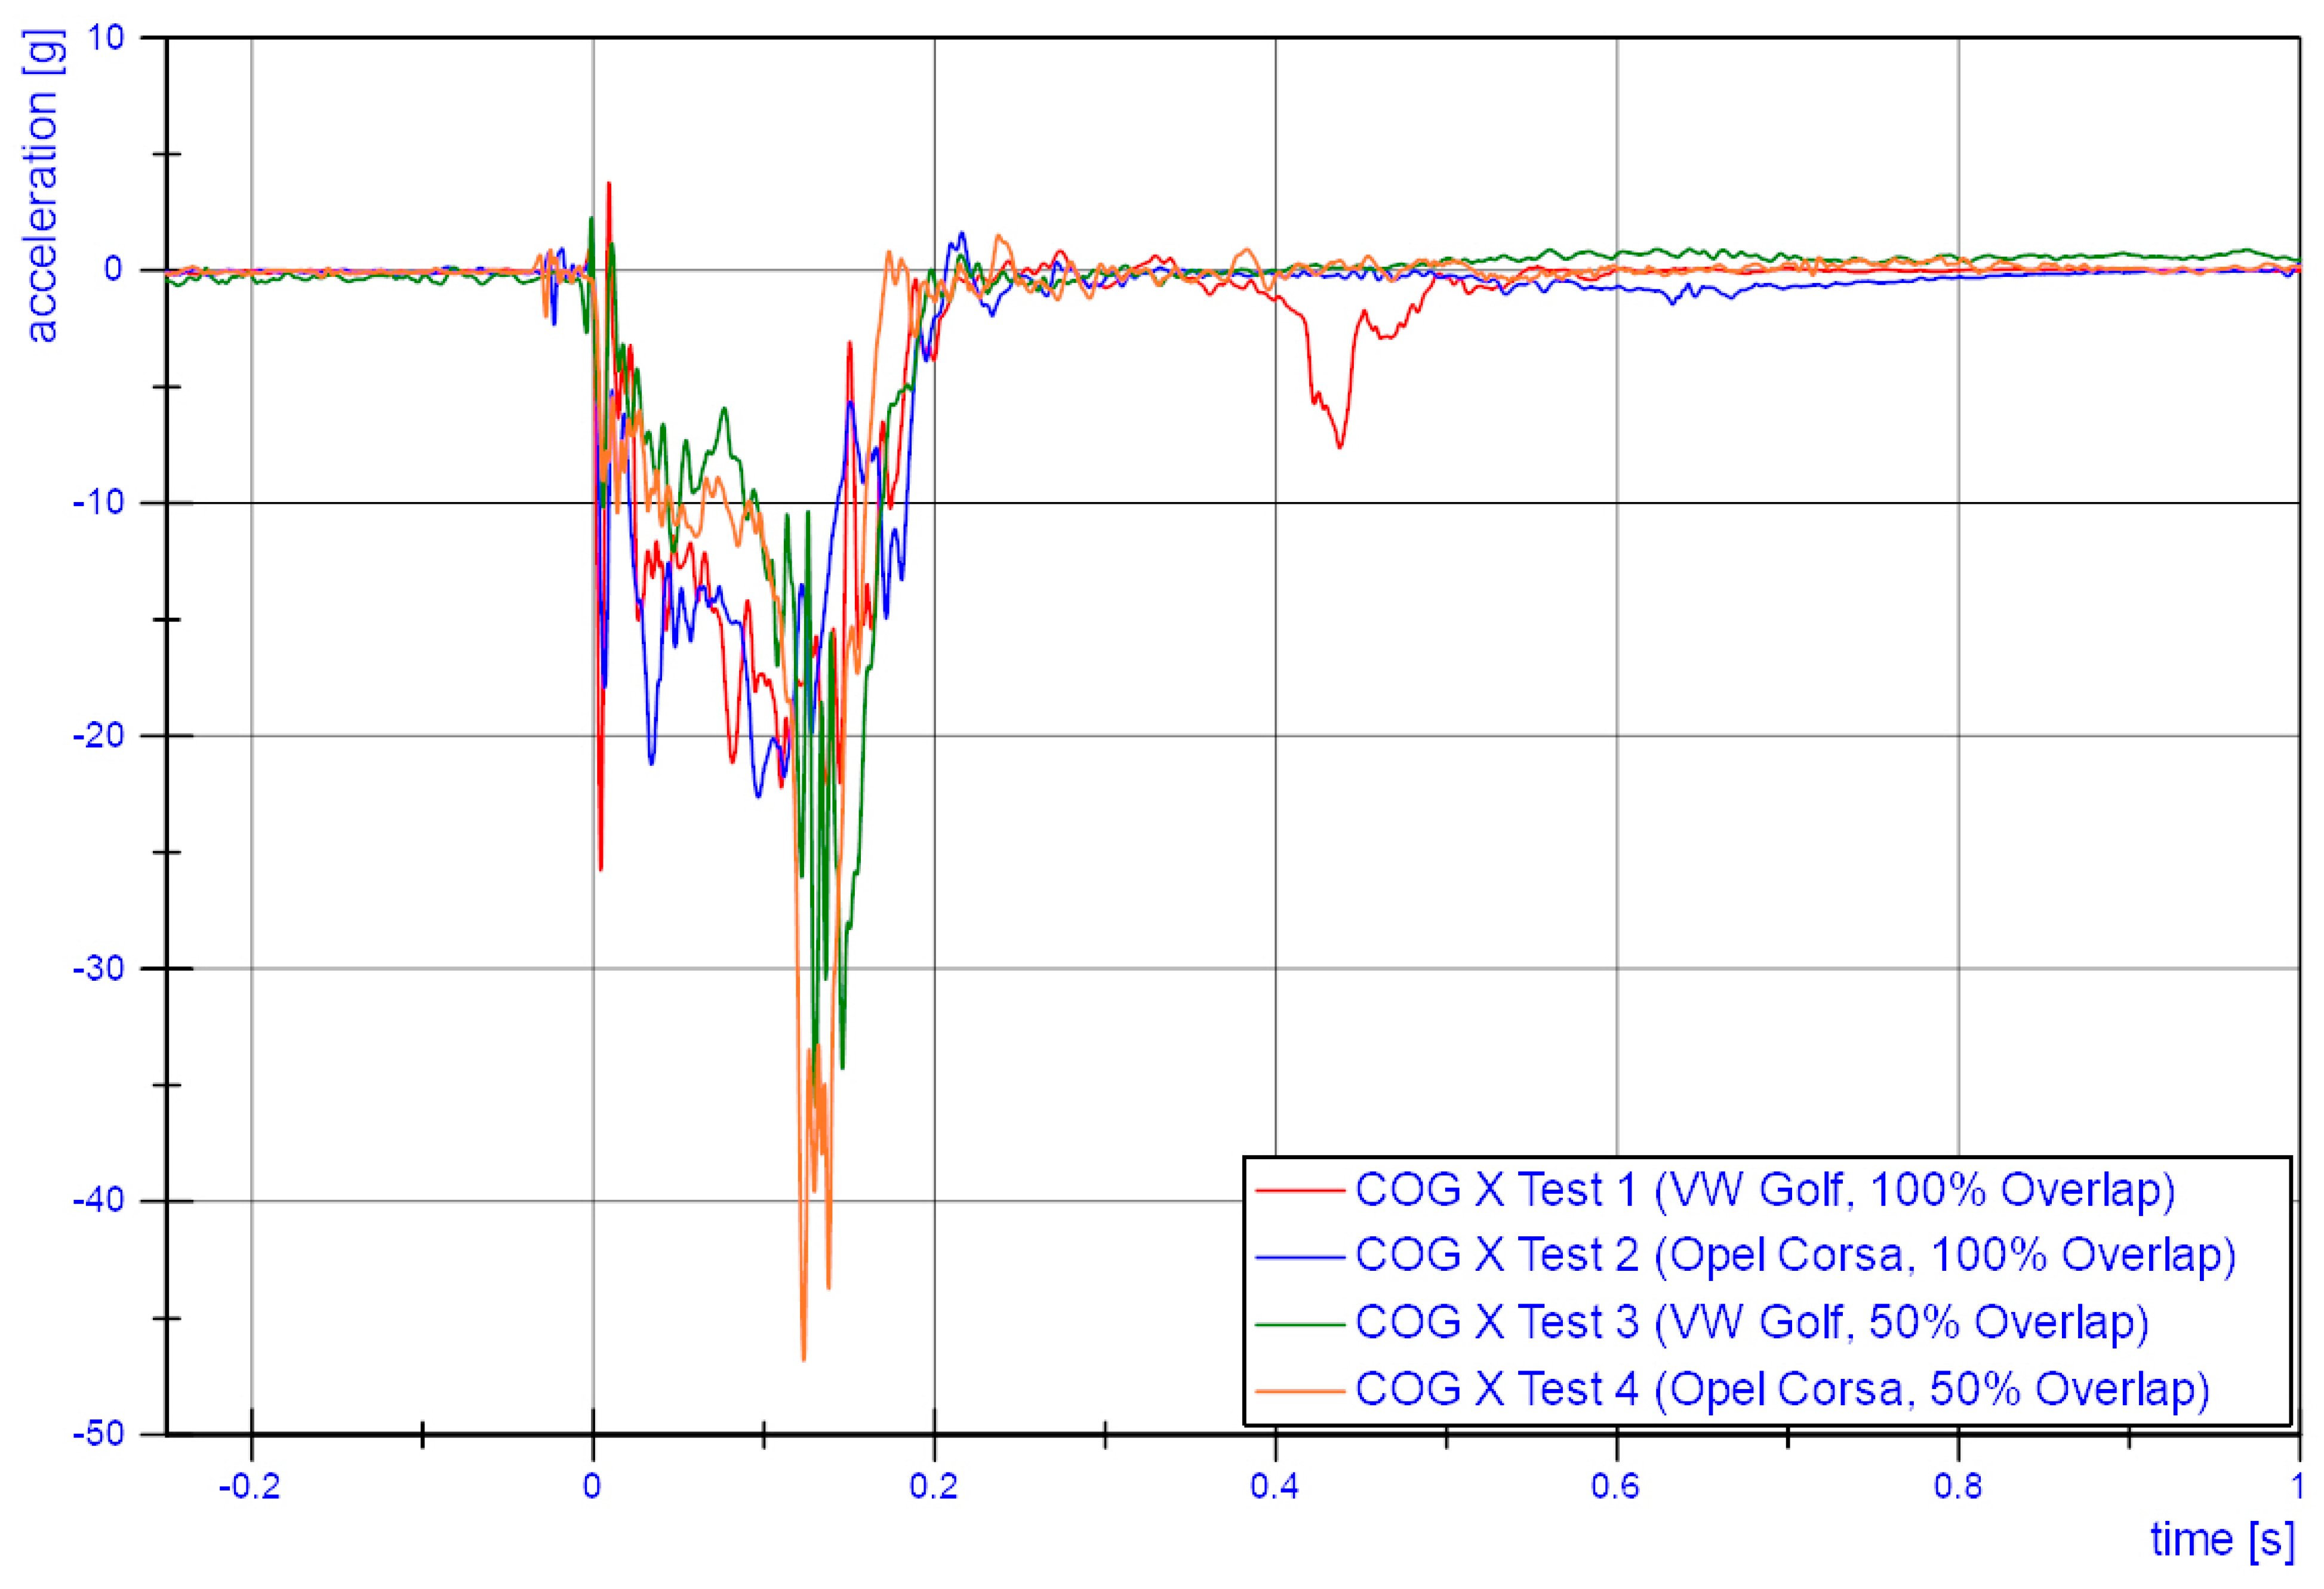
Injury criteria such as HIC, chest criteria, etc. are very strongly dependent on the occupant restraint system and the interaction with the ATD. In the offsetting impact of the vehicle with improved safety equipment, the airbag was deployed directly before the head hit the steering wheel, i.e., the airbag was deployed very late. The acceleration time history of the offset impacts shows a very low acceleration level of approximately 10–12 g in the first 100 ms [
26]. Because of the hard impact against the backup of the crash cushion, the acceleration starts to increase, and the airbag is thus triggered. Late airbag deployment was also noted by Johansson and Otte, in particular under poor impact conditions (e.g., small overlap) [
54], comparable with the offset impact test condition in the present study. An increasing tendency for HIC and maximum head acceleration with increasing airbag trigger time was observed by Asadinia [
55]. Even though a late airbag trigger time is not necessarily related to increased injury severity, a link is likely [
54].
In addition to the improved safety equipment, a higher vehicle mass is considered beneficial for occupants, although this cannot be concluded beyond doubt from the tests since the vehicle with the higher mass is also the vehicle with the improved safety equipment. In a study by Burbridge et al. [
56], however, a correlation was established between vehicle mass and the criteria ASI, OIV, and ORA. For all three values, lower values were found with increasing vehicle mass, i.e., according to the results in Burbridge et al. [
56], vehicles with higher mass would perform significantly better.
In Germany, a trend towards higher vehicle weights in newly registered passenger cars has been observed [
57], which should therefore also have a positive effect on occupant injuries in the event of a collision with a vehicle restraint system. The average vehicle weight of newly registered passenger cars increased from 1426 kg to 1515 kg between 2005 and 2018. Hernandez et al. [
58] studied the vehicle weight of newly registered vehicles in Spain. The total vehicle fleet between 2007 and 2016 showed a massive decrease in the proportion of vehicles weighing less than 1000 kg, dropping by 32% during the period. Newly registered vehicles with less than 1000 kg only have a share of 10%. The minimum weight of different manufacturers in Europe has been consistently above 1000 kg since 2001 and was just under 1200 kg in 2017 [
59]. In real accidents, the vehicle weight of passenger cars below 1000 kg accounts for only 7.3% [
17]. The vehicle used in EN 1317, with a total mass of 900 kg, is thus clearly below the vehicle weights according to the aforementioned studies. It would therefore make sense to adapt the mass of the passenger cars in the EN 1317 tests to the current situation; at least the vehicle mass of the smallest vehicle should be evaluated in any case.
