Review

Refractory Concrete Properties—A Review

by
Lelian W. ElKhatib
1,*,
Jamal Khatib
1,2,
Joseph J. Assaad
3,
Adel Elkordi
1,4 and
Hassan Ghanem
1
1
Faculty of Engineering, Beirut Arab University, Beirut 11-5020, Lebanon
2
Faculty of Science and Engineering, University of Wolverhampton, Wolverhampton WV1 1LY, UK
3
Department of Civil and Environmental Engineering, University of Balamand, Al Koura P.O. Box 100, Lebanon
4
Department of Civil and Environmental Engineering, Faculty of Engineering, Alexandria University, Alexandria 21511, Egypt
*
Author to whom correspondence should be addressed.
Infrastructures 2024, 9(8), 137; https://doi.org/10.3390/infrastructures9080137
Submission received: 20 June 2024 / Revised: 21 July 2024 / Accepted: 5 August 2024 / Published: 19 August 2024

Abstract

:
Due to the large increase in human population, the need for more buildings and other amenities is widening. Concrete is considered one of the most abundant and popular materials used in the structure and construction fields. It is known as a composite mix composed of cement and aggregates including fine and coarse and water. Despite its good properties, its capability to be formed in different shapes and its ability to resist severe conditions, concrete will struggle with the presence of extremely high temperatures. So, different types of concrete must be found to resist those challenging conditions. Refractory concrete can be considered a good choice to be used in places exposed to elevated temperatures and severe conditions. Mainly, refractory concrete is made up of ordinary Portland cement replacement well known as refractory cement, specific types of fine and coarse aggregates and are known as refractory or temperature-bearing aggregates and water. To the best authors’ knowledge, review papers about refractory concrete are rare. For this reason, more than 65 papers were consulted including many recently published. This review describes the different types of materials used in refractory concrete. Furthermore, the different fresh, hardened, structural, durability and thermal properties of refractory concrete are also included such as slump, density, compressive strength, flexural strength, tensile strength, modulus of elasticity, ultrasonic pulse velocity, shrinkage, mass loss, porosity, water absorption, damage level and thermal conductivity.

1. Introduction

Concrete is considered to be one of the most used materials in construction and it is the second most used one after water [1,2]. The main components of concrete are a combination of cement, aggregates including an appropriate particle grading for fine and coarse and a quantity of water with or without the inclusion of admixtures [3]. However, concrete, when exposed to very high temperatures, experiences a huge loss in its properties mainly strength [4]. So, it becomes a fundamental need to find a new type of concrete or mortar that can resist and withstand high or elevated temperatures [5].
Refractory concretes, are known also as monolithic castables and unshaped monolithic refractory materials, are mainly made up of specific types of cement that are known as refractory cements, high-temperature-bearing aggregates that can be used as fine or coarse aggregate replacement and also are known as refractory aggregates with a specific amount of water [6,7]. Refractory concrete that can be considered also as a composite material is used widely in the refractories, metallurgical, cement industries, furnaces and other industries where it can serve as a good solution and can be easily installed in places that require an extensive range of temperatures [8,9]. Also, refractory concretes have the ability to be formed in any geometrical complicated shape in a way similar to ordinary concrete [7]. Refractory concrete has many advantages including the ability to be used in critical places where a high temperature is found, excellent mechanical properties including strength and hardness, good corrosion resistance, thermal shock resistance, and adequate physical properties including density and porosity [6]. So, refractory concrete can serve as a good solution to be used in extreme conditions and mainly where high temperatures are found since it is capable of bearing elevated temperatures [6,10]. Several chemical reactions and interactions take place while the temperature increases in refractory concretes [11]. These interactions are considered to be so sensible to the duration of temperature and atmosphere. So, there are some consequences including the material behavior where the materials behave in a different way when concrete is cooled or pre-fired [11].
Refractory materials mainly contain quantities of alumina, silica, phosphorous, magnesium and titanium oxide [12]. Calcium aluminate cements are considered to be the main materials used as refractory binders [13]. However, they are considered to be four to five times more expensive than ordinary Portland cement [14]. These materials have high refractoriness, excellent hydration capacity and good behavior and performance in corrosive environments, rapid hardening, good resistance to high temperatures, resistance to chemical attacks and resistance to abrasion and impact [13,14].
The installation of refractory concrete must be performed in an accurate way. Attention must be taken while preparing the mix design before placing the concrete. Regarding the curing process, concrete containing calcium aluminate cement must be cured properly in order not to avoid a dusty and friable concrete surface. Concerning the reinforcements used, they must be as far as possible from hot surfaces [15].
To the best of the author’s knowledge, there is rarely any review paper on the topic of refractory concrete and this paper comes to address the gap in this area. The process for conducting the literature review is based on several steps as shown in Figure 1. The main steps are defining the scope of the research, searching different types of databases, assessing the quality and information included in the papers, extracting the data and results related to the review, and analyzing and narrating the results until reaching conclusions. Mainly, Science Direct, Google Scholar and Web of Science are the databases used while searching for papers for the literature review.
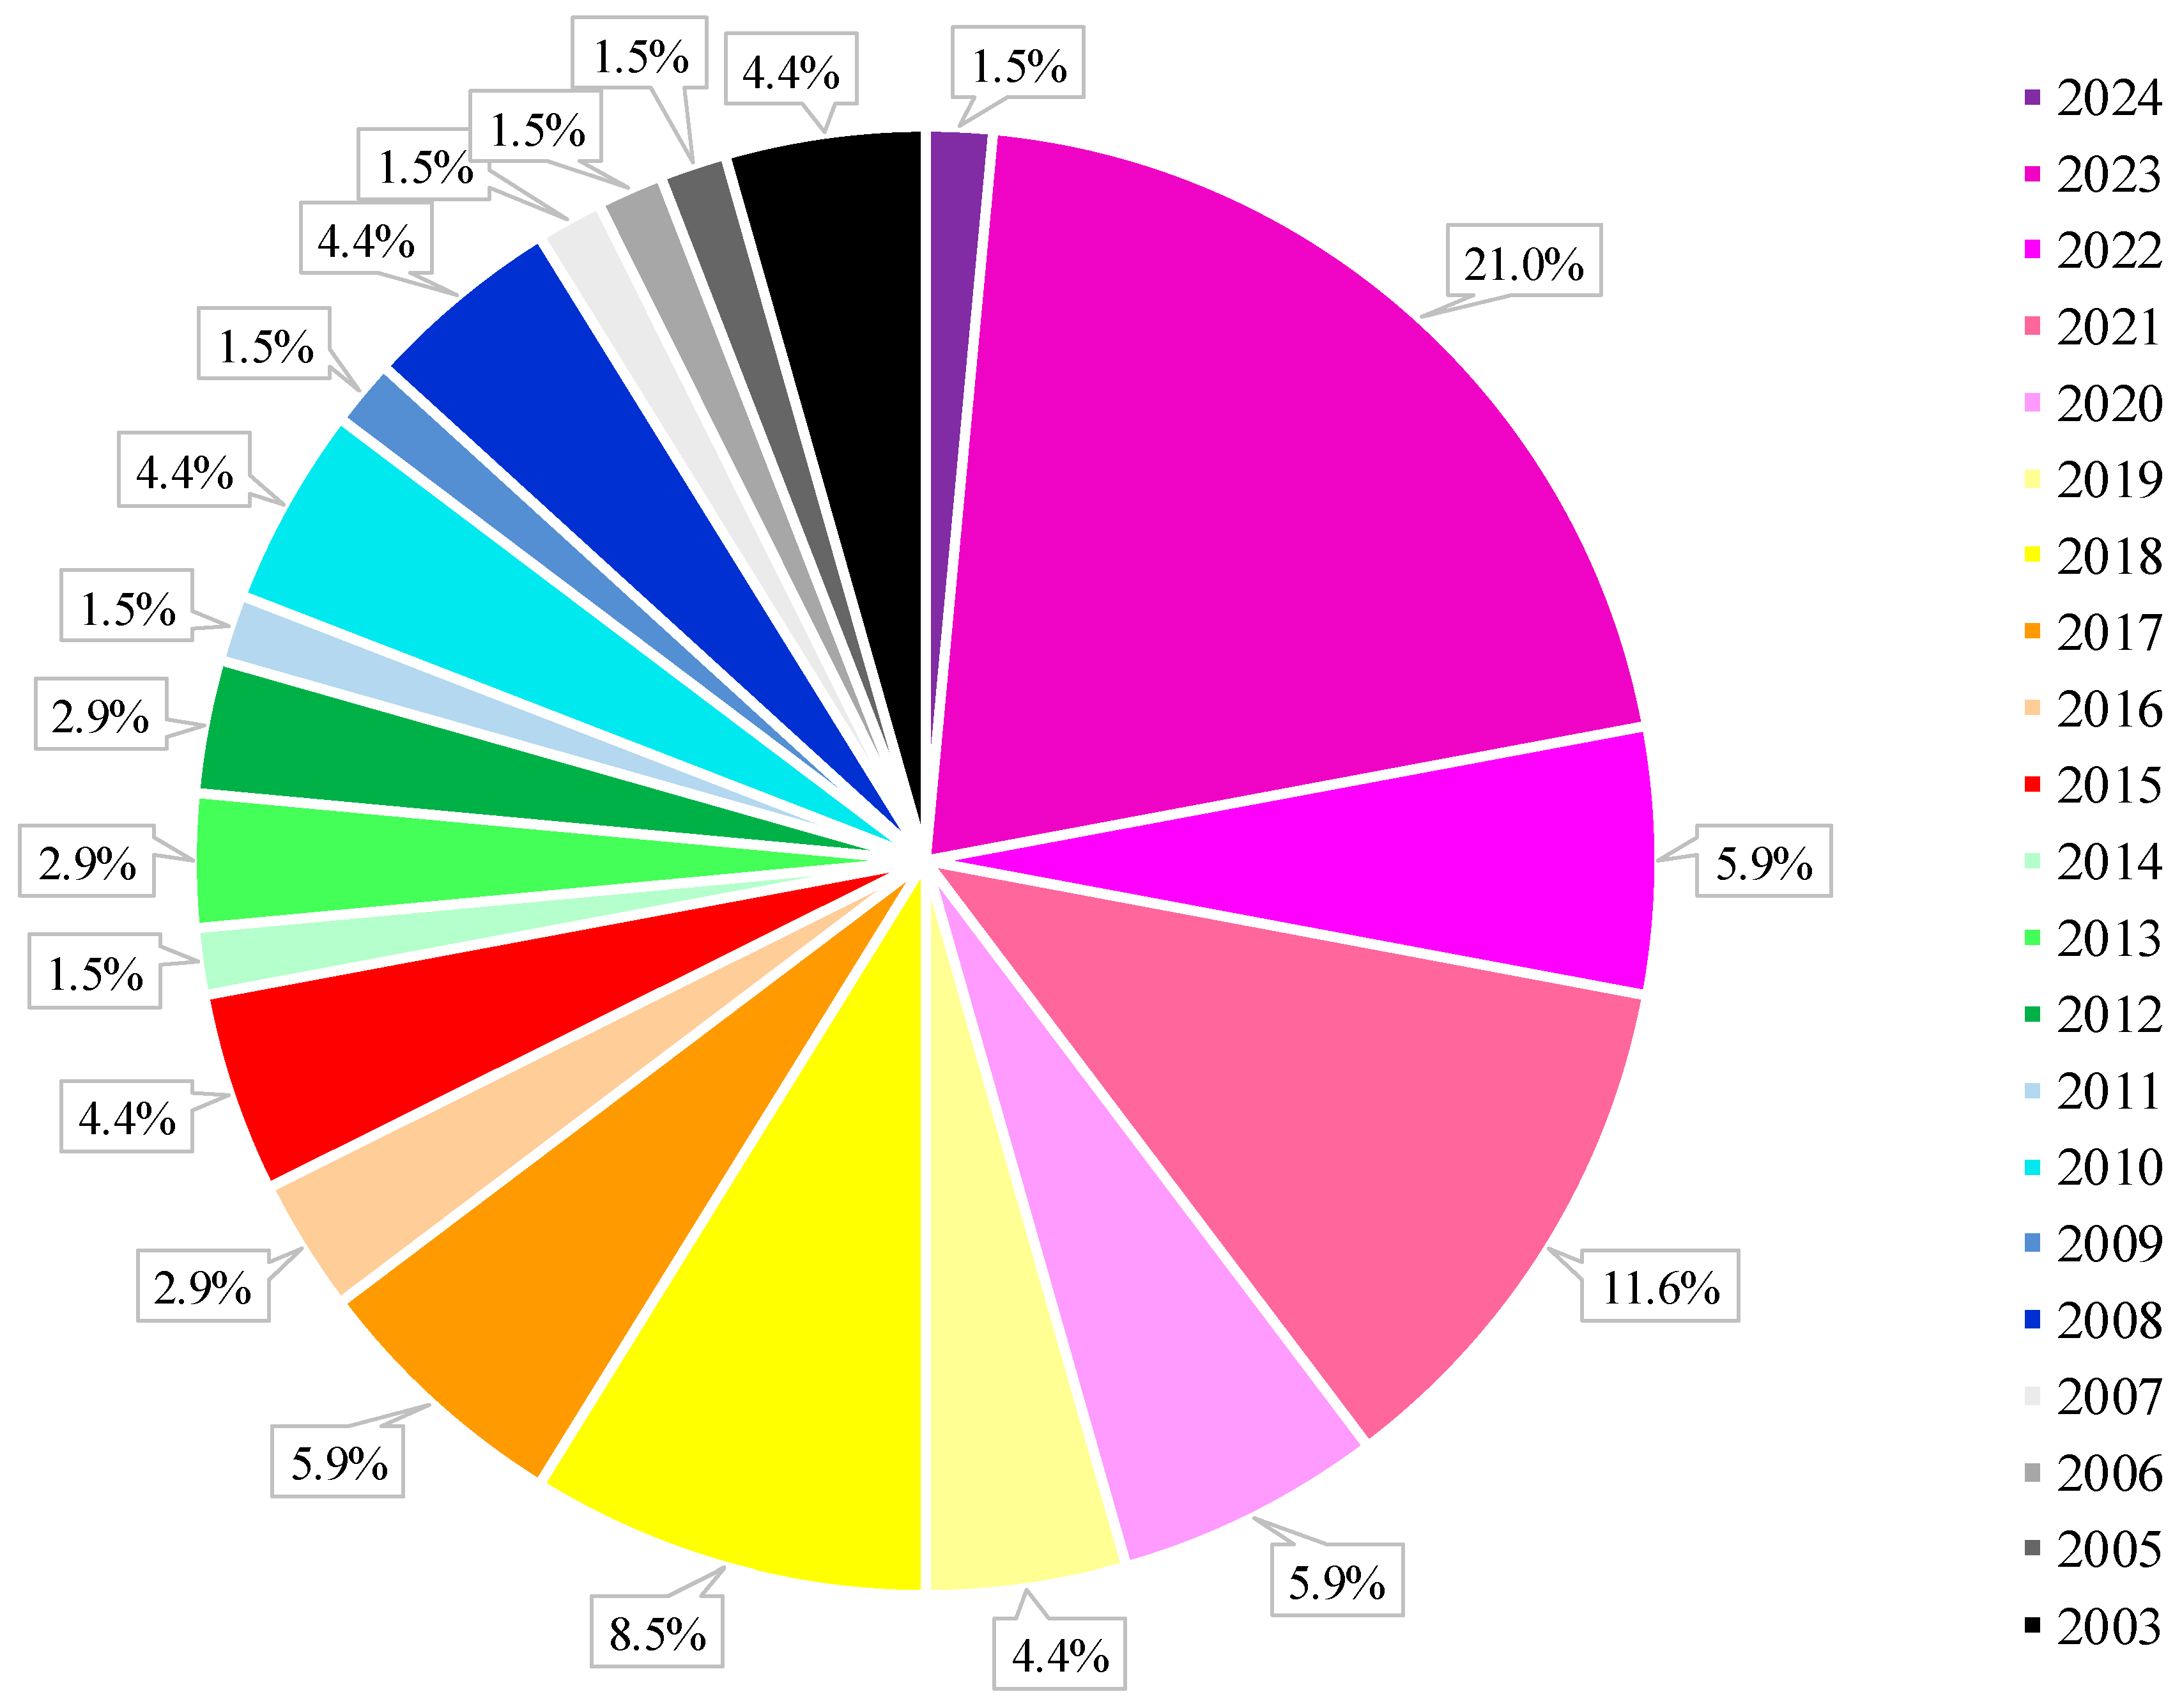
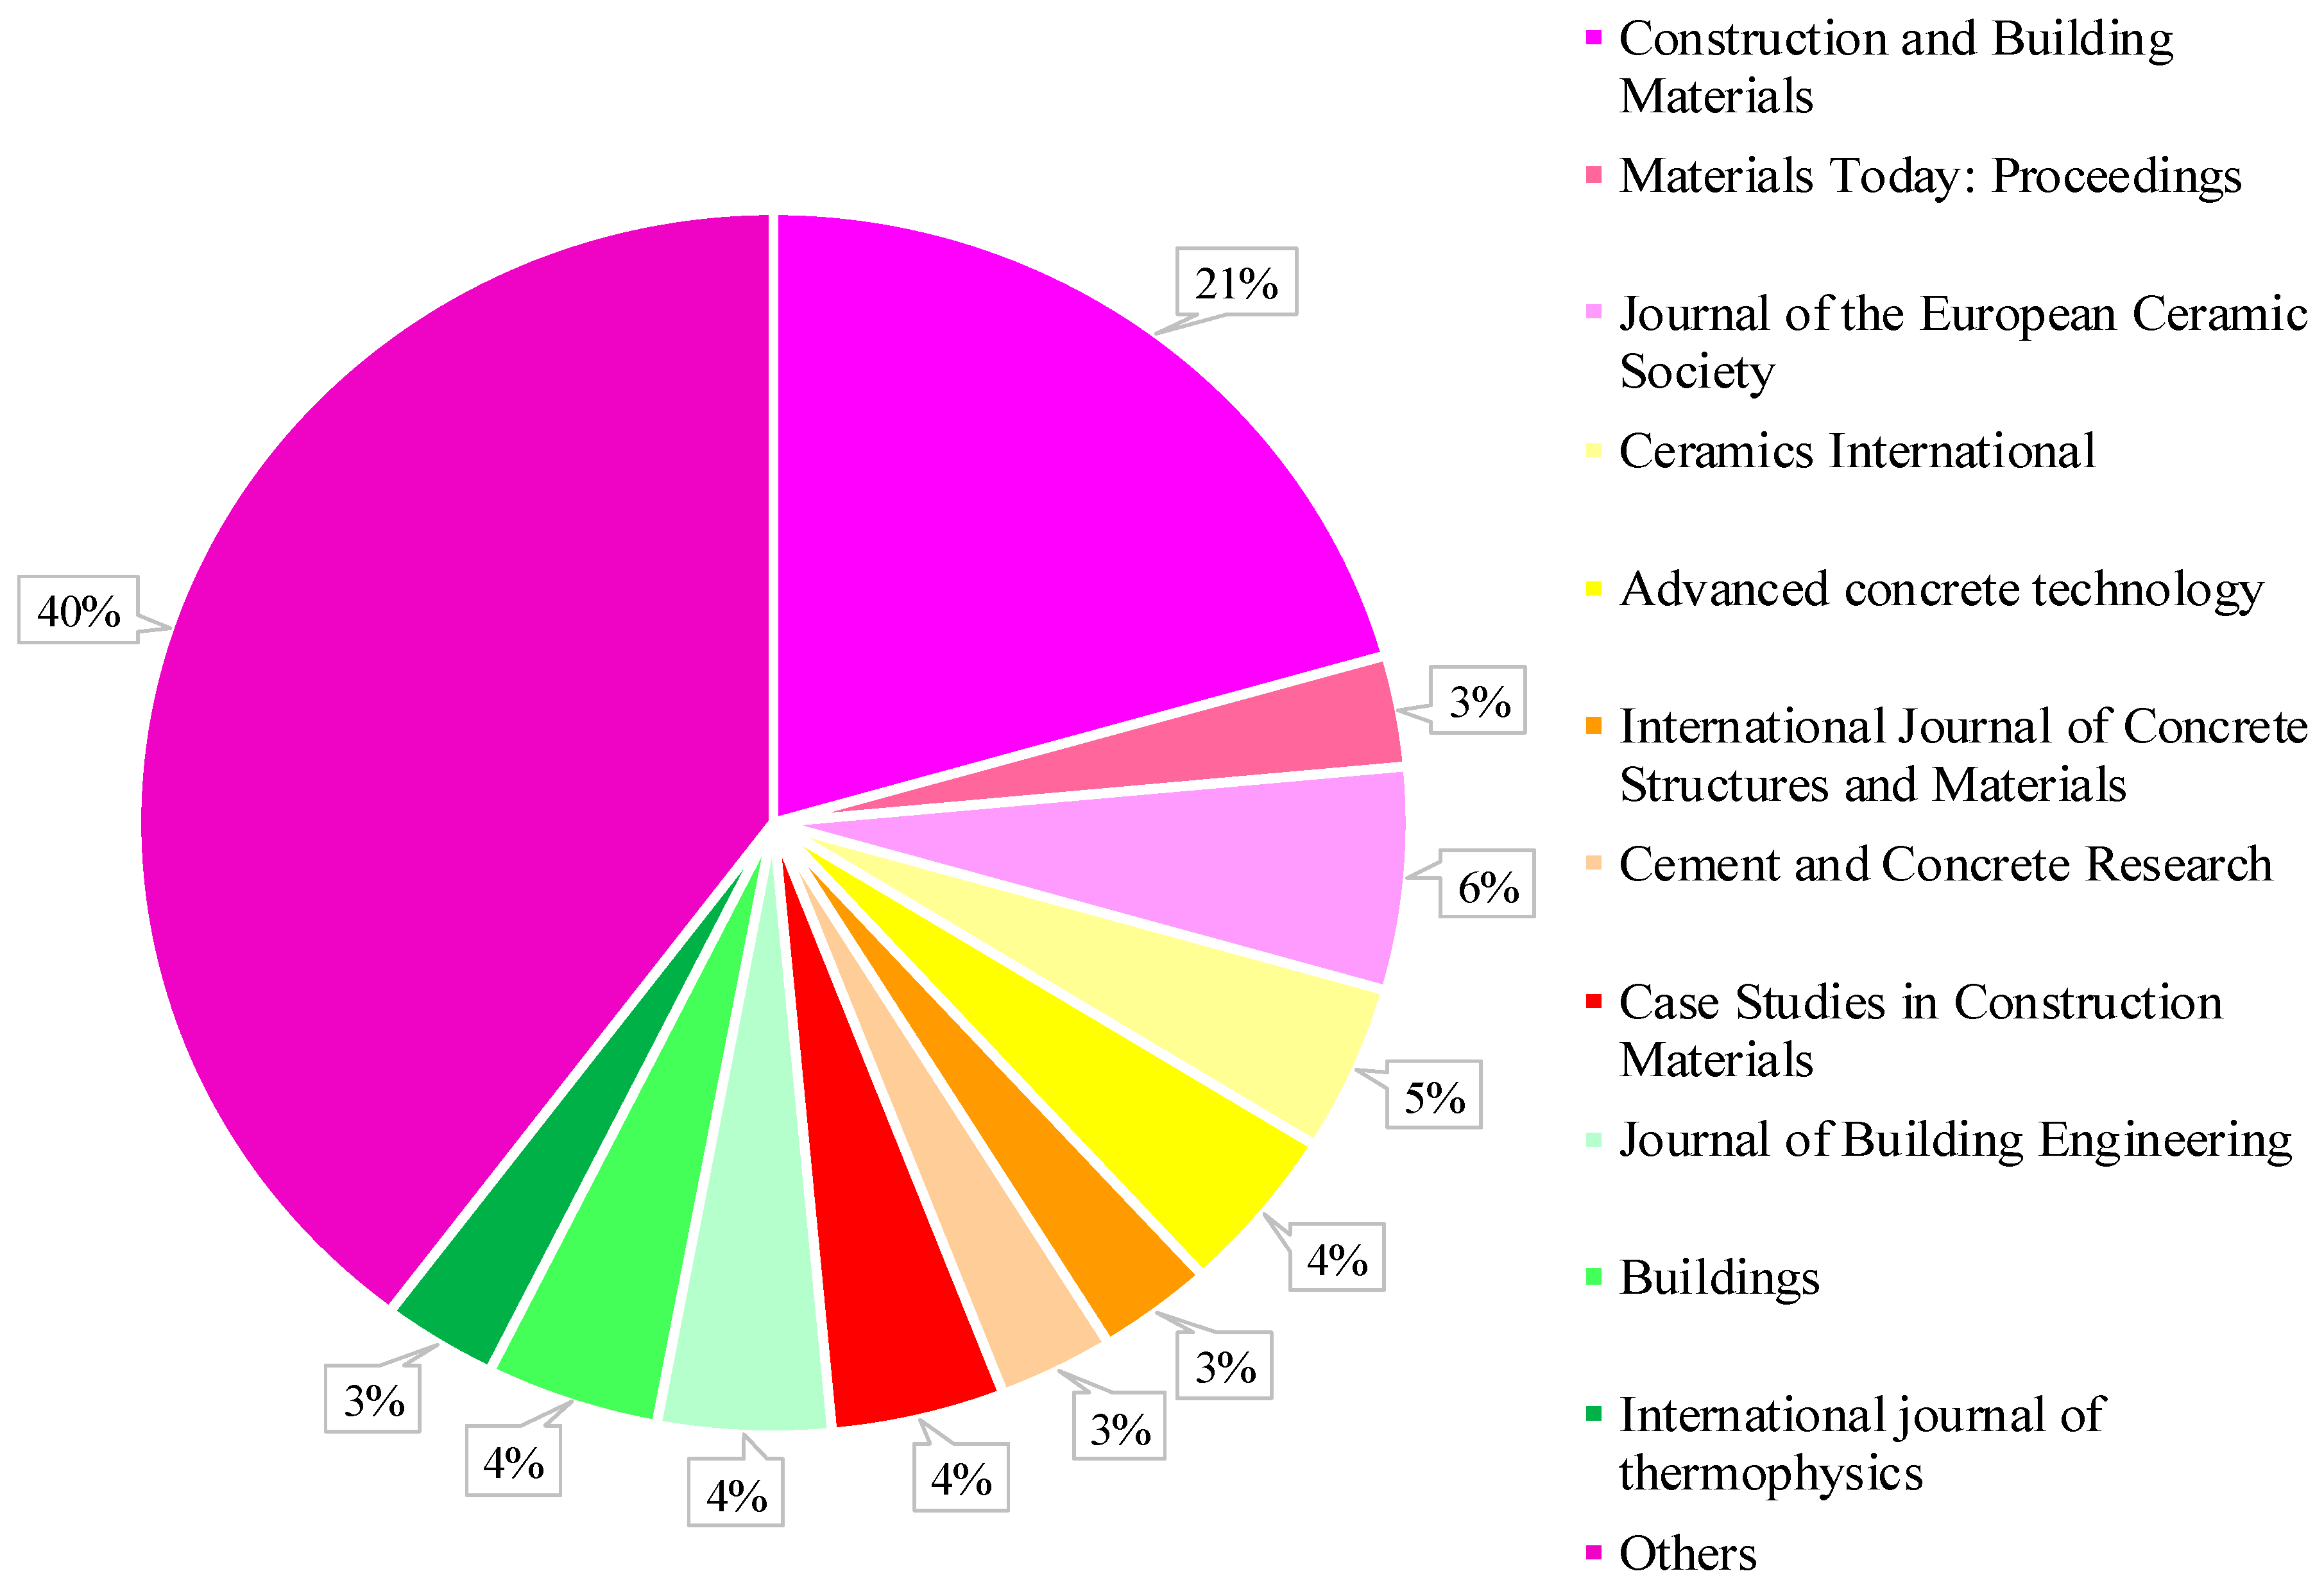
This paper reviews articles on the basic properties of refractory concrete divided into several categories as shown in Figure 2. The chemical and physical properties of different types of refractory cement and aggregates are examined. Also, this paper reports the different fresh, hardened, structural, durability and thermal properties of refractory concrete. One of the most important points of data in the articles is the date of publication. Figure 3 represents the percentages of the years of publication for the chosen papers used in the literature review. A significant percentage is recorded in 2023 (21%) revealing a high percentage of recently published papers. Also, Figure 4 indicates the different percentages for the journals used in the literature review.

2. Materials Used in Refractory Concrete

2.1. Materials, Phase Diagrams and Hydration Reactions

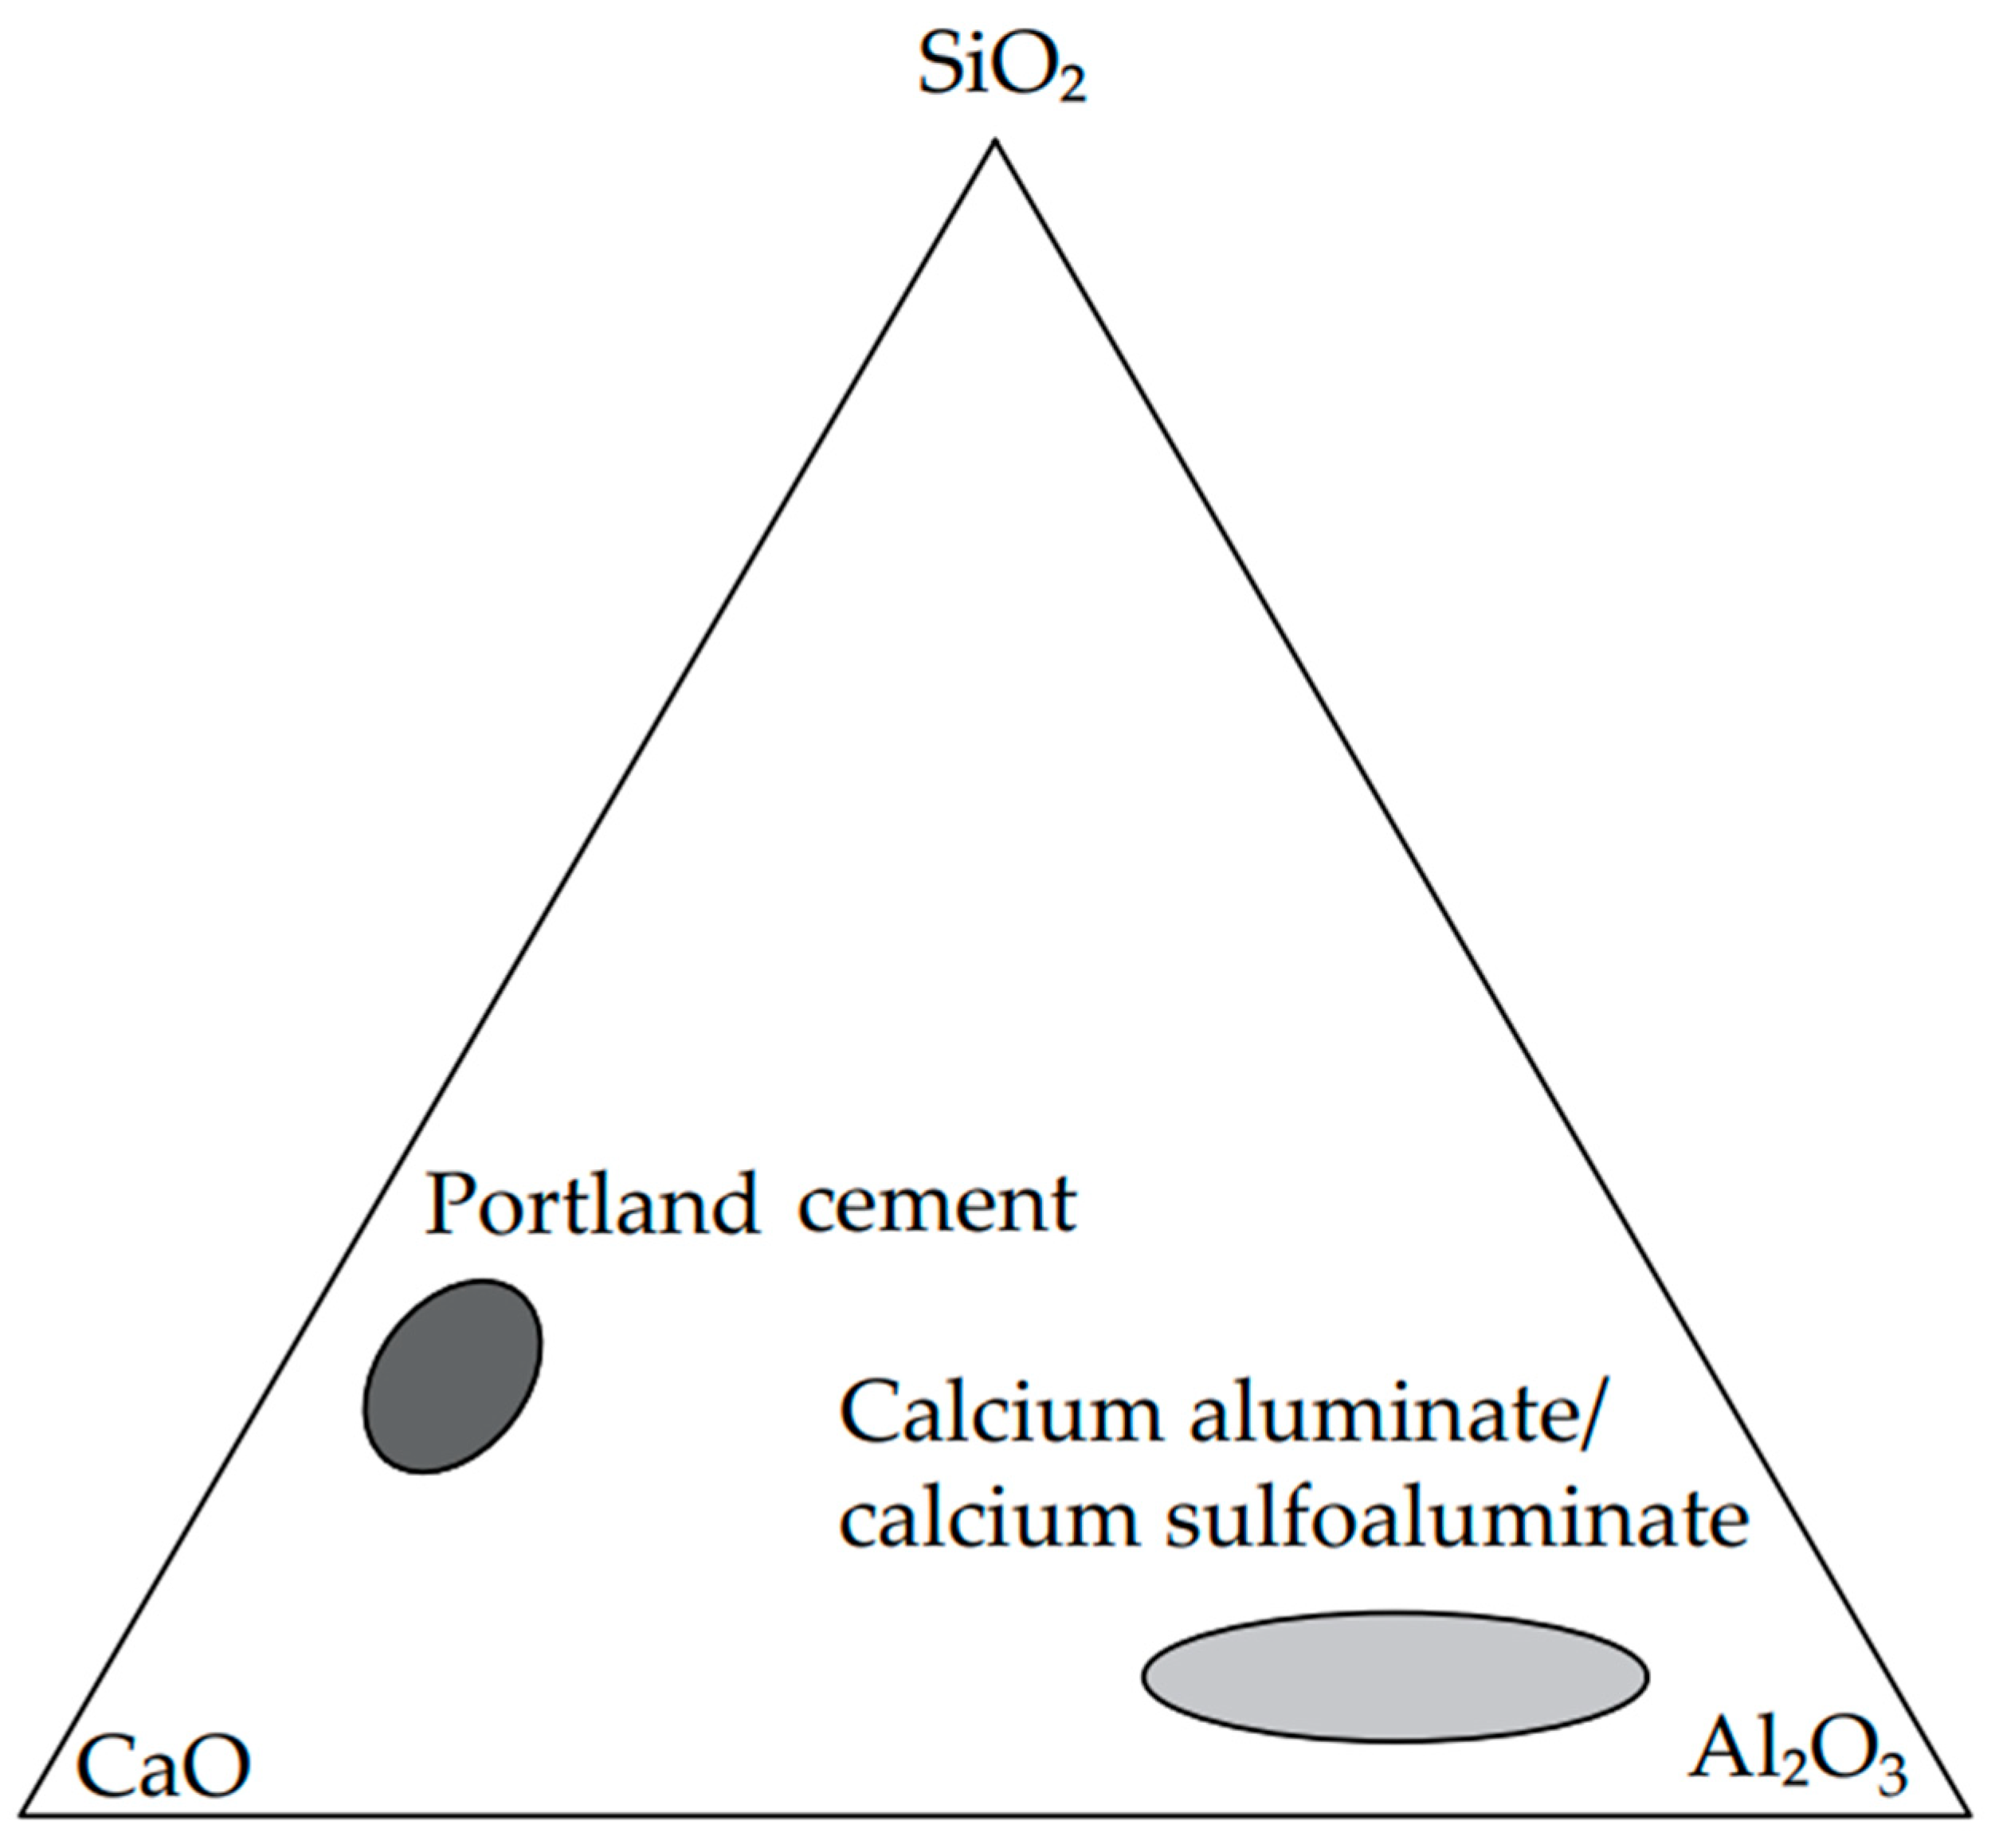
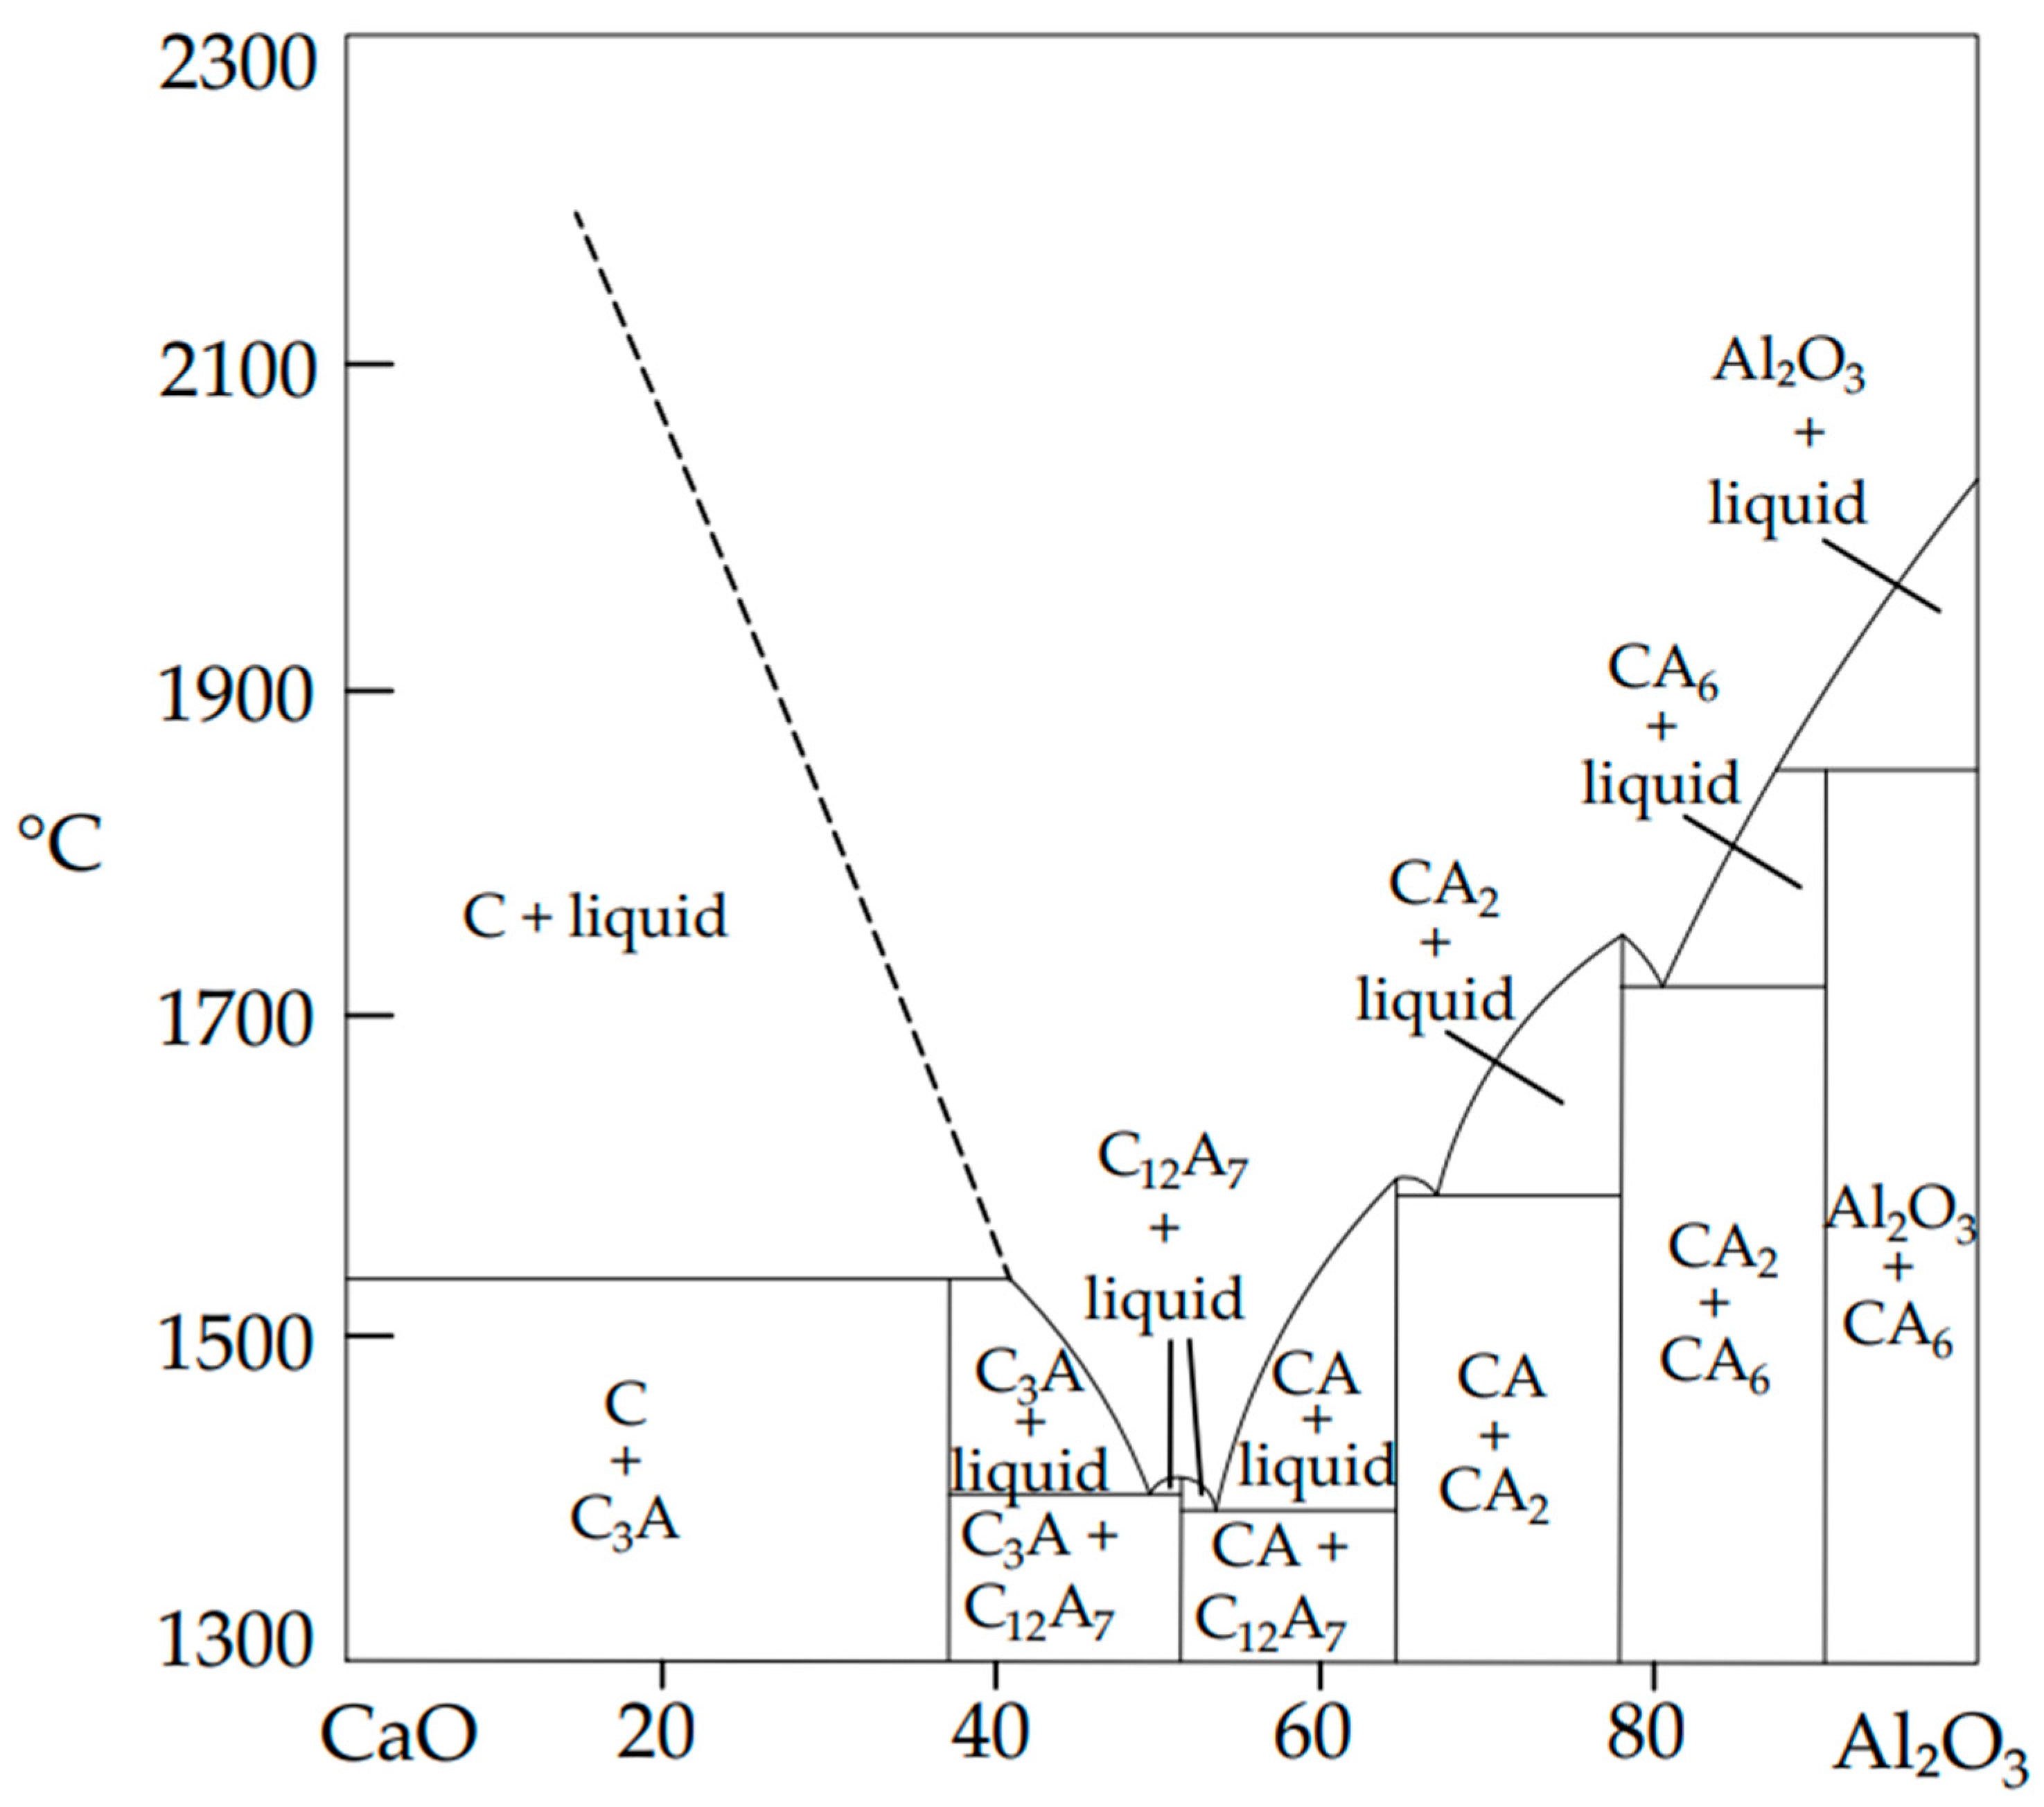
Refractory concrete can be made either by substituting ordinary Portland cement or aggregates (fine or coarse), together or each alone, by a refractory concrete material. There is a wide range of refractory concrete materials that can replace ordinary Portland cement such as calcium aluminate cements (CACs) including standard, medium and high types, reactive alumina, tabular alumina, barite, pumice, basalt, etc. The difference between the several types of CACs is mainly related to their purity where the alumina and iron oxide contents differ from one type to another. Also, there are several types of refractory concrete materials that can replace aggregates, both fine and coarse, like vermiculite, perlite, diatomite, expanded clay, chamotte, pumice, granite, synthetic aluminous aggregates “alag”, alumina bubble, silicon carbide, limestone, quartzite, bauxite, grog, synthetic calcium aluminate, etc. Each one of these materials has its own properties and characteristics that highly depend on the source and way of manufacturing. Regarding CACs, they are considered to be a large family with several compositions that vary more than the Portland type of cement as mentioned in Figure 5 [16]. Mainly, CACs consist of reactive calcium aluminate phases, specifically mono-calcium aluminate. These calcium aluminate phases can be obtained from raw materials that consist of a relatively high proportion of alumina to silica [16]. These raw materials can be either bauxite or limestone where bauxite is considered to be the most suitable material available commercially for the production of cement [16]. The most key binary system related to the calcium aluminate cements is the CaO-Al2O3 as shown in Figure 6 [17]. In between lime and calcium oxide, there are five phases of calcium aluminate including C3A, CA, CA2, CA6 and C12A7 [17].
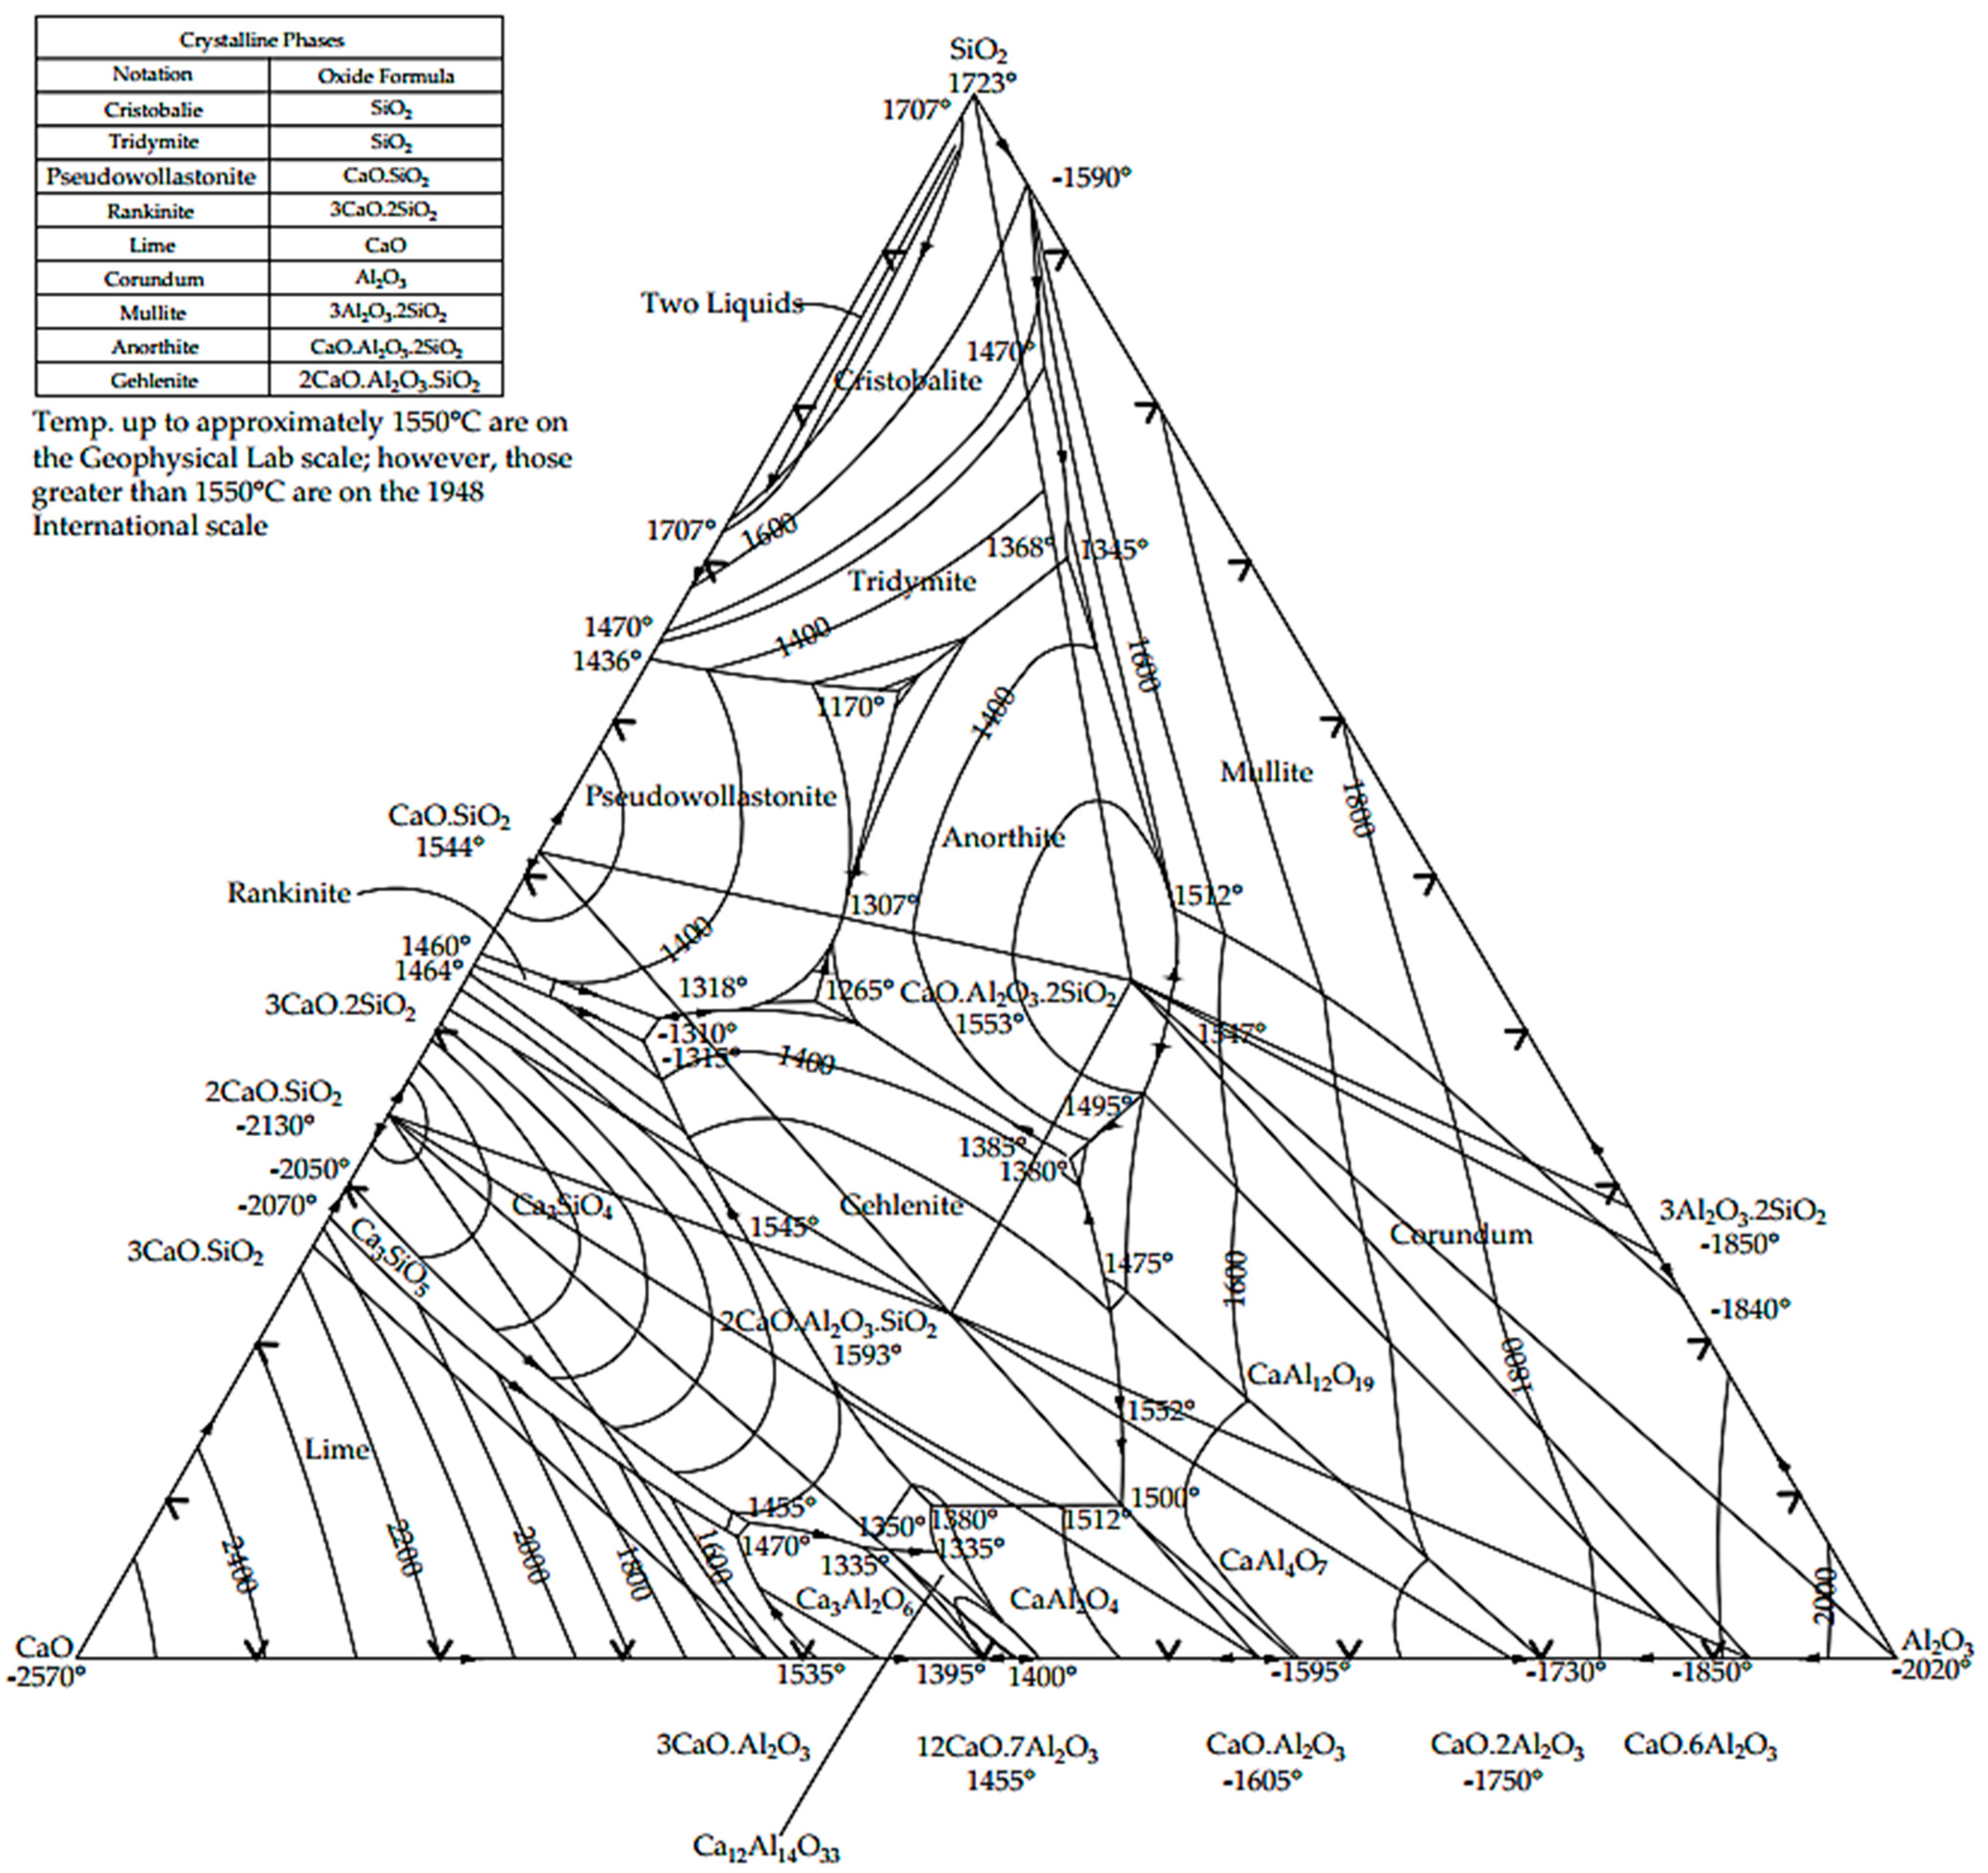
Furthermore, there is a phase diagram that includes calcium aluminate with iron oxide and silica [16]. This phase diagram is known as the CaO-Al2O3-SiO2 system and is presented in Figure 7 [16]. In this system, there are many solid solutions, while the most significant one is for CACs that are considered melitite groups with gehlenite (C2AS). The inclusion of silica in the phases of CAC is considered to be negligible. The presence of silica leads to the formation of silicates and also alumino-silicates. C2S and C2AS are considered to be the main silicate phases that are found in CACs [16].
Regarding the CaO-Al2O3-Fe2O3 system, it is a sub-solidus system and is shown in Figure 8 [16]. This phase is known as the ferrite phase and is considered the main phase that contains iron found in CACs [16].
The following equations are considered the hydration reactions of mono-calcium aluminate (CA) [16]:
CA + 10 H → CAH10
2 CA + 11 H → C2AH8 + AH3
3 CA + 12 H → C3AH6 + 2 AH3
3 C2AH8 → 2 C3AH6 + AH3 + 9 H
3 CAH10 → C3AH6 + 2 AH3 + 18 H
Regarding the hydration reactions occurring between CA and water, they are displayed in Equations (1)–(3) [16]. However, the conversion of the metastable phases C2AH8 and CAH10 to the stable phases C3AH6 and AH3 are conveyed in Equations (4) and (5) [16].

2.2. Properties of Refractory Concrete Materials

2.2.1. Chemical Properties

The chemical composition of different refractory materials used as cement replacement is shown in Table 1. There is a slight difference between the chemical composition of each material depending on the country selected and the way of manufacturing. However, despite that the content of the elements in the refractory concrete materials differs slightly between different studies, it can be concluded that the main components are Al2O3, CaO, SiO2 and Fe2O3. The range of chemical composition of CAC materials for the main components is 36–82% for Al2O3 and 9–40% for CaO. Also, the chemical composition of several refractory materials used as aggregate replacement (fine aggregates and coarse aggregates) is displayed in Table 2. Even though there is a slight difference between different elements in the composition of refractory concrete materials used to replace aggregates, the main constituents are known as Al2O3, SiO2 and Fe2O3. For example, the range of chemical composition of perlite is 70–75% for SiO2 and 12–15.4% for Al2O3.

2.2.2. Physical and Thermal Properties

Different studies show a slight variation in the different properties of refractory concrete materials including physical and thermal properties used as cement replacement or aggregate (fine or coarse). Table 3 shows the different properties of several refractory concrete materials used as cement replacement and Table 4 displays the various properties of the different refractory concrete materials used as aggregate replacement. Some of the physical and thermal properties examined are: specific gravity, density, surface area, refractoriness and fire resistance. The specific gravity and density for refractory materials used as cement replacement range between 2.54–3.3 and 1.1–3.91 kg/m3, respectively. However, the specific gravity for refractory materials used as aggregate replacement ranges between 1.03–2.88.

2.2.3. Color and Shape

The texture, including shape and color, may slightly differ between the selected studies addressed depending on the type of refractory concrete materials, the origin and the way of manufacturing. Table 5 and Table 6 present the color and shape of various refractory concrete materials used as cement and aggregate replacement, respectively. The color of CACs ranges between grey and white. However, there is a wide range of colors for refractory materials used as aggregate replacements. Regarding the shape, refractory aggregates mainly have angular shape.
Table 1. Chemical properties of refractory concrete materials used as cement replacement from selected literature.
Quantity (%)SiO2Al2O3Fe2O3CaOMgOTiO2Na2OK2OSO3Mn2O3P2O5SrOMnOBaSO4BaOFeOLOI 1 (%)
Standard CAC
[15]3–836–4212–2036–40~1~2-----------
[16]3–836–4212–2036–42<1<3~0.1~0.1---------
[18]3–836–422–3.536–401<0.5-----------
[19]4.4040.3015.2037.430.47-0.160.140.06--------
[20]4.9838.2315.437.530.711.80.030.230.060.230.130.02----0.65
[21]4.7236.5617.1036.411.262.360.240.13--------0.14
[22]3.2339.9215.4434.10-------------
[23]4–537–4015–1837–39<1<4-----------
[24]3.8540.3516.2837.500.96-0.080.15----0.2----
[25]4–537–4015–1837–39<1------------
[26]4.7236.5617.1036.411.262.360.240.13--------0.14
Range3–836–422–1834.1–400.47–1.261.8–40.03–0.240.1–0.23--------0.14–0.65
Medium CAC
[15]3–848–601–336–40~0.1~3-----------
[16]3–848–601–336–42<1<3~0.1~0.1---------
[27]7.6054.52.633.400.7---0.2--------
[28]4.–5.550.8–54.21–2.235.9–38.9-------------
[29]4–5.550.8–54.21–2.235.9–38.9-------------
Range3–848–601–333.4–40-------------
High CAC 70
[8]0.4470.20.0628.50-0.20.40.2---------
[15]<0.565–75<0.525–30-------------
[16]<0.565–75<0.525–35~0.1<0.1<0.3~0.05---------
[29]0.2–0.668.7–70.50.1–0.328.5–30.5-------------
[30]13731.39.30-------------
[31]<0.569–71<0.3--------------
Range0.44–1365–730.06–1.39.3–30.5-------------
High CAC 80
[15]<0.280–82<0.215–20-------------
[16]<0.5>79<0.5<20~0.1<0.1<0.3~0.05---------
[29]0.3579.5–82.00.2016.2–17.8-------------
Range-79–82-15–17.8-------------
Barite
[32]1.360.320.100.150.38--------96.12--1.05
[33]3.380.610.530.42----32.42-----62.08--
Range1.6–3.380.32–0.610.10–0.530.15–0.42-------------
Pumice
[32]42.4914.8314.869.4510.07-3.891.45--------2.39
[34]55.2342.050.830.310.45-0.610.20.32--------
Range42.49–55.2314.83–42.050.83–14.860.31–9.450.45–10.07-0.61–3.890.2–1.45---------
Reactive Alumina
[35]-99.7-0.02--0.098----------
[36]0.0399.800.020.020.09-0.08----------
Tabular Alumina
[35]-≥99.4-0.02--<0.38----------
Basalt
[32]42.7114.184.738.828.962.973.251.210.11-0.48----8.562.93
1 Loss on ignition.
Table 2. Chemical properties of refractory concrete materials used as aggregate replacement from selected literature.
Quantity (%)SiO2Al2O3Fe2O3CaOMgOSO3K2ONa2OTiO2P2O5BaOMnOSiCCr2O3ZrO2PbOLOI 1 (%)
Vermiculite
[21]35.4017.8016.706.9017.30-4.68----------
[24]41.2014.947.203.9525.50-5.10-1.40--------
[26]38.7615.8912.062.3217.690.385.500.30---------
[37]41.8014.2011.705.6018.40-----------3.20
[38]34.1017.2014.706.4016.30-4.52----------
Range34.1–41.814.2–17.87.2–16.72.32–6.916.3–25.5-4.52–5.5----------
Perlite
[24]74.4015.401.30-0.13-4.553.38---------
[39]70.9613.401.161.720.28-4.653.20---------
[40]70–7512–150.5–2.00.5–1.50.2–0.7-3–53–4---------
[41]72.3013.400.510.830.12-4.813.150.09--------
Range70–7512–15.40.5–1.30.5–1.720.12–0.7-3–53–4---------
Diatomite
[42]57.6115.755.557.734.170.502.085.60--------14.99
[43]82.153.845.232.390.661.820.320.410.351.190.69-----0.95
Range57.61–82.153.84–15.755.23–5.552.39–7.730.66–4.171.82–0.50.32–2.080.41–5.6--------0.95–14.99
Expanded Clay
[44]75.0510.953.550.590.83-1.940.980.64-------4.80
[45]18.036.153.253.464.10-3.580.740.55-------7.94
Range18.03–75.056.15–10.953.25–3.553.46–0.594.10–0.83-3.58–1.940.74–0.980.55–0.64-------7.94–4.80
Alag
[29]2.7939.8814.4836.02----1.61--------
Alumina Bubble
[46]0.5096.970.21--------------
Chamotte
[25]52.0040.001.500.500.30---5.00--------
[29]19.9070.801.90----0.506.50--------
[31]49.7542.801.93-0.12---1.35--0.04-----
Range19.9–5240–70.81.5–1.93-0.12–0.3---1.35–6.5--0.04-----
Pumice
[47]74.1013.451.401.170.35-4.103.70--------1.54
[48]75.519.941.100.250.04-5.122.04--------4.27
Range74.1–75.519.94–13.451.1–1.40.25–1.170.04–0.35-4.1–5.122.04–3.7--------1.54–4.27
Silicon Carbide
[8]2.101.200.300.20--------96.20----
Limestone
[49]2.690.160.5753.360.21-0.410.32--------42.20
Granite
[18]91.180.221.900.531.820.371.130.080.050.04-0.11----2.72
[49]63.0511.265.8513.194.17-1.080.69--------0.60
Range63.05–91.180.22–11.261.9–5.850.53–13.191.82–4.17-1.08–1.130.08–0.69--------0.60–2.72
Quartzite
[49]91.143.382.23---0.302.71--------0.10
Bauxite
[50]9.2681.291.820.440.370.020.170.071.450.54---0.120.271.601.81
Grog
[50]26.6451.932.991.220.510.884.901.423.741.06---0.070.190.01-
Synthetic Calcium Aluminate
[51]3–537.5–43.514–1835–40-------------
1 Loss on ignition.
Table 3. Properties of refractory concrete materials used as cement replacement from selected literature.
PropertiesSpecific Gravity (g/cm3)Surface Area (cm2/g)Density (g/cm3)Fineness (cm2/g)Refractoriness (°C)Fire resistance (°C)Porosity (%)
Standard CAC
[21]3.23053-----
[22]3.143200-----
[23]-31003.2----
[25]3.23000–3300--1280--
[26]3.23053-----
Medium CAC
[27]3.34------
[29]2.95–3.05------
High CAC 70
[8]-42501.1--1630-
[29]2.90–3.05------
High CAC 80
[29]3.2–3.3------
Pumice
[32]--2.993260---
[34]2.54167-----
Barite
[32]--4.243480---
Basalt
[32]--3.053160---
Reactive Alumina
[35]-30,0003.9----
[36]-30,000–70,0003.91----
Tabular Alumina
[35]--3.79---≤5
Table 4. Properties of refractory concrete materials used as aggregate replacement from selected literature.
PropertiesDensity (kg/m3)Specific GravityFineness (m2/g)Unit Weight (kg/m3)Particle Size (mm)Moisture Content (%)Apparent Porosity (%)Water Absorption (%)Permeability (%)pHWater Holding Capacity
Vermiculite
[21]-1.03------958.1240% (by weight)
28% (by volume)
[37]140---------220–325% (by weight)
20–50% (by volume)
[38]140--------6.1240% (by weight)
Perlite
[52]80–160----------
Diatomite
[43]-2.8612.245--------
Expanded Clay
[53]440–520---2–8--15–25---
Alag
[29]3030----------
Chamotte
[25]2150–2300-----17–21----
Pumice
[48]-2.03-----6.38---
Silicon Carbide
[8]3120----------
Shale
[54]1487------4.5---
Limestone
[43]2740----------
[49]-2.42-1540.5191-1.95---
Basalt
[55]-2.88---------
Granite
[49]-2.68-1649.4190.5-1.78---
[55]-2.72---------
Quartzite
[49]-2.641655.7-190.8-1.87---
[55]-2.67---------
PropertiesThermal conductivity (W/m.°C)Thermal conductivity coefficient at 100 °C(W/m.k)Thermal expansion coefficient at 20 to 1000 °C  (K−1.10−6)Sintering point (°C)Melting point (°C)Softening point (°C)Fire resistanceSpecific heat (KJ/Kg.°C)Refractoriness (°C)Refractoriness under load (°C)Thermal shock at 1000 °CReversible thermal expansion (%) at 1000 °C
Vermiculite
[21]0.062–0.065--1150–1250--Fireproof0.836–1.087----
[37]---1200–1320--------
[38]0.063--1170---0.92----
Perlite
[52]0.05---1260–1343900–1100-0.84----
Chamotte
[25]--------17001320–134015–200.6–0.7
Silicon Carbide
[8]-140–2003.5–4.0---------
Basalt
[19]1.7----------
Table 5. Color of refractory concrete materials used as cement replacement from selected literature.
TextureColor
Standard CAC
[15]Grey
[16]Grey or buff to black
Medium CAC
[15]Buff
[16]Light buff or light grey
High CAC 70
[15]White
[16]White
High CAC 80
[15]White
[16]White
Table 6. Color and shape of refractory concrete materials used as aggregate replacement from selected literature.
TextureColorShape
Vermiculite
[21]GoldAccordion
[26]-Accordion
[37]Brown or GoldAccordion
[38]SilverAccordion
Perlite
[52]White-
[56]White-
[57]-Spherical
Diatomite
[58]White-
Expanded Clay
[53]BlackSpherical
Alag
[59]BlackAngular
Alumina Bubble
[46]-Crystals
[60]-Crystals
Pumice
[61]Dark brownAngular
Silicon Carbide
[8]-Rounded
Limestone
[49]-Angular
[62]Grey-
Basalt
[63]-Angular
[64]Dark grey or black-
Granite
[49]-Angular
[65]Grey-
Quartzite
[49]-Angular

3. Properties of Refractory Concrete

3.1. Properties of Refractory Concrete Containing Refractory Materials as Cement Replacement

The binder most used to replace ordinary Portland cement (NC) in refractory concrete is calcium aluminate cement (CAC). Table 7 displays the various properties examined in the review for refractory concrete containing CAC at 600 °C temperature in comparison with NC mixes.

3.1.1. Slump

The slump values for different concrete mixes, one containing normal cement and designated by NC and the other containing the standard type of calcium aluminate cement denoted by CACC, are shown in Table 8 for different studies. The slump values for NC and CACC are 85 mm and 110 mm, respectively, revealing that the mix containing calcium aluminate cement records higher slump values than that containing normal cement [25]. Also, the same trend is obtained by another study where the slump values for the NC mix and CACC mix record a value of 194 mm and 217 mm, respectively [24].

3.1.2. Density or Dry Unit Weight

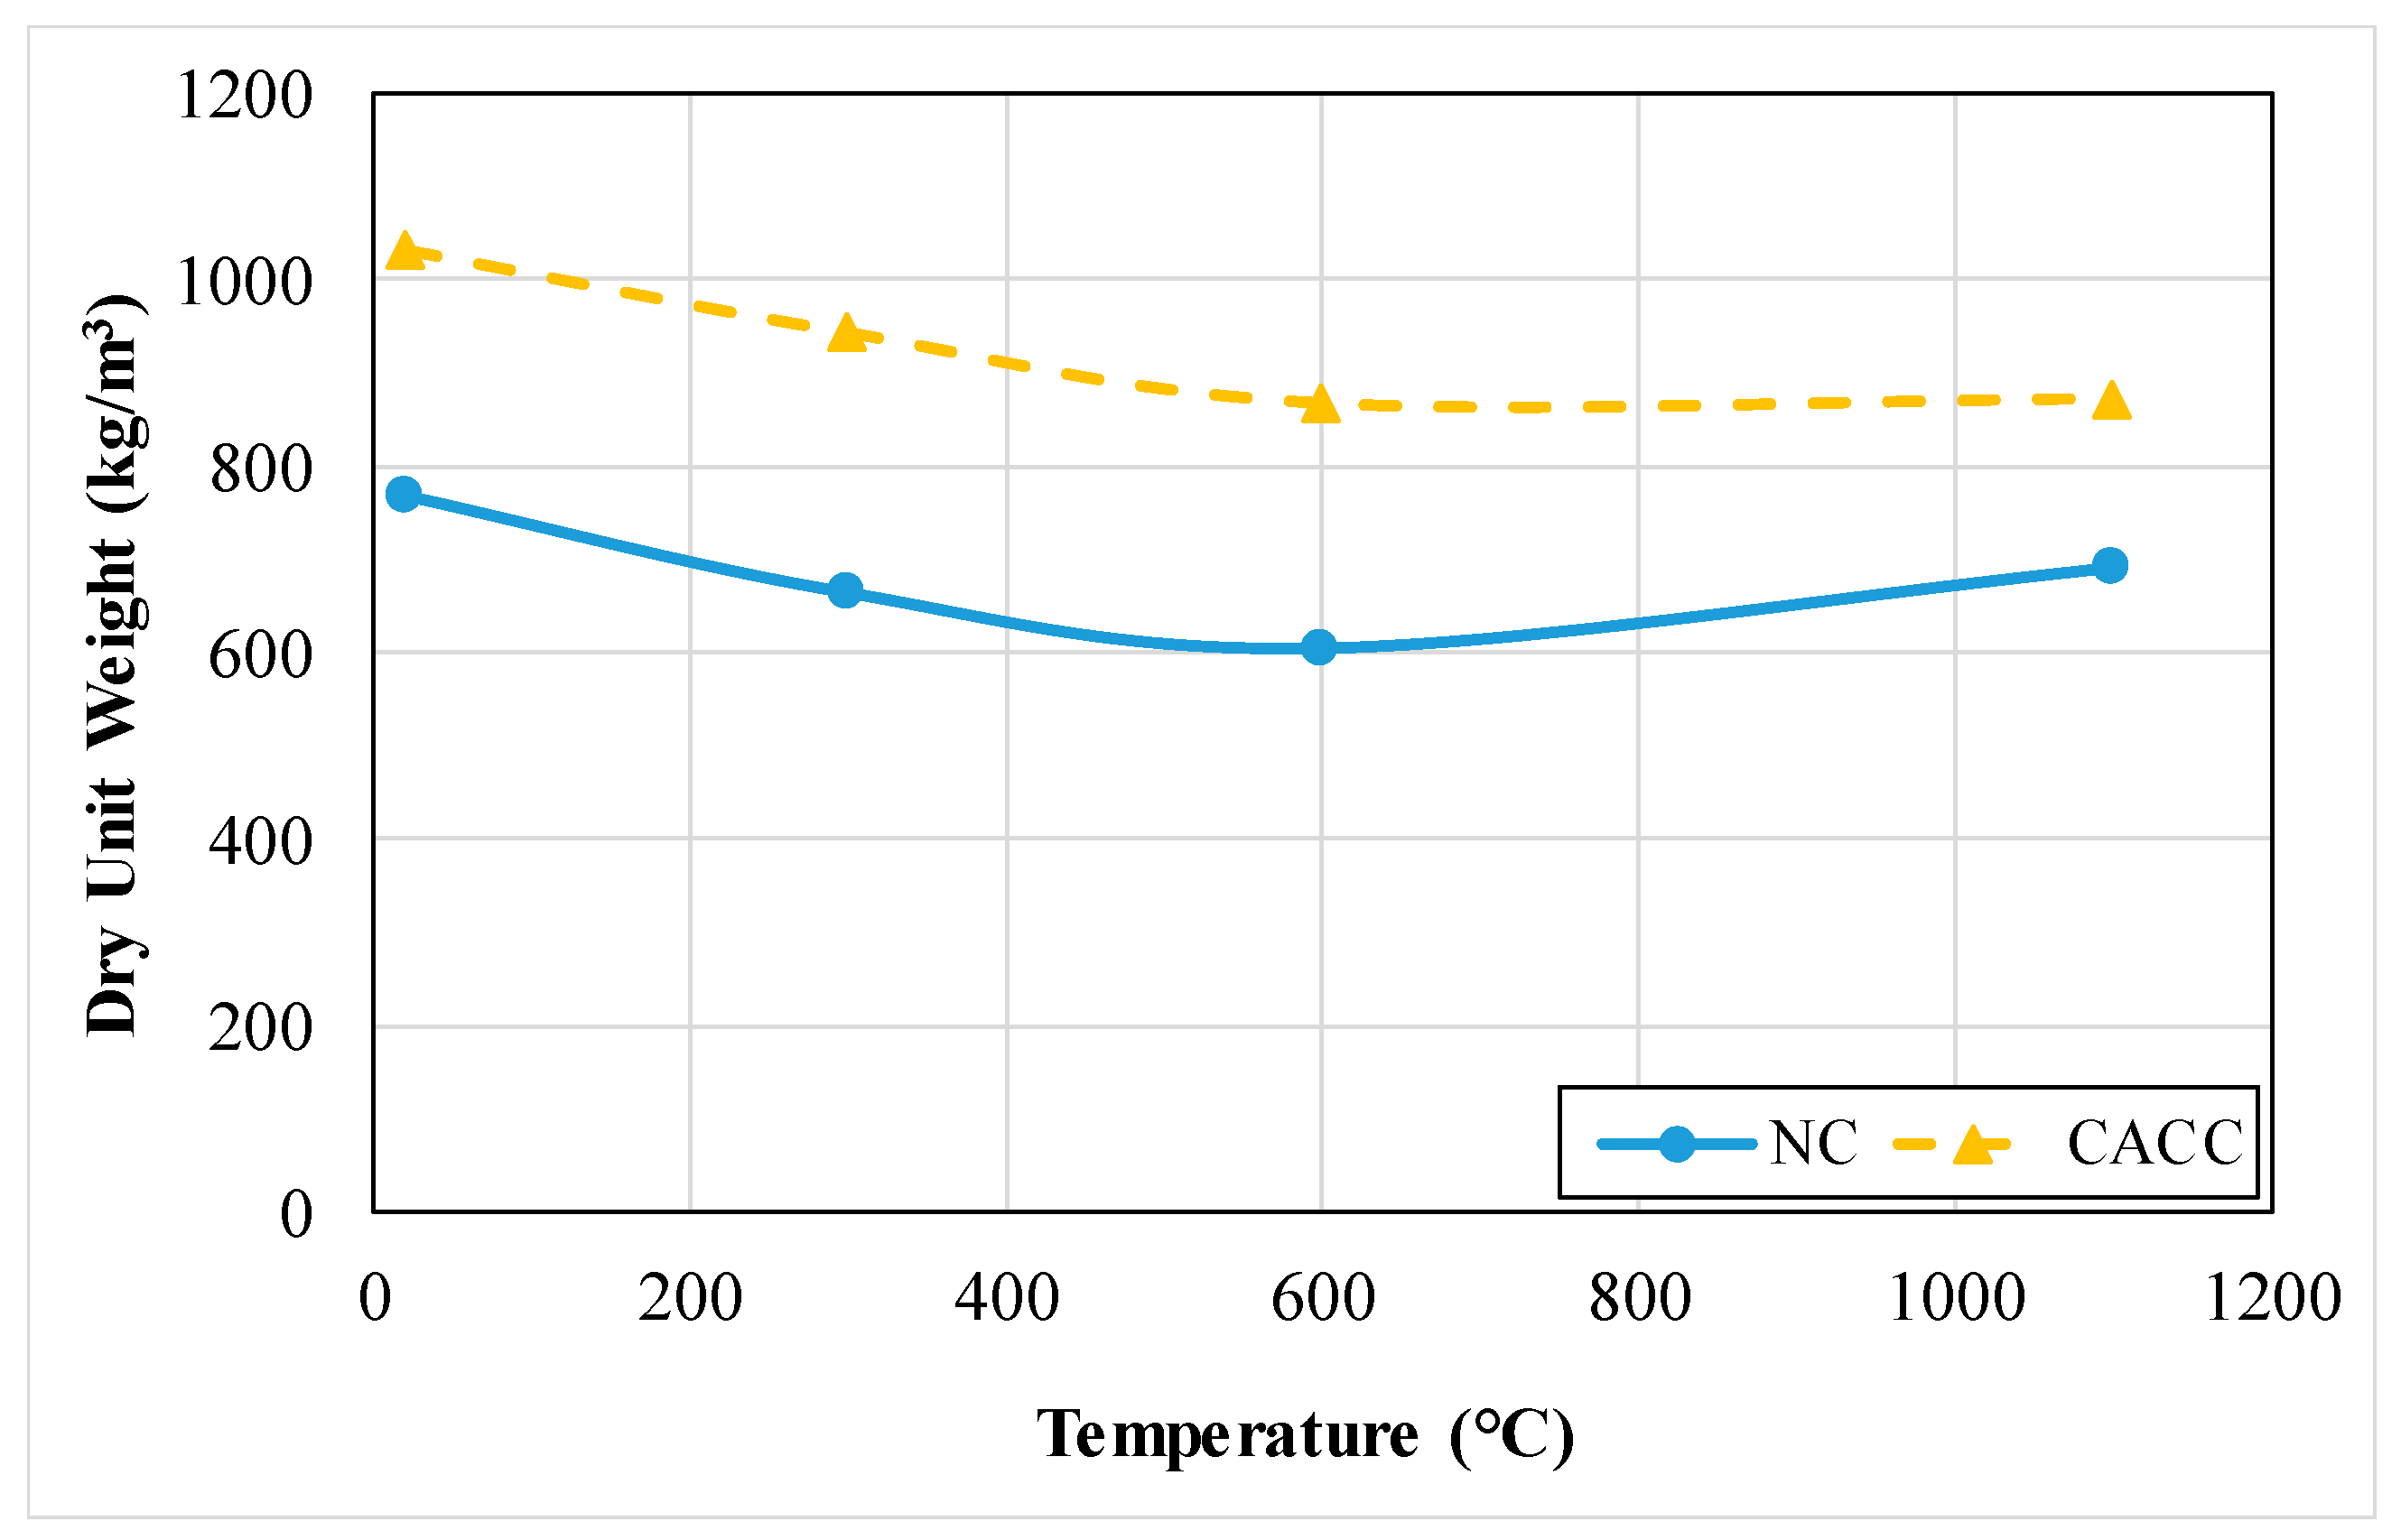
Koksal et al. [21] conducted a study on two different mortar mixes containing different binder materials to check the effect of these materials on the dry unit weight. Figure 9 shows the dry unit weight values for NC and CACC mixes [21]. It is stated that the dry unit weight of both mixes, NC and CACC, encounters a decrease in their values as the temperature increases from 20 °C to 600 °C [21]. This reduction in the dry unit weight in NC specimens is higher than that in CACC specimens. After this reduction, the dry unit weight of both mortar mixes, NC and CACC, increases again as the temperature increases from 600 °C to 1100 °C [21]. In addition to that, the dry unit weight of mortar mixes containing CACC is higher than that containing NC. This can be highly related to the specific gravity where the specific gravity of calcium aluminate cement is much higher than that of ordinary Portland cement [21]. The unit weight of different mixes containing different materials replacing NC is presented in Figure 10. The lowest unit weight recorded is for the pumice mix with 15% replacement; however, the highest unit weight is obtained by the NC mix. This is due to the density of the materials used in the mix [32].

3.1.3. Compressive Strength

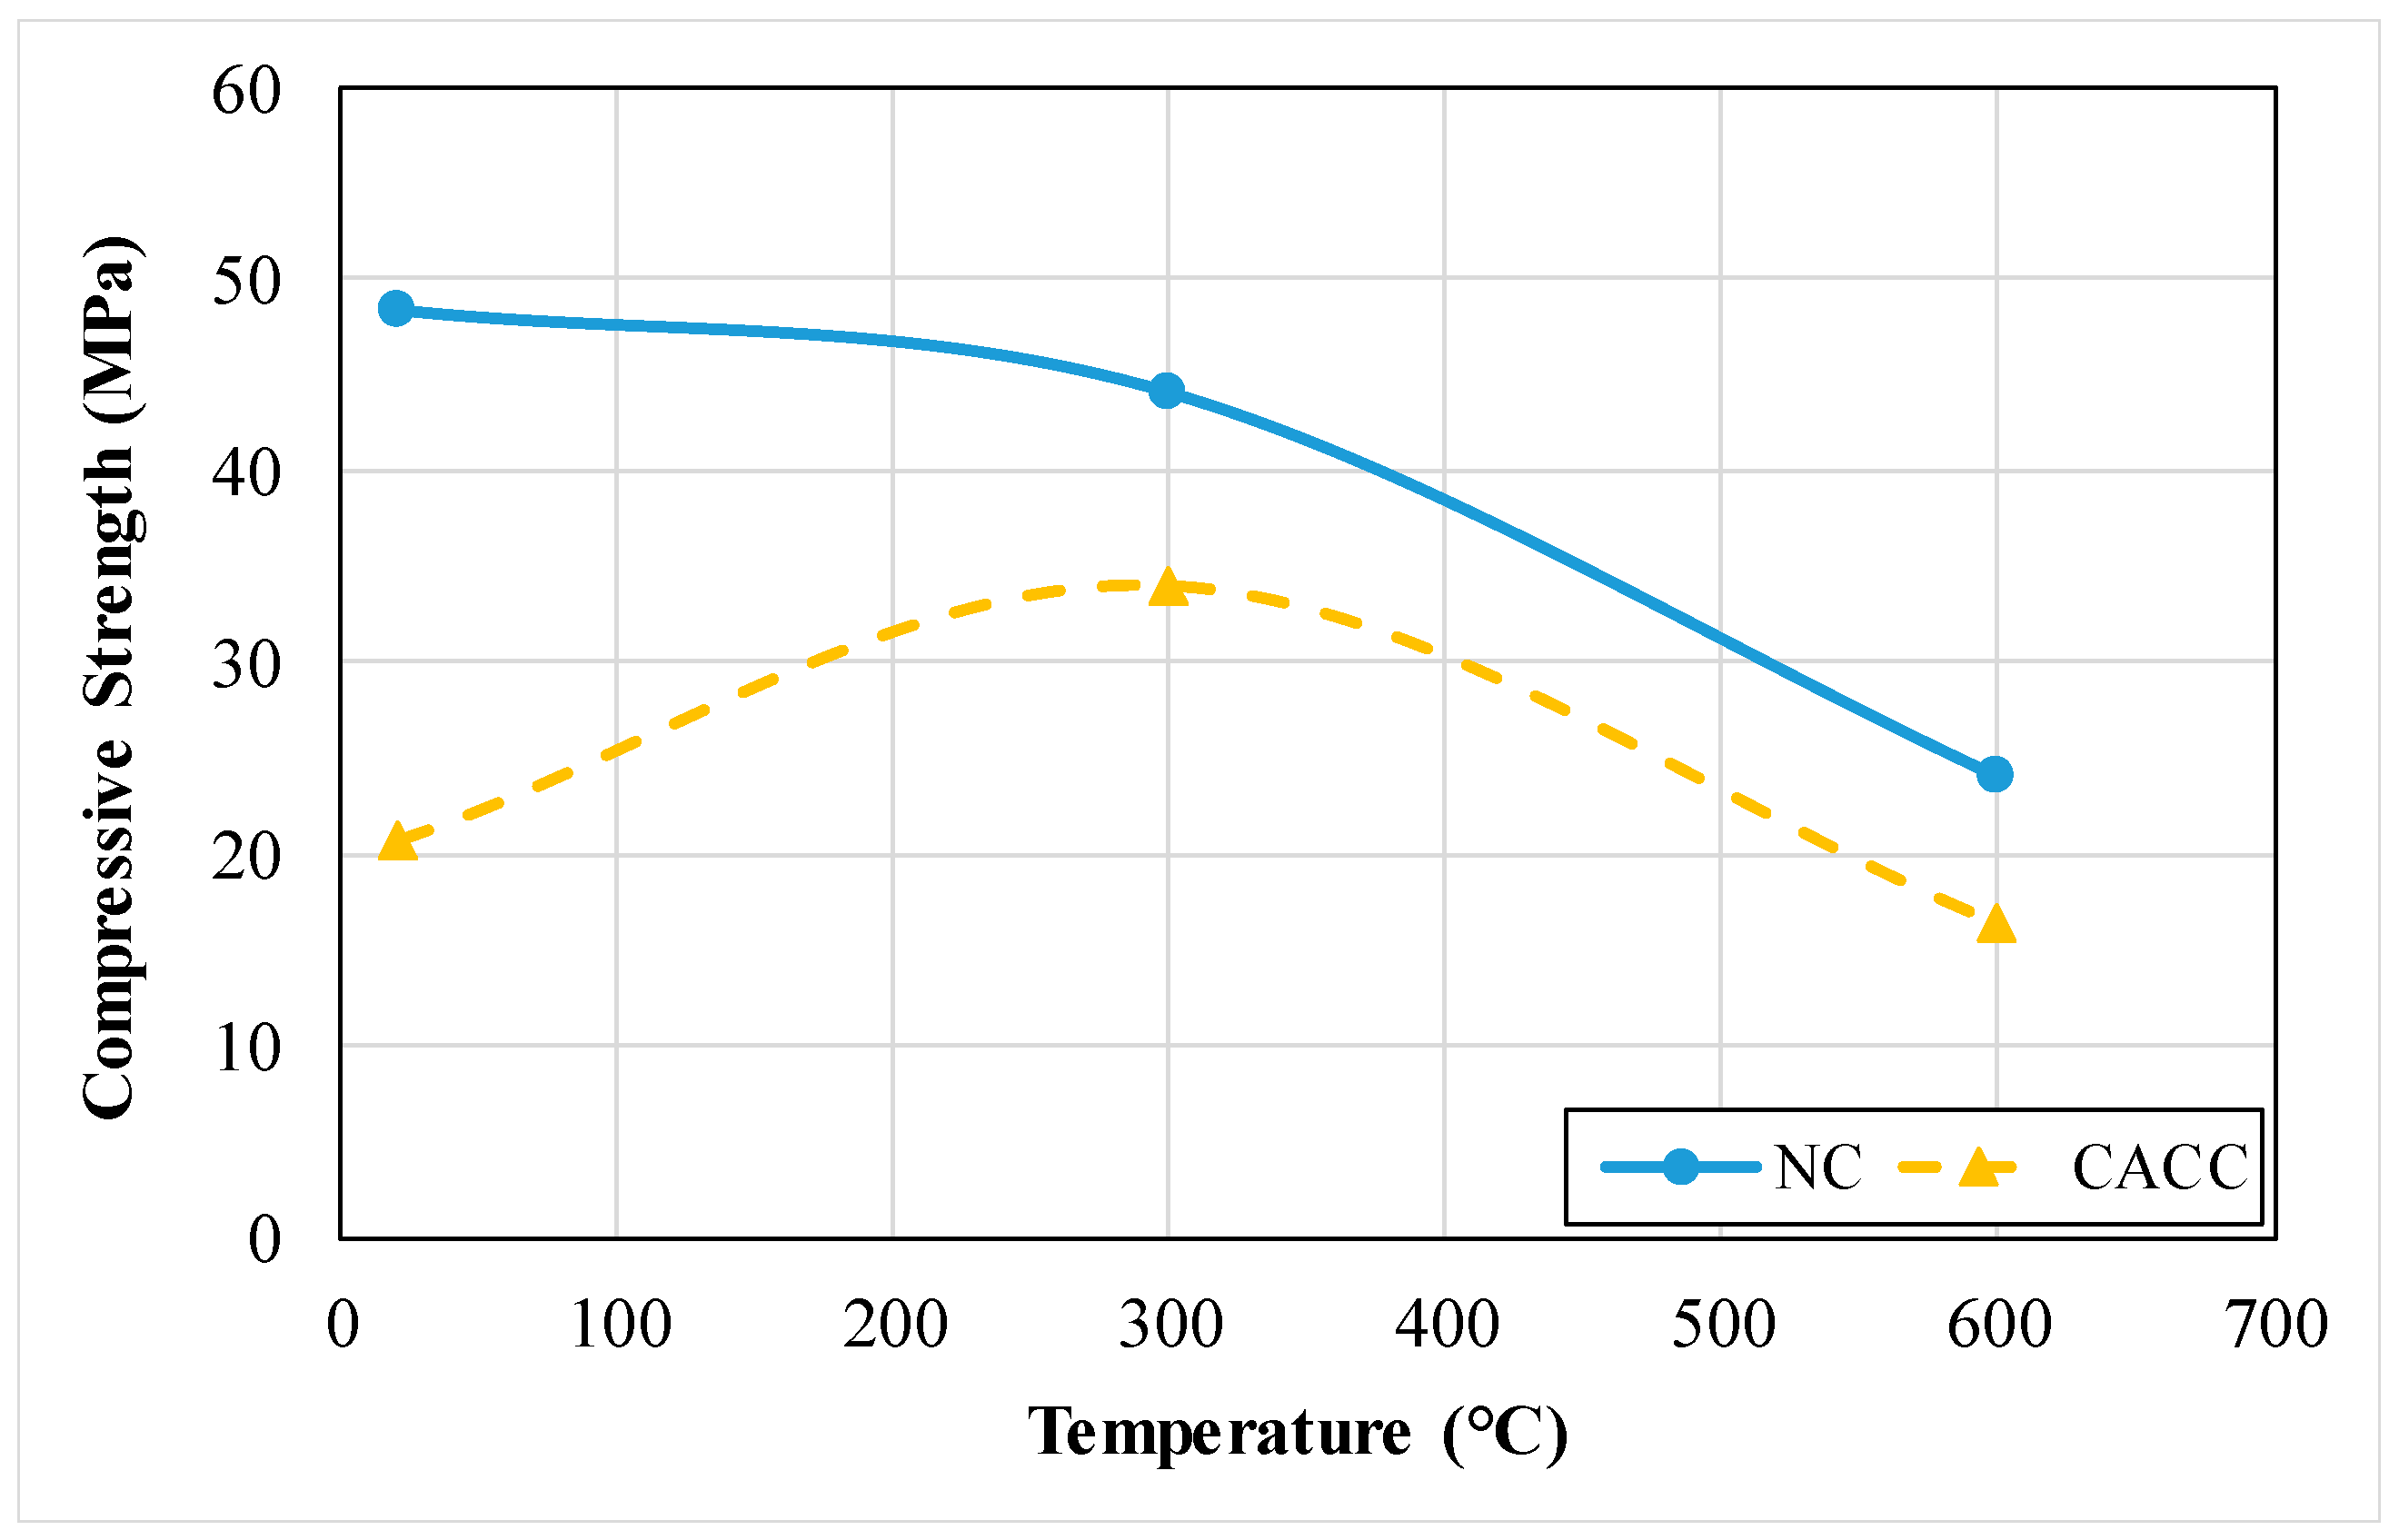
The compressive strength of mortar specimens tested at 28 days after being exposed to three different temperatures 20 °C, 300 °C and 600 °C is presented in Figure 11. The tested specimens are made up of NC and CACC samples [26]. The compressive strength of NC mixes records higher values than that of CACC mixes at the same tested temperature. This can be highly linked to the fact that NC specimens behave completely in a different way than CACC specimens, especially in the way of hydration. In addition to that, there is an effect that is well known as conversion found in CACC chemistry. This effect results in an increase in the porosity of hardened CACC with respect to time leading to a reduction and decrease in the strength [26]. This also can be associated with a lower cracking of NC specimens in comparison to CACC specimens. As temperature increases from 20 °C to 600 °C, the compressive strength of NC specimens decreases; however, the compressive strength of specimens containing calcium aluminate cement records the highest and optimum value at 300 °C. The compressive strength of two different specimens, NC and CACC, exposed to sulfuric acid solution at several immersion days, is shown in Table 9 [23]. NC specimens record higher values of compressive strength than that of CACC specimens despite that specimens containing calcium aluminate cement show a higher resistance to acid in comparison to that containing ordinary Portland cement. However, it produces a smaller amount of ettringite and gypsum which creates a blocking barrier against the acid attack leading to a slower loss in strength [23]. In addition to that, a reduction in compressive strength is observed in the two specimens, NC and CACC, with an increase in immersion days from 0 to 63 days. This results from the expansion that occurs in the specimens due to the formation of the gypsum and ettringite where a dissolution of the cement paste in the acid solution happens and a softening in the cement matrix occurs [23]. Also, as time passes, a gypsum layer is formed on the surface of the specimens, preventing the acid solution from entering and reacting with calcium hydroxide leading to a reduction in the rate of formation of ettringite resulting in a decrease in the rate of loss of compressive strength [23]. Table 10 shows the residual compressive strength of ultra-high-performance concrete for two different mixes, NC and CACC [66]. The compressive strength is measured at different temperatures including room temperature, 250 °C, 500 °C, 750 °C and 1000 °C. However, for NC, the compressive strength is measured only at room temperature and 250 °C because of the explosive spalling. At 250 °C, the compressive strength for NC and CACC mixes increased from 123.8 MPa and 122.1 MPa to 137.5 MPa and 153.8 MPa, respectively. The increase in compressive strength of the NC mix is related to the secondary hydration of the unhydrated clinkers due to the high-temperature environment. However, the increase in the CACC mix is due to the formation of C-A-S-H caused by the hydration of the unhydrated clinkers with fly ash and silica fume. Regarding the CACC mix, the compressive strength decreases from 153.8 MPa at 250 °C to 31.6 MPa at 1000 °C.

3.1.4. Flexural Strength

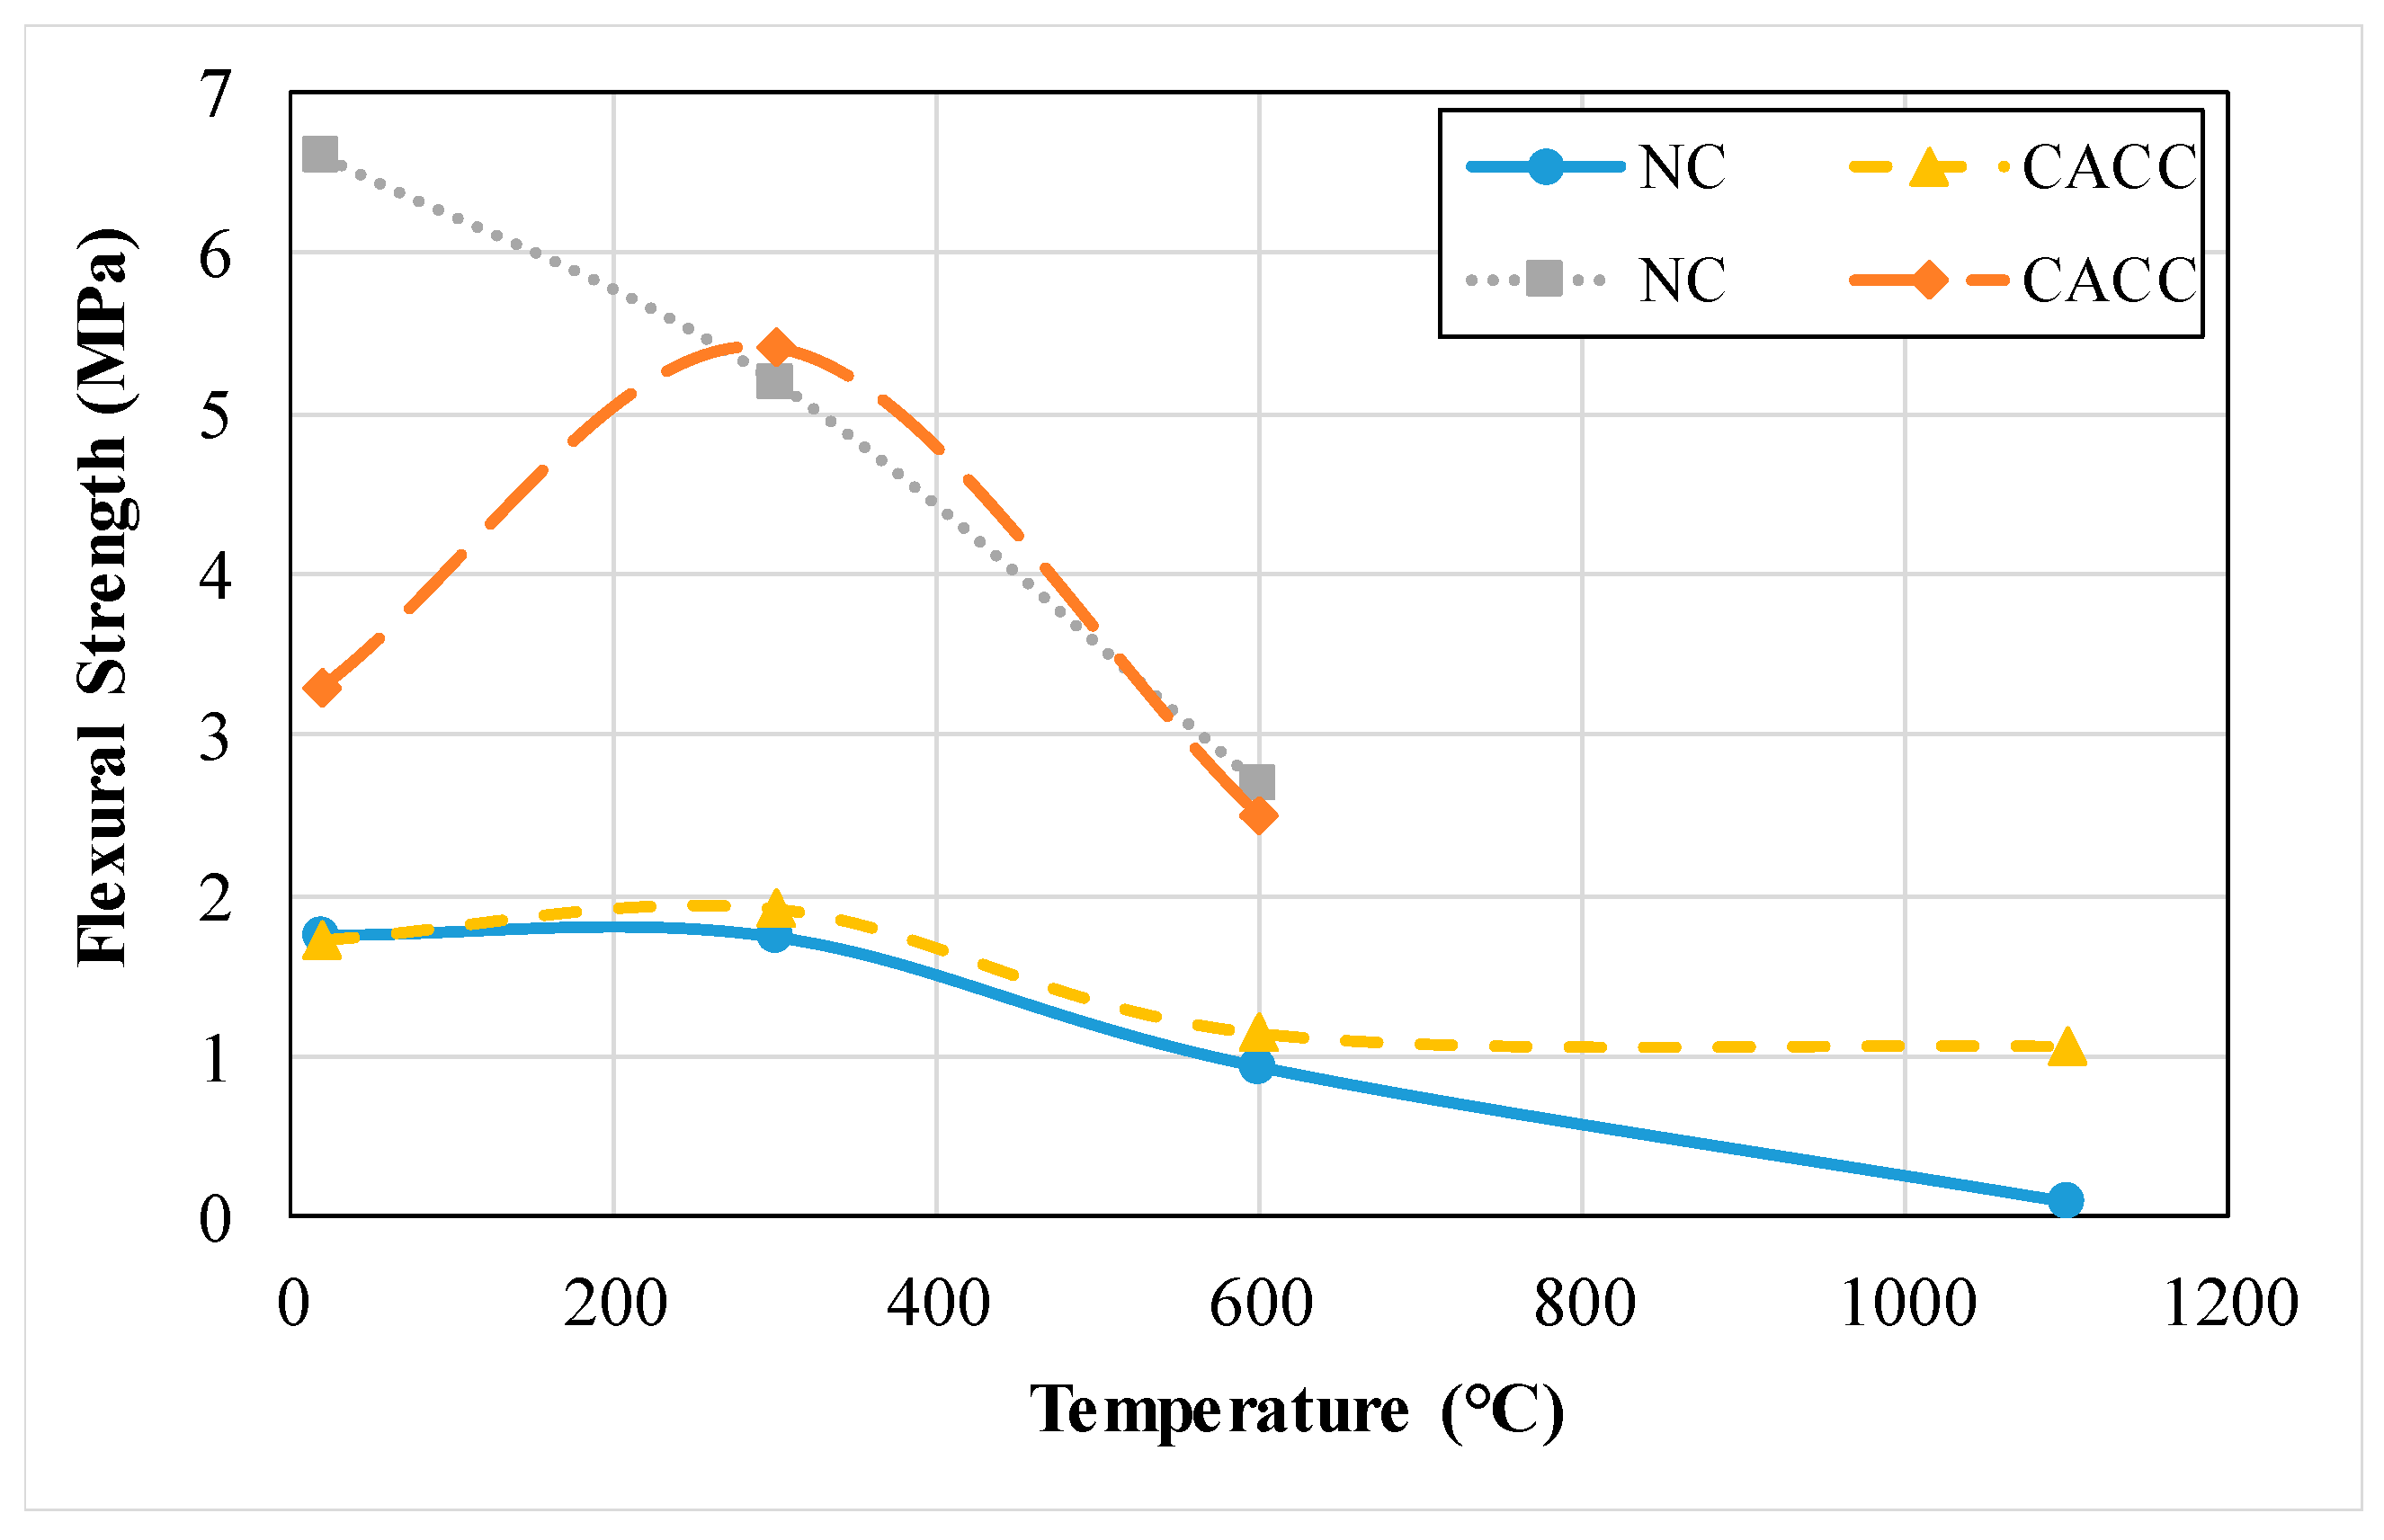
Gulec [22] conducted a study on three different concrete mixes containing different cement types to check the effect of changing the cement type on the flexural strength of concrete specimens. The first mix is the NC, the second is made of calcium aluminate cement that is produced at standard curing temperatures and is named CACC-S and the third mix is made also of calcium aluminate cement but it is produced at high curing temperatures and is named as CACC-H [22]. Table 11 shows the flexural strength results for the three different casted concrete mixes at different testing temperatures [22]. The results show that the NC mix records the highest flexural strength values at all testing temperatures. CACC-H mix has a flexural strength greater than that of CACC-S at 23 °C, while CACC-S mix has a higher flexural strength than that of CACC-H at different testing temperatures including 300 °C and 600 °C [22]. The calcium alumino-silicates (C-A-S) with a high heat resistance help to increase the capacity to maintain high strength for CACC samples that are exposed to 800 °C [22]. The flexural strength of concrete samples is affected much more than the compressive strength of concrete samples by the amount, propagation and the way of distribution of cracks [22]. Two other studies are conducted on two different mortar mixes NC and CACC that are presented in Figure 12 [21,26]. Both studies show that the flexural strength of the NC mix is higher than that of the CACC mix at 20 °C of testing temperature. Also, both studies show that as the temperature increases from 20 °C to a higher testing temperature, the CACC mix records flexural strength values that are above that recorded by the NC mix. In addition to that, both studies reveal that the highest flexural strength values are recorded at 300 °C of testing temperature for both NC and CACC mixes [21,26]. This can be related to the disintegration of the C-S-H gel leading to the formation of macro cracks at elevated temperatures [34].

3.1.5. Tensile Strength

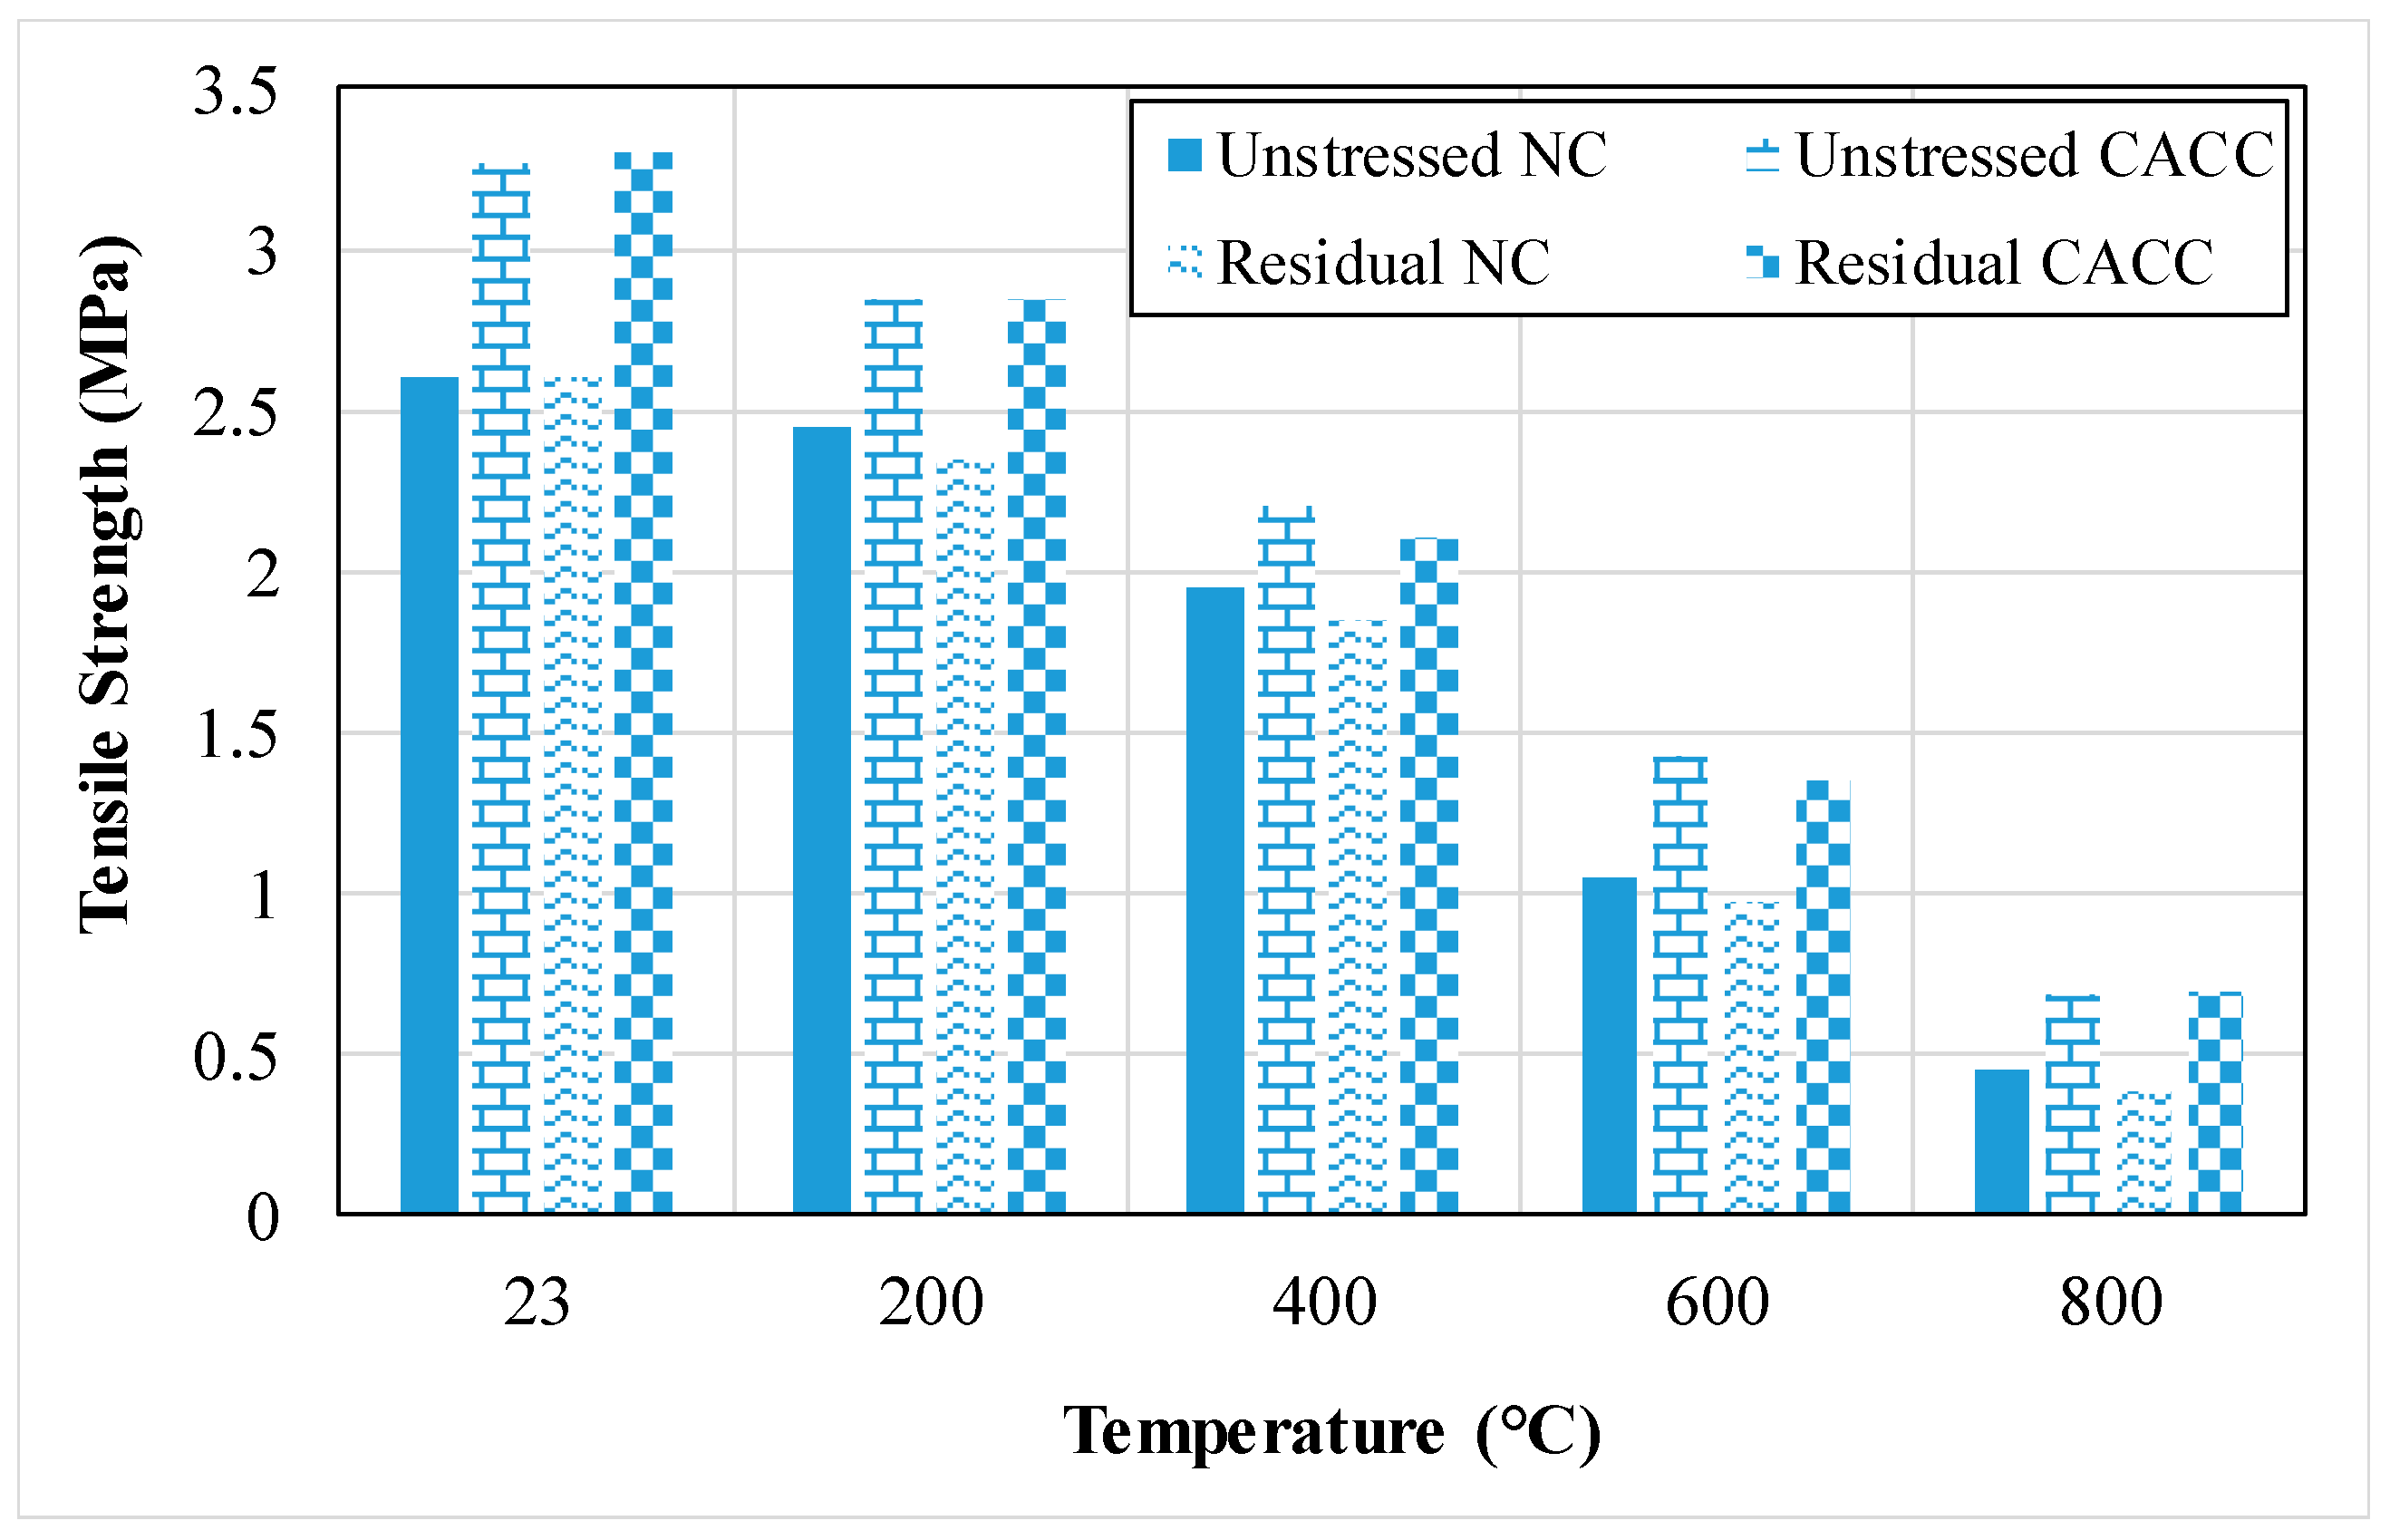
Khaliq and Khan [27] performed a study on the effect of calcium aluminate cement (CAC), medium type, on concrete specimens. As shown in Figure 13, both mixes, NC and CACC encounter a decrease in the tensile strength with respect to the increase in temperature from 23 °C to 800 °C [27]. At room temperature, the CACC mix records a tensile strength that is higher than that of the NC mix by approximately 25%. This can be related to the superior microstructure of CACC in comparison with that of NC at room temperature. Regarding the decrease in tensile strength for the CACC mix in the case of the unstressed test method, it can be considered nearly linear and gradual throughout the tested temperatures 23 °C to 800 °C. Also, the observed trend can be highly compared to the trend observed for the NC mix at temperatures below 400 °C [27]. This reduction can be related to the dehydration of the microstructure of the casted concrete leading to an increase in the thermal stresses. Also, the decrease in tensile strength in the case of the unstressed test method for CACC specimens can be due to the conversion in reaction that results in more moisture in the tested system. However, above 400 °C, the behavior of the CACC mix cannot be highly compared to that of the NC mix due to the huge and sudden loss in the tensile strength that happened in the NC mix under the unstressed testing method. The observed decrease can be due to the dehydration of the C-S-H and CH leading to the disintegration of the microstructure of the tested concrete specimen [27]. In addition to that, the high difference between the CACC specimen and NC specimen tested at 800 °C can be related to the increase in the binding strength of the alumina used as a material to replace cement. This leads to the disintegration and collapse in the microstructure of tested specimens at high temperatures contributing to more loss in tensile strength. The increase in tensile strength in the CACC specimen in comparison to the NC specimen can contribute as an advantage since it can highly enhance the resistance to fire [27]. In addition to that, both CACC specimens and NC specimens are tested under the residual testing method as shown in Figure 13 [27]. A decrease in tensile strength for both the CACC mix and NC mix with respect to the increase in tested temperature from 23 °C to 800 °C under the residual testing method is also experienced. The tensile strength for the CACC mix records values higher than that of the NC mix at all tested temperatures [27]. Table 12 shows the normalized splitting tensile strength of high strength concrete containing ground pumice (GP) as ordinary Portland cement replacement with different percentages [34]. Results show that, in comparison with the NC mix, the increase in the percentage of GP in the mix leads to a slight decrease in the normalized splitting tensile strength. Also, as the temperature increases from 25 °C to 750 °C, the normalized splitting tensile strength decreases for all tested mixes. This decrease can be related to the disintegration of the C-S-H gel and the formation of macro cracks [34].

3.1.6. Modulus of Elasticity (MOE)

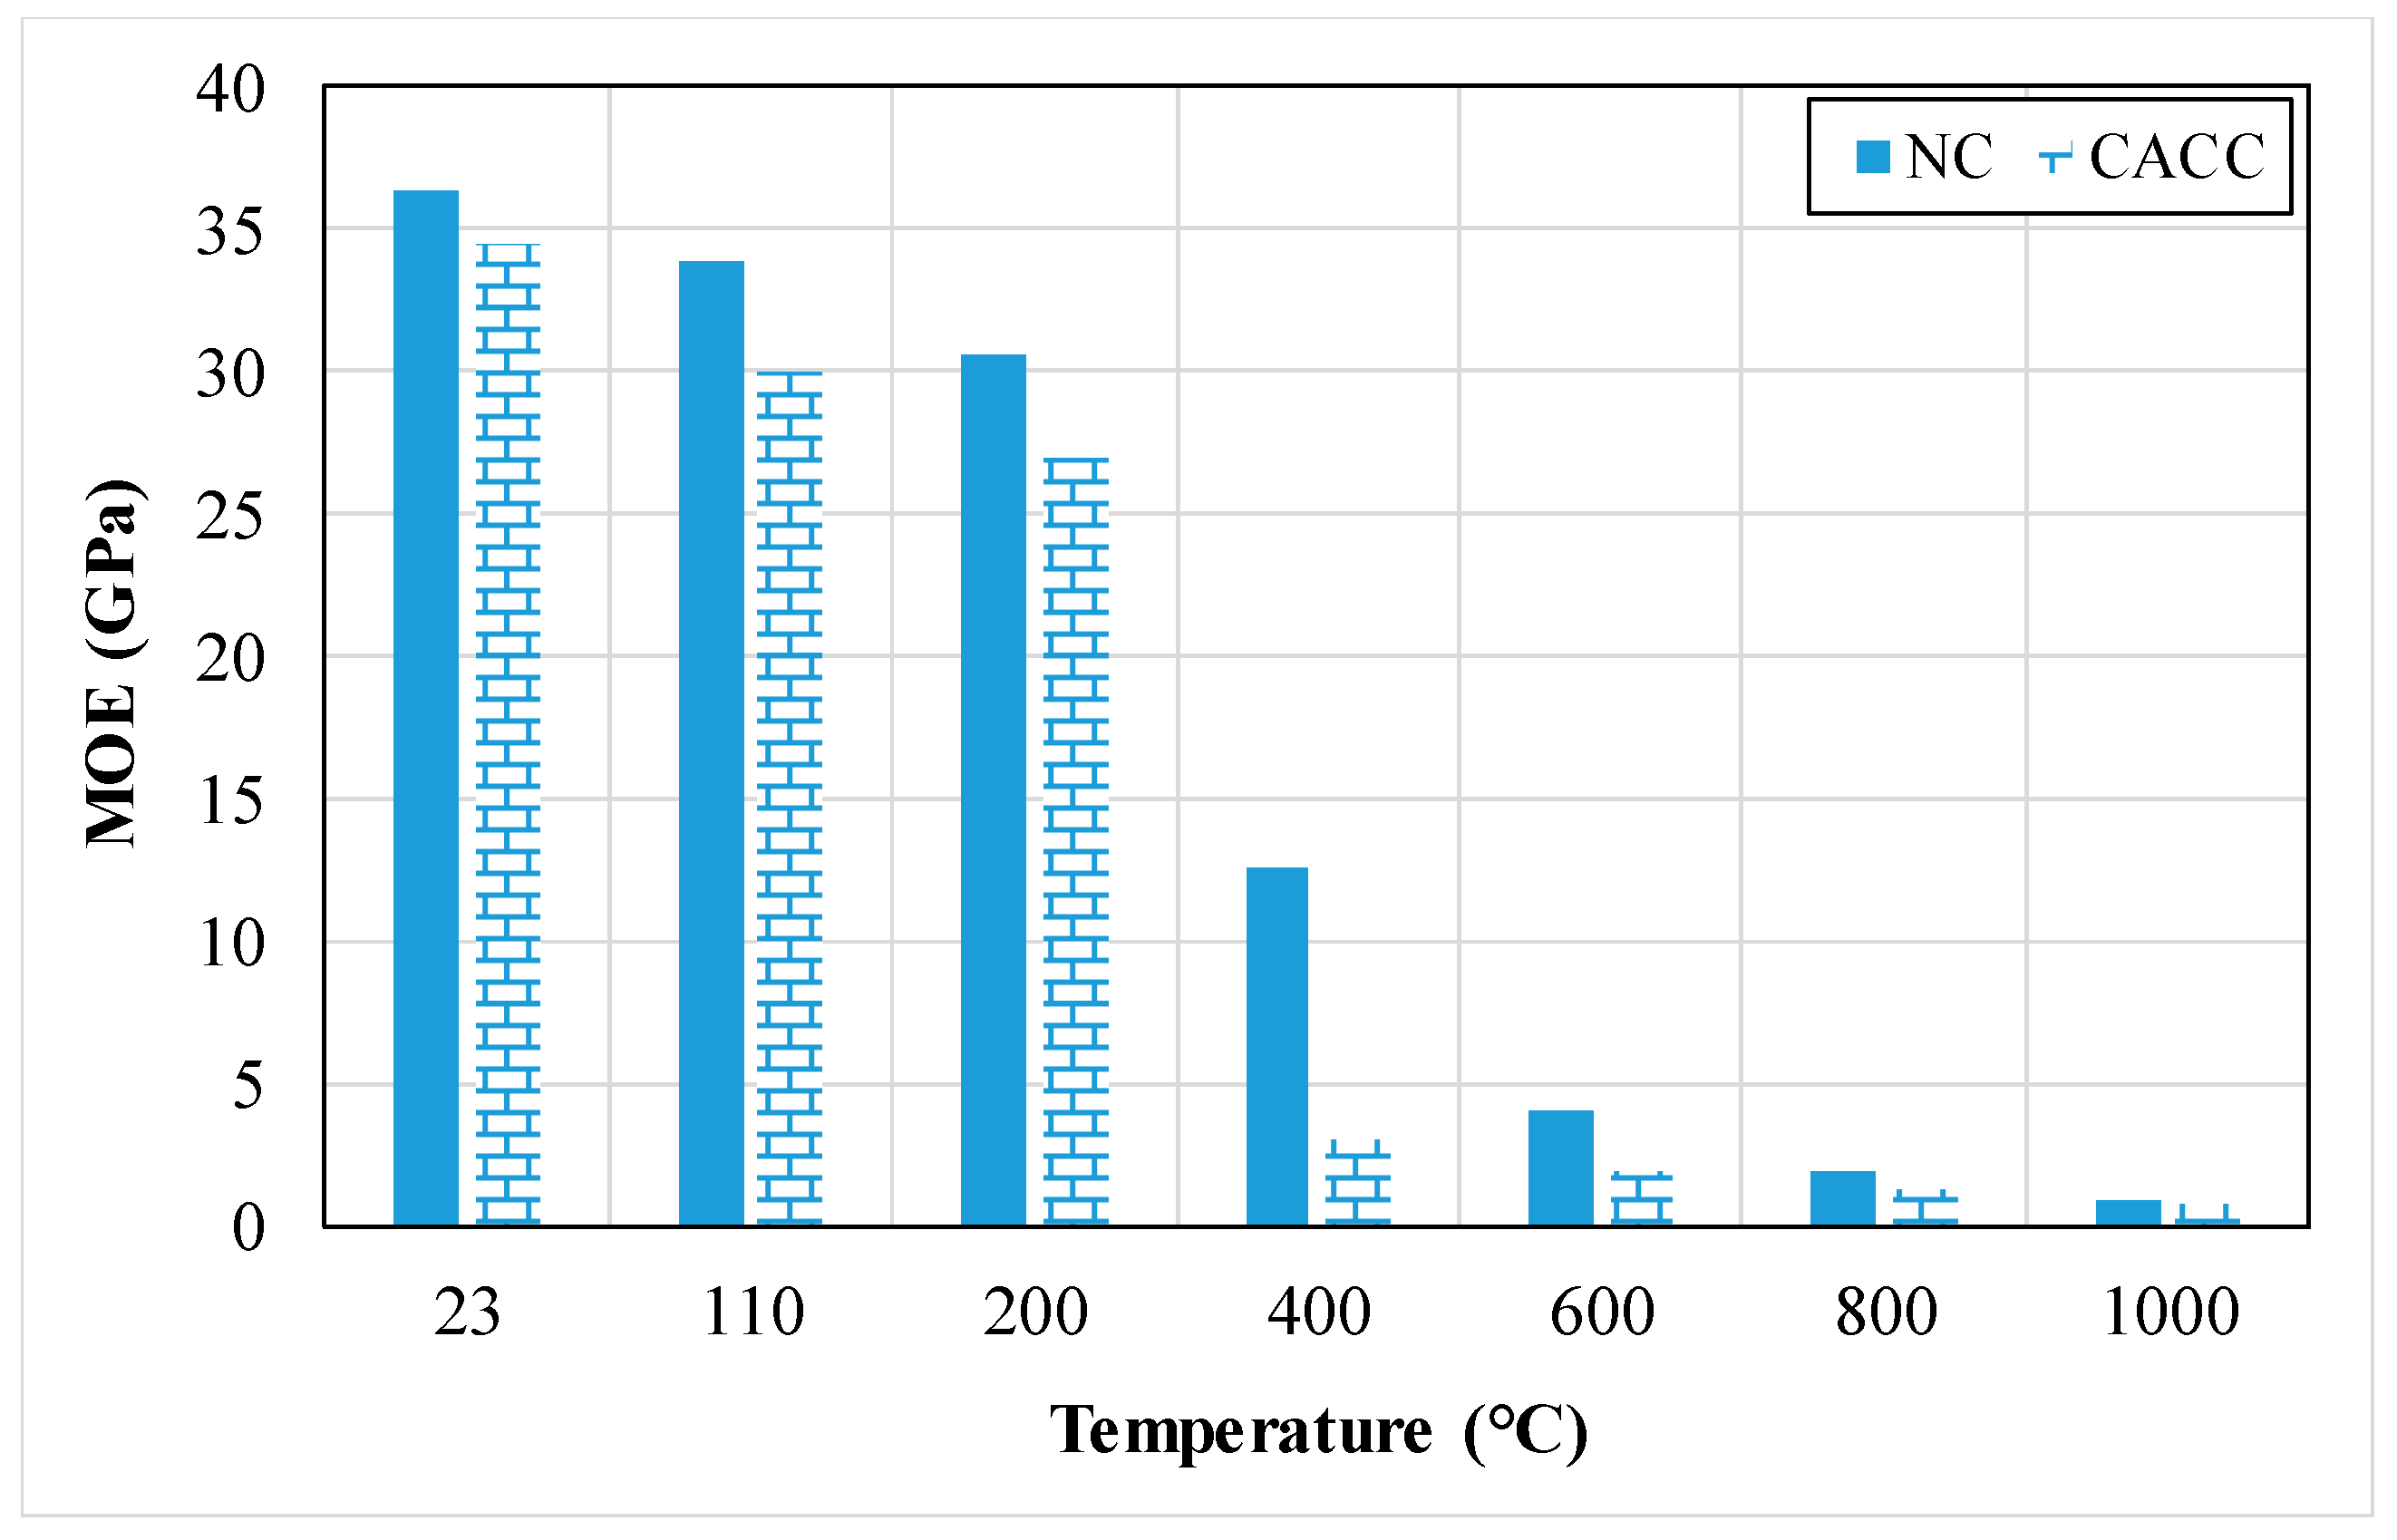
MOE is considered one of the most significant factors that affects the structural performance of concrete specimens [22]. Table 13 presents the MOE of different concrete mixes at different testing temperatures NC, CACC-S and CACC-H [22]. As displayed in Table 13, the MOE for all tested mixes increases with the increase in testing temperature. In addition to that, results of the experiment performed show that the behavior and performance of the two mixes containing CACC cured at standard and high temperatures are much superior to that containing NC at 600 °C of testing temperature [22]. Another study is conducted on two different mixes, NC and CACC at several testing temperatures in order to check the effect of this replacement on the values of MOE [25]. Figure 14 reveals the results of MOE of the two different concrete samples at different testing temperatures [25]. The results show that the MOE of concrete decreases with the increase in testing temperatures from 23 °C to 1000 °C for the two tested concrete mixes. Furthermore, the MOE of NC mix records values greater than that of the CACC mix at all testing temperatures ranging from 23 °C to 1000 °C. This can be highly related to the structure of calcium aluminate cement which can be considered a porous structure that leads to a reduction in the MOE of concrete [25].

3.1.7. Ultrasonic Pulse Velocity (UPV)

Nematzadeh et al. [23] performed a study on two different concrete mixes NC and CACC to check the UPV after immersing the specimens in sulfuric acid solution for several immersion days. A reduction in UPV values is observed in both samples, NC and CACC mixes, as the immersion days increase from 0 days to 63 days as shown in Table 14 [23]. This decrement, during the immersion time, reveals a decrease in the integrity of the materials in concrete specimens [23]. Comparing NC with CACC mixes, it can be shown that the UPV values for NC mixes are much higher than that of CACC mixes. Typically, the small content of calcium oxide, found in the composition of the cement of the specimens that are made of calcium aluminate cement exposed to acid attack, produces gradually and uniformly ettringite throughout the volume of the concrete specimen [23]. This is in contrast to the NC mix that contains a high amount of calcium oxide in its composition, which leads to the production of a considerable amount of ettringite in the early days of immersion. This results in the formation of a barrier at the external part of the concrete surface preventing by this the penetration of the acid into the concrete specimens where a compact core along with a weak external surface is created [23]. Koksal et al. [26] report the results of UPV of different mortar mixes, tested at 28 days, containing different constituents NC and CACC as shown in Figure 15. UPV testing is considered to be the most powerful non-destructive method used for assessing the quality of concrete or mortar [26]. As observed, NC mortar specimens record UPV values higher than that recorded by CACC mortar specimens [26] This can be related to the values reported by the compressive strength test where these two properties are considered to be highly related. As the temperature increases from 20 °C to 600 °C, the UPV is reduced for both tested mixes, NC and CACC mortar specimens [26]. The change in UPV can be related to the degradation of C-S-H gel that leads to the increase in the content of air void in the specimens and thus leading to the reduction in the rate of the sound waves passing through the mortar specimens [26].

3.1.8. Shrinkage

Kudžma et al. [67] report the results of concrete shrinkage of two different concrete mixes containing different materials. The first mix is NC, while the second mix is CACC [67]. As the temperature increases from 110 °C to 1000 °C, the concrete shrinkage of both tested mixes NC and CACC becomes higher. Regarding the concrete shrinkage of CACC in comparison with NC at the same tested temperatures, the CACC mix records a value greater than the NC mix at 110 °C; however, as the temperature increases from 110 °C to 1000 °C, mix containing CAC records shrinkage values below the mix containing cement [67]. The heating of samples and the increase in temperature values lead to a dehydration process that is followed by the free removal of water from concrete specimens resulting in dissociation of the hydrates where polymorphic transitions take place and new phases are formed [67]. Figure 16 displays the results of both concrete mixes, NC and CACC, with respect to different tested temperatures [67].

3.1.9. Variation in Weight

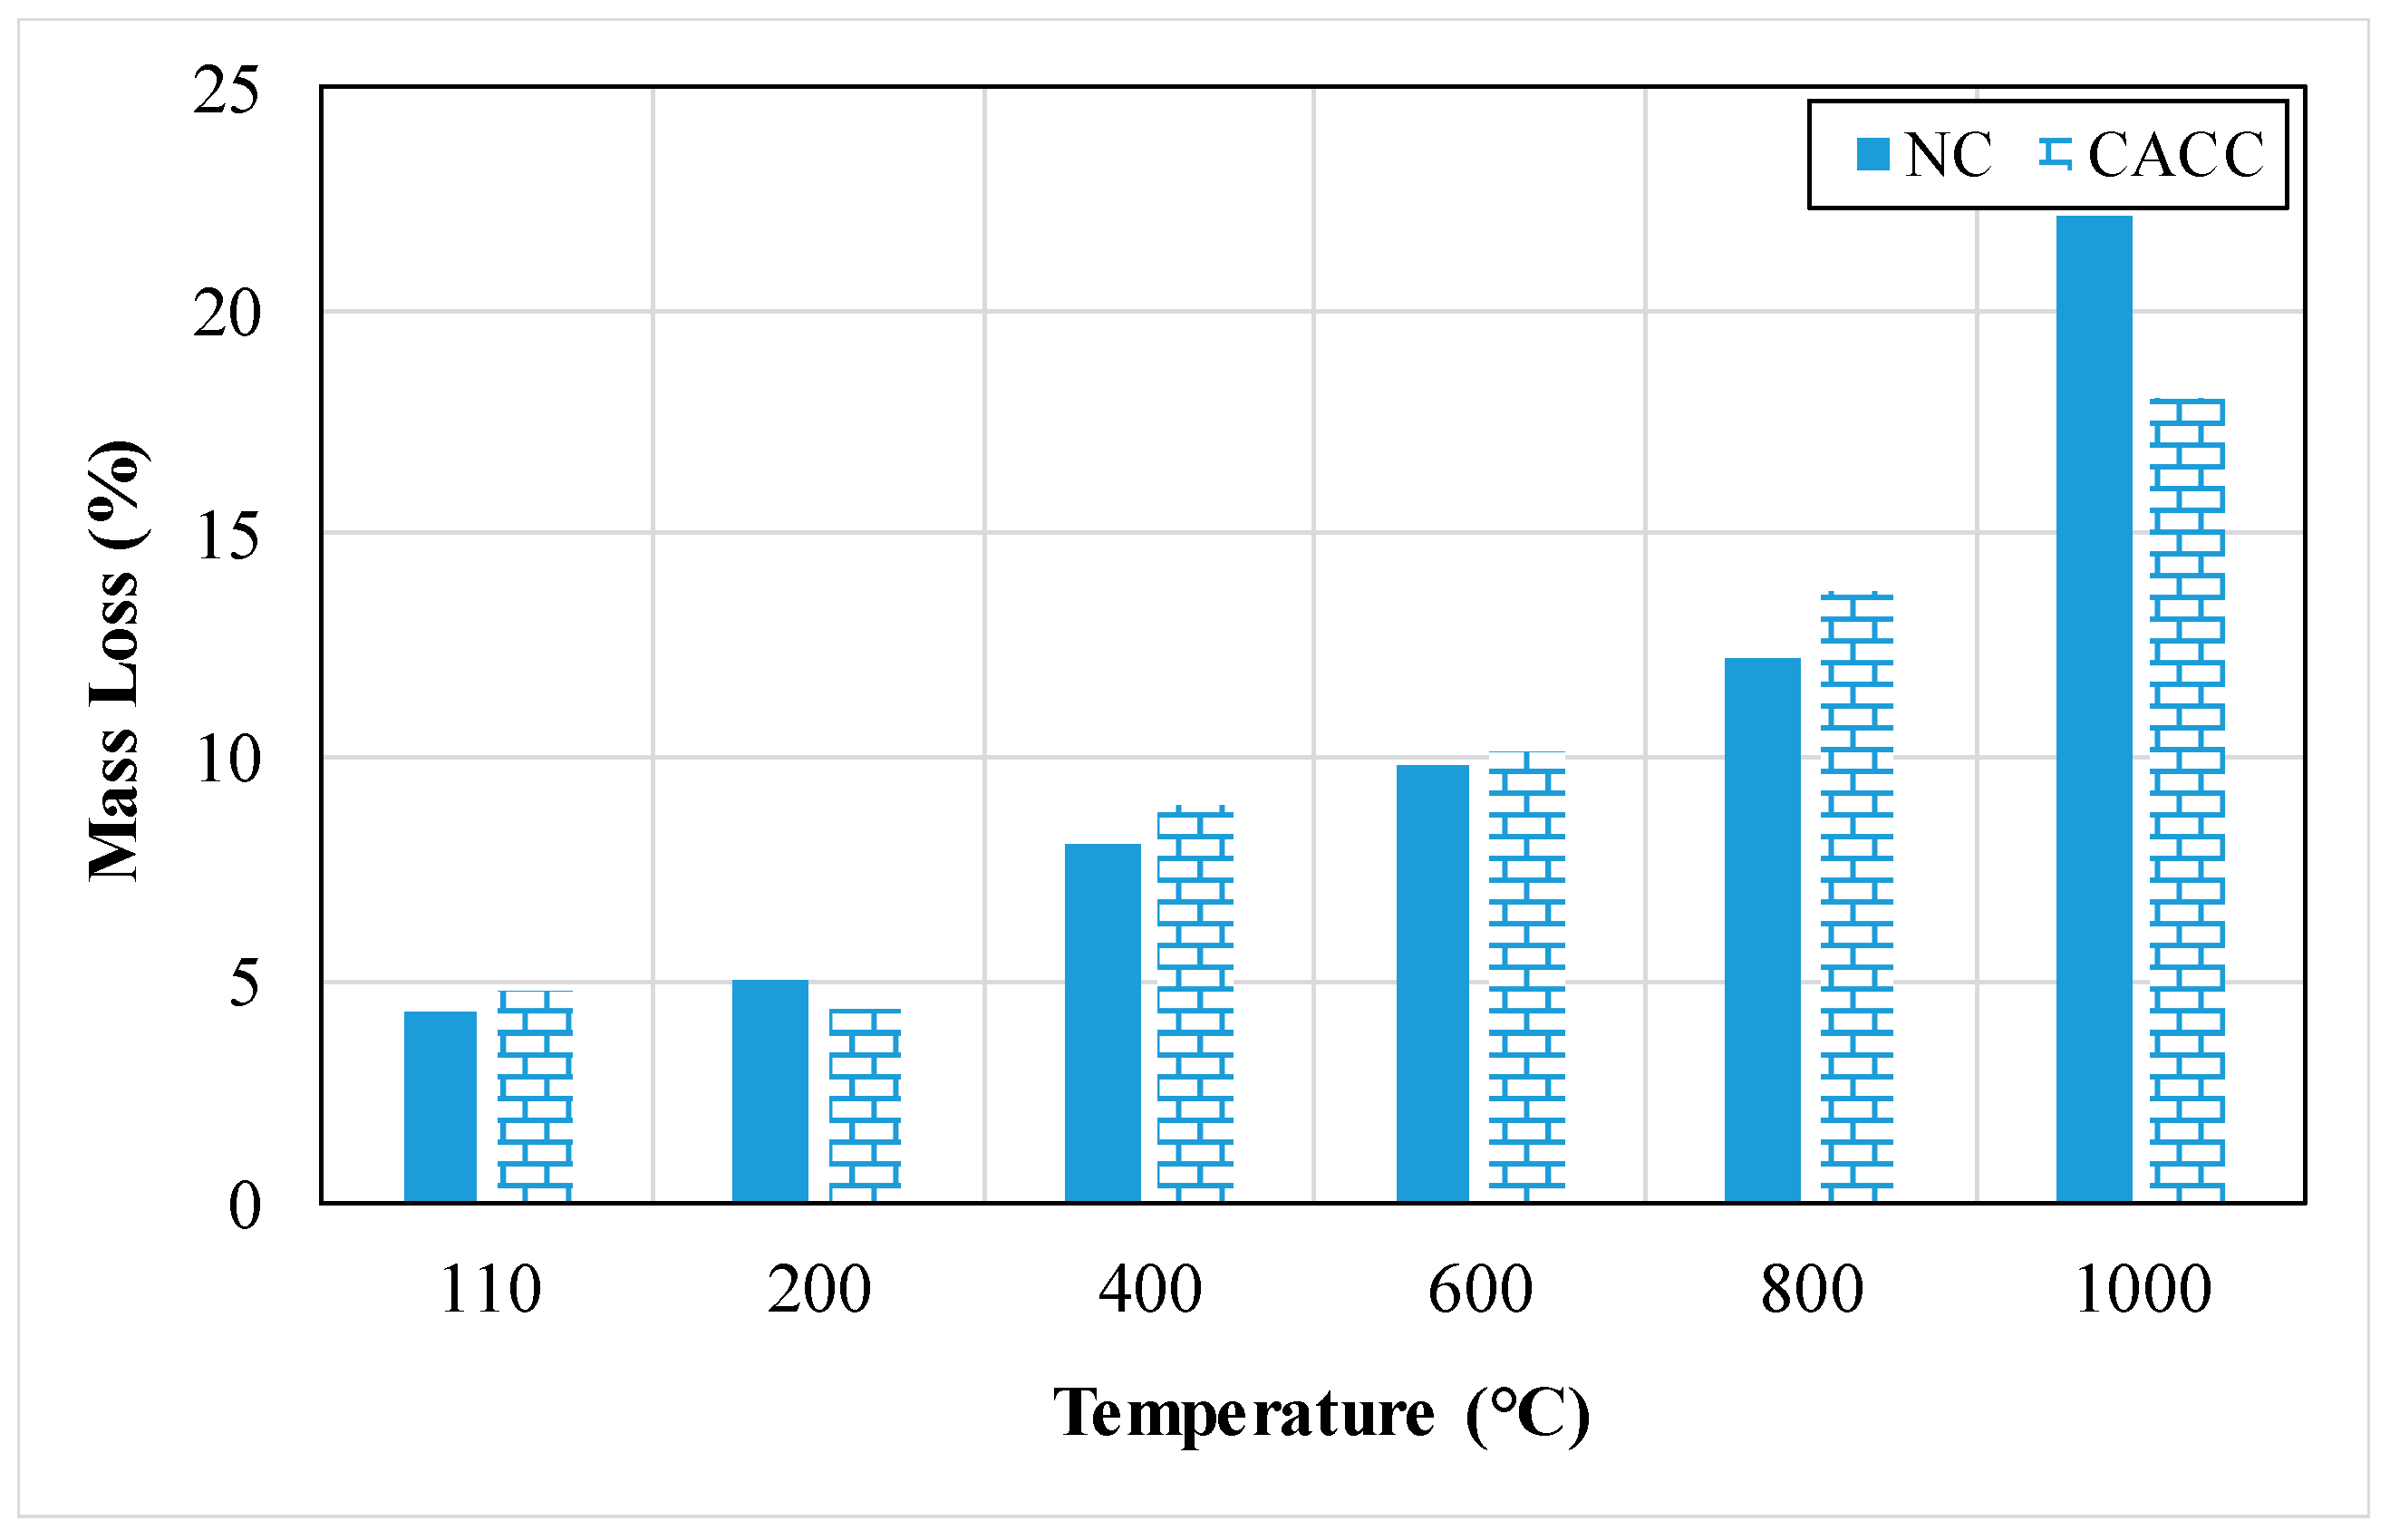
Two different mixes, NC and CACC, are exposed and immersed in the sulfuric acid solution where the weight of specimens is recorded at different immersion days [23]. Table 15 shows the difference in weight for the two different specimens, NC and CACC on different immersion days. As shown, an increase in the weight of both tested specimens, NC and CACC, is recorded until 7 days of immersion in sulfuric acid solution and then a decrease is reported as the immersion time increases from 7 to 63 days [23]. This can be related to the formation of gypsum inside the specimens until the first 7 days of immersion in the sulfuric acid solution, then the variation in weight after 7 days of immersion can be due to the occurrence of corrosion at the surface of specimens contributing to a decrease in the weight of both tested specimens, NC and CACC mixes [23]. Regarding the comparison between NC and CACC mixes, the weight for CACC mixes is lower than that for NC mixes [23]. The proper performance and efficiency in mixes containing CACC against the corrosion at the concrete surface lead to the formation of a very small amount of ettringite resulting in the formation of a less loose layer contributing to a smaller loss of weight [23]. Baradaran-Nasiri and Nematzadeh [25] performed an experiment to calculate the weight loss of different specimens after being measured before and after exposure to the different elevated temperatures. The weight loss percentages of the NC mix and CACC mix are shown in Figure 17 [25]. The results show that as the testing temperature increases from 110 °C to 1000 °C, the percentage of weight loss increases [25]. This can be related to the deterioration of the structural integrity of the concrete specimens at elevated temperatures that is also verified by the propagation of cracks observed on the concrete specimens [25]. In addition to that, by comparing NC with CACC mixes, results show that the incorporation of calcium aluminate cement as normal cement replacement does not have a large impact on the variation of weight loss percentage of concrete specimens exposed to fire or elevated temperatures [25].

3.1.10. Water Absorption

The results of water absorption of two different mortar mixes containing different types of cement and exposed to different testing temperatures ranging from 20 °C to 1100 °C are presented in Figure 18 [21,26]. Both mortar mixes, NC and CACC, undergo an increase in water absorption percentage up to 600 °C and then a decrease in the percentage of water absorption with the increase in testing temperature from 600 °C to 1100 °C [21]. However, at all testing temperatures ranging from room temperature (20 °C) to 1100 °C, CACC mixes record percentages of water absorption that are lower than NC mixes [21]. Also, as shown in Figure 18, the percentage of water absorption for both mixes, NC and CACC, becomes higher as the testing temperature increases from 20 °C to 600 °C [26]. Moreover, comparing NC with CACC mixes, the percentage of water absorption of CACC mixes records lower values from that of NC mixes at 20 °C and 300 °C. However, comparing the percentage of water absorption of the NC mix to CACC mix at 600 °C, it can be noted that the percentage of water absorption of CACC mixes becomes higher than that for NC mixes [26]. This can be related to the compressive strength where a high compressive strength is associated with a low water absorption percentage [26].

3.1.11. Porosity

The percentages of porosity of two concrete mixes containing unlike cement types are presented in Table 16 [25]. The primary mix is the NC, while the second mix is the CACC [25]. As shown in Table 16, the NC mix records a porosity percentage above that recorded by the CACC mix. However, the difference between the two percentages is too small. So, it can be concluded that the quality of concrete containing CACC is too close to that containing NC [25]. Another study was conducted on mortar mixtures to study the effect of using CACC instead of NC on the percentage of porosity and results are displayed in Figure 19 [26]. The percentage of porosity of the NC mix is slightly higher than that of the CACC mix at 20 °C and 300 °C; however, at 600 °C temperature, the percentage of porosity of the CACC mix becomes higher than that of the NC mix [26]. The enhancement in porosity for CACC specimens is lower than that of NC specimens at ambient temperatures. Also, it can be concluded that high compressive strength is associated with low percentage of porosity revealing a high correlation between both tested properties [26].

3.1.12. Damage Level

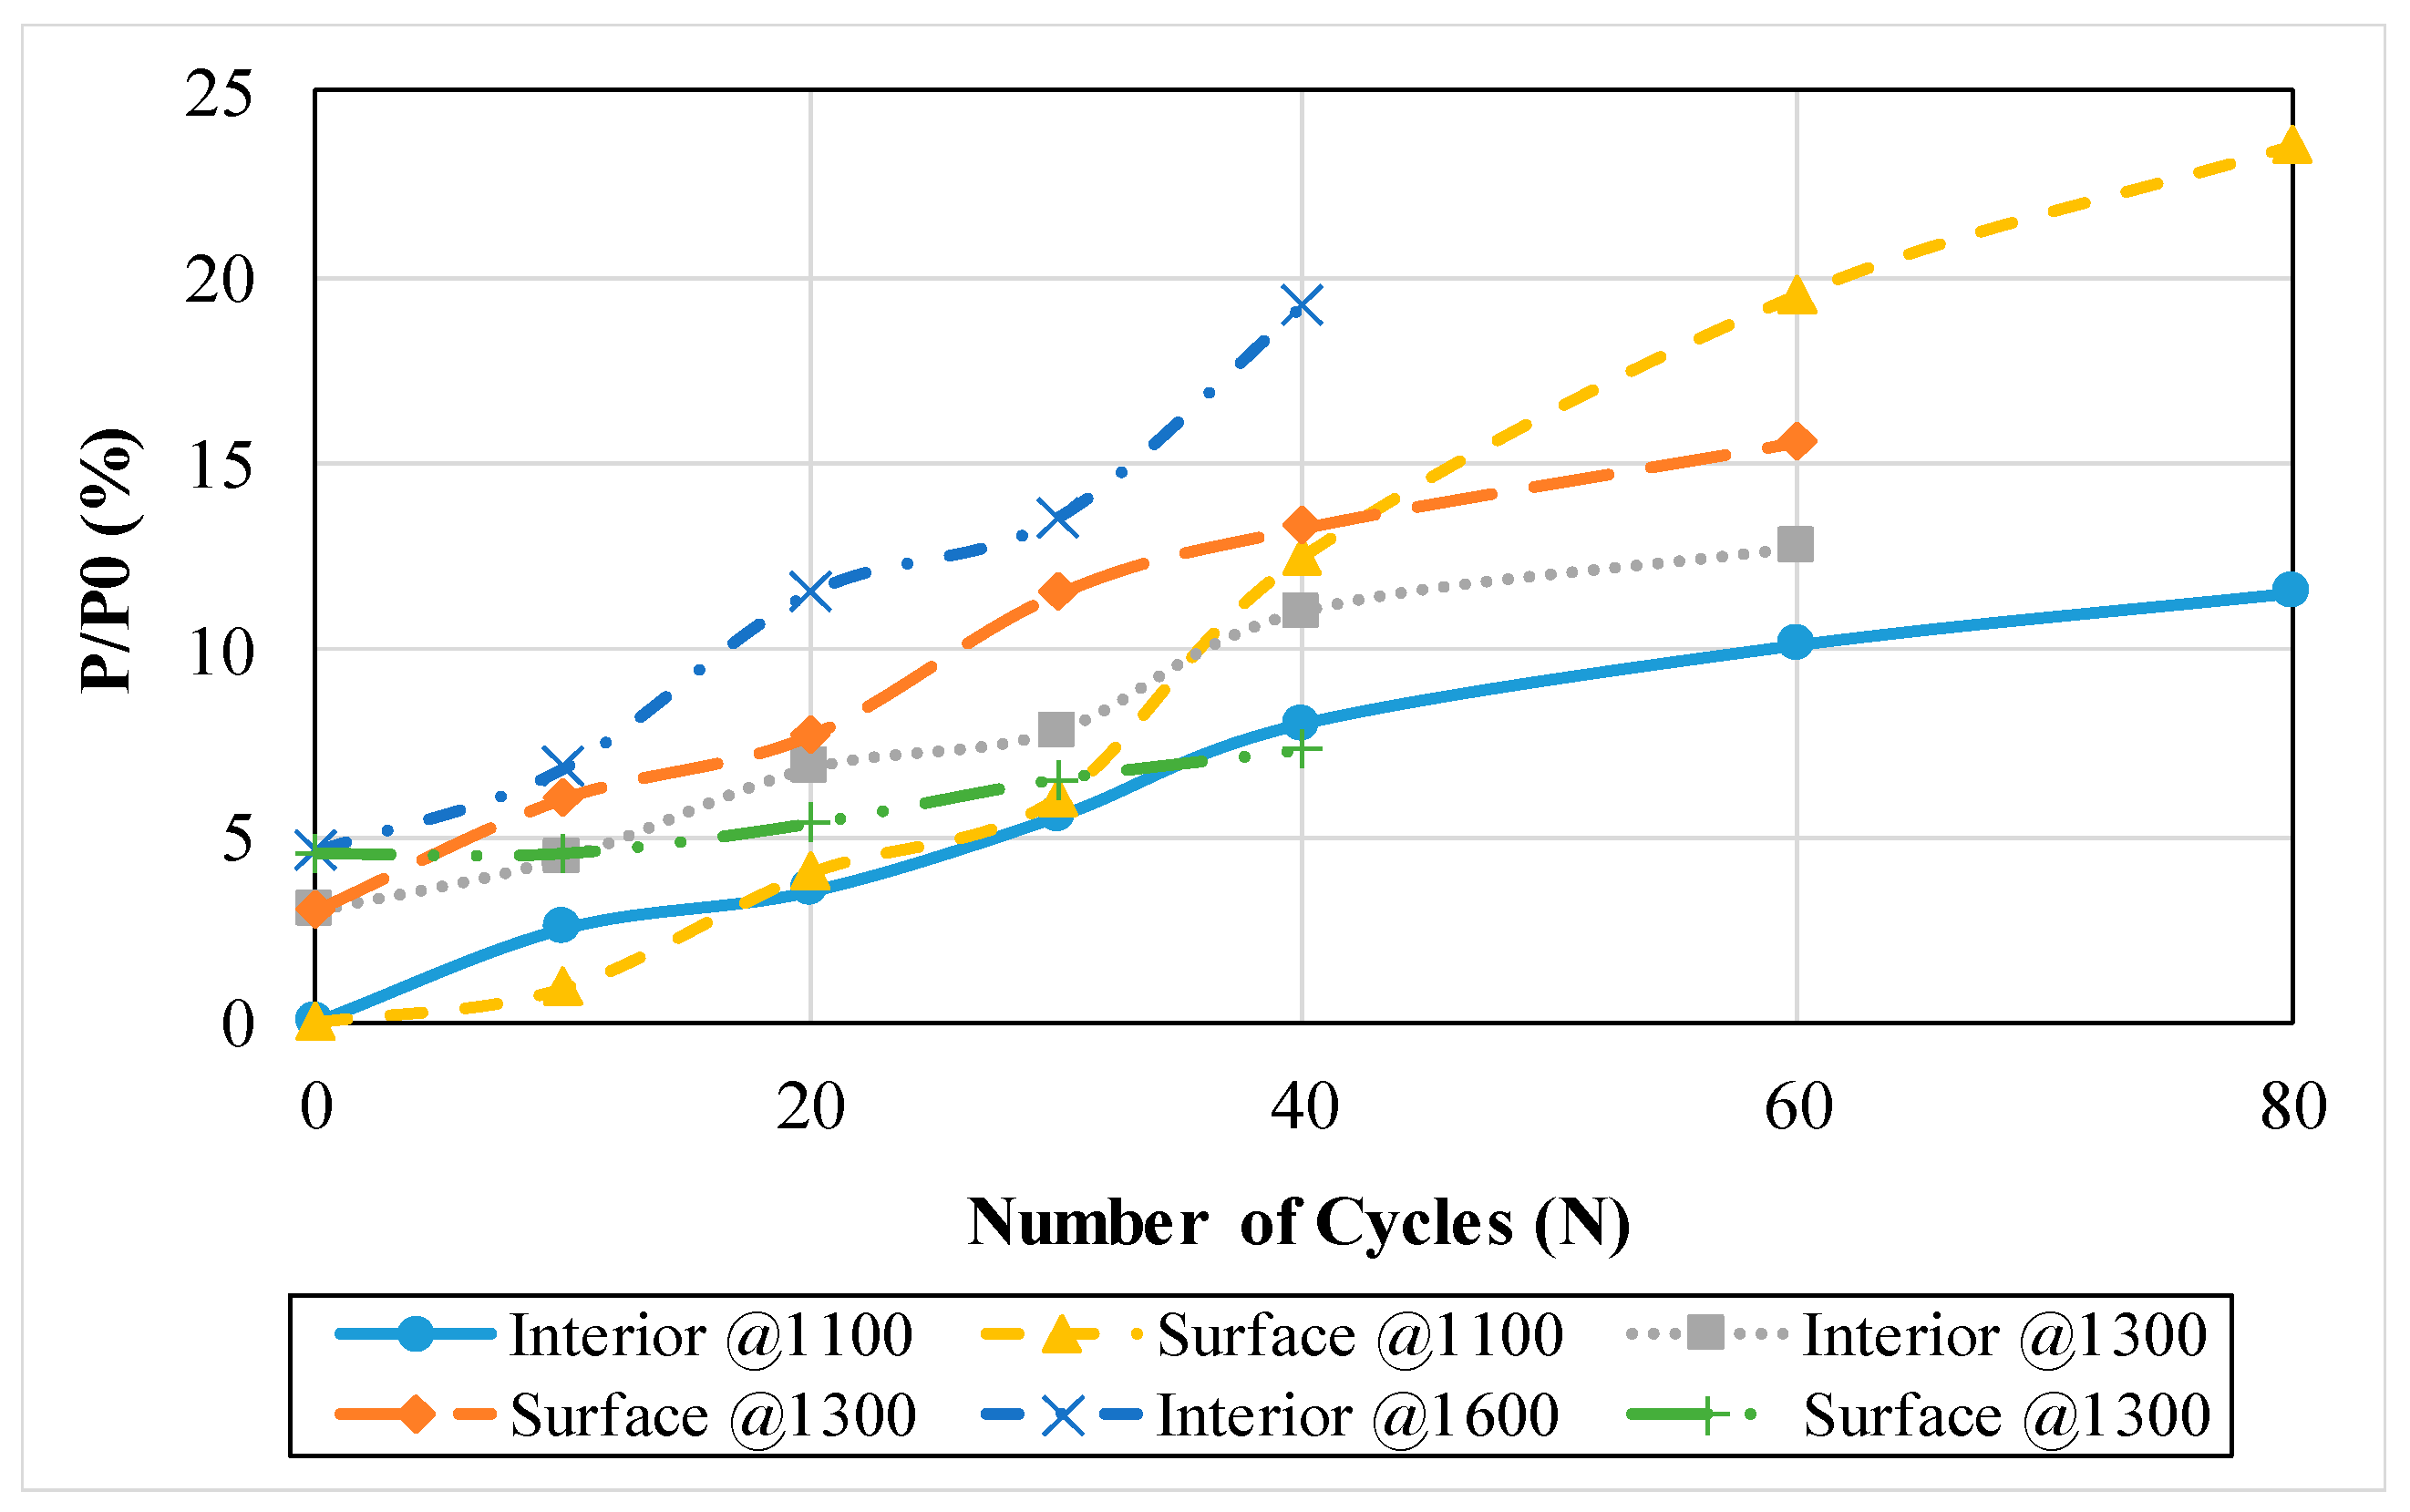
Figure 20 shows the damage level for concrete specimens containing high alumina at different testing temperatures for several numbers of cycles at the surface and interior part of the concrete specimens [35]. Results show that the samples that are sintered at 1300 °C record higher degradation levels at the surface and interior part of the concrete specimens when being compared to specimens that are sintered at 1100 °C [35]. Also, the degradation level at the surface of the samples that are sintered at 1300 °C shows the same trend for that sintered at 1100 °C where the degradation level shows a rising trend at the surface faster than that happening inside the concrete samples [35]. However, it is shown that regarding the samples being sintered at 1600 °C, the behavior is totally different than the samples sintered at 1100 °C and 1300 °C. These samples show lower thermal stability while samples sintered at 1300 °C display good behavior in the thermal shock and an excellent thermal stability [35].

3.1.13. Thermal Conductivity

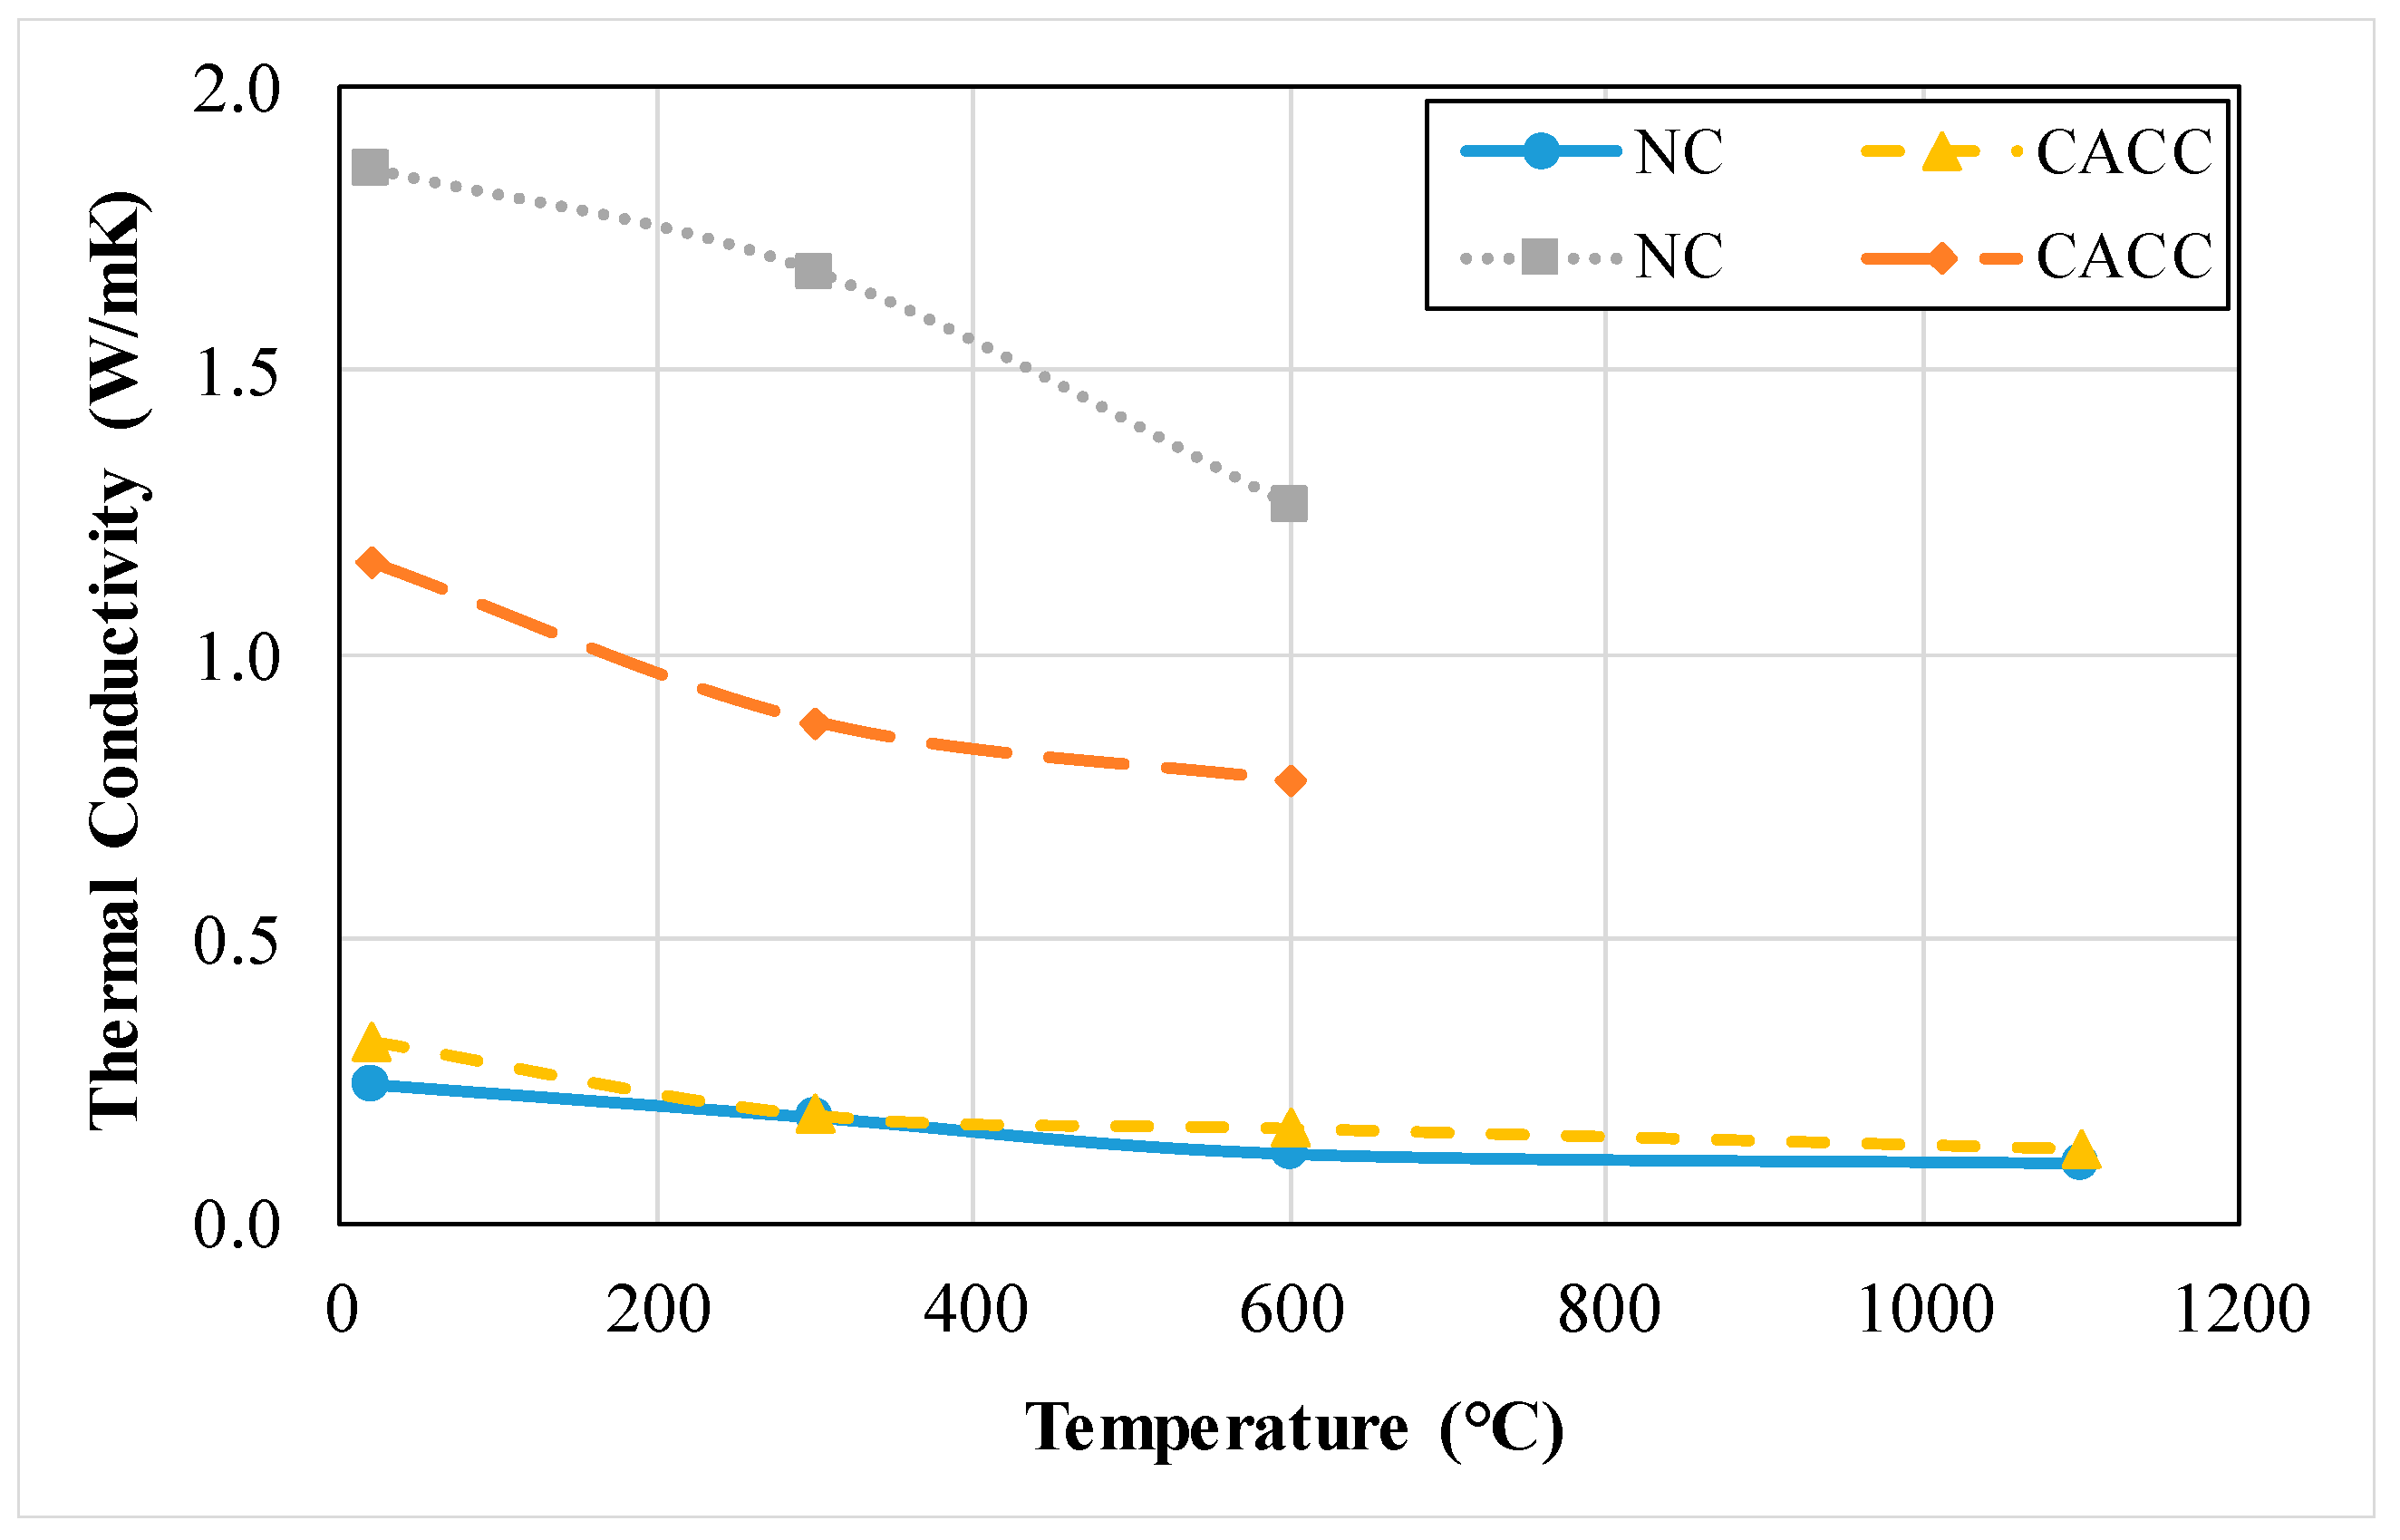
A study was conducted by Koksal et al. [21] about the thermal conductivity test and the results of two different mortars containing different types of cement are presented in Figure 21. The first mix is NC and the second mix is CACC [21]. Results show that as the testing temperature increases from 20 to 1100 °C, the thermal conductivity values increase from 0.242 to 0.106 W/mK and from 0.320 to 0.131 W/mK for NC and CACC mixes, respectively. Also, the values for thermal conductivity test at the same tested temperatures show higher values for the CACC mix than that of the NC mix [21]. Another study is also performed by Koksal et al. [26] regarding the thermal conductivity of mortars containing NC and CACC. The test is performed at 28 days where the specimens are subjected to different temperatures ranging from 20 to 600 °C and the results are displayed in Figure 21 [26]. According to the results, mixes containing CACC record lower thermal conductivity values than those observed for mixes containing NC. This can be related to the fact that mixes with CACC have a more compact and dense structure than NC mixes leading to less thermal conductivity values [26]. The reduction in thermal conductivity values is less for CACC mixes than that of NC mixes. This can mean that the damage in the structure of CACC mixes occurring is less than the damage in the structure of NC mixes [26].

3.2. Properties of Refractory Concrete Containing Refractory Materials as Aggregate Replacement

3.2.1. Slump

Baradaran-Nasiri and Nematzadeh [25] conducted a study on the use of refractory recycled brick aggregates to replace natural fine aggregates in concrete mixes in a percentage ranging from 0 to 100%. Table 17 shows the results of slump for the different concrete mixes. As shown, the slump value for the control mix recorded is the highest one, also, it is observed that as the percentage of refractory recycled brick aggregates increases in the mix from 25% to 100% replacement of fine aggregates, the slump decreases from 70 mm to 55 mm [25]. The workability of concrete samples containing different types of aggregates including perlite and vermiculite to replace aggregates in concrete mix is shown in Table 18 [24]. The control mix containing natural aggregate is denoted by NC, while the mixes containing perlite and vermiculite as aggregate replacement are denoted by NC-P and NC-V, respectively. Results show that the workability of the NC mix is higher than that of NC-P and NC-V. This can be related to the fact that perlite and vermiculite are drier due to the increase in porosity and the higher and greater requirement of water in NC-P and NC-V mixes [24].

3.2.2. Dry Unit Weight or Density

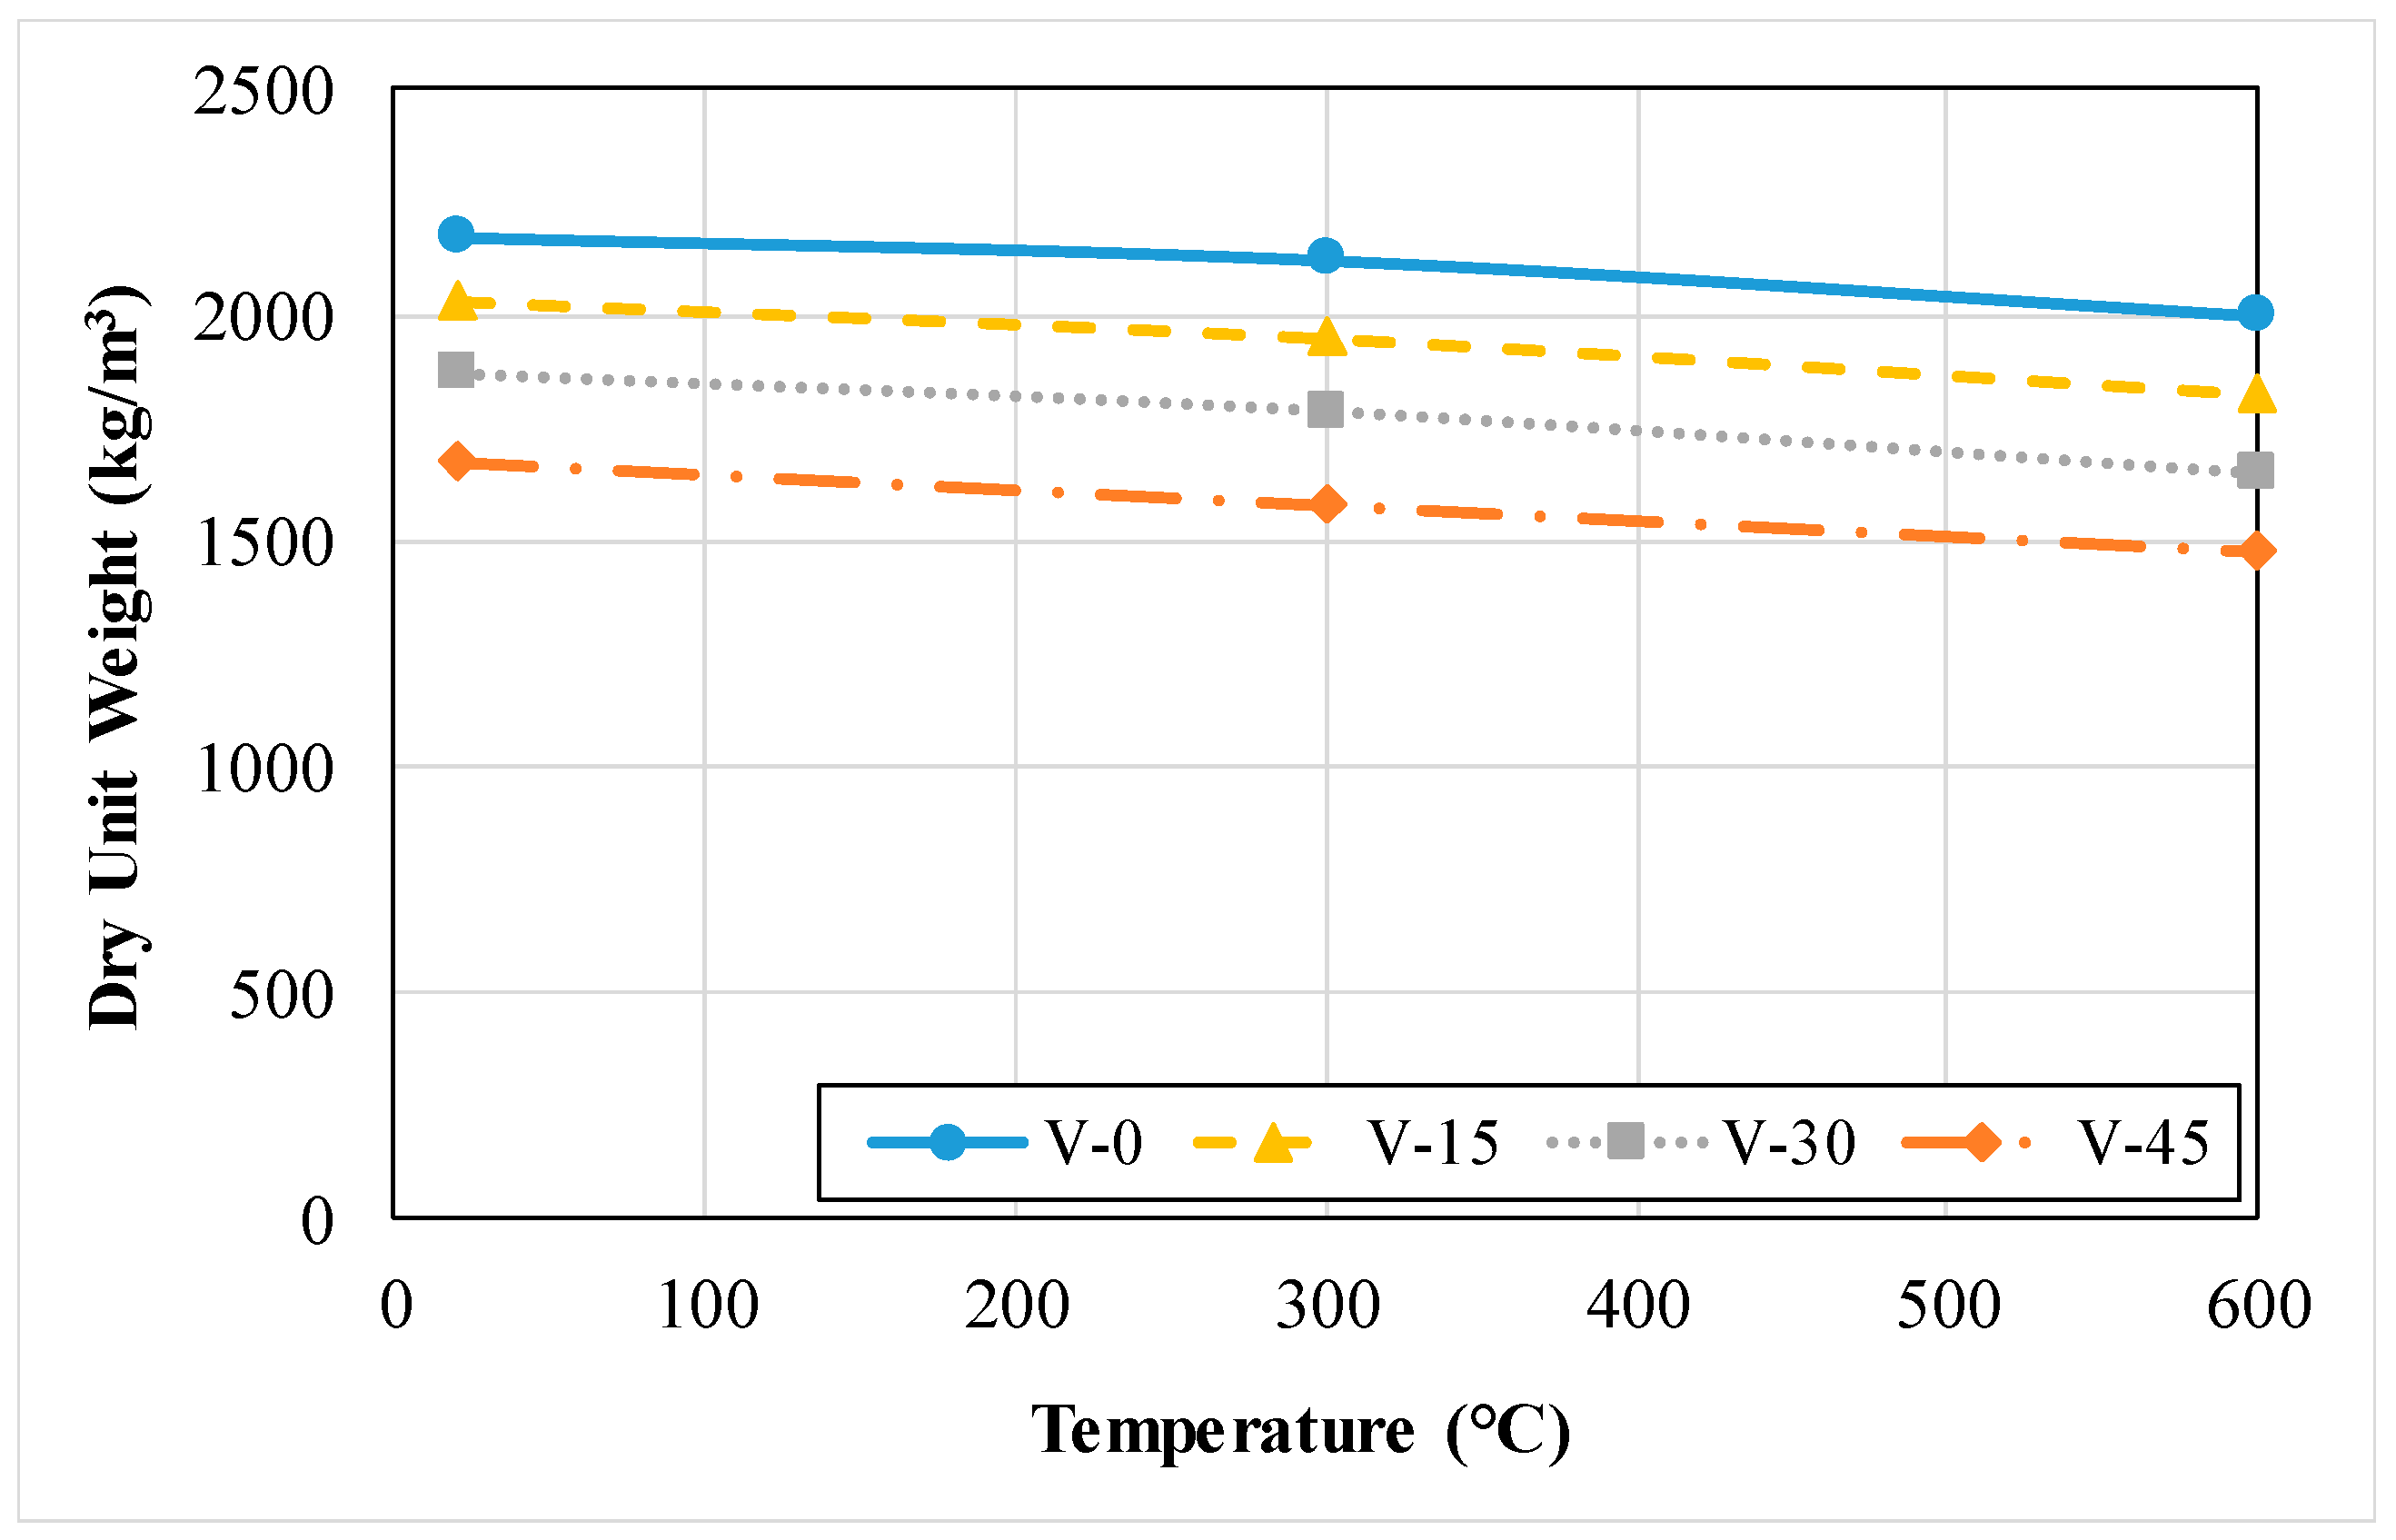
The results for the dry unit weight of mortar specimens at 28 days exposed to different temperatures ranging between 20 °C to 600 °C and containing expanded vermiculite as fine aggregate replacement are presented in Figure 22 [26]. All mixes, despite the materials used in the production of the mortar specimen, exhibit a decreasing trend with the increase in the temperature. In addition to that, the dry unit weight for control mix records the highest dry unit weight value; however, as the percentage of expanded vermiculite increases from 0 to 45%, the dry unit weight decreases. This reduction can be due to the low specific gravity of the expanded vermiculite used in comparison with the natural sand where also more water is needed [26].

3.2.3. Compressive Strength

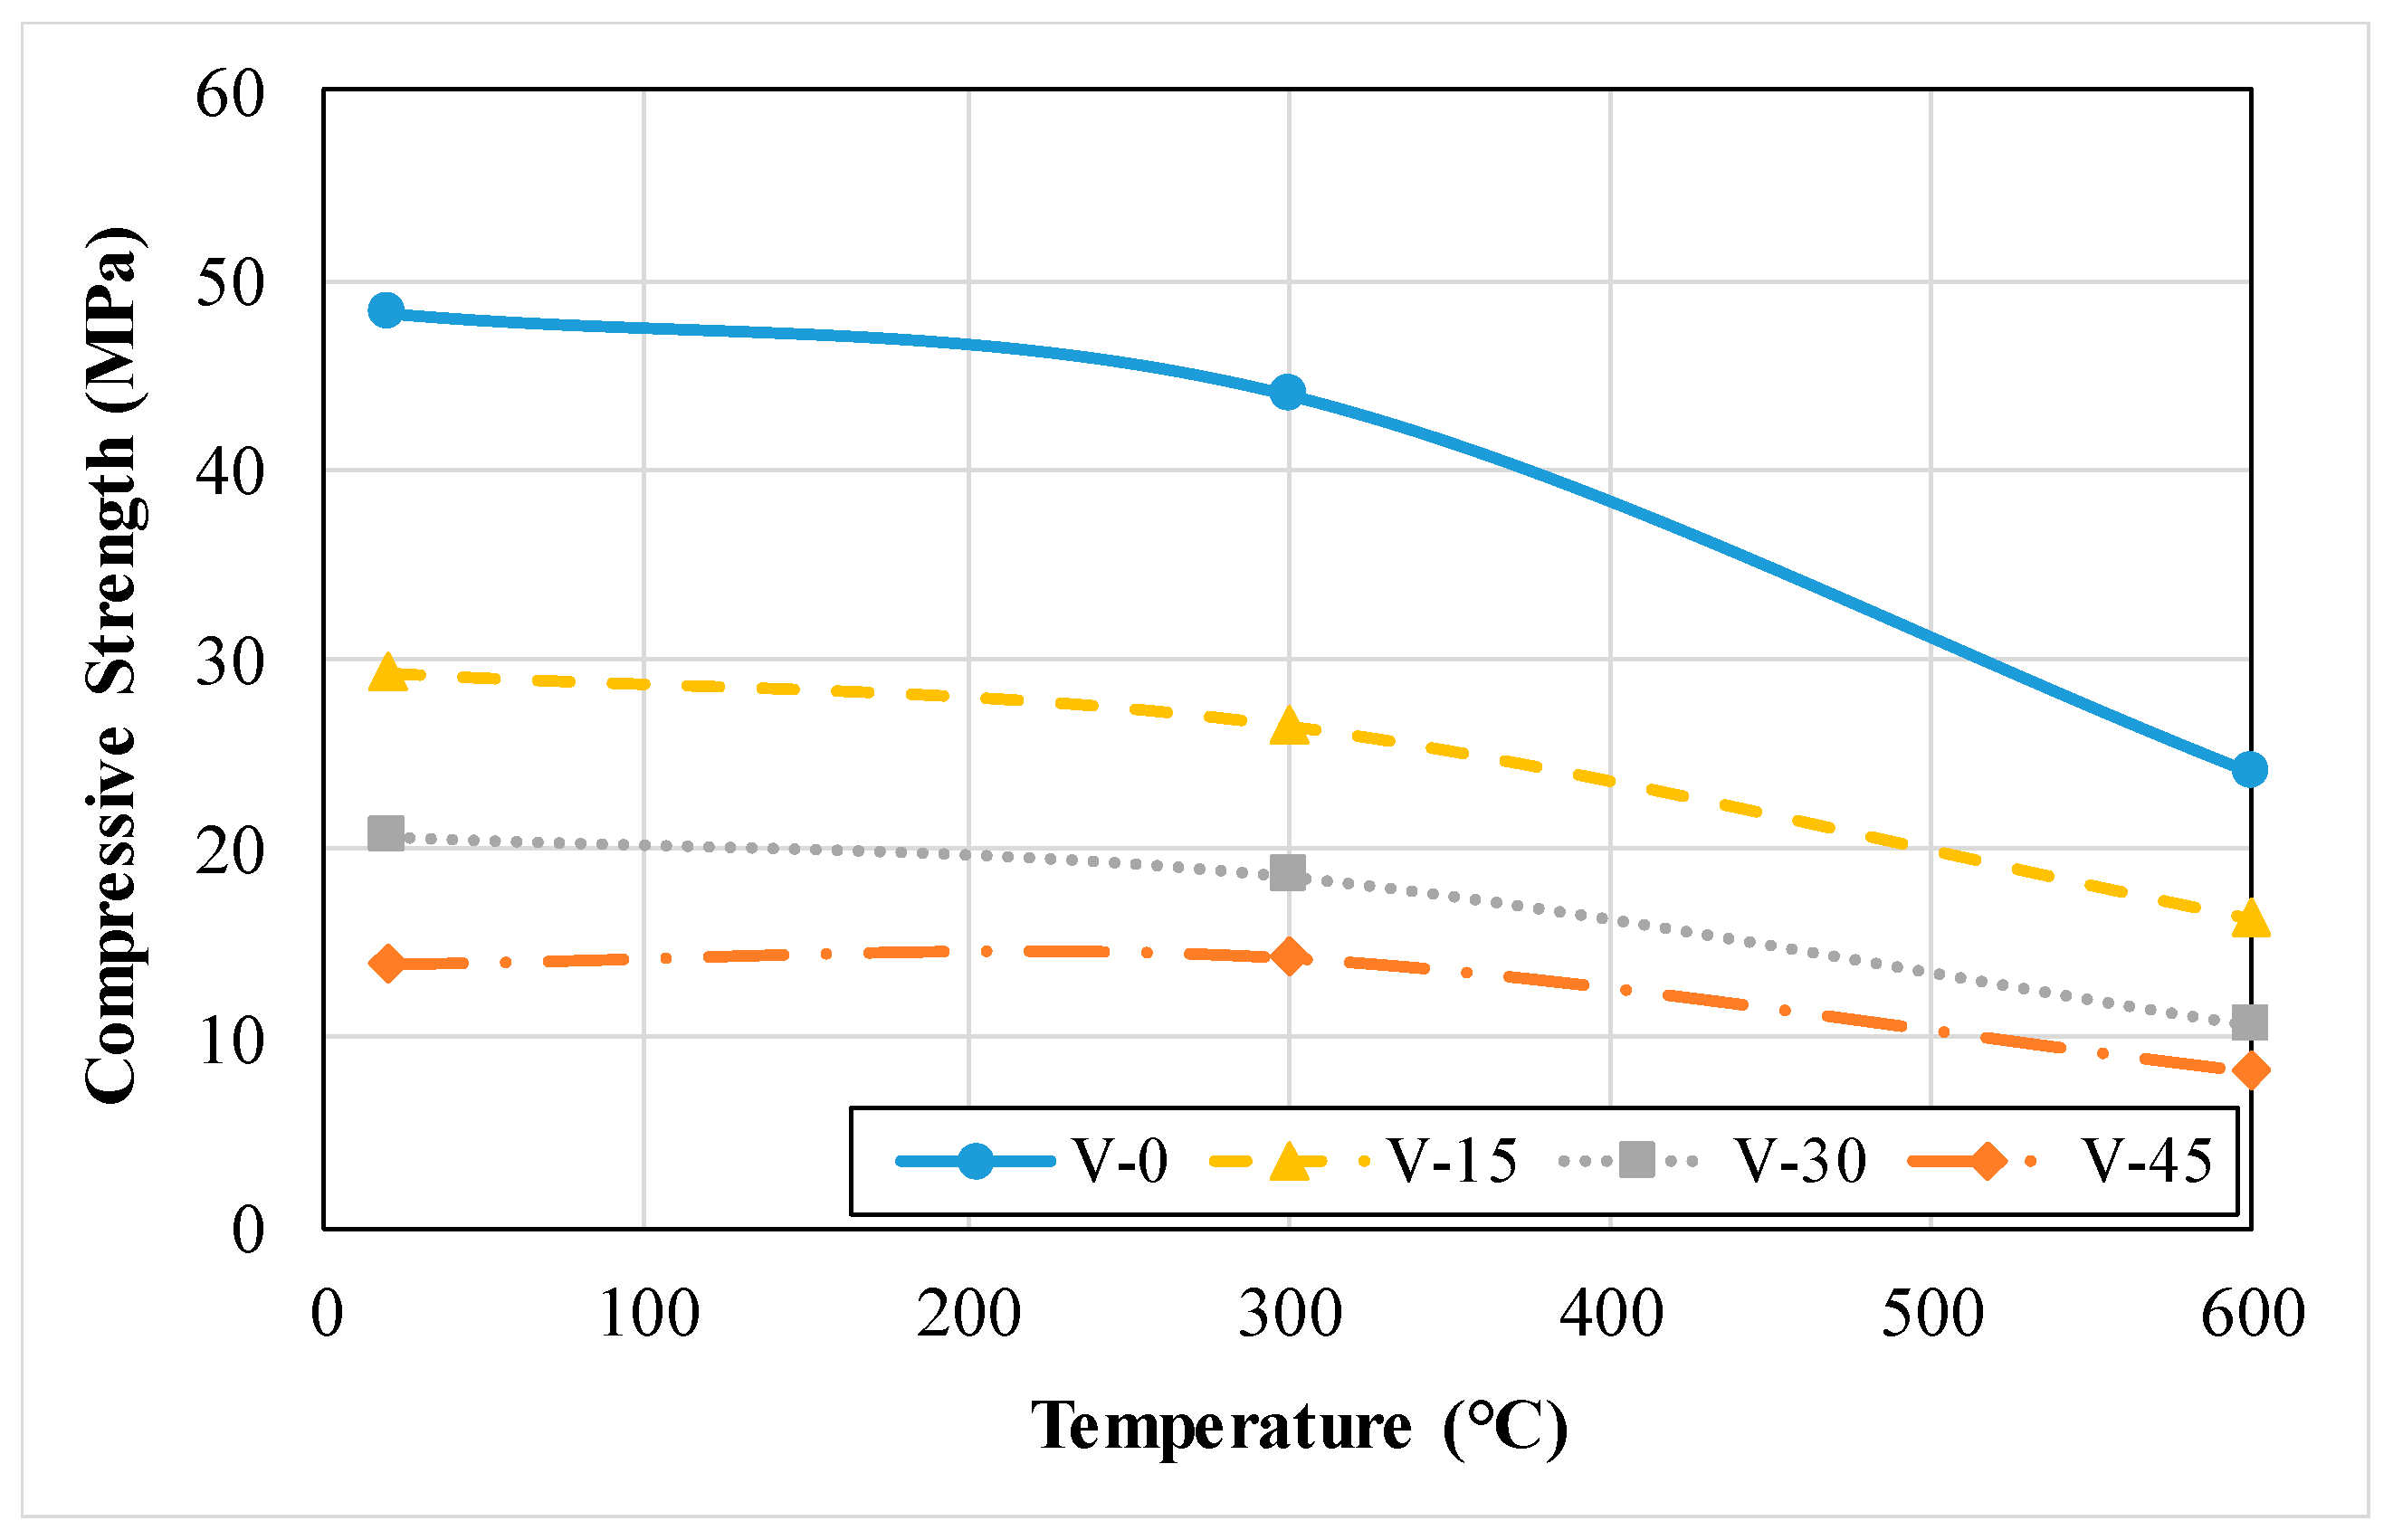
The results for compressive strength test for mortar specimens at 28 days containing expanded vermiculite as aggregate replacement are presented in Figure 23 [26]. It is observed that the compressive strength is reduced as the temperature increases from 20 °C to 600 °C for all tested mixes whatever the percentage of expanded vermiculite is. In addition to that, the compressive strength is highly affected by the incorporation of the expanded vermiculite where it decreases with the increase in expanded vermiculite percentage [26]. This reduction in the compressive strength results is attributed to the decrease in the unit weight and the increase in the porosity percentage. Also, a greater water demand is required for mixes containing expanded vermiculite leading to the production of a dry blend after the hydration process is accomplished resulting in the reduction in compressive strength results [26].

3.2.4. Flexural Strength

The flexural strength results for mortar specimens at 28 days containing different percentages of expanded vermiculite as aggregate replacement exposed to different temperatures in a range of 20 to 600 °C are displayed in Figure 24 [26]. The highest flexural strength is recorded by mix that contains 0% expanded vermiculite. The addition of expanded vermiculite and the increase in the percentage from 0 to 45% as aggregate replacement result in a decrease in the flexural strength value for mortar mixes. This decrease can be due to the increase in the water demand and the porosity of mixes containing expanded vermiculite.

3.2.5. Ultrasonic Pulse Velocity (UPV) and Modulus of Elasticity (MOE)

UPV test is performed to check the quality of concrete and its homogeneity. UPV values, for two different mixes where the first mix is the NC and the other mix contains recycled refractory brick aggregates as natural aggregate replacement and is denoted by RB, are shown in Figure 25 [68]. Results show that the UPV is reduced with the increase in the temperature for all mixes despite the type of aggregates used. Also, there is a slight difference between NC and RB values at the same tested temperatures where NC specimens record better values than RB specimens [68]. The reduction in UPV values can be due to the variation in chemical composition of the hydration process after the evaporation of bound water. This can result in increasing the pore volume leading to crack formation [68]. The MOE of concrete specimens, one made up of NC and the second made up of RB, is presented also in Figure 25 [68]. The control mix records higher MOE values than mix containing recycled refractory brick aggregates. Also, a decrease in the values of MOE is observed in the two mixes with the increase in temperature from 20 °C to 800 °C [68]. This can be attributed to the microstructure disintegration of the aggregates used and the cement paste leading to the deterioration of the chemical and physical properties of the concrete exposed to high temperatures. Also, the transformation of the C-S-H gel results in the formation of a loose matrix that leads to the loss of MOE in the concrete specimens [68].

3.2.6. Variation of Weight

The percentages of loss of weight of concrete specimens containing different percentages of recycled refractory brick aggregate ranging from 0 to 100% of natural fine aggregate replacement as function of temperature ranging between 23 to 1000 °C are presented in Figure 26 [25]. Results indicate that the percentage of weight loss is approximately similar in all tested specimens despite the constituents and materials used in its production. However, at 800 and 1000 °C temperatures, the results show an exceptional behavior that can be related to the high resistance and stiffness of the brick aggregates used and due to their refractoriness at very high temperatures. Thus, concrete specimens containing recycled refractory brick aggregates record a lower percentage of weight loss than those containing natural fine aggregates [25]. In addition to that, the large increase that occurs at a temperature of 1000 °C in the percentage of weight loss can be due to the disappearance in the chemical bonds of specimens and change in the structure and nature of the aggregates used [25].

3.2.7. Water Absorption

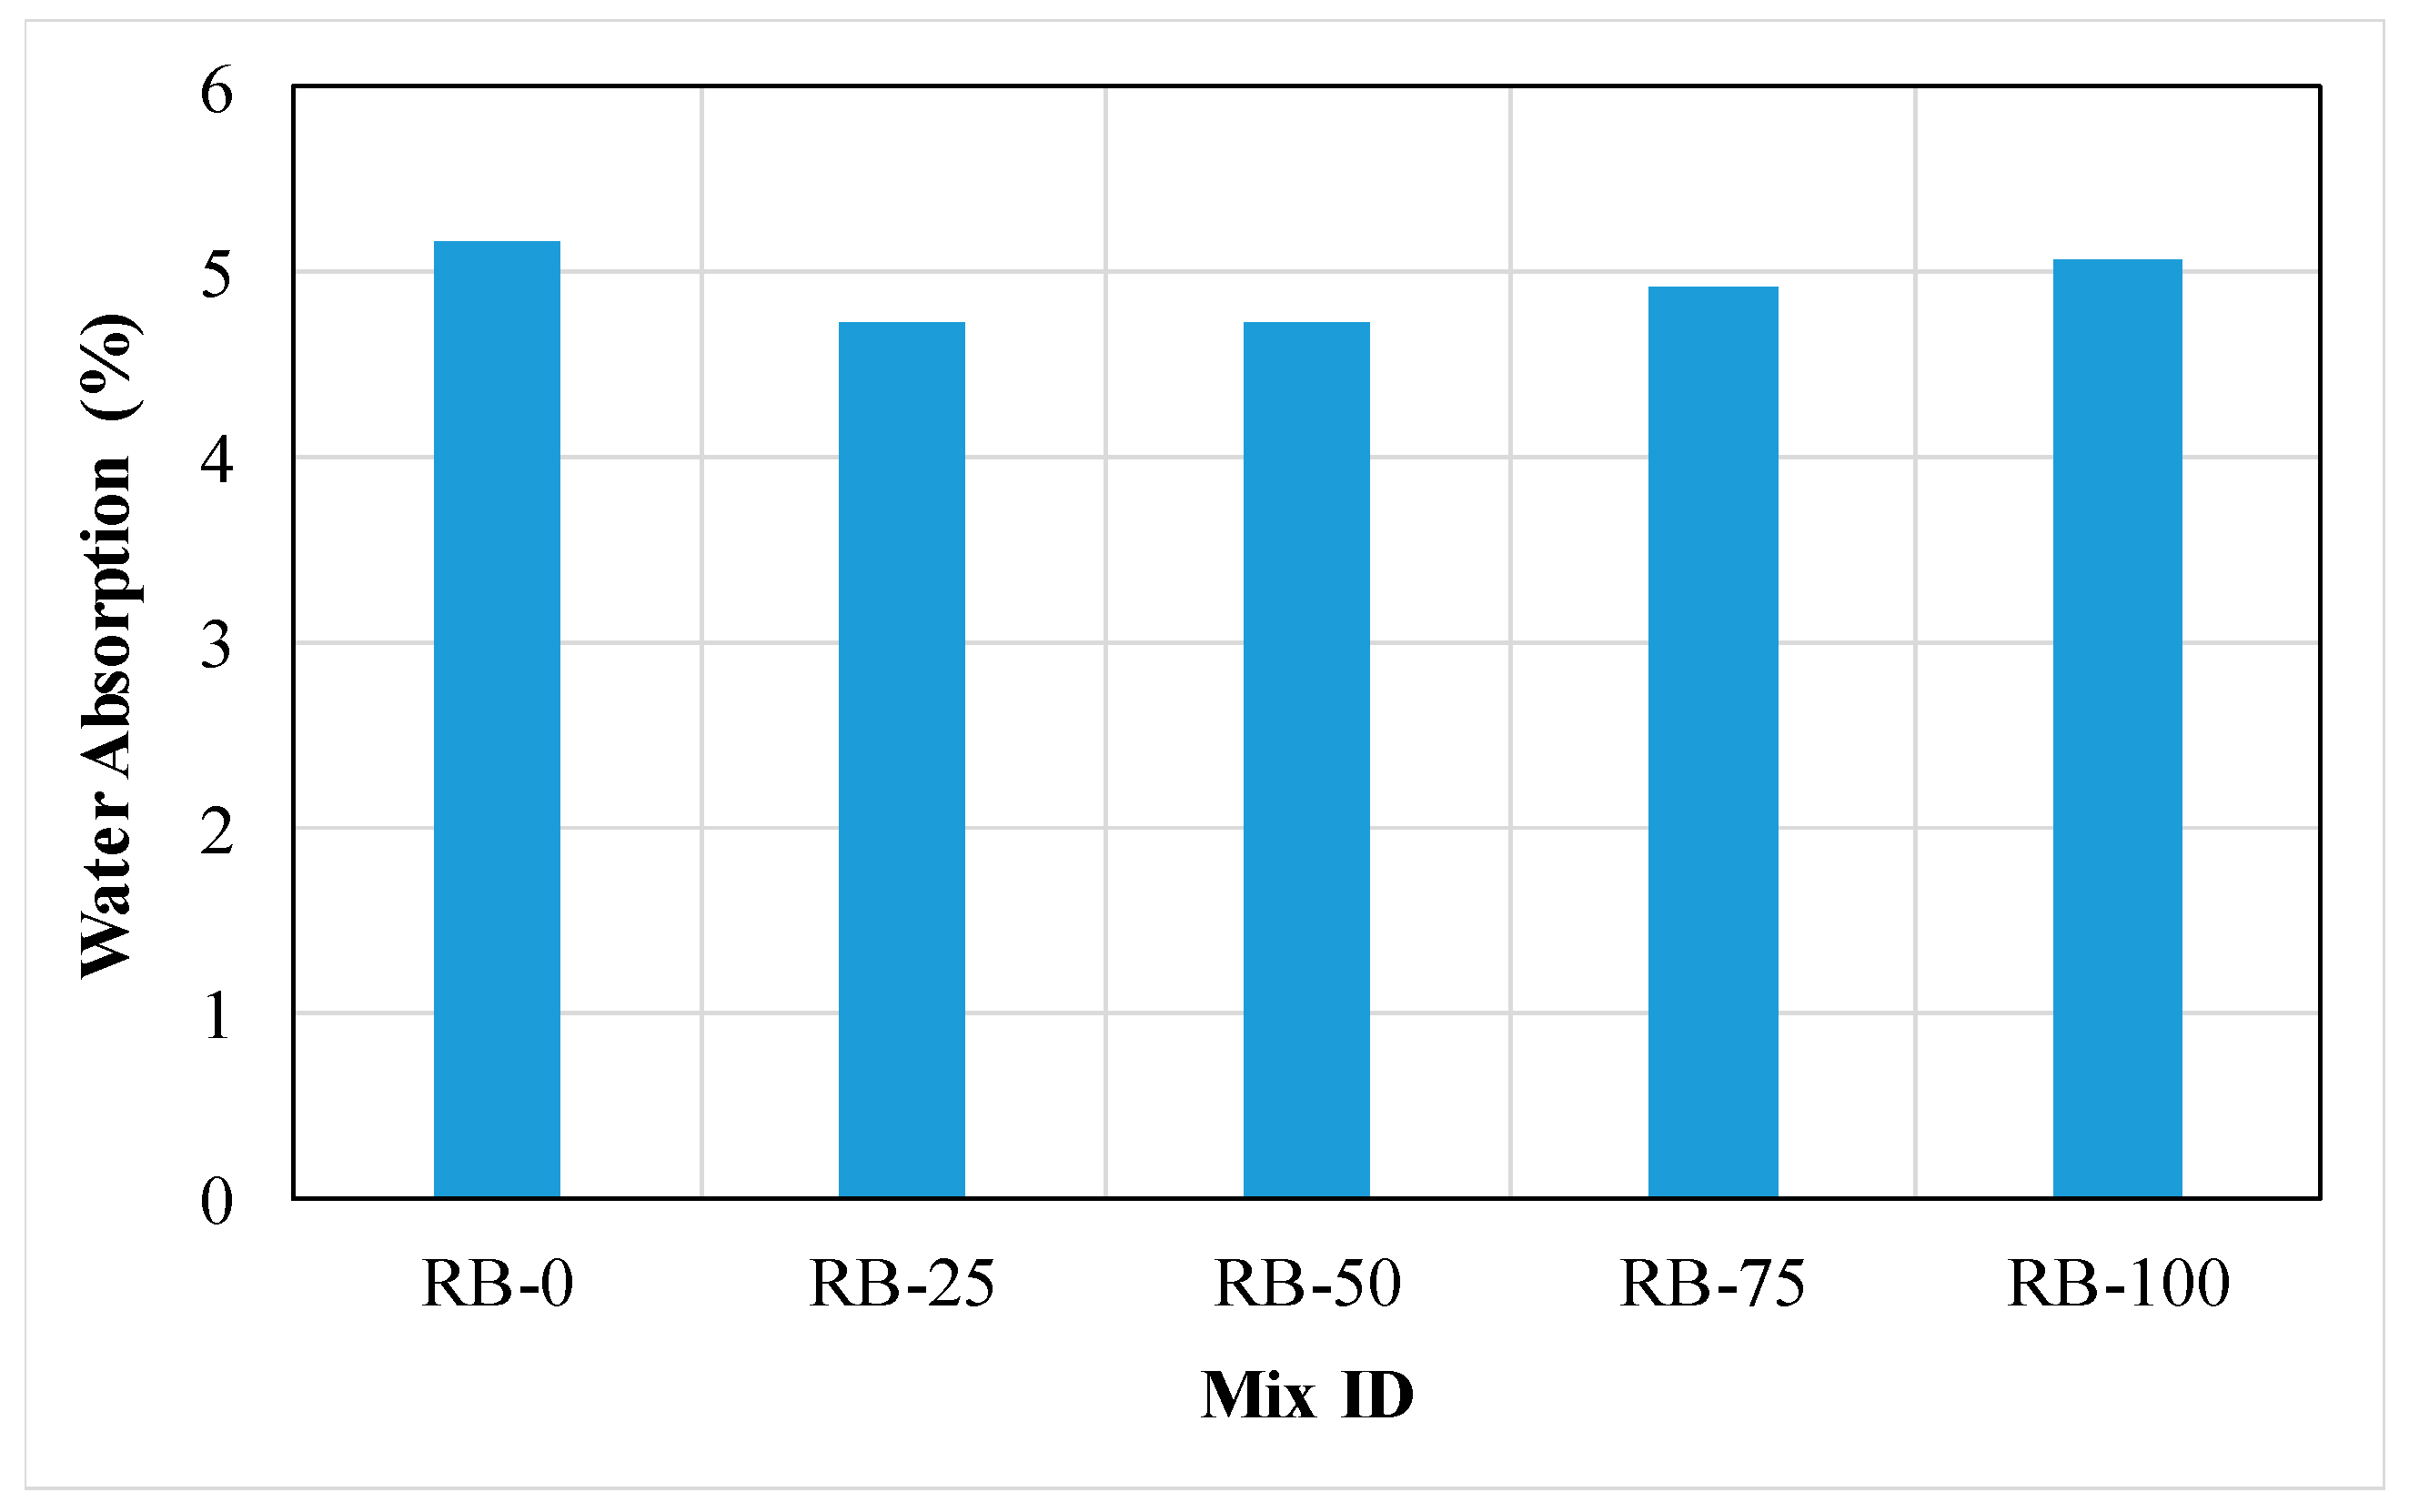
Baradaran-Nasiri and Nematzadeh [25] performed a study on concrete specimens containing different percentages of recycled refractory brick aggregates, ranging from 0 to 100%, to replace natural aggregates used in the mix. The control mix records the highest value of water absorption percentage among all other mixes that contain recycled refractory brick aggregates. This can be due to the high quality of the materials used while constructing the specific type of the refractory brick used in this study [25]. Figure 27 shows the percentage of water absorption for different mixes containing different recycled refractory brick aggregates percentages [25].

3.2.8. Porosity

The porosity of mortar or concrete is highly linked to the values of compressive strength [26]. Figure 28 displays that as the temperature increases from 20 to 600 °C, the percentage of porosity becomes higher in all tested mixes despite the materials and percentages used. In addition to that, it can be observed that as the percentage of expanded vermiculite is enhanced in the mix from 0 to 45%, the percentage of porosity increases [26]. This is due to the nature of aggregate particles that are considered to be porous resulting in an increase in the percentage of porosity [26].

3.2.9. Damage Level

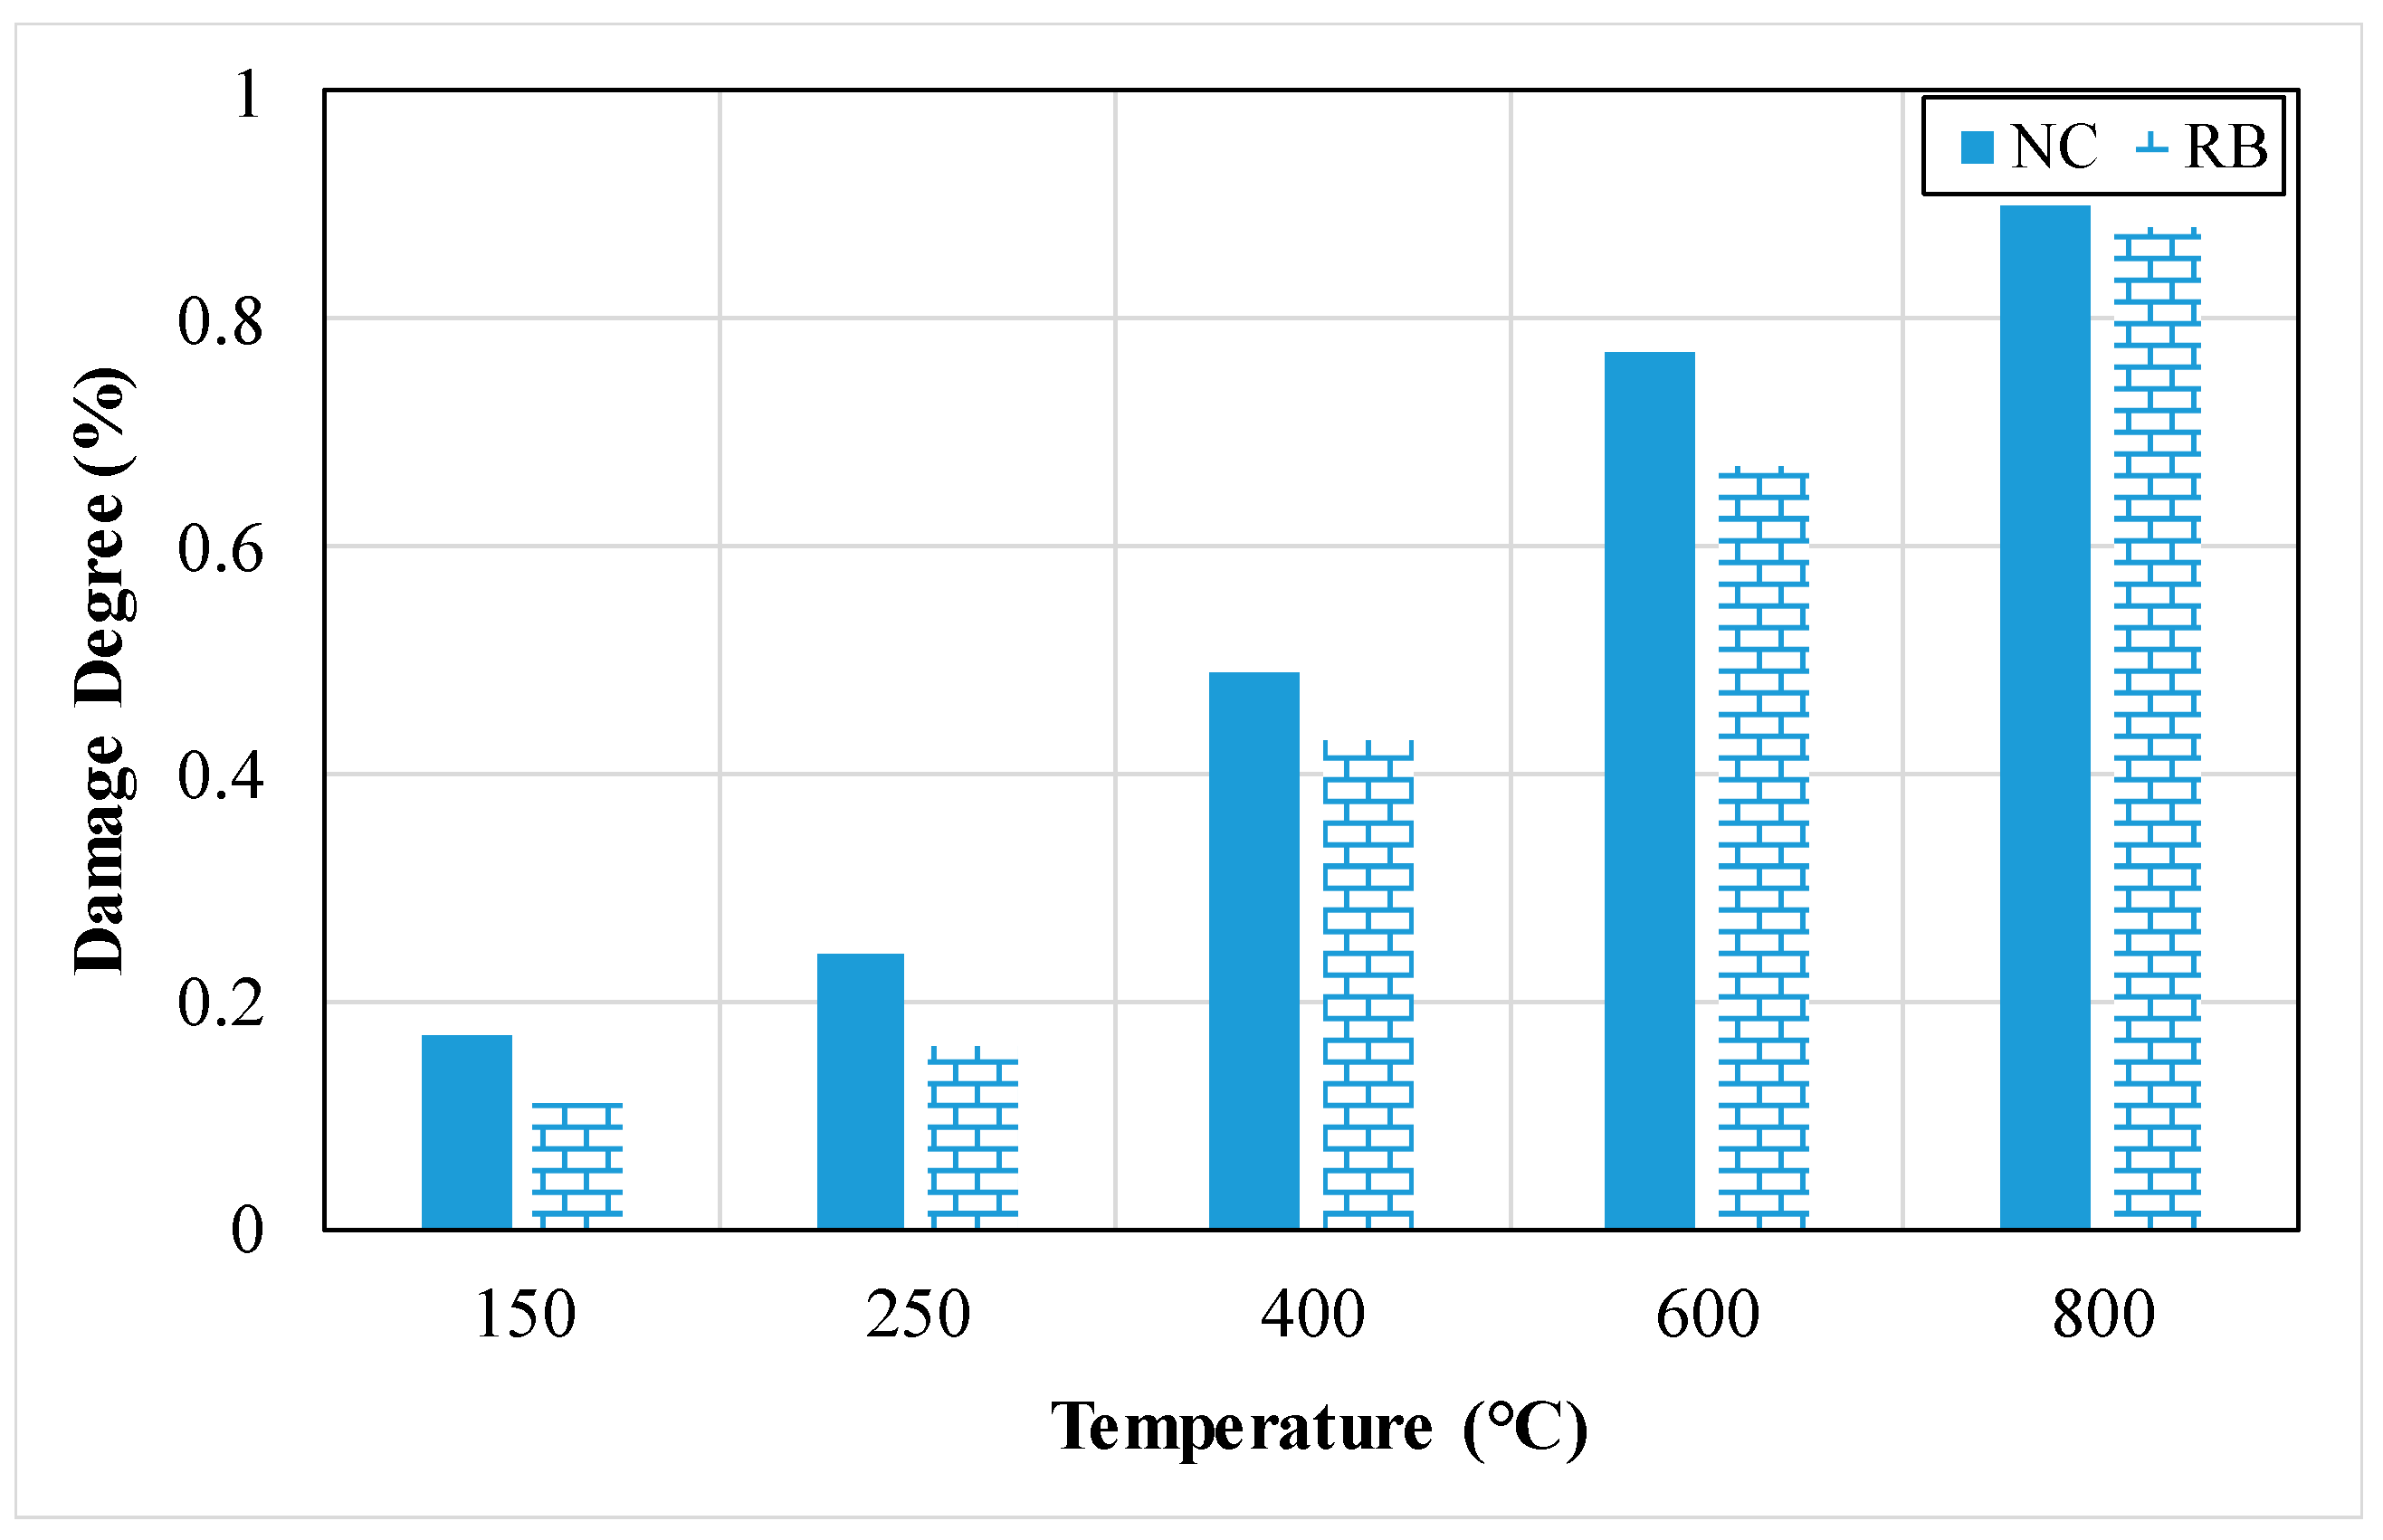
Figure 29 presents the percentage of damage degree in two different concrete mixes, one is made up of NC and the other is partially made of RB [68]. NC specimens indicate higher percentage of damage degree than that of RB specimens. In addition to that, the percentage of damage degree becomes higher for both concrete specimens with the increase in temperature from 150 to 800 °C [68]. This can be due to the increase in porosity and the reduction in UPV. The damage degree percentage of the two concrete specimens increases strongly beyond 400 °C [68]. The increase in the percentage of damage degree can be due to the dehydration of the C-S-H gel with the evaporation of the chemical bonds water. This causes the porosity to become higher and by this the thermal expansion of the aggregates used also results in a shrinkage in the cement paste, finally generating an additional deterioration that facilitates the process of the propagation of cracks [68].

3.2.10. Thermal Conductivity

Koksal et al. [26] report the results of thermal conductivity for the control mix and mix containing different percentages of expanded vermiculite as sand replacement in mortar mixes ranging from 0 to 45%. The thermal conductivity, for all mortar mixes, decreases with the increase in temperature from 20 to 600 °C [26]. In addition to that, the thermal conductivity becomes lower when incorporating expanded vermiculite as sand replacement. This is due to the structure of the aggregates where it is considered porous and the low density of the expanded vermiculite [26]. The thermal conductivity results for both tested mortar mixes are displayed in Figure 30 [26].

4. Discussion and Recommendations

CACC is a type of concrete that contains CAC instead of OPC as a binder material. It can be used in places exposed to high temperatures, infrastructures such as sewerage networks, hydraulic dams where abrasion resistance is required, repairing material, and in the lining of kilns and steel industry [27]. Some of the limitations are:
(a)
Preparing refractory concrete requires skilled labors.
(b)
Cost of unit weight of refractory concrete is higher than that of ordinary concrete. Therefore, producing refractory concrete with lower cost can be challenging.
Future work may include:
(a)
Using bio-ash materials with high alumina contents as calcium aluminate cement replacement.
(b)
Finding new types of aggregates that have a chemical composition suitable for elevated temperatures.
(c)
Using waste and demolished buildings in refractory concrete mix.
(d)
Replacing cement and aggregates by refractory cement and refractory aggregate and studying the effect of this use on the several properties of concrete.
(e)
Investigating using different binder systems such as colloidal silica and geopolymers, that can offer better thermal performance and lower environmental impact compared to traditional Portland cement.
(f)
Exploring the addition of nano-sized additives such as nano-silica and nano-alumina to enhance the mechanical strength, thermal conductivity, and durability of refractory concrete.
(g)
Looking for suitable chemical admixtures to enhance the workability, setting time, and performance of refractory concrete in high-temperature environments.
(h)
Exploring the feasibility of using advanced surface coatings that can be applied to refractory concrete to improve its resistance to chemical attack, abrasion, and thermal degradation.
(i)
Performing comprehensive lifecycle assessments to evaluate the environmental impact of refractory concrete throughout its entire lifecycle.

5. Conclusions

Different types of aggregates and cement are included in this study. Several properties for refractory concrete are studied including fresh, hardened, durability, structural and thermal characteristics. Based on the previous studies, the following conclusions can be drawn out:
  • Refractory concrete is capable of withstanding elevated temperatures due to the specific materials incorporated in it. These materials are known as refractory cement and refractory aggregate and are also known as high bearing temperature aggregate. These materials have specific compositions and properties that allow them to overcome high temperatures.
  • The slump of refractory concrete containing refractory cement is noticeably higher than that of ordinary concrete. However, refractory concrete containing refractory aggregate yielded lower slump than that of ordinary concrete. The more the content of refractory aggregate, the lower the slump.
  • The compressive and flexural strength and thermal conductivity of refractory concrete with refractory cement is lower than that of ordinary concrete. As the exposed temperature of concrete increases, the rate of reduction is relatively lower in refractory concrete compared to that of ordinary concrete.

Author Contributions

Conceptualization, L.W.E., H.G. and J.K.; methodology, L.W.E. and H.G.; formal analysis, L.W.E. and H.G.; writing—original draft preparation, L.W.E. and H.G.; writing—review and editing, L.W.E., J.K. and J.J.A.; supervision, J.K. and A.E. All authors have read and agreed to the published version of the manuscript.

Funding

This research received no external funding.

Data Availability Statement

Data are contained within the article.

Acknowledgments

The authors would like to acknowledge the help received from the civil engineering department at BAU.

Conflicts of Interest

The authors declare no conflict of interest.

References

  1. Monteiro, P.J.; Miller, S.A.; Horvath, A. Towards sustainable concrete. Nat. Mater. 2017, 16, 698–699. [Google Scholar] [CrossRef] [PubMed]
  2. Uratani, J.M.; Griffiths, S. A forward looking perspective on the cement and concrete industry: Implications of growth and development in the Global South. Energy Res. Soc. Sci. 2023, 97, 102972. [Google Scholar] [CrossRef]
  3. Sinha, S.; Ghosh, S.; Samanta, A.K. Influence of waste refractory brick on the destructive and non-destructive properties of sustainable eco-friendly concrete. Mater. Today Proc. 2023; in press. [Google Scholar] [CrossRef]
  4. Seyam, A.M.; Nemes, R. Age influence on compressive strength for concrete made with different types of aggregates after exposed to high temperatures. Mater. Today Proc. 2023; in press. [Google Scholar] [CrossRef]
  5. Madej, D.; Silarski, M.; Parzych, S. Design, structure, microstructure and gamma radiation shielding properties of refractory concrete materials containing Ba-and Sr-doped cements. Mater. Chem. Phys. 2021, 260, 124095. [Google Scholar] [CrossRef]
  6. Martinovic, S.; Vlahovic, M.; Boljanac, T.; Dojcinovic, M.; Volkov-Husovic, T. Cavitation resistance of refractory concrete: Influence of sintering temperature. J. Eur. Ceram. Soc. 2013, 33, 7–14. [Google Scholar] [CrossRef]
  7. Ouedraogo, E.; Roosefid, M.; Prompt, N.; Deteuf, C. Refractory concretes uniaxial compression behaviour under high temperature testing conditions. J. Eur. Ceram. Soc. 2011, 31, 2763–2774. [Google Scholar] [CrossRef]
  8. Pundienė, I.; Korjakins, A.; Pranckevičienė, J.; Kligys, M. Effect of silicon carbide aggregate, prepared by different methods, on the properties of refractory concrete with cenospheres. Ceram. Int. 2018, 44, 15944–15953. [Google Scholar] [CrossRef]
  9. Terzić, A.M.; Pavlović, L.M. Application of results of nondestructive testing methods in the investigation of microstructure of refractory concretes. J. Mater. Civ. Eng. 2010, 22, 853–857. [Google Scholar] [CrossRef]
  10. Bayoumi, I.M.; Ewais, E.M.; El-Amir, A.A. Rheology of refractory concrete: An article review. Boletín Soc. Española Cerámica Vidr. 2022, 61, 453–469. [Google Scholar] [CrossRef]
  11. Ouedraogo, E.; Prompt, N. High-temperature mechanical characterisation of an alumina refractory concrete for Blast Furnace main trough: PART II. Mater. Behav. J. Eur. Ceram. Soc. 2008, 28, 2867–2875. [Google Scholar] [CrossRef]
  12. Mijatović, N.; Vasić, M.; Terzić, A.; Radomirović, M.; Miličić, L. An augmented approach for the determination of the particle size effect on energy dispersive X-ray fluorescence analysis outcomes for alumina-based refractory materials. Spectrochim. Acta Part B At. Spectrosc. 2023, 209, 106796. [Google Scholar] [CrossRef]
  13. Lourenço, R.R.; Angélica, R.S.; Rodrigues, J.D. Preparation of refractory calcium aluminate cement using the sonochemical process. Mater. Res. 2013, 16, 731–739. [Google Scholar] [CrossRef]
  14. Scrivener, K. Calcium aluminate cements. Adv. Concr. Technol. 2003, 4, 713–782. [Google Scholar] [CrossRef]
  15. Montgomery, R. Heat-resisting and refractory concretes. Adv. Concr. Technol. 2003, 3, 1–13. [Google Scholar] [CrossRef]
  16. Ideker, J.H.; Scrivener, K.L.; Fryda, H.; Touzo, B. Calcium aluminate cements. Lea’s Chem. Cem. Concr. 2019, 5, 537–584. [Google Scholar] [CrossRef]
  17. De Bilbao, E.; Poirier, J.; Dombrowski, M. Corrosion of high alumina refractories by Al2O3-CaO slag: Thermodynamic and kinetic approaches. Metall. Res. Technol. 2015, 112, 607. [Google Scholar] [CrossRef]
  18. Shirani, K.; Reisi, M.; Savadkoohi, M.S. Eco-friendly high-strength refractory concrete containing calcium alumina cement by reusing granite waste as aggregate. Int. J. Concr. Struct. Mater. 2021, 15, 48. [Google Scholar] [CrossRef]
  19. Roig-Flores, M.; Lucio-Martin, T.; Alonso, M.C.; Guerreiro, L. Evolution of thermo-mechanical properties of concrete with calcium aluminate cement and special aggregates for energy storage. Cem. Concr. Res. 2021, 141, 106323. [Google Scholar] [CrossRef]
  20. Adams, M.P.; Ideker, J.H. Influence of aggregate type on conversion and strength in calcium aluminate cement concrete. Cem. Concr. Res. 2017, 100, 284–296. [Google Scholar] [CrossRef]
  21. Koksal, F.; Coşar, K.; Dener, M.; Benli, A.; Gencel, O. Insulating and fire-resistance performance of calcium aluminate cement based lightweight mortars. Constr. Build. Mater. 2023, 362, 129759. [Google Scholar] [CrossRef]
  22. Gulec, A. Investigation of the effect of different curing conditions on the mechanical performance of calcium aluminate cement concrete at elevated temperatures. Constr. Build. Mater. 2023, 409, 133920. [Google Scholar] [CrossRef]
  23. Nematzadeh, M.; Dashti, J.; Ganjavi, B. Optimizing compressive behavior of concrete containing fine recycled refractory brick aggregate together with calcium aluminate cement and polyvinyl alcohol fibers exposed to acidic environment. Constr. Build. Mater. 2018, 164, 837–849. [Google Scholar] [CrossRef]
  24. Terzić, A.; Stojanović, J.; Andrić, L.; Miličić, L.; Radojević, Z. Performances of vermiculite and perlite based thermal insulation lightweight concretes. Sci. Sinter. 2020, 52, 149–162. [Google Scholar] [CrossRef]
  25. Baradaran-Nasiri, A.; Nematzadeh, M. The effect of elevated temperatures on the mechanical properties of concrete with fine recycled refractory brick aggregate and aluminate cement. Constr. Build. Mater. 2017, 147, 865–875. [Google Scholar] [CrossRef]
  26. Koksal, F.; Nazlı, T.; Benli, A.; Gencel, O.; Kaplan, G. The effects of cement type and expanded vermiculite powder on the thermo-mechanical characteristics and durability of lightweight mortars at high temperature and RSM modelling. Case Stud. Constr. Mater. 2021, 15, e00709. [Google Scholar] [CrossRef]
  27. Khaliq, W.; Khan, H.A. High temperature material properties of calcium aluminate cement concrete. Constr. Build. Mater. 2015, 94, 475–487. [Google Scholar] [CrossRef]
  28. Bareiro, W.G.; de Andrade Silva, F.; Sotelino, E.D. Thermo-mechanical behavior of stainless steel fiber reinforced refractory concrete: Experimental and numerical analysis. Constr. Build. Mater. 2020, 240, 117881. [Google Scholar] [CrossRef]
  29. Bareiro, W.G.; de Andrade Silva, F.; Sotelino, E.D.; Gomes, O.D. The influence of alumina content on the chemical and mechanical behavior of refractory concretes fired at different temperatures. Constr. Build. Mater. 2018, 187, 1214–1223. [Google Scholar] [CrossRef]
  30. Trujillo, J.J.; Castro, J.A.; Innocentini, M.D.; Vernilli, F. Combined transient 3D simulation and experimental methods to assess a slow heat-up curve used to dry a refractory concrete. Int. J. Therm. Sci. 2023, 185, 108063. [Google Scholar] [CrossRef]
  31. Jovanović, M.; Mujkanović, A.; Bušatlić, N. The effects of the distribution coefficient on the properties of the refractory castables from the chamotte waste and clay “RAPAJLO”. In Proceedings of the 12th Scientific/Research Symposium with International Participation “Metallic and Nonmetallic Materials”, New York, NY, USA, 19–20 April 2018. [Google Scholar]
  32. Sevinç, A.H.; Durgun, M.Y. Elevated temperature performance of cementitious mortars containing pumice, barite, and basalt powder. J. Build. Eng. 2023, 78, 107552. [Google Scholar] [CrossRef]
  33. Khalil, N.M. Refractory concrete based on barium aluminate–barium zirconate cements for steel-making industries. Ceram. Int. 2005, 31, 937–943. [Google Scholar] [CrossRef]
  34. Saridemir, M.; Severcan, M.H.; Ciflikli, M.; Celikten, S.; Ozcan, F.; Atis, C.D. The influence of elevated temperature on strength and microstructure of high strength concrete containing ground pumice and metakaolin. Constr. Build. Mater. 2016, 124, 244–257. [Google Scholar] [CrossRef]
  35. Martinović, S.; Vlahović, M.; Boljanac, T.; Majstorović, J.; Volkov-Husović, T. Influence of sintering temperature on thermal shock behavior of low cement high alumina refractory concrete. Compos. Part B Eng. 2014, 60, 400–412. [Google Scholar] [CrossRef]
  36. Auvray, J.M.; Gault, C.; Huger, M. Evolution of elastic properties and microstructural changes versus temperature in bonding phases of alumina and alumina–magnesia refractory castables. J. Eur. Ceram. Soc. 2007, 27, 3489–3496. [Google Scholar] [CrossRef]
  37. Liu, J.; Zhuge, Y.; Ma, X.; Liu, M.; Liu, Y.; Wu, X.; Xu, H. Physical and mechanical properties of expanded vermiculite (EV) embedded foam concrete subjected to elevated temperatures. Case Stud. Constr. Mater. 2022, 16, e01038. [Google Scholar] [CrossRef]
  38. Koksal, F.; Gencel, O.; Brostow, W.; Lobland, H.H. Effect of high temperature on mechanical and physical properties of lightweight cement based refractory including expanded vermiculite. Mater. Res. Innov. 2012, 16, 7–13. [Google Scholar] [CrossRef]
  39. Tandiroglu, A. Temperature-dependent thermal conductivity of high strength lightweight raw perlite aggregate concrete. Int. J. Thermophys. 2010, 31, 1195–1211. [Google Scholar] [CrossRef]
  40. Pizoń, J.; Konečný, P.; Mynarz, M.; Bílek, V. Properties of Fine Graded Perlite-Based Lightweight Cement Mortars Subjected to Elevated Temperatures. Buildings 2023, 13, 2969. [Google Scholar] [CrossRef]
  41. Koçyiğit, F. Investigation of thermal and strength properties of a novel composite developed for insulation as building material. Int. J. Thermophys. 2020, 41, 41. [Google Scholar] [CrossRef]
  42. Taoukil, D.; lhassane Lahlaouti, M.; Djedjig, R. Effect of the use of diatomite as partial replacement of sand on thermal and mechanical properties of mortars. J. Build. Eng. 2021, 42, 103038. [Google Scholar] [CrossRef]
  43. Sarıdemir, M.; Yıldırım, A. Effect of elevated temperatures on properties of high strength mortars containing ground calcined diatomite with limestone sand. J. Build. Eng. 2022, 56, 104748. [Google Scholar] [CrossRef]
  44. Rodrigues, A.V.; Bragança, S.R. An evaluation of the increased expansion of clay aggregates fired at 1300 °C to maximize lightness for non-structural concrete. Boletín Soc. Española Cerámica Vidr. 2023, 62, 56–65. [Google Scholar] [CrossRef]
  45. Bicer, A. The effect of fly ash and pine tree resin on thermo-mechanical properties of concretes with expanded clay aggregates. Case Stud. Constr. Mater. 2021, 15, e00624. [Google Scholar] [CrossRef]
  46. Li, M.; Li, Y.; Ouyang, D.; Chen, R.; Li, S. The impact of alumina bubble particle size on the microstructure and physical properties of mullite castables. Ceram. Int. 2019, 45, 1928–1939. [Google Scholar] [CrossRef]
  47. Bideci, Ö.S. The effect of high temperature on lightweight concretes produced with colemanite coated pumice aggregates. Constr. Build. Mater. 2016, 113, 631–640. [Google Scholar] [CrossRef]
  48. Aydın, S. Development of a high-temperature-resistant mortar by using slag and pumice. Fire Saf. J. 2008, 43, 610–617. [Google Scholar] [CrossRef]
  49. Tufail, M.; Shahzada, K.; Gencturk, B.; Wei, J. Effect of elevated temperature on mechanical properties of limestone, quartzite and granite concrete. Int. J. Concr. Struct. Mater. 2017, 11, 17–28. [Google Scholar] [CrossRef]
  50. Ghonaim, S.A.; Ghazal, H.B.; Abadir, M.F. Effect of type of aggregate on the properties of refractory concrete. J. Am. Sci. 2010, 6, 1025–1027. [Google Scholar]
  51. Tran, M.T.; Vu, X.H.; Ferrier, E. Mesoscale experimental investigation of thermomechanical behaviour of the carbon textile reinforced refractory concrete under simultaneous mechanical loading and elevated temperature. Constr. Build. Mater. 2019, 217, 156–171. [Google Scholar] [CrossRef]
  52. Ulusu, İ.; Kurnuç Seyhan, A. Effect of Expanded Perlite Aggregate Plaster on the Behavior of High-Temperature Reinforced Concrete Structures. Buildings 2023, 13, 384. [Google Scholar] [CrossRef]
  53. Kanagaraj, B.; Anand, N.; Praveen, B.; Kandasami, S.; Lubloy, E.; Naser, M.Z. Physical characteristics and mechanical properties of a sustainable lightweight geopolymer based self-compacting concrete with expanded clay aggregates. Dev. Built Environ. 2023, 13, 100115. [Google Scholar] [CrossRef]
  54. Hu, S.G.; Wu, J.; Yang, W.; He, Y.J.; Wang, F.Z.; Ding, Q.J. Preparation and properties of geopolymer-lightweight aggregate refractory concrete. J. Cent. South Univ. Technol. 2009, 16, 914–918. [Google Scholar] [CrossRef]
  55. Masood, A.; Shariq, M.; Alam, M.M.; Ahmad, T.; Beg, A. Effect of elevated temperature on the residual properties of quartzite, granite and basalt aggregate concrete. J. Inst. Eng. (India) Ser. A 2018, 99, 485–494. [Google Scholar] [CrossRef]
  56. Topçu, İ.B.; Işıkdağ, B. Effect of expanded perlite aggregate on the properties of lightweight concrete. J. Mater. Process. Technol. 2008, 204, 34–38. [Google Scholar] [CrossRef]
  57. Benjeddou, O.; Ravindran, G.; Abdelzaher, M.A. Thermal and acoustic features of lightweight concrete based on marble wastes and expanded perlite aggregate. Buildings 2023, 13, 992. [Google Scholar] [CrossRef]
  58. Gökçe, M.V.; Koç, İ. Use of diatomite in the production of lightweight building elements with cement as binder. Sci. Res. Essays 2012, 7, 774–781. [Google Scholar]
  59. Horoshenkov, K.V.; Hughes, D.C.; Cwirzen, A. The sound speed and attenuation in loose and consolidated granular formulations of high alumina cements. Appl. Acoust. 2003, 64, 197–212. [Google Scholar] [CrossRef]
  60. Li, M.; Li, Y.; Ouyang, D.; Wang, X.; Li, S.; Chen, R. Effects of alumina bubble addition on the properties of mullite castables. J. Alloys Compd. 2018, 735, 327–337. [Google Scholar] [CrossRef]
  61. Al-Farttoosi, H.K.; Abdulrazzaq, O.A.; Hussain, H.K. Mechanical properties of light weight aggregate. In IOP Conference Series Materials Science and Engineering; IOP Publishing: Bristol, UK, 2021; Volume 1090, p. 012106. [Google Scholar] [CrossRef]
  62. Ullah, M.; Mir, J.; Husain, S.S.; Shahid, M.L.; Ahmad, A. Concrete forensic analysis using deep learning-based coarse aggregate segmentation. Autom. Constr. 2024, 162, 105372. [Google Scholar] [CrossRef]
  63. Kamani, M.; Ajalloeian, R. The effect of rock crusher and rock type on the aggregate shape. Constr. Build. Mater. 2020, 230, 117016. [Google Scholar] [CrossRef]
  64. Karasin, A.; Hadzima-Nyarko, M.; Işık, E.; Doğruyol, M.; Karasin, I.B.; Czarnecki, S. The effect of basalt aggregates and mineral admixtures on the mechanical properties of concrete exposed to sulphate attacks. Materials 2022, 15, 1581. [Google Scholar] [CrossRef] [PubMed]
  65. Torgal, F.P.; Castro-Gomes, J.P. Influence of physical and geometrical properties of granite and limestone aggregates on the durability of a C20/25 strength class concrete. Constr. Build. Mater. 2006, 20, 1079–1088. [Google Scholar] [CrossRef]
  66. Khan, M.; Lao, J.; Ahmad, M.R.; Kai, M.F.; Dai, J.G. The role of calcium aluminate cement in developing an efficient ultra-high performance concrete resistant to explosive spalling under high temperatures. Constr. Build. Mater. 2023, 384, 131469. [Google Scholar] [CrossRef]
  67. Kudžma, A.; Antonovič, V.; Stonys, R.; Škamat, J. The investigation of properties of insulating refractory concrete with portland cement binder. In IOP Conference Series: Materials Science and Engineering; IOP Publishing: Bristol, UK, 2015; Volume 96, p. 012015. [Google Scholar] [CrossRef]
  68. Khattab, M.; Hachemi, S.; Al Ajlouni, M.F. Evaluating the physical and mechanical properties of concrete prepared with recycled refractory brick aggregates after elevated temperatures’ exposure. Constr. Build. Mater. 2021, 311, 125351. [Google Scholar] [CrossRef]
Figure 1. Literature review steps.
Infrastructures 09 00137 g001
Figure 2. Properties examined in the literature review.
Infrastructures 09 00137 g002
Figure 3. Year of publication for papers examined in the literature review.
Infrastructures 09 00137 g003
Figure 4. Journals used in the literature review.
Infrastructures 09 00137 g004
Figure 5. Different zones of the cementitious materials (Al2O3-CaO-SiO2) system [16].
Infrastructures 09 00137 g005
Figure 6. Phase diagram of CaO-Al2O3 [17].
Infrastructures 09 00137 g006
Figure 7. Phase diagram of CaO-Al2O3-SiO2 [16].
Infrastructures 09 00137 g007
Figure 8. Phase diagram of CaO-Al2O3-Fe2O3 [16].
Infrastructures 09 00137 g008
Figure 9. Dry unit weight of CACC and NC mixes at 20, 300, 600 and 1100 °C temperatures [21].
Infrastructures 09 00137 g009
Figure 10. Unit weight of different mixes at different curing ages [32].
Infrastructures 09 00137 g010
Figure 11. Compressive strength of CACC and NC mixes at 20, 300 and 600 °C temperatures [26].
Infrastructures 09 00137 g011
Figure 12. Flexural strength of CACC and NC mixes at 20, 300, 600 and 1100 °C temperatures [21,26].
Infrastructures 09 00137 g012
Figure 13. Tensile strength of CACC and NC under unstressed and residual test methods at different testing temperatures [27].
Infrastructures 09 00137 g013
Figure 14. MOE of CACC and NC mixes at different testing temperatures [25].
Infrastructures 09 00137 g014
Figure 15. UPV of CACC and NC mixes at 20, 300 and 600 °C temperatures [26].
Infrastructures 09 00137 g015
Figure 16. Shrinkage of CACC and NC mixes at different testing temperatures [67].
Infrastructures 09 00137 g016
Figure 17. Mass loss of CACC and NC mixes at different testing temperatures [25].
Infrastructures 09 00137 g017
Figure 18. Percentage of water absorption of CACC and NC mixes at 20, 300, 600 and 1100 °C temperatures [21,26].
Infrastructures 09 00137 g018
Figure 19. Percentage of porosity of CACC and NC mixes at 20, 300 and 600 °C temperatures [26].
Infrastructures 09 00137 g019
Figure 20. Damage level of CACC mixes at different sintering temperatures of 1100, 1300 and 1600 °C [35].
Infrastructures 09 00137 g020
Figure 21. Thermal conductivity of CACC and NC mixes at 20, 300, 600 and 1100 °C temperatures [21,26].
Infrastructures 09 00137 g021
Figure 22. Dry unit weight of mortar mixes containing expanded vermiculite aggregates as natural aggregate replacement at 20, 300 and 600 °C temperatures [26].
Infrastructures 09 00137 g022
Figure 23. Compressive strength of mortar mixes containing expanded vermiculite aggregates as natural aggregate replacement at 20, 300 and 600 °C temperatures [26].
Infrastructures 09 00137 g023
Figure 24. Flexural strength of mortar mixes containing expanded vermiculite aggregates as natural aggregate replacement at 20, 300 and 600 °C temperatures [26].
Infrastructures 09 00137 g024
Figure 25. UPV and MOE of concrete mixes containing recycled refractory brick aggregates as natural aggregate replacement at different temperatures [68].
Infrastructures 09 00137 g025
Figure 26. Loss of weight percentages of concrete mixes containing different percentages of recycled refractory brick aggregates as natural aggregate replacement at different temperatures [25].
Infrastructures 09 00137 g026
Figure 27. Percentage of water absorption of concrete mixes containing different percentages of recycled refractory brick aggregates as natural aggregate replacement [25].
Infrastructures 09 00137 g027
Figure 28. Porosity percentages of mortar mixes containing expanded vermiculite aggregates as natural aggregate replacement at 20, 300 and 600 °C temperatures [26].
Infrastructures 09 00137 g028
Figure 29. Percentage of damage degree of concrete mixes containing recycled refractory brick aggregates as natural aggregate replacement at different temperatures [68].
Infrastructures 09 00137 g029
Figure 30. Thermal conductivity of mortar mixes containing expanded vermiculite aggregates as natural aggregate replacement at 20, 300 and 600 °C temperatures [26].
Infrastructures 09 00137 g030
Table 7. Summary table.
PropertiesDensity (kg/m3)Compressive Strength (MPa)Flexural Strength (MPa)Split Tensile Strength (MPa)MOE (GPa)UPV (m/s)Variation of Weight (%)Water Absorption (%)Porosity (%)Thermal Conductivity (W/mK)
References[21][26][21][27][25][26][25][21][26][21]
w/c1.050.51.050.50.380.50.381.050.51.05
NC605.10024.0000.9301.0504.0001226.0009.800107.20025.3500.122
CACC866.80016.4001.1501.4301.900644.00010.10071.80028.1100.167
Table 8. Slump values of CACC and NC mixes.
Mix IDSlump (mm)
Reference
[24][25]
NC19485
CACC217110
Table 9. Compressive strength of CACC and NC mixes at different immersion days in sulfuric acid solution [23].
Mix IDCompressive Strength (MPa)
Immersion in Sulfuric Acid Solution (Days)072163
NC6866.261.357.4
CACC66.762.654.252.1
Table 10. Residual compressive strength of ultra-high performance concrete for NC and CACC mixes [66].
Mix IDCompressive Strength (MPa)
Temperature (°C)RT2505007501000
NC123.8137.5SpallingSpallingSpalling
CACC122.1153.899.571.631.6
Table 11. Flexural strength of different types of CACC and NC mixes at different testing temperatures [22].
Mix IDFlexural Strength (MPa)
23 °C300 °C600 °C
NC5.985.214.89
CACC-S4.054.272.14
CACC-H5.532.931.50
Table 12. Normalized splitting tensile strength for different mixes at different tested temperatures [34].
Mix IDNormalized Splitting Tensile Strength (MPa)
Temperature (°C)25250500750
NC1.000.910.770.33
GP 5%1.000.890.770.33
GP 10%1.000.910.760.34
GP 15%1.000.920.770.33
GP 20%1.000.900.750.29
Table 13. MOE of different types of CACC and NC mixes at different testing temperatures [22].
Mix IDMOE (MPa)
23 °C300 °C600 °C
NC30,11724,1429399
CACC-S30,41211,5324630
CACC-H26,14911,4823387
Table 14. UPV of CACC and NC mixes at different immersion days in sulfuric acid solution [23].
Mix IDUPV (km/s)
Immersion in Sulfuric Acid Solution (Days)072163
NC4.4224.3764.2714.187
CACC4.3834.2814.1454.118
Table 15. Weight of CACC and NC mixes at different immersion days in sulfuric acid solution [23].
Mix IDWeight (g)
Immersion in Sulfuric Acid Solution (Days)072163
NC2281.32289.722782256.3
CACC2258.32278.02263.32226.3
Table 16. Percentage of porosity of CACC and NC mixes [25].
Mix IDNCCACC
Porosity (%)11.9311.35
Table 17. Slump values of concrete mixes containing different percentages of recycled refractory brick aggregates as natural aggregate replacement [25].
Mix IDRB-0RB-25RB-50RB-75RB-100
Slump (mm)8570656055
Table 18. Slump values of concrete mixes containing different types of refractory aggregates as natural aggregate replacement [24].
Mix IDNCNC-PNC-V
Slump (mm)194160143
Disclaimer/Publisher’s Note: The statements, opinions and data contained in all publications are solely those of the individual author(s) and contributor(s) and not of MDPI and/or the editor(s). MDPI and/or the editor(s) disclaim responsibility for any injury to people or property resulting from any ideas, methods, instructions or products referred to in the content.