Abstract
Bridges are crucial transportation infrastructures with significant socioeconomic impacts, necessitating continuous assessment to ensure safe operation. However, the vast number of bridges and the technical and financial challenges of maintaining permanent monitoring systems in every single bridge make the implementation of structural health monitoring (SHM) difficult for authorities. Unsupervised transfer learning, which reuses experimental or numerical data from well-known bridges to detect damage on other bridges with limited monitoring response data, has emerged as a promising solution. This solution can reduce SHM costs while ensuring the safety of bridges with similar characteristics. This paper investigates the limitations, challenges, and opportunities of unsupervised transfer learning via domain adaptation across datasets from various prestressed concrete bridges under distinct operational and environmental conditions. A feature-based transfer learning approach is proposed, where the joint distribution adaptation method is used for domain adaptation. As the main advantage, this study leverages the generalization of SHM for damage detection in prestressed concrete bridges with limited long-term monitoring data.
1. Introduction
The structural health monitoring (SHM) of bridges rooted in the artificial intelligence [1] field has been used for over three decades to implement a five-level damage identification hierarchy (detection, localization, type, severity, and prognosis), in which machine learning algorithms play an essential role [2,3].
As a subfield of machine learning, transfer learning has attracted tremendous interest for bridge SHM [4]. The ability of transfer learning to overcome challenges in damage identification using prior knowledge presented in the monitoring datasets is based on the human brain’s ability to adapt previous experiences to new situations. Adaptation is a natural human learning ability and transfer learning follows similar concepts.
For instance, we can think about the Golden Gate Bridge (1933) in San Francisco and the 25 de Abril Bridge (1966) in Lisbon. They share the same structural system, the same material, and the same operational and environmental conditions. They were even built by the same construction company, which optimized the design of the 25 de Abril Bridge by transposing knowledge gained three decades before with the construction of the Golden Gate Bridge. Thus, the main idea of transfer learning (or knowledge transfer) is to reuse the relevant knowledge present in monitoring data from a known bridge (source domain) to assess the structural integrity of another bridge (target domain), where the structural knowledge present in the monitoring datasets is limited. Thus, a robust classifier capable of evaluating different bridges can be estimated without the need to carry out a new model identification process from scratch.
This idea has the potential to significantly change how the SHM of bridges is proposed by reducing the investment and operating costs of permanent monitoring systems. Bridge authorities can potentially evaluate several structures through data collected from a few similar ones, where full knowledge of their dynamic behavior exists. This idea has also been mentioned in the scientific community as population-based SHM [5].
We have seen some comprehensive publications on transfer learning for mechanical systems [6,7,8]. Several methods, like transfer component analysis (TCA) and joint distribution adaptation (JDA), have been applied to vibration-based SHM installed mainly in laboratory systems.
From the bridge point of view, ongoing research has tried to answer the following question: “Can transfer learning be a potential solution for SHM of bridges?” Nonetheless, few studies on transfer learning for bridges have been published showing the effectiveness of this concept to support damage identification.
Zhu et al. [9] presented a vision-based method to detect bridge defects using transfer learning and convolutional neural networks. Comparative studies indicated better performance of this methodology based on transfer learning when compared to traditional machine learning algorithms for image processing, which provides an intelligent management assessment and reduces the need of traditional visual inspections.
Figueiredo et al. [4] proposed transfer learning for bridges through domain adaptation over datasets from finite element (FE) models (source domain) of the Z−24 Bridge in Switzerland and from a monitoring system of the same bridge (target domain), where two unsupervised classifiers were trained only with labeled source data. The transfer learning concept validated the application of numerical modeling for long-term monitoring strategies, as it overcomes some of the limitations imposed by the FE model calibration.
Tronci et al. [10] proposed transfer learning for bridge SHM by leveraging the knowledge from speech recording datasets to enrich the training phase of a classifier applied to assess a real bridge. The knowledge from the source domain was reused in the target domain through a pre-trained deep learning model using audio datasets to extract features from experimental data collected from the bridge. Then, the Mel-frequency cepstral coefficients were assumed as the investigated damage-sensitive features in a binary classification of the structural damage assessment of the bridge.
Pan [11] proposed a novel model-based transfer learning approach for data anomaly detection, which uses the similarity of the anomalous patterns across different bridges and shares the knowledge incorporated in a deep neural network. The proposed approach converts vibration and environmental datasets from a source bridge into an image format to train convolutional neural networks for data anomaly classification. The knowledge of this pre-trained model was leveraged to evaluate the structural condition of another bridge using a small portion of its datasets.
Recently, Omori et al. [12] set the foundations of transfer learning and domain adaptation for bridges. They also showed the efficacy of two transfer learning strategies (unsupervised and supervised). Using structural knowledge from the PI-57 Bridge (source), an unsupervised transfer learning strategy is used to first classify the Z−24 Bridge (target). Then, the roles of source and target structures are inverted. Since the labels of the source data are known (healthy and damaged), transfer learning from the Z−24 Bridge (source) to the PI-57 Bridge (target) is carried out under the assumption of a supervised classification.
The unsupervised learning strategy has been the focus of most studies, because bridges are high-capital expenditure structures and so only data from the undamaged condition are generally available. However, the application of unsupervised transfer learning in bridge SHM to address the first level of damage identification, i.e., damage detection, based on long-term monitoring data is still at an early stage. Few studies have been published directly using long-term vibration-based monitoring datasets, like natural frequencies of vibration. In addition, several traditional transfer learning methods and classifiers have not yet been tested and compared on long-term datasets from real bridges.
This paper presents a comprehensive study of the unsupervised transfer learning concept on several real-world prestressed concrete bridges. All case studies have long-term monitoring datasets and are built under different operational and environmental conditions. Specifically, we define two pedestrian bridges in Portugal under moderate temperatures in the middle of Lisbon, two twin bridges over the Itacaiúnas River in Brazil under relatively high and constant temperatures ranging between 23 °C and 27 °C, and the Z−24 Bridge in Switzerland, along with its numerical modeling, under a wide temperature range from −10 °C to 36 °C. The strength of this study is the use of real datasets of structurally similar bridges.
This paper is organized as follows. After Section 1, in Section 2, the foundations of unsupervised transfer learning are summarized, and a long-term damage detection methodology is laid out using a feature-based transfer learning approach. Section 3 analyzes datasets from three case studies. Section 4 links previous case studies’ results to highlight some limitations, challenges, and opportunities. Finally, Section 5 summarizes this study, provides final remarks, and posits future transfer learning works for bridge SHM.
2. Foundations of Unsupervised Transfer Learning for Bridges and Methodology
2.1. Definitions, Questions, Approaches, and Procedures
The main definitions referring to unsupervised transfer learning and domain adaptation in bridges are described in this section. This paper focuses on applying unsupervised transfer learning through domain adaptation to reduce the inherent divergences of probability distributions between datasets measured from two different bridges. To provide a better understanding, a brief description of the particularities of transfer learning and domain adaptation can be found in [13]:
- What is unsupervised transfer learning? Transfer learning proposes leveraging the knowledge previously learned from a known undamaged bridge to improve the assessment of another one, providing a robust classifier capable of generalizing to new situations.
- What is domain adaptation? Domain adaptation represents a particular case of transfer learning mainly concerned with aligning the probability distributions of the datasets from source and target domains to reuse previously learned knowledge.
In the context of bridges, three important questions must be answered to ensure the application of successful knowledge transfer. These questions serve as guidelines for decision-making that address the purpose of carrying out the knowledge transfer [14]:
- When to transfer? It is necessary to define in which situations transfer learning should be carried out, as it does not always provide benefits to the condition assessment of bridges. It is necessary to find bridges that are related to each other through a similarity analysis to avoid the occurrence of a negative transfer [15], which occurs when leveraging source domain data/knowledge undesirably reduces learning performance. From a practical point of view, bridges must share the same structural system, the same material, and the same operational and environmental conditions.
- What to transfer? The useful knowledge in the datasets should be defined. For instance, if we want to transfer dynamics-related knowledge, we should find models or features embedding information from mass and stiffness (e.g., natural frequencies).
- How to transfer? An approach is defined by the knowledge extracted from the data measured, and an appropriate method (e.g., TCA and JDA) is selected to perform knowledge transfer.
The proposed approach for knowledge transfer is defined according to the type of common knowledge between the investigated bridges that can be shared. The two main approaches for bridges are as follows [12]:
- Model-based transfer learning. The knowledge in well-trained models (e.g., deep neural networks) using source data can be reapplied to evaluate a target bridge by fine-tuning the source model parameters and hyperparameters.
- Feature-based transfer learning. The structural integrity is assumed to be embedded in the damage-sensitive features extracted from datasets. Therefore, features from the source bridge can be used to build a classifier capable of evaluating the structural condition of the target bridge.
Finally, according to the nature of the data, the effectiveness of transfer learning can be assessed using two main procedures:
- Numerical-to-experimental domain adaptation when there is a numerical model of a real bridge to be used as the source domain. In this case, the experimental datasets (e.g., from monitoring systems) are the target domain.
- Experimental-to-experimental domain adaptation when there are two similar bridges with experimental data, in which the one with more datasets and knowledge is considered the source domain and the other one is considered the target domain.
2.2. Methodology: Damage Detection Using Long-Term Monitoring Datasets
2.2.1. Unsupervised Feature-Based Transfer Learning Approach
An unsupervised feature-based transfer learning approach is considered in this paper, as SHM traditionally relies on a binary classification of damage-sensitive features: healthy or damaged conditions. Figure 1 presents a schematic representation of the proposed methodology for damage detection across similar bridges. First, feature extraction is performed on the raw datasets measured from the source and target bridges and grouped into observations. A noticeable separation between observations in the original feature space may not allow a classifier to be trained using only the source knowledge to assess the structural integrity of both bridges at the same time.
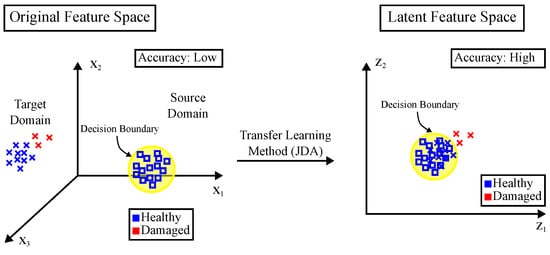
Figure 1.
Unsupervised feature-based transfer learning approach for observations from source and target domains.
Then, a transfer learning method (JDA in this study) is applied to perform domain adaptation by transforming observations into a new space (latent feature space), where the probability distance between the source and target observations are mitigated. This transformation embeds knowledge of both bridges.
Finally, it is possible to generalize the classifier’s application in the latent feature space, assuming a binary classification (healthy and damaged conditions) and a decision boundary. The classifier’s accuracy is a performance metric highlighting the transfer learning success.
2.2.2. Joint Distribution Adaptation
The JDA is a kernel-based transfer learning method that projects the features from the source and target domains into a shared latent space using a nonlinear mapping function to minimize the mismatch between their joint probability distributions [16,17].
In this case, the class-conditional distributions with pseudo-labels are considered instead of conditional distributions to overcome the lack of labels from the target domain (unsupervised learning strategy). Then, the source knowledge is applied to estimate a classifier to determine the pseudo-labels iteratively, resulting in the optimization of the mapping function .
The maximum mean discrepancy is a kernel-based metric often applied to estimate the divergences between the class-conditional distributions of the domains investigated. Considering the source data matrix and labels, and , target data matrix and labels, and , this distance metric can be written as:
where is the transformation matrix that projects the features to the latent space, is the kernel, and the matrix can be written as:
where is the number of observations in the source domain, is the number of observations in the target domain, represents the source features with true labels y, and represents the target features with pseudo-labels estimated by the base classifier.
The kernel is defined as given that , where d is the dimension of the features.
The JDA method requires that the datasets’ variance be preserved in the latent space. This constraint aims to maintain the underlying data properties while the divergences between the probability distributions of the domains are mitigated. Thus, the minimization problem can be defined as:
where represents the centering matrix, represents the identity matrix, and is the trade-off parameter assuming only positive values. This minimization problem can be rewritten as an eigenproblem by applying the Lagrange multipliers as a possible solution. Therefore, the eigenproblem can be described as , where the m leading eigenvectors represent the weights of the transformation matrix , and the latent features can be determined based on .
2.2.3. Classifier: Gaussian Mixture Model
The Gaussian mixture model (GMM) uses multivariate finite mixture models to capture the main clusters (components) of observations. These clusters correspond to a bridge’s normal (healthy or undamaged) condition despite the influence of varying operational and environmental conditions. Then, an outlier detection strategy is carried out, assuming that the main components are defined [18]. In this case, the damage detection uses the Mahalanobis squared distance (MSD) according to the clusters to evaluate the structural condition, where the covariance matrices and mean vectors are functions of the main components.
Suppose a training matrix, , is composed of a mixture of Q distributions. Formally, this can be written as [19]:
where represents a probability distribution from a known parametric distribution family . The datasets are used to estimate the component parameters and the mixture weights of the underlying mixture distributions. In this case, multivariate Gaussian mixture distributions represent each component density in the form of [19]:
with unknown parameters, , defined by the mean vectors, , and covariance matrices, , while the sum of mixture weights are constrained to be equal to one ().
The estimation of the parameters uses the classical maximum likelihood (ML) based on the expectation-maximization (EM) algorithm [20]. The Bayesian information criterion (BIC) can be applied to define the appropriate number of components, which introduces a penalty term for the number of parameters in the model.
For the outlier detection strategy, each observation is determined based on the MSD from the estimated clusters. Formally, for each main component, q, of the data, the MSD or damage indicator (DI) can be defined as:
Finally, the DI for each observation is given by the minimization of the DI estimated based on each component:
2.2.4. Decision Boundary and Outlier Detection
A threshold is defined based on the assumption of a chi-squared distribution and for a given level of significance, . The selection of must be properly chosen, as a relatively high value would lead to an excessive number of outliers as false alarms, whereas too low value could leave some outliers as false negatives. As discussed by Figueiredo et al. [4], herein we assume a level of significance equal to 5%, as is normally acceptable in civil engineering, which corresponds to having 95% of undamaged observations correctly classified and 5% as false alarms.
Given a binary classification in the SHM context, four possible classifier outputs assume the damaged label as positive (P) and the undamaged label as negative (N). The performance of the classifier is assessed based on the overall accuracy, which can be described as:
where TP and FP represent true positives and false positives, respectively, while TN and FN represent true negatives and false negatives, respectively. Additionally, it is well-known that the misclassifications, FP and FN, represent Type I and Type II errors, respectively.
3. Practical Application of Transfer Learning in Three Case Studies
In all three case studies, natural frequencies are used as damage-sensitive features for the source and target bridges, as they are often applied in vibration-based SHM. The natural frequencies are grouped into observations. The JDA method transforms those observations from the original space into a shared latent space, where the distance between the joint distributions of source and target domains is minimized. The training phase corresponds to the determination of the transformation matrix that infers the mapping into a two-dimensional latent space , using half of the observations from the source and target domains. The transformation matrix uses only the knowledge about the healthy condition.
A pre-processing normalization is performed based on the source and target data, using the mean and standard deviation values, i.e., the mean is subtracted from all damage-sensitive features, and their values are divided by the standard deviation.
This paper presents different case studies with observations assuming different patterns. Therefore, the kernel is chosen for each case study in order to better describe the correlation between the data. Their hyperparameters were established according to the performance of the classifier after carrying out an optimization process. Basically, each parameter was determined through an optimization process that proposes the variation of its value and the evaluation of its performance through the classifier.
A classifier for outlier detection is implemented in both feature spaces to evaluate the transfer learning performance, assuming the training data only from the source bridge. The classifier is built with a GMM, and assuming a level of significance equal to .
3.1. Two Pedestrian Bridges
3.1.1. Structural Description and Experimental Datasets
In the Lisbon district of Campo Grande, two similar pedestrian bridges are located 225 m from each other. They are designated herein as the north and south bridges (Figure 2). Both bridges are in front of Lusófona University’s Campus and are characterized by a superstructure consisting of two prefabricated I-shaped beams in reinforced and prestressed concrete, linked by simply supported slabs at the bottom flanges, as shown in Figure 3.

Figure 2.
The north (left) and south (right) pedestrian bridges.
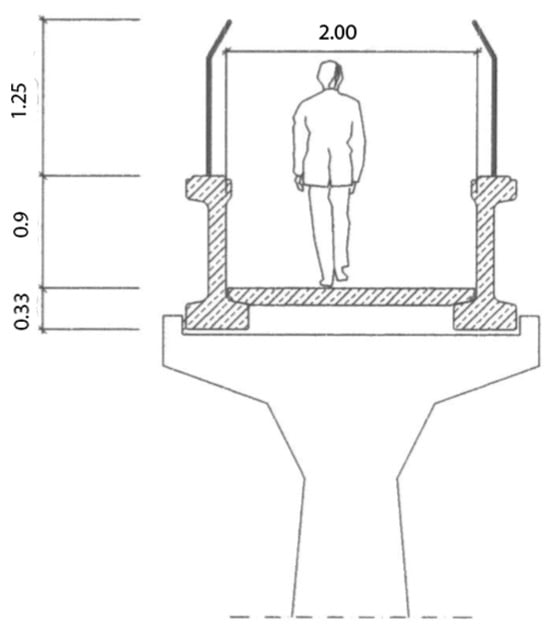
Figure 3.
Typical transverse section of the south bridge (dimensions in meters).
The south bridge was built in the year 2000 to facilitate students’ crossing to the Campo Grande garden, its span is 24.71 m, and its I-beams have a height of 1.23 m. The beams feature prestressed 0.5″ cables, equivalent to a diameter of 12.7 mm, with 20 strands in the lower flange and two in the upper flange. Our research group has used this bridge for almost one decade as a test-bed structure for vibration-based SHM. The north bridge is structurally similar to the south bridge, except that its span is 20.55 m and its main beams have a height of 1.22 m.
Several temporarily monitoring plans were proposed in different periods to measure both bridges’ ambient vibration response under the normal (or healthy) condition. Two special operational conditions were carried out on the south bridge by parading 56 (operational condition I) and 100 (operational condition II) people on the bridge deck for several minutes, which corresponds to 5.8% and 10.4% of the total mass of the deck (assuming an average of 65 kg per person and a bridge deck of 62.75 ton). A smartphone application (App4SHM) measured all acceleration datasets and estimated the first three natural frequencies [21].
Each observation comprised the first three natural frequencies at a given time. Figure 4 shows both bridges’ first three natural frequencies in concatenated format. For the north bridge, there were 90 observations from the healthy condition. On the other hand, for the south bridge, there were 114, 10, and 14 observations, respectively, for the healthy condition, operational condition I, and operational condition II, respectively.
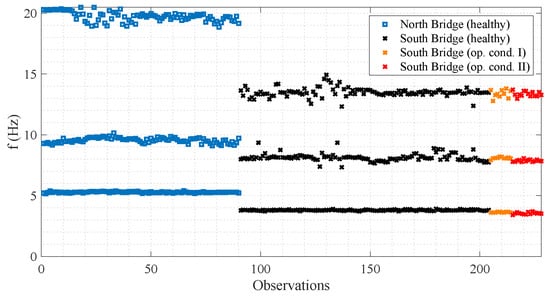
Figure 4.
First three natural frequencies from both pedestrian bridges.
Table 1 shows the average of the natural frequencies of both bridges for all operational and environmental conditions. For the south bridge, the increased mass introduces changes in the natural frequencies, especially in the first one, leading to a variation of −4.41% under the operational condition I and −6.82% under the operational condition II.

Table 1.
Average of the natural frequencies from the north and south bridges.
3.1.2. Experimental-to-Experimental Domain Adaptation
Figure 5a shows all observations from both bridges in the original feature space. The slight differences in the bridges’ structures result in the mismatch of the centroids of the observations for the healthy condition.
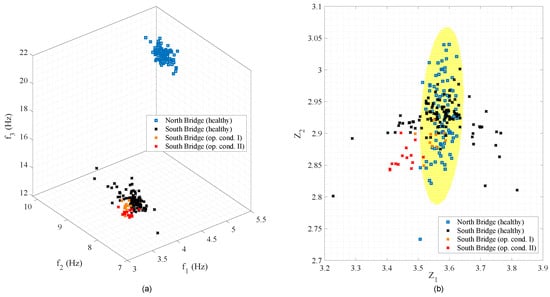
Figure 5.
Pedestrian bridges: (a) observations in the original 3D feature space; (b) observations mapped onto the latent 2D feature space, with the decision boundary defined for a level of significance of 5% in the form of a yellow ellipse.
An experimental-to-experimental domain adaptation is used herein, as experimental data from both bridges exist. Assuming that both bridges are undamaged and the two operational conditions in the south bridge are considered abnormal loading (or damage in this case), the north bridge is assumed as the source domain and the south bridge is assumed as the target domain. The main goal is to show how the undamaged data from the source bridge can be reused to train a classifier to detect the abnormal operational conditions of the target bridge while discriminating to the normal conditions.
The JDA method is performed on the normalized original observations assuming a trade-off parameter, , equal to and a Gaussian kernel with a characteristic length scale set to be , as described in [12]. Figure 5b shows the observations in the latent feature space from both bridges sharing the same region, indicating that the divergences in the observations were minimized.
In both feature spaces, the GMM-based classifier is trained with observations from the north bridge (source domain) only, and assuming one cluster for the outlier damage detection purposes, as indicated by the BIC. A threshold for a level of significance of 5% is assumed. Figure 5b shows several observations from the healthy and special operational conditions outside and inside of the ellipse-shape threshold, respectively, which can contribute to a high number of false positive and false negative indications of damage.
3.2. Twin Bridges over the Itacaiúnas River
3.2.1. Structural Description and Experimental Datasets
Two prestressed concrete box girder bridges located side by side over the Itacaiúnas River in Marabá, Brazil, were built on different dates to meet increasing demand from local traffic (Figure 6). The old bridge was built in the 1980s, while the new one opened to traffic in 2010. Both bridges have a main span of 120 m and two side spans of 70 m. These bridges represent a unique opportunity to apply transfer learning in a real-world situation, as the structures are nominally identical under similar operational and environmental conditions.
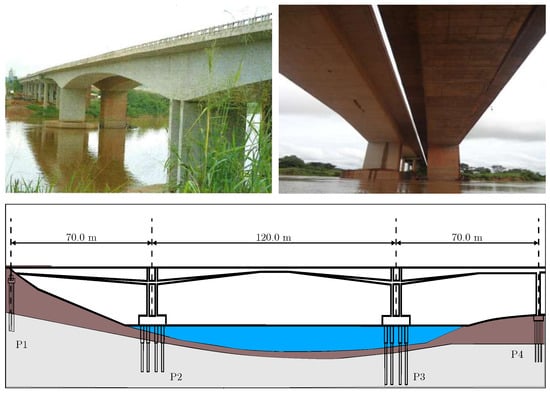
Figure 6.
Above: In each figure, the new (left) and old (right) bridges over the Itacaiúnas River in Brazil; Below: longitudinal section of both bridges.
Even though the central region of the new bridge deck presents excessive deformation, it is assumed herein that it does not effectively impact the bridge’s integrity. Thus, both bridges are assumed to be operating in the healthy condition.
A weekly monitoring plan using the App4SHM [21] was applied over a year to characterize and evaluate the dynamical behavior of both bridges. From October 2021 to October 2022, one technician from the Departamento Nacional de Infraestrutura de Transportes (DNIT) obtained weekly measurements. Figure 7 shows the 52 observations from each bridge composed of natural frequencies. This study uses only the first three natural frequencies associated with bending modes. Although both bridges have identical structures, their dynamic behavior shows differences, as summarized in Table 2. For instance, the first frequency of vibration of the new bridge (1.062 Hz) is 28.7% lower than the one from the old bridge (1.490 Hz).
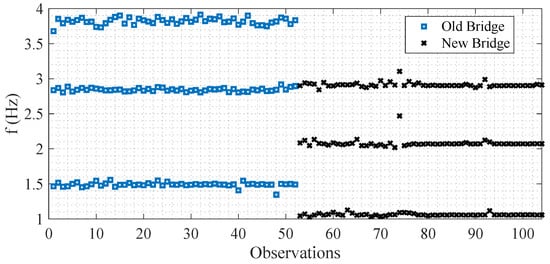
Figure 7.
Observations from the twin bridges (old and new) composed of the first three natural frequencies.

Table 2.
Average natural frequencies of the twin bridges.
3.2.2. Experimental-to-Experimental Domain Adaptation
An experimental-to-experimental domain adaptation was used herein, as experimental data from both bridges exist. Figure 8a illustrates the observations in the original 3D feature space.
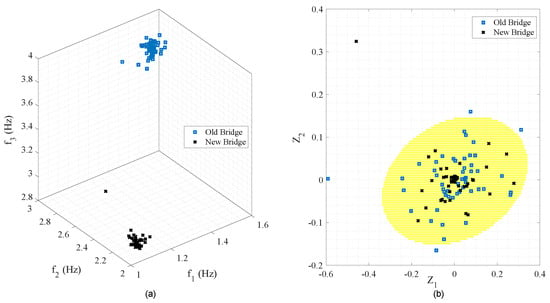
Figure 8.
Twin bridges over the Itacaiúnas River: (a) observations in the original 3D feature space; (b) observations mapped onto the latent 2D feature space, with the decision boundary defined for a level of significance of 5% in the form of an yellow ellipse.
The condition assessment of the new bridge (target domain) was conducted using the knowledge transferred from the old bridge (source domain). The main idea was to capture and transfer the effects of operational and environmental variability. As the bridge operates under a temperature range between 23 °C and 27 °C, and so the temperature does not impact the natural frequencies, significantly, only one cluster was defined to set the GMM-based classifier.
Figure 8b shows the observations in the latent feature space after the application of the JDA method, assuming a linear kernel to correlate the normalized features and a trade-off parameter () equal to . The source and target observations are located in the same region in the latent feature space; meanwhile, the dispersion of the observations are generally the same, which is an indication of the successful domain adaptation in terms of preserving the effects of operational and environmental conditions.
3.3. The Z−24 Bridge
3.3.1. Description and Experimental Datasets
The Z−24 Bridge (Figure 9) was a post-tensioned concrete box girder bridge split into one central span of 30 m and two side spans of 14 m, as illustrated in Figure 10. A monitoring system was installed in the bridge and several experiments were extensively carried out before its demolition to provide a comprehensive “feasible tool” for vibration-based SHM in bridge engineering [22].
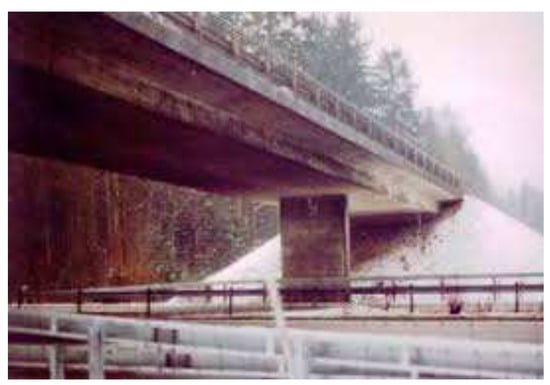
Figure 9.
View of the Z−24 Bridge.
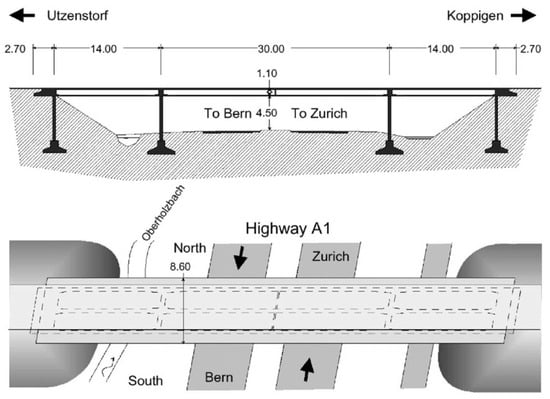
Figure 10.
Longitudinal section (top) and top view (bottom) of the Z−24 Bridge (units in meters) [22].
From 11 November 1997, to 10 September 1998, a long-term monitoring program was conducted to assess the operational and environmental variability induced in the bridge and to determine the presence of damage. The data were acquired using eight accelerometers that captured the bridge’s vibrations every hour, and an array of sensors measured environmental parameters.
The effects of operational and environmental variability were mainly caused by temperature, as the bridge was closed to traffic during the entire monitoring period.
A progressive damage program was implemented in the last month of operation to simulate the presence of real damage scenarios, often found in real situations, and to measure their influence on the dynamics of the bridge [23]. The structural changes caused by the installation of the hydraulic jacks in one of the piers to simulate settlements are herein assumed effects of operational conditions.
Feature extraction was performed using a reference-based stochastic subspace identification method to estimate the natural frequencies [24]. Figure 11a illustrates the first three natural frequencies as damage-sensitive features embedding the bridge’s structural condition for the healthy and damaged conditions. There are 5012 experimental observations, in which 4410 observations represent the healthy condition and 602 observations represented the damaged condition. In the healthy condition, it is possible to observe a variation in the natural frequencies associated with the negative temperature effects caused mainly by the frozen water in the asphalt layer, increasing structural stiffness [23]. Table 3 summarizes the average of the experimental natural frequencies; on average, the second natural frequency is the most affected by damage (−7.57%).
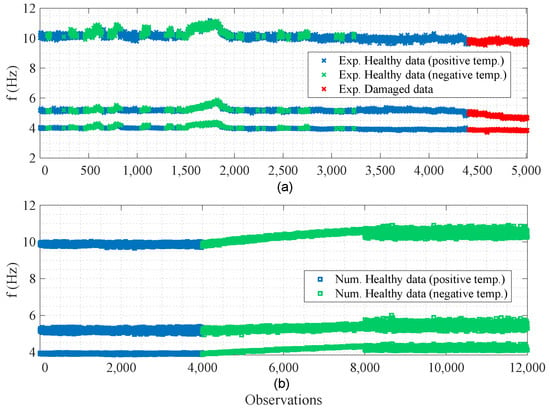
Figure 11.
(a) Experimental observations and (b) numerical observations from the Z−24 Bridge composed of the first three natural frequencies.
3.3.2. Numerical Modeling for Data Generation
Numerical models (Figure 12) were developed to generate new datasets and perform data augmentation from the experimental conditions; that is, the FE models were calibrated to replicate data from the observed operational and environmental conditions in the healthy condition only.
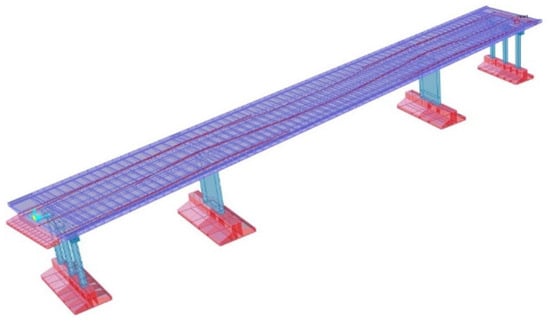
Figure 12.
FE model of the Z−24 Bridge [25].
The FE modeling of the Z−24 Bridge was developed by Bud et al. [25]. A reference model was used to generate three parent FE models to represent the healthy structural condition with variations due to operational and environmental effects. Then, a Latin Hypercube simulation was conducted to investigate the probability distributions of the model parameters and estimate the offspring FE models. The numerical modeling and calibration process is comprehensively described in [25].
In contrast to the previous publication [4] that investigated the environmental impact considering observations in three temperature ranges (baseline, low, and freezing), herein, the observations are grouped in two temperature ranges only (negative and positive temperatures).
Figure 11b shows the natural frequencies generated by the FE models for positive and negative temperature ranges. In addition, Table 3 summarizes the average of the first three numerical natural frequencies and compares them with the ones estimated experimentally. Overall, the FE models are stiffer than the real bridge, as indicated by differences in the natural frequencies. Nevertheless, in the healthy condition, the highest difference () is normally not considered significant for bridge engineering analysis, which shows that the FE modeling embeds the fundamental dynamics of the Z−24 Bridge.

Table 3.
Average natural frequencies of the Z−24 Bridge (experimental and numerical).
Table 3.
Average natural frequencies of the Z−24 Bridge (experimental and numerical).
| Experimental Observations | Numerical Observations | ||
|---|---|---|---|
| Condition | Healthy | Damaged | Healthy |
| 1st Frequency (Hz) | 4.000 | 3.861 (−3.48%) | 4.079 (1.98%) |
| 2nd Frequency (Hz) | 5.207 | 4.813 (−7.57%) | 5.301 (1.81%) |
| 3rd Frequency (Hz) | 10.151 | 9.776 (−3.69%) | 10.202 (0.51%) |
3.3.3. Numerical-to-Experimental Domain Adaptation
Figure 13a shows the observations in the original 3D feature space. Even though the numerical modeling shows an increase in the natural frequencies due to the influence of temperature on the dynamic behavior of the bridge, the experimental and numerical natural frequencies present some divergences. As shown in Table 3, the differences in the first three natural frequencies (, , and ) may not be significant for structural analysis, but it may challenge the application of numerical data to train a classifier, as shown in [25].
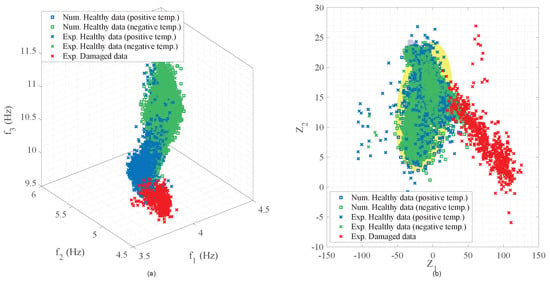
Figure 13.
Z−24 Bridge: (a) Observations in the original 3D feature space; (b) observations in the latent 2D feature space, with the decision boundaries defined by the classifier in the form of ellipses.
Therefore, a numerical-to-experimental domain adaptation is used herein. Numerical modeling is considered the source domain, and long-term monitoring (or experimental) data are investigated as the target domain.
The JDA method is used for domain adaptation, with a regularization parameter equal to and a combination of linear and exponential kernels to correlate the normalized observations from the source and target domains, assuming a characteristic length scale, , as described in [4]. The transformation matrix comprises the knowledge about the operational and environmental effects contained in the datasets under a healthy condition.
The effects of negative and positive temperatures on the numerical natural frequencies are modeled with a GMM-classifier with two clusters, as shown in [18].
Figure 13b shows the observations in the latent 2D feature space, assuming the numerical observations as the source domain and the experimental ones as the target domain, along with the decision boundaries defined by the classifier for a level of significance of 5%.
4. Discussion, Limitations, Challenges, and Opportunities
For all three case studies, the GMM-based classifier assumed only the source datasets (and knowledge) for the training phase. As summarized in Table 4, the number of clusters considered to model the healthy condition was set to be one, except for the case study involving the Z−24 Bridge, which assumed two clusters to address the structural effects associated with positive and negative temperatures.

Table 4.
Accuracy in both original and latent feature spaces, when transferring knowledge from source to target bridges.
The JDA method is shown to present reasonable stability as the variation of its trade-off parameter does not significantly affect the distribution of the observations in the latent space. However, the proper selection of the kernel and its hyperparameters is not trivial, and a negative transfer may occur if they are not performed correctly. Therefore, the kernel used to correlate feature patterns may be different for each case study as the observations are extracted under distinct operational and environmental conditions. Therefore, the kernel selection is case-specific, and a sensitivity analysis is a solution to find the optimal kernel for each application.
In addition, determining the transformation matrix related to the JDA method using only knowledge about the healthy condition is shown to reduce the source and target joint distribution divergences even under operational and environmental effects, while preserving changes in the observations from the damaged condition.
In all case studies, the observations are properly aligned in the latent feature space according to their structural conditions, resulting in an improved binary classification (healthy or damaged) performance compared to the one obtained in the original feature space, as summarized in Table 4. For the pedestrian bridges, the classification accuracy shows an improvement from in the original feature space to in the latent feature space. The relatively low accuracy (68.1%) observed in the latent feature space of the pedestrian bridges is attributed to the relatively low changes in the natural frequencies of the south bridge caused by the operational conditions (less than 6.82%). Therefore, it is important to ensure the separability of observations in the original space so that knowledge transfer is carried out properly. For the twin bridges, the classification performance moves from in the original feature space to in the latent feature space. For the Z−24 Bridge, in the original feature space, the dynamical behavior of the bridge affected by negative temperature significantly impacts the performance of the classifier, as demonstrated by the low accuracy (). However, the classification accuracy is improved to after mapping the observations onto the latent feature space.
One can notice that domain adaptation aims to reduce the source and target joint distribution divergences from a statistical point of view without any physical insights. Therefore, as shown in this paper, especially with the twin bridges, when the domain adaptation is performed based on an unsupervised strategy, it is not guaranteed that changes in the source data caused by normal operational and environmental conditions will be separable from changes caused by damage.
Even though the data mapping onto the latent feature space may be challenging to interpret the physical phenomena, as the observations are dimensionless, the domain adaptation through JDA ensures the aligning of the observations while keeping their statistical properties. Thus, transfer learning can also be applied to describe the dynamical behavior of structures in a lower-dimensional space.
Finally, the success of knowledge transfer to support the assessment of the integrity of different bridges may be associated with the similarities of their dynamic behavior and the characteristics of the structures investigated. This results from the label consistency requirement imposed on domain adaptation, which demands the same structural conditions in the source and target domains. In this paper and for all case studies, only damage detection is performed on each pair of bridges analyzed. For a deeper assessment of the damage identification hierarchy, equivalence between the labels of the investigated domains regarding structural conditions such as type of damage, level of existing damage, and damage location in the structure should exist for correct knowledge transfer.
5. Conclusions and Final Remarks
This paper presented the principle of using unsupervised transfer learning to detect damage in prestressed concrete bridges using knowledge from other previously analyzed bridges. It also provided an in-depth overview of transfer learning, detailing the prerequisites for successful knowledge transfer and surveying current methodologies. The merits of unsupervised transfer learning over traditional methods commonly employed in SHM scenarios were compared using training datasets in the original and latent feature spaces.
The effectiveness of unsupervised transfer learning was showcased across numerical-to-experimental and experimental-to-experimental domain adaptation procedures, with the exclusive use of the JDA method. These two procedures were applied across three case studies that cover several prestressed concrete bridges under varying operational and environmental conditions. In most cases, the performance of the classifiers, when trained solely using data from the source bridge, showed improvements after domain adaptation when assessed on a target bridge. However, it was highlighted that the best accuracy arises when observations from healthy and damaged conditions are distinct in the original feature space. Factors that introduce changes in structural behavior, which do not significantly alter the natural frequency patterns, can result in a negative transfer phenomenon.
At the current stage of development and based on the authors’ experience, unsupervised transfer learning and domain adaptation have validated the generalization of SHM to prestressed concrete bridges without long-term monitoring data as the main advantage. Significant financial savings and full SHM coverage are expected, as bridge authorities do not need to fully monitor all bridges. However, for a given bridge, it is still to be proven whether the reuse of long-term monitoring data from other bridges yields superior classification results than the usage of long-term monitoring data from the same bridge. Unless test data are obtained from the same structure in the same operational and environmental conditions, the machine learning inferences from the training data will not provide accurate predictions when applied to the test data. It is the authors’ opinion that there is a trade-off for each classifier between its generalization capabilities and its accuracy.
Author Contributions
Conceptualization, E.F. and L.S.; methodology, L.S. and M.O.Y.; software, M.O.Y.; investigation, L.S.; resources, L.S.; data curation, L.S.; original draft preparation, L.S. and M.O.Y.; review and editing, E.F. and S.d.S.; supervision, E.F. and S.d.S.; project administration, L.S. All authors have read and agreed to the published version of the manuscript.
Funding
This work was funded by the Portuguese Foundation for Science and Technology (FCT) through national funds (PIDDAC) under the R&D Unit “Civil Engineering Research and Innovation for Sustainability (CERIS)”, reference UIDB/04625/2020. Marcus Omori Yano, Samuel da Silva, and Eloi Figueiredo express their thanks for the financial support provided by Coordenação de Aperfeiçoamento de Pessoal de Nível Superior (CAPES/Brazil)-Finance Code 001 and CAPES/FCT grant number 675 2019.00164.CBM and the Portuguese National Funding Agency for Science Research and Technology (FCT/Portugal) for promoting the collaboration between Brazil and Portugal. Marcus Omori Yano acknowledges the funding from the Coordenação de Aperfeiçoamento de Pessoal de Nível Superior (CAPES/Brazil) grant numbers 88882.433643/2019-01 and 88887.647575/2021-00. Samuel da Silva is thankful to the Brazilian National Council of Technological and Scientific Development (CNPq) grant number 309467/2023-3. Finally, Samuel da Silva and Eloi Figueiredo are also thankful to São Paulo Research Grant Number 24/00720-8 from FAPESP.
Data Availability Statement
Some or all data, models, or codes that support the findings of this study are available from the corresponding author upon reasonable request.
Acknowledgments
Laura Souza acknowledges all support given by the Departamento Nacional de Infraestrutura de Transportes (DNIT) during the experimental campaigns; Núcleo de Instrumentação e Computação Aplicada à Engenharia—NICAE/UFPA; and Polícia Rodoviária Federal (PRF).
Conflicts of Interest
The authors declare no conflicts of interest.
References
- Figueiredo, E.; Brownjohn, J. Three decades of statistical pattern recognition paradigm for SHM of bridges. Struct. Health Monit. 2022, 21, 3018–3054. [Google Scholar] [CrossRef]
- Figueiredo, E.; Park, G.; Farrar, C.; Worden, K.; Figueiras, J. Machine Learning Algorithms for Damage Detection under Operational and Environmental Variability. Struct. Health Monit. 2011, 10, 559–572. [Google Scholar] [CrossRef]
- Farrar, C.; Worden, K. Structural Health Monitoring: A Machine Learning Perspective; John Wiley & Sons, Ltd.: Chichester, UK, 2013. [Google Scholar]
- Figueiredo, E.; Yano, M.O.; da Silva, S.; Moldovan, I.; Bud, M.A. Transfer Learning to Enhance the Damage Detection Performance in Bridges When Using Numerical Models. J. Bridge Eng. 2023, 28, 04022134. [Google Scholar] [CrossRef]
- Bull, L.; Gardner, P.; Dervilis, N.; Papatheou, E.; Haywood-Alexander, M.; Mills, R.; Worden, K. On the transfer of damage detectors between structures: An experimental case study. J. Sound Vib. 2021, 501, 116072. [Google Scholar] [CrossRef]
- Gardner, P.; Liu, X.; Worden, K. On the application of domain adaptation in structural health monitoring. Mech. Syst. Signal Process. 2020, 138, 106550. [Google Scholar] [CrossRef]
- Gardner, P.; Bull, L.; Gosliga, J.; Dervilis, N.; Worden, K. Foundations of population-based SHM, Part III: Heterogeneous populations—Mapping and transfer. Mech. Syst. Signal Process. 2021, 149, 107142. [Google Scholar] [CrossRef]
- Ritto, T.; Worden, K.; Wagg, D.; Rochinha, F.; Gardner, P. A transfer learning-based digital twin for detecting localised torsional friction in deviated wells. Mech. Syst. Signal Process. 2022, 173, 109000. [Google Scholar] [CrossRef]
- Zhu, J.; Zhang, C.; Qi, H.; Lu, Z. Vision-based defects detection for bridges using transfer learning and convolutional neural networks. Struct. Infrastruct. Eng. 2020, 16, 1037–1049. [Google Scholar] [CrossRef]
- Tronci, E.M.; Beigi, H.; Feng, M.Q.; Betti, R. A transfer learning SHM strategy for bridges enriched by the use of speaker recognition x-vectors. J. Civ. Struct. Health Monit. 2022, 12, 1285–1298. [Google Scholar] [CrossRef]
- Pan, Q.; Bao, Y.; Li, H. Transfer learning-based data anomaly detection for structural health monitoring. Struct. Health Monit. 2023, 22, 3077–3091. [Google Scholar] [CrossRef]
- Yano, M.O.; Figueiredo, E.; da Silva, S.; Cury, A. Foundations and applicability of transfer learning for structural health monitoring of bridges. Mech. Syst. Signal Process. 2023, 204, 110766. [Google Scholar] [CrossRef]
- Pan, S.J.; Yang, Q. A survey on transfer learning. IEEE Trans. Knowl. Data Eng. 2010, 22, 1345–1359. [Google Scholar] [CrossRef]
- Yang, Q.; Zhang, Y.; Dai, W.; Pan, S.J. Transfer Learning; Cambridge University Press: Cambridge, UK, 2020. [Google Scholar]
- Wang, Z.; Dai, Z.; Poczos, B.; Carbonell, J. Characterizing and avoiding negative transfer. In Proceedings of the IEEE/CVF Conference on Computer Vision and Pattern Recognition, Long Beach, CA, USA, 15–20 June 2019; pp. 11293–11302. [Google Scholar]
- Long, M.; Wang, J.; Ding, G.; Sun, J.; Yu, P.S. Transfer Feature Learning with Joint Distribution Adaptation. In Proceedings of the IEEE International Conference on Computer Vision (ICCV), Sydney, Australia, 1–8 December 2013. [Google Scholar]
- Gardner, P.; Bull, L.; Dervilis, N.; Worden, K. Overcoming the problem of repair in structural health monitoring: Metric-informed transfer learning. J. Sound Vib. 2021, 510, 116245. [Google Scholar] [CrossRef]
- Figueiredo, E.; Cross, E. Linear approaches to modeling nonlinearities in long-term monitoring of bridges. J. Civ. Struct. Health Monit. 2013, 3, 187–194. [Google Scholar] [CrossRef]
- McLachlan, G.J.; Peel, D. Finite Mixture Models; Wiley Series in Probability and Statistics; Wiley: New York, NY, USA, 2000. [Google Scholar]
- Dempster, A.; Laird, N.; Rubin, D. Maximum likelihood from incomplete data via the EM algorithm. J. R. Stat. Society. Ser. B (Methodol.) 1977, 39, 1–38. [Google Scholar] [CrossRef]
- Figueiredo, E.; Moldovan, I.; Alves, P.; Rebelo, H.; Souza, L. Smartphone Application for Structural Health Monitoring of Bridges. Sensors 2022, 22, 8483. [Google Scholar] [CrossRef]
- Peeters, B.; De Roeck, G. One-year monitoring of the Z24-Bridge: Environmental effects versus damage events. Earthq. Eng. Struct. Dyn. 2001, 30, 149–171. [Google Scholar] [CrossRef]
- Peeters, B.; Maeck, J.; Roeck, D.D. Vibration-based damage detection in civil engineering: Excitation sources and temperature effects. Smart Mater. Struct. 2001, 10, 518–527. [Google Scholar] [CrossRef]
- Peeters, B.; Roeck, D.D. Reference-based stochastic subspace identification for output-only modal analysis. Mech. Syst. Signal Process. 1999, 13, 855–878. [Google Scholar] [CrossRef]
- Bud, M.; Moldovan, I.; Radu, L.; Nedelcu, M.; Figueiredo, E. Reliability of probabilistic numerical data for training machine learning algorithms to detect damage in bridges. Struct. Control Health Monit. 2022, 29, e2950. [Google Scholar] [CrossRef]
Disclaimer/Publisher’s Note: The statements, opinions and data contained in all publications are solely those of the individual author(s) and contributor(s) and not of MDPI and/or the editor(s). MDPI and/or the editor(s) disclaim responsibility for any injury to people or property resulting from any ideas, methods, instructions or products referred to in the content. |
© 2024 by the authors. Licensee MDPI, Basel, Switzerland. This article is an open access article distributed under the terms and conditions of the Creative Commons Attribution (CC BY) license (https://creativecommons.org/licenses/by/4.0/).
