Abstract
The management of unutilized fly ash poses challenges due to concerns about storage and its potential groundwater contamination. Within the road industry, where the bulk utilization of fly ash is feasible, its unsuitability for use in the base and sub-base layers of pavements due to its low strength and a high proportion of fine particles has been a limitation. The incorporation of stone dust alongside fly ash, treated with lime or cement, yields superior strength and stiffness. Apart from strength, the stabilized mix’s durability, capillary rise, and water absorption properties are crucial for determining its suitability for pavement applications. Observations from this study reveal that fiber-reinforced cement-stabilized fly ash–stone aggregate specimens treated with 4% and 6% cement, with and without fibers, met the limiting mass loss of 20%, as specified in IRC SP: 89. The mass loss decreases with an increase in cement and fiber content. However, the capillary rise in the mixes increases with a higher percentage of fly ash and fiber content but decreases with increased cement content. Cement addition results in a reduction in water absorption; however, the addition of fibers results in an increase in water absorption. A linear correlation has been established between mass loss and UCS and IDT, which can be used to evaluate the suitability of materials for the structural layer without conducting a wet–dry durability test, which typically takes one month. This study proposes that cement-stabilized fly ash and stone aggregate mixtures with 4% and 6% cement can be used as the subbase and base of pavement based on wet–dry mass loss criteria and water absorption criteria. Observations from this study reveal that fiber-reinforced cement-stabilized fly ash–stone aggregate specimens treated with 4% and 6% cement, with and without fibers, met the limiting mass loss of 20%, as specified in IRC SP: 89. The mass loss decreases with an increase in cement and fiber content. However, the capillary rise in the mixes increases with a higher percentage of fly ash and fiber content but decreases with increased cement content. Cement addition results in reduction in water absorption. However, the addition of fibers results in increase in water absorption. A linear correlation is established between mass loss and UCS and IDT, which can be used to evaluate the suitability of materials for the structural layer without conducting wet–dry durability tests, which take one month. This study proposes that cement-stabilized fly ash and stone aggregate mixtures with 4% and 6% cement can be used as the subbase and base of pavement based on wet–dry mass loss criteria and water absorption criteria.
1. Introduction
Thermal power plants have been meeting urban energy needs, but they also generate significant quantities of fly ash as a byproduct. As per ASTM C 618 [1], fly ash is categorized into two classes, i.e., Class C and Class F, based on the percentages of calcium oxide (CaO) present in it. Class C fly ash possesses significantly higher percentages of CaO compared to Class F, and hence reacts with water easily without needing any activators such as lime or cement.
Engineers and policymakers have expressed concern over the storage challenges of fly ash and its potential to contaminate groundwater. Over the years, extensive research and committed efforts have enabled the large-scale reutilization of fly ash in the production of various construction materials, such as cement, bricks, tiles, and more [2,3]. This not only alleviates storage concerns but also mitigates potential hazards associated with fly ash disposal. Fly ash has also found applications in filling embankments [4,5] and serving as a stabilizing agent when combined with lime and cement to improve road materials properties [6,7]. However, large quantities of fly ash are still unutilized and much more effort is required to maximize fly ash’s utilization.
Untreated fly ash exhibits unsuitability for utilization in the base and sub-base layers of pavement. This is primarily attributed to its low strength and a high proportion of fine particles. However, when fly ash is subjected to treatment with substances like bentonite, lime, cement, or silica, it demonstrates enhanced strength and compatibility, as indicated by [8,9,10]. This strength increase is attributed to the pozzolanic properties of fly ash. The addition of cement to the fly ash also reduces its liquid limit and lowers the shrinkage potential [11]. Hence, it is suitable for use in the construction industry.
Furthermore, incorporating stone dust or quarry dust alongside fly ash and subsequently treating the mixture with lime or cement results in even greater strength and stiffness, surpassing the performance of treated fly ash alone [10]. This improvement can be attributed to the enhanced particle gradation within the fly ash–stone dust mixture compared to only fly ash. Researchers [12,13] have also reported that a mixture of fly ash and granulated blast furnace slag stabilized with lime has the potential to be used in the base layer of pavement and can be considered as an alternative to the wet mix macadam layer. Pavement constructed with cement-stabilized fly ash has performed satisfactorily in Great Britain, France and the United States [14].
In the realm of pavement applications, any potential stabilized mixture must adhere to the predetermined minimum strength and durability criteria established by the road agency as mentioned in Table 1 and Table 2, respectively. The minimum strength prerequisites guarantee that the mixture remains resistant to premature failure under load, while durability ensures that the stabilized mix can endure diverse climatic conditions. The evaluation of stabilized mix durability typically involves measuring the mass loss of specimens subjected to alternating wetting and drying cycles. Researchers such as Beriha et al. [15] and Patel et al. [16] have also noted changes in the mechanical properties, including the resilient modulus, unconfined compressive strength (UCS), and flexural strength (FS), during wetting and drying cycles to assess the durability of the stabilized mixes. Barmade et al. [17] reported a mass loss of 9.2% for a quarry dust–fly ash mix (40–60) stabilized with 3% lime after 12 wet–dry cycles, which falls below the 14% threshold recommended in the Indian guideline IRC SP:89 [18]. Additionally, Patel et al. [16] observed that the resilient modulus value of stabilized fly ash increases with the number of wet–dry cycles, attributed to the enhancement of pozzolanic reactions during the wet–dry process.

Table 1.
Strength criteria for stabilized subbases and bases of medium- to high-volume roads.

Table 2.
Permissible mass loss in the wet–dry durability test.
In addition to the wet–dry (W-D) cycles caused by the seasonal transition from monsoon to summer, the elevation of the natural water table also impacts the strength of stabilized mixes. Water infiltrates the pore spaces within the mix, causing it to soften and leading to the disintegration of the mixture [8]. Samanta [11] observed a reduction of 2% to 15% in the UCS value of specimens with varying cement percentages after being immersed in water for 24 h. Another study by Ghosh and Subbarao [8] reported a loss in UCS ranging from 2% to 30% for different mixes of lime-stabilized fly ash. The amount of water that a stabilized fly ash specimen will absorb depends on the content of the stabilizer [14]. With the increase in cement quantity, the water absorption quantity also increases, which reduces the strength. Moreover, samples with a moisture content higher than the optimum moisture content (OMC) absorbed less water compared to samples with a moisture content lower than the OMC.
This study conducts a thorough examination of a fiber-reinforced cement-stabilized fly ash–stone dust–crushed stone aggregate mixture. The investigation encompasses an analysis of its durability, capillary rise, and water absorption properties, aiming to determine its suitability for application in the subbase and base layers of pavement.
2. Materials and Methods
2.1. Materials
In this investigation, three types of raw materials were used: fly ash, stone dust and crushed stone aggregate. Cement and polypropylene fibers were used as binding and reinforcing agents in the present study respectively. Figure 1 shows the materials used in this study.
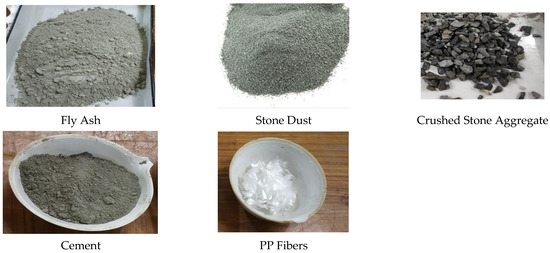
Figure 1.
Materials used in present study.
2.1.1. Fly Ash
Fly ash (FA) was collected from the NALCO thermal power plant situated in Angul, India. The physical and chemical properties of fly ash were determined and are presented in Table 3 and Table 4. Specific gravity is a measure of the density of a material compared to the density of water. The specific gravity of the fly ash was 2.14, indicating that it is relatively dense. The liquid limit and plastic limit were categorized as “non-plastic”, suggesting that the fly ash did not exhibit significant plastic properties. For the fly ash, the maximum dry density was 1.35 g/cc. The fly ash was described as grey, which is a common characteristic of this material. Table 4 shows that the fly ash contained a substantial amount of SiO2. As the percentage of SiO2, Al2O3, and Fe2O3 combined was 95.77 and the CaO content was low (1.05), the fly ash was graded as Class “F” Fly Ash as per ASTM C618 [1]. The gradation of oven-dried fly ash is shown in Figure 2. The collected fly ash consisted of around 23% particles of sand size and approximately 77% fine particles. According to the Indian soil classification system, the fly ash used in the present study was classified as ML.

Table 3.
Physical properties of fly ash.

Table 4.
Composition of chemicals in fly ash.
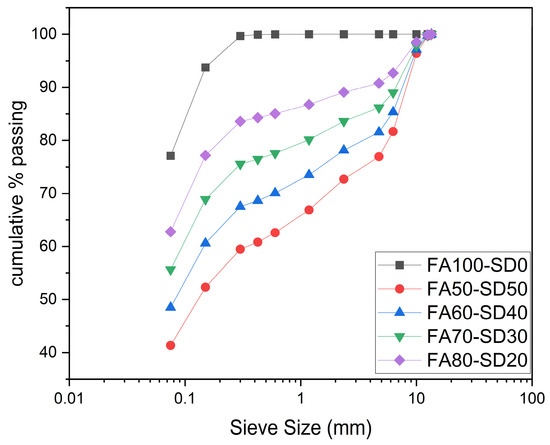
Figure 2.
Particle size distribution of FA–SD mixtures at various ratios.
2.1.2. Stone Dust and Crushed Stone Aggregates
Stone crusher dust and crushed stone aggregates (combined and designated as SD) were procured from the stone crusher at Tapang of Khurdha District in Odisha state. The maximum particle size of the stone dust and aggregate was 4.75 mm and 12.5 mm respectively. The SD was mixed with fly ash in different proportions to improve the gradation, as shown in Figure 2.
2.1.3. Cement
The cement used in this investigation adhered to the specifications of Ordinary Portland Cement (OPC) grade 43, in accordance with IS 8112 [23]. It was purchased from the local distributor at Bhubaneswar, Odisha State, India.
2.1.4. Fibers
Randomly oriented, non-corrosive, 100% virgin polypropylene (PP) fibers were obtained from EXTEX Industries Pvt. Ltd, Mumbai, India. These fibers were used in this study for reinforcement and the enhancement of the strength of the mixture. The physical characteristics of the PP fibers were obtained from the manufacturer and are presented in Table 5.

Table 5.
Physical characteristics of polypropylene fibers.
2.2. Mix Proportioning
Stone dust and aggregates were combined with fly ash to enhance gradation, with maximum particle sizes of 1.18 mm, 4.75 mm, and 12.5 mm for the fly ash, stone dust, and aggregates, respectively. A 50:50 ratio of stone dust and aggregates, referred to as SD, was utilized. Different mixtures of fly ash and stone aggregate (FA80-SD20, FA70-SD30, 60FA-40SD, and FA50-SD50) were tested to improve gradation. The particle size distribution curve of the mixtures in Figure 2 illustrates the improved gradation. Stabilization of the mixtures was carried out using cement at concentrations of 4% and 6% by mass. Additionally, fibers were incorporated at rates of 0.25%, 0.35%, and 0.50% by mass of the mixture of fly ash and stone aggregates to mitigate the brittleness of the mixtures. The notation of the mixtures is given in Table 6.

Table 6.
Notation of samples prepared for testing.
2.3. Sample Preparation and Curing
The initial phase involved conducting a standard Proctor test on various mixtures, adjusting the proportions of fly ash (FA), cement I, stone dust (SD), aggregate (AG), and fibers (FI). The optimum moisture content (OMC) and maximum dry density (MDD) obtained from the Proctor test were subsequently used for mixture preparation throughout the testing process. In each experiment, a predetermined amount of FA was collected in a tray and oven-dried for nearly 24 h. FA, C, SD, AG, and FI quantities were determined by the MDD and carefully mixed in varying proportions. Water, dependent on the OMC, was then added to the mixtures for specimen preparation.
During trial tests, it was observed that fibers could be more easily blended with stabilized FA in a moist state than in a dry state. Consequently, the dry FA–CEM (FC) mixture or the dry FA-CEM-SD–AGG (FA-SA) mixture was initially mixed with water and then combined with randomly distributed fibers. The samples were wrapped in 8 to 10 layers to prevent moisture evaporation using a wrapper. Specimens were kept in the laboratory for curing, with moist gunny bags covering them and being kept moist by periodic water sprinkling during the curing period. Different mold sizes were employed to prepare samples for various tests (UCS, IDT and FS). For the UCS test, a sample size of 100 mm in diameter and 115 mm in length was considered. Similarly, cylindrical samples of 100 mm in diameter and 60 mm in length were used for indirect tensile strength (IDT) tests. Further details of the tests are outlined in Table 7.

Table 7.
Test program for the conduction of laboratory tests.
2.4. Experimental Investigation
2.4.1. Unconfined Compressive Strength Test
The strength of stabilized mixes is commonly evaluated using the UCS value. This study adhered to the procedures outlined in ASTM D1633 [24], wherein cylindrical specimens measuring 100 mm in diameter and 115 mm in height were cured for a predetermined period and subjected to loading at a rate of 1.25 mm/min until failure. The UCS value of the specimen is given by Equation (1).
where P denotes the highest compressive load exerted on the specimen failing and A denotes the cross-sectional area of the specimen.
2.4.2. Indirect Tensile Strength (IDT) Test
In addition to compressive loads, the bound material within the pavement undergoes tensile stress from factors such as traffic loading and temperature gradients. Directly determining tensile strength involves a complex process, making the use of IDT more preferable. The IDT test entails applying compressive loads to a cylindrical sample distributed along two axial lines diametrically opposite to each other. This loading configuration produces a relatively uniform tensile stress both perpendicular to and along the diametric plane. In this study, IDT tests were conducted following the approach suggested by Yeo [25], with certain modifications. The IDT value is determined as per the Equation (2).
where P represents the failure load, D denotes the diameter of the specimen, and t denotes the thickness of the specimen.
2.4.3. Wet–Dry Durability Test
The durability of stabilized mixes reflects the ability of specimens to withstand repeated wetting and drying cycles. This study adhered to the protocol outlined in ASTM D559 [26]. Cylindrical specimens (100 mm in dia. and 115 mm in height) were cured for 28 days and subsequently exposed to 12 wet–dry cycles. A single wetting and drying cycle involved soaking the specimens for a period of 5 h in water, followed by heating at 72 °C for 42 h, and concluded with hand brushing. At the end of every cycle, the mass loss was calculated. A schematic diagram showing a wet–dry cycle is presented in Figure 3.
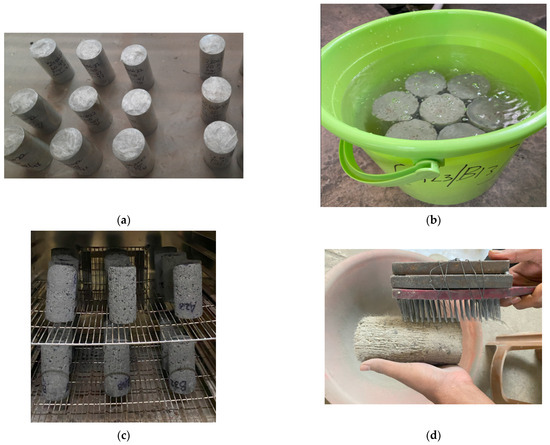
Figure 3.
Steps of wet–dry durability test. (a) Cylindrical samples after 7 days of curing; (b) samples immersed in water for 5 h; (c) samples in oven at 72 °C for 42 h; (d) samples under hand brushing.
2.4.4. Capillary Rise and Water Absorption Test
The capillary rise and water absorption test were conducted following the Australian standard AS 1141.53 [27], as illustrated in Figure 4. In this study, cylindrical specimens (100 mm in dia. and 115 mm in height) cured for 7 days were used. After achieving a constant mass (mdry) in an oven at 55 °C, the dried samples were placed in a dish filled with water reaching up to 10 mm from the base to simulate capillary rise. The ascent of water was measured at various time intervals, as depicted in Figure 5, showcasing specimens undergoing the water absorption and capillary rise test. After 72 h, the specimens were extracted from the dish. The mass of the dampened specimens (mdamp) was then recorded. These specimens were subsequently placed in an oven at 105 °C. The process continued until a constant mass (md) was achieved. Capillary rise (CR) was calculated as the height of capillary rise expressed as a percentage of the total height of specimens. Additionally, the calculation involves considering the total water absorption given by Equation (3).

Figure 4.
Schematic drawing showing capillary rise test. (a) initial stage of water absorption and capillary rise test; (b) water absorption and capillary rise test after time t.
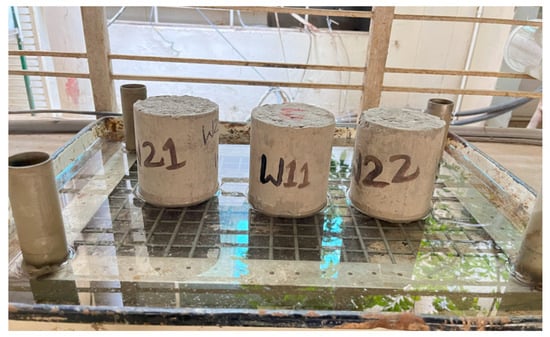
Figure 5.
Specimens undergoing the water absorption and capillary rise test procedure.
2.4.5. X-ray Diffraction Test and Scanning Electron Microscopic Study
X-ray diffraction (XRD) was conducted to determine the mineralogical composition of virgin fly ash and fly ash, stone aggregate, and cement mixture. SEM is usually conducted to study the microstructure of clay particles. SEM is very useful for studying various soil features like soil composition, voids present in the soil, bonds between particles, fracture surface, etc. Fly ash and a cement-stabilized fly ash–stone dust mixture was used for SEM analysis, utilizing ZEISS EV-18 SEM coupled with energy dispersive spectroscopy (EDS).
3. Result and Discussions
3.1. Wet–Dry Durability
The wet–dry durability test outcomes, presented as mass loss, are expressed as a percentage of the initial dry weight of the stabilized fly ash–stone aggregate mixtures reinforced with polypropylene fibers. The mass loss of various fly ash stone aggregate samples is shown in Table 8. The degraded samples after 12 cycles of wet and dry testing are shown in Figure 6.

Table 8.
Mass loss of FA–SD mixes.
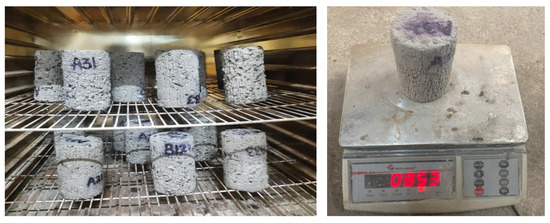
Figure 6.
Degraded samples after 12 cycles.
3.1.1. Effect of Cement Content on Mass Loss of FA–SD Mixes
Figure 6 shows the effect of cement on the mass loss of fly ash mixed with stone aggregate stabilized with cement. It can be seen from Figure 7 that the mass loss of the FA80-SD20-C4 samples is higher than that of the others. The mass loss decreases as the cement content increases from 4% to 6% for the FA60-SD40 and FA70-SD30 samples. This suggests that the cavities are filled with an increased amount of cement gel. Furthermore, the increase in stabilized fine fly ash particles reduces mass loss as the voids are filled with cementitious gel during the pozzolanic action of fly ash, which is evident in the microstructural and mineralogical study.
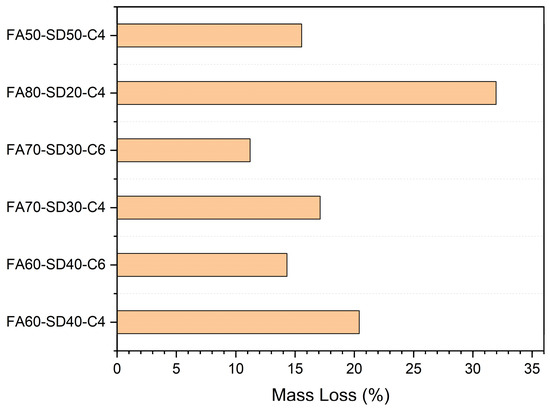
Figure 7.
Effect of cement on mass loss of FA–SD mixes (0% fiber).
The mechanism underlying the strength enhancement in the cement stabilization of fly ash and aggregate involves both cement hydration and pozzolanic reactions. Key cement components, C3S, and C2S, react with water to produce calcium hydroxide and hydration products, notably calcium silicate hydrate (CSH), as presented in Equation (4). CSH, possessing a gel-like consistency, acts to bind together inert aggregate particles and fly ash particles. As a pozzolanic material, fly ash reacts with Ca(OH)2 in the presence of water (Equation (5)), as corroborated by Furlan et al. [28], Solikin et al. [29] and Zimar et al. [30]. This pozzolanic reaction results in the formation of additional strength-enhancing compounds such as CSH and CASH, similar to those generated during the hydration of Portland cement.
Cement hydration reaction:
Pozzollanic reaction:
The XRD test results of fly ash and cement-treated fly ash, as depicted in Figure 8a,b, reveal quartz as the predominant compound in all cases. Simultaneously, the appearance of new peaks in the cement–fly ash mixture indicates the presence of cementitious products like portlandite, calcite, and zeolite. These compounds are formed due to the addition of cement.
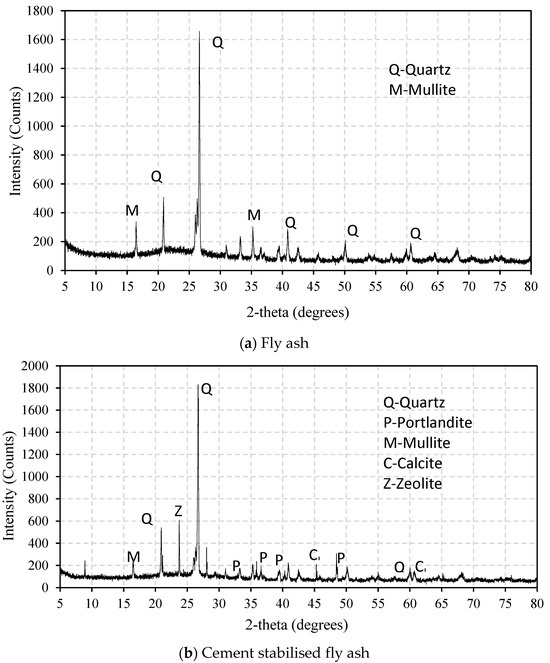
Figure 8.
XRD test results of (a) fly ash and (b) stabilized fly ash.
The SEM image (Figure 9) of fly ash and the cement-stabilized fly ash mixture reveals the original spherical shape of the fly ash particles in virgin fly ash, and this spherical form is maintained in the cement-stabilized fly ash. Concurrently, cement hydration products (C–S–H) have developed on the surface of the fly ash particles. Needle-like crystals, identified as ettringite, a byproduct of cement hydration, are also observable on the fly ash particle surfaces. Microstructure images of the cement-stabilized fly ash samples show the aggregation of fly ash and cement particles, forming large fly ash–cement clusters due to the presence of ettringite.
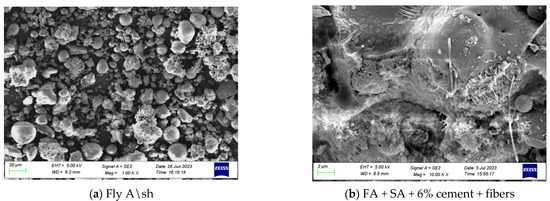
Figure 9.
SEM photographs. (a) Fly ash; (b) fly ash + cement + fibers.
The cementitious product formed is stable in both the intra-aggregate and inter-aggregate pores, facilitated by physicochemical attractive forces and capillary action between the fly ash–cement clusters and cement gel, respectively. The strength of the cement-stabilized sample is attributed to the resistance offered by the inter-clusters and intra-clusters of fly ash particles, bonded by cement hydration products, against deformation.
3.1.2. Effect of Fiber Percentages on Mass Loss of the Stabilized FA–SD Mixes
Figure 10 illustrates the impact of fibers on durability, expressed as the percentage of mass loss in fly ash–stone aggregate mixtures stabilized with 4% and 6% cement. From the figure, it can be seen that the mass loss of the fiber-reinforced cement-stabilized fly ash–stone aggregate mix samples decreases with the increase in fiber content from 0.25% to 0.5%.
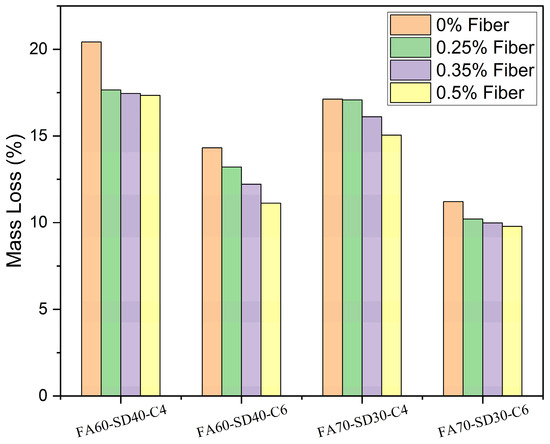
Figure 10.
Mass loss in percentage of the fiber-reinforced cement-stabilized fly ash–stone aggregate mix.
It is observed that the mass loss of the fiber-reinforced FA–SD dust mixtures varies between 9.8% and 20.42% after 12 wet and dry cycles. The mass loss of FA60-SD40 is more than that of FA70-SD30. This is due to the increase in voids in the mixture due to the presence of coarser aggregate particles. Fibers have a positive effect on mass loss because the addition of fibers increases brush strength. With an increase in fiber content above 0.25%, the decrease in mass loss is negligible.
The material losses for 4% and 6% fiber-reinforced FA–SD mixtures were found to be low, as shown in Figure 10, which shows the degradation of CLS after 12 wet–dry cycles for samples stabilized with different cement dosages. The Indian Road Congress [18] sets different limit mass losses for subbase and base layers (i.e., 30 and 20% respectively). Thus, according to the above regulations, FA60-SD40-C4 is suitable for the subbase layer, and FA60-SD40-C6, FA70-SD30-C4, and FA70-SD30-C6 are suitable for both the subbase layer and the base layer. According to the Portland Cement Association [22], the acceptable mass loss is 14%, and a minimum cement content of 6% is sufficient to meet the durability requirements.
3.1.3. Correlations between Mass Loss and UCS
Conducting the wet–dry durability test typically extends beyond a month, posing practical challenges in time-sensitive projects. Hence, certain researchers have proposed a minimum 7-day UCS value that meets durability criteria and is deemed acceptable for application. Figure 11 illustrates the correlation between mass loss (in percentage) obtained from the wet–dry durability test and the 7-day unsoaked UCS of the samples. It is observed that a linear relationship exists between mass loss and UCS. The relationship developed in the present study is very similar to the relationship developed by Biswal et al. [31] and Shihata and Baghdadi [32].
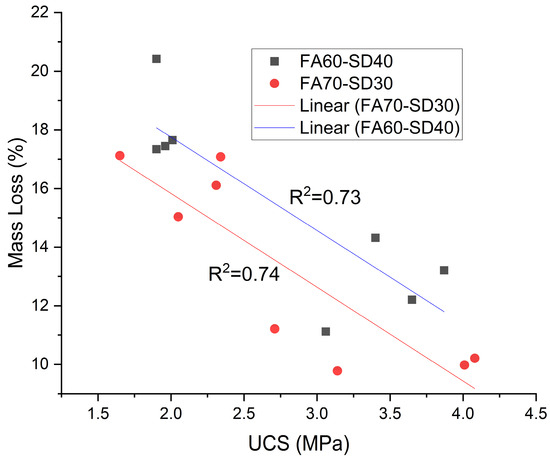
Figure 11.
Correlation between mass loss (%) and unsoaked UCS of FA–SD samples at 7 days of curing.
3.1.4. Correlations between Mass Loss and IDT
A good correlation between mass loss and IDT of FA–SD samples is shown in Figure 12. A negative linear relationship between IDT and mass loss was also observed for the FA60-SD40 and FA70-SD30 mixtures. However, the correlation coefficient R2 for both UCS and mass loss is found to be between 0.64 and 0.74 and that for IDT and mass loss is found to be between 0.9 and 0.96. This indicates that IDT can be used as a better indicator for the determination of mass loss. The durability of FA–SD samples in terms of mass loss can be better determined by correlating with IDT compared to UCS value.
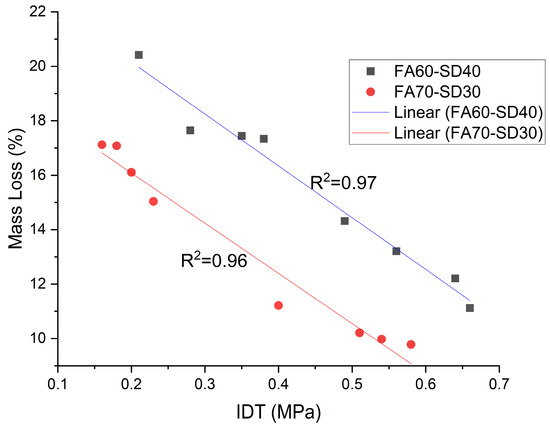
Figure 12.
Correlation between mass loss and IDT.
3.2. Capillary Rise
The principal issue concerning pavements is the excess accumulation of water in the pavement base, potentially causing premature pavement deterioration. Three main pathways through which water can infiltrate the pavement base include surface infiltration, capillary rise, and lateral inflow from shoulders and drains.
In the present study, a capillary rise test was conducted to investigate the capillary rise rate and maximum capillary rise of the stabilized FA–SD mixtures reinforced with polypropylene fibers to be used in the base layer. Figure 13 shows the capillary rise of stabilized FA-SD with and without fibers.
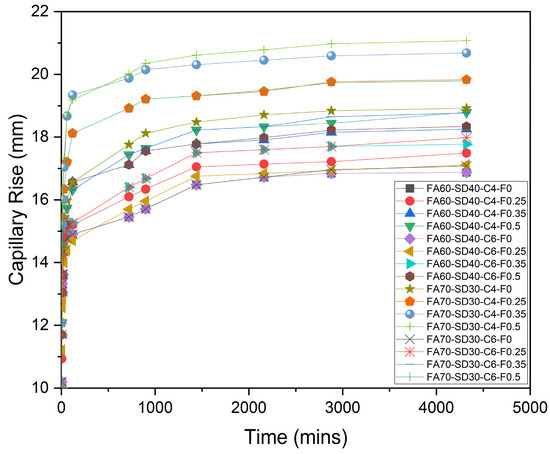
Figure 13.
Capillary rise of fly ash–stone mixes with time.
In the course of the test, it was noted that the capillary rise rate is notably elevated within the initial 30 min, gradually diminishing thereafter. Despite the 72 h testing period, capillary rise ranged from 14.45% to 14.85% (corresponding to 14.67 mm to 16.87 mm) for samples with 4% and 6% cement content, respectively, in the absence of fibers.
3.2.1. Effect of Cement and Coarse Aggregate on Capillary Rise
As observed in Figure 13, the capillary rise of FA60-SD40-C4 and FA60-SD40-C6 was 14.67% and 14.45%, respectively, while the capillary rise for FA70-SD30-C4 and FA70-SD30-C6 was 16.45% and 14.85%. The capillary rise rate diminishes with a higher cement content due to the hydration process, wherein cement hydration results in a decrease in soil suction. This reduction in soil suction, in turn, leads to a diminished affinity for water. This indicates that cement has a positive effect in samples with finer particles and has no significant influence as the proportion of coarse particles increases, regardless of the increase in cement content. This is due to the increase in pore spaces that act as capillary tubes. After 24 h, all samples with a cement dosage of 4% and 6% exceed the capillary rise limit of 25% of the total height recommended by AUSTSTAB [33]. Similar results were reported by Biswal et al. [31] and Chakrabarti and Kodikara [34].
3.2.2. Effect of Fiber on the Capillary Rise of FA-SD Samples
Figure 14 illustrates the influence of fibers on the capillary rise of cement-stabilized FA-SD samples reinforced with PP fibers at contents ranging from 0.25% to 0.5%. The data in Figure 14 indicate a rise in capillary action with an increase in fiber content for all mixtures. The increase in capillary rise ranged from 1.67% to 2.36% for 0.25% to 0.5% fibers compared to 0% fibers. This may be due to the action of fibers as capillary tubes, which accelerate capillary action in the samples.
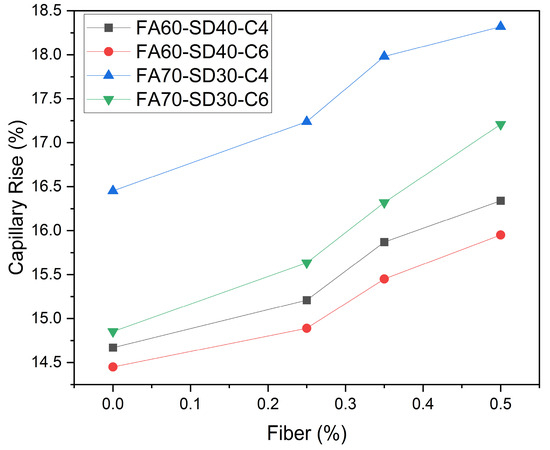
Figure 14.
Effect of fibers on the capillary rise of FA–SD mixes.
3.3. Water Absorption
The water absorption of FA60-SD40-C4, FA60-SD40-C6, FA70-SD30-C4 and FA70-SD30-C6 reinforced with 0%, 0.25%, 0.35% and 0.5% fibers is shown in Figure 15. The water absorption for samples without fibers ranges from 21.13% to 26.87%. At a fiber dosage of 0.25% to 0.5% in cement-treated fly ash–stone aggregate samples, the water absorption of fiber-reinforced samples is in the range of 23.45% to 27.98%.
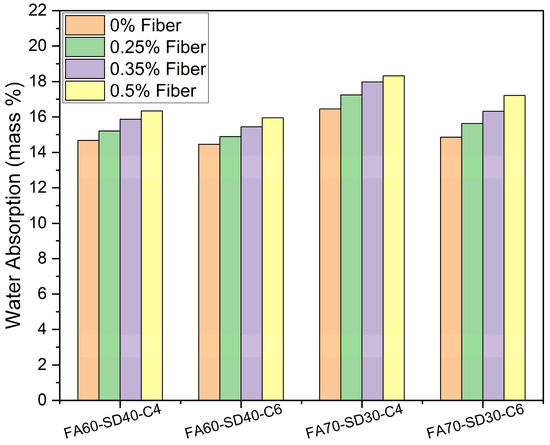
Figure 15.
Water absorption of FA–SD mixes.
3.3.1. Effect of Cement on Water Absorption
Figure 15 shows the water absorption of the FA60-SD40-C4, FA60-SD40-C6, FA70-SD30-C4 and FA70-SD30-C6 samples cured for 28 days. The reduction in water absorption when the cement content is increased from 4% to 6% is 2.32% and 3.14% for FA60-SD40 and FA70-SD30-C6 without fibers, respectively. Similar behavior of the stabilized materials was also observed by Chakraborty and Kodikarra [34] and Biswal et al. [31]. Chakraborty and Kodikarra [34] studied the effect of cementitious binders (cement, lime, ground granulated slag) on the water absorption properties of stabilized basalt rock and observed that water absorption increases with the increase in cement quantity, particularly for values > 3%. They also proposed 6% cement for the better performance of stabilized basaltic rock material. Similarly, Biswal et al. [31] also observed similar behavior of stabilized lateritic soil.
3.3.2. Effect of Fiber on Water Absorption of FA–SD Mixes
Figure 16 shows the effect of fibers on cement-stabilized FA–SD mix samples. Water absorption increases with the increase in the addition of fibers. A strong linear relationship (R2 > 0.98) was observed between water absorption percentage and fiber percentage. This observation is consistent with the capillary rise of the samples prepared with the same specifications. Similar results also have been reported by other researchers [31,34].
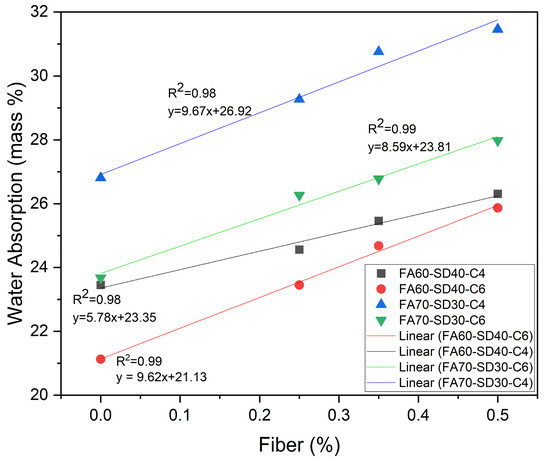
Figure 16.
Correlation between fiber percentages and water absorption for FA–SD mixes.
4. Conclusions
In this study, the durability, capillary rise, and water absorption properties of the fiber-reinforced cement-stabilized mixture of fly ash, stone dust and crushed stone aggregate were investigated, which are crucial for determining its suitability for pavement application.
It was observed that all of the fiber-reinforced cement-stabilized FA-SD specimens treated with 4% and 6% cement with and without fibers except for FA60-SD40-C4 and FA80-SD20-C4 passed the limiting mass loss of 20%, as stipulated in IRC SP:89 [18], desired for the base layer of pavements. However, FA60-SD40-C4 and FA80-SD20-C4 samples were suitable for sub-base courses. A linear correlation was established between mass loss and UCS and IDT, which can be used to evaluate the suitability of materials for the structural layer without conducting a wet–dry durability test, which takes one month. The mass loss decreased with an increase in cement content and fiber content.
The capillary rise in the mixes was increased with an increase in the percentage of fly ash and fiber content, whereas it decreased with an increase in cement content. Water absorption for specimens cured for 28 days was decreased with an increase in cement content. In contrast, it increased with an increase in fiber content and the percentage of fly ash. All samples with a 4% and 6% cement content and a fiber content from 0.25% to 0.5% pass the recommended capillary rise limit of 25% of the total height after 24 h, as specified by AUSTSTAB [33]. The test results of this study are consistent with the similar results reported by other researchers.
This study proposes that cement-stabilized fly ash and stone aggregate mixtures with 4% and 6% cement can be used as the subbase and base of pavement based on wet–dry mass loss criteria and water absorption criteria.
More studies are required to develop cementitious fly ash mixtures to reduce the capillary rise.
Author Contributions
Conceptualization, D.R.B., S.K.M. and B.G.M.; methodology, S.K.M., D.R.B.; formal analysis, S.K.M., B.B. and D.R.B.; investigation, S.K.M., N.K.P., P.K.S., N.M. and R.Y.; resources, S.K.M. and R.P.; data curation, S.K.M., R.P., B.B., S.K.P. and D.R.B.; writing—original draft preparation, S.K.M., B.B. and R.P.; writing—review and editing, D.R.B., B.B. and S.K.P.; supervision, D.R.B., B.B. and B.G.M.; project administration, B.G.M. All authors have read and agreed to the published version of the manuscript.
Funding
This research received no external funding.
Data Availability Statement
All data are included in the manuscript. No separate data are available for this manuscript.
Conflicts of Interest
The authors declare no conflicts of interest.
References
- ASTM C618; Standard Specification for Coal Fly Ash and Raw or Calcined Natural Pozzolan for Use in Concrete. American Society for Testing and Materials: West Conshohocken, PA, USA, 2022.
- Tkaczewska, E. Effect of the superplasticizer type on the properties of the fly ash blended cement. Constr. Build. Mater. 2014, 70, 388–393. [Google Scholar] [CrossRef]
- Gorai, S. Utilization of fly ash for sustainable environment management. J. Mater. Environ. Sci. 2018, 9, 385–393. [Google Scholar] [CrossRef]
- Yoon, S.; Balunaini, U.; Yildirim, I.Z.; Prezzi, M.; Siddiki, N.Z. Construction of an embankment with a fly and bottom ash mixture: Field performance study. J. Mater. Civ. Eng. 2009, 21, 271–278. [Google Scholar] [CrossRef]
- Azaiez, H.; Cherif Taiba, A.; Mahmoudi, Y.; Belkhatir, M. Shear characteristics of fly ash improved sand as an embankment material for road infrastructure purpose. Innov. Infrastruct. Solut. 2021, 6, 148. [Google Scholar] [CrossRef]
- Renjith, R.; Robert, D.; Setunge, S.; Costa, S.; Mohajerani, A. Optimization of fly ash based soil stabilization using secondary admixtures for sustainable road construction. J. Clean. Prod. 2021, 294, 126264. [Google Scholar] [CrossRef]
- Rai, P.; Qiu, W.; Pei, H.; Chen, J.; Ai, X.; Liu, Y.; Ahmad, M. Effect of fly ash and cement on the engineering characteristic of stabilized subgrade soil: An experimental study. Geofluids 2021, 2021, 1368194. [Google Scholar] [CrossRef]
- Ghosh, A.; Subbarao, C. Strength characteristics of class F fly ash modified with lime and gypsum. J. Geotech. Geoenviron. Eng. 2007, 133, 757–766. [Google Scholar] [CrossRef]
- Patel, S.; Shahu, J.T. Comparison of industrial waste mixtures for use in subbase course of flexible pavements. J. Mater. Civ. Eng. 2018, 30, 04018124. [Google Scholar] [CrossRef]
- Puppala, A.J.; Saride, S.; Williammee, R. Sustainable reuse of limestone quarry fines and RAP in pavement base/subbase layers. J. Mater. Civ. Eng. 2012, 24, 418–429. [Google Scholar] [CrossRef]
- Samanta, M. Investigation on geomechanical behaviour and microstructure of cement-stabilized fly ash. Int. J. Geotech. Eng. 2018, 12, 449–461. [Google Scholar] [CrossRef]
- Bakare, M.D.; Pai, R.R.; Patel, S.; Shahu, J.T. Environmental sustainability by bulk utilization of fly ash and GBFS as road subbase materials. J. Hazard Toxic. Radioact. Waste 2019, 23, 04019011. [Google Scholar] [CrossRef]
- Pai, R.R.; Bakare, M.; Patel, S.; Shahu, J.T. Structural evaluation of flexible pavement constructed with steel slag fly ash-lime mix in the base layer. J. Mater. Civ. Eng. 2021, 33, 04021097. [Google Scholar] [CrossRef]
- Kaniraj, S.R.; Gayathri, V. Factors influencing the strength of cement fly ash base courses. J. Transp. Eng. 2003, 129, 538–548. [Google Scholar] [CrossRef]
- Beriha, B.; Biswal, D.R.; Sahoo, U.C. Effect of Wet-Dry Cycles on Mechanical Strength Properties of Cement Stabilized Granular Lateritic Soil. In Latest Thoughts on Ground Improvement Techniques: Proceedings of the 2nd GeoMEast International Congress and Exhibition on Sustainable Civil. Infrastructures, Cairo, Egypt, 24 November 2018—The Official International Congress of the Soil-Structure Interaction Group. in Egypt. (SSIGE); Shehata, H., Poulos, H., Eds.; Springer: Cham, Switzerland, 2018; pp. 112–121. ISBN 978-3-030-01917-4. [Google Scholar]
- Patel, D.; Kumar, R.; Chauhan, K.A.; Patel, S. Experimental and modeling studies of resilient modulus and permanent strain of stabilized fly ash. J. Mater. Civ. Eng. 2019, 31, 06019005. [Google Scholar] [CrossRef]
- Barmade, S.; Patel, S.; Dhamaniya, A. Laboratory and field evaluation of stabilized fly ash as an alternative material for sustainable pavements. J. Hazard. Toxic. Radioact. Waste 2022, 26, 04022028. [Google Scholar] [CrossRef]
- IRC SP:89; Guidelines for the Design of Stabilized Pavement (Part I). IRC: New Delhi, India, 2010.
- NCHRP (National Cooperative Highway Research Program). Guide for Mechanistic-Empirical Design of New and Rehabilitated Pavement Structures; Final Report Project No. 1-37 A; Transportation Research Board (TRB): Washington, DC, USA, 2004. [Google Scholar]
- Austroads. Guide to Pavement Technology Part 2: Pavement Structural Design; Austroad: Sydney, Australia, 2012. [Google Scholar]
- IRC 37; Guidelines for the Design of Flexible Pavement. IRC: New Delhi, India, 2018.
- PCA. Soil-Cement Laboratory Handbook; Portland Cement Association: Chicago, IL, USA, 1992. [Google Scholar]
- IS 8112; Ordinary Portland Cement, 43 Grade—Specification (Second Revision). BIS: New Delhi, India, 2003.
- ASTM D1633; Standard Test Methods for Compressive Strength of Molded Soil-Cement Cylinders. ASTM International: West Conshohocken, PA, USA, 2017.
- Yeo, R. The Development and Evaluation of Protocols for the Laboratory Characterisation of Cemented Materials; Austroads Publication No. AP–T101/08; ARRB-Australia: Melbourne, Australia, 2008. [Google Scholar]
- ASTM D559; Standard Test Methods for Wetting and Drying Compacted Soil-Cement Mixtures. ASTM International: West Conshohocken, PA, USA, 2015.
- AS 1141.53; Absorption, Swell and Capillary Rise of Compacted Materials. Standards Australia: Sydney, Australia, 1996.
- Furlan, A.P.; Razakamanantsoa, A.; Ranaivomanana, H.; Amiri, O.; Levacher, D.; Deneele, D. Effect of Fly Ash on microstructural and resistance characteristics of dredged sediment stabilized with lime and cement. Constr. Build. Mater. 2021, 272, 121637. [Google Scholar] [CrossRef]
- Solikin, M.; Setunge, S.; Patnaikuni, I. The influence of lime water as mixing water on the compressive strength development of high volume ultra fine fly ash mortar. In Proceedings of the Modern Methods and Advances in Structural Engineering and Construction, Zurich, Switzerland, 21–26 June 2011. [Google Scholar]
- Zimar, Z.; Robert, D.; Zhou, A.; Giustozzi, F.; Setunge, S.; Kodikara, J. Application of coal fly ash in pavement subgrade stabilisation: A review. J. Environ. Manag. 2022, 312, 114926. [Google Scholar] [CrossRef] [PubMed]
- Biswal, D.R.; Sahoo, U.C.; Dash, S.R. Durability and shrinkage studies of cement stabilsed granular lateritic soils. Int. J. Pavement Eng. 2019, 20, 1451–1462. [Google Scholar] [CrossRef]
- Shihata, S.A.; Baghdadi, Z.A. Long-term strength and durability of soil cement. J. Mater. Civ. Eng. 2001, 13, 161–165. [Google Scholar] [CrossRef]
- AUSTSTAB. Developments in road stabilization. In Proceedings of the Joint VicRoads and AusStab Technology Transfer Seminar for Austroads NT&E Project 01; Australian Stabilisation Industry Association: Melbourne, Australia, 2001. [Google Scholar]
- Chakrabarti, S.; Kodikara, J. Basaltic crushed rock stabilized with cementitious additives: Compressive strength and stiffness, drying shrinkage, and capillary flow characteristics. Transp. Res. Rec. 2003, 1819, 18–26. [Google Scholar] [CrossRef]
Disclaimer/Publisher’s Note: The statements, opinions and data contained in all publications are solely those of the individual author(s) and contributor(s) and not of MDPI and/or the editor(s). MDPI and/or the editor(s) disclaim responsibility for any injury to people or property resulting from any ideas, methods, instructions or products referred to in the content. |
© 2024 by the authors. Licensee MDPI, Basel, Switzerland. This article is an open access article distributed under the terms and conditions of the Creative Commons Attribution (CC BY) license (https://creativecommons.org/licenses/by/4.0/).