1. Introduction
The technology-enabling vehicles equipped with driving automation systems in Europe are advancing rapidly, with increasing numbers of conventional vehicle functions being automated. This transition is driven by various factors, including regulatory challenges, infrastructure readiness, and public acceptance. Several EU countries are actively testing and developing vehicles equipped with driving automation systems in controlled environments, such as closed test tracks and designated urban areas. These tests often involve collaborations between car manufacturers, technology companies, and local governments to assess the feasibility, safety, and practicality of vehicles equipped with driving automation systems under real-world conditions. Additionally, in the realm of research, autonomous vehicle (AV) simulation environments have been developed, allowing drivers to participate in studies investigating the interaction between drivers and vehicles equipped with driving automation systems [
1].
One of the key challenges facing the widespread adoption of connected and autonomous vehicles (CAVs) in Europe is regulatory uncertainty. Each country within the EU has its own set of rules and standards regarding driving automation systems, leading to fragmentation and inconsistency across borders. The harmonization of regulations and establishment of clear guidelines for testing and development are crucial for fostering innovation and the seamless integration of vehicles equipped with driving automation systems into existing transportation systems. For this reason, the EU is fostering methods that will eventually enable such vehicles to move across borders through the development and installation of the necessary infrastructure, such as 5G cross-border corridors, initially in pilot operation, in countries like Italy, France, Germany, Spain, Finland, Latvia, Estonia, Belgium, Luxembourg, and the Netherlands [
2]. Proper infrastructure is critical, with road networks needing to support AV capabilities like reliable connectivity and high-definition mapping. Studies highlight the importance of integrating vehicle-to-everything (V2X) technologies to enhance AV operational safety and decision-making by enabling real-time communication with road users and infrastructure [
3].
Public acceptance remains another critical challenge. Even with technological advancements, there are concerns about the safety of AVs, especially in cases where operational control is fully transferred to the vehicle. Crashes involving AVs will still occur, raising questions about liability and responsibility. Factors such as clear communication about AV decision-making processes and positive exposure to AVs in controlled environments have been shown to enhance public confidence [
4]. Research shows that the general population remains cautious about fully driving automation systems [
5]. Effective stakeholder engagement and transparent demonstration of AV safety could address these concerns. Furthermore, public outreach campaigns and live demonstrations of AV capabilities have proven effective in reducing skepticism and fostering trust [
6,
7].
Researchers have already begun examining the safety impact of AVs, especially through simulations and real-world crash data analysis. For instance, early studies in California found that crashes involving AVs occur more frequently than those involving conventional vehicles [
8,
9]. Notably, rear-end collisions—where a conventional vehicle strikes the back of an AV—are the most common type of crash. This is likely due to differences in driving styles, as conventional vehicles often engage in aggressive driving, while AVs strictly follow traffic regulations [
10].
Simulations of AV introduction into urban traffic in Europe also show an increase in rear-end collisions, particularly when AV penetration is low [
11,
12]. Some studies suggest that dedicating exclusive lanes to AVs could help mitigate these issues, with a mixed AV and human-driven vehicle network showing potential safety benefits at certain penetration rates [
13]. Additionally, enhanced road infrastructure, such as advanced traffic signaling and high-definition mapping systems, can significantly reduce conflicts in mixed-traffic environments [
14,
15].
Predictions for AV market penetration vary. Some researchers estimate that fully AVs (i.e., SAE Level 5) could account for 10% to 71% of the market by 2050 [
16,
17]. In addition, new mobility models, such as car-sharing, are expected to complement AV adoption. Car-sharing, especially in urban environments, is likely to increase as driving automation systems become more prevalent [
18]. These concepts reinforce one another, with shared AVs offering a more efficient and flexible mode of transport.
Notwithstanding significant progress in technology and policy, some critical deficiencies persist. The dynamics between vehicles equipped with driving automation systems and human-operated vehicles in mixed-traffic scenarios remain inadequately investigated, especially at different penetration rates. Furthermore, although the prospective safety advantages of AVs are recognized, there is a lack of comprehension regarding the impact of infrastructural preparedness—specifically the deployment of V2X communication systems—in augmenting these benefits. Addressing these flaws requires a holistic approach that accounts for both the immediate safety implications of AV integration and the broader impacts on infrastructure, policy, and social acceptance.
In this context, this paper explores how the increasing penetration of SAE Level 5 AVs [
19] will influence traffic safety in the Villaverde district of Madrid. The Villaverde district offers diverse traffic patterns, combining residential, commercial, and transit corridors, which make it representative of typical urban environments in Europe. Its infrastructure, including a mix of road types and traffic conditions, provides a robust foundation for evaluating interactions between autonomous and conventional vehicles. The district’s characteristics also enable the study of how advanced technologies, such as V2X communication systems, can enhance safety outcomes and address the complexities of mixed-traffic environments. The study examines both the direct impact on crash rates, including changes in the frequency and types of collisions, and how the interaction between autonomous and conventional vehicles affects overall road safety. Additionally, the study considers the broader implications for urban mobility, such as the potential for CAVs to reduce traffic congestion and improve traffic flow. By analyzing these factors, this paper provides insights into how different levels of CAV adoption might shape the future of road safety in Europe.
3. Results
3.1. Conflict Analysis
An exploratory analysis was initially conducted for the evaluation of the dataset to uncover trends and patterns and assess the overall quality of the data. This preliminary examination was crucial for understanding how the presence of CAVs affects traffic dynamics and road safety.
In terms of TTC, one notable finding, as shown in
Figure 2, was that when CAV penetration was at 10%, the highest number of conflicts with a TTC of 0 s occurred. This suggests that introducing a small percentage of CAVs initially disrupts traffic flow, likely due to the significant differences between the driving behaviors of CAVs and human drivers. Studies have shown that low penetration rates of CAVs may lead to reduced traffic efficiency, as human drivers adapt to the presence of vehicles equipped with driving automation systems [
24,
25]. However, at 100% CAV penetration, the number of conflicts with a TTC of 0 s significantly decreased, indicating a reduction in immediate crash risks. Interestingly, the majority of conflicts at full CAV penetration were recorded with TTC values between 0.9 and 1.3 s. This finding suggests that while the likelihood of crashes diminishes in a CAV-dominated environment, near-collision events become more frequent. This outcome reflects the fact that CAVs maintain consistent, safe distances between vehicles, which reduces crash risks but can generate more minor conflicts as vehicles operate in closer proximity to one another.
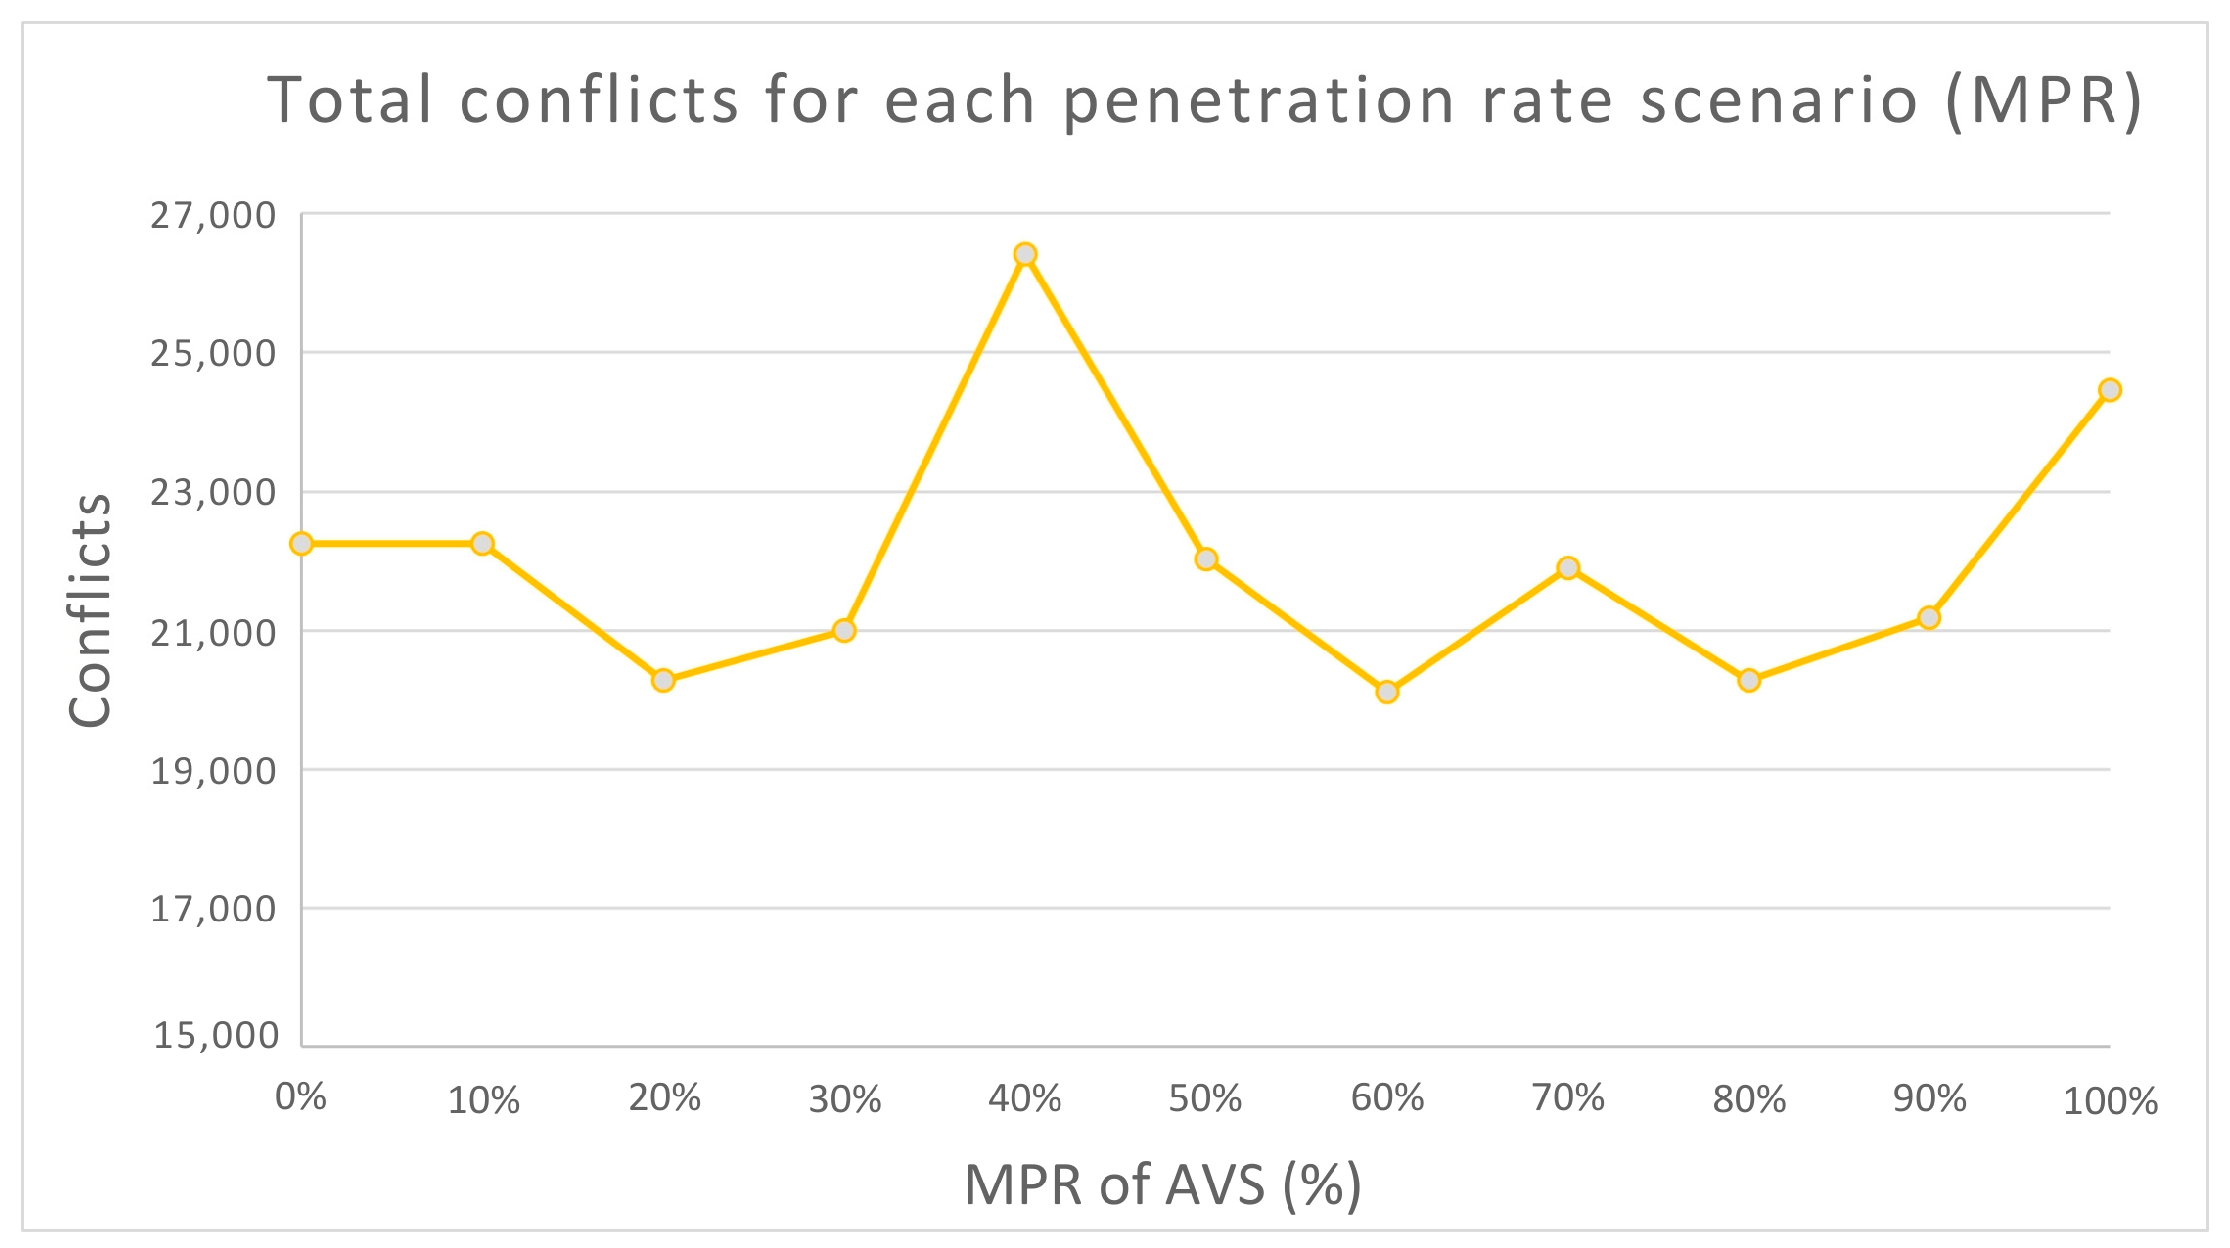
The frequency of traffic conflicts demonstrated a non-linear relationship with CAV penetration, as shown in
Figure 3. The largest number of conflicts occurred when CAV penetration was at 40% and 100%. As the penetration rate increased from 40% to 60%, the number of conflicts decreased, indicating an improvement in traffic conditions as more CAVs were introduced. This suggests that CAVs contribute to smoother and safer traffic as their presence increases. However, when CAV penetration reached 80% to 100%, the number of conflicts began to rise again.
Figure 3 illustrates this pattern, suggesting that while higher levels of CAV integration generally promote safer traffic conditions by minimizing human driving errors, a fully CAV-populated network may still introduce new types of conflicts. This could be attributed to the uniform and cautious driving behavior of CAVs, which might lead to different dynamics compared to a mixed-traffic environment. This observation aligns with existing research showing that fully automated traffic systems may experience inefficiencies or unique safety challenges due to homogeneous behavior and lack of adaptability in certain scenarios [
26,
27]. Additionally, uniform driving strategies of CAVs can cause delays or bottlenecks, especially in high-density scenarios where adaptive responses are critical [
25].
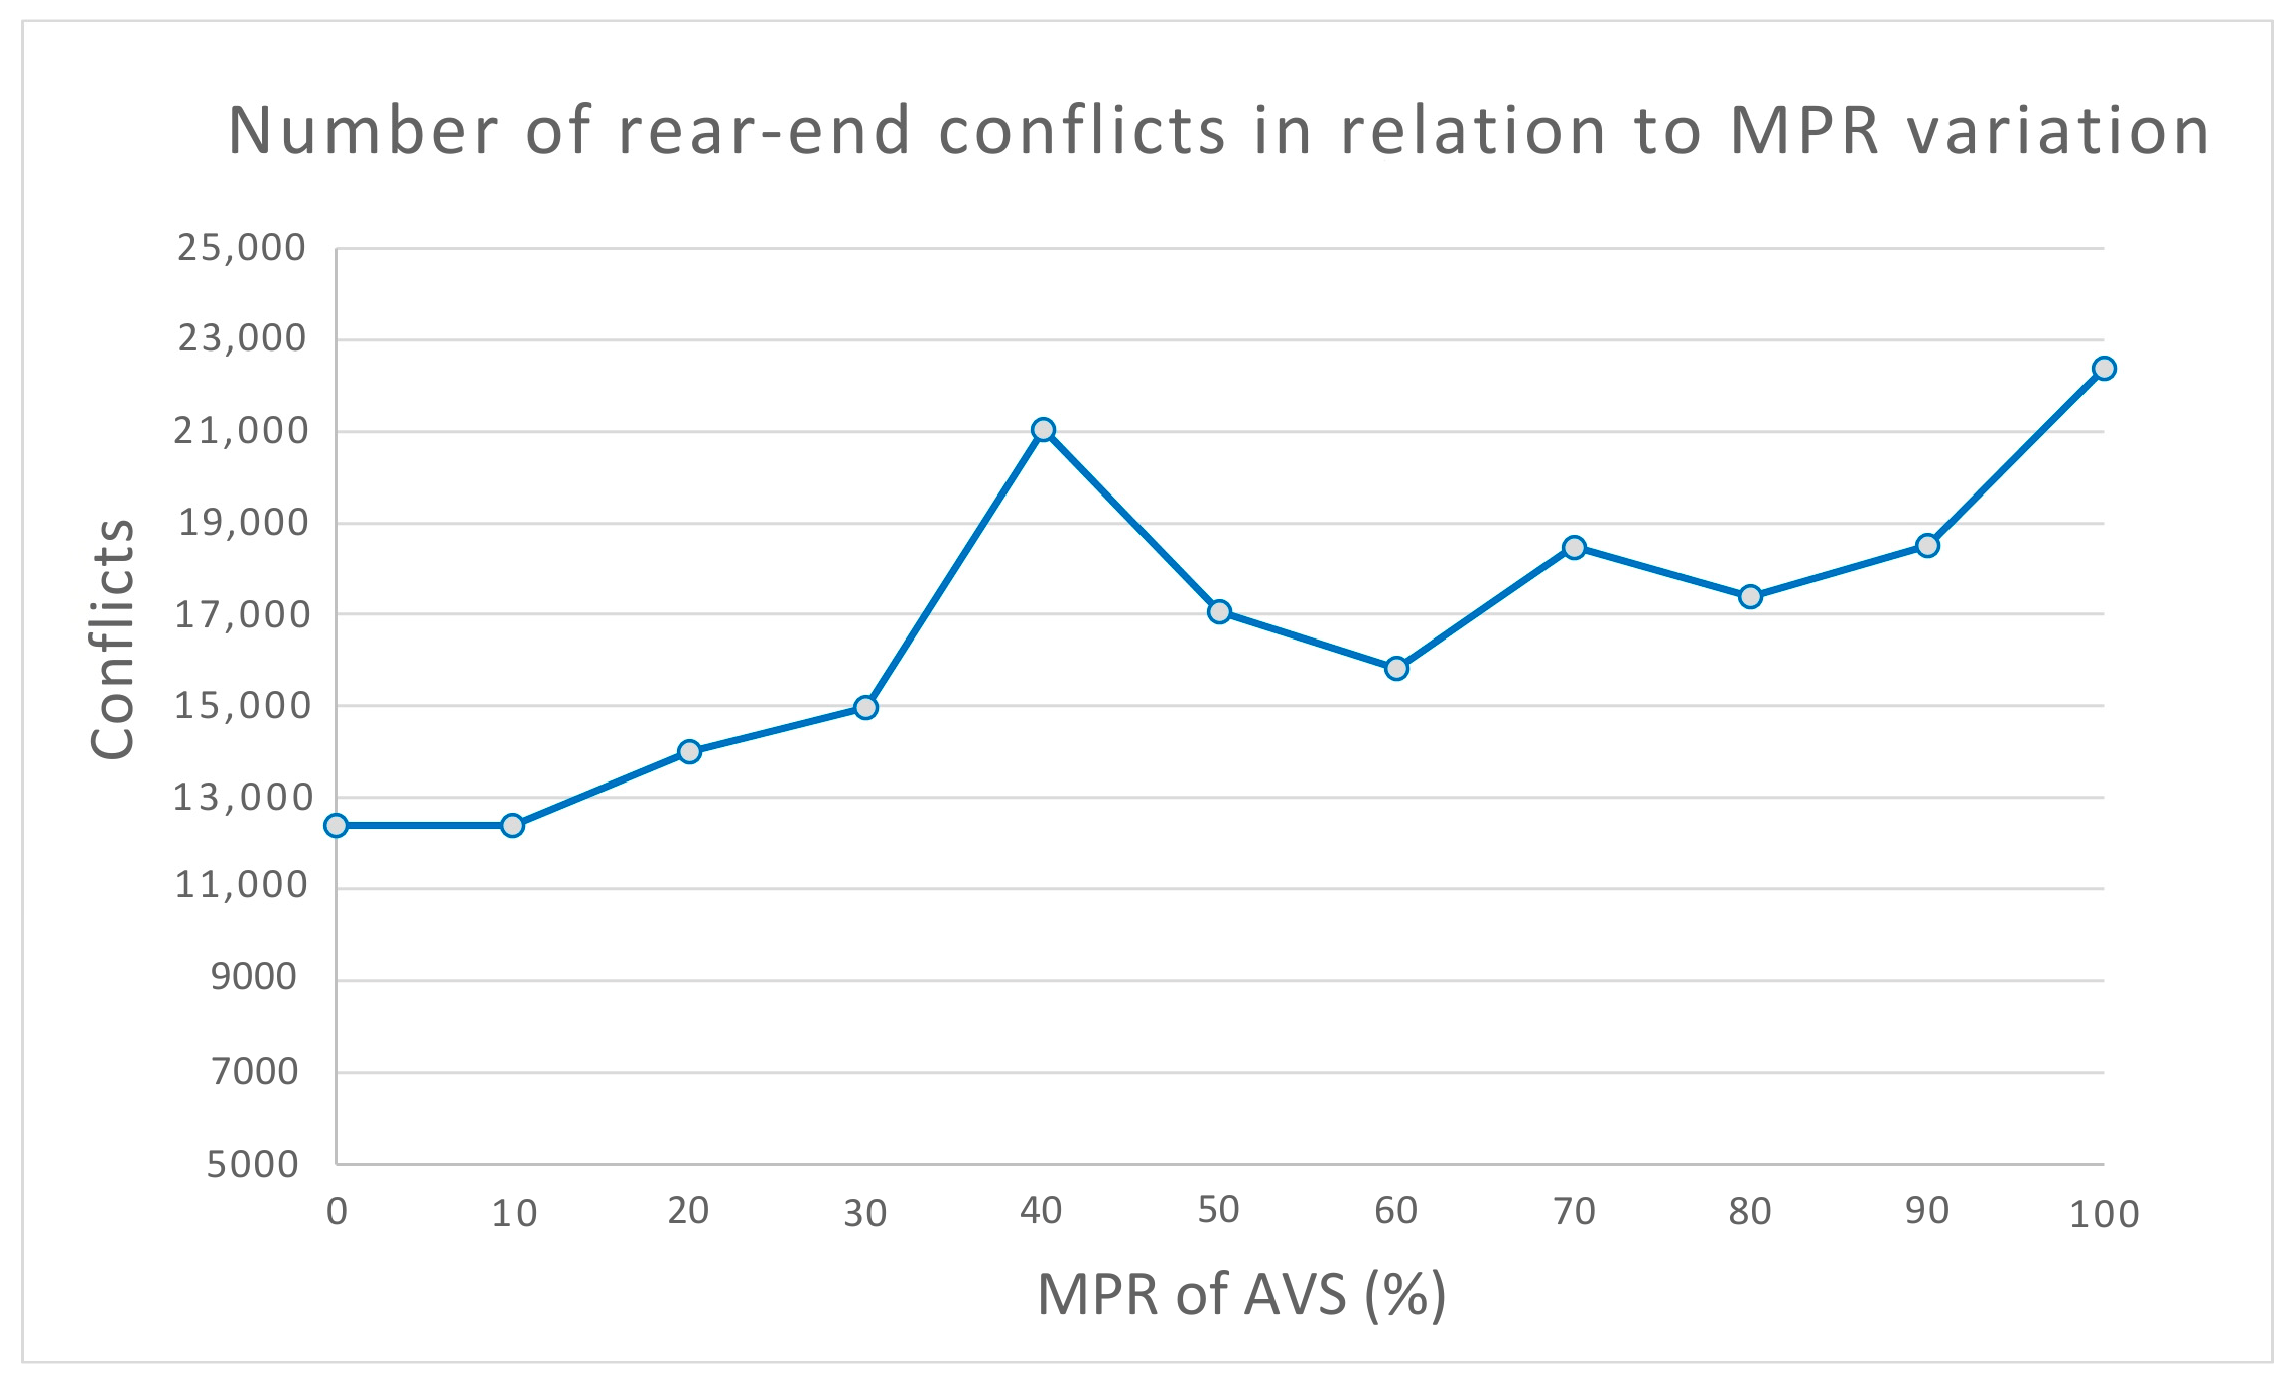
The analysis of conflict types, as depicted in
Figure 4,
Figure 5 and
Figure 6, provides further insights into the effects of CAV penetration on specific types of traffic conflicts.
Figure 4 shows that rear-end conflicts increased as CAV penetration grew. This rise can be attributed to the conservative driving behavior of CAVs, which follow traffic regulations strictly. Human drivers, who may follow AVs too closely or engage in more aggressive driving, can be surprised by the predictable but cautious nature of CAVs, leading to a higher occurrence of rear-end collisions.
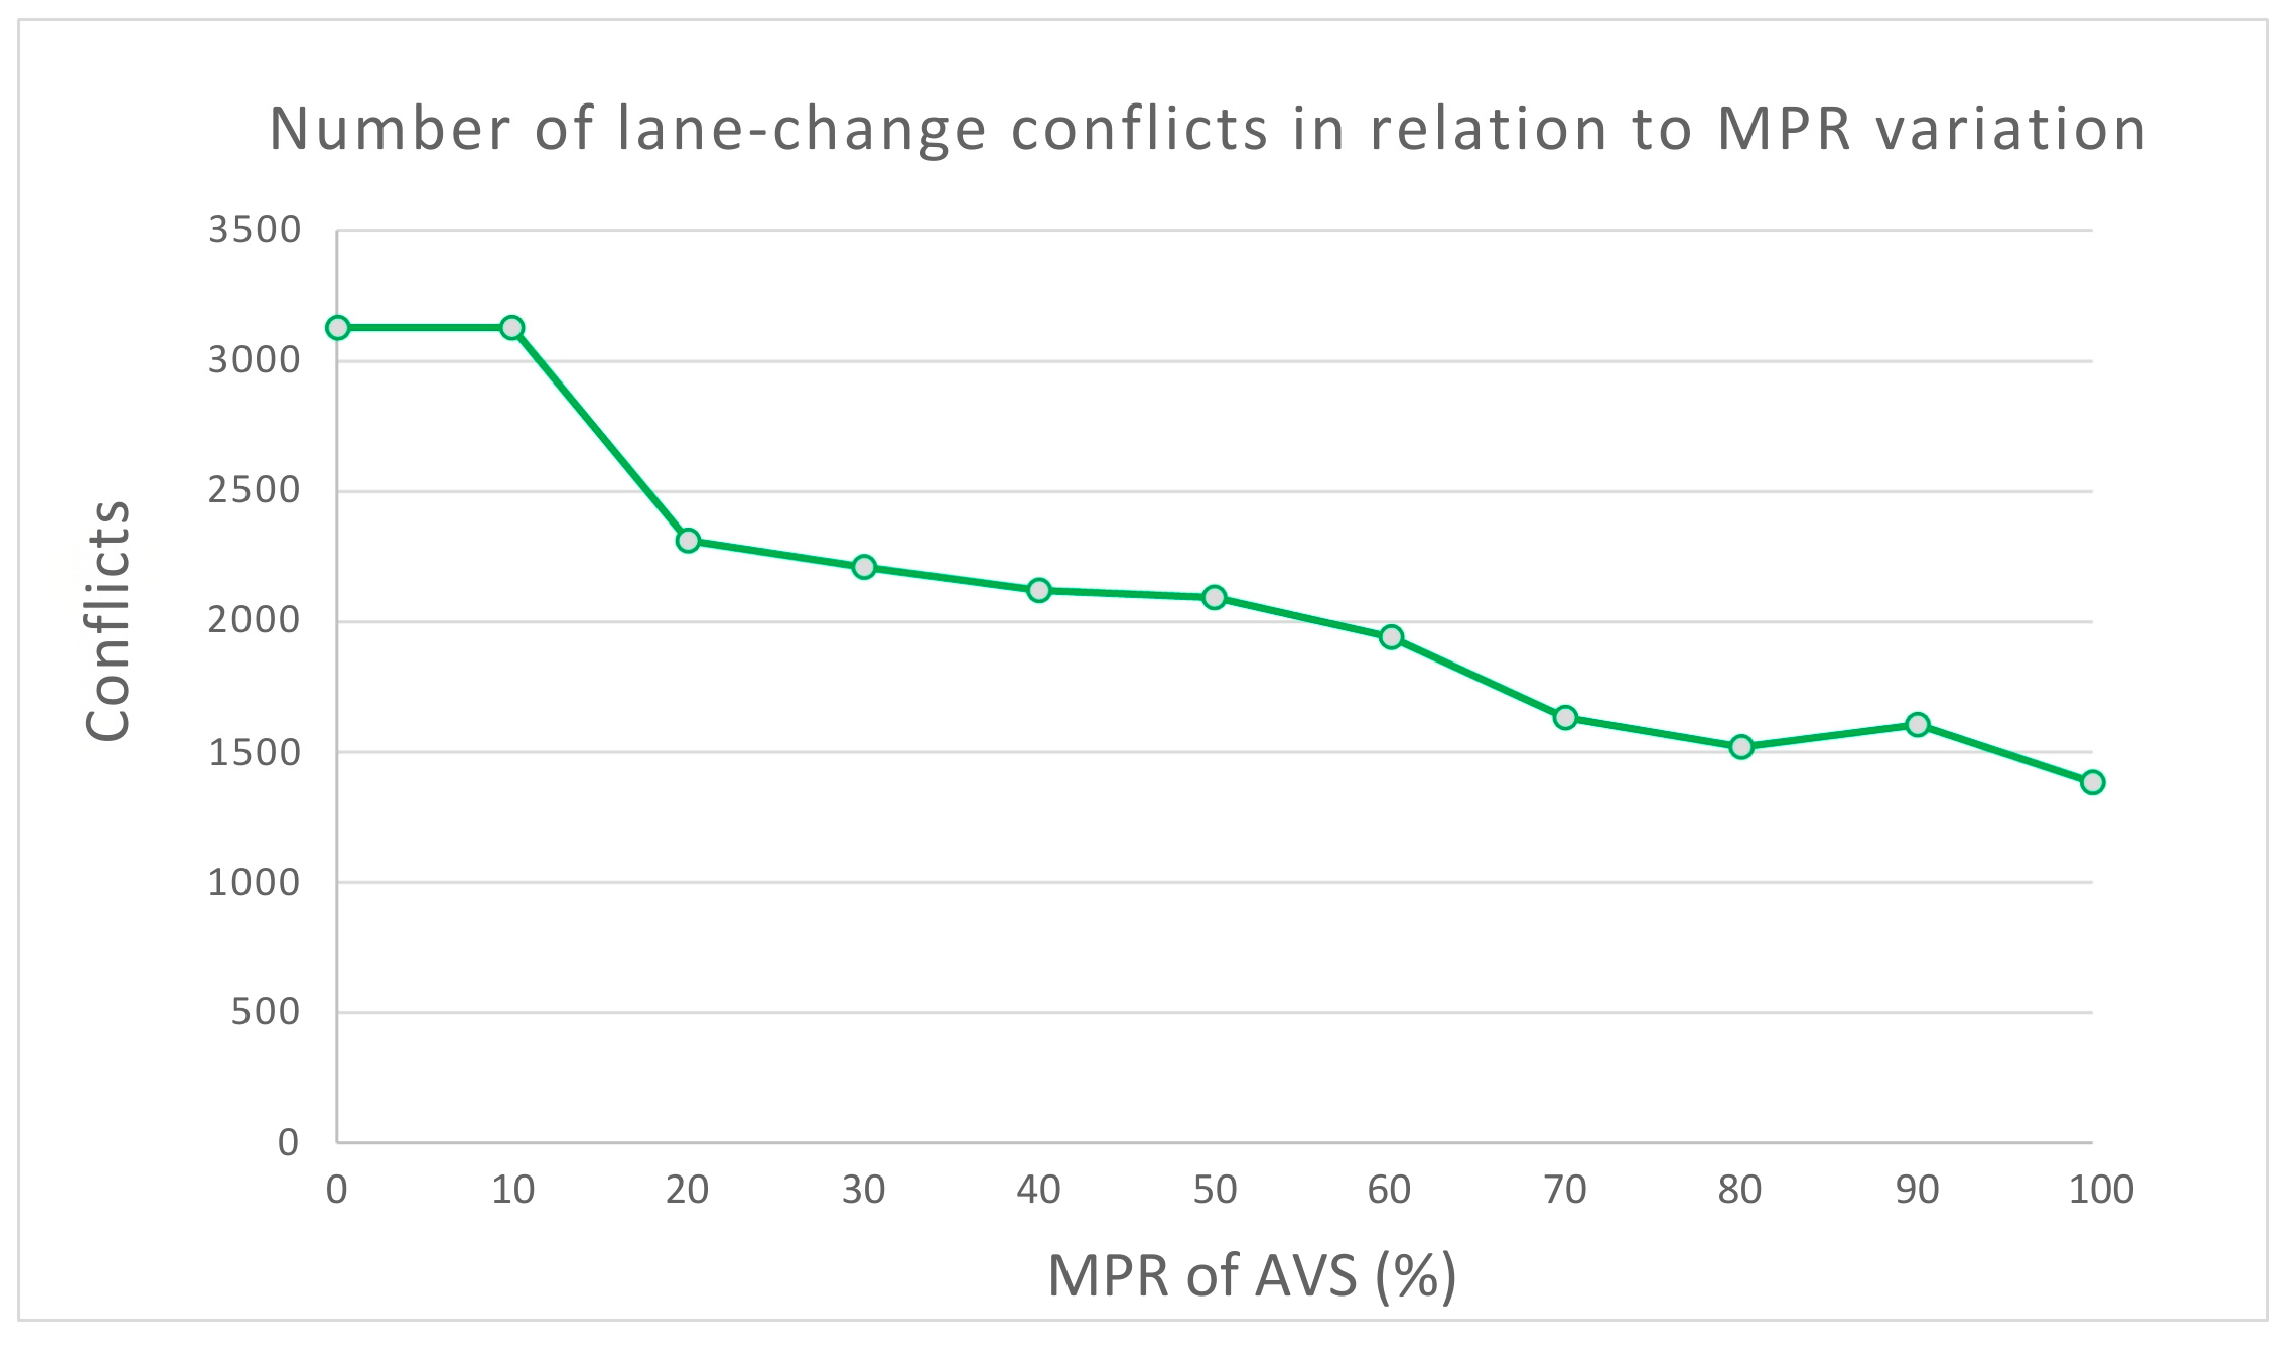
In contrast,
Figure 5 and
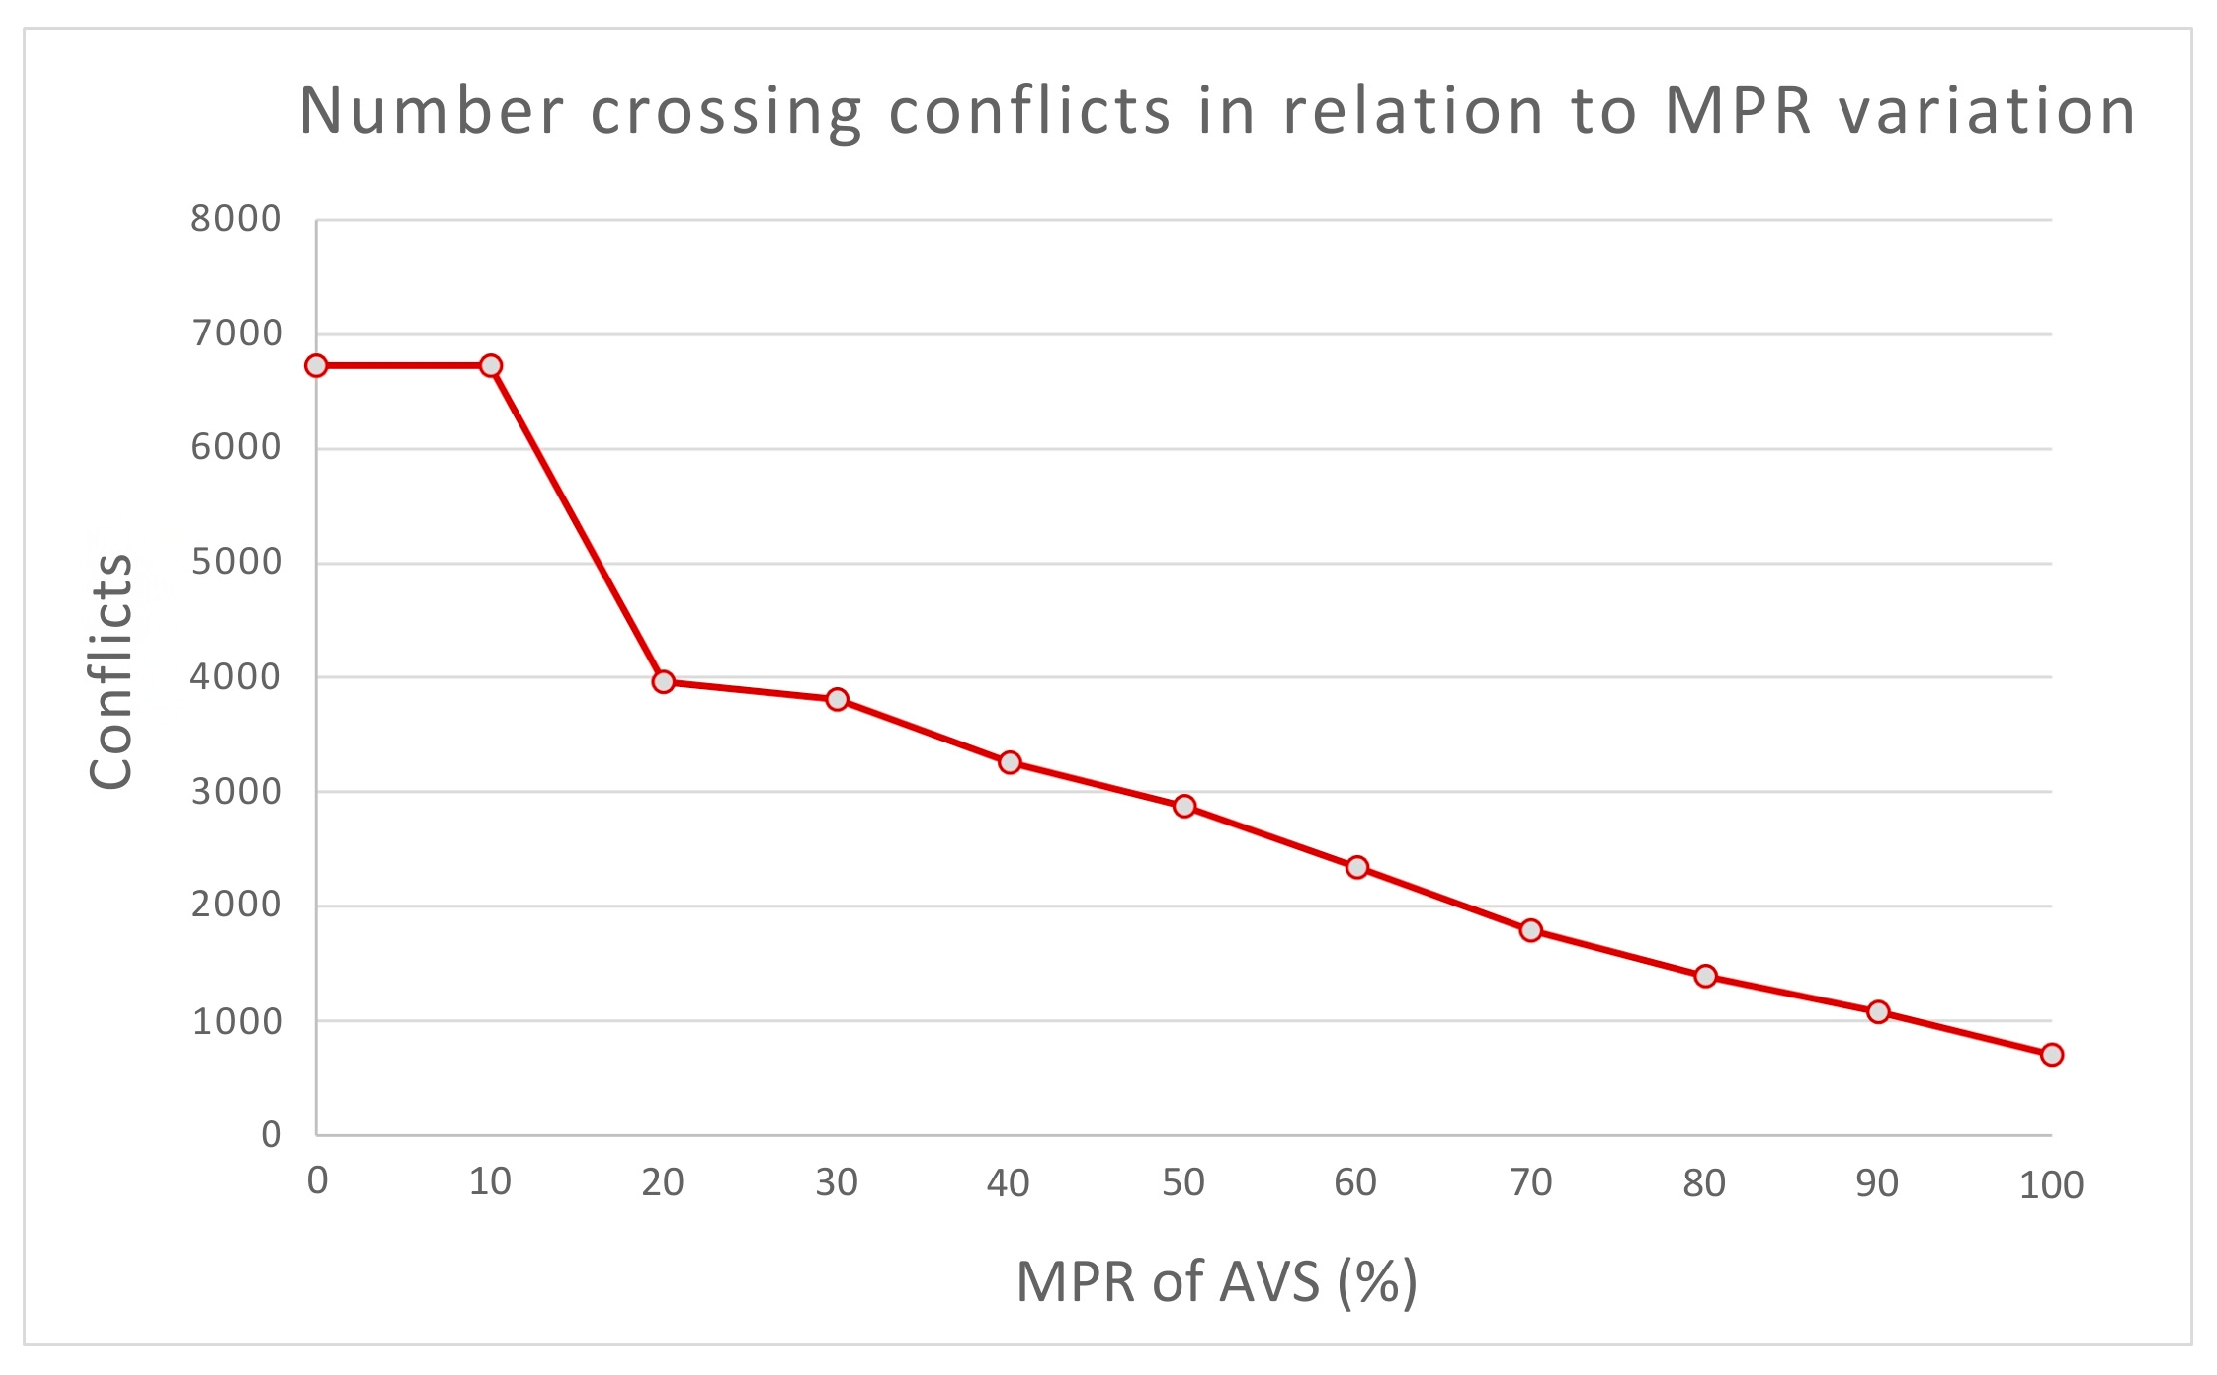
Figure 6 demonstrate that lane-change and crossing conflicts decreased as CAV penetration increased. This reduction is likely due to the increased predictability and stability in traffic flow brought by CAVs. Since CAVs adhere to rules and avoid sudden maneuvers, the frequency of unexpected lane changes and risky crossings decreases, resulting in fewer lane-change conflicts (
Figure 5) and crossing conflicts (
Figure 6). These findings highlight the different ways in which CAVs influence traffic safety depending on the type of conflict.
The exploratory analysis highlighted the impact of CAV penetration on traffic safety, but the complexity of the relationships required a more detailed quantitative approach. To address this, four regression models were applied to examine the connections between key traffic safety indicators—such as TTC, conflict frequency, maximum conflict speed, and conflict types—and the MPR of CAVs. These models provided a deeper understanding of how CAV penetration affects traffic dynamics, offering precise insights into critical patterns and helping to inform strategies for managing mixed-traffic environments as CAV technology evolves.
3.2. Model 1—Time-to-Collision (TTC)
The first model deals with predicting TTC, which is an important indicator in the analysis of traffic safety since it measures the time one would still have while driving at the current conditions until some sort of collision might happen. In order to model the relation of TTC, a multiple linear regression model is established considering a variety of independent variables that are expected to influence the same. These variables include maximum speed of the involved vehicles, MPR of vehicles equipped with SAE Level 5 driving automation system, road types, and presence of specific control elements, such as stop signs. The direction and magnitude of this relationship between the independent variables and TTC are determined by the coefficients from the model. These coefficients are presented in
Table 3 below,
This model performed at an adjusted R-squared of 0.461, showing moderate explanatory strength in the prediction of TTC. The model was also verified to be robust since it contained variables with significant t-values greater than 1.7 and
p-values less than 0.05. The regression equation for TTC can be expressed as follows:
Key findings indicated that as MaxS increased, TTC decreased, indicating quicker approaches to near-collisions in high-speed situations. Conversely, larger vehicle widths had longer TTC times associated with them, likely due to slower, cautious driving with larger vehicles. The positive coefficient of MPR is 0.125, which represents the fact that higher CAV penetration will drive TTC values higher, creating the hypothesis that CAVs encourage safer, less aggressive driving practices, lengthening reaction times and improving safety. This model proved strong in predictive power and thus offers a very good tool in terms of understanding how CAVs may influence collision timings in traffic systems.
3.3. Model 2—Conflict Frequency
Similar to Model 1, Model 2 also employs multi-linear regression to determine how road types, vehicle types, MPR of CAVs, and MaxS relate to the frequency of conflict. This is an important analysis, as it states the frequency with which conflict arises, hence providing an insight into those factors that could minimize or raise the potential collision risks. The respective coefficients obtained from this model have been elaborated in the following
Table 4.
This model resulted in an adjusted R-squared of 0.335, which shows a weaker fit than the TTC model; therefore, MPR, although significant, is not the only contributor to conflict frequency. All the statistical criteria were met: t-values for each independent variable were good, being above 1.7; significance levels were below 0.05; and coefficient signs made logical sense. The model’s equation is structured as:
The conflict frequency analysis identifies substantial influences from road type, vehicle type, and speed on the number of conflicts. Notably, control types like stop signs exhibit significant negative impacts on conflict frequency, highlighting their role in mitigating traffic conflicts. This model’s insights could inform strategies to minimize high-risk scenarios.
3.4. Model 3—Maximum Conflict Speed
Accordingly, this model focuses on the investigation of the influence of the penetration of vehicles equipped with driving automation systems, vehicle types, road types, and elements of traffic control on maximum speed during recorded traffic conflicts. Emphases are brought to MaxS, as higher conflict speed generally provides a correlation to the increased severity of the outcome; it becomes very important in assessing the risk under various considerations of mixed traffic with varied presence of vehicles equipped with SAE Level 5 driving automation system. The coefficients for each predictor obtained under this model are given in
Table 5, showing the statistical influence of each factor on MaxS.
Model 3 considers the speed at conflicts; accordingly, it reaches a quite robust adjusted R-squared of 0.447. The robustness of the model is reflected in the
t-tests by showing that some variables, like MPR, road type, and vehicle type, all have high t-statistics continuously, which proves they are significant in influencing the TTC. Furthermore, their low
p-values of less than 0.05 confirm their influence, which indicates a strong relation with longer TTC. Model 3 is specified by the following regression equation:
TTC and the presence of vehicles equipped with driving automation systems emerge as primary predictors, both negatively associated with conflict speed. These findings suggest that SAE Level 5 AV integration could help reduce speeds in conflict situations, potentially reducing crash severity. The model provides valuable input on speed regulation and safety measures for mixed-traffic conditions.
3.5. Model 4—Conflict Type
Since the conflict type variable (ConflictType) is categorical with three possible categories (e.g., rear-end, crossing, and lane-change), a multinomial logistic regression was applied to predict the likelihood of each type. In this model, crossing was designated as the reference category, meaning the model estimates the probability of each other type (rear-end and lane-change) occurring relative to crossing. The model produces a unique set of coefficients for the predictor variables, reflecting their effects on the odds of each conflict type relative to the crossing type. For example, the equation for rear-end conflicts reveals how factors like MaxS, MPR of vehicles equipped with driving automation systems, speed limits, and presence of stop signs influence the likelihood of a rear-end conflict compared to a crossing conflict. Similarly, the equation for lane-change conflicts shows how MaxS, MPR, speed limits, and stop signs also affect the probability of a lane-change conflict relative to a crossing conflict. All these coefficients are summarized in
Table 6, providing a comprehensive overview of how each predictor variable influences conflict types relative to crossing conflicts.
The model can be expressed as follows (Equations (13) and (14)) for each conflict type relative to the crossing category:
From Model 4 coefficients, it can be observed that each of the key predictors has a different effect in both lane-change and rear-end conflicts. In lane-change conflicts, negative signs of the coefficients for maximum speed and speed limit indicate that with increasing speed, the chances of conflicts decrease, while the positive coefficient for MPR indicates a slight increase in lane-change incidents with more vehicles equipped with driving automation systems. The high value of intercepts, added to the positive contribution of MPR in rear-end conflicts, underlines the inherently higher likelihood of conflicts at stop-controlled intersections due to cautious following distances of vehicles equipped with driving automation systems. For both conflict types, the tertiary roads present negative coefficients, reflecting the fewer conflicts on less-trafficked roads.
The evaluation metrics of the model given in
Table 7 highlight the precision, recall, and F1 score for each conflict type (e.g., crossing, lane-change, and rear-end). Concretely, the model provides a precision of 0.60 with a recall of 0.59 for the crossed conflicts, giving rise to a balanced F1 score of 0.59. This suggests that the identification of crossing conflicts is moderately effective, although metrics here do suggest some room for refinement toward increasing the model’s predictive power on this category. In lane-change conflicts, however, performance is markedly weaker: an observed precision of 0.36, a recall of 0.01, and an F1 score of 0.02 are recorded there. These reflect the struggles of the model in making correct predictions of lane-change conflicts, which could be due to the insufficiency of data representation for this type, as suggested in the simulation constraints analysis. The rear-end conflicts, however, get classified with a high accuracy of 0.86 precision, 0.97 recall, and F1 score of 0.91. This high performance aligns well with the predictability of rear-end incidents, probably driven by more crisp and consistent patterns within the dataset for such conflicts.
Overall, the accuracy for this model is 0.82, which means that 82% of conflicts were classified correctly.
Figure 7, the confusion matrix, shows most of the misclassifications in the lane-change category, with lane-change conflicts being misclassified as other types. This misclassification further supports the lower recall and F1 score of lane-change conflicts in the model. A primary reason for this is the relatively low occurrence of lane-change conflicts within the study area, as the majority of the road network consists of single-lane roads where lane changes are less frequent or even not applicable. As such, there is a limited amount of data available to adequately train the model on lane-change behavior. The current model relies on aggregate variables such as MPR and speed, which, while effective for predicting other conflict types, may lack the granularity needed for lane-change scenarios. This limitation is particularly evident in mixed-traffic conditions, where the interaction between human-driven and vehicles equipped with driving automation systems adds further variability to lane-change behavior. In contrast, rear-end conflicts, which occur more frequently, showed the lowest misclassification rate, strengthening the capability of the model to provide reliable predictions of this conflict type due to the interaction of vehicles equipped with driving automation systems, especially under conditions dictated by MPR and types of road control. The imbalance in classification performance between lane-change and rear-end conflicts suggests that further predictors, specifically related to lateral vehicle movements and surrounding vehicle proximity, could enhance the model’s performance for lane-change scenarios. Additionally, the inclusion of variables capturing driver reaction times or decision-making processes could address the observed gaps in predictive accuracy for lane-change conflicts. Future studies should consider these aspects to provide a more comprehensive understanding of conflict dynamics in mixed-traffic scenarios.
4. Discussion
The study revealed crucial insights about the influence of CAV adoption on road safety. The findings show that incorporating CAVs into urban traffic networks has a significant impact on important safety metrics, such as TTC, conflict frequency, and conflict types, including rear-end, lane-change, and crossing conflicts. The regression models developed in this study include geometric configuration variables, such as road type, control type, capacity, and speed limit, which play a significant role in influencing traffic safety and operational performance. While these variables are specific to the study area (Villaverde district), the models aim to capture broader patterns rather than site-specific details. This approach ensures that the equations reflect generalizable relationships, making them potentially applicable to areas with similar geometric characteristics. However, their practical applicability outside the study area depends on the similarity of conditions and may require calibration for new contexts. Only statistically significant parameters were retained in the final models to ensure robustness. The equations’ complexity derives from the goal of adequately describing multidimensional interactions; nevertheless, simplifying the equations further by removing variables could improve interpretability. It would risk reducing the models’ accuracy and explanatory power. Nonetheless, with additional data or resources, future research could test the influence of other parameters or evaluate alternative relationships between variables.
This research revealed an important positive relationship between increased CAV MPR and enhanced TTC values, suggesting improved safety in driving conditions. The growing prevalence of AVs underscores their capacity for sustaining consistent and safe following distances in comparison to human drivers. This effect aligns with research findings that suggest that the cautious driving behavior of CAVs enhances overall safety, even when network capacity increases more slowly than safety improvements [
26]. As the network changes to be dominated by CAVs, the types and numbers of conflicts seen at different CAV penetration rates become more complicated. Particularly, the study noted an increase in rear-end collisions as CAV penetration increased. This is likely due to the conservative stopping distances of CAVs, which have the capacity to startle human drivers in mixed-traffic scenarios. This trend is further supported by research that highlights rear-end collisions as a common hazard in mixed-traffic environments with low to moderate AV penetration rates [
28].
On the other hand, when CAV penetration rates grew, their predictable behavior and respect for traffic norms were shown to reduce issues related to lane changes and crossings. This conclusion is consistent with research that emphasizes the critical function of AVs in reducing dangerous crossings and unpredictable lane changes by developing more structured traffic patterns [
21]. Increased CAV penetration rates result in a safer and smoother flow since CAVs collectively minimize these conflicts. Conflicts decrease initially at mid-level penetration rates of approximately 40%, but they again increase as CAV penetration approaches 100%. This non-linear pattern underscores the necessity of infrastructure modifications, as CAVs introduce distinctive traffic dynamics, particularly when their conduct diverges from that of traditional drivers. According to research, the best way to reduce traffic jams is to separate the unique flow characteristics of AVs when dedicated AV lanes are set up at higher penetration levels [
29]. The impact of vehicle type was also substantial, with heavier vehicles equipped with SAE Level 5 driving automation systems, necessitating more conservative spacing and driving behavior, particularly at higher penetration rates. This underscores the necessity of infrastructural support, including controlled channels and signage, to effectively manage a variety of AV behaviors in intricate urban networks. Research has shown that these infrastructural modifications, particularly when implemented with high-definition imaging, optimize safety benefits and improve AV integration [
30].
While this study utilized TTC as the primary surrogate safety measure, it is important to note that other measures, such as PET, could provide additional insights into traffic safety dynamics. In the present study, only the models with statistically significant results were retained to maintain the validity and explanatory power of the analysis. Future research should consider incorporating alternative surrogate safety measures to enhance the robustness and transparency of safety evaluations, especially in complex mixed-traffic environments [
22].
Regardless of the promising safety benefits linked to AVs, it is important to take into account the study’s limitations. While the simulation-based approach allows for a suitable evaluation of fictitious CAV penetration situations, it neglects some crucial real-world conditions. Driver behavior under stress, unanticipated road conditions, and environmental factors like weather are just a few of the variables that may have a substantial influence on how CAVs interact with people during operation in ways that simulation models do not account for. Furthermore, due to the fact that this study focused on a specific metropolitan network in Madrid, the findings may not be relevant to other geographic and infrastructural situations. High-speed highways and rural roads, for example, may provide specific safety issues not addressed in this study. Further limitations include the study’s progressive approach to CAV penetration rates, which may not truly reflect how CAV technology adoption occurs in the real world. In fact, AV adoption rates may vary surprisingly between areas, resulting in distinct risk characteristics that the research’s linear growth model cannot account for.
Given that the focus of this research is on modeling traffic scenarios for varying MPRs of CAVs ranging from 0 to 100%, which are not yet representative of current real-world traffic conditions, physical validation of these models is not feasible at this stage. However, future research could explore the validation of these models as the market penetration of CAVs increases and these scenarios become more relevant in practice.
In order to address these constraints and further develop the findings, future research should incorporate real-world, longitudinal studies that monitor the integration of CAVs over time. This research has the ability to validate simulation results and give vital insights into the long-term effects of self-driving cars (AVs) on human-driver relations as CAV penetration naturally increases. By including environmental elements such as poor weather and a variety of road types, such as high-speed freeways or country roads, into simulation models, conclusions would be more applicable to a larger range of traffic scenarios. Furthermore, an evaluation of policy-driven solutions, such as adaptive traffic control systems and CAV-exclusive lanes, would provide useful insights into better managing mixed-traffic settings. During the initial phases of AV adoption, the implementation of policies that promote adaptive signaling or establish dynamic speed limits may reduce rear-end collisions and simplify transitions. Moreover, this study employed traditional regression techniques, ensuring that the assumptions of linearity and other diagnostic tests were satisfied, to ensure interpretability and practical application of results in traffic safety research. While these methods provide robust insights, advanced statistical and machine learning techniques could further enhance the analysis by capturing complex, non-linear relationships. Future research could explore such methods to complement the findings and provide a more comprehensive assessment of the impact of vehicles equipped with driving automation system penetration on traffic safety.
Comprehensive regulatory frameworks and an assessment of public perception are necessary for the successful integration of CAV, in addition to technological advancements. Public acceptance studies might feed educational programs addressing widespread concerns about CAV safety, whereas regulatory research could set liability requirements and operating rules for CAVs in shared traffic situations. Through the integration of insights from longitudinal studies, adaptive infrastructure, and regulatory research, stakeholders can facilitate a more seamless transition to CAV-dominated roads. This approach maximizes safety benefits and reduces transitional risks.
This study concludes that the penetration of AVs has a typically positive effect on traffic safety, as it reduces severe conflicts and promotes stable traffic movements. Nevertheless, mixed-traffic conditions present distinctive obstacles, particularly in areas with low to moderate CAV penetration rates. These complexities can be resolved through targeted infrastructure, adaptive policies, and additional research, thereby facilitating the development of a more efficient and secure transportation system that effectively accommodates both human drivers and vehicles equipped with driving automation systems. Policymakers and urban planners must concentrate on pragmatic strategies that facilitate the incorporation of CAVs into current traffic infrastructure. The incremental deployment of adaptive traffic management technologies and dynamic speed limits can reduce rear-end collisions in mixed-traffic scenarios. Infrastructure enhancements, such as dedicated CAV lanes and V2X communication systems, are essential for improving safety and efficiency, especially with the rising prevalence of CAVs. Regulatory frameworks must tackle liability concerns and set operational requirements for mixed-traffic settings, whereas public outreach initiatives can enhance societal acceptance of CAVs. By synchronizing these steps with technical improvements, stakeholders can enable a more seamless transition to CAV-dominated networks, optimizing safety and operational advantages.
5. Conclusions
The examination of SAE Level 5 AV integration into traffic systems indicates a complex influence on road safety, influenced by traffic conditions and infrastructure characteristics. As vehicles equipped with driving automation systems gradually supplant conventional vehicles, their distinct driving behaviors exert both beneficial and detrimental impacts on traffic dynamics, with particular effects manifesting at varying levels of AV penetration.
The TTC is an important parameter that is impacted by vehicle types, the level of AV market penetration, and road infrastructure characteristics such as signs and speed limits. Vehicles equipped with driving automation systems improve safety by improving TTC, which allows for greater reaction time in possible crash scenarios. The cohabitation of CAVs with conventional cars on the road produces a diverse traffic environment, which may lead to unforeseen interactions that impair TTC consistency. This emphasizes the significance of traffic management methods for meeting the anticipated mixed-traffic circumstances throughout the transition phase. Another key factor is the frequency and type of traffic conflicts, which vary considerably with road and vehicle characteristics. The increased perception and reaction capabilities of CAVs have been shown to reduce specific conflict types, such as lane-changing and crossing conflicts. However, one drawback appears to be an increase in the number of rear-end collisions. This issue arises when vehicles equipped with driving automation systems consistently maintain smaller, controlled inter-vehicle distances, potentially surprising traditional drivers who typically drive more aggressively and anticipate larger inter-vehicle gaps. This interaction indicates a possible requirement for policy or infrastructural modifications to enhance safety in interactions between AVs and traditional vehicle operators.
The highest conflict speed recorded in incidents is also associated with CAV penetration rates and the type of road. The growing popularity of autonomous cars often decreases maximum conflict speeds, lowering the severity of probable crashes. Particularly when the AV serves as the secondary vehicle in specific conflict scenarios, the maximal conflict speed may increase, potentially increasing the risk of injury. This variation underscores the complexity of AV interactions and the necessity for additional research on the influence of AV positioning in conflicts on outcomes. Infrastructure characteristics, such as road types and traffic control measures, play a crucial role in determining these outcomes. Secondary and tertiary roads have been shown to reduce both TTC and conflict frequency, which is most likely due to these routes’ lower speed restrictions. Stop signs, while beneficial in improving traffic control and reducing overall conflict occurrences, increase the chance of rear-end collisions due to the need for frequent stops. This discovery emphasizes the importance of infrastructure improvements planned for the coexistence of autonomous and conventional vehicles, guaranteeing a balance of advantages across different conflict types.
To summarize, including cars equipped with driving automation systems into traffic networks brings major safety benefits, yet mixed-traffic environments create unique obstacles. In the future, developing adaptable infrastructure and traffic rules will be critical for cars equipped with driving automation systems to reach their full potential in terms of road safety and efficiency across a wide range of driving circumstances.


