Abstract
Proper road network maintenance is essential for ensuring safety, reducing transportation costs, and improving fuel efficiency. Traditional pavement condition assessments rely on specialized equipment, limiting the frequency and scope of inspections due to technical and financial constraints. In response, crowdsourcing data from connected and autonomous vehicles (CAVs) offers an innovative alternative. CAVs, equipped with sensors and accelerometers by Original Equipment Manufacturers (OEMs), continuously gather real-time data on road conditions. This study evaluates the feasibility of using CAV data to assess pavement condition through the International Roughness Index (IRI). By comparing CAV-derived data with traditional pavement auscultation results, various thresholds were established to quantitatively and qualitatively define pavement conditions. The results indicate a moderate positive correlation between the two datasets, particularly in segments with good-to-satisfactory surface conditions (IRI 1 to 2.5 dm/km). Although the IRI values from CAVs tended to be slightly lower than those from auscultation surveys, this difference can be attributed to driving behavior. Nonetheless, our analysis shows that CAV data can be used to reliably identify pavement conditions, offering a scalable, non-destructive, and continuous monitoring solution. This approach could enhance the efficiency and effectiveness of traditional road inspection campaigns.
1. Introduction
The proper maintenance of road networks is crucial for preserving and enhancing citizens’ quality of life [1,2]. Otherwise, the costs associated with the transportation of goods and people would increase due to poor road conditions, which lead to higher fuel consumption and, consequently, increased greenhouse gas emissions. Additionally, poor pavement conditions pose significant dangers to road users, cause greater tire wear, and can damage vehicles [3,4].
Therefore, it is essential for highway authorities to develop a pavement management system to analyze the lifecycle of road infrastructure and create optimal pavement conditions. This requires evaluating pavement condition and developing predictive models to understand how pavement deterioration will evolve [5].
In this context, the Spanish Highway Administration, like many national highway agencies, has implemented a pavement management system designed to effectively and efficiently manage road maintenance. This system facilitates the creation of inventories, the maintenance of a database for surveys and inspections, and the assessment of pavement condition using various indices. There are, however, areas for improvement regarding the availability of information on pavement condition, as auscultation systems require significant investment. Additionally, while visual inspections are necessary before making decisions, they may introduce variability in assessments. Exploring the use of evolutionary models to predict pavement condition, estimate pavement life, and determine the optimal timing for interventions could further enhance management efficiency and effectiveness.
As a result, according to the Spanish Road Association, Spanish roads are in a “poor” state of conservation, nearing the “very poor” threshold [6]. One out of thirteen kilometers of the Spanish road and highway network shows significant deterioration in over 50% of the pavement surface, featuring potholes, rutting, and longitudinal and transverse cracks. This lack of maintenance is severely impacting Spanish road infrastructure, with a 36% loss in asset value between 2001 and 2017 for national roads and a 38% loss for regional and local roads. This progressive deterioration leads to uncomfortable driving conditions, road safety issues, inter-territorial and European competitiveness losses, exponential increases in pavement repair costs, higher vehicle maintenance costs, and increased pollutant emissions.
Current methods for evaluating pavement condition involve conducting inspections with specialized equipment to assess pavement condition and driving comfort [7,8,9,10]. Due to economic and technical constraints, administrations cannot cover the entire road network on an annual basis. This typically results in detailed data collection only for high-volume roads, with less attention given to lower-priority roads.
Despite advancements in image processing and specialized vehicle instrumentation [11,12,13,14,15,16], a significant gap exists in terms of scalability and continuous monitoring across all road types. The current methods, including those based on image processing, are limited by their dependency on equipment setup, cost, and infrequent data collection cycles. Additionally, the reliance on specific vehicles or routes further restricts the ability to gather consistent, real-time pavement data.
An alternative to these instrumented vehicles is crowdsourcing data from connected and autonomous vehicles (CAVs). Original Equipment Manufacturers (OEMs) integrate sensors, accelerometers, and mobile network connections in vehicles, providing a data source on current road conditions. Integrating and utilizing vehicle data have enabled the assessment of road markings, traffic signs, and crash mitigation through surrogate safety measures [17,18,19,20,21]. In pavement condition evaluation, vehicles use a system that leverages individual wheel speed through rotational sensors combined with transmission information to provide data on ride quality or comfort [22]. This information can be used to estimate the International Roughness Index (IRI) using a fleet of crowdsourced vehicles.
Unlike auscultation methods, whose results depend significantly on the path of the specialized equipment at the time of measurement and have very low data collection frequency, data from CAVs constitute a more reliable type of real-time road condition information, with data from hundreds or thousands of vehicles at each road point.
Thus, this study fills the gap by leveraging crowdsourced data from CAVs to provide continuous, scalable, and cost-effective pavement monitoring. The novelty of this approach lies in its ability to utilize data from a vast fleet of vehicles, offering higher data frequency and broader network coverage than traditional methods.
2. Materials and Methods
This study aims to analyze the relationship between International Roughness Index (IRI) data obtained from pavement assessments made via specialized equipment and IRI values derived from data collected by Connected and Autonomous Vehicles (CAVs) to explore the feasibility of using the latter for assessing the roughness of rural roads.
To achieve this objective, this study will first provide a description of available roughness data, identifying the specific road where these data were collected. Next, a descriptive and graphical analysis of IRI values obtained from both pavement assessments and CAVs will be conducted to assess their initial correlation.
Following the descriptive analysis, a statistical analysis using paired sample tests will be performed by matching IRI data from both sources at each kilometer and hectometer point along the road. The null hypothesis for this statistical test assumes there is no difference in means between the two datasets, subject to prior evaluation of data normality.
Finally, this study proposes establishing various thresholds to quantitatively and qualitatively determine pavement conditions based on data collected from connected and autonomous vehicles.
2.1. Road Segment
The road section used for the development of this study is a segment of road N-310, from station 144 + 990 (San Clemente) to station 198 + 710 (Villanueva de la Jara), in the province of Cuenca (Spain).
This road segment is a two-lane rural road with a total cross-section width of 10 m composed of asphalt pavement. The width of each lane and shoulder is 3.5 m and 1.5 m, respectively. Specifically, along this segment, there are a total of six traffic-counting stations (see Table 1). The Average Annual Daily Traffic (AADT) along this road segment in 2021 ranged from approximately 1000 to 3000 vehicles per day.

Table 1.
Annual Average Daily Traffic (AADT) on the road segment in question in 2021 [23].
2.2. Auscultation Data
The pavement condition data were provided by the Highway Department of Castilla–La Mancha, a division of the Highway Administration of the Spanish Ministry of Transport and Sustainable Mobility.
The field data were collected on 15 June 2023. Specifically, the following variables were obtained: (i) section identifier (IdSection), (ii) highway (IdRoad), (iii) initial station (PKIHito and PKIDist), (iv) final station (PKFHito and PKFDist), (v) right wheel track IRI (IRI_der), (vi) left wheel track IRI (IRI_izq), and (vii) average IRI (IRI_med).
In addition to these data, another set of georeferencing data were provided, with the following information: (i) section identifier (IdSection), (ii) highway (IdRoad), (iii) initial station (PKIHito and PKIDist), (iv) final station (PKFHito and PKFDist), and (v) UTM coordinates (UTMx and UTMy). From these data, IRI values could be assigned to the highway and the corresponding measurement unit, as the data related to the station points might not be sufficiently accurate. In short, IRI data are available every hectometer.
2.3. Data from Connected and Autonomous Vehicles
Data regarding pavement condition from connected and autonomous vehicles were downloaded on the same day as the pavement assessment, specifically on 15 June 2023. These data were provided by NIRA Dynamics, which manages a vehicle fleet consisting of close to two million cars around the world.
These vehicles are equipped with software that collects real-time data from the existing onboard sensors. Thus, the vehicles serve as a continuous sensor of infrastructure conditions whenever they travel on it with the minimum sample size required to ensure that the measurement is not biased by a single vehicle. For this study, data from the connected vehicles were collected not only on the specified day but also aggregated over a 30-day period to provide a more comprehensive overview. This product is called the long-term value of road roughness.
Original Equipment Manufacturers (OEMs) integrate enhanced sensors, accelerometers, and mobile connections into vehicles to provide a rich data source on current road conditions. Wheel speed is leveraged through rotation sensors in combination with drivetrain information to assess pavement quality across vehicle fleets. These measurements are processed through NIRA Dynamics’ sensor fusion algorithms, which uses the calibration data to translate raw sensor outputs into roughness indicators, including the International Roughness Index (IRI). This method ensures that the IRI values are consistent with standard pavement assessment methodologies.
Data provided by the supplier were aggregated into segments of approximately 20 m based on mapping from navigation and mapping companies. Once a segment was obtained, it was georeferenced and assigned to the road under study. Specifically, the data structure available for each road segment includes (i) segment identifier (IdSection), (ii) International Roughness Index (IRI) value in dm/hm (IRI), (iii) UTM coordinates of points within the segment (geometry), (iv) UTM coordinates of the starting point of the road segment (GeometryInitialPoint), and (v) UTM coordinates of the endpoint of the road segment (GeometryFinalPoint). As with the auscultation data, a value of IRI per hectometer was available.
3. Results
3.1. Descriptive Analysis
Table 2 presents a statistical summary of the IRI data obtained, expressed in dm/hm. As can be seen, the mean IRI value obtained from the data recorded by the CAVs (IRI_cavs) closely resembles, in overall terms, the mean IRI from auscultations (IRI_med), calculated as the average of the maximum and minimum values. However, the positional parameters—minimum value, maximum value, and percentiles—indicate that the minimum IRI values (IRI_min) dataset is the most similar to the distribution of the IRI_cavs data.

Table 2.
Statistical summary for IRI.
To further explore the aforementioned points, density distributions of all the IRI datasets are represented (Figure 1). Firstly, it is noteworthy that all the distributions exhibit positive skewness, meaning the data cluster at lower IRI values, with a tail towards higher values. This suggests that the mean values of the datasets are higher than the median or the 50th percentile (see Table 2). Additionally, it can be observed that the density curve most similar to that described by the IRI_cavs data is that of the minimum values obtained from auscultation (IRI_min). However, in the tail of the distribution, the IRI dataset from CAVs (IRI_cavs) more closely resembles the distribution of the mean auscultation data (IRI_med).
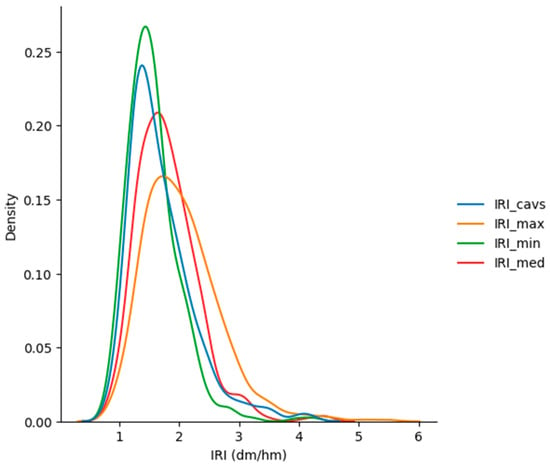
Figure 1.
Density distribution of IRI datasets.
Nevertheless, similarity between distributions does not necessarily imply a higher correlation between the datasets, especially considering that the data are actually paired by the location of the observations.
Figure 2 includes the correlation matrix between the different IRI datasets analyzed, as well as the corresponding scatter plots comparing the IRI values from CAVs with those from the other datasets. As expected, the correlations between the auscultation datasets are strong (>0.8). Regarding the correlation between IRI_cavs and IRI from auscultation, it is noteworthy that they are very similar across all the datasets considered. However, the correlation between IRI_cavs and the datasets of minimum and mean IRI is very similar (>0.5), despite identifying earlier that the density distribution most similar to the IRI_cavs data was that of the minimum auscultation values.
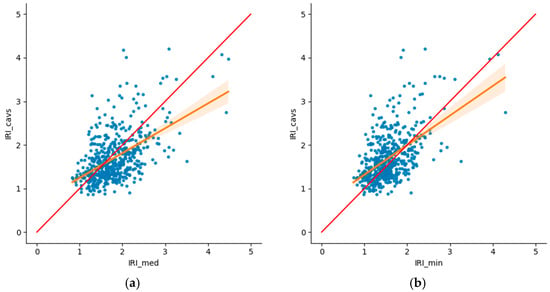
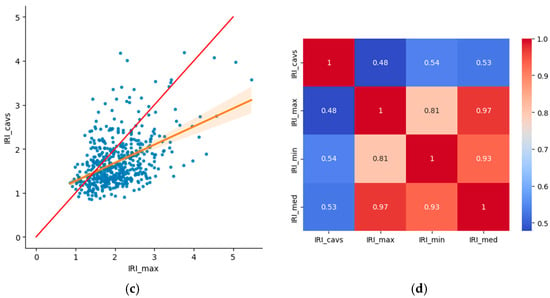
Figure 2.
Correlation analysis: (a) IRI_cavs and IRI_med, (b) IRI_cavs and IRI_med, (c) IRI_cavs and IRI_med, and (d) correlation matrix.
Additionally, a scatter plot was created, which includes the point density in the represented region (see Figure 3). Specifically, only the relationship between IRI_cavs and IRI_min is represented, which is indicative of the other cases. As observed, most observations are situated between values of IRI of 1 dm/hm and 2.5 dm/hm, and these values appear to concentrate very close to the line representing IRI_cavs = IRI_min. Specifically, the values obtained from vehicles seem slightly lower than those obtained from auscultation, particularly as the IRI value increases (see Figure 2). This phenomenon could be explained by the behavior of road users, who tend to avoid the most deteriorated parts of the road. Given that these parts usually correspond to lane-centered driving and that auscultation methods try to trace this trajectory, it was expected that the values of the roughness data obtained from CAVs would be slightly lower than those of the data obtained via auscultation, mainly as users’ discomfort increases.
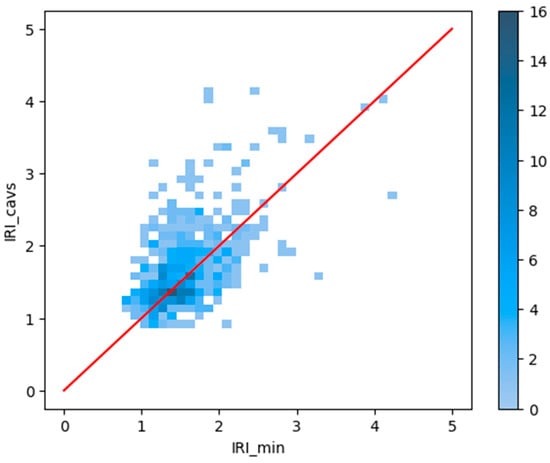
Figure 3.
Point histogram.
3.2. Statistical Analysis
This section aims to determine whether IRI data from Connected and Autonomous Vehicles (CAVs) can be considered equivalent to those obtained through auscultation methods. For this purpose, the chosen statistical test is the paired samples comparison. The primary aim of this type of test is to compare IRI values obtained from auscultation and those derived from CAVs for each hectometer point.
Specifically, to determine the statistical test to be applied, it is necessary first to evaluate the normality of the data. As mentioned during the descriptive analysis, all the datasets exhibit strong positive skewness. Therefore, according to the results of the Shapiro–Wilk test, it cannot be confirmed with 95% confidence that the datasets follow a normal distribution, as the p-values are less than 0.05 (Table 3).

Table 3.
Assessment of data normality: Shapiro–Wilk test.
This implies that the paired data test using the usual t-test cannot be performed. Thus, the following alternative tests were proposed: (i) the Wilcoxon signed-rank test and (ii) the Kruskal–Wallis test. Both these tests are non-parametric and therefore require fewer assumptions compared to the t-test for dependent samples. Specifically, the Wilcoxon test checks whether the mean values of two dependent groups differ significantly from each other. On the other hand, the Kruskal–Wallis test determines whether the medians of two or more groups are different.
Table 4 and Table 5 present the results of the Wilcoxon signed-rank test and the Kruskal–Wallis test, respectively, conducted for each pair of datasets. As a result, at a 95% confidence level, neither of the null hypotheses of the considered tests can be confirmed. Therefore, we concluded that the IRI data from CAVs are not equivalent to the data obtained through auscultation.

Table 4.
Wilcoxon test.

Table 5.
Kruskal-Wallis test.
Despite not being equivalent, a relationship between both datasets could be established to, for example, estimate auscultation data using the IRI values from CAVs.
3.3. Proposal of Thresholds for Pavement Evaluation
Considering that it is not possible to assert, with a 95% confidence level, that the IRI values obtained from connected and autonomous vehicles (CAVs) are similar to those obtained from auscultation equipment, the relationship between IRI_cavs and IRI_min was analyzed in greater depth since there exists a moderate correlation between both datasets.
The qualitative evaluation of pavement condition established by the Spanish Highway Administration based on the IRI value for conventional road network routes served as the basis for this assessment (see Table 6).

Table 6.
Qualitative levels of pavement condition according to the Spanish Highway Administration.
Using these qualitative pavement condition levels and the IRI_min value, the IRI data from CAVs were classified into different subsets, with each subset’s outcome represented in a box–whisker plot (see Figure 4). As pavement condition worsens, the mean and median values of the IRI_cavs subset increase, demonstrating a clear relationship between the IRI value obtained from CAV data and pavement condition. It is important to note that most available IRI_cavs values range between 1.0 and 2.5 dm/hm; hence, for pavement conditions rated as fair, poor, or very poor, variability is quite high. A larger volume of data is needed to study these pavement condition levels in greater detail.
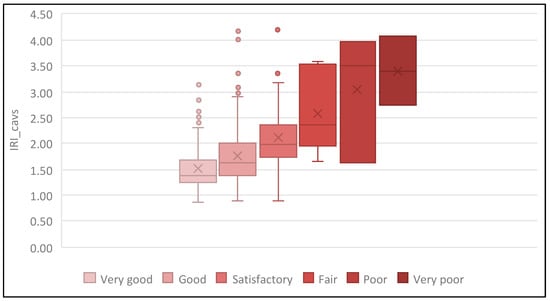
Figure 4.
Box–whisker diagrams for IRI_cavs according to pavement condition level.
Additionally, the confusion matrix generated when classifying pavement condition based on the variables IRI_cavs and IRI_min was estimated. To achieve this, the number of thresholds previously shown in Table 6 was reduced due to the low representativeness of levels associated with high IRI values, resulting in the thresholds presented in Table 7.

Table 7.
Qualitative levels of pavement condition (adaptation from Spanish Highway Administration).
Table 8 shows the confusion matrix considering the IRI values obtained from auscultation to be true. Each row of the matrix sums to 100%, indicating for a given IRI_min threshold the proportion of data classified into the proposed thresholds according to IRI_cavs. Notably, more than 80% of the data classified as corresponding to good pavement condition according to IRI_min were similarly classified according to IRI_cavs. However, 50% of the data evaluated as corresponding to fair pavement condition according to IRI_min were classified as corresponding to good condition according to IRI_cavs, potentially leading to inadequate pavement management. These results were anticipated based on Figure 3 and the statistical analysis, suggesting that the thresholds used to determine pavement condition from auscultation-derived IRI values may differ from those for CAV-derived IRI values.

Table 8.
Confusion matrix according to the qualitative levels defined by the Spanish Highway Administration.
Thus, new thresholds were calibrated to determine pavement conditions based on the IRI values from vehicles. The objective function was designed to maximize the values on the diagonal of the confusion matrix, with fixed IRI_min thresholds according to Table 7 and varying IRI_cavs thresholds. As a result, the thresholds presented in Table 9 were obtained. The updated confusion matrix is shown in Table 10, indicating that approximately 70% of the data were appropriately classified. However, we recommend recalibrating these thresholds and validating the results with a larger dataset that includes a greater range of pavement condition levels, particularly with data on pavements in poor condition.

Table 9.
Qualitative pavement condition levels according to IRI_cavs.
4. Discussion
This study delves into the potential of using data from connected and autonomous vehicles (CAVs) to assess pavement condition, specifically through the International Roughness Index (IRI). The results presented here contribute to understanding how CAV data can complement or even substitute for traditional manual survey methods in pavement management systems.
4.1. Comparison of IRI Data Sources
The moderate positive correlation observed between the IRI values derived from CAVs and those from manual surveys underscores the utility of CAV data in assessing pavement conditions. However, the discrepancies between the datasets, particularly noticeable at higher IRI values, suggest the need for cautious interpretation. Variations can arise from differences in measurement precision, vehicle-sampling biases, and environmental factors affecting data collection. For instance, while CAVs provide extensive coverage across road networks, variations in vehicle speeds and path selections may influence the accuracy and representativeness of the data, especially in segments with more severe pavement degradation.
These practical considerations indicate that while CAVs offer a valuable and scalable alternative for road condition monitoring, their results should be carefully interpreted, particularly in the case of severely deteriorated roads where traditional methods might still provide a more precise evaluation.
4.2. Data Distribution and Pavement Condition
The density distributions of the IRI datasets, which skew towards lower values, predominantly align with segments categorized as “Very Good” to “Satisfactory” according to established thresholds. This distribution pattern reflects the suitability of CAV data for identifying well-maintained pavement sections but highlights the need for increased data sampling in poorer conditions. This expansion would enhance the robustness of correlation analyses across a broader spectrum of pavement states, thereby improving the reliability of condition assessments.
From a road maintenance perspective, these results suggest that CAV-derived data could be integrated into existing pavement management strategies to provide continuous updates on well-maintained roads, with additional efforts required for roads in poorer condition.
4.3. Implications for Pavement Management
Integrating CAV data into pavement management systems offers several operational advantages. By providing real-time and continuous data streams, CAVs enable timely updates on pavement conditions without the logistical and cost constraints associated with periodic manual surveys. This capability enhances the scalability and efficiency of maintenance planning and decision-making processes, potentially reducing operational costs and minimizing disruptions to road users. Furthermore, the comprehensive coverage provided by CAVs facilitates a more equitable distribution of monitoring efforts across entire road networks, ensuring that critical maintenance needs are identified and addressed promptly.
These practical implications underscore the potential for road authorities to adopt CAV-based systems as part of a proactive maintenance strategy, allowing for more efficient resource allocation and timely intervention before road conditions worsen.
4.4. Practical Considerations and Recommendations
The establishment of distinct IRI thresholds for CAV-derived data has proven to be effective in categorizing pavement conditions into qualitative states. However, this study highlights the importance of refining these thresholds through extensive validation exercises involving diverse pavement conditions and geographic contexts. Such validations are crucial for ensuring the accuracy and applicability of CAV data in supporting informed decision-making by road authorities and stakeholders. Moreover, advancements in sensor technology and data analytics present opportunities to enhance the precision and reliability of CAV-based pavement assessments, warranting continued research and innovation in this field.
While CAV data offer several advantages, practical limitations remain, particularly regarding real-time applications. Variability in data due to vehicle behavior—such as changes in driving patterns to avoid road defects—and environmental conditions like weather can introduce noise into data, making calibration essential to minimize these influences.
4.5. Future Research Directions
Future research efforts should focus on addressing several key areas to further advance the integration of CAV data into pavement management:
- Enhanced data sampling—increasing the diversity and volume of CAV data collected, particularly in segments exhibiting greater pavement deterioration, to improve the robustness of correlation analyses.
- Validation and calibration—conducting extensive validation studies across varied environmental and traffic conditions to refine and validate proposed IRI thresholds derived from CAV data.
- Sensor technology advancements—exploring advancements in sensor technologies and data-processing algorithms to enhance the accuracy, reliability, and real-time capabilities of CAV-based pavement assessments.
- Lifecycle analysis—developing predictive models that leverage CAV data to forecast pavement deterioration and optimize maintenance strategies over the lifecycle of road infrastructure.
In conclusion, while CAV data have substantial potential for revolutionizing pavement management practices, further research efforts are essential to address relevant technical, methodological, and operational challenges. By advancing these fronts, the transportation sector can leverage CAV technologies to achieve more sustainable, cost-effective, and resilient pavement management solutions in the future.
5. Conclusions
This study presents an analysis of the relationship between International Roughness Index (IRI) values obtained through auscultation methods and those gathered by Connected and Autonomous Vehicles (CAVs). The most noteworthy conclusions are as follows:
- The density distributions of the IRI datasets exhibit positive skewness, with observations predominantly clustering at lower IRI values. Thus, expanding the dataset to include higher IRI values would refine the correlation analysis between the two datasets, particularly under poor pavement conditions.
- The results of the correlation analysis indicate there is a moderate positive correlation between IRI values recorded by connected and autonomous vehicles and those obtained through manual surveys
- The majority of observations fall within an IRI range of 1 dm/km to 2.5 dm/km, suggesting road segments with a surface roughness level ranging from “Very Good” to “Satisfactory” based on thresholds established by the Spanish Highway Administration.
- IRI values derived from vehicles are slightly lower than those obtained through manual surveys as IRI values increase. This could be attributed to driver behavior, where drivers tend to avoid more deteriorated paths, resulting in non-centered lane travel.
- Despite not being directly comparable to auscultation data, the IRI values from connected and autonomous vehicles can be used to establish distinct IRI thresholds to qualitatively assess pavement condition.
- The confusion matrix obtained (see Table 10) indicates that the defined IRI thresholds from connected and autonomous vehicles effectively identify pavement condition.
- Considering that IRI values from connected and autonomous vehicles aggregate data from hundreds or thousands of vehicles, they are deemed highly reliable for initial pavement condition assessments. Thus, employing IRI data from these vehicles presents a cost-effective and non-destructive alternative to traditional methods, potentially enhancing and optimizing conventional field data collection campaigns.
Author Contributions
Conceptualization, D.L.-C. and P.T.-M.; methodology, D.L.-C. and F.J.C.-T.; formal analysis, D.L.-C. and F.J.C.-T.; data curation, F.R.-P.; writing—original draft preparation, D.L.-C.; writing—review and editing, F.J.C.-T., P.T.-M. and F.R.-P. All authors have read and agreed to the published version of the manuscript.
Funding
This research received no external funding.
Data Availability Statement
The data presented in this study are available on request from the corresponding author due to privacy reasons.
Acknowledgments
The authors would like to thank the Highway Department of Castilla La Mancha, a division of the Highway Administration of the Spanish Ministry of Transport and Sustainable Mobility, for providing the auscultation data.
Conflicts of Interest
The authors declare no competing interests. The author Fabio Romeral-Pérez was employed by the company Xouba Ingeniería S.L., C/de Cristóbal Bordiú 33 Entreplanta A. There is no conflict of interest between any of the authors and the company Xouba Ingeniería S.L., C/de Cristóbal Bordiú 33 Entreplanta A.
References
- Bull, A.; CEPAL, N. Traffic Congestion: The Problem and How to Deal with It; ECLAC: Santiago, Chile, 2003. [Google Scholar]
- Hajj, E.Y.; Loria, L.; Sebaaly, P.E. Performance evaluation of asphalt pavement preservation activities. Transp. Res. Rec. 2010, 2150, 36–46. [Google Scholar] [CrossRef]
- Santero, N.J.; Horvath, A. Global warming potential of pavements. Environ. Res. Lett. 2009, 4, 034011. [Google Scholar] [CrossRef]
- Lee, J.; Abdel-Aty, M.; Nyame-Baafi, E. Investigating the effects of pavement roughness on freeway safety using data from five states. Transp. Res. Rec. 2020, 2674, 127–134. [Google Scholar] [CrossRef]
- Pérez-Acebo, H.; Bejan, S.; Gonzalo-Orden, H. Transition probability matrices for flexible pavement deterioration models with half-year cycle time. Int. J. Civ. Eng. 2018, 16, 1045–1056. [Google Scholar] [CrossRef]
- Asociación Española de la Carretera. Análisis de la Relación Entre el Estado de Conservación del Pavimento, el Consumo de Combustible y las Emisiones de los Vehículos; Asociación Española de la Carretera: Madrid, Spain, 2020. [Google Scholar]
- Pierce, L.M.; McGovern, G.; Zimmerman, K.A. Practical Guide for Quality Management of Pavement Condition Data Collection; Federal Highway Administration: Washington, DC, USA, 2013. [Google Scholar]
- Attoh-Okine, N.; Adarkwa, O. Pavement Condition Surveys–Overview of Current Practices; Delaware Center for Transportation, University of Delaware: Newark, DE, USA, 2013. [Google Scholar]
- Seraj, F.; Van Der Zwaag, B.J.; Dilo, A.; Luarasi, T.; Havinga, P. RoADS: A road pavement monitoring system for anomaly detection using smart phones. In International Workshop on Modeling Social Media; Springer International Publishing: Cham, Switzerland, 2014; pp. 128–146. [Google Scholar]
- Kamranfar, P.; Lattanzi, D.; Shehu, A.; Stoffels, S. Pavement Distress Recognition via Wavelet-Based Clustering of Smartphone Accelerometer Data. J. Comput. Civ. Eng. 2022, 36, 04022007. [Google Scholar] [CrossRef]
- Mahmoudzadeh, A.; Golroo, A.; Jahanshahi, M.R.; Firoozi Yeganeh, S. Estimating pavement roughness by fusing color and depth data obtained from an inexpensive RGB-D sensor. Sensors 2019, 19, 1655. [Google Scholar] [CrossRef] [PubMed]
- Baek, J.W.; Chung, K. Pothole classification model using edge detection in road image. Appl. Sci. 2020, 10, 6662. [Google Scholar] [CrossRef]
- Fan, R.; Wang, H.; Wang, Y.; Liu, M.; Pitas, I. Graph attention layer evolves semantic segmentation for road pothole detection: A benchmark and algorithms. IEEE Trans. Image Process. 2021, 30, 8144–8154. [Google Scholar] [CrossRef] [PubMed]
- Tedeschi, A.; Benedetto, F. A real-time automatic pavement crack and pothole recognition system for mobile Android-based devices. Adv. Eng. Inform. 2017, 32, 11–25. [Google Scholar] [CrossRef]
- Llopis-Castelló, D.; Paredes, R.; Parreño-Lara, M.; García-Segura, T.; Pellicer, E. Automatic classification and quantification of basic distresses on urban flexible pavement through convolutional neural networks. J. Transp. Eng. Part B Pavements 2021, 147, 04021063. [Google Scholar] [CrossRef]
- Ravi, R.; Bullock, D.; Habib, A. Pavement distress and debris detection using a mobile mapping system with 2D profiler lidar. Transp. Res. Rec. 2021, 2675, 428–438. [Google Scholar] [CrossRef]
- Xie, K.; Yang, D.; Ozbay, K.; Yang, H. Use of real-world connected vehicle data in identifying high-risk locations based on a new surrogate safety measure. Accid. Anal. Prev. 2019, 125, 311–319. [Google Scholar] [CrossRef] [PubMed]
- Mahlberg, J.A.; Sakhare, R.S.; Li, H.; Mathew, J.K.; Bullock, D.M.; Surnilla, G.C. Prioritizing roadway pavement marking maintenance using lane keep assist sensor data. Sensors 2021, 21, 6014. [Google Scholar] [CrossRef] [PubMed]
- Mahlberg, J.A.; Li, H.; Cheng, Y.T.; Habib, A.; Bullock, D.M. Measuring roadway lane widths using connected vehicle sensor data. Sensors 2022, 22, 7187. [Google Scholar] [CrossRef] [PubMed]
- Saldivar-Carranza, E.; Li, H.; Mathew, J.; Hunter, M.; Sturdevant, J.; Bullock, D.M. Deriving operational traffic signal performance measures from vehicle trajectory data. Transp. Res. Rec. 2021, 2675, 1250–1264. [Google Scholar] [CrossRef]
- Hunter, M.; Saldivar-Carranza, E.; Desai, J.; Mathew, J.K.; Li, H.; Bullock, D.M. A proactive approach to evaluating intersection safety using hard-braking data. J. Big Data Anal. Transp. 2021, 3, 81–94. [Google Scholar] [CrossRef]
- Magnusson, P.; Svantesson, T. Road Condition Monitoring. U.S. Patent 10,953,887 B2, 23 March 2021. [Google Scholar]
- Ministerio de Transportes y Movilidad Sostenible. Mapa de Tráfico. 2021. Available online: https://www.mitma.es/carreteras/trafico-velocidades-y-accidentes-mapa-estimacion-y-evolucion/mapas-de-trafico/2021 (accessed on 1 September 2024).
Disclaimer/Publisher’s Note: The statements, opinions and data contained in all publications are solely those of the individual author(s) and contributor(s) and not of MDPI and/or the editor(s). MDPI and/or the editor(s) disclaim responsibility for any injury to people or property resulting from any ideas, methods, instructions or products referred to in the content. |
© 2024 by the authors. Licensee MDPI, Basel, Switzerland. This article is an open access article distributed under the terms and conditions of the Creative Commons Attribution (CC BY) license (https://creativecommons.org/licenses/by/4.0/).