Article

Micro-Scale Experimental Approach for the Seismic Performance Evaluation of RC Frames with Improper Lap Splices

1
Department of Civil and Environmental Engineering, Florida International University, Miami, FL 33174, USA
2
School of Engineering and Technology, Asian Institute of Technology, Pathum Thani 12120, Thailand
3
Transport Development Division, CTI Engineering International, Tokyo 136-0071, Japan
4
Institute of Industrial Science, The University of Tokyo, Tokyo 153-8505, Japan
*
Authors to whom correspondence should be addressed.
Infrastructures 2023, 8(3), 56; https://doi.org/10.3390/infrastructures8030056
Submission received: 16 February 2023 / Revised: 6 March 2023 / Accepted: 13 March 2023 / Published: 15 March 2023

Abstract

:
Reinforced concrete (RC) frames are an integral part of modern construction as they resist both gravity and lateral loads in beams and columns. However, the construction methodologies of RC frames are vulnerable to non-engineering defects, particularly in developing countries. The most common non-engineering defect occurs due to improper lap splice, which can compromise the structural integrity. This research demonstrates an easy, low-cost, and verifiable experimental technique incorporating micro-concrete to evaluate the seismic performance of a completely engineered RC frame with the defect of improper lap splice. The micro-concrete was prepared by using the locally available material for a target compressive strength and then two scaled-down RC frames (1/16 scale) were prepared, including one proper frame and another with improper lap splice. Finally, these frames were tested on a shake table to study their behavior under various seismic loading conditions. This study quantifies the severity of high-risk structural systems due to non-engineering defects. The experimental results demonstrate that improper lap splice can alter the frame’s damage points, triggering the failure of the whole structure.

1. Introduction

The reinforced concrete (RC) moment resisting frame (MRF) is among the most common building construction practices in the modern world [1]. In recent earthquakes, these buildings have suffered damages mainly due to their inadequate design and flawed engineering practices in developing countries [2,3]. Many countries follow international building codes which have stringent building code requirements for high seismic zones. However, the construction practices in developing countries are slack, which has caused a severe threat to these buildings. This vulnerability could be attributed to various kinds of non-engineering defects in the buildings and has been widely accepted by experts in the past [4,5]. In this research, the authors have investigated improper lap splicing as an existing defect in RC frame construction which can occur due to incorrect or inadequate design.
It is imperative to note that through the experiences of experts [6], it is found that the main causes of these various non-engineering defects are due to a lack of (1) concern for safety, (2) awareness to build earthquake-resistant buildings, (3) skills in seismic design and workmanship, and (4) scarcity in construction materials. While some non-governmental organizations (NGOs) and academicians have tried to study and understand the cause of these problems [7,8,9], especially when built by local contractors, many others have tried to provide various retrofitting measures for these buildings to make them earthquake-resistant [10,11,12,13]. However, only a few researchers have examined these defects experimentally or analytically for dynamic testing to achieve a tailor-made solution in the form of retrofitting [14]. The main reason for this is the cost and complications involved in manufacturing RC frames of different cases and conducting a shake table test.
Various researchers have attempted to study different inadequacies in the construction of RC frames concerning their design and code provisions [15,16]. They have primarily focused on the health monitoring of such structures including the effects of such inadequacies on the structural integrity [17,18,19]. Filiatrault et. al. [20] compared a ductile RC frame with a non-ductile frame using a 1:4 scaled two-story two-bay model and provided some recommendations to improve the seismic protection of ductile and non-ductile RC frames. Caccese and Harris [21] conducted a shaking table test using 1:5 scaled RC models by employing non-linear ultimate strength models. Similarly, Zamic et al. [22] and Kim et al. [23] also conducted static and dynamic tests of RC models with 1:4 and 1:6 scales, respectively, and evaluated various aspects including cyclic degradation of stiffness and energy absorption of the RC frame. Noor et al. [24] explicated the procedures, factors, merits, limitations, and drawbacks of scaled concrete testing which are later used in this article to derive the scaled parameters.
The experimental approaches enlightened in the above-mentioned research works were not qualified for the current requirements on the cost of the setup, which would eventually lead to a series of multiple experiments to investigate other non-engineering defects. To reduce the cost, one of the most lucrative ideas is to have an RC model with a scale higher than 1:10. This requires expertise in the design and construction of frames involving micro-concrete and small-diameter rebars. The possibility of utilizing micro-concrete for small-scale testing is evaluated by several researchers including Dejian et al. [25], Boutemeur et al. [26], and Tobar et al. [27]. This research explains a simple and demonstrable experimental technique using micro-concrete to design and build completely engineered and non-engineered RC frames and test them on a shake table.
Among different non-engineering defects, improper lap splicing has been studied in this research which is one of the most common problems occurring in RC structures, especially in developing countries. Some existing research has focused on the experimental evaluation of this defect concerning columns. For instance, the seismic fragility of RC structures with splice-deficient columns was studied experimentally [28,29]. The results exhibited that the vulnerability of such RC structures is dependent on the failure mode of splice-deficient columns and the limit state under consideration. Similarly, Chronopoulos et al. [30] studied the behavior of inadequate splices in the tension reinforcement of RC elements and recommended their upgradation through welding. Elrakib and Arafa [31] studied these common defects in RC beams under flexural loading. They concluded that the distress produced due to these defects causes an abrupt failure of the structure without the intermediate stage reducing the ductile behavior of the elements. Goksu et al. [32] evaluated the effect of different lap splice lengths in RC columns and suggested the provision of hooks to improve the bond–slip behavior. Cho and Pincheira [33] carried out nonlinear numerical modeling to determine the required splice length in reinforced concrete columns. They presented a model based on the local bond stress–slip relationship which could calculate lateral load resistance and deformation corresponding to splice failure. Chowdhury and Orakcal [34] also performed analytical modeling to investigate the inadequacy of lap splices. This inadequacy of lap splices can lead to an inadequate bond strength causing the reduction of concrete durability and the load-carrying capacity of structural members under various kinds of loadings [35]. Thereby, there should be a sufficient lap splice length with compatible bond strength between concrete and reinforcement rebars to maintain the proper distribution of stresses in the RC structural frames.

2. Code Requirements for Rebar Lap Splices

It is well established that the bond formation between steel reinforcing bars and concrete results from the adhesion, mechanical interlock, and friction produced by the ribs of the reinforcing bar. The mechanical interlock, as compared to adhesion and friction, does not occur with plain reinforcing bars owing to their plain surface [36]. The bond strength of a plain bar is comparatively low and for reaching the yield strength, the lap splices are of paramount importance. Additionally, the reinforcing bars are generally supplied by the manufacturers in shorter lengths and because of it, it is often essential to splice the bars in the field. Several structural design guidelines including ACI 318-19 [37] and ASCE 41-13 [38] stipulate the empirical formulas for the required lap splice length of reinforcing bars.
By definition, the lap splice length is a function of reinforcing steel yield strength ( f y ) and concrete strength ( f c ). There are two types of lap splices: (1) tension splices and (2) compression splices. In columns subjected to the axial force and moment, the tensile stresses may generate on one face of the column for eccentric loading. If such stresses occur, ACI 318-19 [37] code provisions require tension splices to be used. The splice requirements are prepared based on that a compression lap splice has a tensile strength of at least 0.25 f y . Therefore, even if column bars are designed for compression, some tensile strength is inherently provided. The minimum lap splice length in tension ( l s t ) not less than 300 mm is selected based on the class type considering the development length ( l d ) of the bar as shown in Table 1 in which Class A and Class B correspond to l s t = 1.0 l d and l s t = 1.3 l d , respectively. For lap splice lengths in tension for column members, Class A and Class B are decided based on the maximum tensile bar stress due to the factored loads. For instance, for tensile stress 0.5 f y and maximum percent of A s spliced within the required lap length 50%, the splice type is designated as Class A. Otherwise, the lap splice length is taken to be greater than 1.3 l d and 300 mm for Class B.
On the other hand, compression splices do not need provisions as stringent as those specified for tension splices. Reinforcing bars in compression are spliced mainly in columns, where bars are terminated normally just above each floor or every other floor. This is conducted partly for construction convenience, to avoid handling and supporting long column bars; however, it is also conducted to allow the column steel area to be reduced in steps, as the loads reduce at higher floors. The minimum lap splice length in compression ( l s c ) not less than 300 mm is selected based on the yield strength f y of the reinforcement bar and the concrete strength f c as shown in Table 2. The required lap splice length increases when f c is lower and f y is higher. As per ACI 318-19 [37], the required lap splice length is to be increased by a multiplying factor of 1.333 for f c < 21 MPa.

3. Design and Development of Model Structure

3.1. Design of Structure

A simple two-story RC frame was selected and designed based on ACI 318-19 [37] code provisions. A finite-element-based building design software was utilized to find the member forces and section sizes along with the demand for reinforcement bars. The input parameters for the design of the structure were selected from the Building Code of Pakistan because of its frequent issues related to non-engineering defects [4,39].
These seismic provisions stipulated in the Building Code of Pakistan are compatible with the American Concrete Institute ACI 318-08. Figure 1a shows the dimensions and reinforcement bars selected for the actual full-scale frame structure. The connection of the beam-column is designed to be hinged allowing the rotation without any translational displacement, whereas the base of the columns is assumed to be fixed ignoring the soil–structure interaction. The slenderness ratio of the columns ( k L u / r ) is determined to be 0.85 × 3.6/0.139 = 22, where k = 0.85 is the effective length factor for a column with a fixed base and hinged top determined from the Jackson and Moreland Alignment Charts, which provide a graphical determination of k for a column of a constant cross-section in a multi-bay frame; L u = 3.6 m represents the column height of a single story, and r = 0.139 m shows the value of the radius of gyration estimated from the basic formula of r = I g A g 1 / 2 (where I g and A g are the second moment of area (m4) and cross-sectional area (m2) of the column, respectively).
According to ACI 318-19 [37], slenderness (or second-order) effects can be neglected in unbraced columns (against sideway) if k L u / r 22. The section sizes of structural components, i.e., column and beam, and reinforcement detailing are also shown in Figure 1a. As for the columns, the longitudinal bars of D35 (dia: 35 mm) and stirrups of D11@190 mm c/c are embedded in 480 × 480 square-shaped short columns with a reinforcement ratio of 1.67% while preserving a concrete cover of 35 mm, whereas the singly reinforced beams with a 320 × 400 rectangular-shaped cross-section are designed by providing D30 bars on the top and bottom along with ties of D11@250 mm c/c while preserving a concrete cover of 30 mm. These are the design parameters considered for the full-scale frame structure.

3.2. Scaling of the Structure

The similitude laws are essential for testing the scaled model. Both the dimensional analysis and direct use of the governing equations can be employed to derive the scaling laws [40]. It is a fact that a wholly scaled replica of RC structures is almost impossible because the post-yielding behavior of concrete is governed by the following three significant parameters: (1) the descending part of the stress–strain curve of concrete in compression, (2) the cyclic response degradation, and (3) the steel and concrete bond characteristics. Due to these factors, the use of micro-concrete becomes essential which is also advantageous in terms of saving material and equipment, and helps in better handling [41]. However, by taking the stress and stiffness scale factors equal to unity, the similitude requirement for density cannot be satisfied. Thereby, by selecting micro-concrete as the model material, the similitude requirement for density should be equal to unity. As small-scale models of RC structures in seismic analysis cannot be accurate replica models, one of the following strategies is usually adopted to reproduce similar inertial effects [24] as (1) reducing the material strength, (2) the provision of additional masses at appropriate points on the model and loosely attached so that the stiffness and strength of members are not altered, and (3) changing the density of the materials by keeping other properties constant. The laws of similarity by taking the density as the unity are shown in Table 3, which are applied to develop a small-scale replica of the actual RC frame structure. In other words, the dimensions of the cross-sections of structural components and reinforcement bars are reduced to 1/16-scale to obtain the reinforcement of the small-scale model as shown in Figure 1b.
Furthermore, the same ground motion cannot be applied to an actual model and a scaled model to verify the laws of similarity. In this case, to verify the similarity laws for a scaled model structure, additional weights were calculated based on the weights of actual and scaled models as shown in Table 4. The additional mass calculations are based on Equation (1).
D G = 1 S L 2 G P 1 1 S L + Q E
where D G is the additional weight; S L is the scale of the model (=16); G p is the weight of the actual size model (=9830 kg); and Q E is the vertical live load (=0). After putting these values in Equation (1), DG turns to 36 kg. Besides this, the time of the input ground motion was also contracted [24]. The time contraction is estimated to be S T = 1 S L = 1 4 .

3.3. Verification of the Similitude Laws

In order to verify the application of the laws of similarity for a 1/16 scale-down model structure, two analyses, one for the actual size structure and the other for the scaled-down model structure, were carried out and the results were compared to see the effectiveness of AEM in the case of small modeling against earthquake loadings.

3.3.1. Selection of Ground Motion

The selection of ground motions was made on the basis of ASCE 7-16 16.1 and the peak values of the acceleration response spectrum of the ground motions. According to ASCE 16.1.1 [42], the response history analysis shall consist of not less than three appropriate ground motions. Each ground motion shall consist of a horizontal acceleration history obtained from the records of events having a magnitude, fault distance, and source mechanism that are consistent with those factors which control the maximum considered earthquake. The ground motions shall be scaled such that the average value of the 5% damped response spectra for the suite of motions is not less than the designed response spectrum for the site for periods ranging from 0.2 T to 1.5 T where “T” is the natural period of the structure in the fundamental mode for the direction of the response being analyzed.
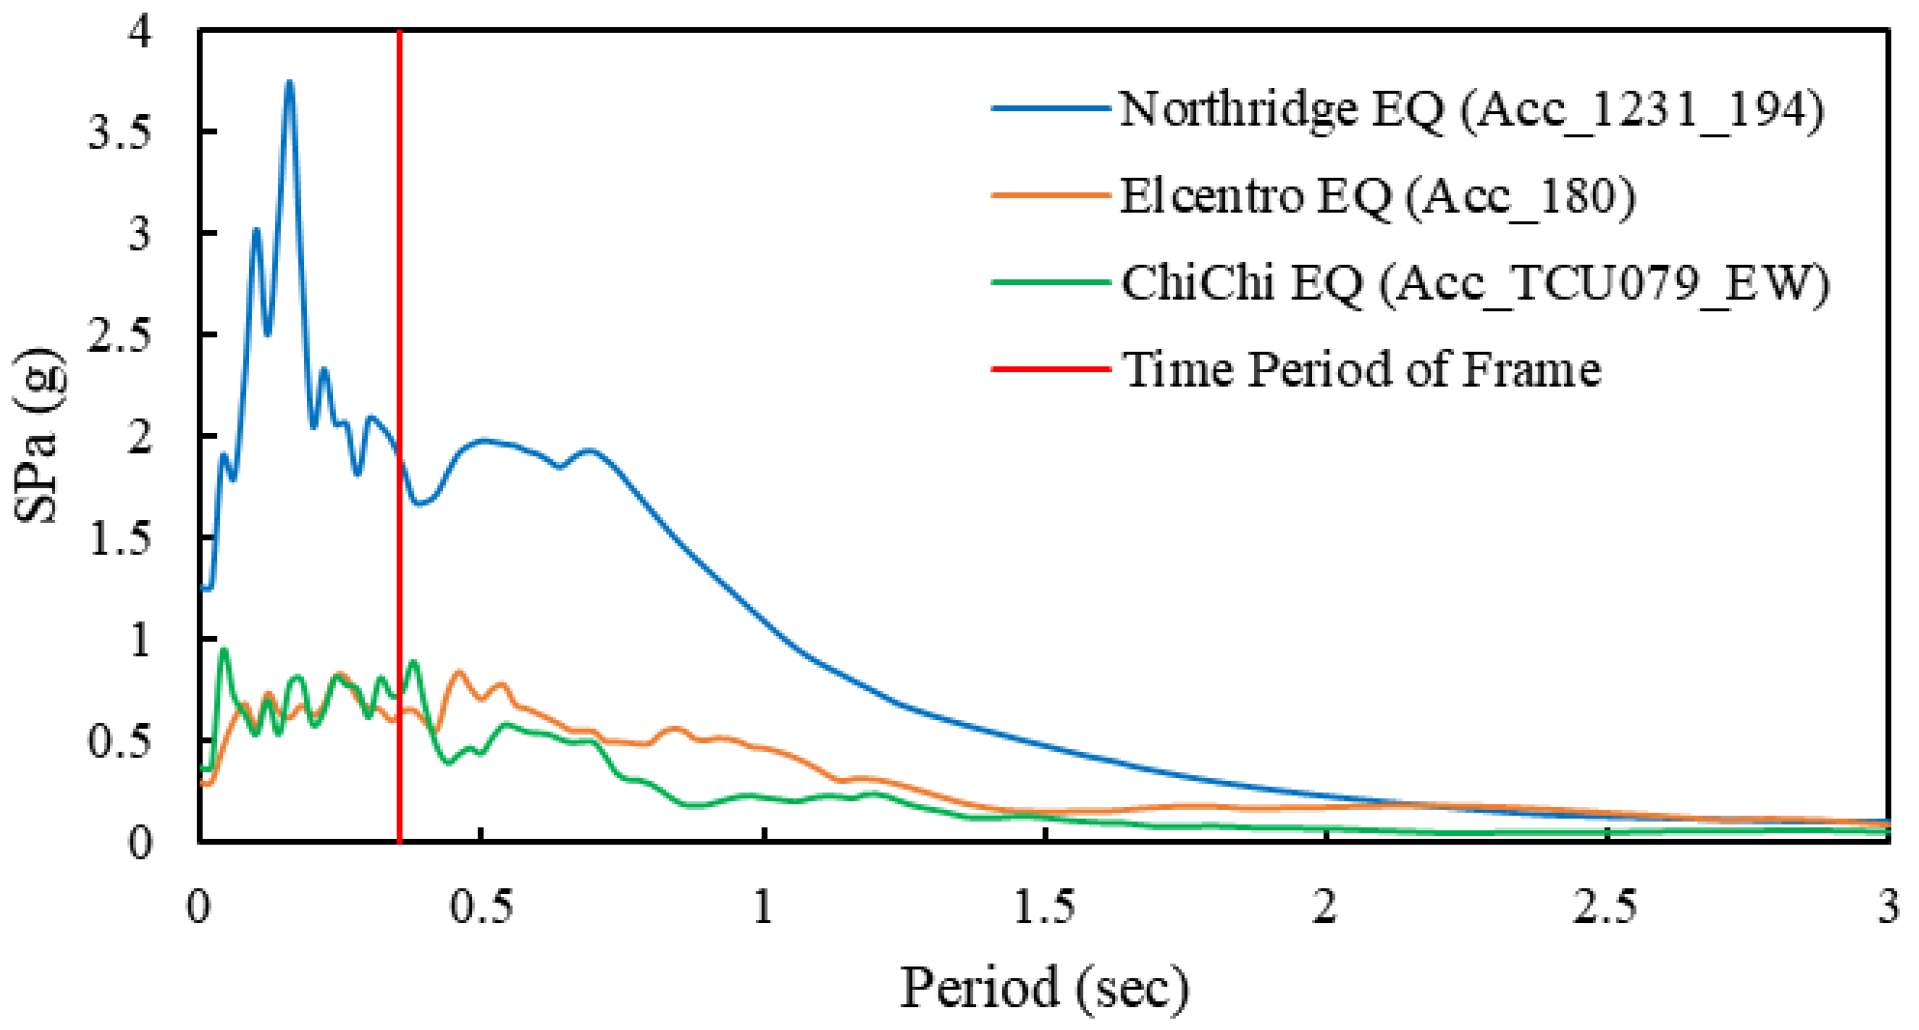
For the verification of the laws of similarity, the ground motions were selected based on the time period of the actual size structure. The natural time period of the actual size frame was calculated as 0.275 s by using the ASCE 7-16 12.8.2 analytical formula [42]. On this basis, three earthquakes including the 1999 Chi-Chi earthquake, Taiwan, 1940 El Centro earthquake, California, and 1994 Northridge earthquake, California were selected for the numerical simulation of the actual and scaled structure. The reason for their selection is that the peaks of the response spectrum of these earthquakes are within the range of the time period of the actual size structure as shown in Figure 2.

3.3.2. Applied Element Method (AEM) Results

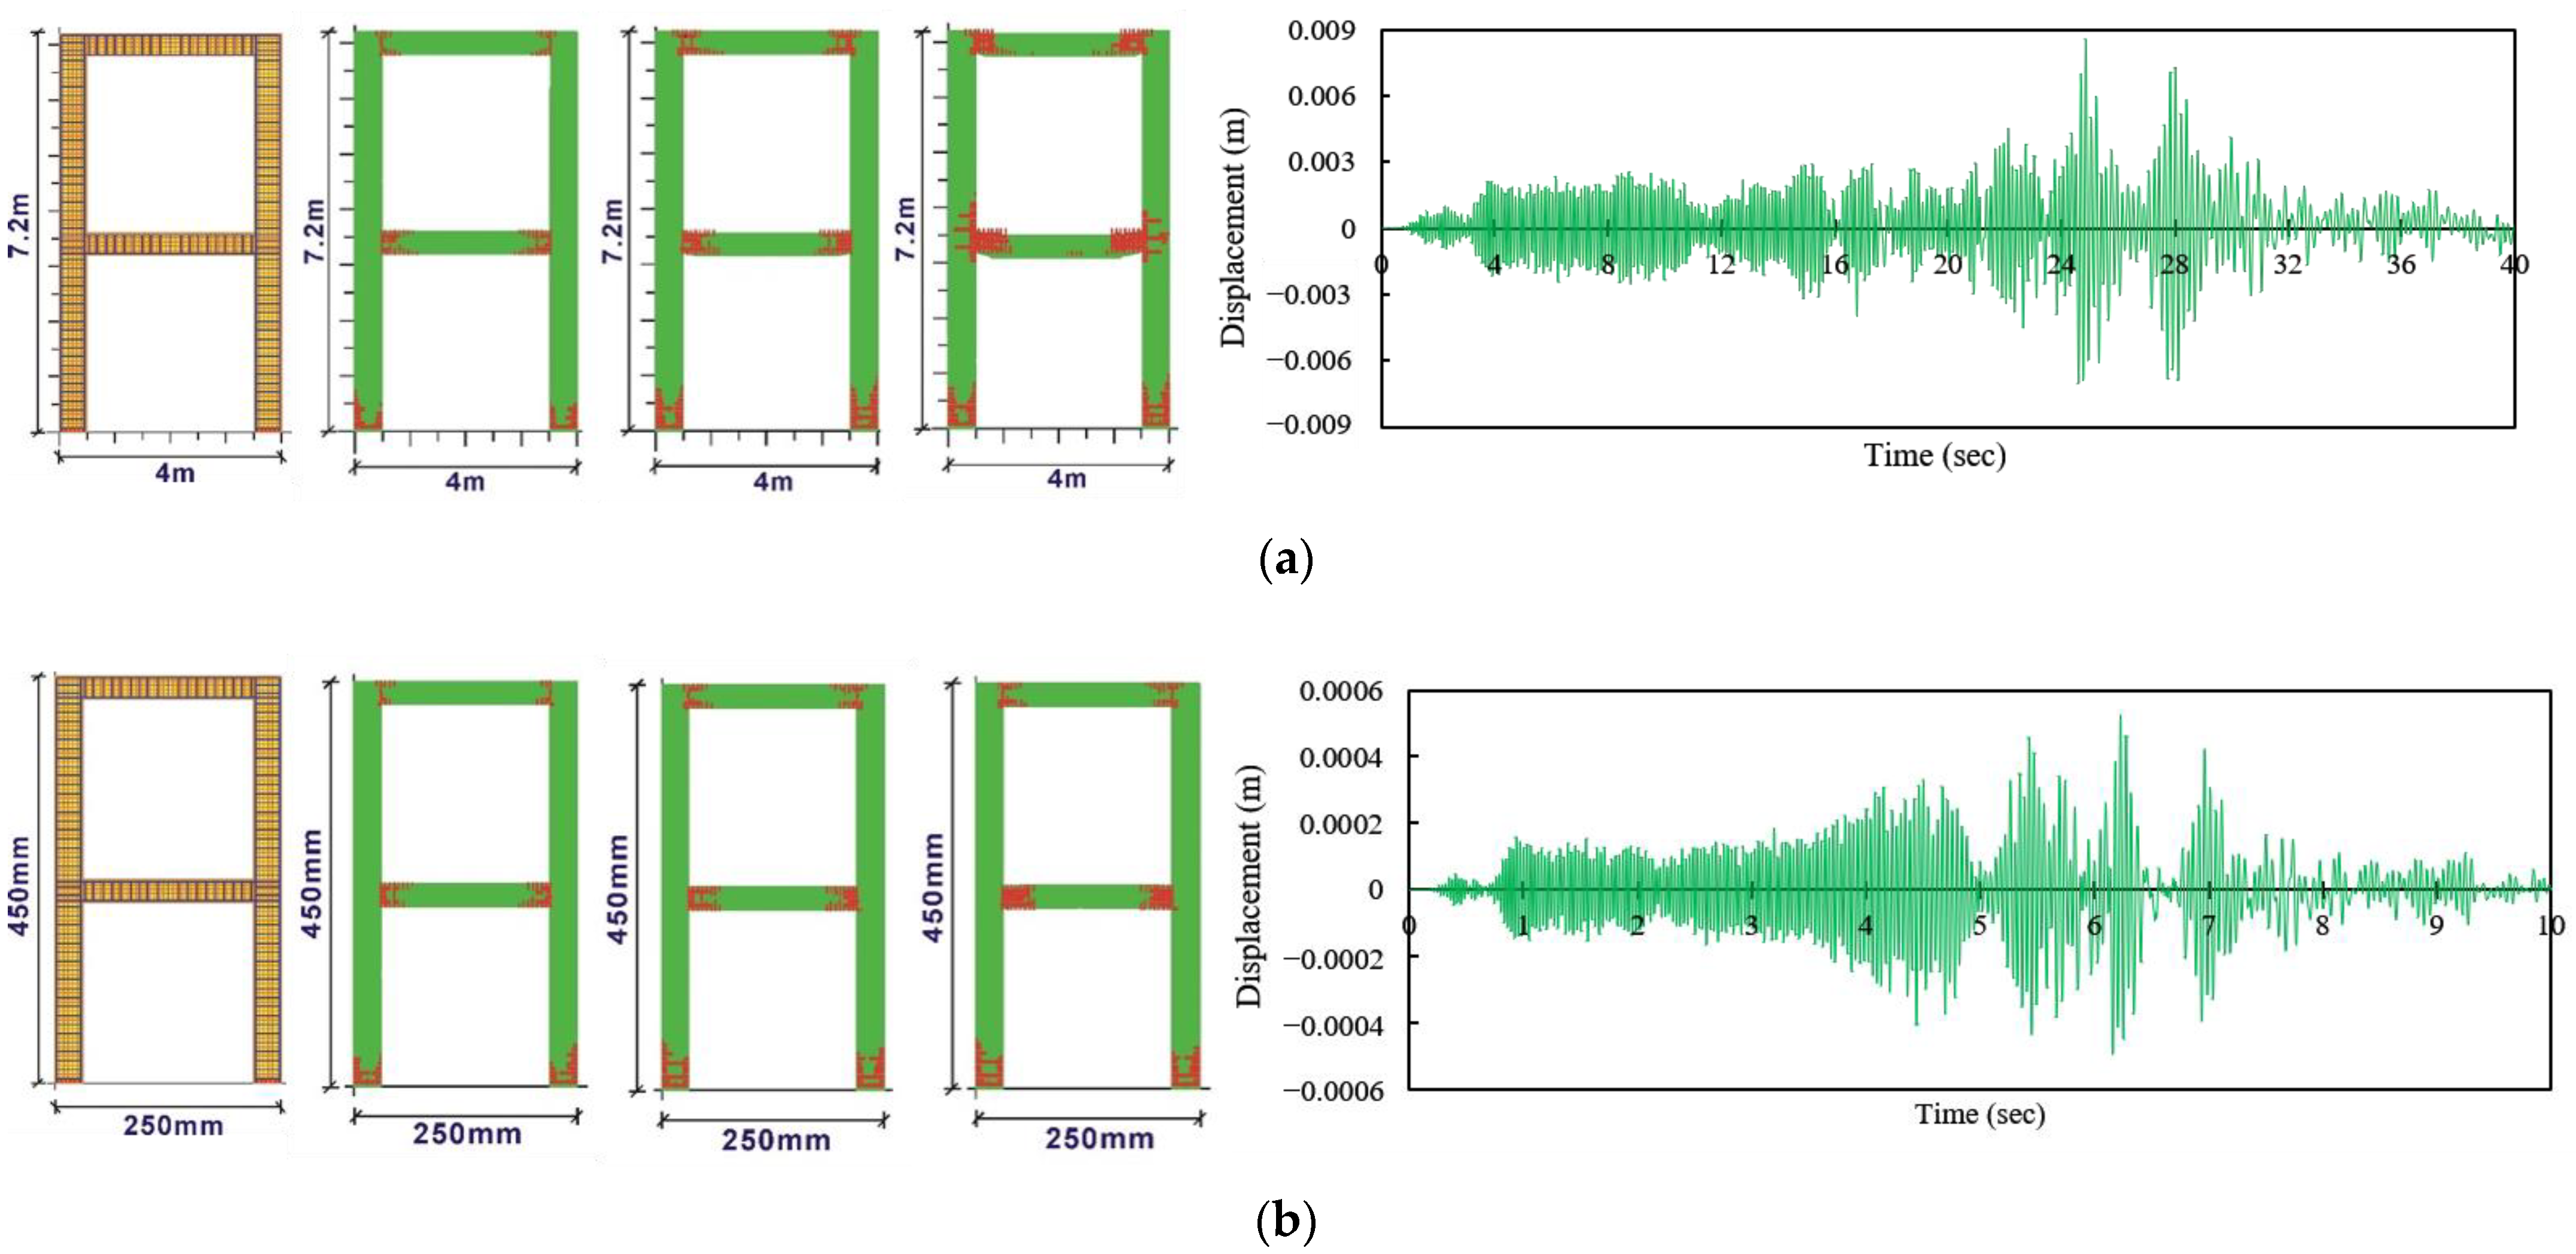
The actual size structure and the 1/16 scaled structure were analyzed against the above-mentioned ground motions by using the Applied Element Method (AEM) with similar geometric properties. The properties of the scaled model were reduced according to the 1/16 scale including the size of the elements in the analysis. The additional weight of 36 kg was also applied to the scaled model as per the laws of similarity. Furthermore, the ground motion duration was also contracted with the factor of 1 16 as per Table 3. The deformed shape and cracks in the springs for the actual structure and scaled model were compared at three different stages of loading as shown in Figure 3. The analysis results show that both the actual frame and scaled frame exhibited similar crack propagation at different stages of loading. The maximum displacement was obtained for both cases and the time history of both frames is also shown in Figure 3.
For actual structure:
Maximum displacement = 8.55 mm
Max. Displacement/height of structure = 0.00119
For scaled model:
Maximum displacement = 0.453 mm
Max. Displacement/height of structure = 0.00101
Difference in results =
2.52%
The drift ratio values of both the actual size frame and the scaled frame are significantly close to each other, which verifies the applicability of the similitude laws and demonstrate that the numerical simulation of the scaled model can lead to fruitful results.

3.4. Preparation of Model Structures

The geometric properties of the model are shown in Table 5. Based on these properties, it was decided to fabricate the formwork by aluminum angles with simple nuts and bolts as aluminum angles are lightweight and can give an excellent finish to the surface, which is very important for small-scale models. Due to the small diameter of the reinforcement bars, it was a challenging task to prepare the same size stirrups with a margin of 2 mm clear cover for micro-concrete. Figure 4a,b show the stirrups preparation and spacing between the stirrups. To tie the stirrups with beam and column reinforcement bars, a steel wire of 0.2 mm diameter was used to obtain the same effect as field conditions. To maintain a proper clear cover, small pieces of a 1.9 mm bar were attached to the main reinforcement bars so that the wires did not bend in the formwork. Figure 4c shows the prepared reinforcement cages for the beams and columns.

3.5. Location of Improper Lap Splices

The main focus of this research is to study the effect of improper lap splicing on reinforced concrete frames. It was intended to select that location for improper rebar splicing, where it produces the largest displacement in the structure so that the effect can be easily studied during the experimental program. Different locations of improper lap splices were considered, such as (1) at the center of top bars, (2) at the center of bottom bars, (3) at 1/6th of the beam length (L) from the face of the column for the top bar, and (4) at 1/6th of the beam length (L) from the face of the column for the bottom bar. The maximum displacement and ratio of displacement to the height of the structure were evaluated for each scenario using the Applied Element Method (AEM). Figure 5 shows the plots of maximum displacement achieved in each case which shows that maximum displacement was found to be caused for the case when the improper splice was provided at 1/6th of the beam length (L) from the face of column for the top bar. Thereby, an improper lap splice effect was selected and introduced at 31 mm (1/6 × beam length) from the beam–column interface, as shown in Figure 6. According to the ACI 318, the minimum splice should be 48 d b where d b is the diameter of the bar; thereby, in a given case, it should be 90 mm, whereas the provided splice is 9 mm.

4. Materials for Small-Scale Modelling

Micro-concrete is usually used in small-scale RC models, which is a mixture of suitably graded sand, Portland cement, and water [43]. The selection of model materials in this study was made on a practical basis rather than on a theoretical basis considering the inherent complexity of many factors that influence the properties of hardened (cured) concrete. Theoretically, the scaling of concrete properties not only needs the suitable scaling of aggregate size but also the scaling of pore size in the gel and of void size in the hardened mixture. Although the aggregate in the micro-concrete fulfills some of these requirements partially, the cement particle size cannot be scaled. In other words, a precise simulation of small-scale model concrete is not ideally possible [23]. There is no criterion to obtain the values of a mix design against a particular compressive strength for the micro-concrete. The determination of a suitable micro-concrete mix has been the subject of many studies in the past [24] as it is dependent on many factors including the type of locally available sand, varying aggregate-to-cement and water-to-cement ratios, workability required, and most importantly the similitude requirements and scale of the model concrete. The adopted procedure for the 1/16 scale frame with a target strength of 21 MPa is shown in the subsequent subsections.

4.1. Sieve Analysis

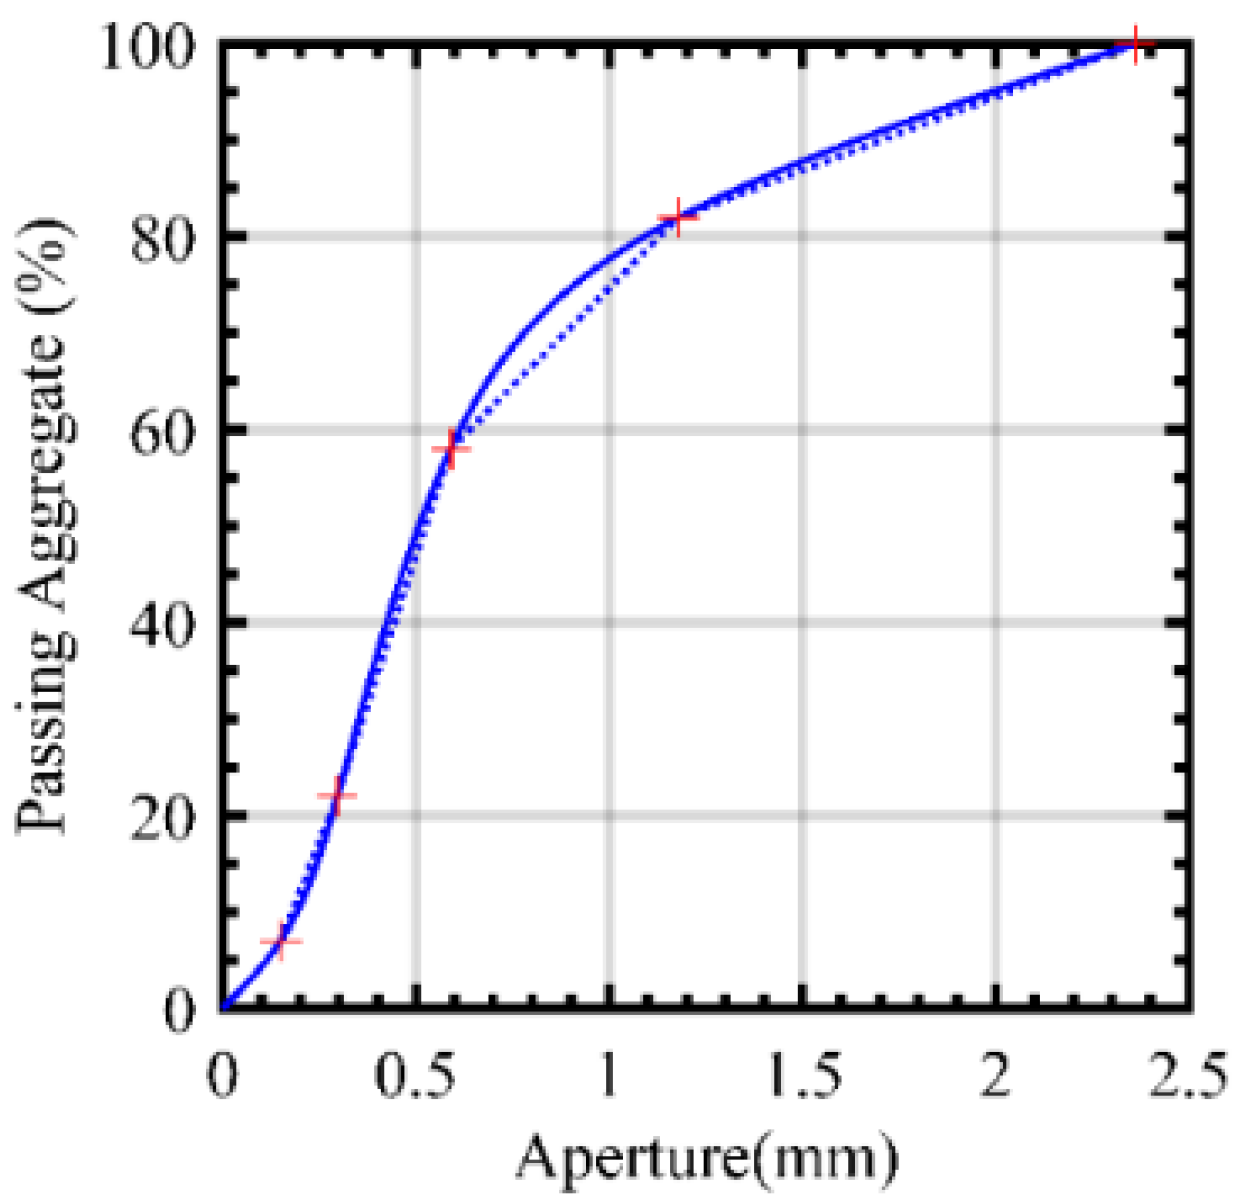
The values of the aggregate gradation curve were selected based on the maximum aggregate size given in the Naval Facilities Engineering Command [43]. The aggregate gradation curve used for the model concrete is shown in Figure 7. This gradation curve was achieved by performing the sieve analysis of locally available sand (#2 to #8 sandbags, available in Tokyo, Japan) and then by mixing the required proportions of each size. The curve in Figure 7 shows a monotonic increase of passing aggregate with respect to the aperture size.

4.2. Selection of Aggregate-to-Cement and Water-to-Cement Ratios

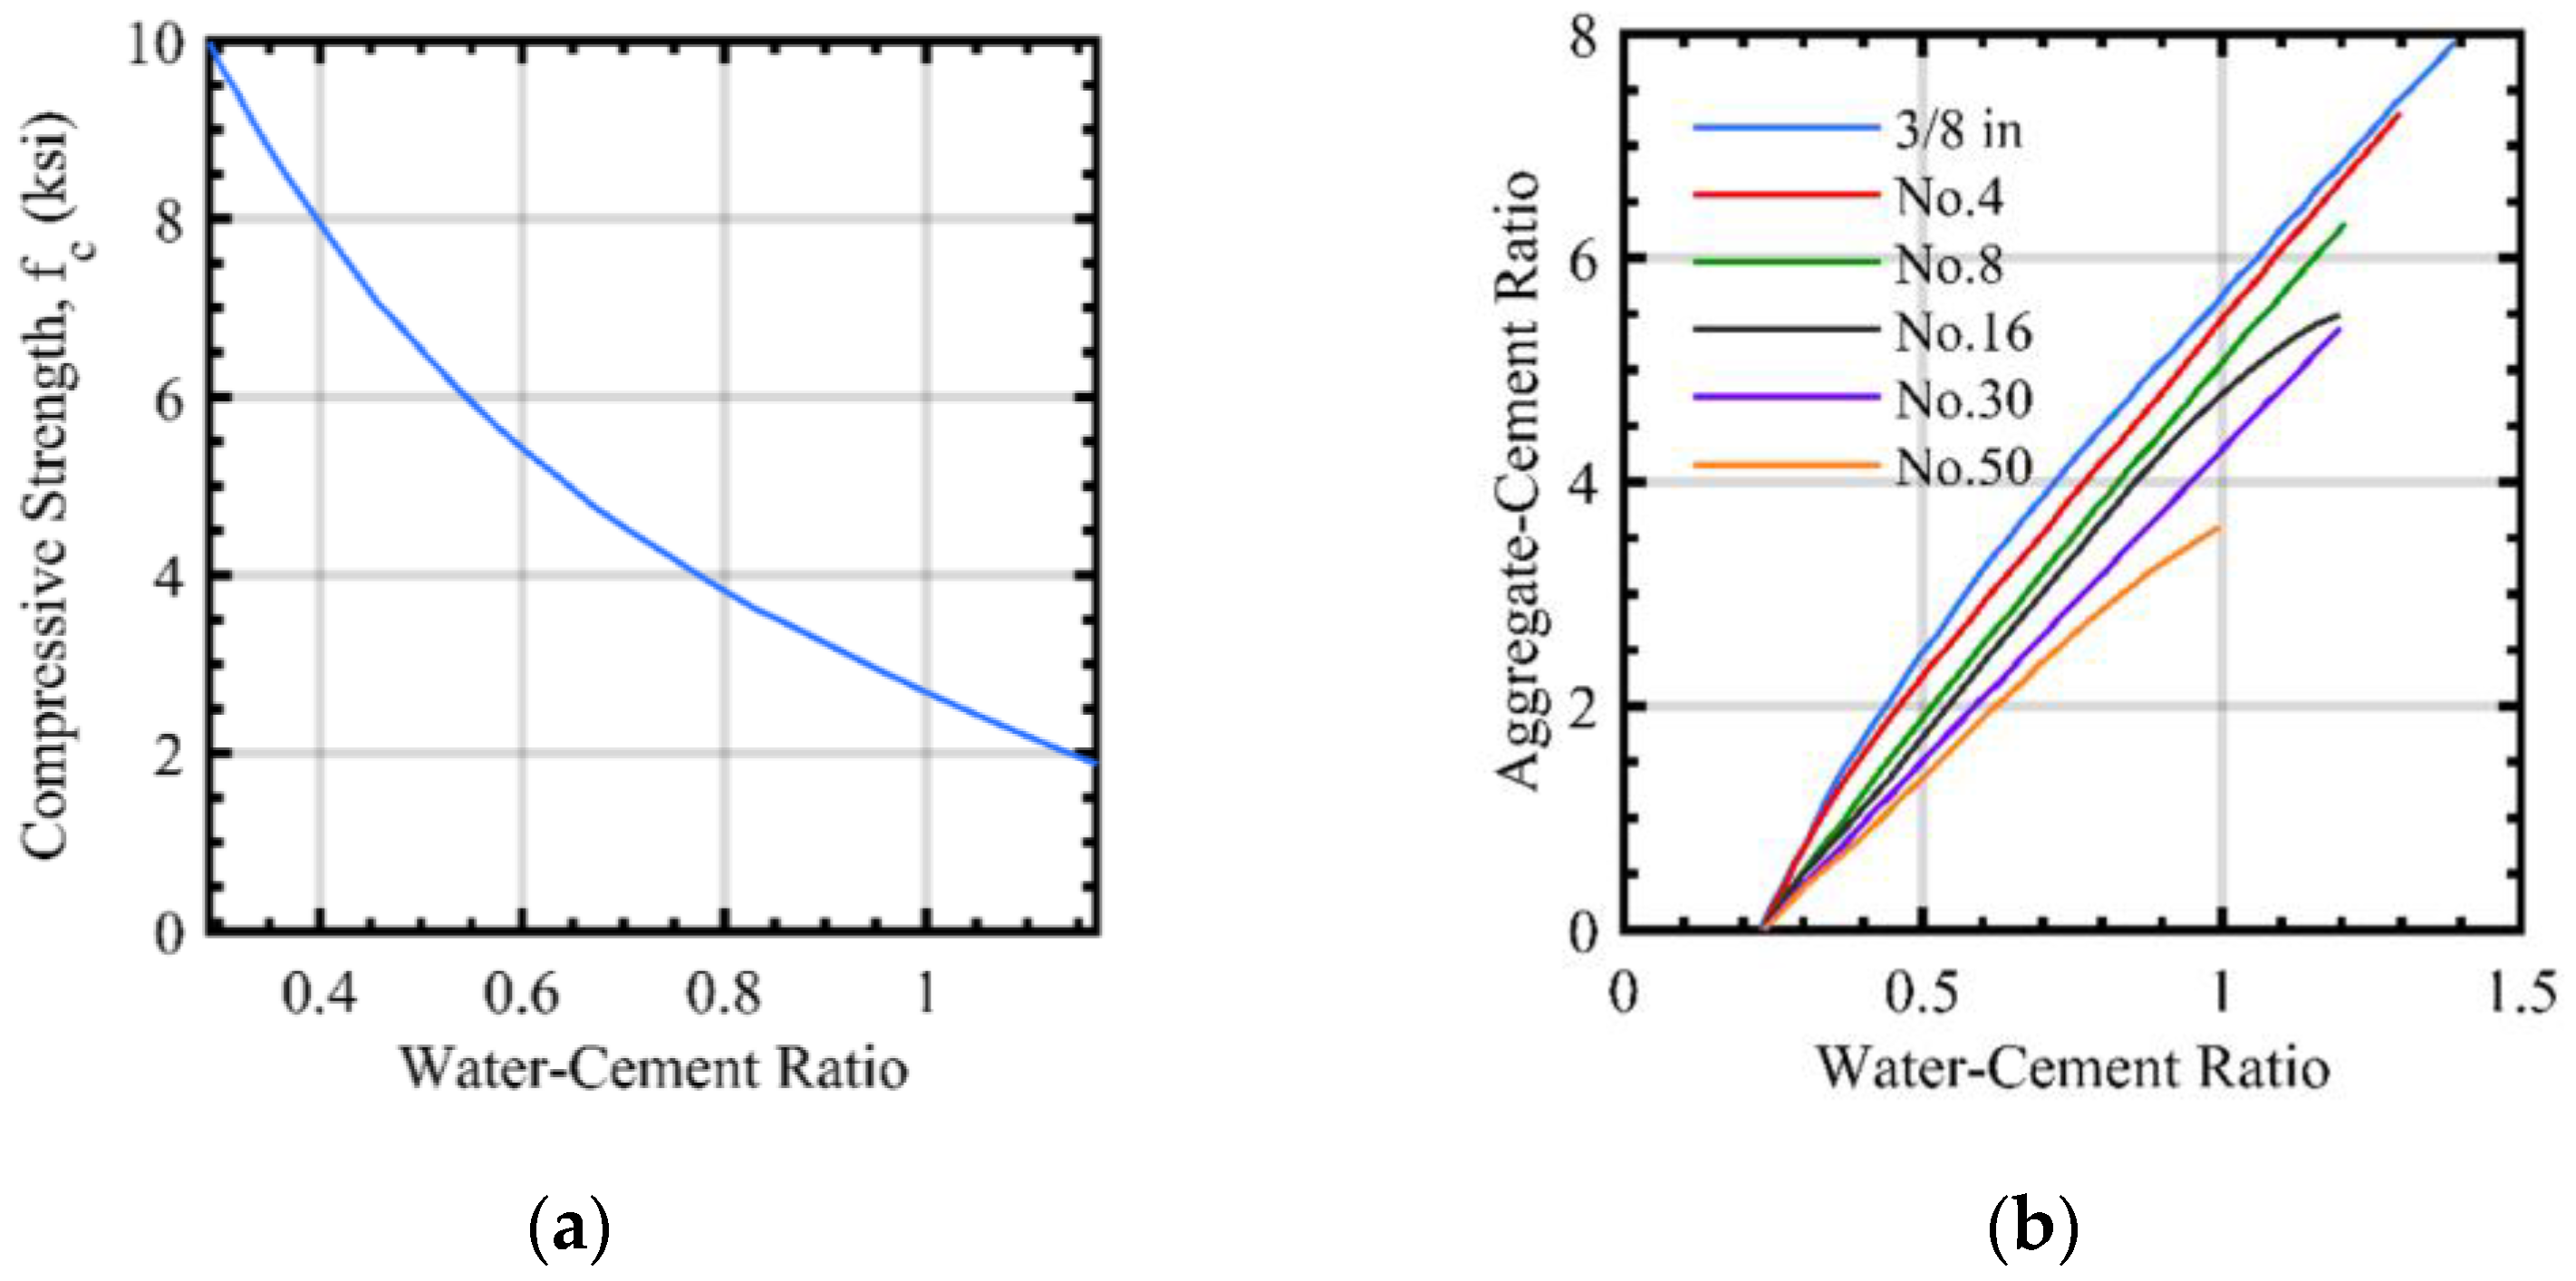
Following the steps given in the Naval Facilities Engineering Command [43], a value of water-to-cement ratio against the required compressive strength was obtained from the graph shown in Figure 8a. By using this water-to-cement ratio, the aggregate-to-cement ratio was calculated by using the graph shown in Figure 8b. As these values do not confirm whether the required strength will be achieved or not, for this purpose, four different mixes were selected as shown in Table 6, and a compression test was carried out to find the strength achieved for selected mixes. This step-by-step procedure gives an idea about the selections of the aggregate-to-cement ratio and water-to-cement ratio against the targeted strength of micro-concrete with excellent workability. On this basis, four different mixes were selected for the model as shown in Table 6.

4.3. Casting and Capping of Cylinders

A total of 56 cylinders were cast and tested at 7, 14, and 28 days to see the difference in compressive strengths of different mixes. The cylinder size was selected to be 50 × 100 mm so that the size effect does not occur in model concrete and prototype concrete in the controlled compaction and curing conditions of model concrete. Additionally, the variation in mean strength becomes more pronounced for the specimen size below 50 × 100 mm [44]. The casting procedure was adopted according to ASTM C-192 [45]. The mixing of micro-concrete was performed manually by first combining the weighted aggregate and cement and then gradually mixing with water. The micro-concrete was poured in three layers; each layer was tamped by 25 strokes with a steel rod of 10 mm diameter. After smoothing the upper surface of the concrete molds, they were covered to prevent moisture loss and left undisturbed for 24 h. The specimens were put into the curing tank after stripping off the molds. The specimen was capped one day before the test. The whole process of casting, curing, and capping of micro-concrete cylinders is shown in Figure 9.

4.4. Compressive Strength of Micro-Concrete

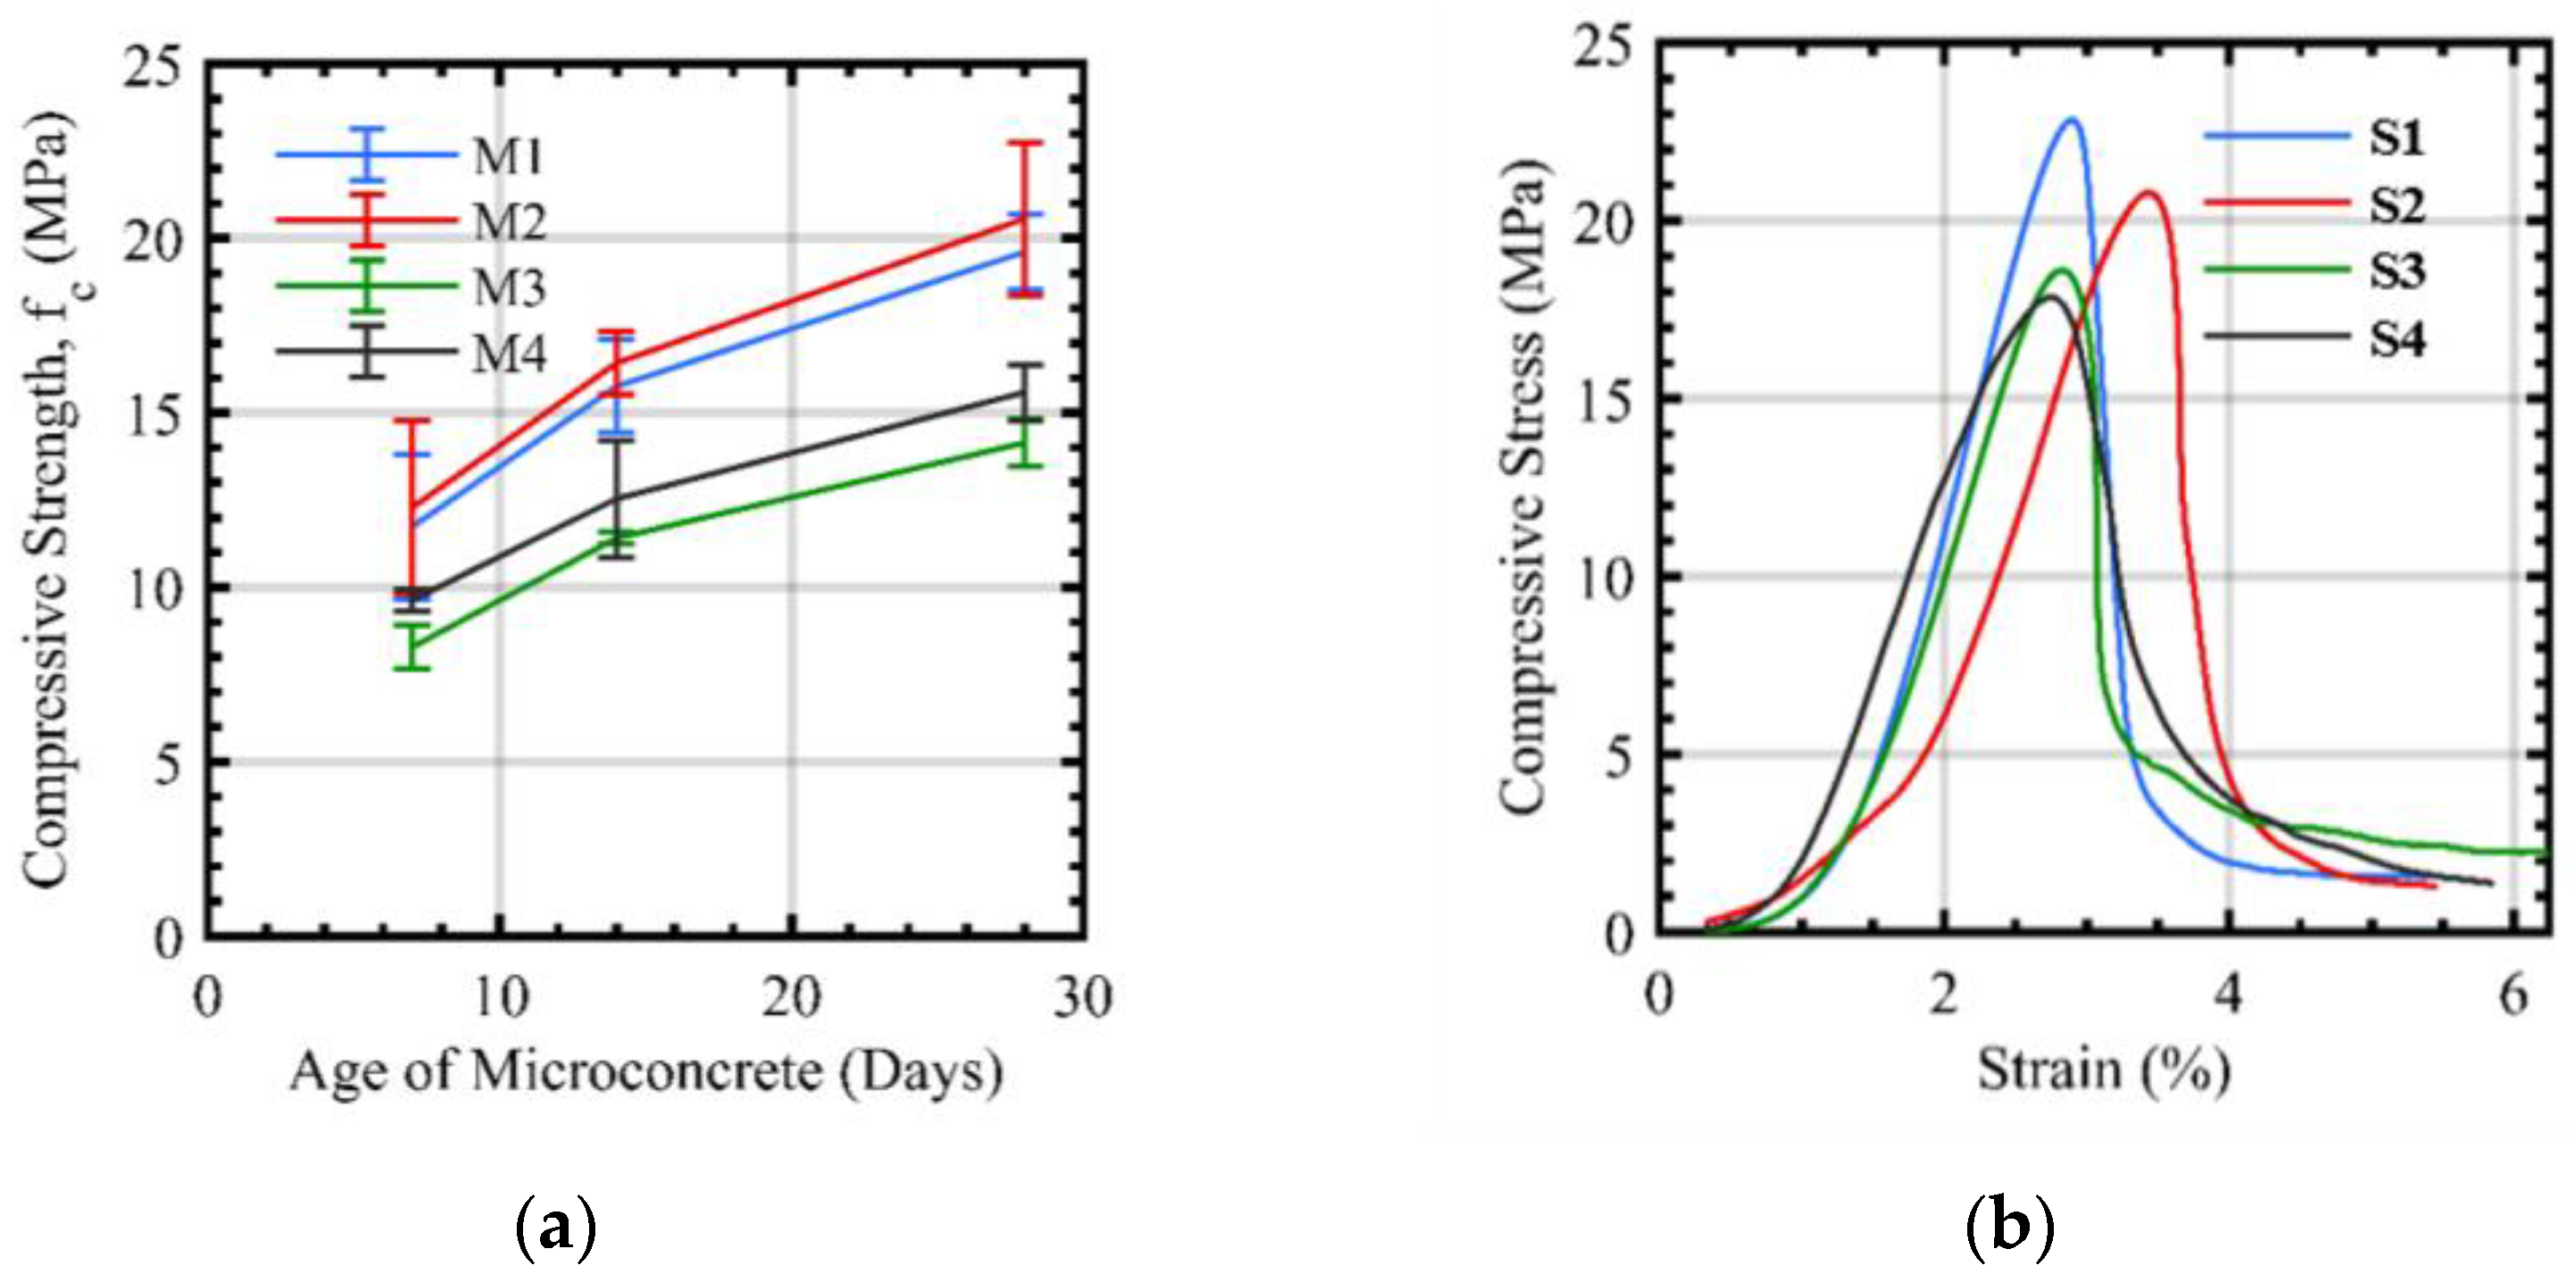
The compression test was conducted under the specifications mentioned in ASTM C-39 [46]. The testing was performed on the AG-100 kN Autograph Shimadzu testing machine. The applied strain rate was 0.3 mm/min. The compression tests of mix numbers M1 to M4 were conducted at the age of 7, 14, and 28 days. The results of the compression test are shown in Table 7. The relationships between the compressive strength and age of micro-concrete are shown in Figure 10a. The results show that mix M1 and M2 had similar strengths which are very close to the target strength, but due to the higher workability, M1 was selected for the model frame. The stress–strain relationship of the cylinders from M2 has been shown in Figure 10b which shows that the selected mix of micro-concrete has a 3% strain.

4.5. Size Effect in Compression

To know the influence of age, cement-to-aggregate ratio, relative consistency, specimen shapes, and aggregate fineness on the size effects in concrete, Yi et al. [47] and Sabnis et al. [48] conducted a comprehensive experimental study for cylindrical, cubical, and prismatic shapes of concrete specimens with a wide range of sizes and different height-to-diameter ratios and concluded that, with the increase in cylinder diameter, the strength ratio decreases accordingly. Elfahal et al. [49,50] investigated the size effect in normal-strength concrete cylinders with sizes ranging from 75 × 150 mm to 600 × 1200 mm and validated the existence of the size effect in concrete cylinders. The smaller samples had a higher compressive strength and reached almost full strength in a shorter time than the larger ones.
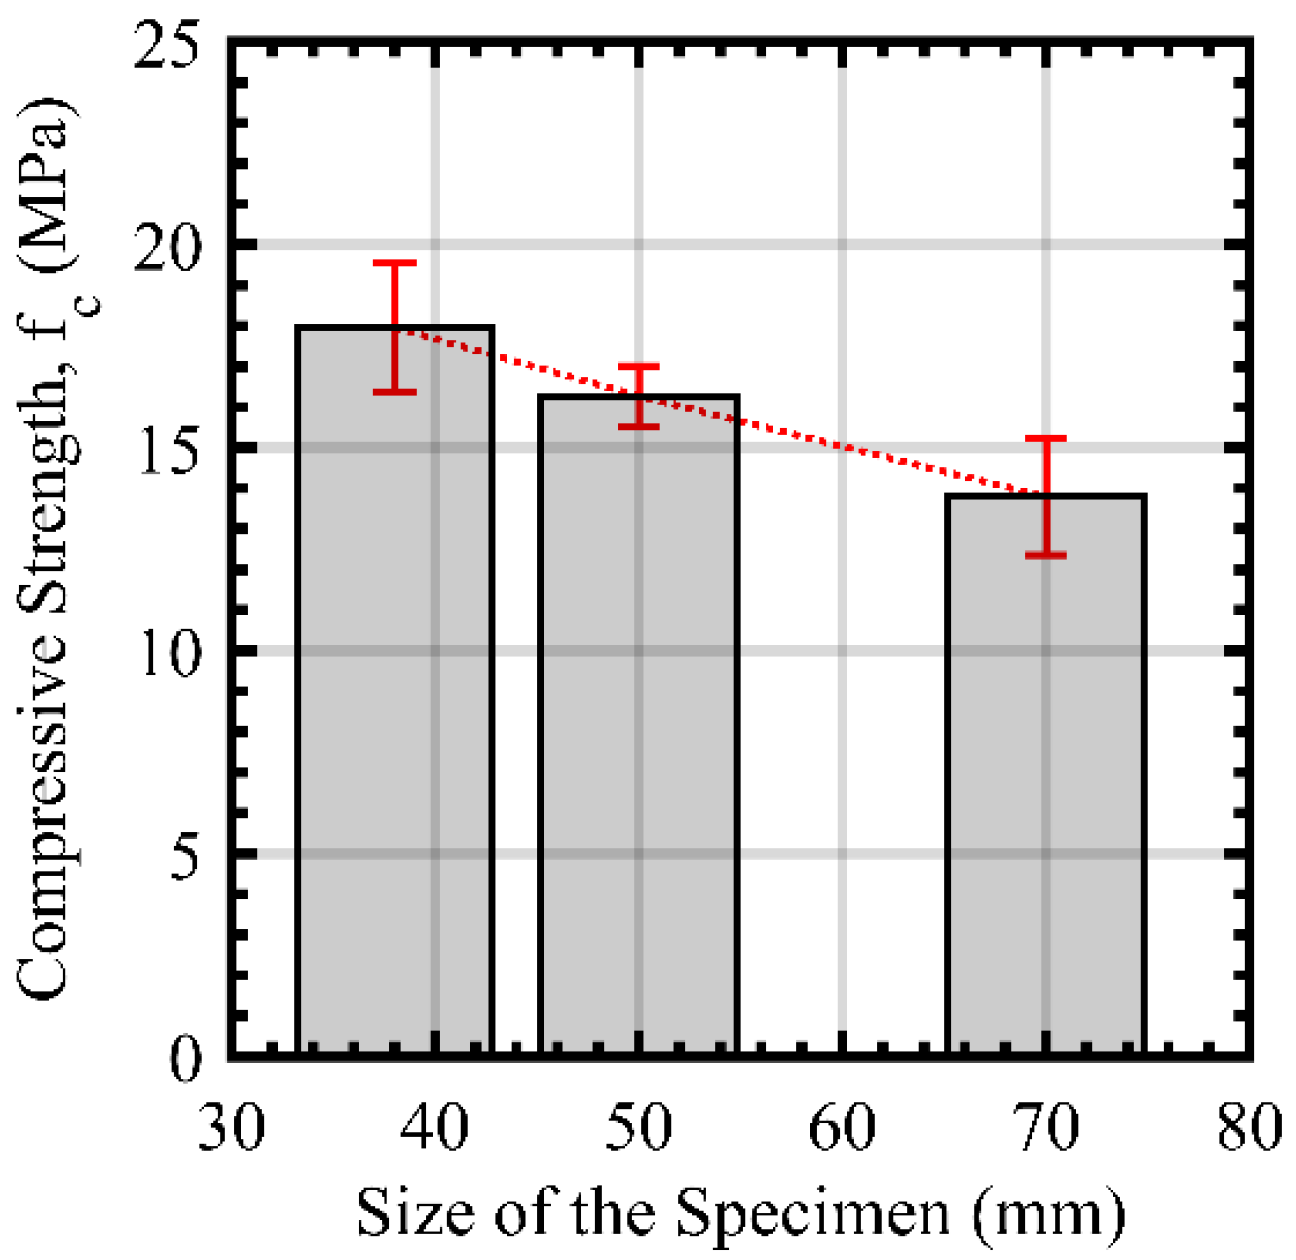
In this study, cylinders of 38 mm, 50 mm, and 70 mm diameters were cast and tested at the age of 14 days to see the size effect. The average compressive strength of three samples each are shown in Table 8. The trend of the decrease in strength by increasing the specimen size is shown in Figure 11. The decrease in strength for larger specimen sizes is significant. Almost 10% of strength reduces in 50 mm diameter cylinders when compared with 38 mm diameter cylinders. Similarly, a 23% decrease in strength was observed for 70 mm diameter specimens when compared with 38 mm diameter cylinders. This trend is almost similar to the trend of normal concrete.

4.6. Tensile Strength of Scaled Rebars

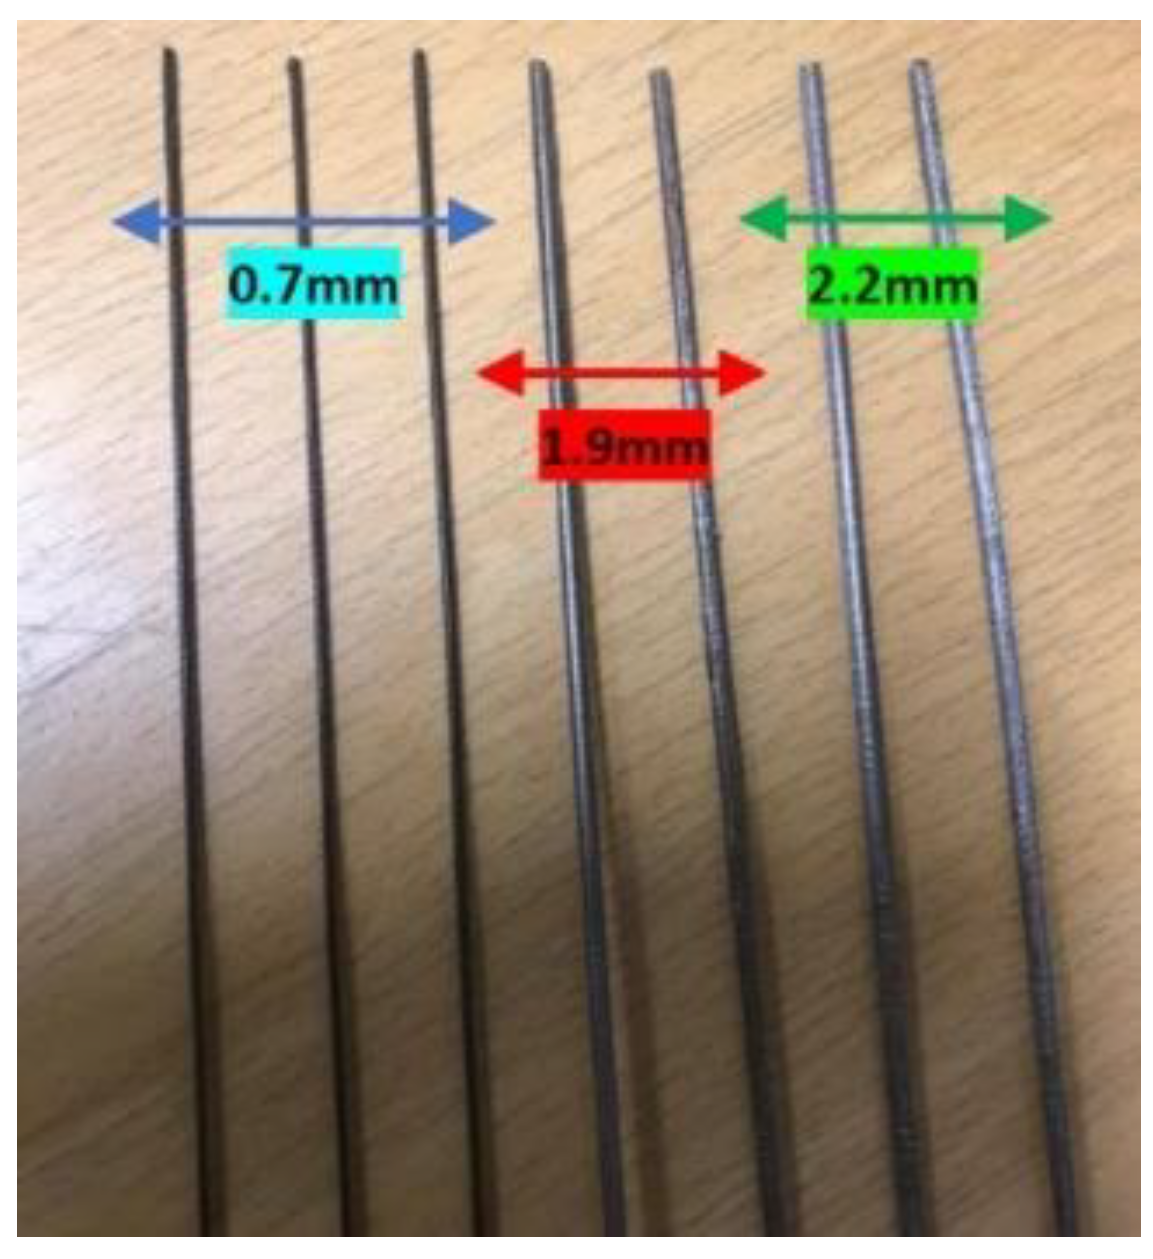
As the scale of the model structure was selected to be 1/16, the diameter of the reinforcing bars was very small. In this study, three different diameter bars were used for the reinforcement of the model structure. The sizes include 0.7 mm diameter bars for stirrups, 1.9 mm diameter bars for the main reinforcement of beams, and 2.2 mm diameter bars for the column reinforcement. These deformed bars, as shown in Figure 12, were manufactured by Kingo Seisakusho Co. Ltd., Tokyo. The tensile test on these bars was conducted by using the AG-50 kN Autograph Shimadzu testing machine with a loading rate of 1 mm/min. The average tensile strength of these bars is shown in Table 9. The design yield strength for the model structure was 345 MPa. The stress–strain relationships and tested samples are shown in Figure 13 which shows a satisfactory value of the yield strength of the scaled rebars.

5. Experimental Study

5.1. Instrumentation, Test Setup, and Testing Procedure

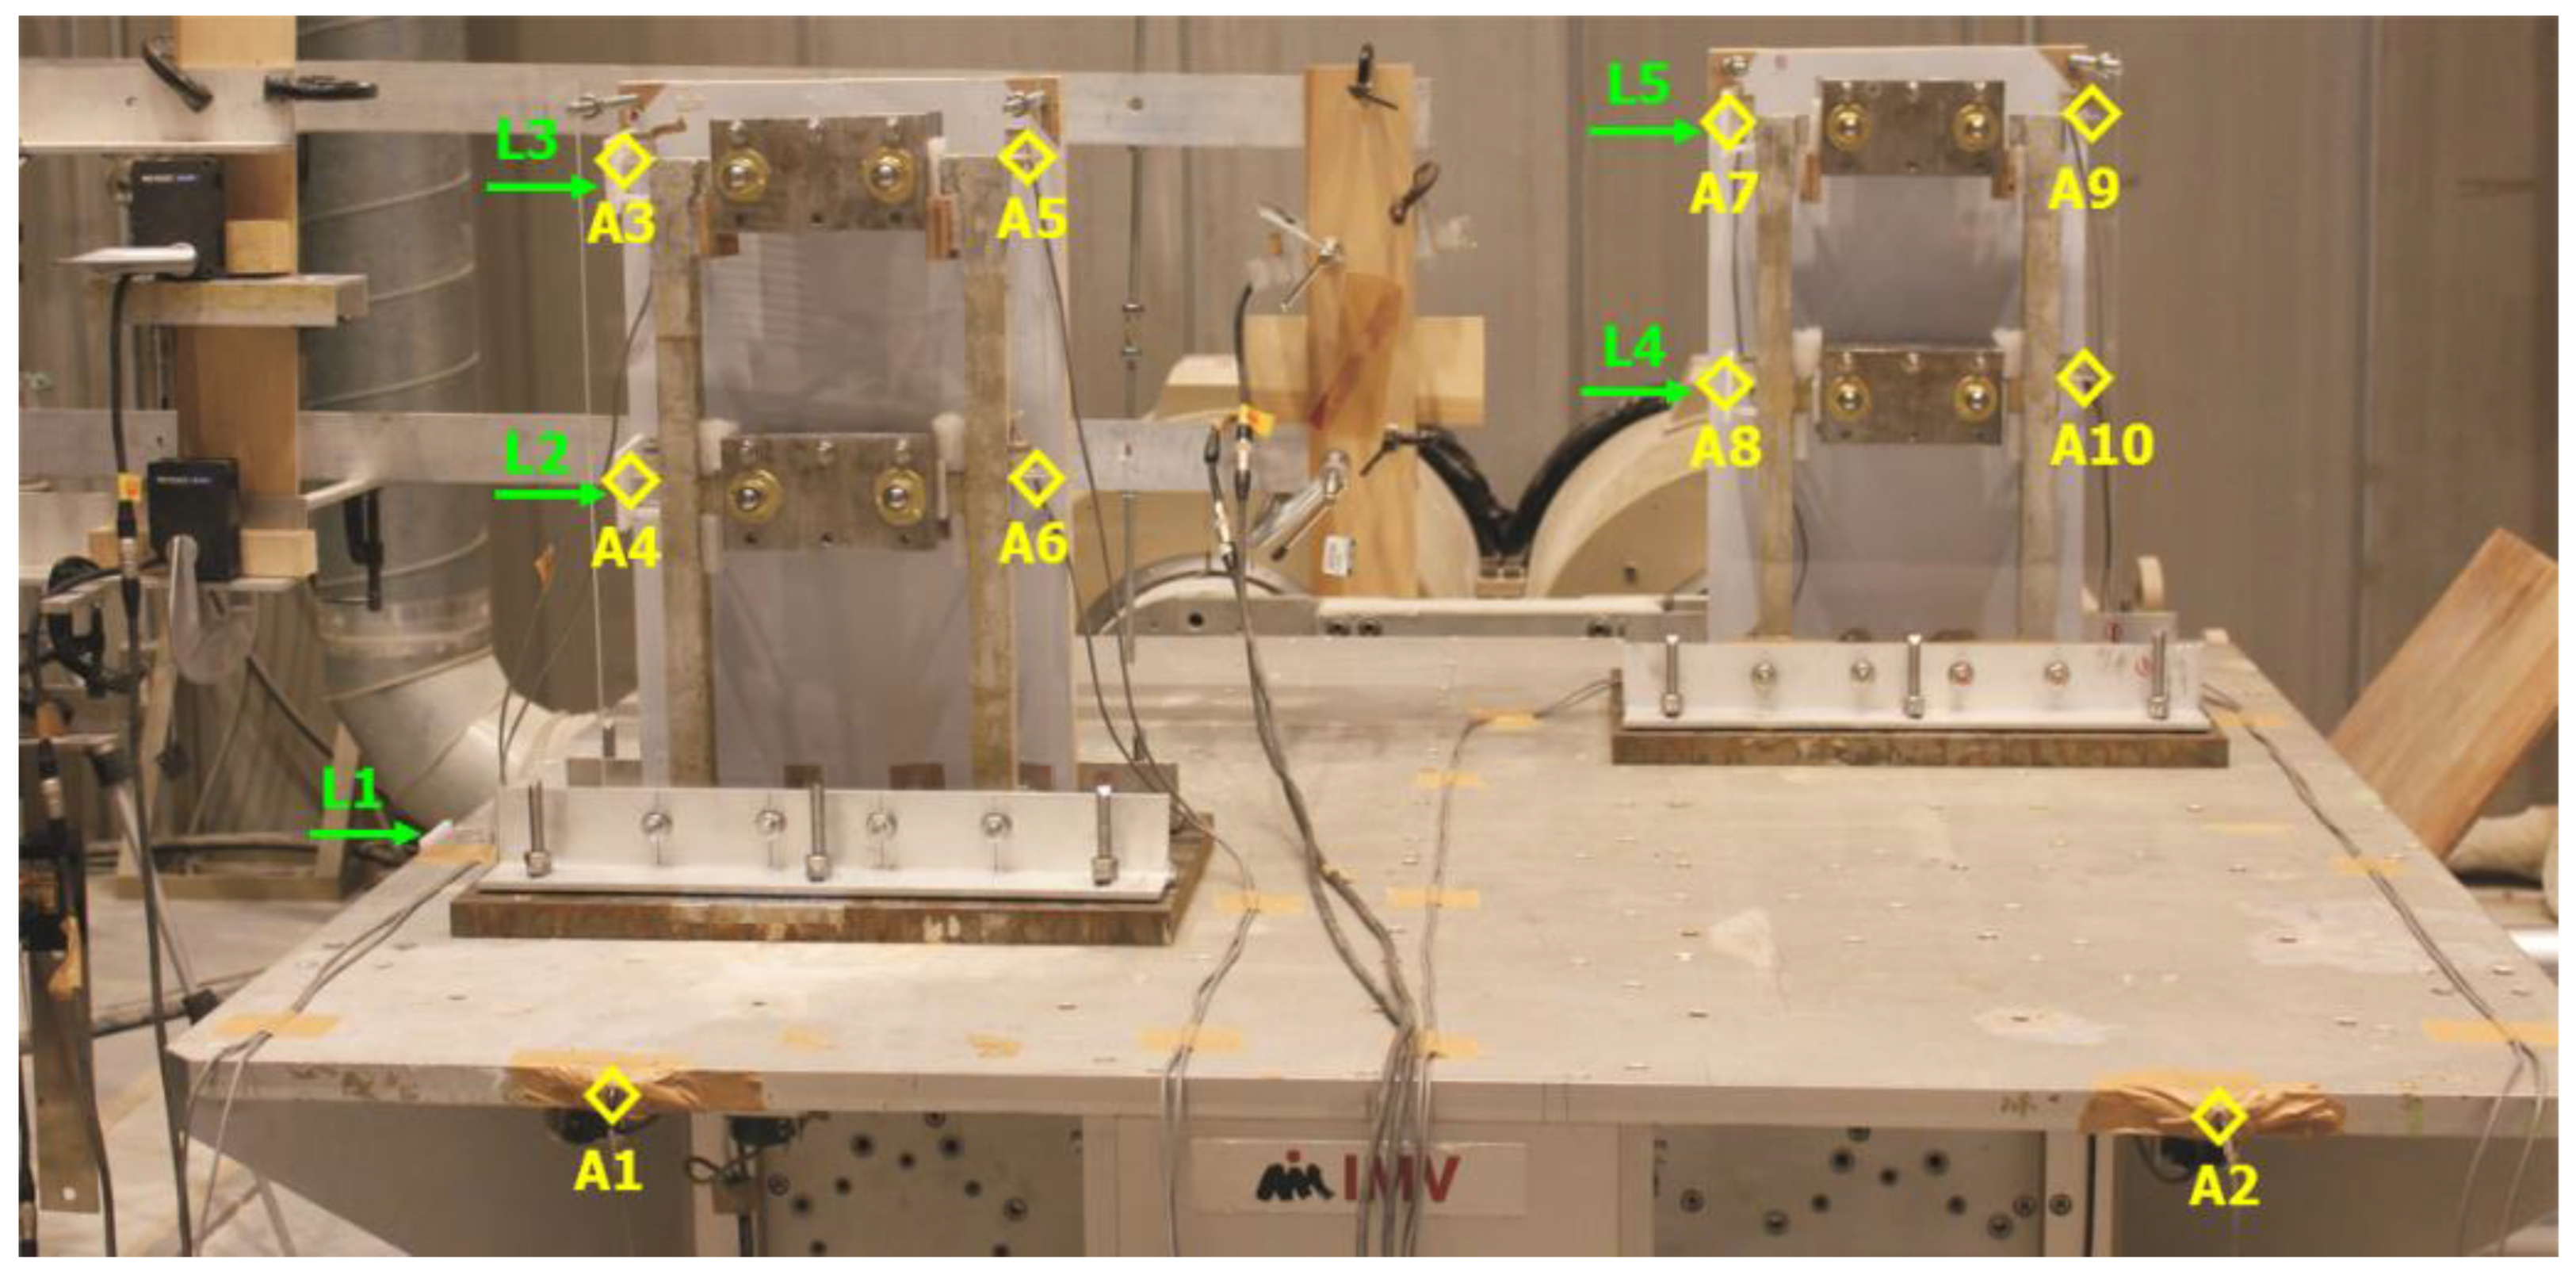
The model frames were instrumented with accelerometers and laser displacement sensors to assess their dynamic behavior. A total of 10 AS-2GB cable-integrated accelerometers with a ±19.61 m/s2 (±2 G) rated capacity were installed on both models. In addition to the accelerometers, five LB-300 ultra-long-range type laser displacement sensors were also installed on both models. The experimental setup for the shake table test is shown in Figure 14 which shows the location of all sensors. The model frames were built in 2D which implies that they cannot resist out-of-plane shaking, so to avoid out-of-plane failure of the model frames, frictionless rollers were mounted against the out-of-plane support to avoid out-of-plane failure.

5.2. Shake Table Properties

For the shake table experiment, two model frames named a proper frame and an improper frame were cast and tested at the same time to compare the results. The shake table system at the Institute of Industrial Science, The University of Tokyo, can control six degrees of freedom. Its properties are shown in Table 10. In this experiment, the shaking was only limited to one direction.

5.3. Sinosoidal Motion Selection

Sinusoidal motions of frequencies ranging from 1.5 Hz to 60 Hz with a maximum of 2.0 g amplitude were applied to obtain the dynamic response of the structure. The rate of sampling frequency was kept at 200 Hz. After each sinusoidal wave, white noise of a 3 min duration was applied to obtain the frequency of the model frames to study the change in frequency with structural damage. The loading sequence of the input motion is shown in Figure 15. In the loading sequence 45–49, a 10 Hz frequency for 40 s was applied, and in the loading sequence 55–57, a 10 Hz frequency for 2 min was applied. This loading sequence was obtained by keeping in view the following:
By obtaining the maximum displacements, for all frequencies, in the proper frame through time history analysis in Staad.pro, which is a structural analysis and design software. The obtained values of displacements against all frequencies are shown in Table 11.
By judging and following the structure behavior against given inputs on the day of the test.

5.4. Calibration of Shake Table and Preparation of Data Files

To prepare and calibrate the input data files for the shake table, two wooden dummy frames were fabricated and mounted on the shake table as shown in Figure 16. The additional weight of 63 kg was placed at the shake table to comply with the weights of actual model frames. The other properties were also kept constant as the actual model frames. While keeping in view the limitations of the shake table, sinusoidal waves of frequency ranging from 60 Hz to 1.5 Hz were prepared. These sinusoidal waves were prepared for the maximum achievable amplitude, velocity, and displacement from the shake table. The values of these properties are shown in Table 12.

6. Results and Discussions

6.1. Crack Pattern and Energy Dissipation Mechanism

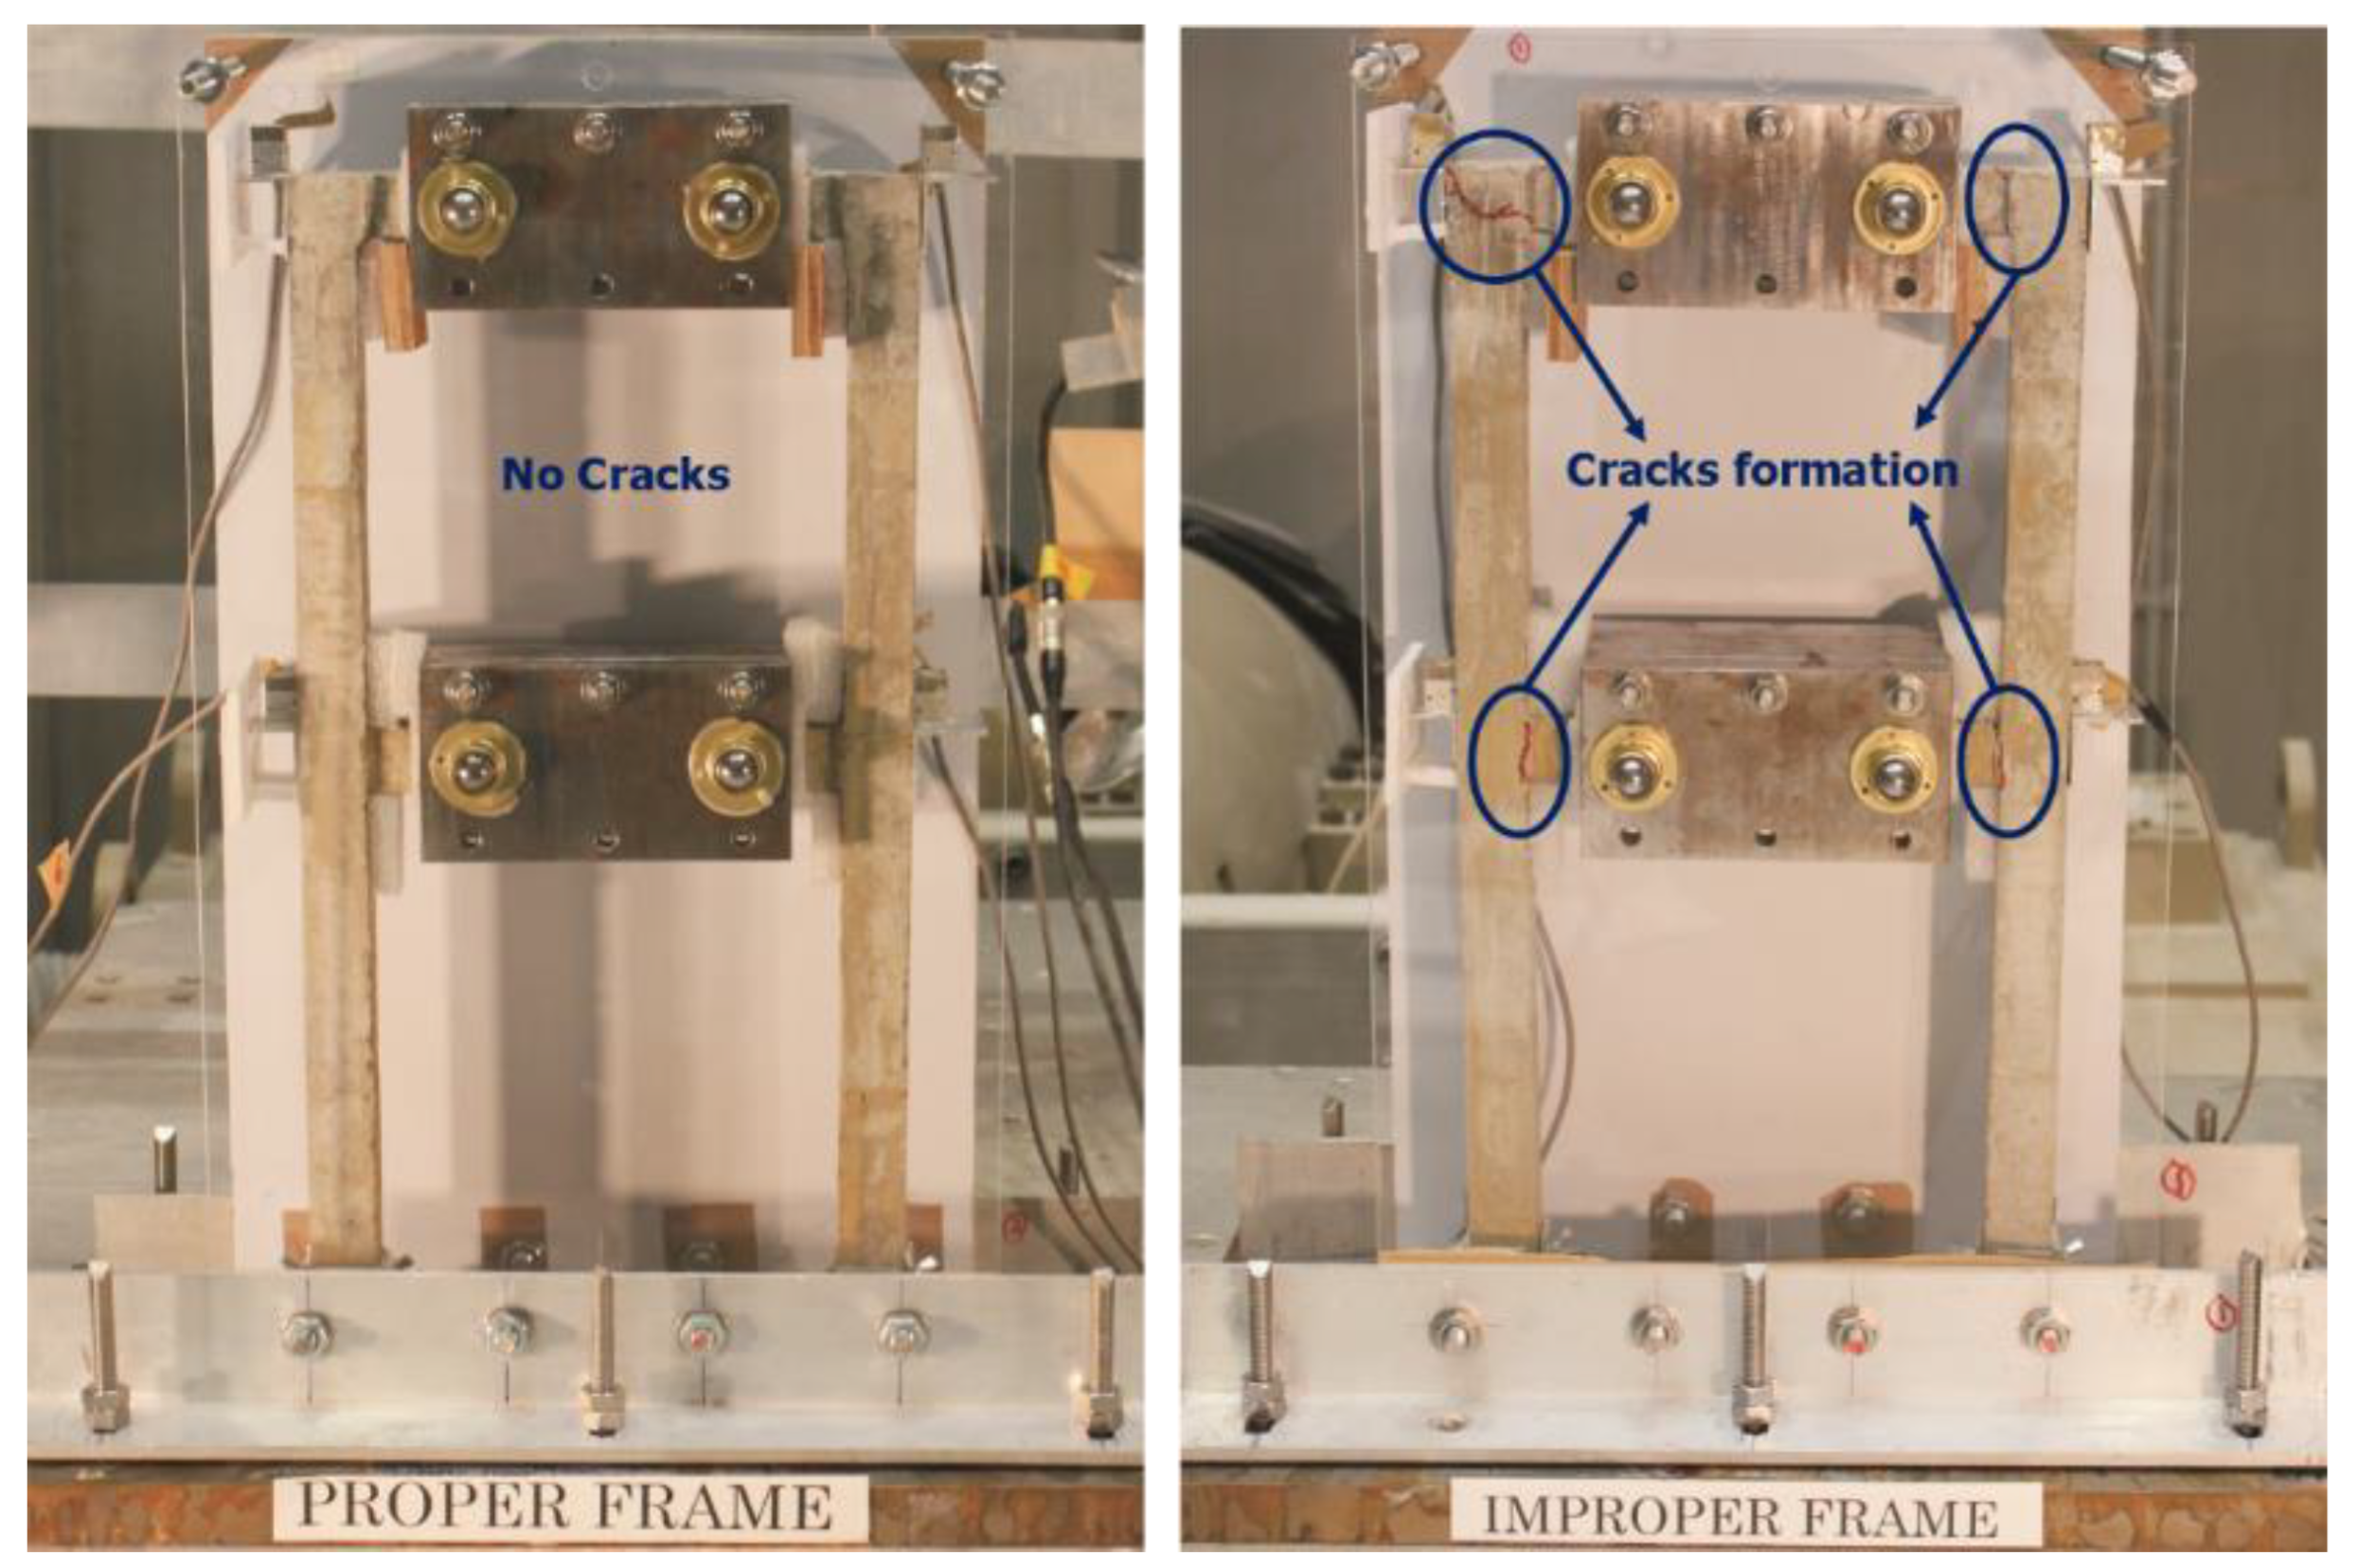
To envisage the crack pattern and energy dissipation mechanism, a total of 63 shake table tests were performed for both proper and improper frame structures. Hereinafter, each test is called a Run as shown in Table 13. For both proper and improper frames, no cracks were observed until Run 30. Some cracks were observed in the improper frame from Run 31, and the complete failure of the improper frame was observed after Run 39, whereas the proper frame did not show any cracks even after Run 55. After Run 57, the proper frame exhibits some cracks in the beam–column interface, which propagate in Run 61 and lead to a complete collapse in Run 62. The detail of each frame after each Run is explained in Table 13.
Table 13. Crack pattern and description of proper and improper frames.
RunDescription
Proper FrameImproper Frame
1–30No cracks No significant cracks appear in the frame
31No cracksSignificant cracks appeared in the beam–column joints when a 10 Hz frequency was applied for 40 s. The cracks in the frame are shown in Figure 17. Partial cracks appear in the base connection.
32–38No cracksNo significant changes in the cracks. The frame was able to resist higher frequencies (i.e., 35 Hz and 40 Hz) and also low frequencies (i.e., 5 Hz and 2 Hz) with lesser (50%) amplitude.
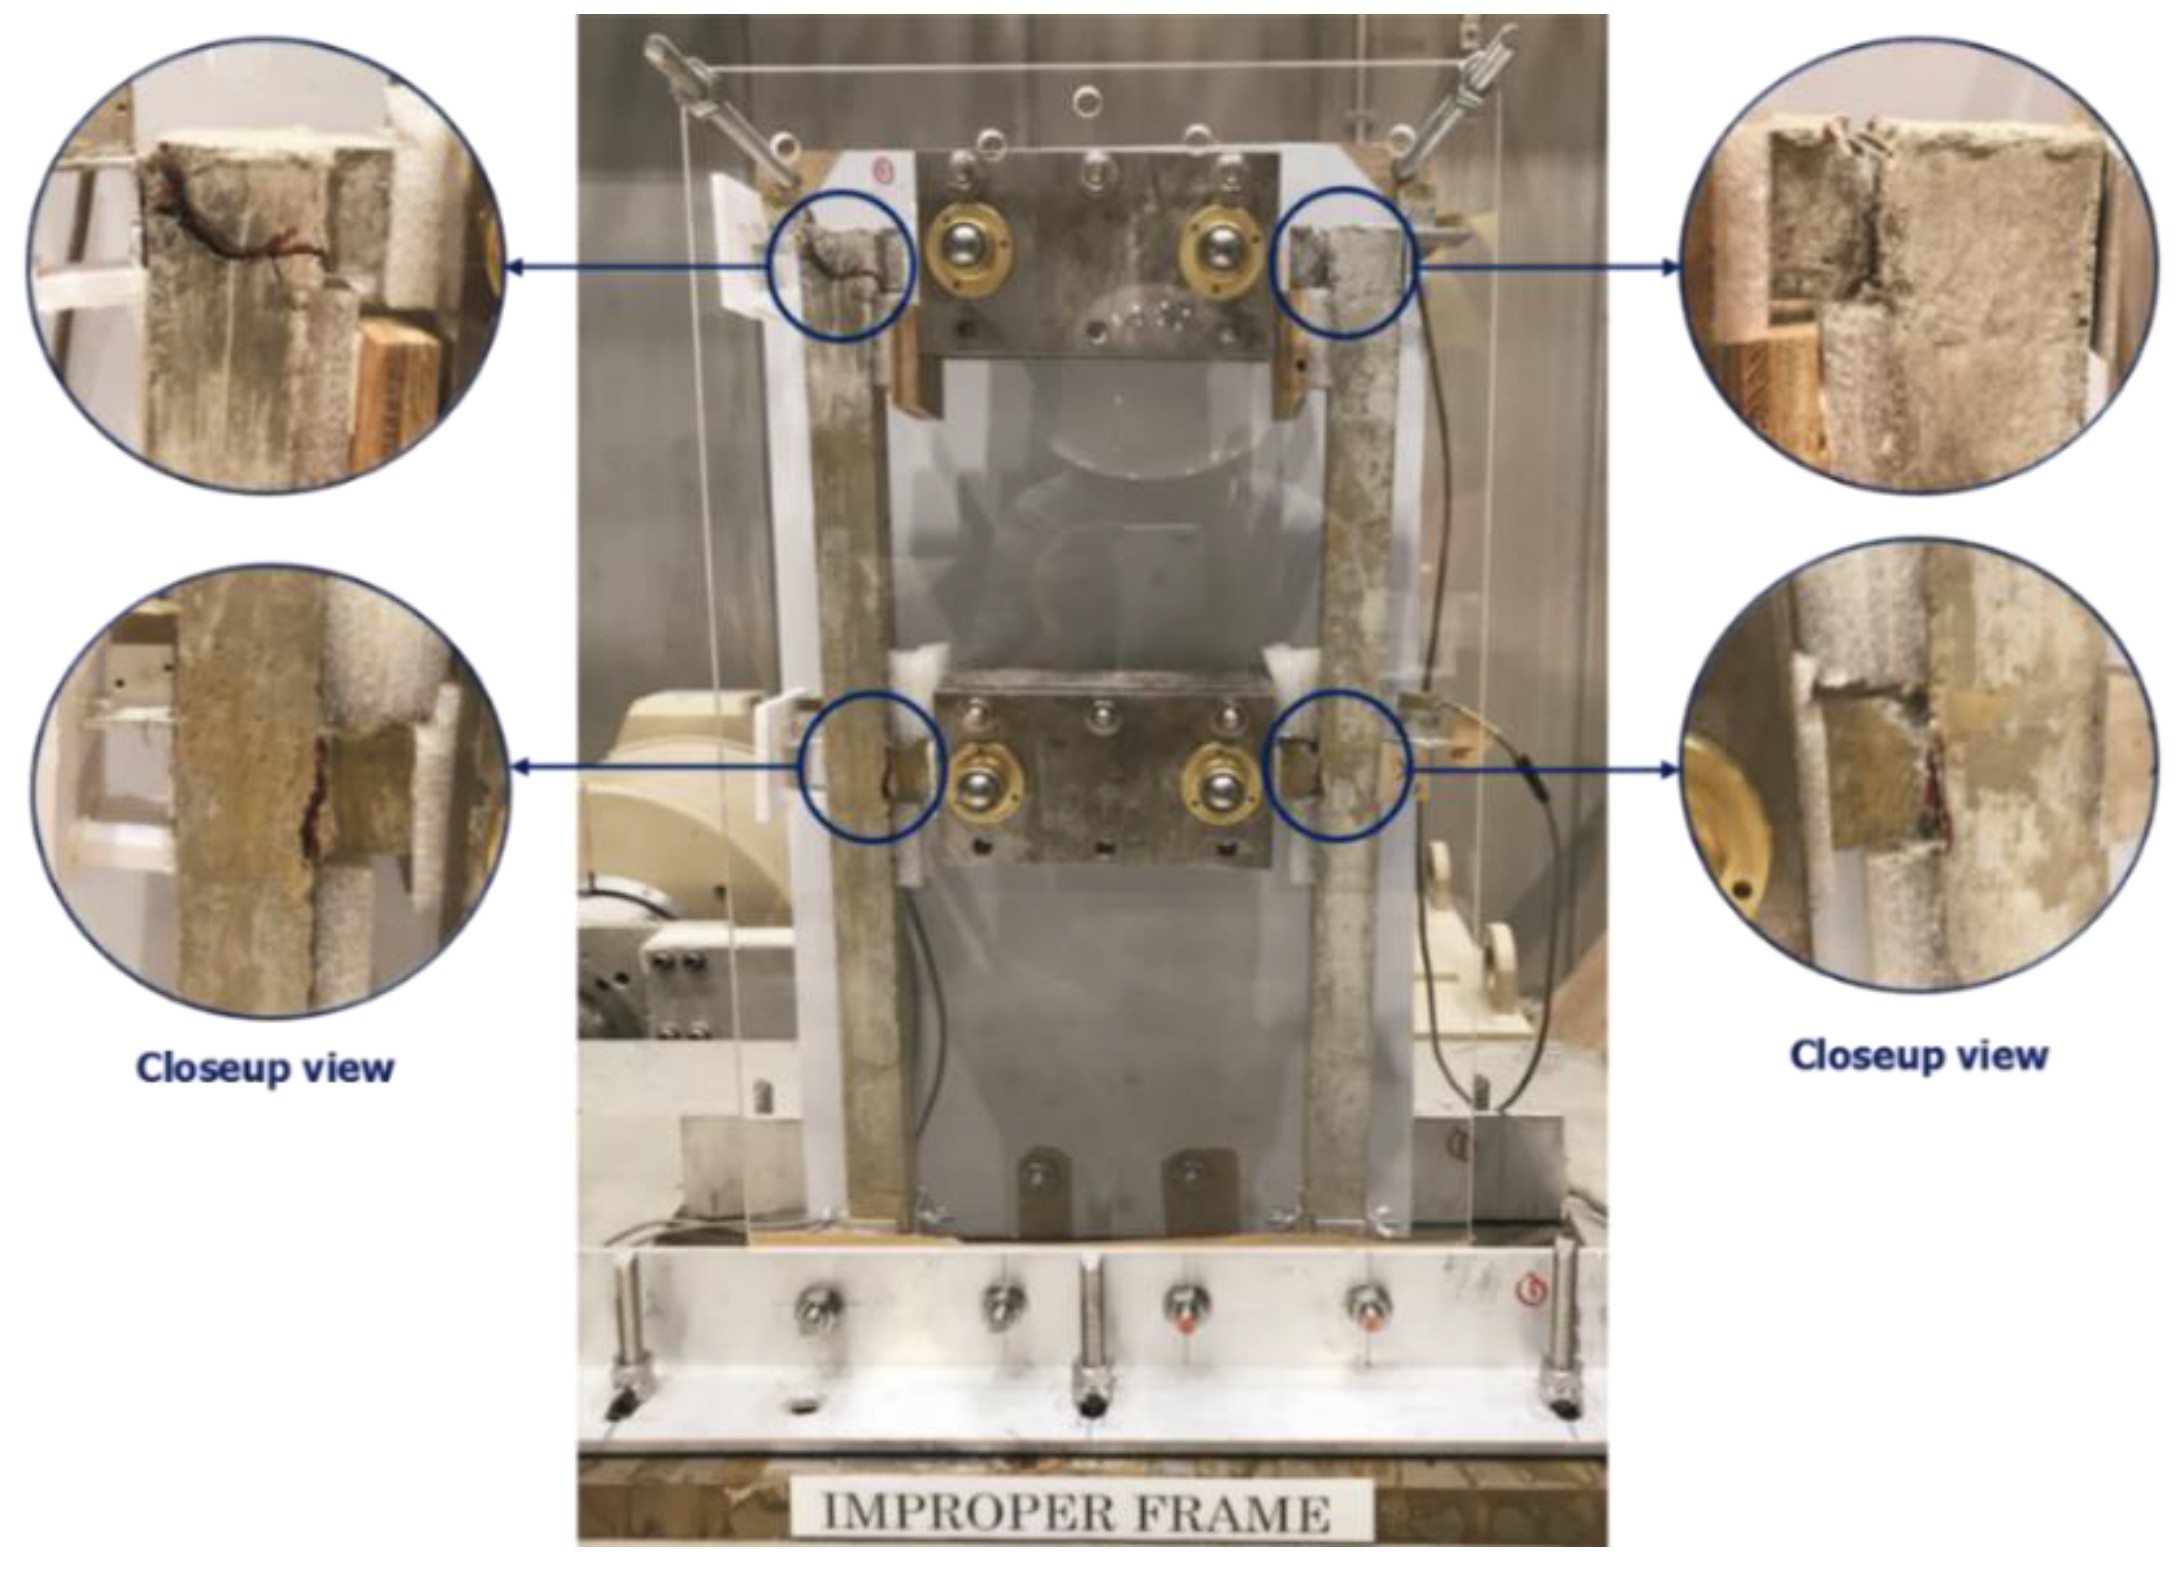
39No cracksThe cracks in the joints widen up severely, and additional cracks appear in the base connection. The reinforcement bars in the top right corner of the improper frame had a shear failure. The accelerometer A9 was detached, and reinforcement was visible. Its close-up view is shown in Figure 18.
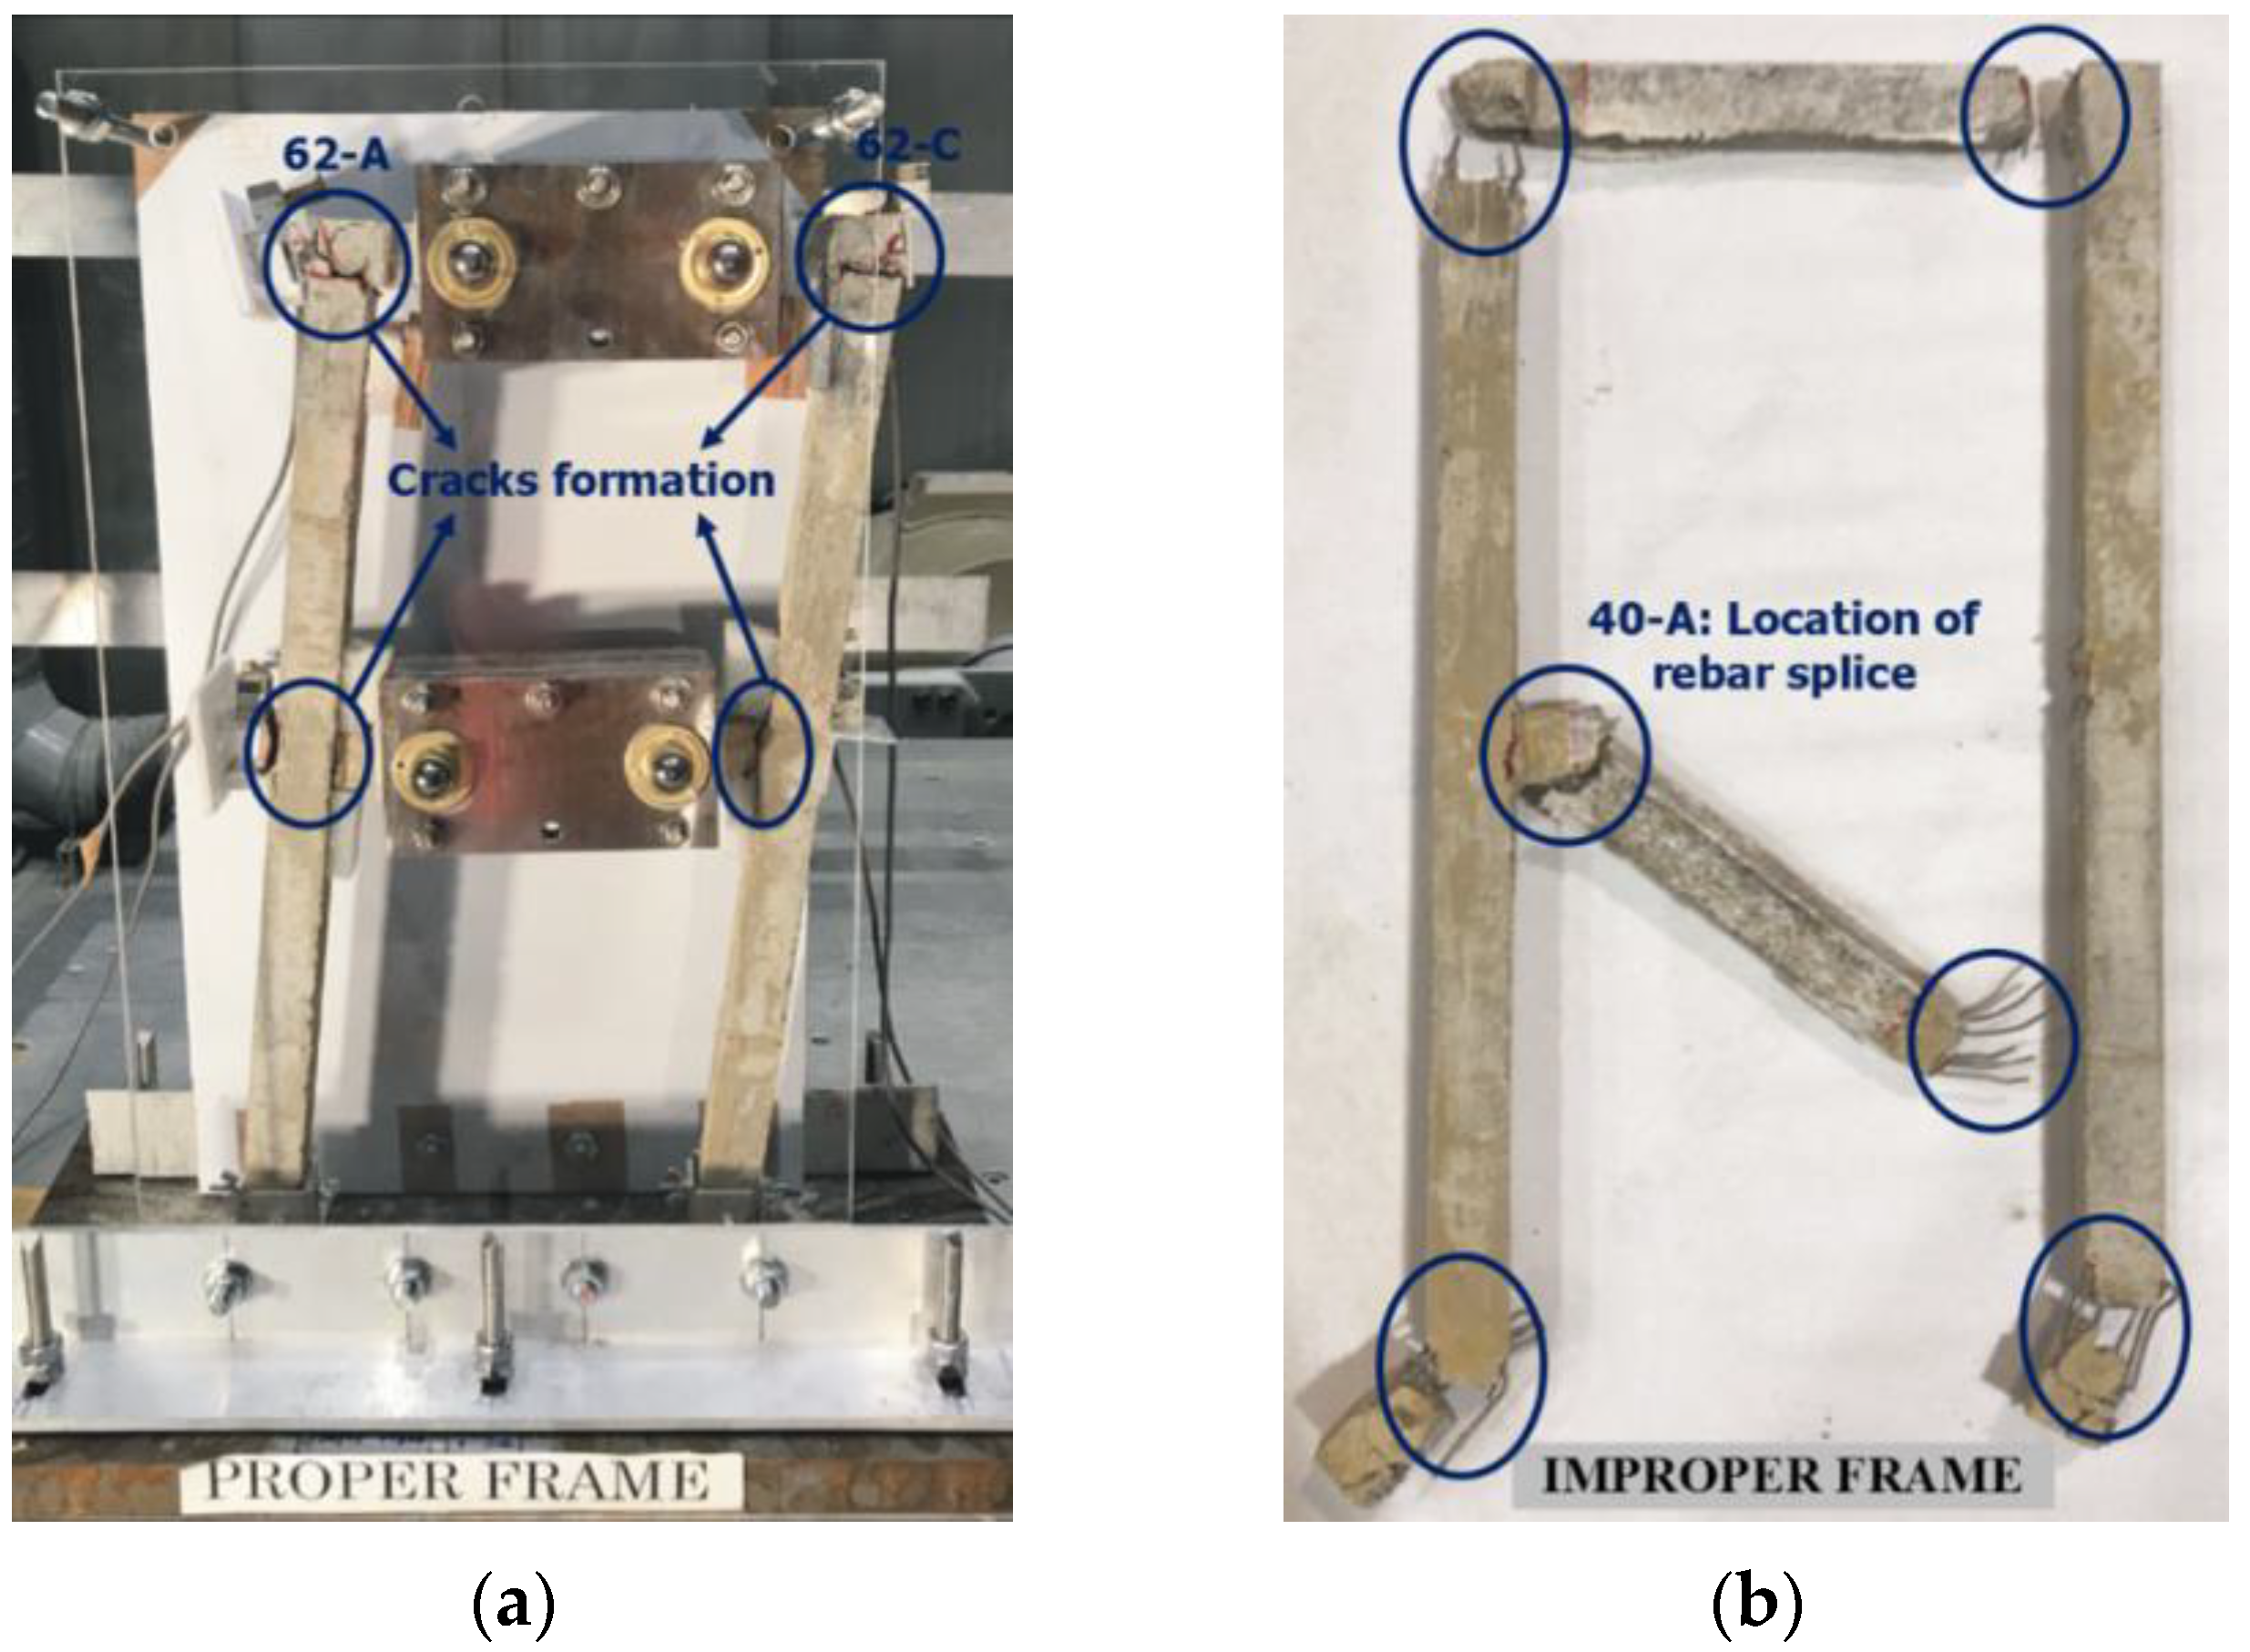
40No cracksComplete failure of the improper frame. Both beams were damaged entirely as shown in Figure 19b. Although there were some cracks at the beam–column interface at point 40-A, but the improper lap splicing dominated the failure at this portion. At all other joints, the failure occurred at the beam–column joints.
41–44No cracks were observed in the proper frame. After this stage, the 10 Hz frequency loading was repeated several times.Collapsed
45–58The 8 Hz, 10 Hz, and 12 Hz frequency waves were repeated several times, but no cracks were observed.Collapsed
59Significant cracks appear after repeating the 10 Hz frequency several times for 2 min. There were no significant cracks in the base connection.Collapsed
60,61No significant change in cracks.Collapsed
62Severe cracks appear in all joints, as shown in Figure 19a. The base connections also had severe cracks. The accelerometers were detached from points 62-a and 62-c.Collapsed
63Complete failure of the proper frame. None of the beams were completely detached, but all beam–column joints had severe damage.Collapsed

6.2. Hysteresis

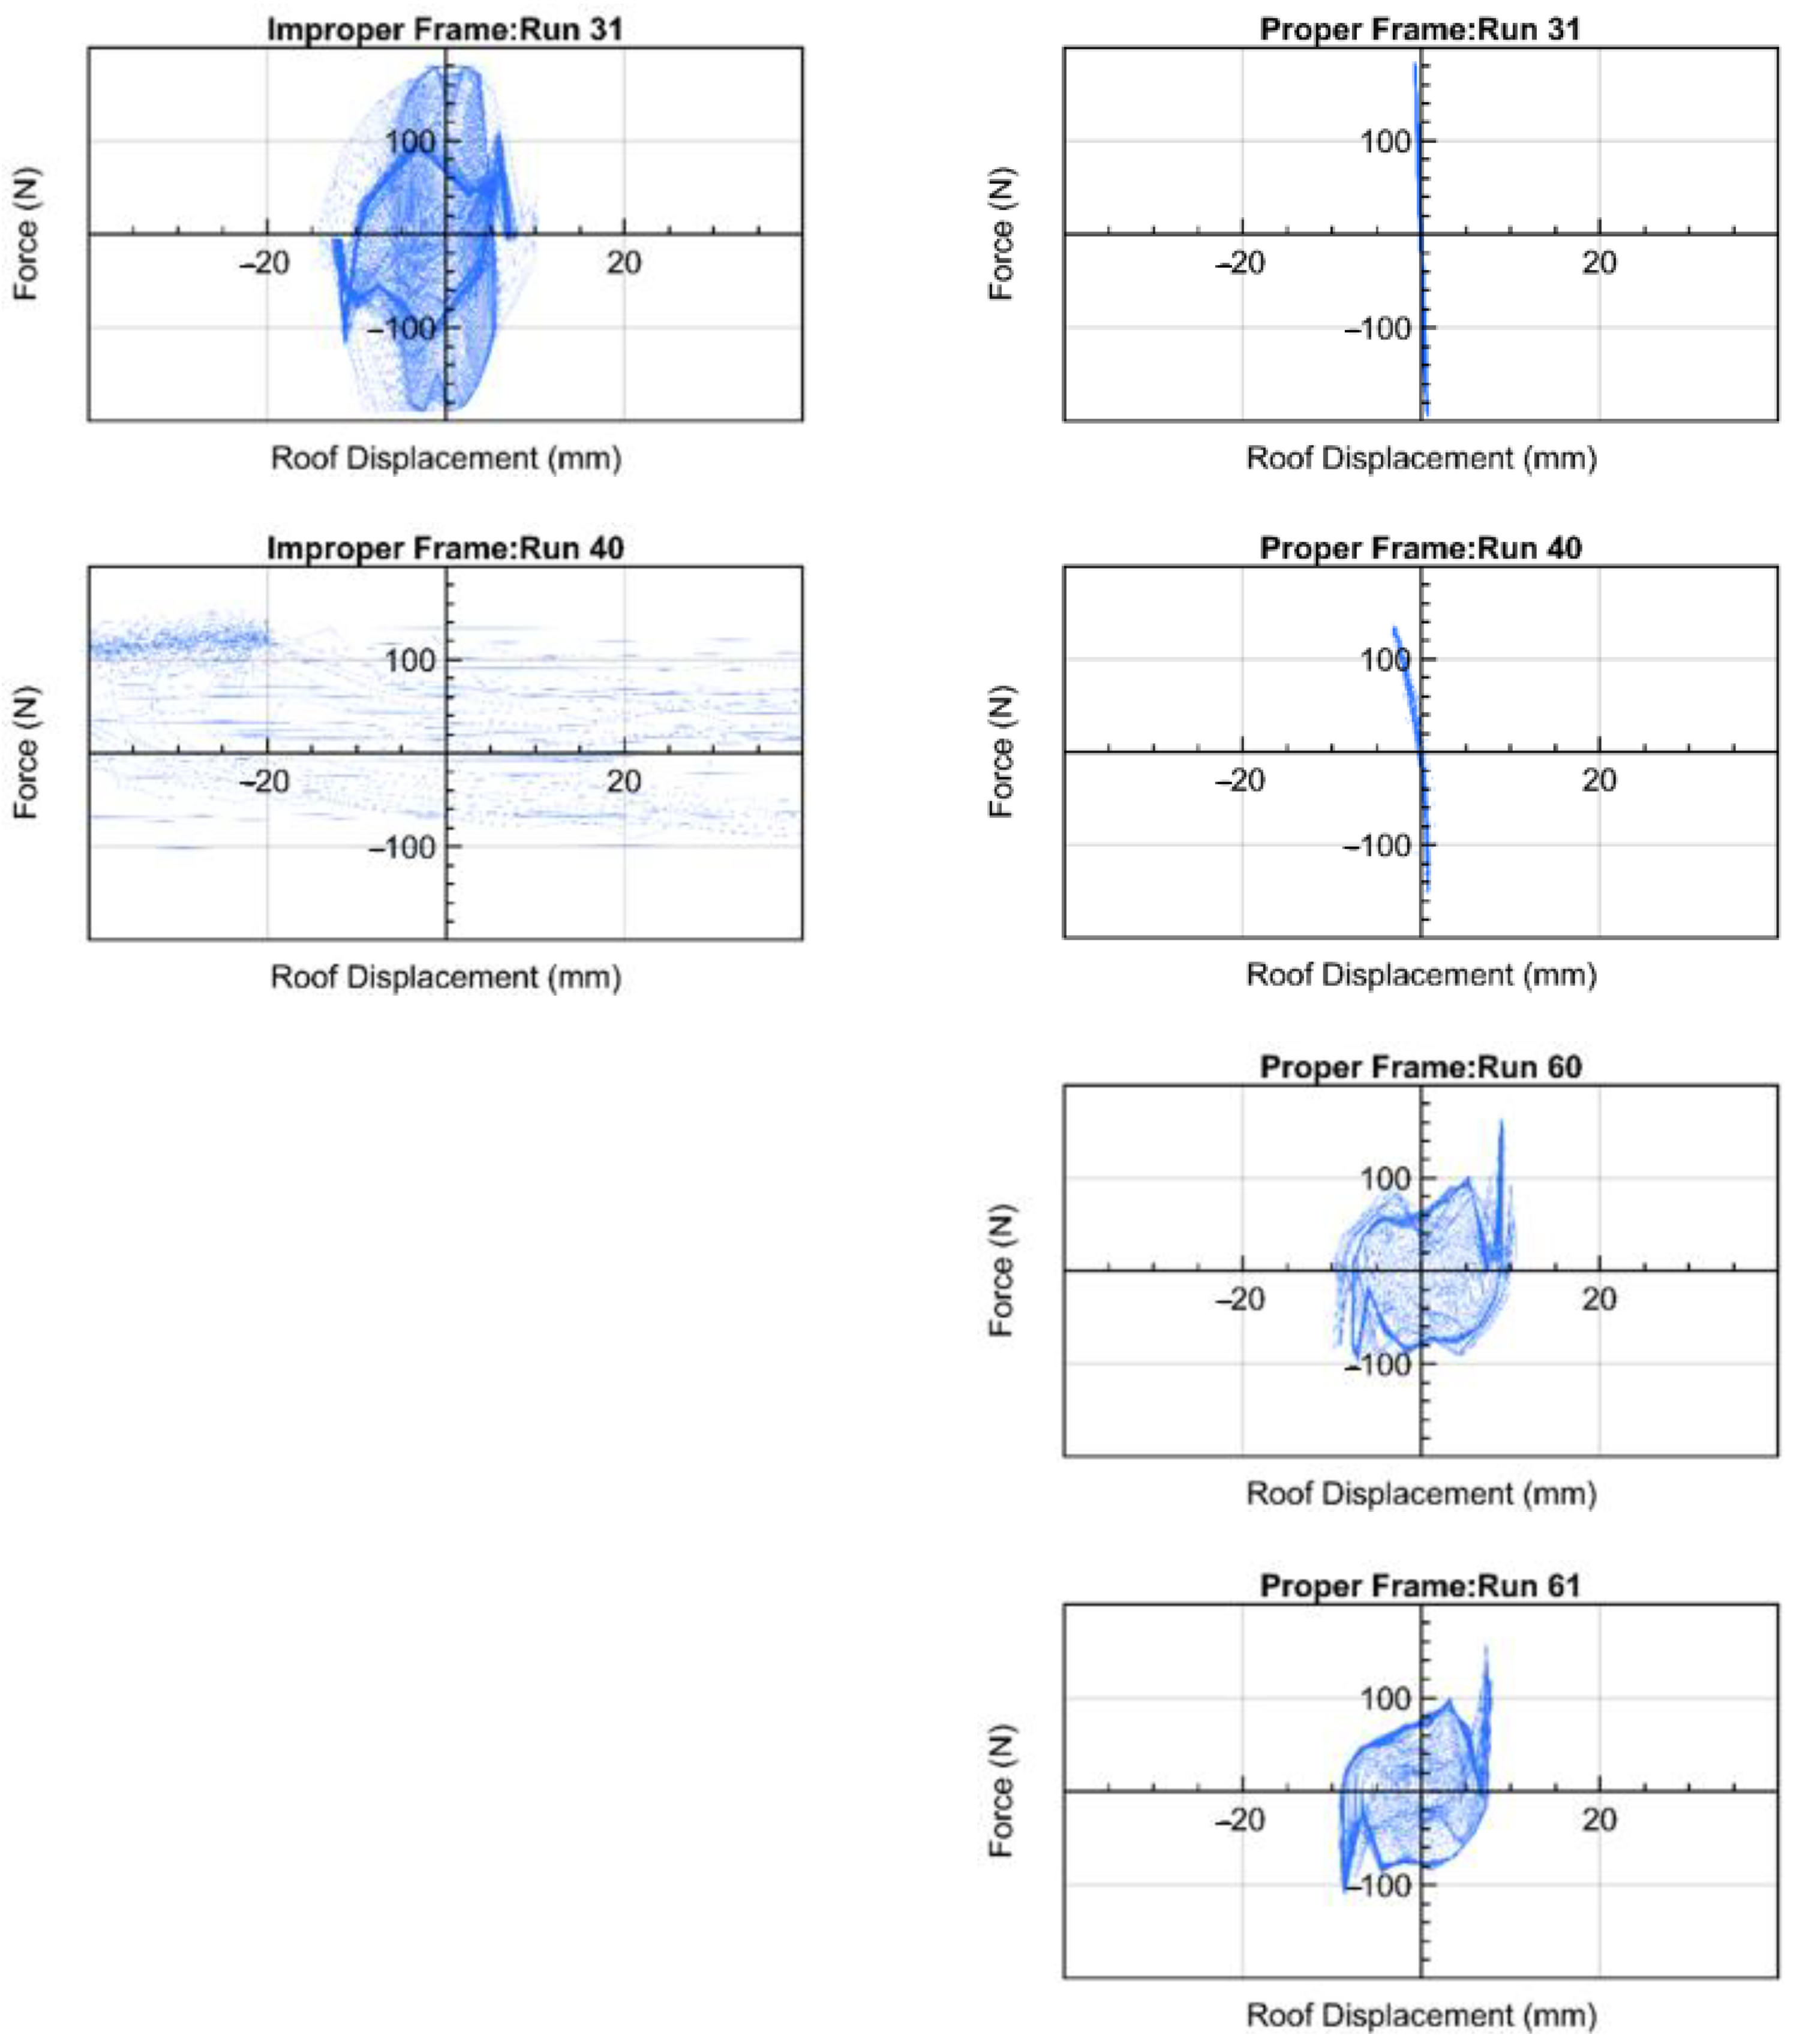
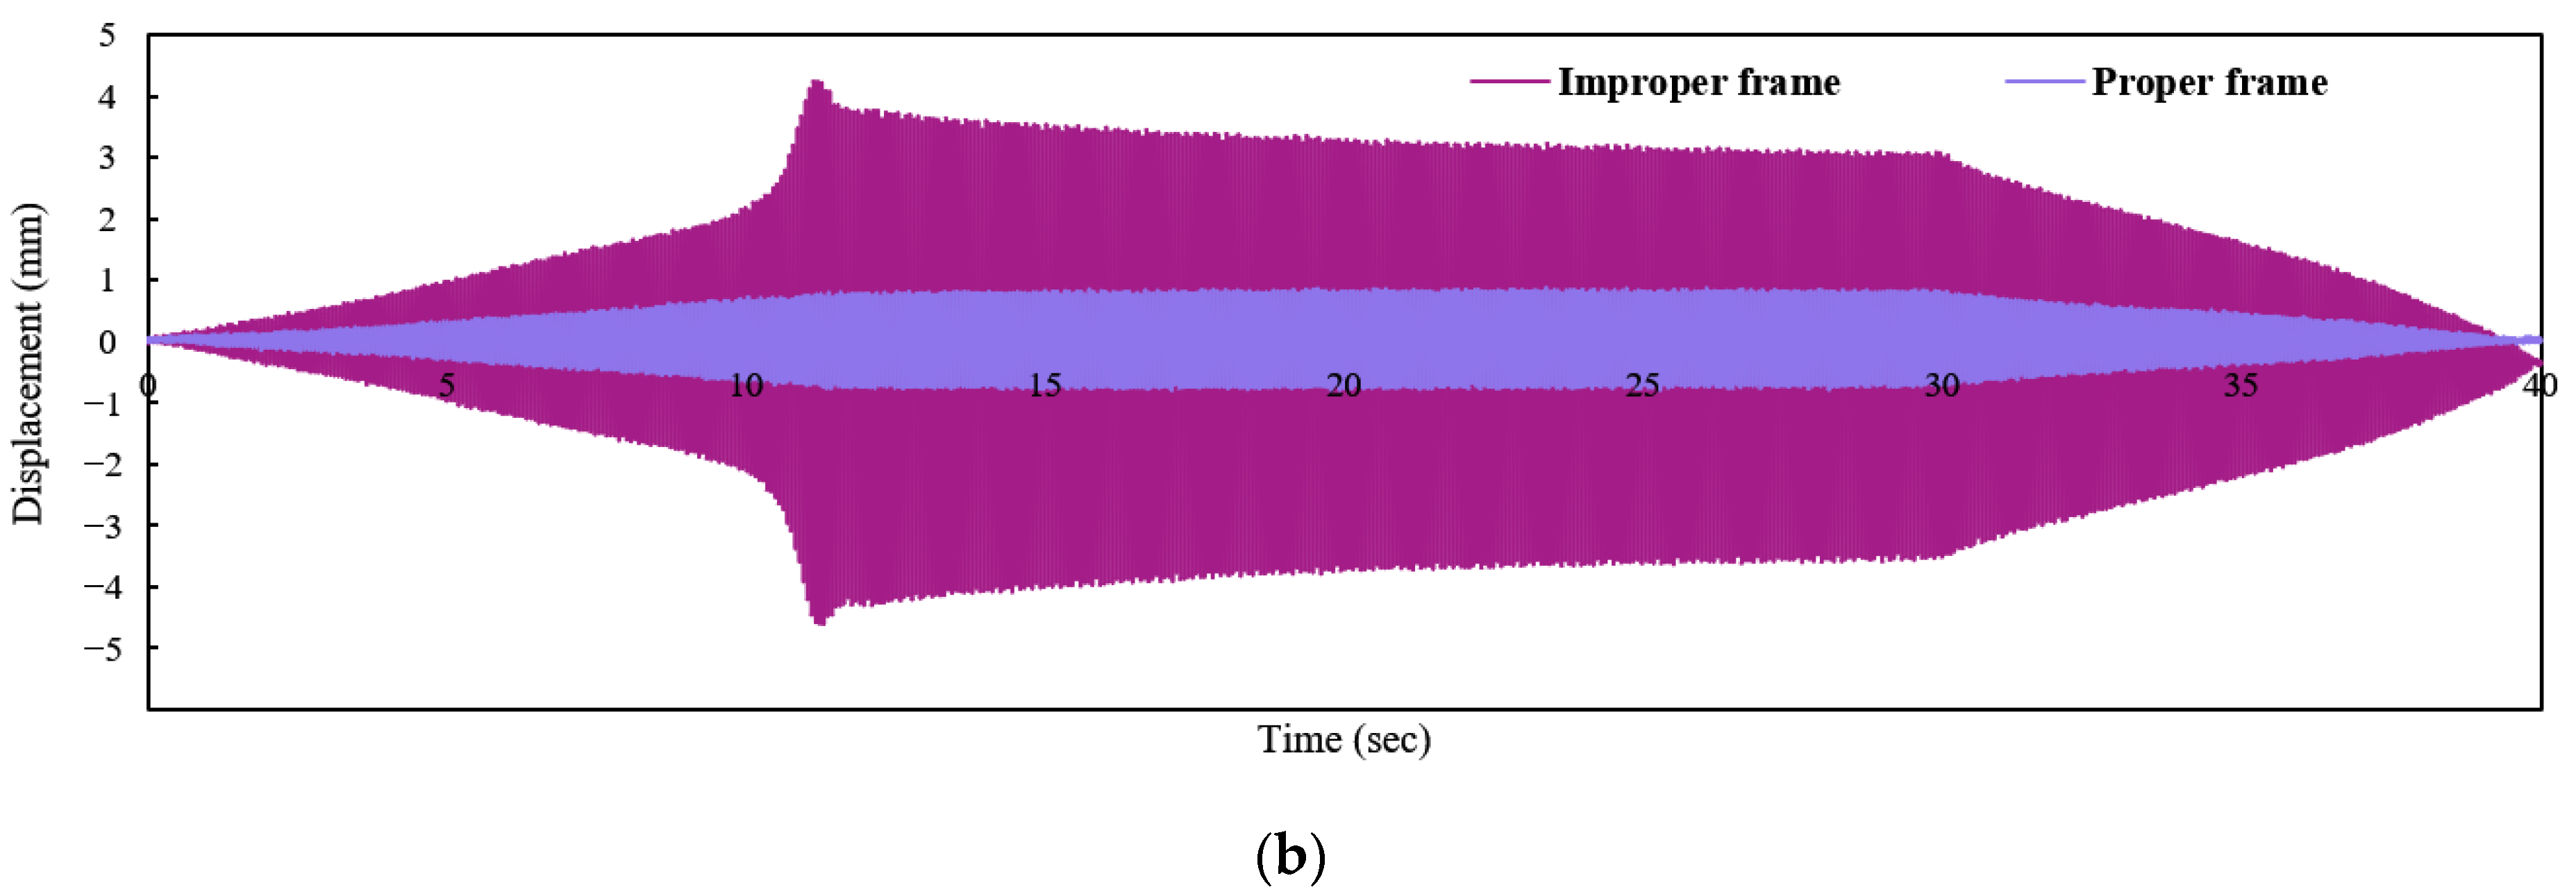
The hysteresis load–displacement behaviors of both the proper and improper frames are shown in Figure 20. From the hysteresis after Run 31, it is evident that the improper frame has huge roof displacement as compared to the proper frame, indicating the initiation of bond–slip behavior. From this, there is the initiation of gradual strength degradation, due to the deterioration in bond stresses between the concrete and reinforcing steel bars. Ultimately, the hysteresis diagram after Run 40 shows the failure of the improper frame. On the other hand, the proper frame was still behaving structurally fine at Run 40, demonstrating the effectiveness of the lap splices of reinforcing bars. After Run 60, the roof displacement of the proper frame is increased. The difference in displacement at the roof of both frames at Run 20 and Run 30 is shown in Figure 21 which exhibits that the improper frame has a larger displacement since the beginning.

7. Conclusions

The main goal of this research is to highlight the consequences of improper lap splicing in RC frame structures. To this aim, the authors demonstrated a simple, inexpensive, and evident experimental technique by using micro-concrete with locally available material to assess the seismic performance of a completely engineered RC frame with the defect of an improper lap splice. Based on the experimental investigation, the following conclusions can be drawn:
(1)
The experimental results have proved that improper splicing details can reduce the capacity of reinforced concrete structures sufficiently, and the structure is highly vulnerable in case of an earthquake. The shake table test results demonstrate that the plastic hinges and damage points for the proper frame are the beam–column joints and the base connections as shown in Figure 19a, but if there is a provision of improper lap splice, then this can alter the damage point of the structure, triggering complete detachment of the beam with the improper lap splice as observed in Figure 19b at point 40-A.
(2)
The experimental results of this research also demonstrate the reduction in strength, stiffness, and energy dissipation of RC structures, which have been through multiple earthquakes, which implies the reduction in the age of the structure. Furthermore, the results from this experiment can be used for awareness among local communities about the vulnerability of structures against earthquakes due to these small, neglected defects. This could reduce poor construction practices in developing countries in future projects.
(3)
In addition to the scientific importance of this research, the authors would also like to emphasize the cost-effectiveness of this research. While increasing the burden on the financial component of experimentations, studying problems such as non-engineering defects could not be lucrative with the conventional methods of testing. Therefore, the testing mentioned in this research should pave the way for other research in micro-modeling to reduce the cost and study non-engineering problems extensively to find scientific and social solutions.
(4)
In this research, the shake table test was conducted by limiting the shaking to only one direction to avoid the out-of-plane failure of the 2D frames. Furthermore, it is also important to mention here that this research focuses mainly on the qualitative presentation of the problems caused by non-engineering defects. The idea of a reduction in the capacity of a structure with non-engineering defects can be achieved qualitatively through the numerical simulation presented in the article but the extent of the reduction in strength as compared to the proper structure could not be acquired at this stage. So, there is a need to further improve the numerical analysis techniques by using the experimental results.
This paper will be an additional contribution to the structural engineering community, which focuses on the consequences of commonly encountered non-engineering defects, i.e., improper lap splices in RC frames. Therefore, the results of this research can be useful to prepare the proper guidelines on the non-engineering defects encountered during the construction of RC frame structures for the sake of improving their structural integrity and load-carrying capacity.

Author Contributions

Conceptualization, A.J., C.K. and K.M.; methodology, A.J., C.K., K.A. and K.M.; AEM analysis, A.J. and M.F.U.D.A.; writing—original draft preparation, A.J. and K.A.; writing—review and editing, M.F.U.D.A. and A.M.; supervision, K.M. All authors have read and agreed to the published version of the manuscript.

Funding

This research received no external funding.

Data Availability Statement

Some or all data, models, or analysis results that support the findings of this study are available from the corresponding author upon reasonable request. The item list includes (1) the models of proper and improper frames in the Applied Element Method and (2) the analysis results of the shake table test.

Acknowledgments

We would like to extend our sincere gratitude to the Asian Development Bank (ADB), Japan and the Institute of Industrial Sciences (IIS), The University of Tokyo for providing facilities and support to conduct this research.

Conflicts of Interest

The authors declare no conflict of interest.

References

  1. Zafar, A. Response Modification Factor of Reinforced Concrete Moment Resisting Frames in Developing Countries; University of Illinois at Urbana-Champaign: Urbana, IL, USA, 2009. [Google Scholar]
  2. Isler, O. Seismic Performances and Typical Damages of Beam-Column Joints in the RC Buildings. In Proceedings of the 14th World Conference on Earthquake Engineering, Beijing, China, 12–17 October 2008. [Google Scholar]
  3. Ates, S.; Kahya, V.; Yurdakul, M.; Adanur, S. Damages on reinforced concrete buildings due to consecutive earthquakes in Van. Soil Dyn. Earthq. Eng. 2013, 53, 109–118. [Google Scholar] [CrossRef]
  4. Arya, A.S. Non-engineered construction in developing countries—An approach toward earthquake risk preduction. In Proceedings of the 12th World Conference on Earthquake Engineering, Auckland, New Zeland, 30 January–4 February 2000; pp. 1–22. [Google Scholar]
  5. Castillo, A.; López-Almansa, F.; Pujades, L.G. Seismic risk analysis of urban non-engineered buildings: Application to an informal settlement in Mérida, Venezuela. Nat. Hazards 2011, 59, 891–916. [Google Scholar] [CrossRef] [Green Version]
  6. Arya, A.S.; Boen, T.; Ishiyama, Y. Guidelines for Earthquake Resistant Non-Engineered Construction; The United Nations Educational, Scientific and Cultural Organization (UNESCO): Paris, France, 2014. [Google Scholar]
  7. Alam, M.J.; Ahsan, R.; Akhter, F.; Paul, A. Earthquake Resistant Non-Engineered Building Construction for Rural Area in Bangladesh. In Proceedings of the 14th World Conference on Earthquake Engineering, Beijing, China, 12–17 October 2008. [Google Scholar]
  8. Ali, K.; Javed, A.; Mustafa, A.E.; Saleem, A. Blast-Loading Effects on Structural Redundancy of Long-Span Suspension Bridge Using a Simplified Approach. Pract. Period. Struct. Des. Constr. 2022, 27, 04022024. [Google Scholar] [CrossRef]
  9. Mustafa, A.E.; Javed, A.; Ali, K. Safety Assessment of Cables of Suspension Bridge under Blast Load. Struct. Congr. 2022, 2022, 79–93. [Google Scholar] [CrossRef]
  10. Chaudhary, M.T.A. Seismic Vulnerability Mitigation of Non-Engineered Buildings. Int. J. Civ. Struct. Constr. Archit. Eng. 2014, 8, 37–41. [Google Scholar]
  11. Boen, T.; Pribadi, K.S. Engineering of Non-Engineered Masonry Houses for Better Earthquake Resistance in Indonesia. Asian J. Environ. Disaster Manag. 2011, 3, 65–70. [Google Scholar] [CrossRef]
  12. Blondet, M.; Vargas-Neumann, J.; Tarque, N.; Soto, J.; Sosa, C.; Sarmiento, J. Seismic Reinforcement of Earthen Constructions. In Proceedings of the 16th World Conference on Earthquake Engineering, Santiago, Chile, 9–13 January 2017. [Google Scholar]
  13. Blondet, M.; Vargas, J.; Sosa, C.; Soto, J. Seismic Simulation Tests to Validate a Dual Technique for Repairing Adobe Historical Buildings Damaged by Earthquakes. In Proceedings of the Kerpic—New Generations Earthern Architecture, Istanbul, Turkey, 11–14 September 2013. [Google Scholar]
  14. Fahim, M.; Elkoly, S.; Morad, S. Efficient New Numerical Technique for RC Structures with Construction Defects under Monotonic and Cyclic Loading Conditions. Asian Trans. Eng. 2013, 2, 7–16. [Google Scholar]
  15. Elishakoff, I.; Ankitha, A.P.; Marzani, A. Rigorous versus naïve implementation of the Galerkin method for stepped beams. Acta Mech. 2019, 230, 3861–3873. [Google Scholar] [CrossRef]
  16. Elishakoff, I.; Amato, M.; Ankitha, A.P.; Marzani, A. Rigorous implementation of the Galerkin method for stepped structures needs generalized functions. J. Sound Vib. 2021, 490, 115708. [Google Scholar] [CrossRef]
  17. Javed, A.; Sadeghnejad, A.; Rehmat, S.; Yakel, A.; Azizinamini, A. Magnetic Flux Leakage (MFL) Method for Damage Detection in Internal Post-Tensioning Tendons; Florida International University: Miami, FL, USA, 2021. [Google Scholar] [CrossRef]
  18. Afzal, M.F.; Matsumoto, Y.; Nohmi, H.; Sakai, S.; Su, D.; Nagayama, T. Comparison of Radar Based Displacement Measurement Systems with Conventional Systems in Vibration Measurements at a Cable Stayed Bridge. 2016. Available online: https://www.researchgate.net/publication/307932143 (accessed on 31 January 2023).
  19. Hameed, A.; Rasool, A.M.; Ibrahim, Y.E.; Afzal, M.F.U.D.; Qazi, A.U.; Hameed, I. Utilization of Fly Ash as a Viscosity-Modifying Agent to Produce Cost-Effective, Self-Compacting Concrete: A Sustainable Solution. Sustainability 2022, 14, 11559. [Google Scholar] [CrossRef]
  20. Filiatrault, A.; Lachapelle, É.; Lamontagne, P. Seismic performance of ductile and nominally ductile reinforced concrete moment resisting frames. I. Experimental study. Can. J. Civ. Eng. 1998, 25, 331–341. [Google Scholar] [CrossRef]
  21. Caccese, V.; Harris, H.G. Earthquake simulation testing of small-scale reinforced concrete structures. Struct. J. 1990, 87, 72–80. [Google Scholar] [CrossRef]
  22. Žarnić, R.; Gostič, S.; Crewe, A.J.; Taylor, C.A. Shaking table tests of 1:4 reduced-scale models of masonry infilled reinforced concrete frame buildings. Earthq. Eng. Struct. Dyn. 2001, 30, 819–834. [Google Scholar] [CrossRef]
  23. Kim, W.; El-Attar, A.; White, R.N. Small-Scale Modeling Techniques for Reinforced Concrete Structures Subjected to Seismic Loads; Technical Report NCEER-88-0041; National Center for Earthquake Engineering Research: New York, NY, USA, 1988; p. 92. [Google Scholar]
  24. Noor, F.A.; Boswell, L.F. Small Scale Modelling of Concrete Structures; Elsevier Science Publishers Ltd.: New York, NY, USA, 2005. [Google Scholar] [CrossRef]
  25. Dejian, S.; Lu, X. Experimental study on dynamic compressive properties of microconcrete under different strain rate. In Proceedings of the 14th World Conference on Earthquake Engineering, Beijing, China, 12–17 October 2008. [Google Scholar]
  26. Boutemeur, R.; Demidem, M.; Bali, A.; Benyoussef, E.H. Modelling of Micro-Concrete Behaviour under Static and Dynamic Loading. Appl. Mech. Mater. 2014, 584–586, 1089–1096. [Google Scholar] [CrossRef]
  27. Tobar, R.; Bonelli, P. Test of micro-concrete model of a building damaged during the 1985 chile earthquake. In Proceedings of the Eleventh World Conference on Earthquake Engineering, Acapulco, Mexico, 23–28 June 1996. [Google Scholar]
  28. Opabola, E.A.; Mangalathu, S. Seismic fragility assessment of bridges with as-built and retrofitted splice-deficient columns. Bull. Earthq. Eng. 2022, 21, 583–603. [Google Scholar] [CrossRef]
  29. Opabola, E.A.; Elwood, K.J. Seismic assessment of reinforced concrete columns with short lap splices. Earthq. Spectra 2021, 37, 1726–1757. [Google Scholar] [CrossRef]
  30. Chronopoulos, P.; Trezos, C.; Chronopoulos, M. Behaviour of RC elements with inadequate lap splices, before and after upgrading by welding of reinforcement. In Proceedings of the 4th International Symposium “Bond in Concrete 2012”, Brescia, Italy, 17–20 June 2012. [Google Scholar]
  31. Elrakib, T.M.; Arafa, A.I. Experimental evaluation of the common defects in the execution of reinforced concrete beams under flexural loading. HBRC J. 2012, 8, 47–57. [Google Scholar] [CrossRef] [Green Version]
  32. Goksu, C.; Yilmaz, H.; Chowdhury, S.R.; Orakcal, K.; Ilki, A. The effect of lap splice length on the cyclic lateral load behavior of RC members with low-strength concrete and plain bars. Adv. Struct. Eng. 2014, 17, 639–658. [Google Scholar] [CrossRef]
  33. Cho, J.-Y.; Pincheira, J.A. Nonlinear modeling of RC columns with short lap splices. In Proceedings of the 13th World Conference on Earthquake Engineering, Vancouver, BC, Canada, 1–6 August 2004. [Google Scholar]
  34. Chowdhury, S.R.; Orakcal, K. Analytical modeling of columns with inadequate lap splices. ACI Struct. J. 2014, 110, 735–744. [Google Scholar] [CrossRef]
  35. Nawaz, W.; Yehia, S.; Elchalakani, M. Lap splices in confined self-compacting lightweight concrete. Constr. Build. Mater. 2020, 263, 120619. [Google Scholar] [CrossRef]
  36. Code CF; International Federation for Structural Concrete: Lausanne, Switzerland, 2010.
  37. ACI Committee 318, 318–319; Building Code Requirements for Structural Concrete and Commentary. ACI Committee: Farmington Hills, MI, USA, 2019. [CrossRef]
  38. ASCE. Seismic Evaluation and Retrofit of Existing Buildings ASCE/SEI 41-13; ASCE: Reston, VA, USA, 2014. [Google Scholar] [CrossRef] [Green Version]
  39. Okazaki, K.; Kusumastuti, D.; Probadi, K.; Saito, T. Comparison of Current Construction Practices of Non-Engineered Buildings in Developing Countries. In Proceedings of the 15th World Conference on Earthquake Engineering (15WCEE), Lisbon, Portugal, 24–28 September 2012; pp. 9962–9971. [Google Scholar]
  40. Rezaeepazhand, J.; Simitses, G.J.; Starnes, J.H. Scale models for laminated cylindrical shells subjected to axial compression. Compos. Struct. 1996, 34, 371–379. [Google Scholar] [CrossRef]
  41. Thomas, C.; Tamayo, P.; Setién, J.; Ferreño, D.; Polanco, J.A.; Rico, J. Effect of high temperature and accelerated aging in high density micro-concrete. Constr. Build. Mater. 2021, 272, 121920. [Google Scholar] [CrossRef]
  42. American Society of Civil Engineers. Minimum Design Loads and Associated Criteria for Buildings and Other Structures; American Society of Civil Engineers: Reston, VA, USA, 2017; pp. 1–889. [Google Scholar] [CrossRef]
  43. NFEC. Mix Design for Small-Scale Models of Concrete Structures: Technical Report R564; NFEC: Port Hueneme, CA, USA, 1968. [Google Scholar]
  44. Talaat, A.; Emad, A.; Tarek, A.; Masbouba, M.; Essam, A.; Kohail, M. Factors affecting the results of concrete compression testing: A review. Ain Shams Eng. J. 2021, 12, 205–221. [Google Scholar] [CrossRef]
  45. ASTM C 192/C 192M-02; Standard Practice for Making and Curing Concrete Test Specimens in the Laboratory. ASTM International, ASTM Committee: Farmington Hills, MI, USA, 2002; Volume 4, pp. 1–8.
  46. ASTM C 39/C 39M-01; Standard Test Method for Compressive Strength of Cylindrical Concrete Specimens. ASTM International, ASTM Committee: Farmington Hills, MI, USA, 2001; Volume 4, pp. 1–5.
  47. Yi, S.T.; Yang, E.I.; Choi, J.C. Effect of specimen sizes, specimen shapes, and placement directions on compressive strength of concrete. Nucl. Eng. Des. 2006, 236, 115–127. [Google Scholar] [CrossRef]
  48. Sabnis, G.M.; Mirza, S.M. Size Effect in Model Concretes? ASCE J. Struct. Div. 1979, 105, 1007–1020. [Google Scholar] [CrossRef]
  49. Elfahal, M.M.; Krauthammer, T.; Ohno, T.; Beppu, M.; Mindess, S. Size effect for normal strength concrete cylinders subjected to axial impact. Int. J. Impact Eng. 2005, 31, 461–481. [Google Scholar] [CrossRef]
  50. Elfahal, M.M.; Theodor, K. Dynamic Size Effect in Normal- and High-Strength Concrete Cylinders. Mater. J. 2005, 102, 77–85. [Google Scholar]
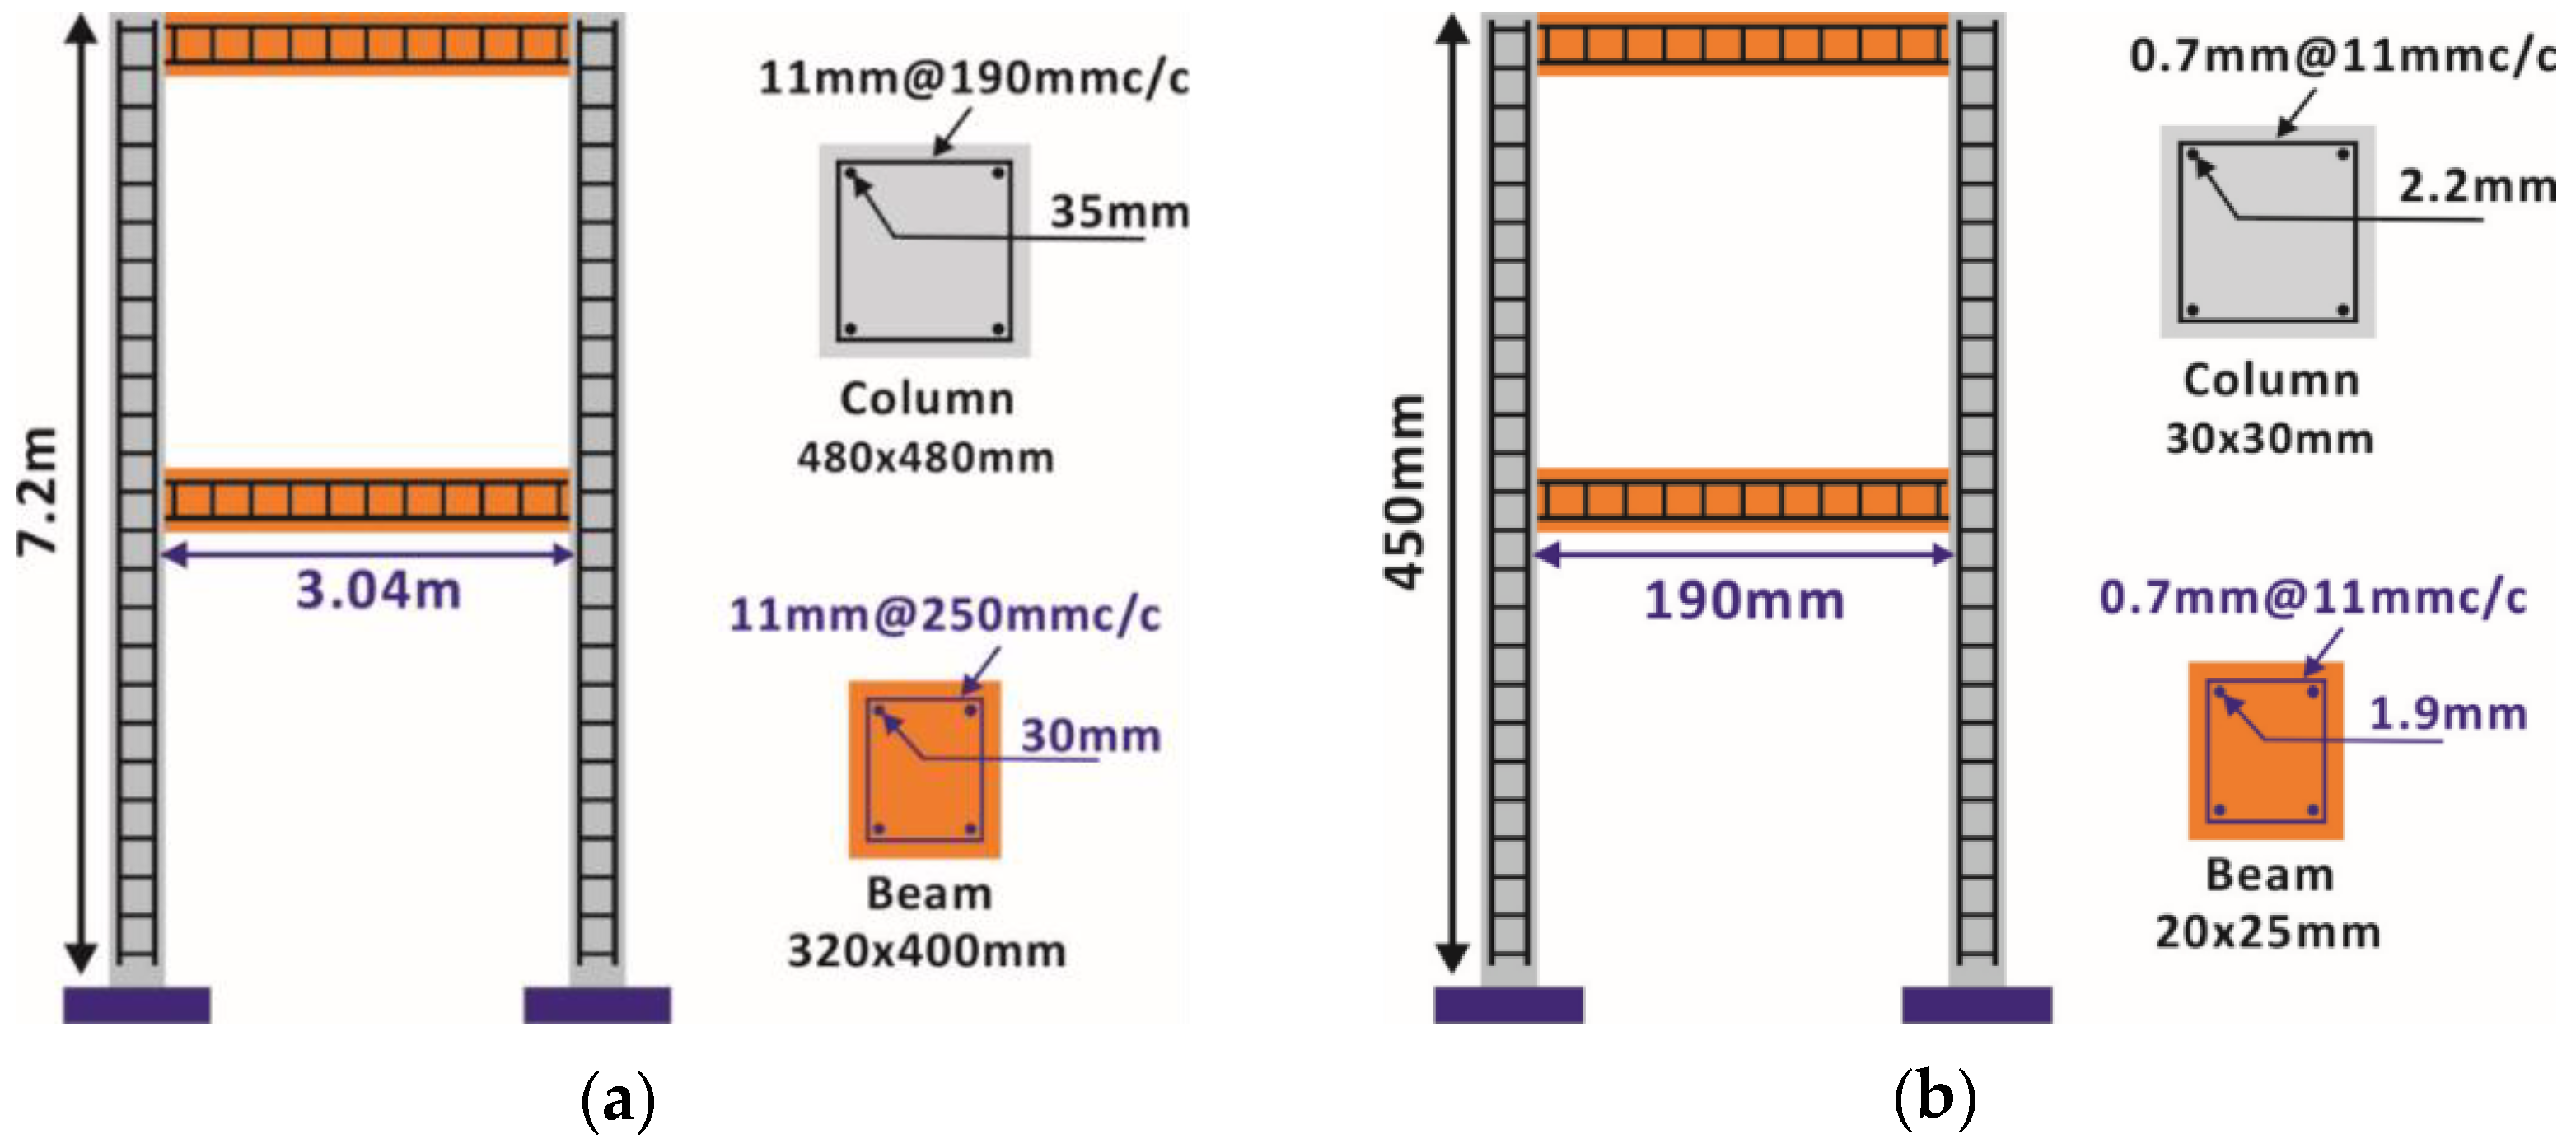
Figure 1. Reinforcement detail. (a) Actual size structure and (b) 1/16-scaled model.
Infrastructures 08 00056 g001
Figure 2. Response spectrum of selected earthquake motions.
Infrastructures 08 00056 g002
Figure 3. Analysis of actual frame and 1/16 scaled frame using Applied Element Method and time−history of displacement. (a) Cracked springs of actual structure at loading stages of 50, 100, and 200, (b) cracked springs of 1/16 scaled structure at loading stages of 50, 100, and 200.
Infrastructures 08 00056 g003
Figure 4. Reinforcement fabrication (a) stirrups preparation, (b) spacing between stirrups, and (c) column reinforcement caging.
Infrastructures 08 00056 g004
Figure 5. Maximum displacement for different locations of improper lap splice. (a) At the center of the top bar, (b) at the center of the bottom bar, (c) at L/6 of the top bar, and (d) at L/6 of the bottom bar.
Infrastructures 08 00056 g005aInfrastructures 08 00056 g005b
Figure 6. Improper lap splicing location.
Infrastructures 08 00056 g006
Figure 7. Aggregate gradation curve for micro-concrete.
Infrastructures 08 00056 g007
Figure 8. (a) Compressive strength vs. w/c ratio and (b) workability curves for different aggregate sizes [43].
Infrastructures 08 00056 g008
Figure 9. Casting of micro-concrete. (a) Freshly casted cylinders, (b) curing conditions, and (c) capping process.
Infrastructures 08 00056 g009
Figure 10. (a) Compressive strength vs. age of micro-concrete and (b) stress vs. strain curve of M2 samples at 28 days.
Infrastructures 08 00056 g010
Figure 11. Aggregate gradation curve for micro-concrete.
Infrastructures 08 00056 g011
Figure 12. Small-scale reinforcement bars for model structure.
Infrastructures 08 00056 g012
Figure 13. Stress–strain relationship of scaled reinforcement bars. (a) 0.7 mm, (b) 1.9 mm, and (c) 2.2 mm.
Infrastructures 08 00056 g013
Figure 14. Shake table test setup, where A1–A10 shows locations of accelerometers and L1–L5 shows locations of laser displacement sensors.
Infrastructures 08 00056 g014
Figure 15. Loading sequence.
Infrastructures 08 00056 g015
Figure 16. Setup of dummy frames for shake table calibration (L1–L5 = laser displacement sensors and A1–A4, A7–A8 = accelerometers).
Infrastructures 08 00056 g016
Figure 17. Cracks in the improper frame after Run 31.
Infrastructures 08 00056 g017
Figure 18. Close-up view of severely widened cracks in the improper frame after Run 39.
Infrastructures 08 00056 g018
Figure 19. (a) Cracks in the proper frame—Run 62 and (b) complete failure of the improper frame—Run 40.
Infrastructures 08 00056 g019
Figure 20. Hysteresis of the proper and improper frame at important runs.
Infrastructures 08 00056 g020
Figure 21. Response time history of displacement. (a) Run 20 and (b) Run 30.
Infrastructures 08 00056 g021aInfrastructures 08 00056 g021b
Table 1. Classification of tension splices of rebars recommended by ACI 318-19.
Maximum Tensile Bar StressThe Maximum Percent of A s Spliced within the Required Lap Length
50% > 50%
0.5   f y Class AClass B
> 0.5   f y Class BClass B
Table 2. Classification of compression splices of rebars recommended by ACI 318-19.
f c (MPa) f y 414 MPa414 MPa < f y 550 MPa f y > 550 MPa
21 l s c = Larger of
(a) 0.071 f y d b
(b) 300 mm
l s c = Larger of
(a) (0.13 f y 24) d b
(b) 300 mm
l s c = Larger of
(a) (0.13 f y 24) d b
(b) l s t
< 21 l s c = 1.333 × 0.071 f y d b l s c = 1.333 × (0.13 f y − 24) d b l s c = 1.333 × (0.13 f y − 24) d b
Note: d b denotes the diameter of the rebar and l s t denotes the lap splice length in tension.
Table 3. Laws of similarity.
Parameter1/16 Scaled ValueTarget Value
Length1/161/16
Area1/1621/162
Mass1/1631/163
Time1/ 16 1/ 16
Density11
Stress1/161
Strain1/161
Table 4. Estimation of weights of actual and scaled models.
ModelVolume (m3)Total Weight (kg)
Weight of actual size model4.0969830
Weight of scaled model0.0012.4
Table 5. Geometric properties of the model.
Sr. No.ParameterValue
1Height of model450 mm
2Width of model250 mm
3Dimensions of columns30 mm × 30 mm
4Dimensions of beams20 mm × 25 mm
Table 6. Selected mixes.
Mix No.Aggregate-to-Cement RatioWater-to-Cement Ratio
M-13.60.76
M-23.60.72
M-34.250.8
M-440.78
Table 7. Compressive strength (MPa) of all mixes *.
Mix No.7 Days14 Days28 Days
M112.3215.8219.27
M212.5916.2819.89
M38.1811.2214.39
M49.6312.2415.39
* Average of 3 samples.
Table 8. Compressive strength (MPa) of different size cylinders at 14 days *.
Cylinder Diameter
38 mm50 mm75 mm
Average f c (MPa)17.9616.2713.76
* Average of 3 samples.
Table 9. Tensile strength of reinforcement bars *.
Diameter (mm)Stress (MPa)Strain (%)
0.7414.71.51
1.9328.74.32
2.2393.28 5.42
* Average of 4 samples.
Table 10. Properties of shake table (Source: ERS, IIS, The University of Tokyo).
PropertyDescription
Frequency range DC~100 Hz
Maximum load capacity2000 kg
Shake table dimensions1.5 m × 1.5 m
Maximum velocity (XYZ axis)1.1 m/s
Exciting force (XY axis)Sine wave: 2000 kgf
Pulse wave: 3000 kgf
Maximum displacement (XY axis)±100 mm
Maximum acceleration (XY axis)Sine wave: 2.5 G and Pulse wave: 3.7 G (without load)
Sine wave: 1.7 G and Pulse wave: 2.6 G (1000 kg)
Sine wave: 1.2 G and Pulse wave: 1.0 G (2000 kg)
Maximum rotation angle ±15°
Table 11. Maximum displacements by time history analysis.
Sr. No.Frequency (Hz)Maximum Displacement (mm)
(1st Story)(2nd Story)
1600.0650.182
2550.0950.253
3500.2030.522
4450.5591.32
5400.2640.645
6351.9624.504
7300.7781.749
8250.4551.003
9200.3360.730
10150.2780.596
11120.2570.550
12100.2540.541
1380.2400.511
1450.2370.505
1520.1440.306
161.50.0870.184
Table 12. Properties of sinusoidal waves.
FrequencyMax. AmplitudeMax. Velocity (m/s)Max. Displacement (mm)
602.0 g0.0600.11
552.0 g0.0650.14
502.0 g0.100.25
452.0 g0.0800.24
402.0 g0.0860.31
352.0 g0.100.40
302.0 g0.110.52
252.0 g0.140.85
202.0 g0.161.31
152.0 g0.222.30
122.0 g0.273.54
102.0 g0.335.21
82.0 g0.407.91
52.0 g0.6520.6
21.28 g1.079.55
1.50.77 g0.8088.50
Disclaimer/Publisher’s Note: The statements, opinions and data contained in all publications are solely those of the individual author(s) and contributor(s) and not of MDPI and/or the editor(s). MDPI and/or the editor(s) disclaim responsibility for any injury to people or property resulting from any ideas, methods, instructions or products referred to in the content.