


Quality of Automatic Traffic Volume Counting by Cameras and Impact on the Qualitative Indicators of Traffic


Abstract
1. Introduction
- What is the difference in data accuracy between the manual and automatic numbering models?
- What is the impact of the basic data obtained from two models in the determination of qualitative traffic indicators?
- How accurate is the data obtained by automatic counting in conditions of poor visibility at night?
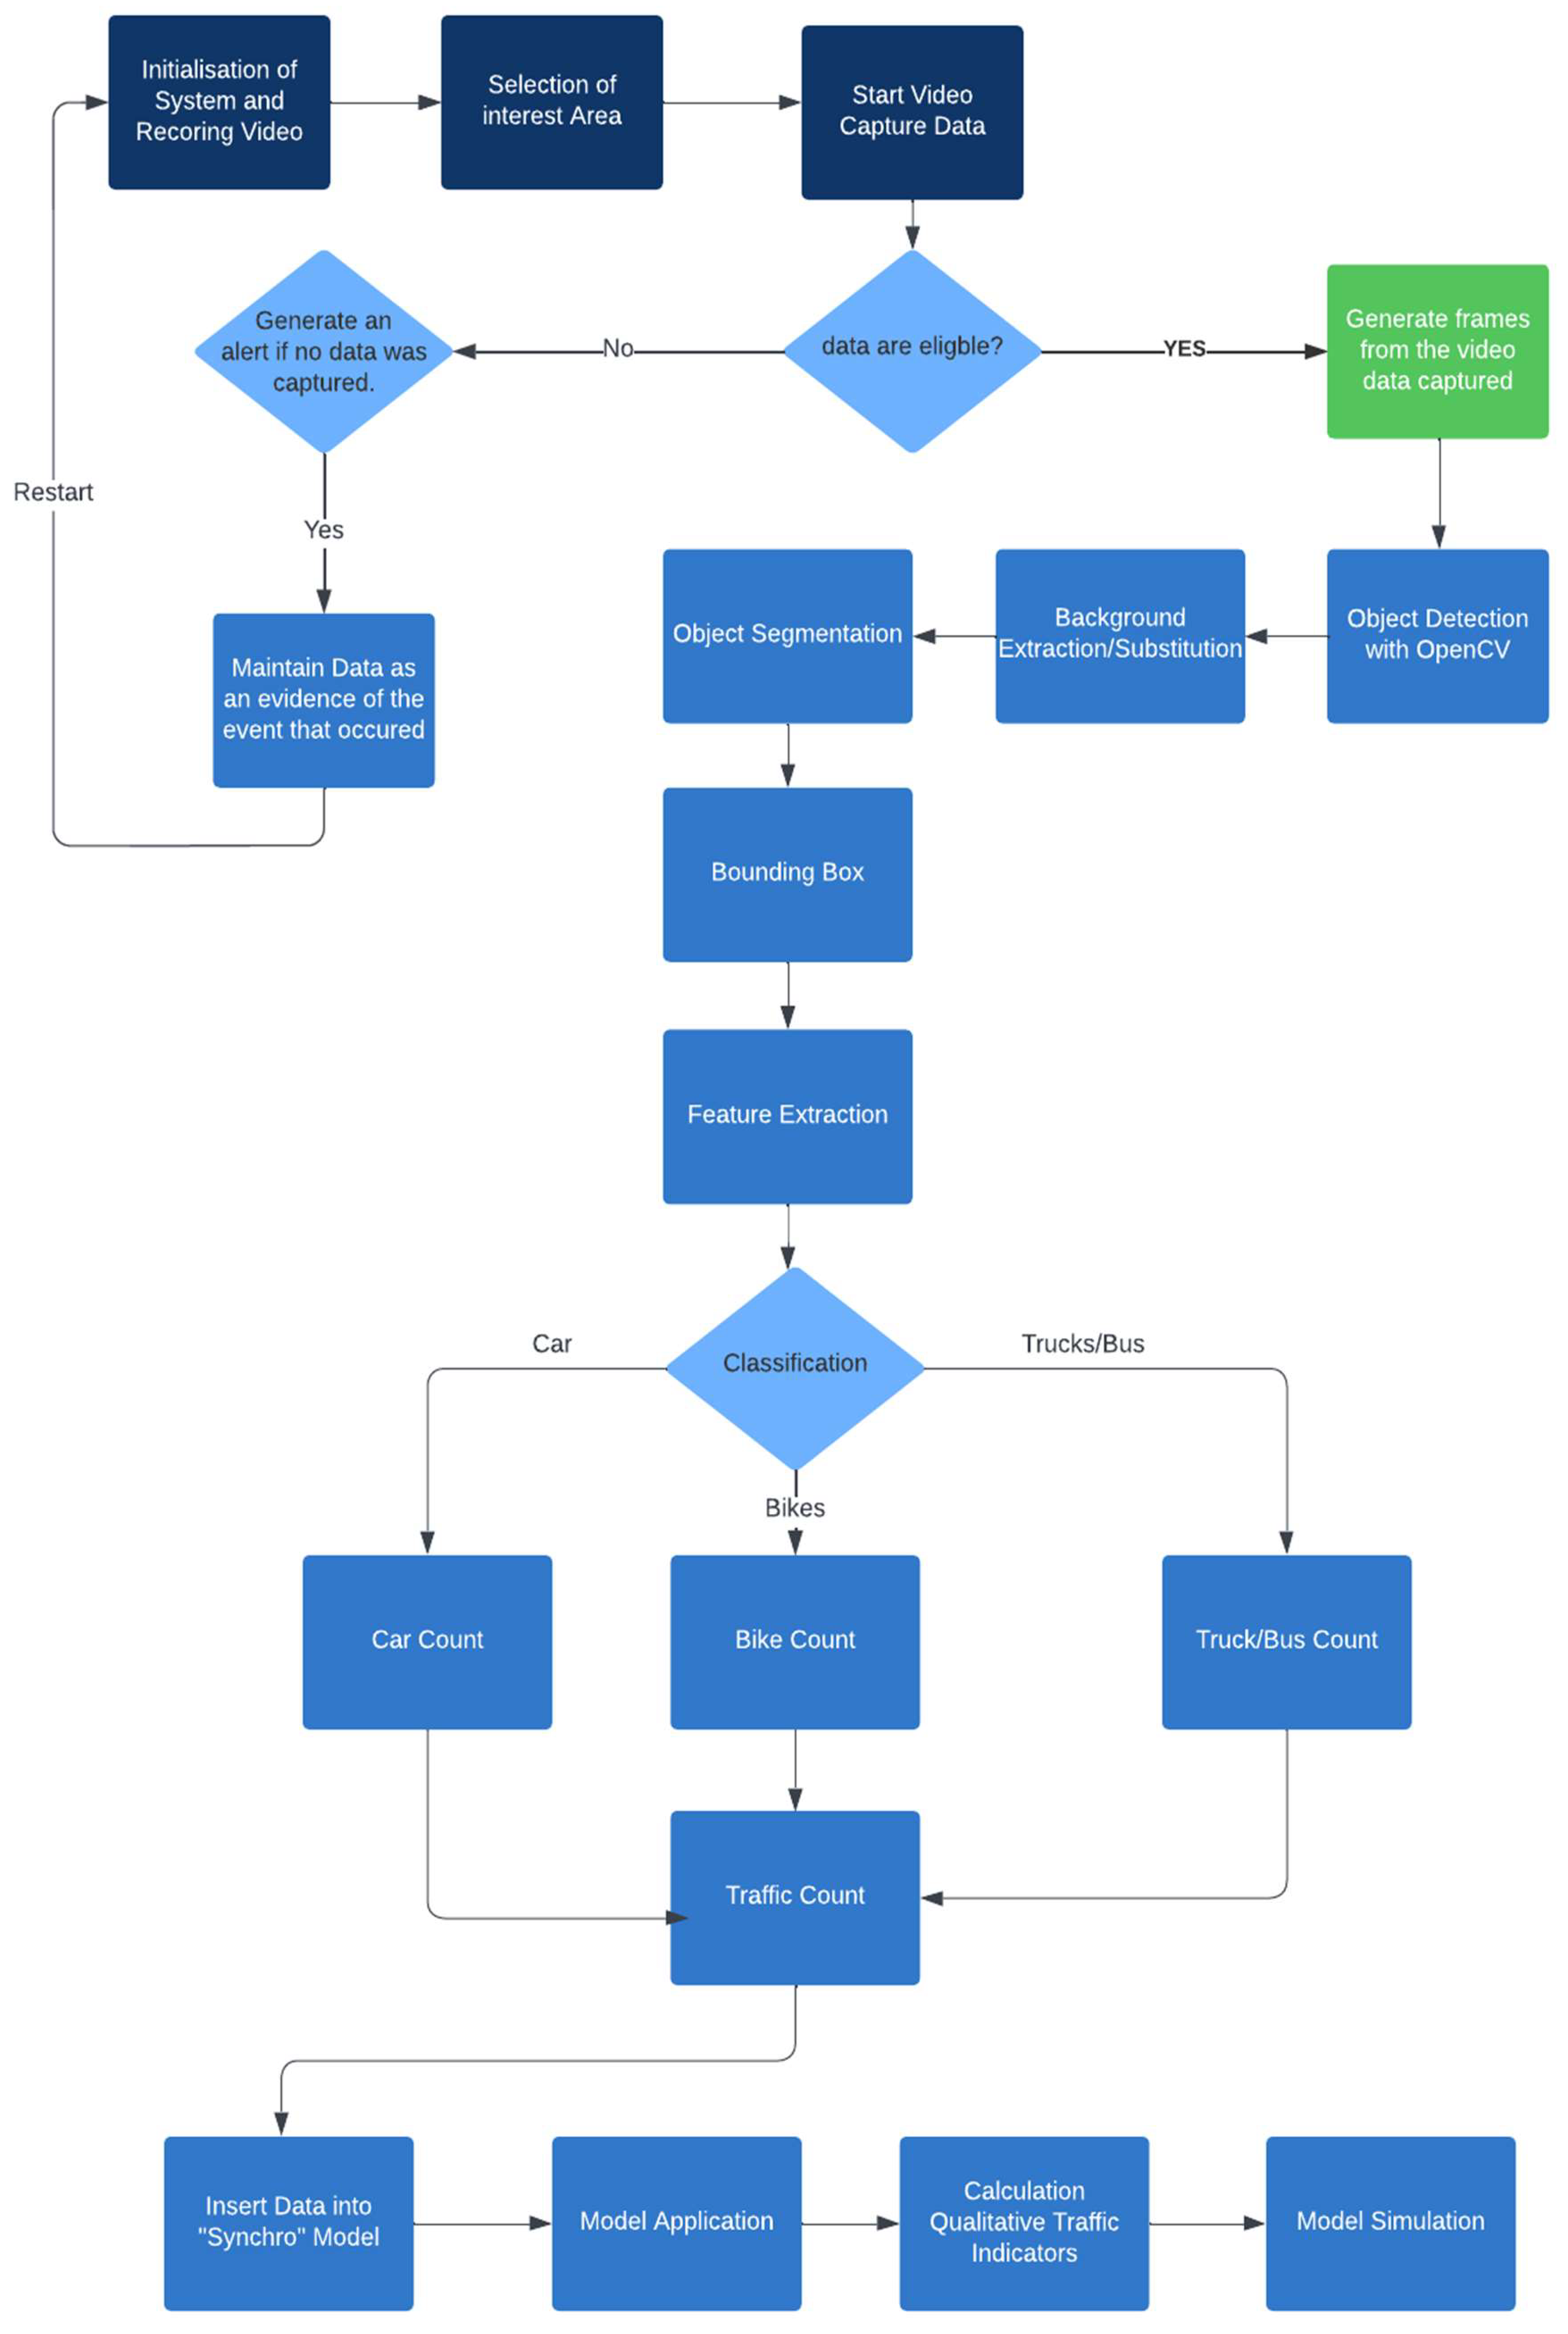
Approach and Methodology
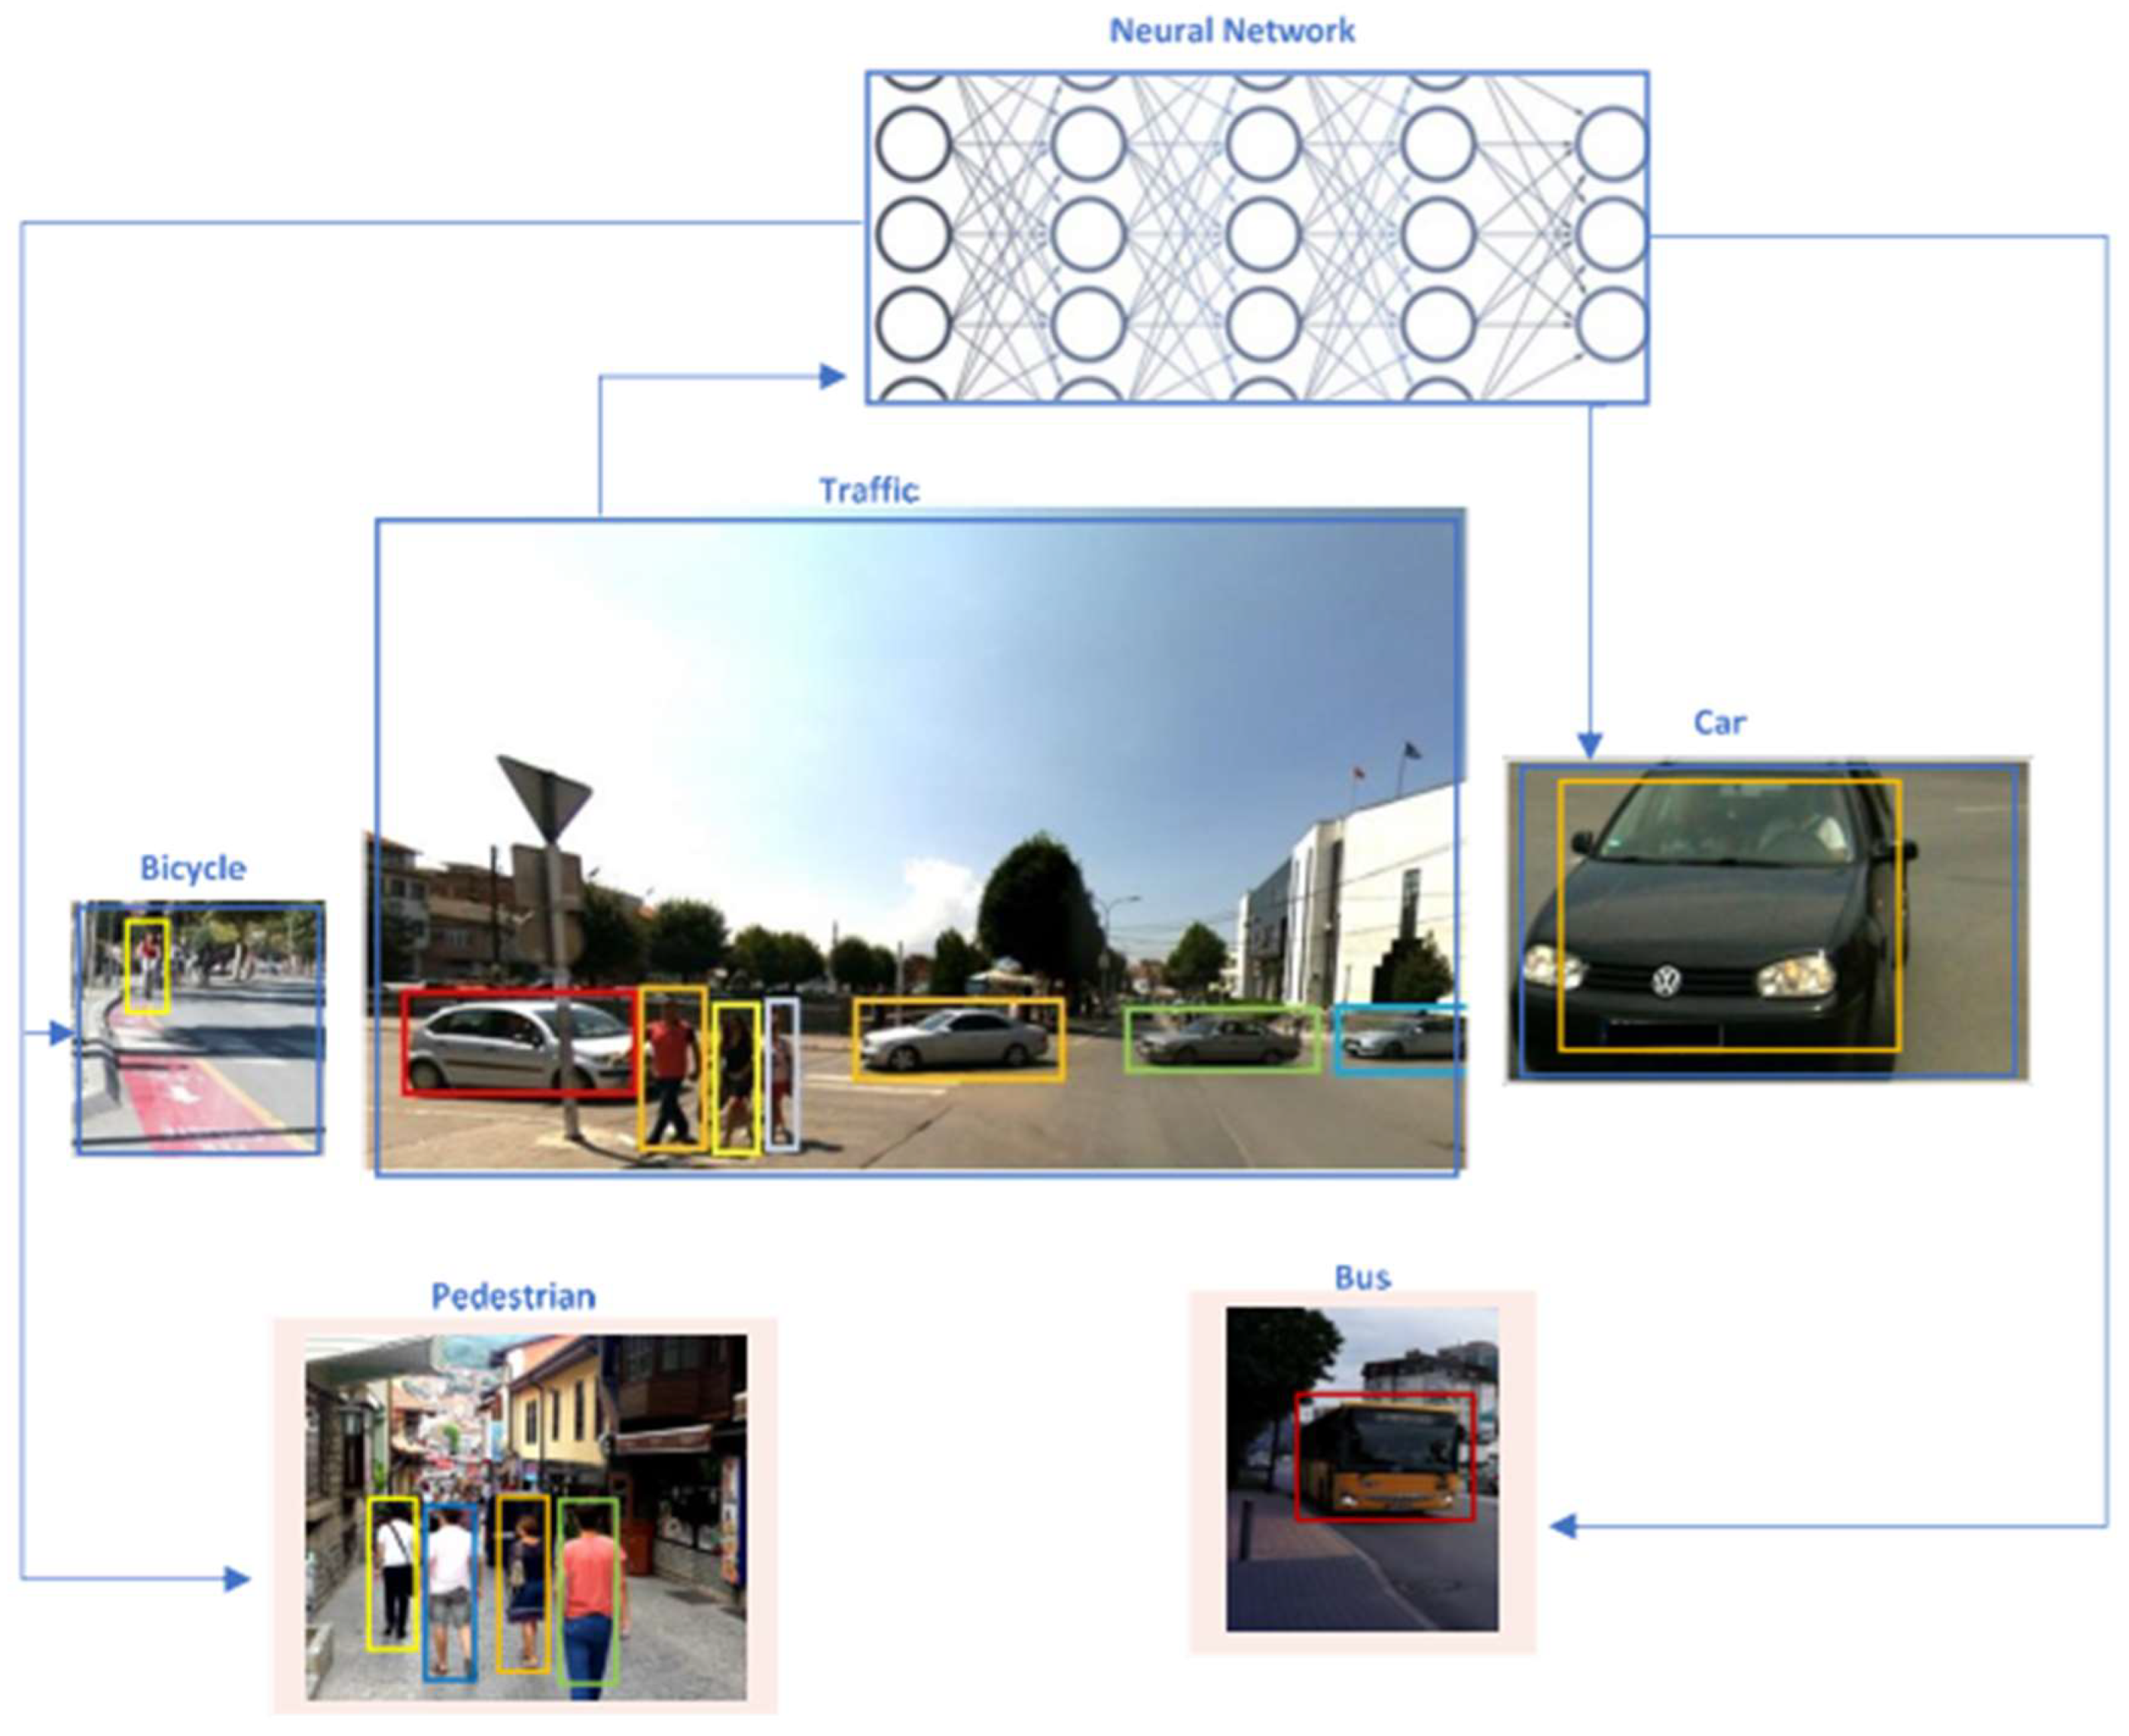
- An encoder takes a frame (image) as input and applies a series of layers and blocks to it in order to generate statistical data that can be used to identify and label the objects within the frame, such as vehicles;
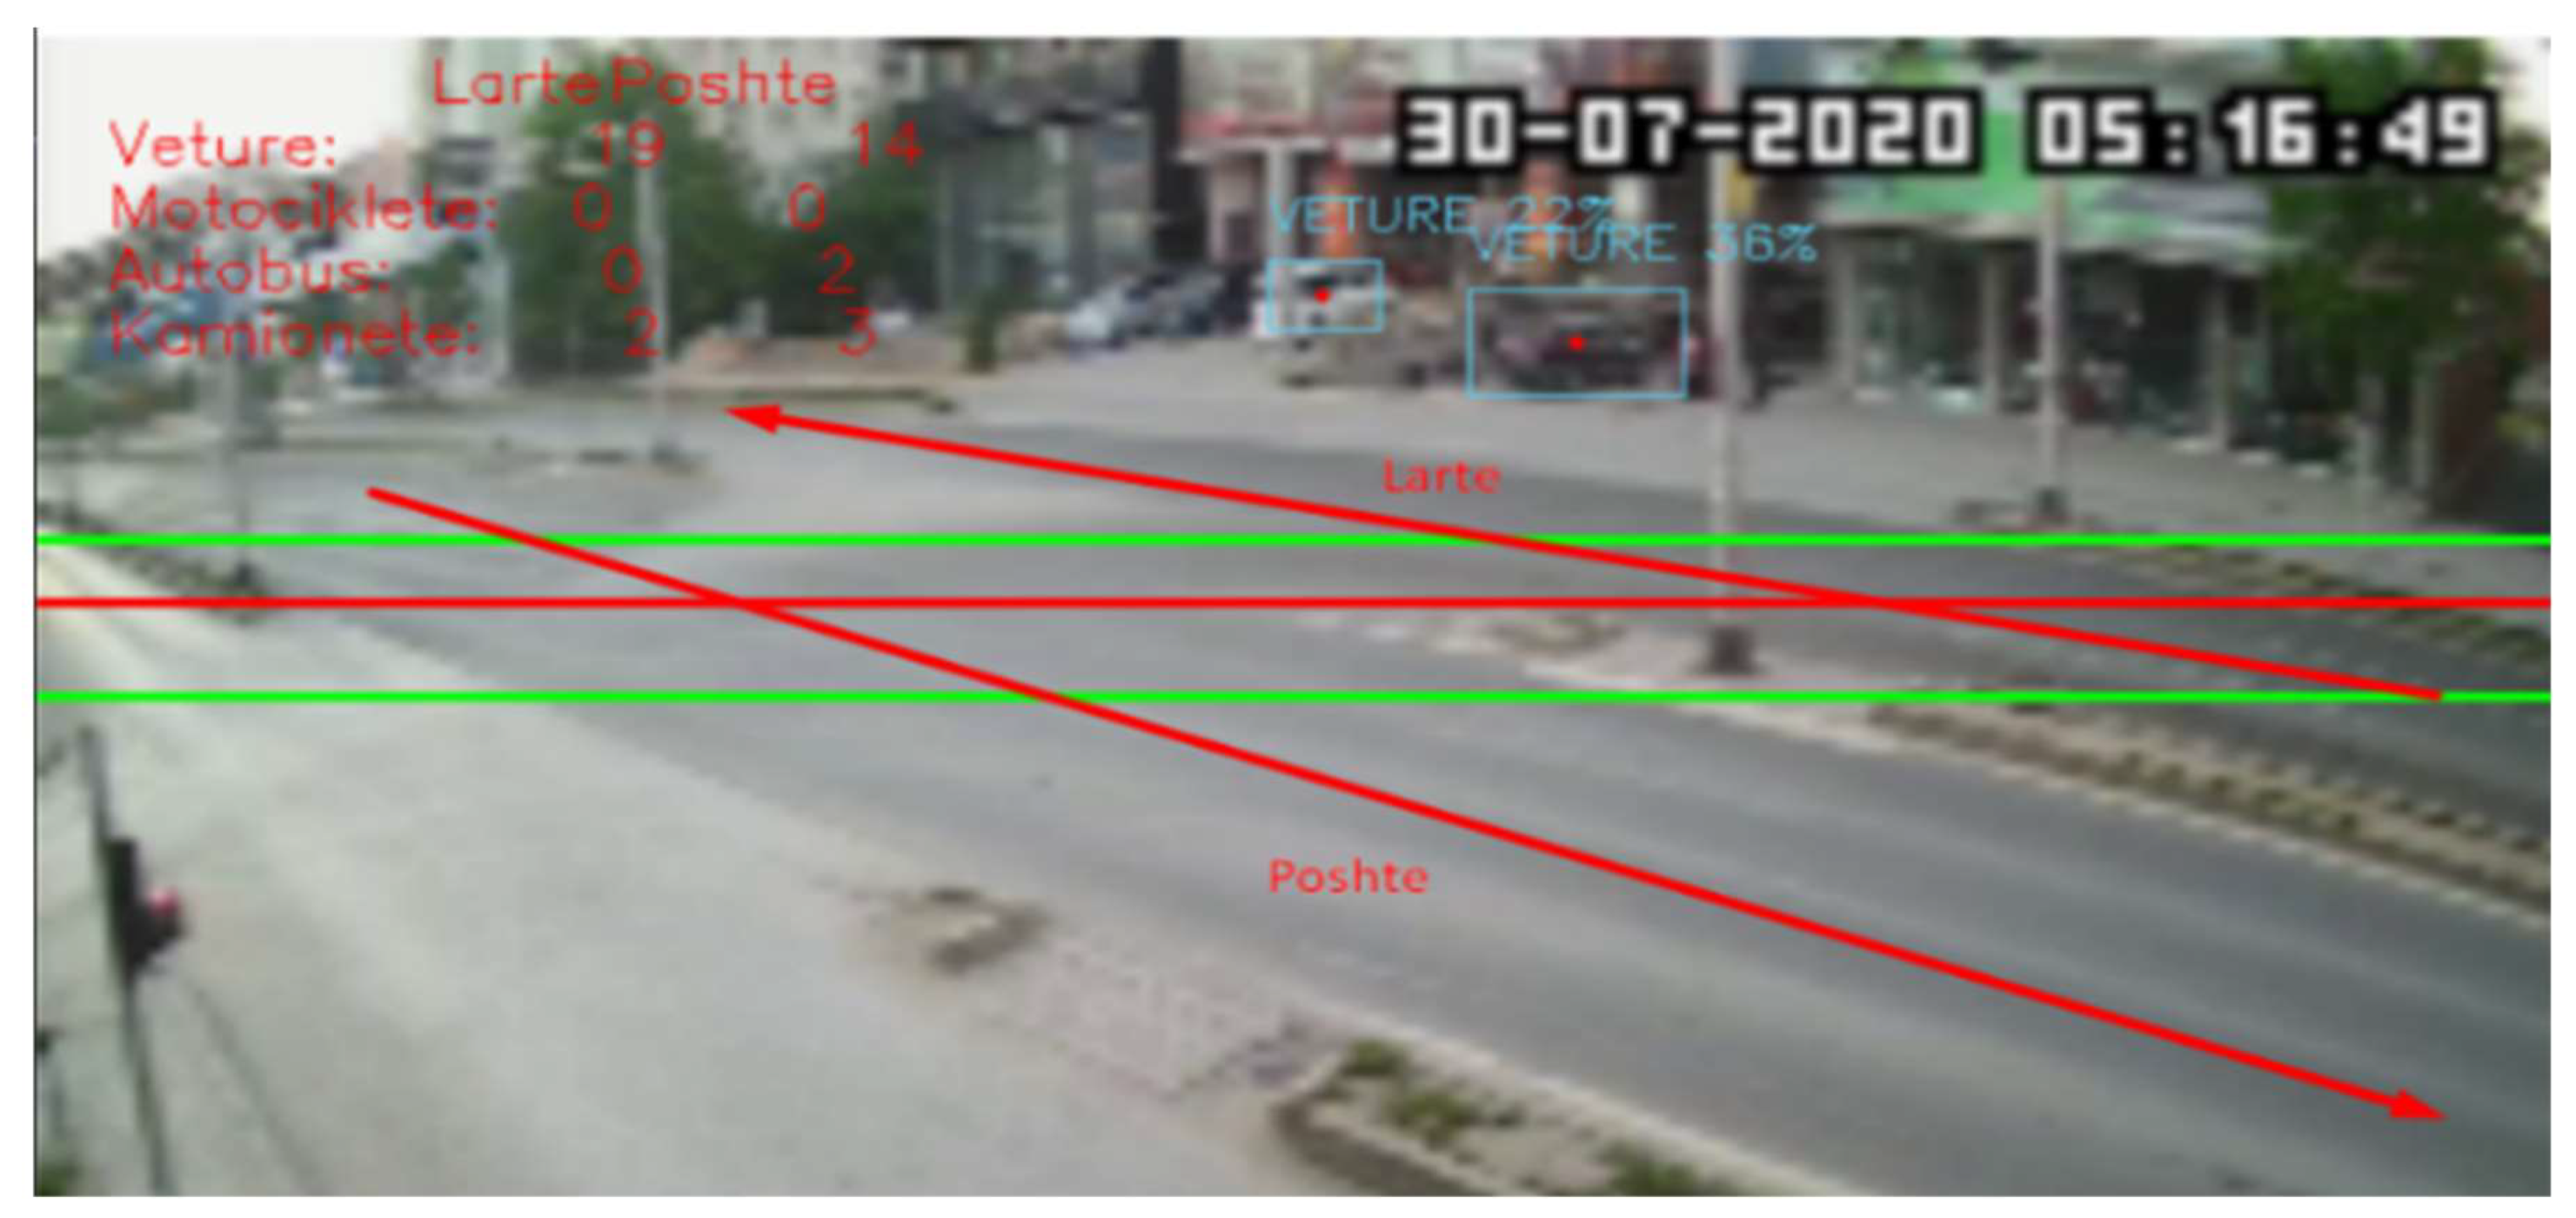
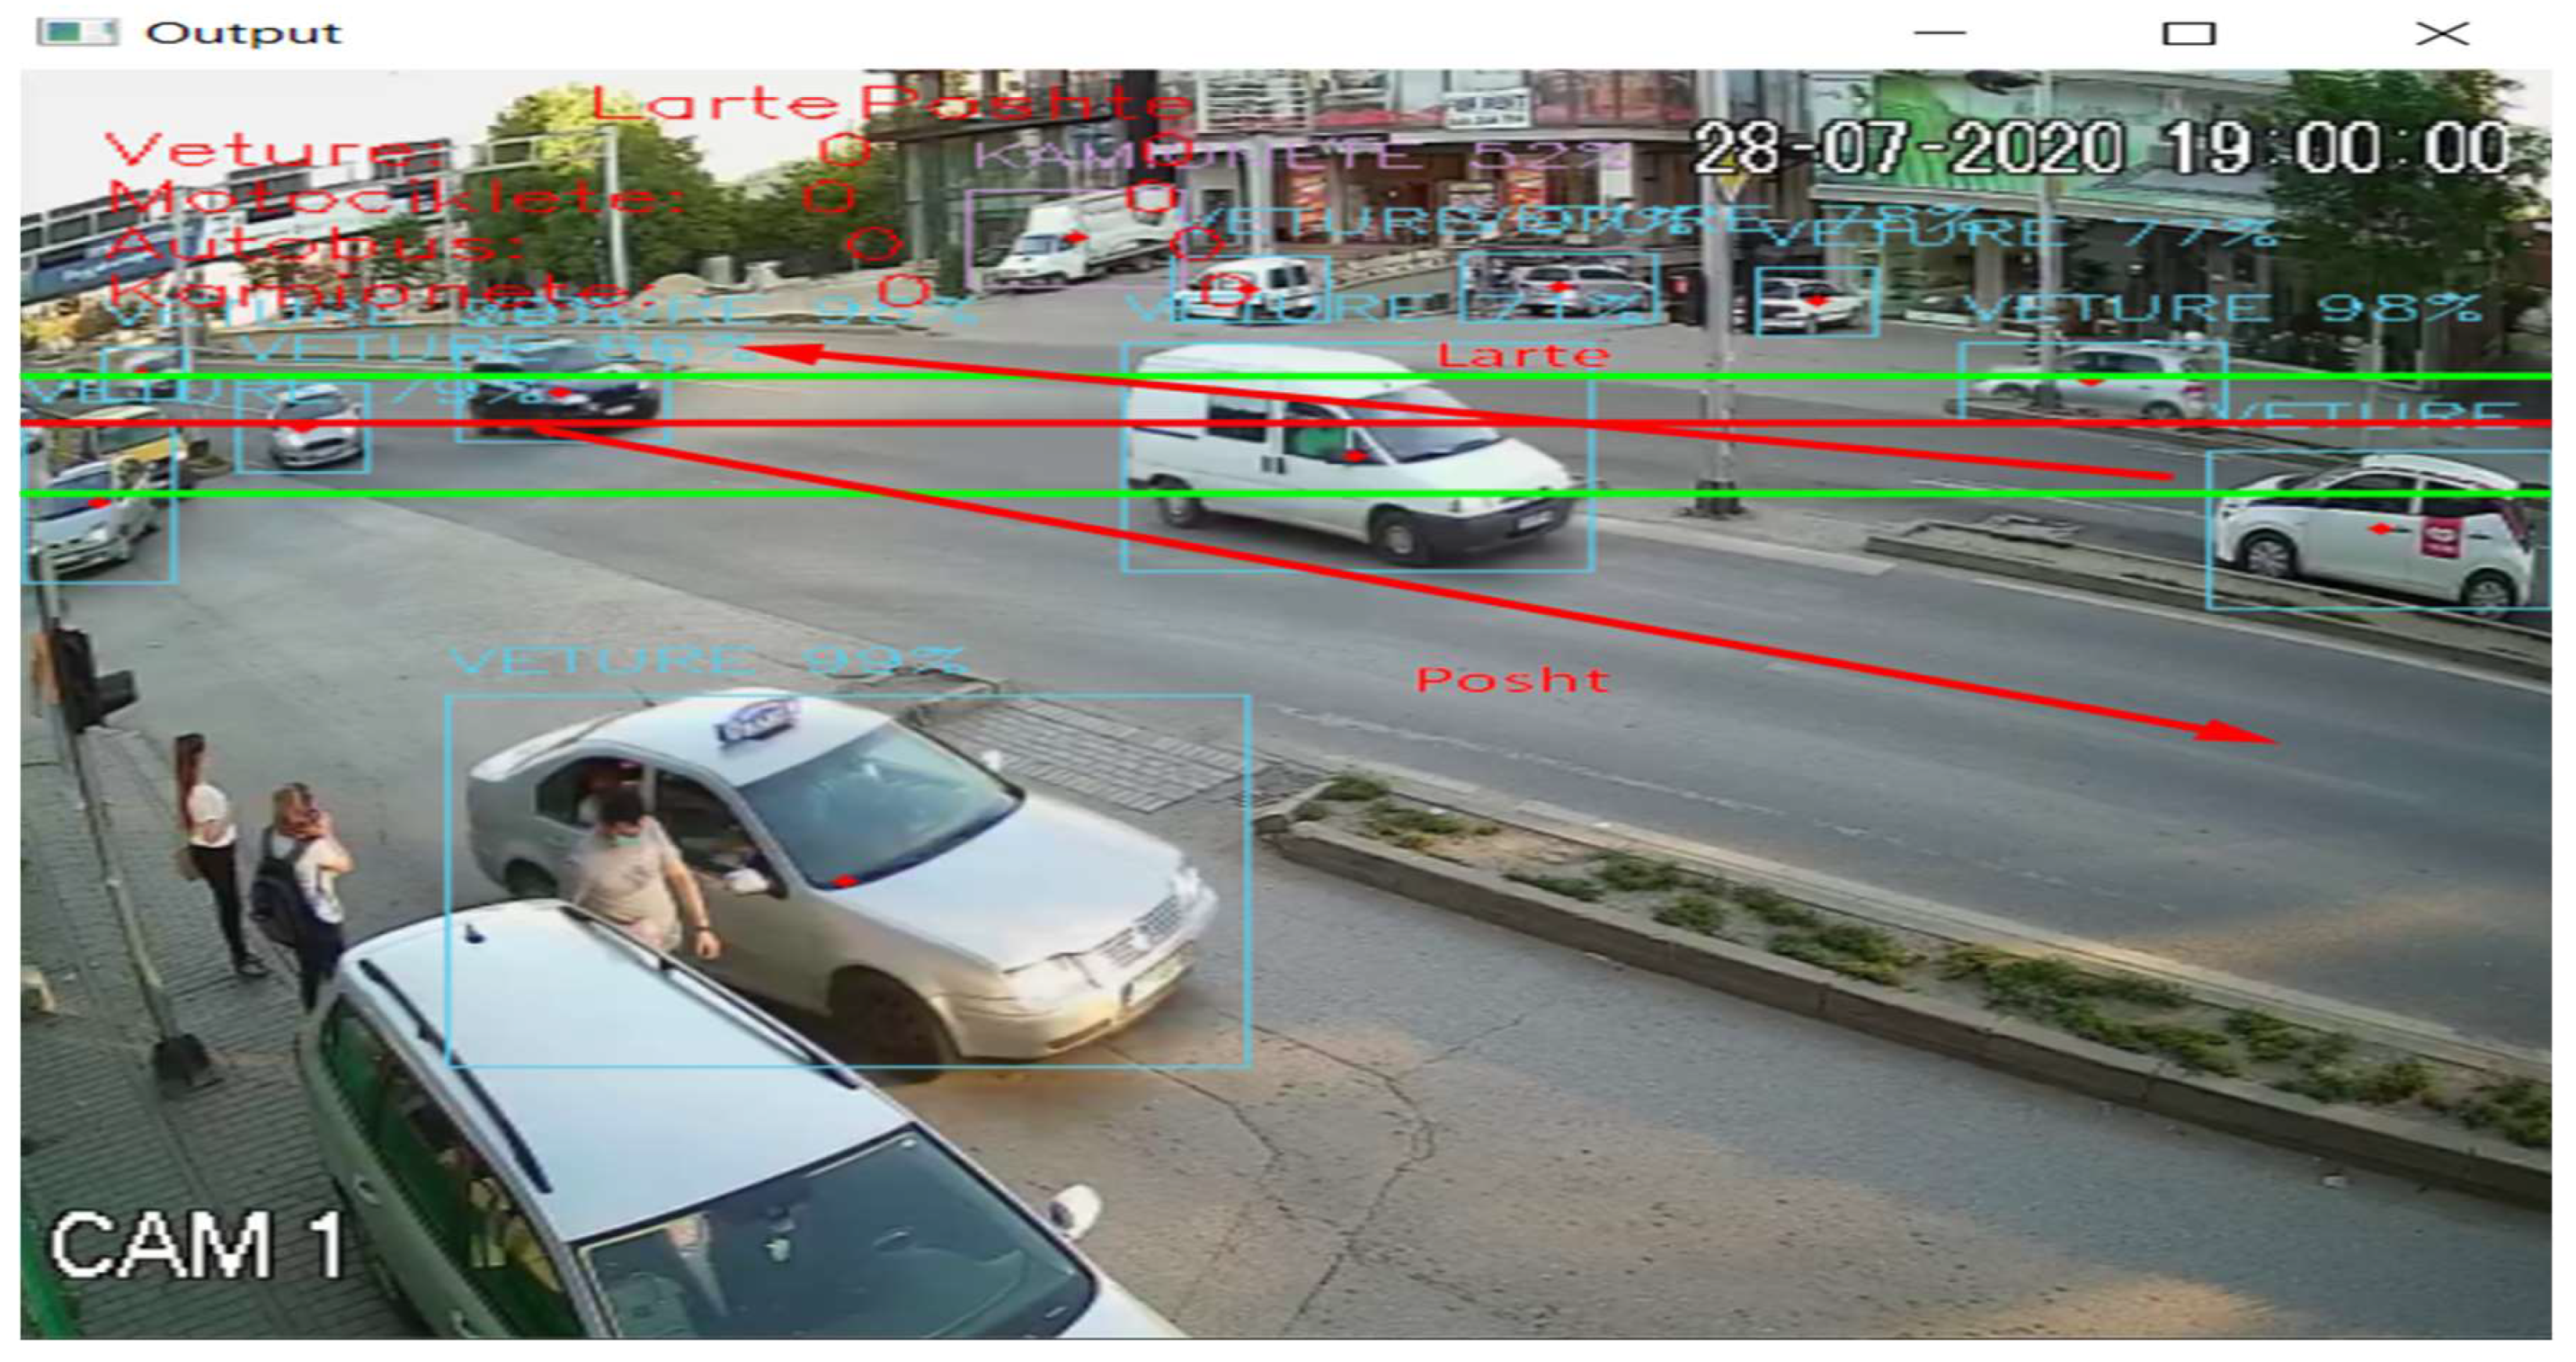
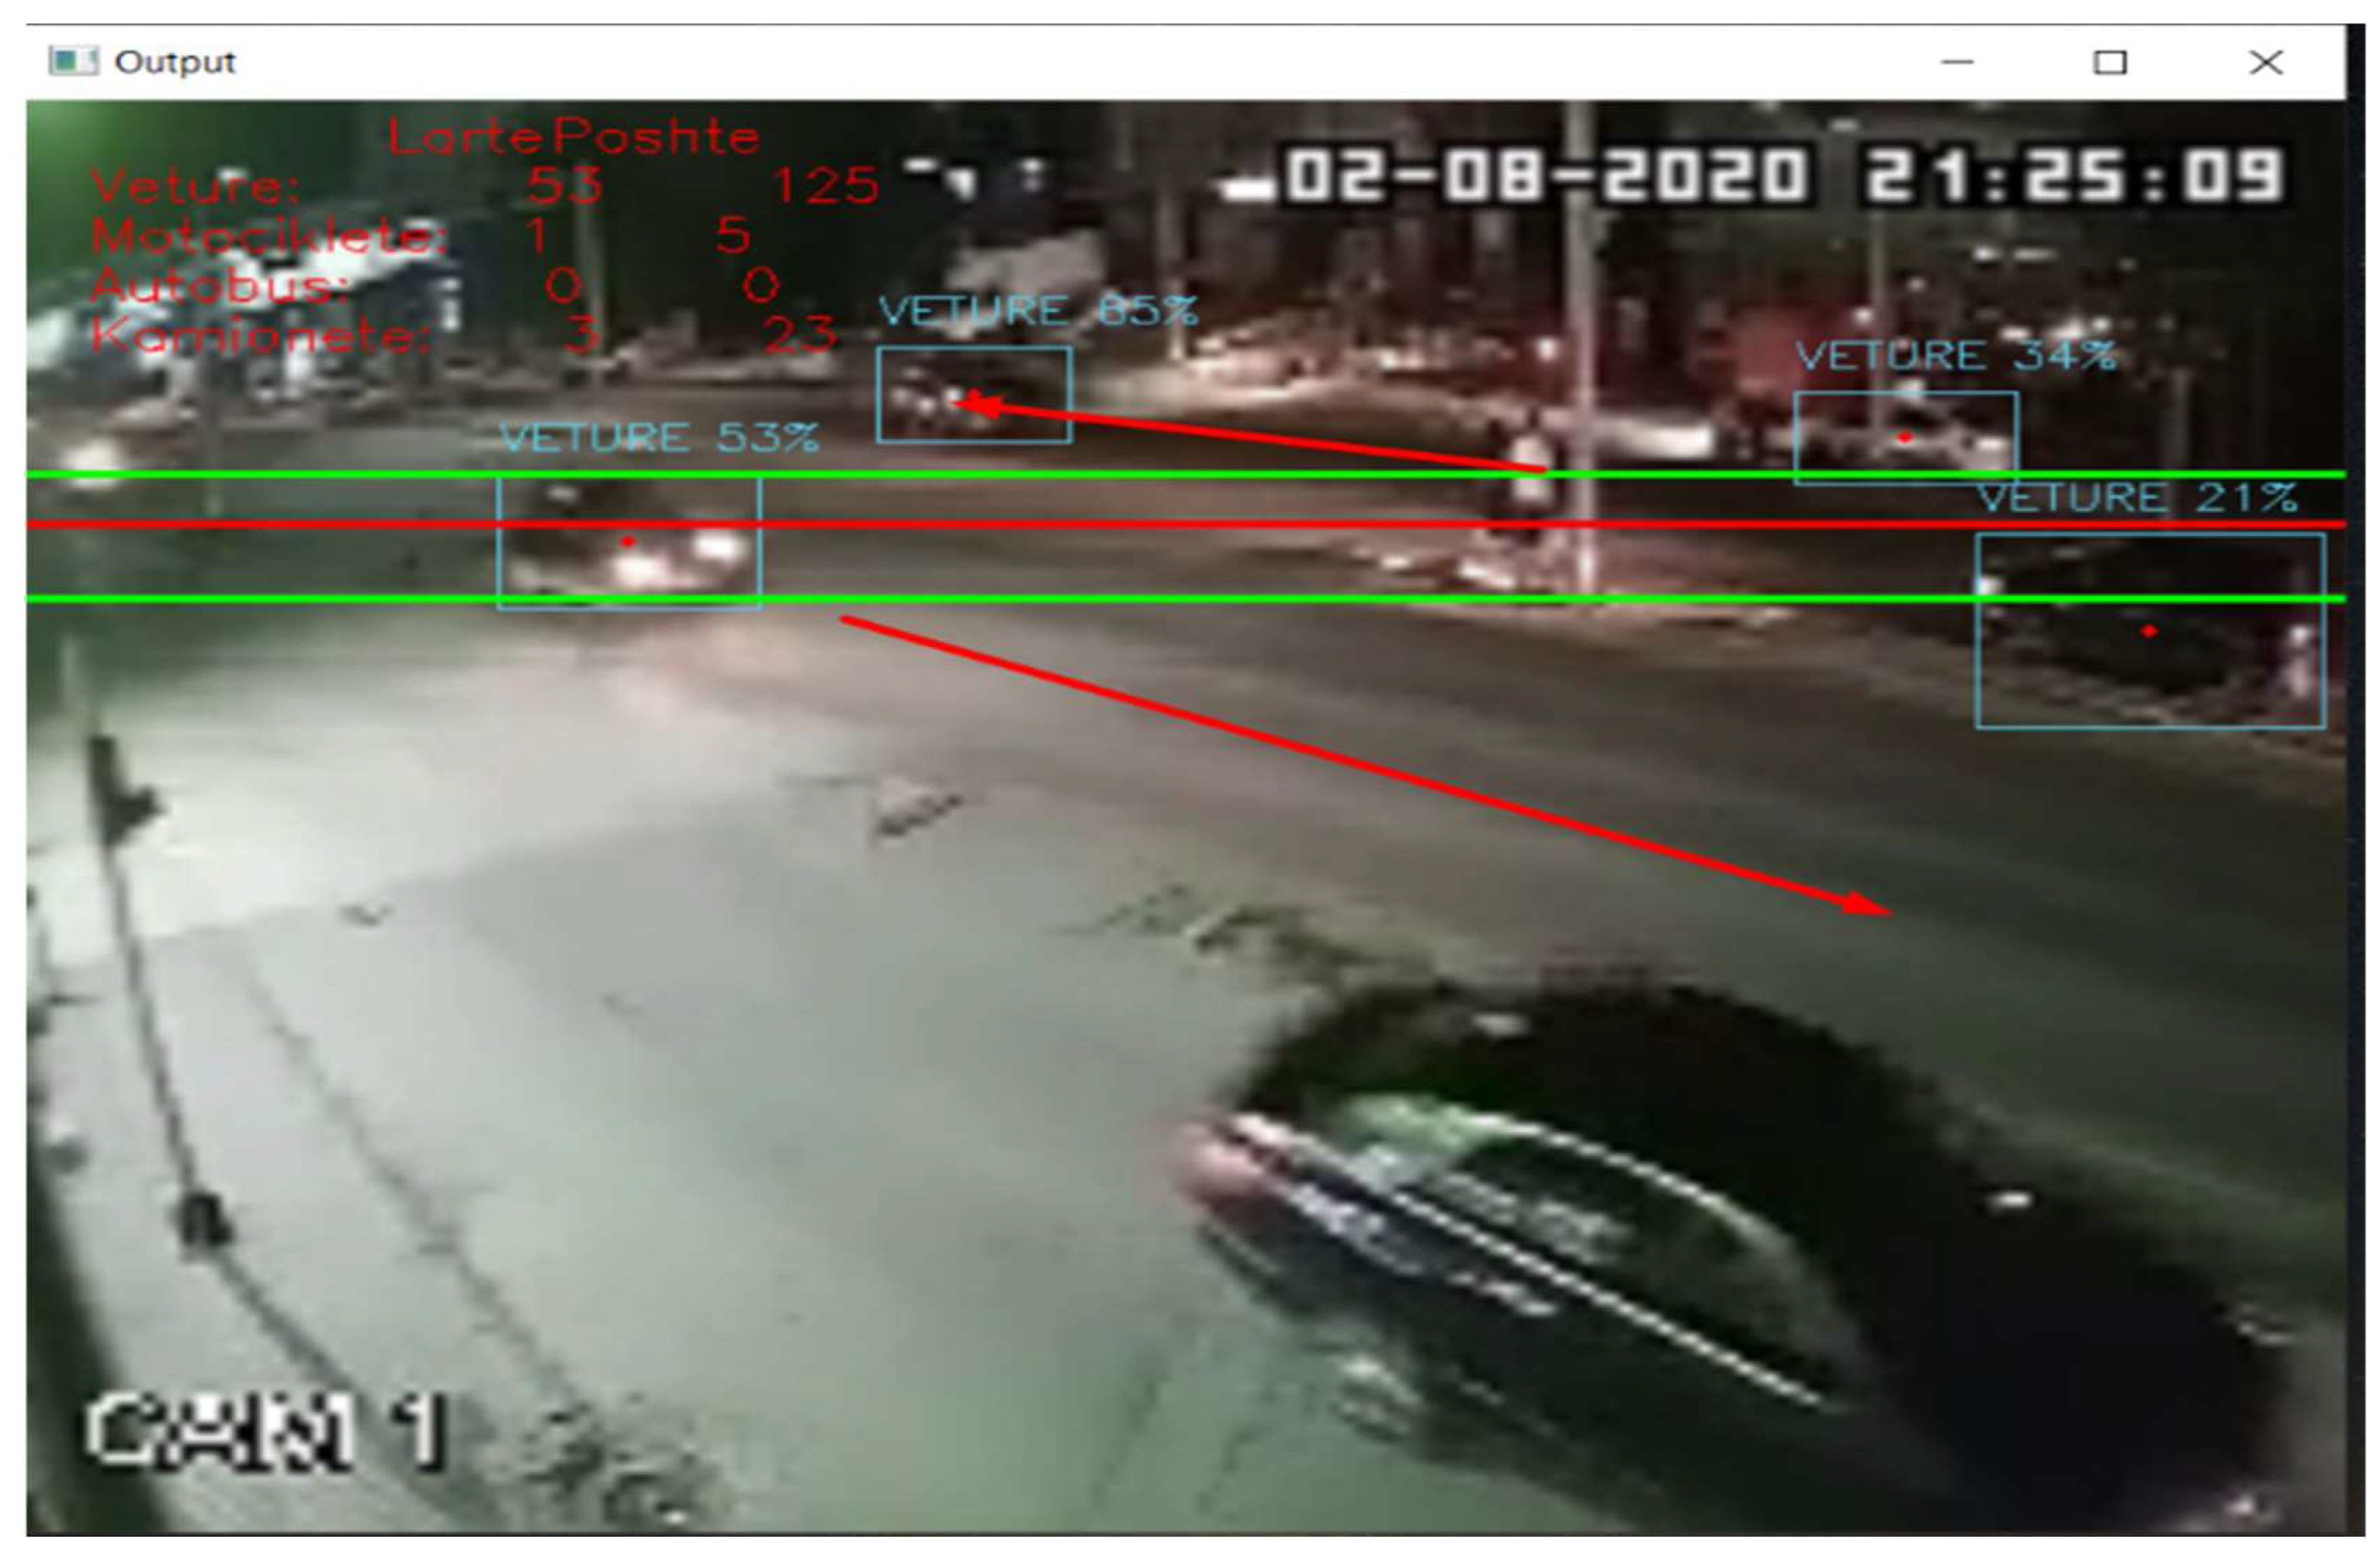
2. Model Design and Automatic Measurements through Cameras
| Algorithm 1: Finding the left of the frame (image). |
| Input: |
| Output: |
| # Finding the position of the vehicle |
| and |
| Algorithm 2: Part of the algorithm for counting and categorizing vehicles during automatic counting through cameras. |
| import cv2 |
| class RealTime(Processing): |
| def __init__(self): |
| super().__init__() |
| def realTime(self): |
| # Set the frame rate of the video capture device |
| cap = cv2.VideoCapture(0) |
| cap.set(cv2.CAP_PROP_FPS, 800) |
| while True: |
| # Read the video frame and resize it |
| ret, frame = cap.read() |
| frame = cv2.resize(frame, (self.width, self.height)) |
| # Create a blob from the image |
| blob = cv2.dnn.blobFromImage(frame, self.scale, (self.width, self.height), (self.mean, self.mean, self.mean), swapRB=True, crop=False) |
| # Set the input of the neural network |
| self.net.setInput(blob) |
| # Get the output layers of the network |
| layers = self.net.getUnconnectedOutLayersNames() |
| # Feed the data to the network and get the output |
| outs = self.net.forward(layers) |
| # Call the postProcess() function from the Processing class |
| objects = self.postProcess(frame, outs) |
| # Draw the counting texts in the frame |
| for obj in objects: |
| label = obj [0] |
| confidence = obj |
| xmin = obj [2] |
| ymin = obj [3] |
| xmax = obj [4] |
| ymax = obj [5] |
| cv2.rectangle(frame, (xmin, ymin), (xmax, ymax), (0, 255, 0), 2) |
| cv2.putText(“Kamionete, Autobus, Kamion, Veture, Biciklete, kem-besore “, frame, label + “ “ + str(round(confidence, 2)), (xmin, ymin–5), cv2.FONT_HERSHEY_SIMPLEX, 0.5, (0, 255, 0), 2) |
| # Write the counting data into a csv file |
| self.writeData(objects) |
| # Show the frame |
| cv2.imshow(“Real Time”, frame) |
| # Press ‘q’ to quit |
| if cv2.waitKey(1) & 0xFF == ord(‘q’): |
| break |
| # Release the video capture device and destroy all windows |
| cap.release() |
| cv2.destroyAllWindows() |
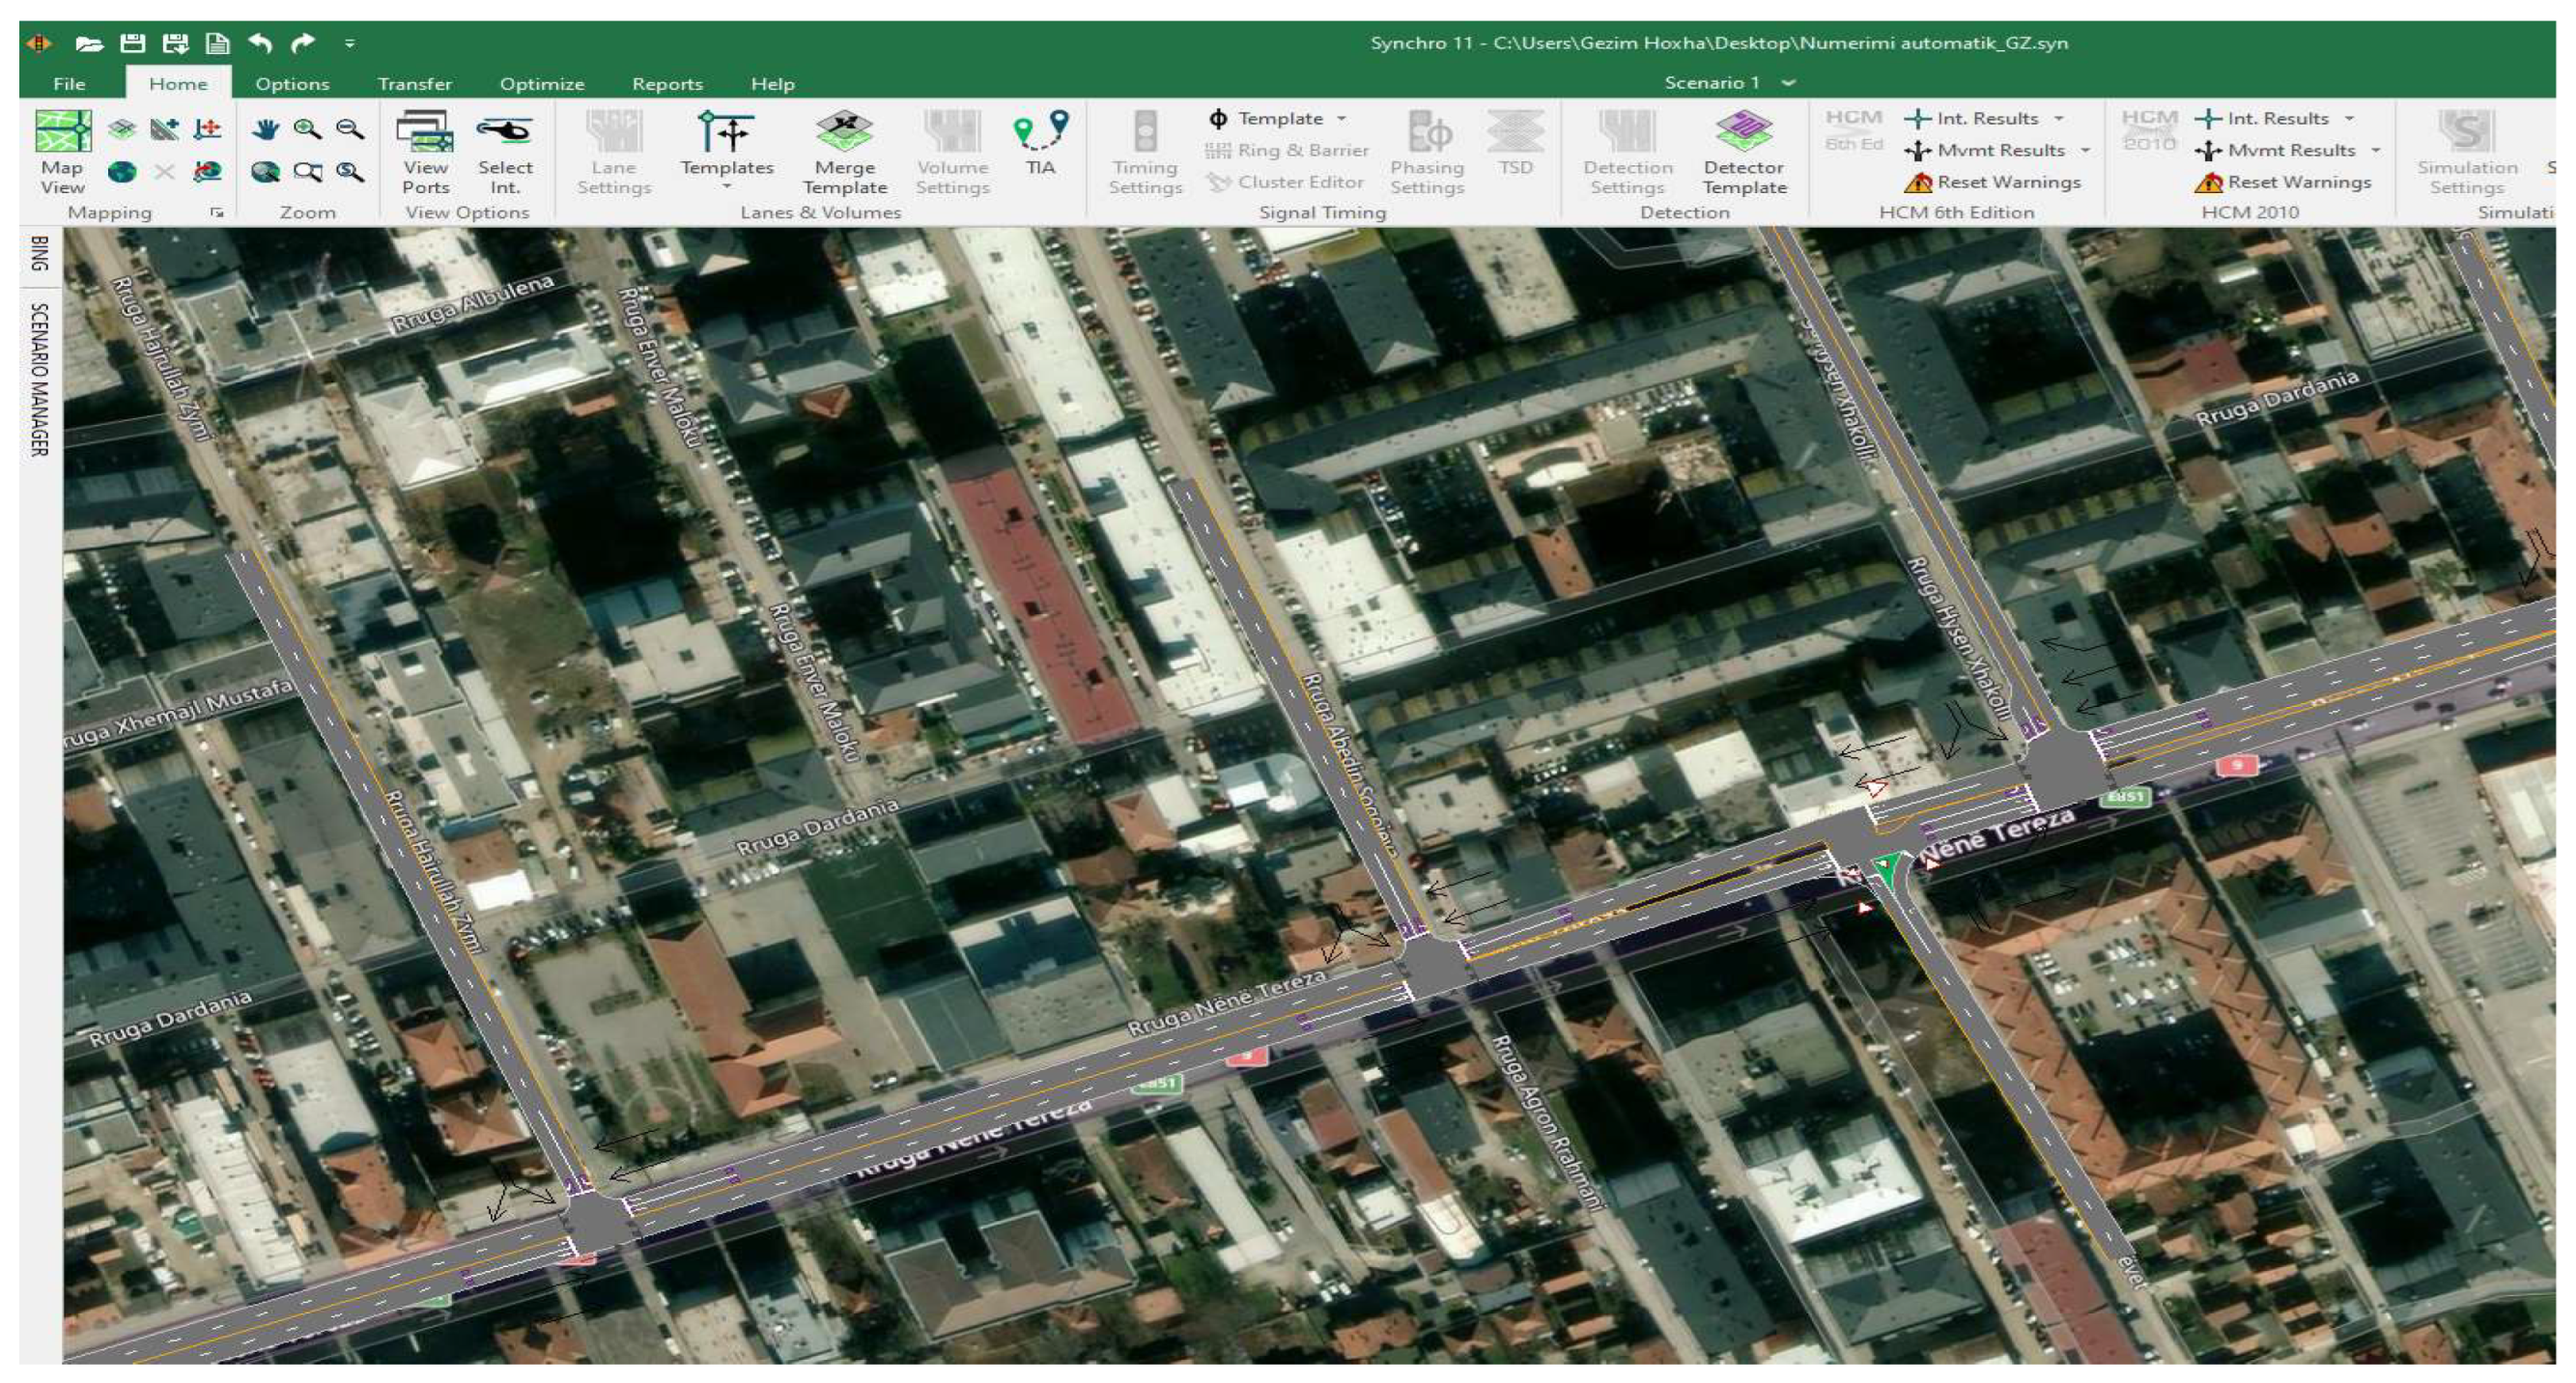
3. Impact on Qualitative Traffic Indicators
4. Conclusions
Author Contributions
Funding
Data Availability Statement
Conflicts of Interest
Abbreviations
| LOS | level of service |
| N9 | national road of Kosovo |
| CNN | convolutional neural networks |
| Blob | binary large object |
| v/s | the highest flow ratio for a given signal phase |
| v/c | volume capacity ratio |
References
- Gëzim, H.; Ahmet, S.; Ramë, L.; Xhevahir, B. Mathematical Model for Velocity Calculation of Three Types of Vehicles in the Case of Pedestrian Crash. Stroj. Časopis-J. Mech. Eng. 2018, 68, 95–110. [Google Scholar] [CrossRef]
- Hoxha, G. Urban Mobility; Dispensë për Përdorim të Brendshëm: Prishtinë, Kosovo, 2022. [Google Scholar]
- Dinh, H.; Tang, H. Simple method for camera calibration of roundabout traffic scenes using a single circle. IET Intell. Transp. Syst. 2014, 8, 175–182. [Google Scholar] [CrossRef]
- Vehicle Counting, Classification & Detection using OpenCV & Python. Available online: https://techvidvan.com/tutorials/opencv-vehicle-detection-classification-counting (accessed on 5 January 2023).
- Sonnleitner, E.; Barth, O.; Palmanshofer, A.; Kurz, M. Traffic, Measurement and Congestion Detection Based on Real-Time Highway Video Data. Appl. Sci. 2020, 10, 6270. [Google Scholar] [CrossRef]
- Abdelwahab, M.A. Fast approach for efficient vehicle counting. Electron. Lett. 2019, 55, 20–22. [Google Scholar] [CrossRef]
- Zheng, L.; Li, J. Application of Fast P2P Traffic Recognition Technology Based on Decision Tree in the Detection of Network Traffic Data. J. Electr. Comput. Eng. 2022, 2022, 8320049. [Google Scholar] [CrossRef]
- Subedi, S.; Tang, H. Development of a multiple-camera 3D vehicle tracking system for traffic data collection at intersections. IET Intell. Transp. Syst. 2018, 13, 614–621. [Google Scholar] [CrossRef]
- Gidaris, S.; Komodakis, N. Object detection via a multi-region & semantic segmentation-aware CNN model. In Proceedings of the IEEE International Conference on Computer Vision, Las Condes, Chile, 11–18 December 2015. [Google Scholar]
- Du, J. Understanding of object detection based on CNN family and YOLO. J. Phys. Conf. Ser. 2018, 1004, 012029. [Google Scholar] [CrossRef]
- Chandra, A.M.; Rawat, A. A Review on YOLO (You Look Only One)-An Algorithm for Real Time Object Detection. J. Eng. Sci. 2020, 11, 554–557. [Google Scholar]
- Hoxha, G.; Shala, A.; Likaj, R. Vehicle Speed Determination in Case of Road Accident by Software Method and Comparing of Results with the Mathematical Model. Stroj. Časopis-J. Mech. Eng. 2017, 67, 51–60. [Google Scholar] [CrossRef]
- Chen, Y.; Lu, J. Multi-Loop Vehicle-Counting Method under Gray Mode and RGB Mode. Appl. Sci. 2021, 11, 6831. [Google Scholar] [CrossRef]
- Harikrishnan, P.M.; Thomas, A.; Nisha, J.S.; Gopi, V.P.; Palanisamy, P. Pixel matching search algorithm for counting moving vehicle in highway traffic videos. Multimed. Tools Appl. 2020, 80, 3153–3172. [Google Scholar]
- Rosas-Arias, L.; Portillo-Portillo, J.; Hernandez-Suarez, A.; Olivares-Mercado, J.; Sanchez-Perez, G.; Toscano-Medina, K.; Perez-Meana, H.; Orozco, A.L.S.; Villalba, L.J.G. Vehicle counting in video sequences: An incremental subspace learning approach. Sensors 2019, 19, 2848. [Google Scholar] [CrossRef] [PubMed]
- YOLOv4 vs YOLOv4-Tiny. Available online: https://medium.com/analytics-vidhya/yolov4-vs-yolov4-tiny-97932b6ec8ec (accessed on 5 January 2023).
- Ojagh, S.; Cauteruccio, F.; Terracina, G.; Liang, S.H. Enhanced air quality prediction by edge-based spatiotemporal data preprocessing. Comput. Electr. Eng. 2021, 96, 107572. [Google Scholar] [CrossRef]
- Yao, J.; Cai, D.; Fan, X.; Li, B. Improving YOLOv4-Tiny’s Construction Machinery and Material Identification Method by Incorporating Attention Mechanism. Mathematics 2022, 10, 1453. [Google Scholar] [CrossRef]
- Fredianelli, L.; Carpita, S.; Bernardini, M.; Del Pizzo, L.G.; Brocchi, F.; Bianco, F.; Licitra, G. Traffic flow detection using camera images and machine learning methods in ITS for noise map and action plan optimization. Sensors 2022, 22, 1929. [Google Scholar] [CrossRef] [PubMed]


| Direction | Car | Motorcycle | Bus | Trucks | Total |
|---|---|---|---|---|---|
| Time period: 05:00–05:15 | |||||
| Up | 19 | 0 | 0 | 2 | 21 |
| Down | 14 | 0 | 2 | 3 | 19 |
| Total | 33 | 0 | 2 | 5 | 40 |
| Direction | Car | Motorcycle | Bus | Trucks | Total |
|---|---|---|---|---|---|
| Time period: 19:00–19:15 | |||||
| Up | 149 | 0 | 0 | 9 | 158 |
| Down | 224 | 1 | 7 | 22 | 254 |
| Total | 373 | 1 | 7 | 31 | 412 |
| Direction | Car | Motorcycle | Bus | Trucks | Total |
|---|---|---|---|---|---|
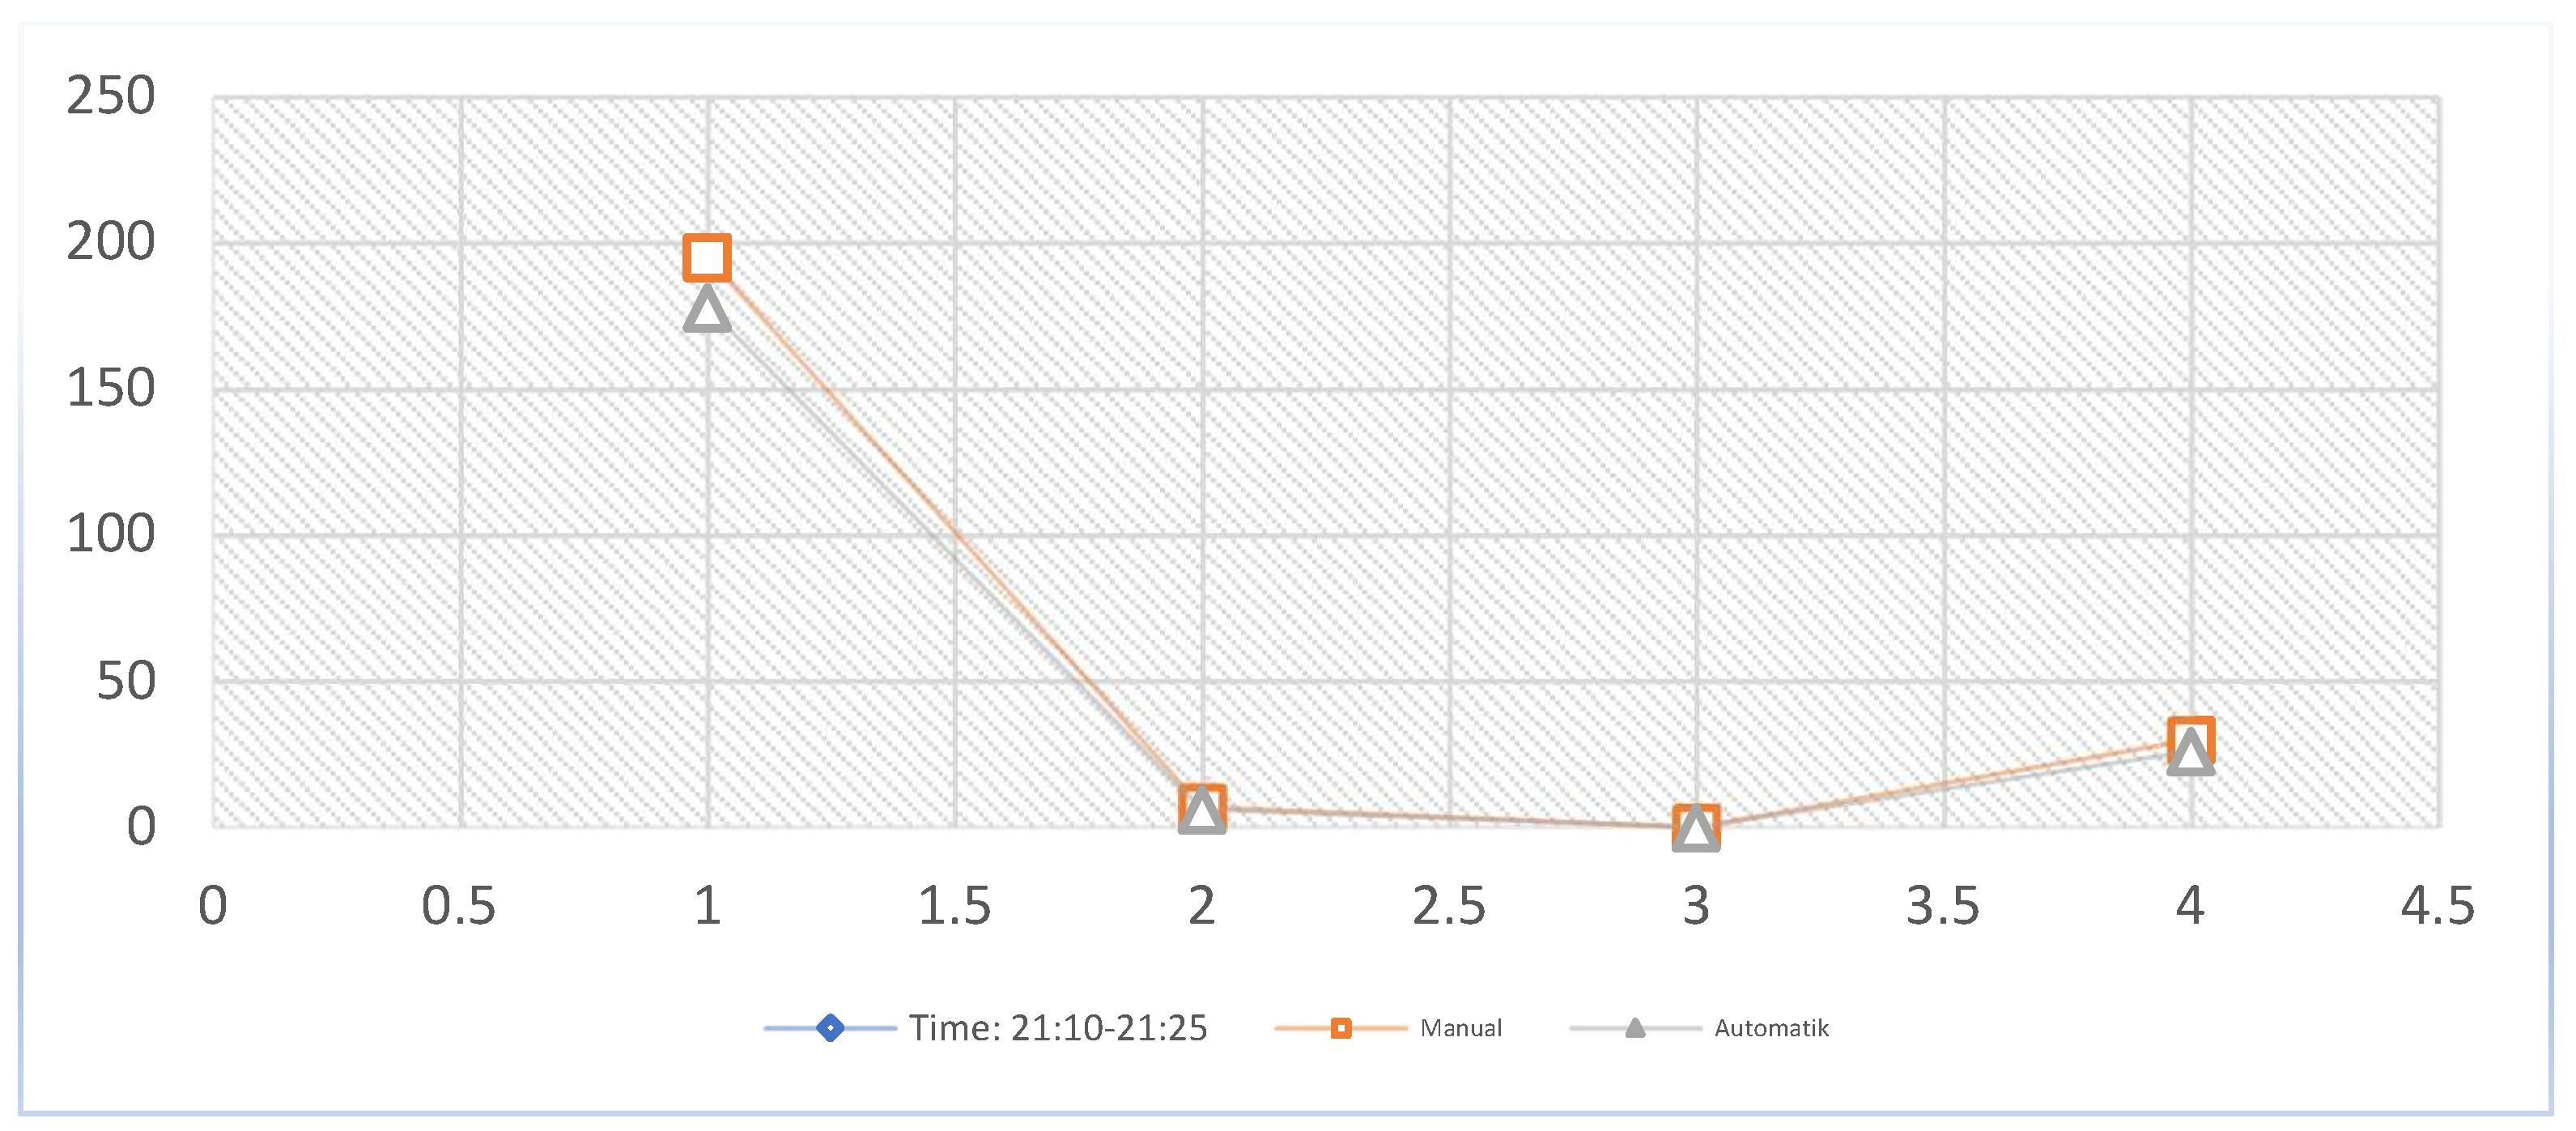
| Time Period: 21:00–21:15 | |||||
| Up | 53 | 1 | 0 | 3 | 57 |
| Down | 125 | 5 | 2 | 23 | |
| Total | 178 | 6 | 2 | 26 | 212 |
| Direction | Car | Motorcycle | Bus | Trucks | Average Difference in Counting | Processing Time of the Data |
|---|---|---|---|---|---|---|
| Time Period: 21:10–21:25 | ||||||
| Manual | 195 | 7 | 0 | 30 | 9.43% | 15 min |
| Automatic | 178 | 6 | 2 | 26 | ||
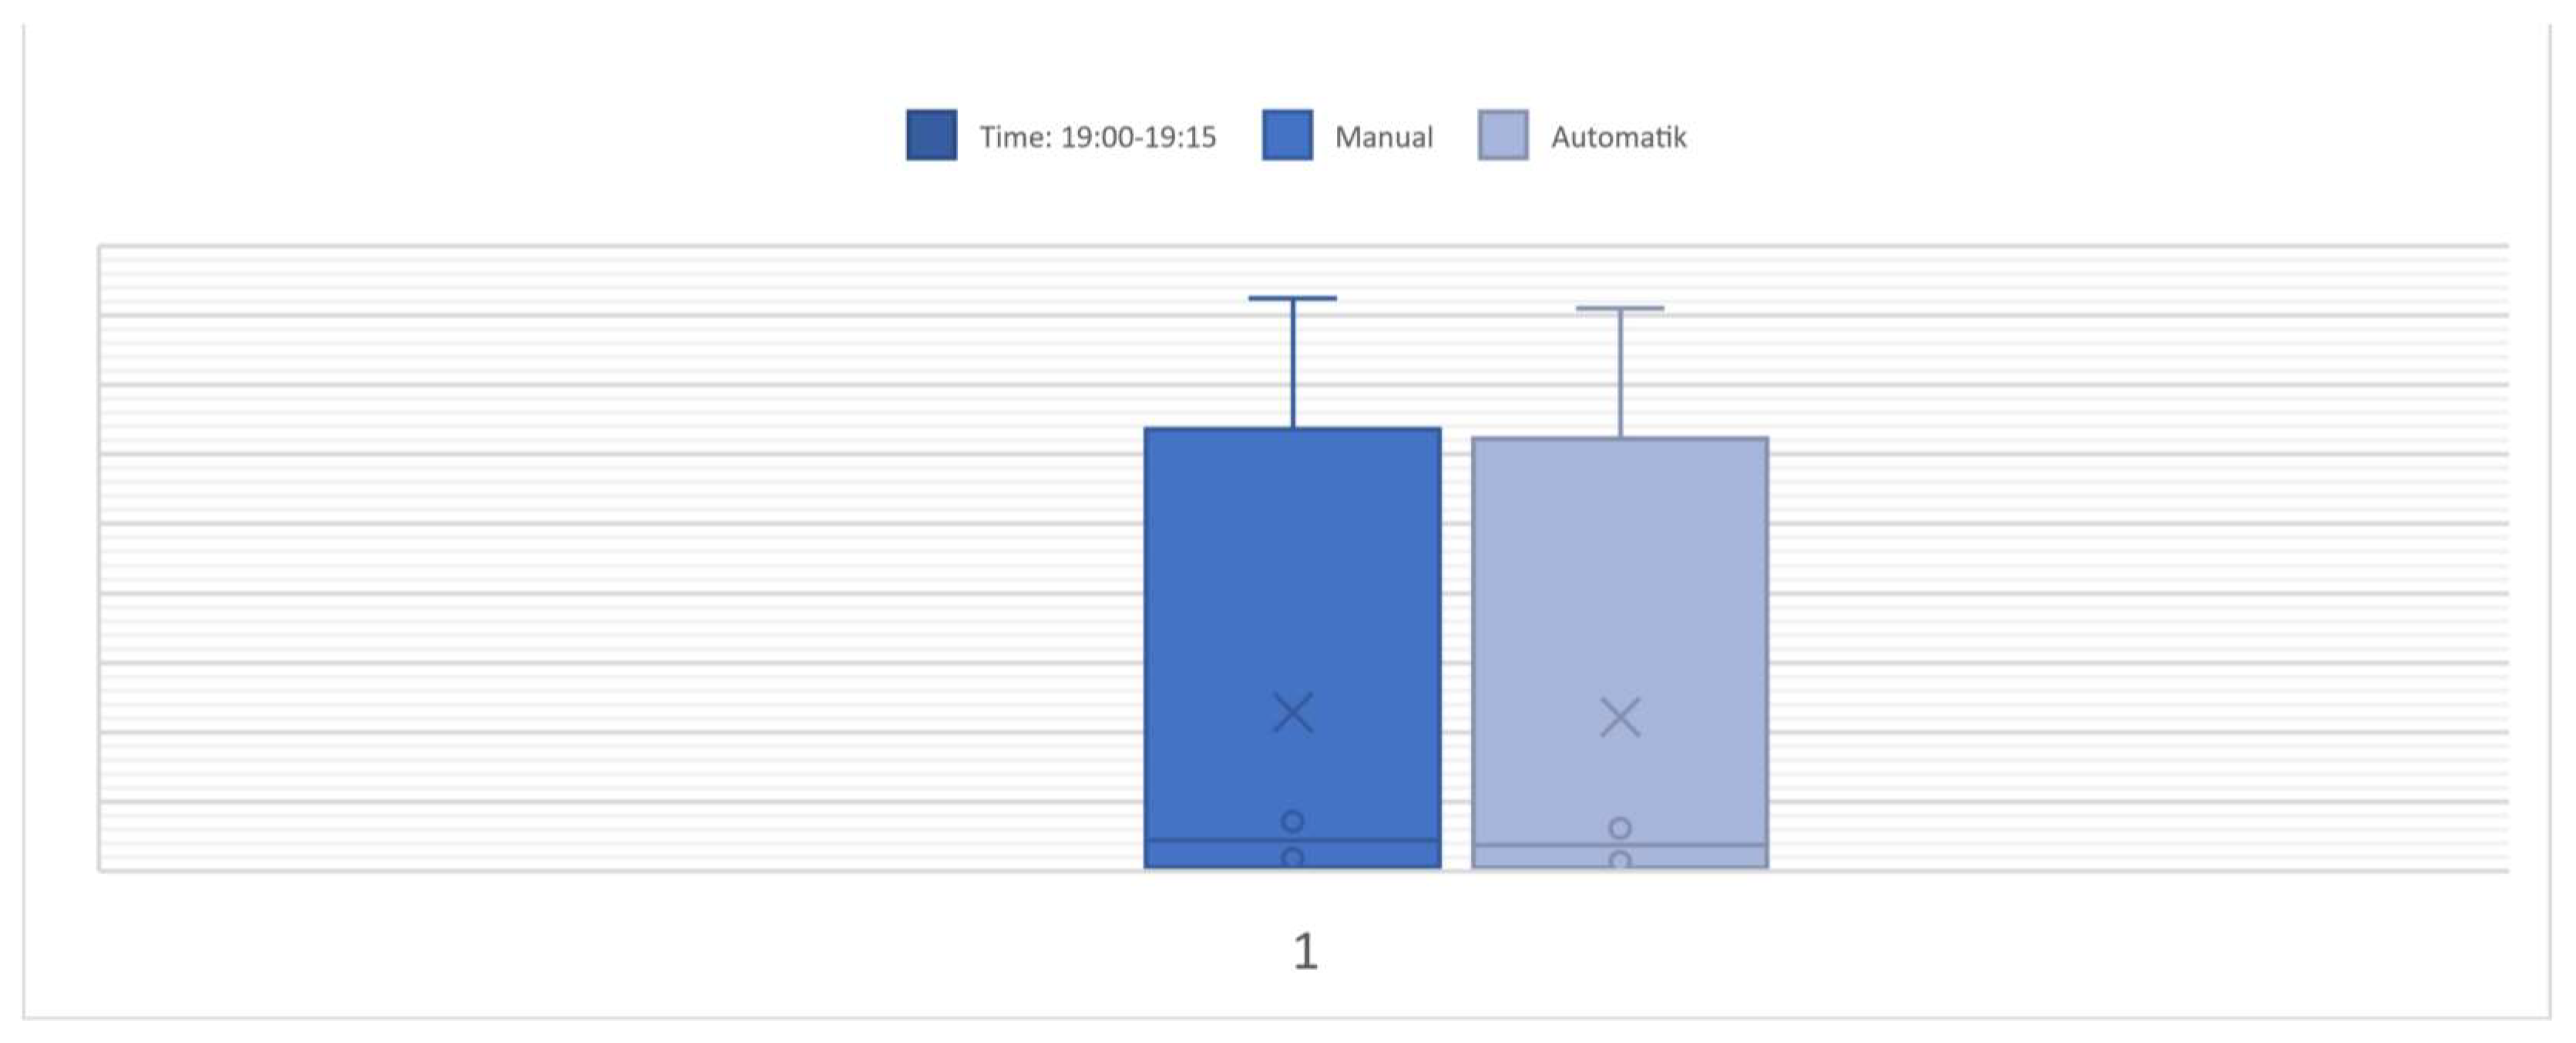
| Time Period: 19:00–19:15 | ||||||
| Manual | 427 | 1 | 9 | 36 | 4.87% | 15 min |
| Automatic | 412 | 1 | 7 | 31 | ||
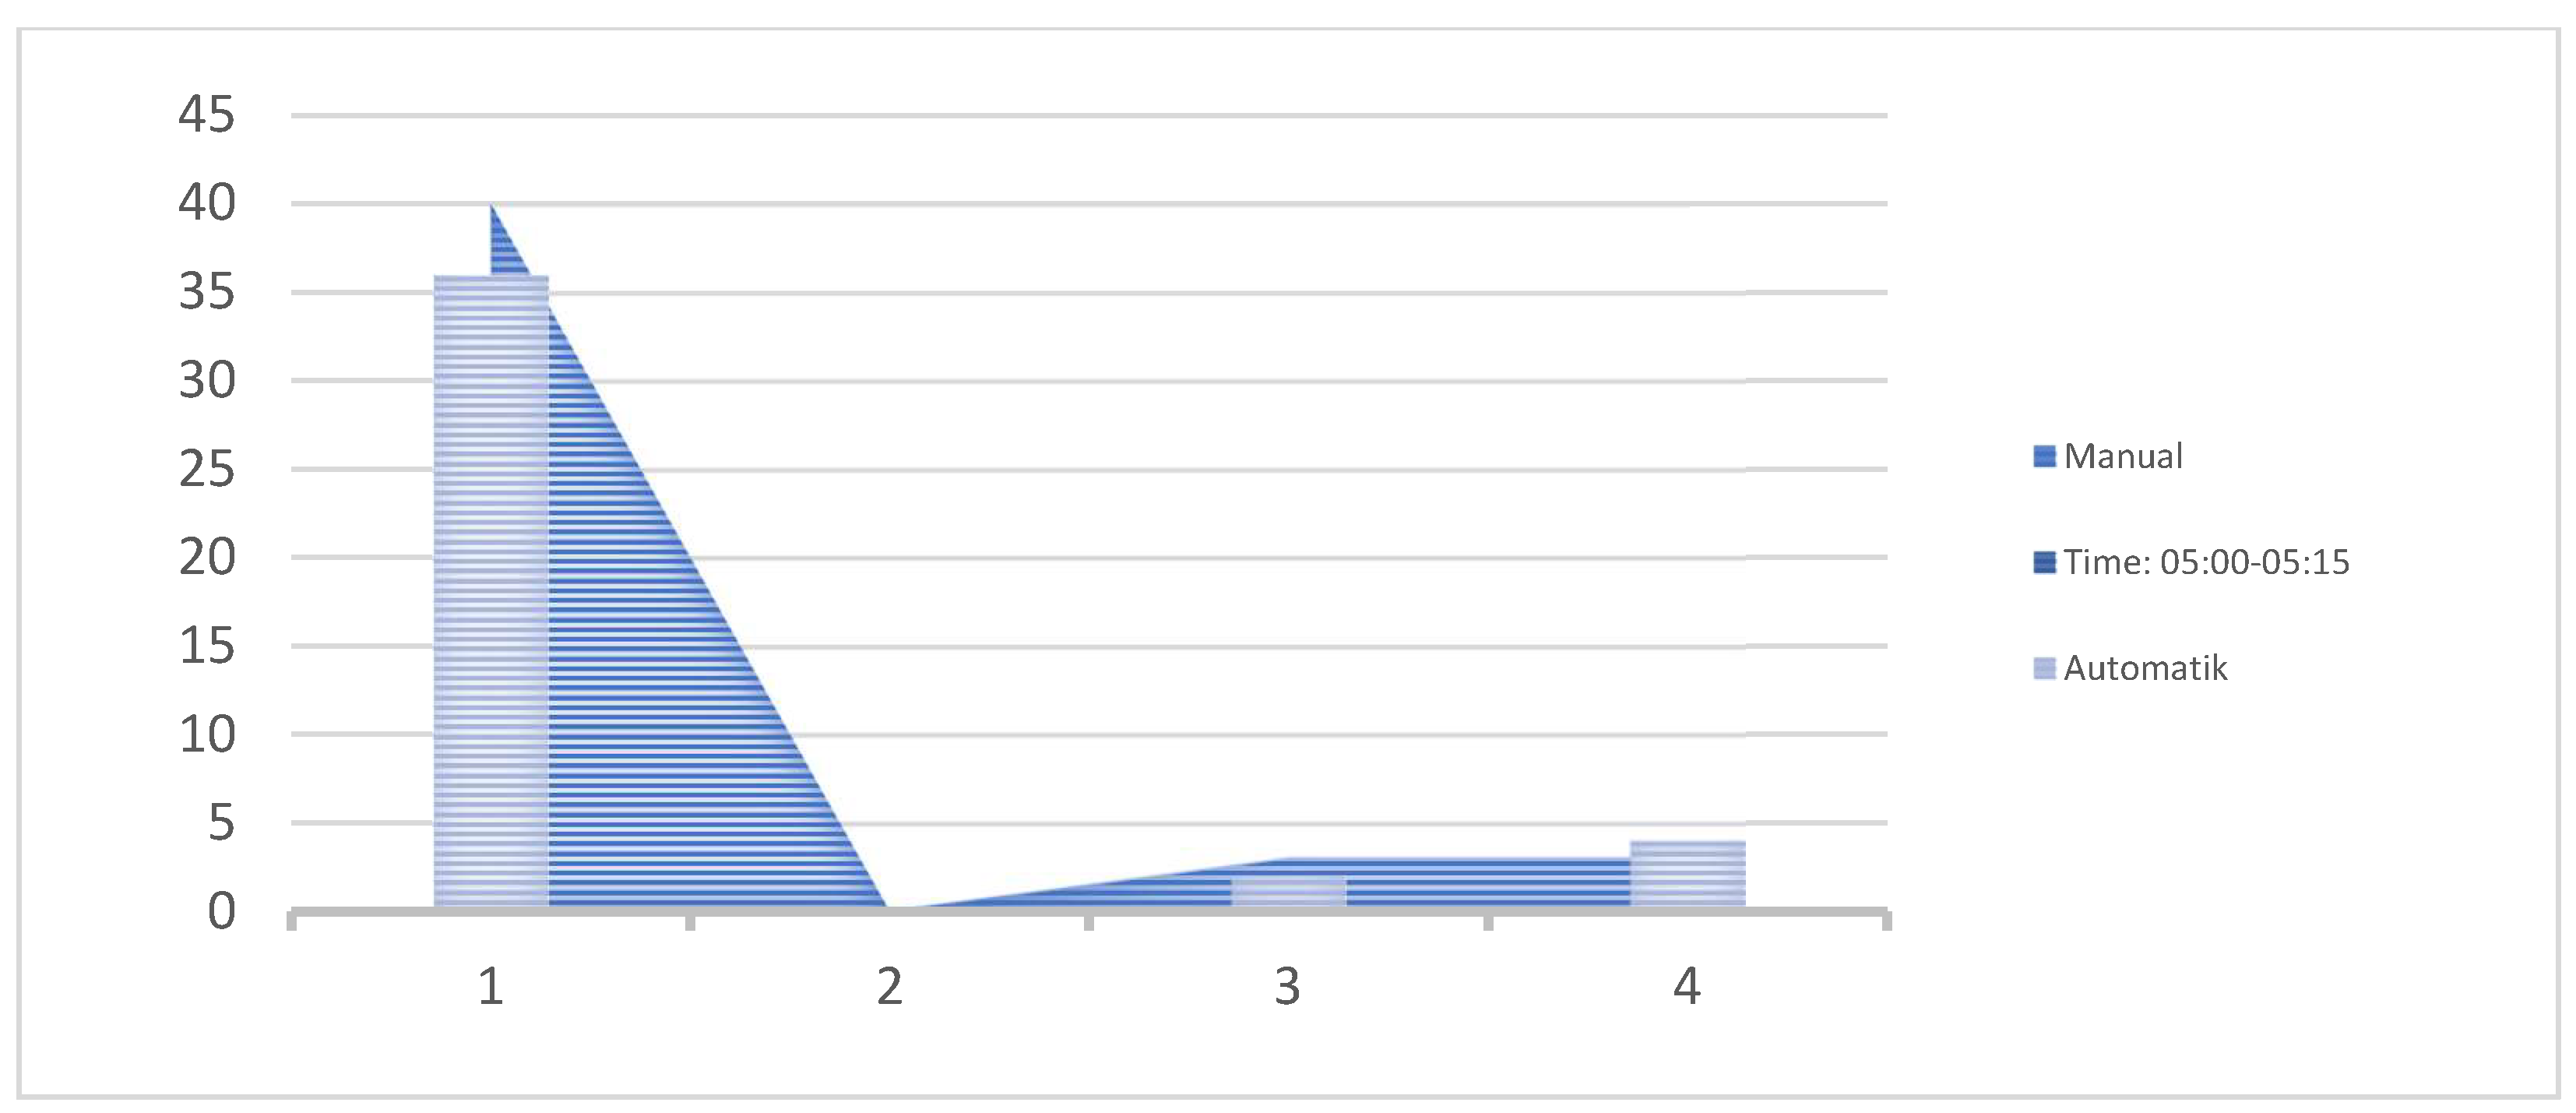
| Time Period: 05:00–05:15 | ||||||
| Manual | 40 | 0 | 3 | 3 | 4.54% | 15 min |
| Automatic | 38 | 0 | 2 | 4 | ||
| Movement |  EBL |  EBT |  WBT |  WBR |  SBL |  SBR |
|---|---|---|---|---|---|---|
| Lane configurations |  |  |  |  |  | |
| Traffic volume (vph) | 20 | 178 | 195 | 110 | 98 | 100 |
| Future volume (vph) | 20 | 178 | 195 | 110 | 98 | 100 |
| Ideal flow (vphpl) | 1900 | 1900 | 1900 | 1900 | 1900 | 1900 |
| Total lost time (s) | 4.5 | 4.5 | 4.5 | 4.5 | 4.5 | |
| Lane util, factor | 1.00 | 0.95 | 0.95 | 1.00 | 1.00 | |
| Frpb, ped/bikes | 1.00 | 1.00 | 1.00 | 0.45 | 0.83 | |
| Flpb, ped/bikes | 1.00 | 1.00 | 1.00 | 1.00 | 1.00 | |
| Frt | 1.00 | 1.00 | 1.00 | 0.85 | 0.93 | |
| Flt protected | 0.95 | 1.00 | 1.00 | 1.00 | 0.98 | |
| Satd, flow (prot) | 1770 | 3539 | 3539 | 714 | 1406 | |
| Flt permitted | 0.95 | 1.00 | 1.00 | 1.00 | 0.98 | |
| Satd, flow (perm) | 1770 | 3539 | 3539 | 714 | 1406 | |
| Peak-hour factor, PHF | 0.92 | 0.92 | 0.92 | 0.92 | 0.92 | 0.92 |
| Adj. flow (vph) | 22 | 193 | 212 | 120 | 107 | 109 |
| RTOR reduction (vph) | 0 | 0 | 0 | 48 | 29 | 0 |
| Lane group flow (vph) | 22 | 193 | 212 | 72 | 187 | 0 |
| Confl. peds. (#/hr) | 220 | 200 | 200 | 200 | ||
| Turn type | Prot | NA | NA | Perm | Prot | |
| Protected phases | 7 | 4 | 8 | 1 | ||
| Permitted phases | 8 | |||||
| Actuated green, G (s) | 20.5 | 100.5 | 75.5 | 75.5 | 16.5 | |
| Effective freen, g(s) | 20.5 | 100.5 | 75.5 | 75.5 | 16.5 | |
| Actuated g/C ratio | 0.16 | 0.80 | 0.60 | 0.60 | 0.13 | |
| Clearance time (s) | 4.50 | 4.50 | 4.50 | 4.50 | 4.50 | |
| Lane grp cap (vph) | 287 | 2822 | 2120 | 427 | 184 | |
| v/s ratio prot | c0.01 | 0.05 | 0.06 | c0.13 | ||
| v/s ratio perm | c.0.10 | |||||
| v/c ratio | 0.08 | 0.07 | 0.1 | 0.17 | 1.02 | |
| Uniform delay, d1 | 44.7 | 2.7 | 10.8 | 11.3 | 54.8 | |
| Progression factor | 1.00 | 1.00 | 0.87 | 0.58 | 1.00 | |
| Incremental delay, d2 | 0.5 | 0 | 0.1 | 0.80 | 71.1 | |
| Approach delay (s) | 7.1 | 8.7 | 125.9 | |||
| Approach LOS | A | A | F | |||
| Intersection Summary | ||||||
| HCM 2000 control delay | 41.4 | HCM 2000 level of service | D | |||
| HCM 2000 volume to capacity ratio | 0.28 | |||||
| Actuated cycle length (s) | 126 | Sum of lost time (s) | 13.5 | |||
| Intersection capacity utilization | 39.60% | ICU level of service | A | |||
| Analysis period (min) | 15 | |||||
| Critical lane group | ||||||
Disclaimer/Publisher’s Note: The statements, opinions and data contained in all publications are solely those of the individual author(s) and contributor(s) and not of MDPI and/or the editor(s). MDPI and/or the editor(s) disclaim responsibility for any injury to people or property resulting from any ideas, methods, instructions or products referred to in the content. |
© 2023 by the authors. Licensee MDPI, Basel, Switzerland. This article is an open access article distributed under the terms and conditions of the Creative Commons Attribution (CC BY) license (https://creativecommons.org/licenses/by/4.0/).
Share and Cite
Hoxha, G.; Fandaj, A.; Bajrami, X. Quality of Automatic Traffic Volume Counting by Cameras and Impact on the Qualitative Indicators of Traffic. Infrastructures 2023, 8, 44. https://doi.org/10.3390/infrastructures8030044
Hoxha G, Fandaj A, Bajrami X. Quality of Automatic Traffic Volume Counting by Cameras and Impact on the Qualitative Indicators of Traffic. Infrastructures. 2023; 8(3):44. https://doi.org/10.3390/infrastructures8030044
Chicago/Turabian StyleHoxha, Gëzim, Arjanit Fandaj, and Xhevahir Bajrami. 2023. "Quality of Automatic Traffic Volume Counting by Cameras and Impact on the Qualitative Indicators of Traffic" Infrastructures 8, no. 3: 44. https://doi.org/10.3390/infrastructures8030044
APA StyleHoxha, G., Fandaj, A., & Bajrami, X. (2023). Quality of Automatic Traffic Volume Counting by Cameras and Impact on the Qualitative Indicators of Traffic. Infrastructures, 8(3), 44. https://doi.org/10.3390/infrastructures8030044