Article

A Study on the Genetic Algorithm Optimization of an Asphalt Mixture’s Viscoelastic Parameters Based on a Wheel Tracking Test

1
Beijing Key Laboratory of Traffic Engineering, Beijing University of Technology, Beijing 100124, China
2
Beijing Engineering Research Center of Integrated Transportation Systems Management and Operation, Beijing University of Technology, Beijing 100124, China
3
School of Mechanics and Civil Engineering, China University of Mining Technology, Xuzhou 221116, China
*
Author to whom correspondence should be addressed.
Infrastructures 2023, 8(12), 169; https://doi.org/10.3390/infrastructures8120169
Submission received: 1 November 2023 / Revised: 19 November 2023 / Accepted: 20 November 2023 / Published: 28 November 2023

Abstract

:
The generalized Maxwell (GM) constitutive model has been widely applied to characterize the viscoelastic properties of asphalt mixtures. The parameters (Prony series) of the GM are usually obtained via interconversion between a dynamic modulus and relaxation modulus, and they are then input to a finite element model (FEM) as viscoelastic parameters. However, the dynamic modulus obtained with the common loading mode only provides the compressive and tensile properties of materials. Whether the compression or tensile modulus can represent the shear properties of materials related to flow rutting is still open to discussion. Therefore, this study introduced a novel method that integrates the Kriging model into the genetic algorithm as a surrogate model to determine the viscoelastic parameters of an asphalt mixture in rutting research. Firstly, a wheel tracking test (WTT) for AC-13 was conducted to clarify the flow rutting development mechanism. Secondly, two sets of the AC-13 viscoelastic parameters obtained through the optimization method and the dynamic modulus were used as inputs into the FEM simulation of the WTT to compare the simulation results. Finally, a sensitivity analysis of viscoelastic parameters was performed to improve the efficiency of parameter optimization. The results indicating the viscoelastic parameters obtained by this method could precisely characterize the development law of flow rutting in asphalt mixtures.

1. Introduction

Rutting is one of the most serious diseases of asphalt pavement, seriously affecting pavement performance and traffic safety. For the semi-rigid base pavement structure widely used in China, pavement rutting is mainly caused by asphalt layers over the semi-rigid base [1].
Research on rutting has become a challenging task due to the uneven and complex mechanical properties of the asphalt mixture, as well as various external affecting factors [2]. The FEM method is a widely used method in pavement research, and finite element software such as ANSYS and ABAQUS has been employed by many scholars to investigate rutting in asphalt mixtures [3]. At the same time, many viscoelastic constitutive models have been proposed to evaluate high-temperature rutting resistance and predict the rutting of the asphalt mixture at high temperatures. Among these models, the GM model has gained widespread acceptance due to its ability to better characterize the viscoelastic behavior of asphalt mixtures [4]. Rameshkhah et al. applied the GM model to simulate the viscoelastic behavior of asphalt mixtures and investigated the effects of asphalt material, surface thickness, and load duration on the deformation of pavement asphalt surface layers [5]. Alimohammadi et al. used the GM model in FEM viscoelastic simulations in finite element software to predict rutting in asphalt pavement sections [6]. Sun et al. used a GM model to describe the complex mechanical behavior of asphalt mixtures and found that adding high-modulus modifiers could enhance the high-temperature rutting resistance of pavements [7]. Fan et al. optimized the practical application of epoxy asphalt concrete (EAC) based on the GM model, demonstrating that the appropriate utilization of EAC can reduce pavement rutting disease [8].
In fact, the GM model, in the form of the Prony series, describes the relaxation modulus of a viscoelastic material [9,10]. However, since the strain must remain constant during the experiment, it is difficult to directly determine the Prony series coefficients. Therefore, it is common to determine the Prony series coefficients via interconversion between the dynamic and relaxation moduli [11,12,13].
It should be noted that the measurements of a dynamic modulus are influenced by multiple factors, such as the size, test method, and geometry of the sample [14]. The effect of size can be characterized in terms of shape and mass; Di Benedetto et al. experimentally demonstrated that specimen size and mass affect the magnitude of the dynamic modulus [15]. In addition, there are many dynamic modulus testing methods with different loading modes and different specimen shapes, including uniaxial compression, indirect tension, four-point bending, etc., [16,17,18]. Huang et al. conducted dynamic modulus tests for trapezoid beams and cylinders and found that the dynamic modulus was smaller in trapezoid beam tests [19]. Ruan et al. reported that the dynamic modulus was larger under a haversine loading mode than under a bell-shaped loading mode [20]. Qin et al. comparatively studied two test modes, indirect tension and uniaxial compression, and found that there were significant differences in the dynamic modulus, phase angle, and displacement factor of asphalt mixes measured using these two test modes [21]. Cheng et al. found that the dynamic modulus obtained in the four-point bending test was lower than those of the uniaxial and indirect tension tests [22]. Therefore, the loading form has an important influence on the determination of the dynamic modulus. When performing a mechanical analysis of asphalt pavements, a suitable dynamic modulus test method should be selected according to the force condition of the asphalt surface.
The deformation of an asphalt mixture as a result of shear failure is the main cause of rutting [23]. Viscoelasticity parameters are required to characterize the shear resistance of the material in rutting analysis and prediction. However, the dynamic modulus measured in the generic loading mode only provides the tensile or compressive properties of the material [24]. Whether the viscoelastic parameters obtained with the compressive or tensile modulus can accurately characterize shear resistance or not has not yet been demonstrated. In addition, dynamic modulus testing requires loading time at different temperatures and loading frequencies, which places high demands on the accuracy of the equipment and environment [15]. The wheel tracking test (WTT) has been widely used to evaluate the high-temperature performance of asphalt mixtures due to its simple operation and easy execution [25]. If the rutting resistance of an asphalt mixture can be obtained from WTT while directly obtaining viscoelastic parameters for a rutting simulation and prediction, efficiency will be effectively improved, and resources and costs will be saved.
In this study, a novel method was proposed to obtain the WTT-based viscoelastic parameters of an asphalt mixture for rutting simulation and prediction. This method takes advantage of both the high productivity of the Kriging model and the unique global optimization properties of genetic algorithms. The GM model was selected to characterize the viscoelasticity of the asphalt mixture. The rutting depth with loading time in the WTT was used as base data to obtain the viscoelastic parameters of the asphalt mixture using the optimization method. Meanwhile, a uniaxial compression loading mode was used for the dynamic modulus test to obtain another set of viscoelastic parameters. Two sets of parameters were input into the FEM simulation of the WTT to compare simulation results. Finally, in order to develop a more efficient optimization scheme, each viscoelastic parameter was examined in relation to rutting development. The remainder of this paper is as follows. Section 2 introduces the optimization model and process; Section 3 describes the WTT, uniaxial compression test, and FEM models; the simulation results are analyzed and discussed in Section 4; and Section 5 draws the conclusion.

2. Methodology

2.1. Optimization Objects

Asphalt mixtures are commonly considered as an elastic material, and the mechanical response of asphalt pavements is analyzed through the multilayer linear elastic method. However, asphalt mixtures exhibit viscoelastic behaviors under many conditions. Studies have shown that asphalt mixtures exhibit more viscoelastic behaviors in experimental and practical engineering applications. The characteristics of asphalt mixtures under traveling loads are very complex. Therefore, it is more realistic to consider the asphalt mixture as a viscoelastic material [26]. In general, the viscoelastic behavior of materials can be characterized by a mechanical model composed of spring and dashpot elements in different combinations. The stress relaxation behavior can be described by the Maxwell model, which consists of spring and viscous dashpots in series. In the Kelvin model, the springs and dashpots form parallel channels and are suitable for describing creep [27]. The long-term viscoelastic mechanical behavior of asphalt mixtures requires more spring and dashpot elements. The GM model consists of a linear elastic spring and an N-term Maxwell model in parallel. Long-term relational behaviors can be captured by the Prony series. The Prony series components have corresponding physical meanings in the GM model. As shown in Figure 1, E i and η i represent the elasticity modulus of the spring and the damping of the dashpot in the GM model, respectively.
The GM model formulation taking the form of the Prony series can be expressed by Equation (1).
E t = E + i = 1 n E i e t / τ i
where τ i represents the relaxation time of the i Maxwell element, τ i =   η i / E i , E t represents the relaxation modulus, E represents the equilibrium modulus, and n represents the number of terms in the Prony series.
Previous studies have shown that the viscoelastic properties of materials could be accurately characterized using a Prony series with n = 5 [28]. In this study, the Prony series with n = 7 was selected to ensure accuracy. The relaxation time was determined by the following Equation (2), in which E 1 ~ E 7 were assumed to be the elastic modulus corresponding to different relaxation times, and E is the equilibrium modulus. The physical meaning of the parameters is shown in Table 1.
τ i = 10 i 4 , i = 1,2 , 7
Ansys (2021 R1) software was used to examine the Prony series constants for the viscoelastic material. In addition, the regression parameters that fit the Williams–Landel–Ferry (WLF) equation were determined, which were assumed to be C 1 and C 2 . Finally, 10 parameters were determined as the optimization objects of this study, including E 1 ~ E 7 , E , C 1 , and C 2 .

2.2. Kriging Surrogate Model

Due to the large number of parameters in this optimization model, the direct use of the methods will lead to a low optimization efficiency. The surrogate modeling was thus adopted to reduce the difficulties and improve the efficiency of calculation [29]. The essence of surrogate modeling is to replace complex calculations with simple mathematical models to save time and computation resources spent on numerical simulations. The Kriging model proposed by Krige in 1951 is one of the multiple surrogate models [30]. The Kriging model has demonstrated a superior capacity to combine global modeling with local modeling. It shows a better efficiency in determining the output values than the numerical method and converges faster and stably compared to artificial neural networks [31]. Zhang et al. used the Kriging model instead of numerical simulations to quickly and accurately predict the parameters of the bilinear cohesion zone model [32].
DACE (design and analysis of computer experiments) is a MATLAB toolbox to deal with Kriging approximations of computer models. This software is typically used to construct a Kriging approximation model based on the computer experimental data, and takes this approximation model as a surrogate for computer models. In this study, the DACE toolbox (Version 2.0) in MATLAB was utilized to construct the Kriging model, and the model structure was briefly described to select appropriate model parameters. For a given sample set S = [ s 1   s m ] T ( s i I R n ) and its response Y = [ y 1 y m ] ( y i I R q ), it was assumed that it meets the positive normalization condition, and then for the response y ( x ) I R q of an unknown point, its predicted value by the Kriging model can be expressed in Equation (3):
y ^ x = F β : , l , x + z l x ,   l = 1 , , q
where F β : , l , x is a polynomial regression model obtained from p-selected linear combination functions. It can be calculated as:
F β : , l , x = β 1 , l f 1 x + β p , l f p x = f ( x ) T β : , l
where ( x ) T = f 1 x f p x , f n : I R n I R , β n , l represents the coefficient of the n polynomial.
Notably, z l x in Equation (3) is a random function, and its expected mathematical value was assumed to be 0. The covariance between any two points z w and z x can be expressed by Equation (5):
E z l w z l x = σ l 2 R θ , w , x ,   l = 1 , , q
where σ l is the variance of the l component of the response set. In the covariance model R θ , w , x , θ is the random variable. The covariance model can be expressed by Equation (6):
R θ , w , x = n = 1 j R θ , w n x n
In the DACE toolbox, there are six types of covariance models and three types of polynomial regression models. In this study, the second-order polynomial and Gaussian covariance models were used to construct the Kriging surrogate model, which was utilized as a substitute for numerical simulation to predict the mechanical response under different combinations of asphalt mixture viscoelastic parameters.

2.3. Optimal Algorithm

An optimal algorithm was used to determine the viscoelastic parameters in this study. The genetic algorithm (GA) is an efficient search and optimization tool based on the principle of survival of the fittest, and its research focuses on selecting the best fitness in a randomized population [33]. In contrast to other optimization methods, GA performs crossover and variation in each iteration, so that the stochastic aggregate covers the full range of possibilities for each parameter and avoiding local minima. It makes GA more capable of searching for the global optimal solutions [34]. The optimization objective function in this study is shown in Equation (7). Referring to previous studies [35,36], a reasonable range of values for each viscoelastic parameter was determined, as shown in Table 2.
m i n f E 1 7 , E , C 1 2 = i n D E 1 7 , E , C 1 2 , t i D ( t i )
where D ( t i ) is the rutting depth at time t i in the WTT, and D E 1 7 , E , C 1 2 , t i is the rutting depth at time t i in the FEM simulation of the WTT. The optimization objective f is the sum of absolute error (SAE) between the test measurement points and the simulated curve. As mentioned in Section 2.1, the optimization variables in Equation (7) are the optimization objects, including E 1 ~ E 7 , E , C 1 , and C 2 .
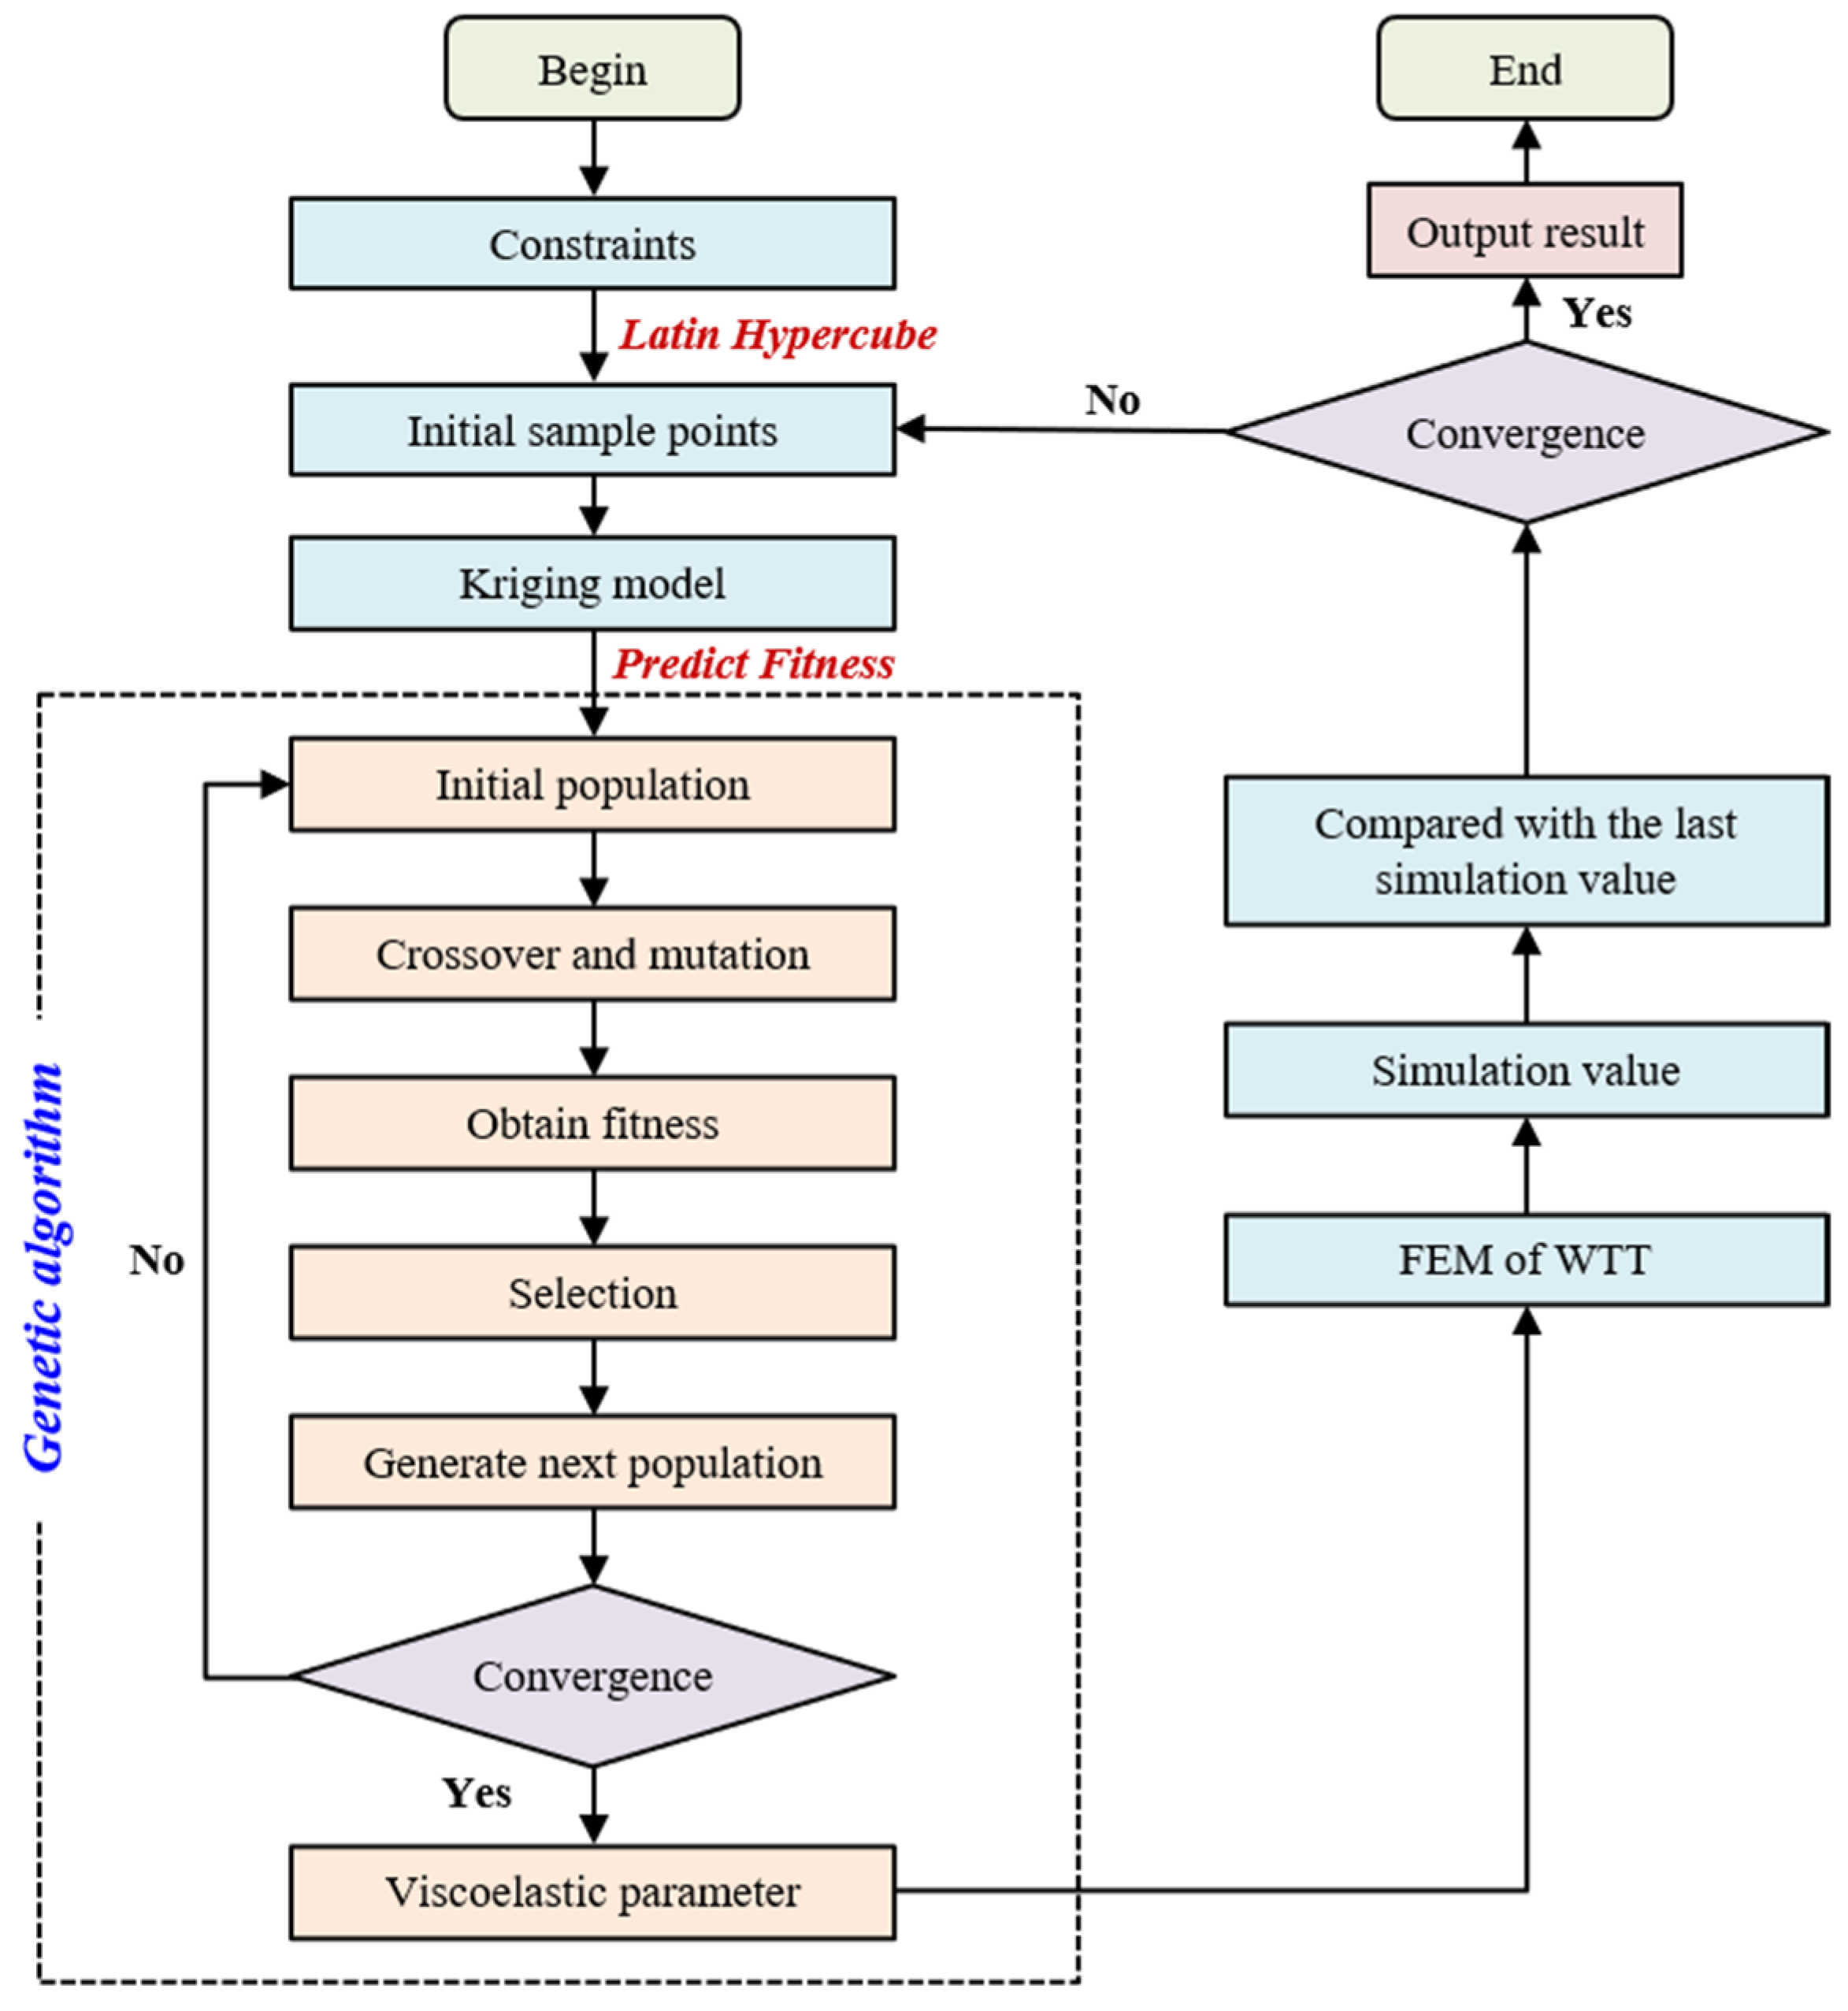
GA is a global optimization algorithm that requires iterations [37]. Calculation of the objective function requires repeated numerical simulations to obtain the rutting depth curves for different viscoelastic parameters. In order to save time and improve optimization efficiency, the Kriging model was used as a surrogate model instead of the FEM to predict the objective function values under different viscoelastic parameters.
As shown in Figure 2, the optimization process consists of a series of steps. It is worth noting that the size of the data volume is important for the accuracy of the optimization. In order to improve accuracy and optimization efficiency, the Latin hypercube sampling (LHS) method was used to generate enough sample points to establish the initial Kriging surrogate model. Each point was chosen with equal probability randomly in its corresponding subrange [32]. The initial population of GA and initial Kriging model were then constructed by pairing each point with the true response calculated from finite element simulations. The possible optimal solutions predicted by the GA, i.e., the viscoelastic parameters, were input into the FEM of WTT to obtain their corresponding SAE. The possible optimal solutions predicted by the GA, i.e., the viscoelastic parameters, were input into the FEM of WTT to obtain their corresponding SAE. The possible optimal solutions in combination with their corresponding SAE were then added to the Kriging sample points to form a new sample set. This process was repeated until it reached the convergence condition to obtain the desired viscoelastic parameters.
The Kriging surrogate model can predict the values of unknown points in N-dimensional space by spatial interpolation, and the prediction results can combine with the original N-dimensional space to form a “response surface”. During this process, the role of GA is to search for the lowest point in this surface, and this lowest point is the optimal solution [32]. Therefore, the whole optimization step was divided into the following four parts:
(1)
According to the constraints in the optimization model, the initial sample points selected randomly using the LHS method are used to establish the initial Kriging “response surface”.
(2)
Genetic algorithms are utilized to obtain the optimal solution in this “response surface”.
(3)
The true values of the optimization results are calculated using the FEM simulations and this set of true values is added to the initial sample points to renew the Kriging “response surface”.
(4)
The second and third steps are looped until the difference between the optimization results SAE of the two adjacent ones is less than 1.
In this study, the mutation rate was set to 0.09 and the number of generations was set to 6000. In each optimization iteration of GA, the initial population of the GA was the sample points that construct the Kriging surrogate model.

3. Materials and Experiment

In order to obtain the variation in rutting depth over time and the base data for parameters’ optimizations, the WTT was conducted on the AC-13 asphalt mixture. Then, the dynamic modulus test of AC-13 was carried out under the uniaxial compression loading mode, and the interrelationship between the complex modulus and the relaxation modulus for the FEM simulation of the WTT was analyzed to determine the viscoelastic parameters of the material.

3.1. Material Properties

In this study, SBS-modified asphalt was selected as the binder, and its basic physical properties are shown in Table 3. Limestone was chosen as the aggregate of the mixture and limestone fines were selected as the filler. The designed gradation is shown in Table 4. The asphalt content is 4.30%.

3.2. Wheel Tracking Test

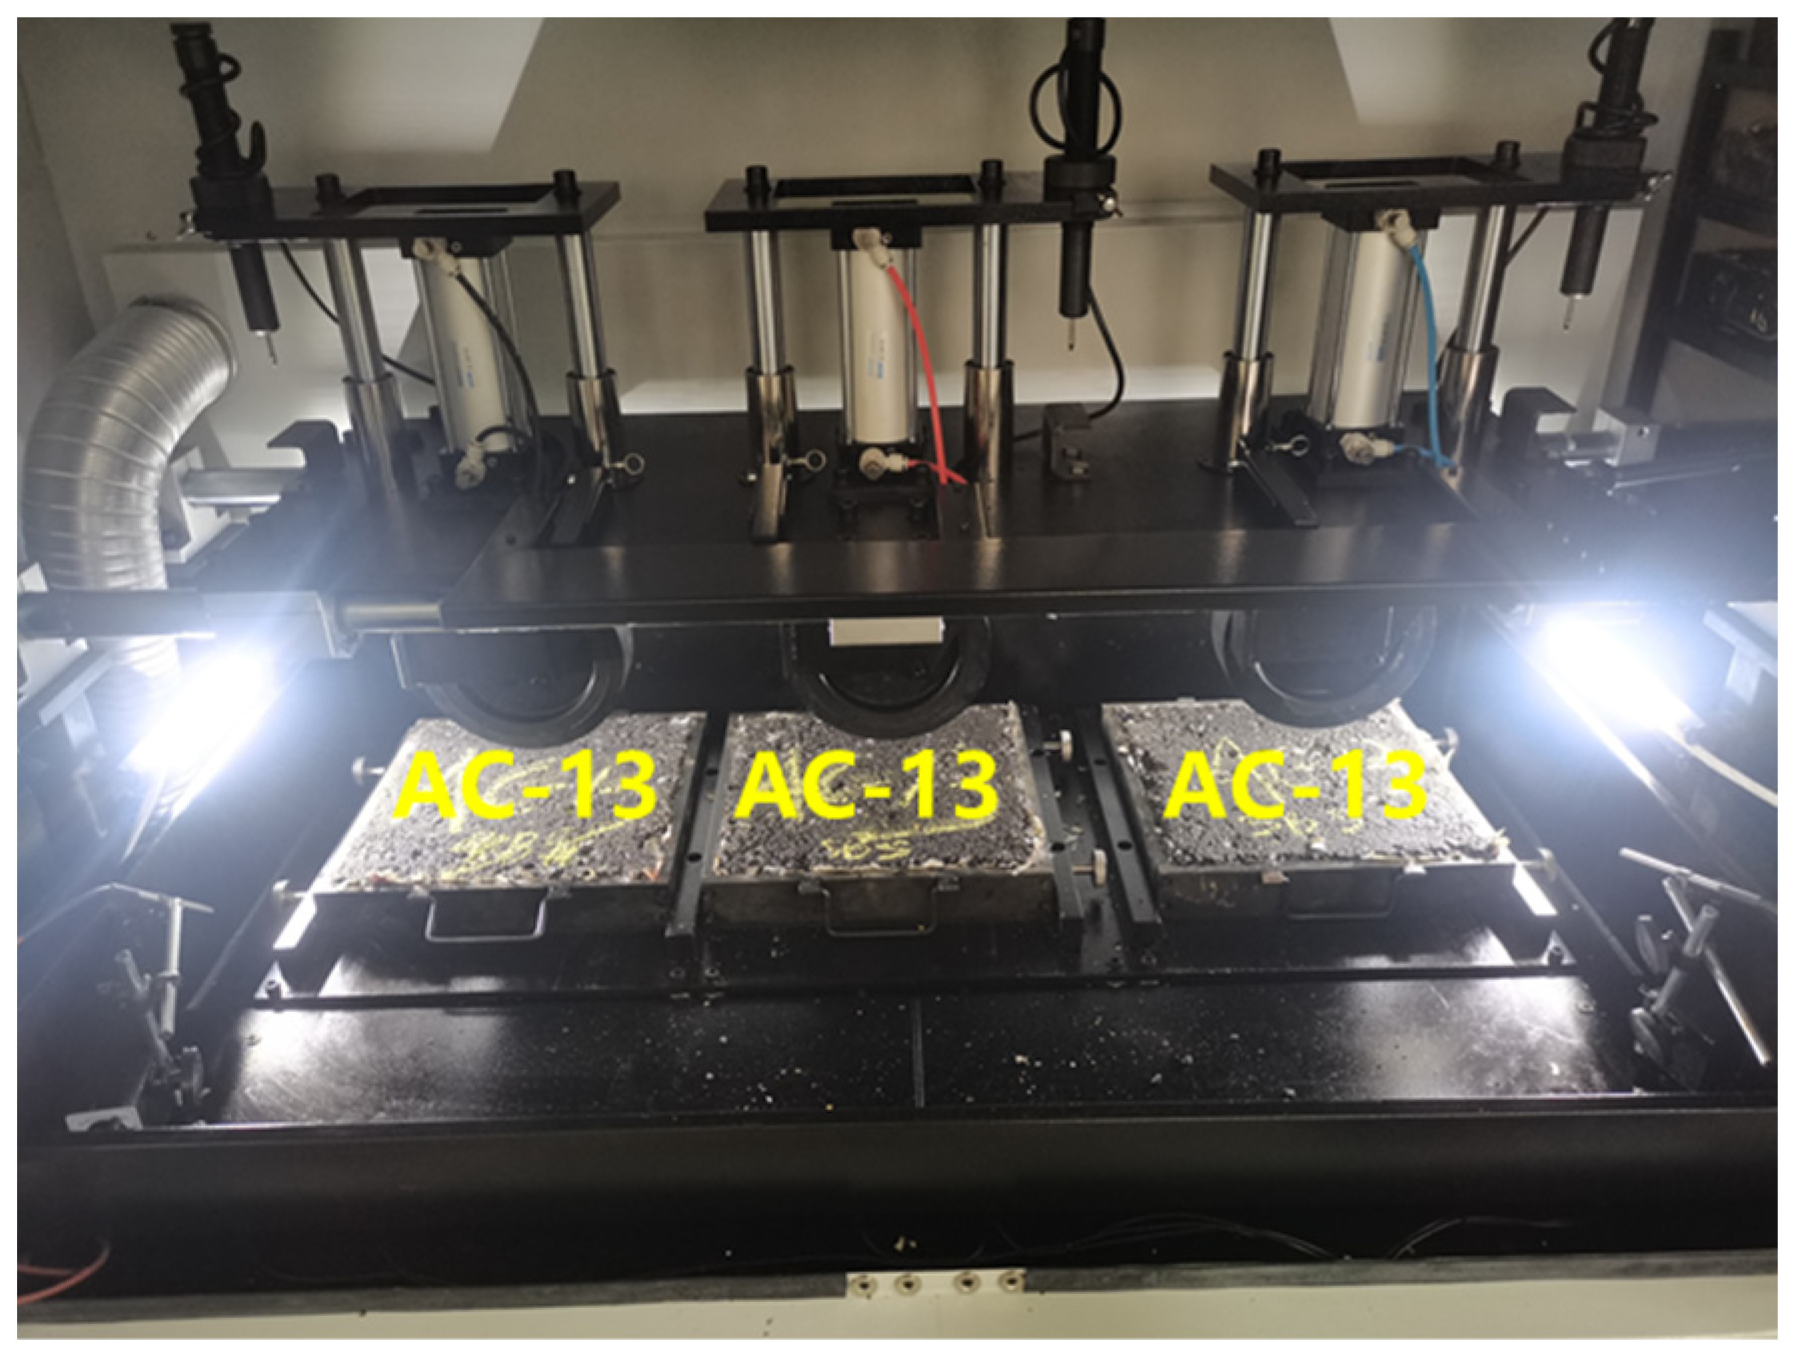
The wheel tracking test (WTT) was conducted according to the Chinese test specification [38]. A slab specimen of 300 mm × 300 mm × 50 mm was made by a wheel-milling machine. The WTT test was conducted at 60 °C in the laboratory. Loading with a pressure of 0.7 MPa was applied on the slab specimen through a rubber wheel with a width of 50 mm. During the test, the specimen underwent 42 times per minute by the rubber wheel for 60 min. The rutting depth of the specimen and the dynamic stability (DS) were recorded during the test. Figure 3 shows the process of the WTT.
The WTT results are listed in Table 5 and the curve of rutting depth over time is shown in Figure 4. It can be observed that the rutting depth grows faster at the beginning of loading, mainly due to the relatively large porosity of the specimen. The specimen was densified over time by the loading, and eventually, pressure-dense rutting was formed. After the loading was applied to the specimen for 1000 s, the rutting depth growth rate decreased significantly and stabilized. This was mainly attributed to the shear stress on the asphalt mixture exceeding its shear strength in the post-loading phase. The vertical displacement was mainly caused by the flow rutting from shear damage. The rutting growth rate remained stable at this point, indicating that the linear viscoelastic characteristics of asphalt mixtures are suitable for characterization by the GM model. Therefore, the vertical displacement occurring between 1000 s and 3600 s was defined as the relative rutting depth (RRD) to reflect the rutting resistance of the asphalt mixture itself. For viscoelastic parameter optimization, the rutting deformation during the period from 1000 s to 3600 s was fitted as the base data.

3.3. Uniaxial Compression Test

In this study, the dynamic modulus of AC-13 was measured by a uniaxial loading mode, and the viscoelastic parameters of the material GM model were determined by the interrelationship between the complex modulus and relaxation modulus. If the relaxation modulus of the material is described in the form of the Prony series, the complex modulus of the material in the uniaxial compression test can be obtained according to the linear viscoelastic theory as shown in Equation (8):
E ω = E + i = 1 n E i · i ω τ i / ( 1 + i ω τ i )
Cylindrical specimens with a diameter of 150 mm and a height of 170 mm were prepared using a rotary compaction machine of Superpave. Then, a standard cylindrical specimen with a diameter of 100 mm and a height of 150 mm was obtained by coring and cutting. The complex modulus test was conducted according to the AASHTO’s T 342–11 standard [39] under a uniaxial compress mode. The experimental temperatures were set as 5 °C, 15 °C, 30 °C, and 50 °C, and the half-sine shape load with frequencies of 25 Hz, 10 Hz, 5 Hz, 1 Hz, 0.5 Hz, and 0.1 Hz was applied at each temperature, as shown in Figure 5. To ensure the test accuracy, the test followed a sequential procedure, commencing with lower temperatures and progressing towards high temperatures. Simultaneously, the frequency was gradually reduced from high values to low values.
After determining the complex modulus, the dynamic modulus measured at different temperatures (T) could be shifted into the reference temperature ( T 0 ) based on the-time-temperature superposition principle in Equation (9):
E ω , T = E α T ω , T 0
where α T is the shift factor, which satisfies the Williams–Landel–Ferry function [40], as shown in Equation (10).
l g α T = [ C 1 ( T T 0 ) / ( C 2 + T T 0 ) ]
where C 1 and C 2 are regression coefficients, related to material properties, T 0 is the reference temperature of the master curve, and T 0 was set to 20 °C.
The dynamic modulus master curve at the reference temperature was plotted to fit the modified Havriliak–Negami (MHN) function by the least squares method [41]. Figure 6 shows the dynamic modulus master curve at the reference temperature of 20 °C. In addition, C 1 was 21.6, C 2 was 172.7, and the corresponding Prony series parameters were solved by setting up a system of nonlinear equations by Equation (8). The relaxation time series was determined by Equation (2). The results of E i are listed in Table 6.

4. Results and Discussion

4.1. Finite Element Model Simulation of WTT

4.1.1. Elements Division

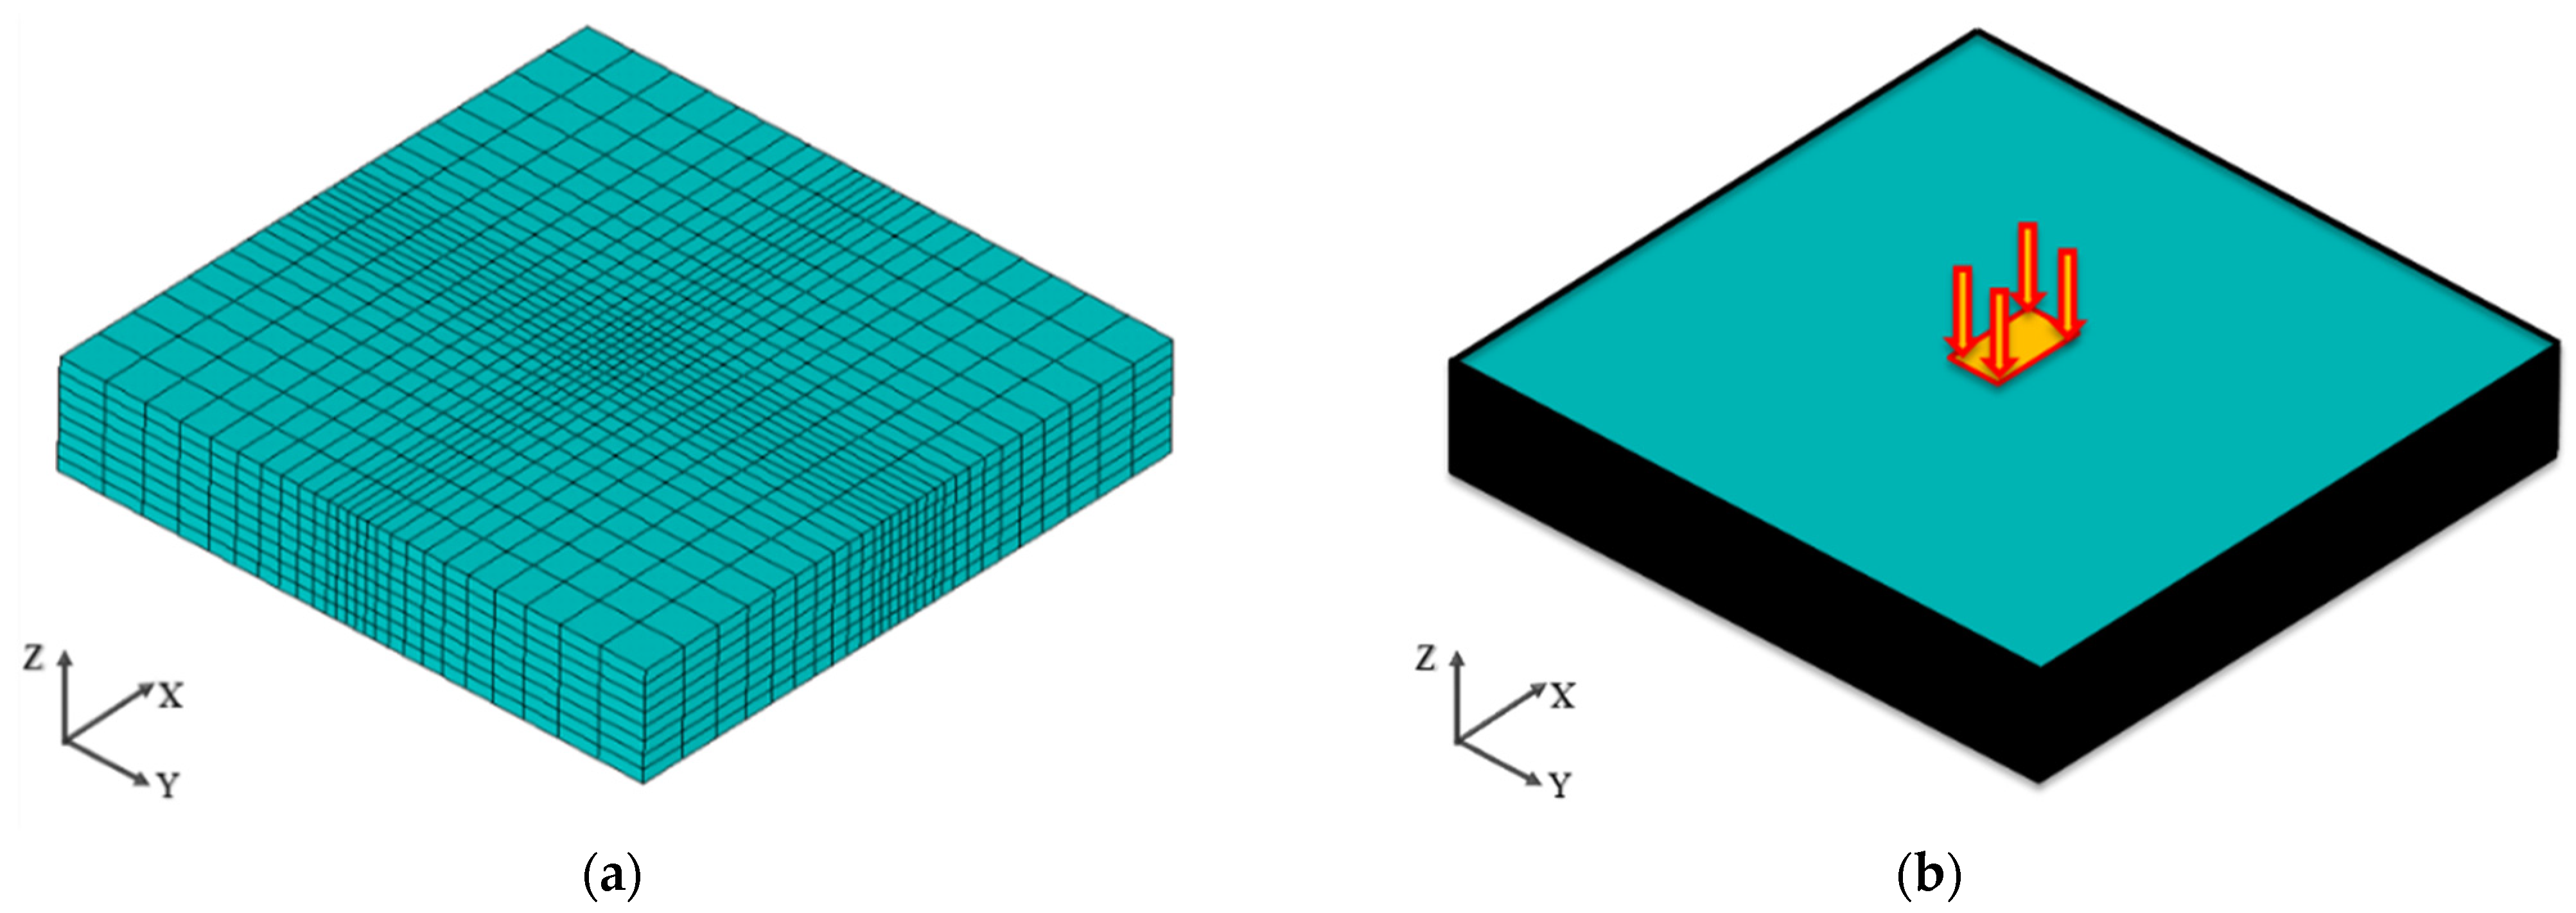
The finite element model (FEM) was utilized to numerically simulate the WTT. The dimensions of the developed model reflect the real specimen sizes used in the WTT, i.e., 300 mm × 300 mm × 50 mm. ANSYS (2021 R1) was used to generate the model, and Solid185 was employed as a modeling unit. A coordinate system was established to describe the FEM, as shown in Figure 7a. The X-axis direction is the direction of wheel travel. The region in proximity to the load underwent fine meshing. Specifically, the farther the distance from the center of the load, the coarser the mesh. This division not only ensured the accuracy of the finite element calculation, but also improved the calculation efficiency. In total, the FEM consisted of 5600 elements and 6786 nodes.

4.1.2. Loading Mode and Boundary Conditions

In pavement design and mechanical analysis, wheel loads are usually simplified to circular and vertical uniform loads. However, it has been shown that the actual shape of the contact between the vehicle tire and the road surface consists of a rectangle and two semicircles. For modeling convenience, the load contact shape was simplified to a rectangle as shown in Figure 8. The dimensions of the simplified rectangle were determined by Equation (11) [3]:
L = F / 0.5227 p = 56.98   m m
where F is the wheel load in WTT, 1.2 kN; p is the tire pressure, 0.707 MPa. Therefore, the length of the equivalent rectangular load is L = 0.8712 L = 49.64 mm and the width of equivalent load is B = 0.6 L = 34.19 mm. In order to enable a more convenient meshing, the load area was further reduced to a rectangular loading area with a length of 50 mm and a width of 35 mm.
Then, the dynamic load was applied to the slab in the WTT. For improving the calculation efficiency, the dynamic load was converted into a static load according to the load time accumulation principle [42]. The static load was applied at the center with a magnitude of 0.7 MPa and a loading time of 600 s.
In order to simulate the actual situation of the WTT, the boundary conditions of the FEM simulation were set according to the real situation of the WTT. The three directions of freedom on the bottom surface of the model were constrained, and the two sides parallel to the X-axis were constrained in the Y-axis direction, and the other two sides were constrained in the X-axis direction. The loading and boundary conditions of the FEM simulation are shown in Figure 7b.

4.2. Implementation of the Proposed Method

This section introduces the implementation process of the optimization method of viscoelastic parameters of the asphalt mixture. Firstly, the Latin hypercube method was used to obtain the random initial sample points according to the range of values of each variable in Table 2. The extracted values were fed into the FEM simulation of the WTT to obtain the simulation results of the rutting depth curve at different times. On that basis, the corresponding SAE between the simulated result and the experimental result was determined. Table 7 lists the first 25 sets of initial sample points.
The viscoelastic parameters were optimized following the steps in Figure 2. The difference of less than 1 mm between the SAE of two adjacent optimization iterations was the convergence condition for the optimization process. In this study, the first 66 sets of sample points were randomly extracted using the Latin hypercube sampling method to construct the initial Kriging model, and the parameter optimization process started from the 67th iteration. The SAE for each iteration is shown in Figure 9. Although the optimization curve fluctuates greatly, it generally shows a downward trend.
The optimization process ended at the 234th iteration and the convergence criterion was reached at an SAE of 6.03 mm. From Table 8, E 1 shows the maximum modulus of 10,133.326 MPa, while the equilibrium modulus is the minimum at 41.208 MPa.

4.3. Comparison of Simulation Results

In order to verify the effectiveness of the method proposed in this paper, the WTT data were used as the reference data, and the accuracy of the optimized parameters (OP) and the experimental parameters (EP) were compared using the FEM of the WTT test. Since rutting due to the compaction behavior of the asphalt mixture dominated the pre-test period, the trend of rutting depth in the pre-test period could not be characterized in terms of viscoelasticity. Thus, the relative rut depth changes of the test and simulation were compared. The simulation and test results are shown in Table 9. The relative rutting depth and dynamic stability of the FEM simulations using the OP were 0.366 mm and 7756 times/mm, and the error rates were 3.1% and 1.5%, respectively, which were lower than those of FEM simulations using the EP.
After loading for 1000 s, we compared the trends of rutting depth between the simulation and tests, as shown in Figure 10. It can be seen that the rutting depth curves over time simulated by OP show a good agreement with the curve from the WTT data, and the result was more consistent with the development of flow-type rutting formed by shear action.
The vertical shear stress distribution in the X = 0 plane at the end of loading is shown in Figure 11. It can be seen that the shear stress within the loading area was significantly greater than that in other areas, and the vertical shear stress gradually decreased with increasing depth. The maximum shear stress was 1.43 MPa, and the shear strength of the SBS-modified AC-13 asphalt mixture was generally 1.5–1.7 MPa [43], indicating that the shear action on the asphalt mixture caused the deformation and eventually induced rutting. This was consistent with the formation mechanism of flow-type rutting.
In addition, the values of C 1 and C 2 differed greatly with regard to the two sets of parameters. Studies have shown that C 1 and C 2 are closely related to the intrinsic activation energy and the temperature sensitivity of the material, and changing the reference temperature will lead to large changes in C 1 and C 2 simultaneously [44]. In this study, the viscoelastic parameters of the material were obtained by two methods, and the reference temperature in the WLF equation was set to 20 °C, which avoided the influence of the reference temperature. Therefore, the difference between C 1 and C 2 might be related to the inherent activation energy of the asphalt mixture, and the reason for the difference might be the way to form the specimens and the loading mode.
The comparison results in Table 9 showed that the material viscoelastic parameters obtained by the optimization method could effectively characterize the rutting resistance of the material and were more accurate in simulating and predicting the flow-type rutting. Therefore, the FEM simulation of WTT and the prediction of flow-type rutting were implemented by using only the WTT, and the simulation accuracy was higher than the simulation results using the EP. In short, the optimization method can replace the dynamic modulus measurement method when utilizing the FEM to analyze and predict the flow-type rutting of the asphalt mixture, which not only can improve the accuracy of the simulation results but also save resources and increase efficiency.

4.4. Sensitivity Analysis of Viscoelastic Parameters

Due to the large number of optimization variables in this study, different parameters have distinct sensitivities to SAE in the optimization process. By analyzing the sensitivity of each parameter to SAE, a better optimization strategy could be determined to reduce the number of iterations and improve the optimization efficiency. Spearman correlation analysis was performed on the viscoelastic parameters and SAE, and the results of the analysis are shown in Table 10.
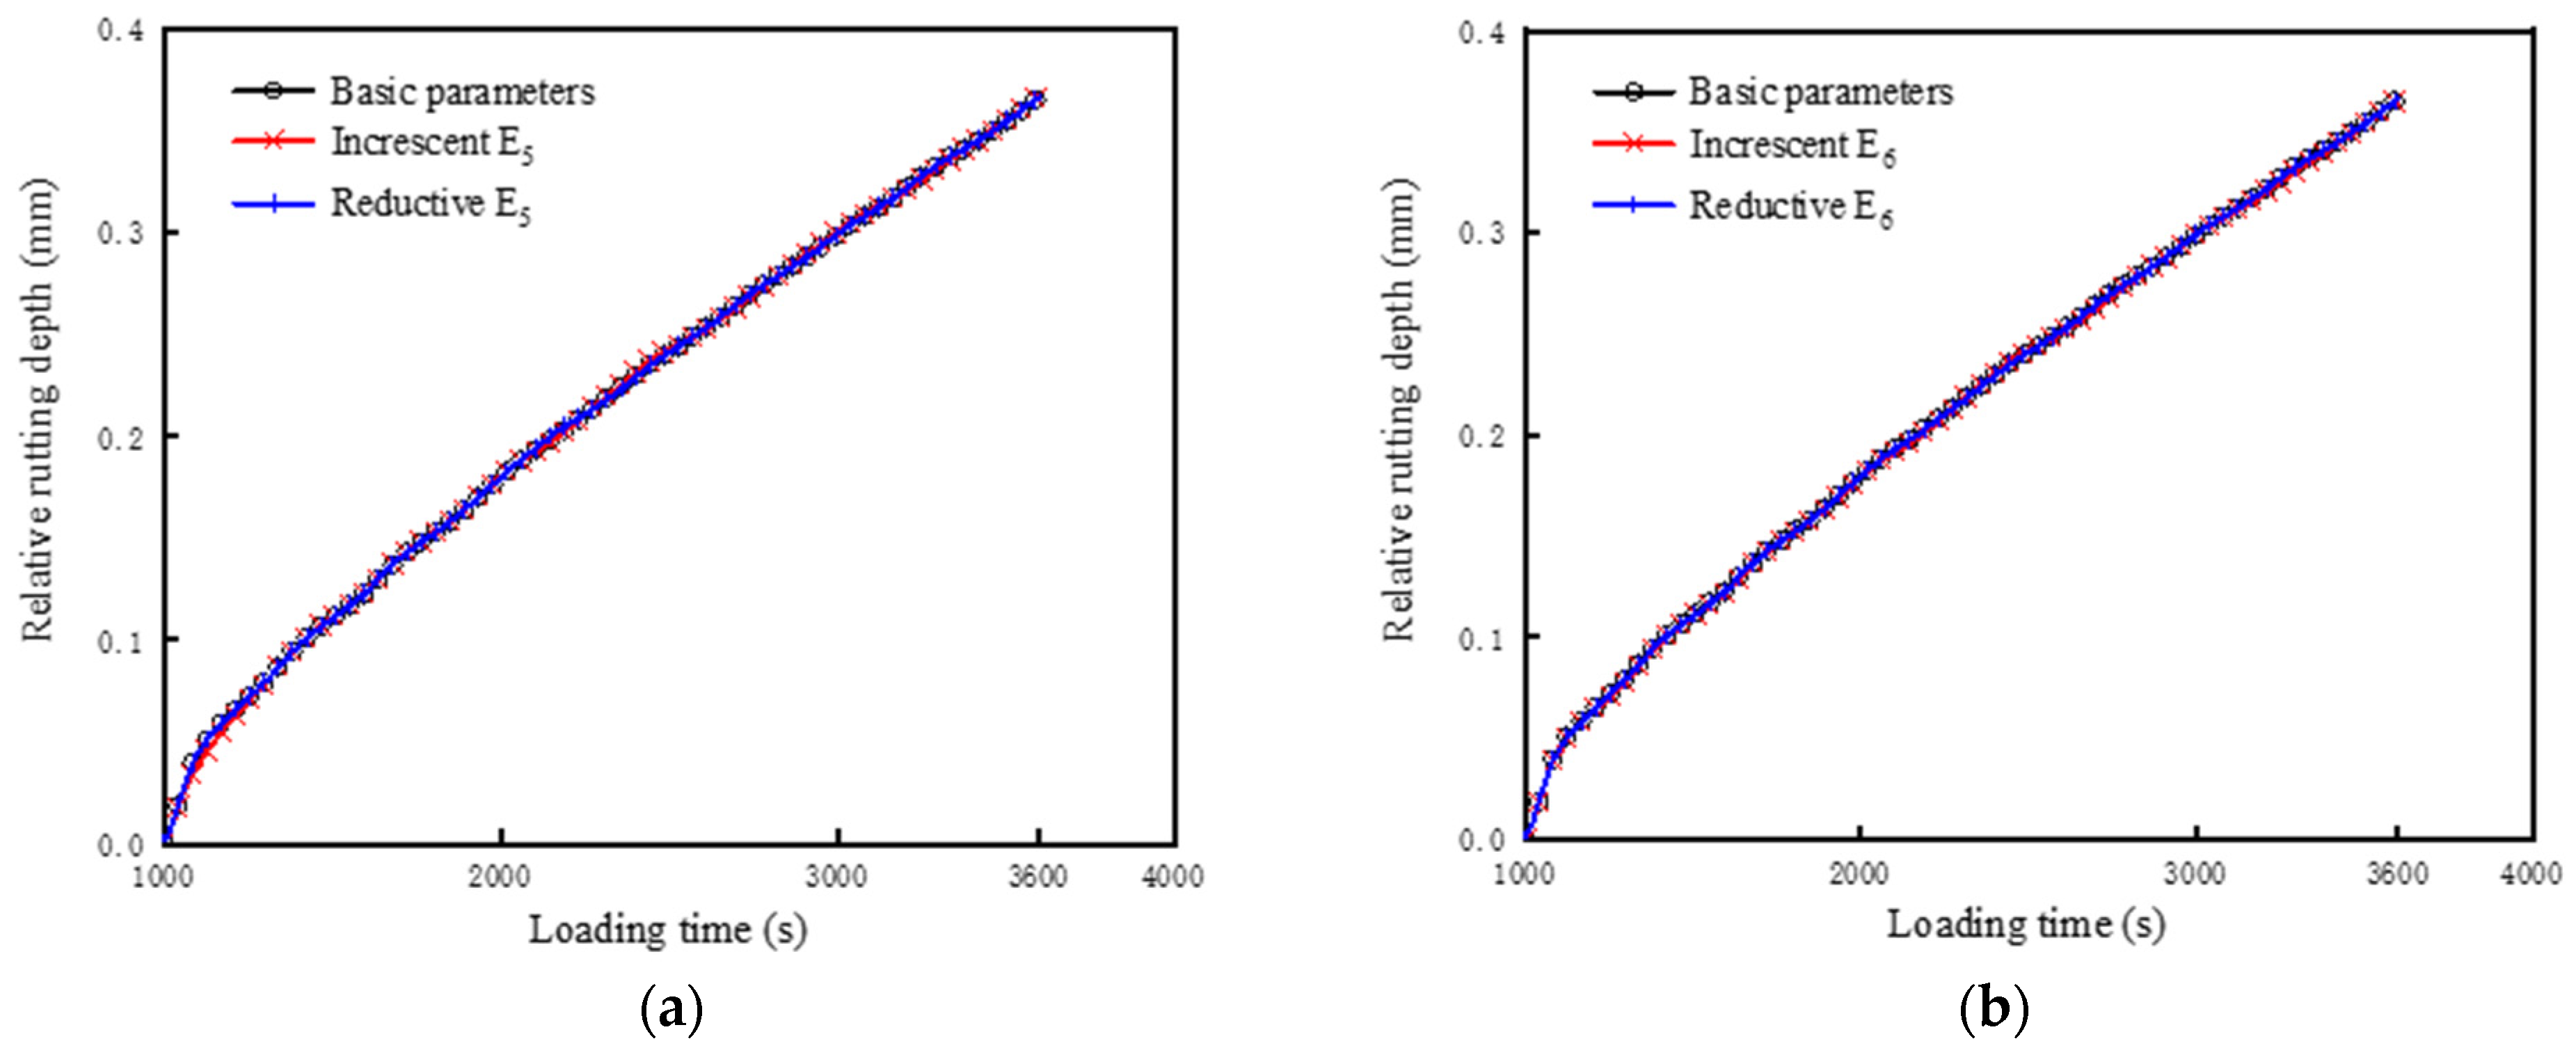
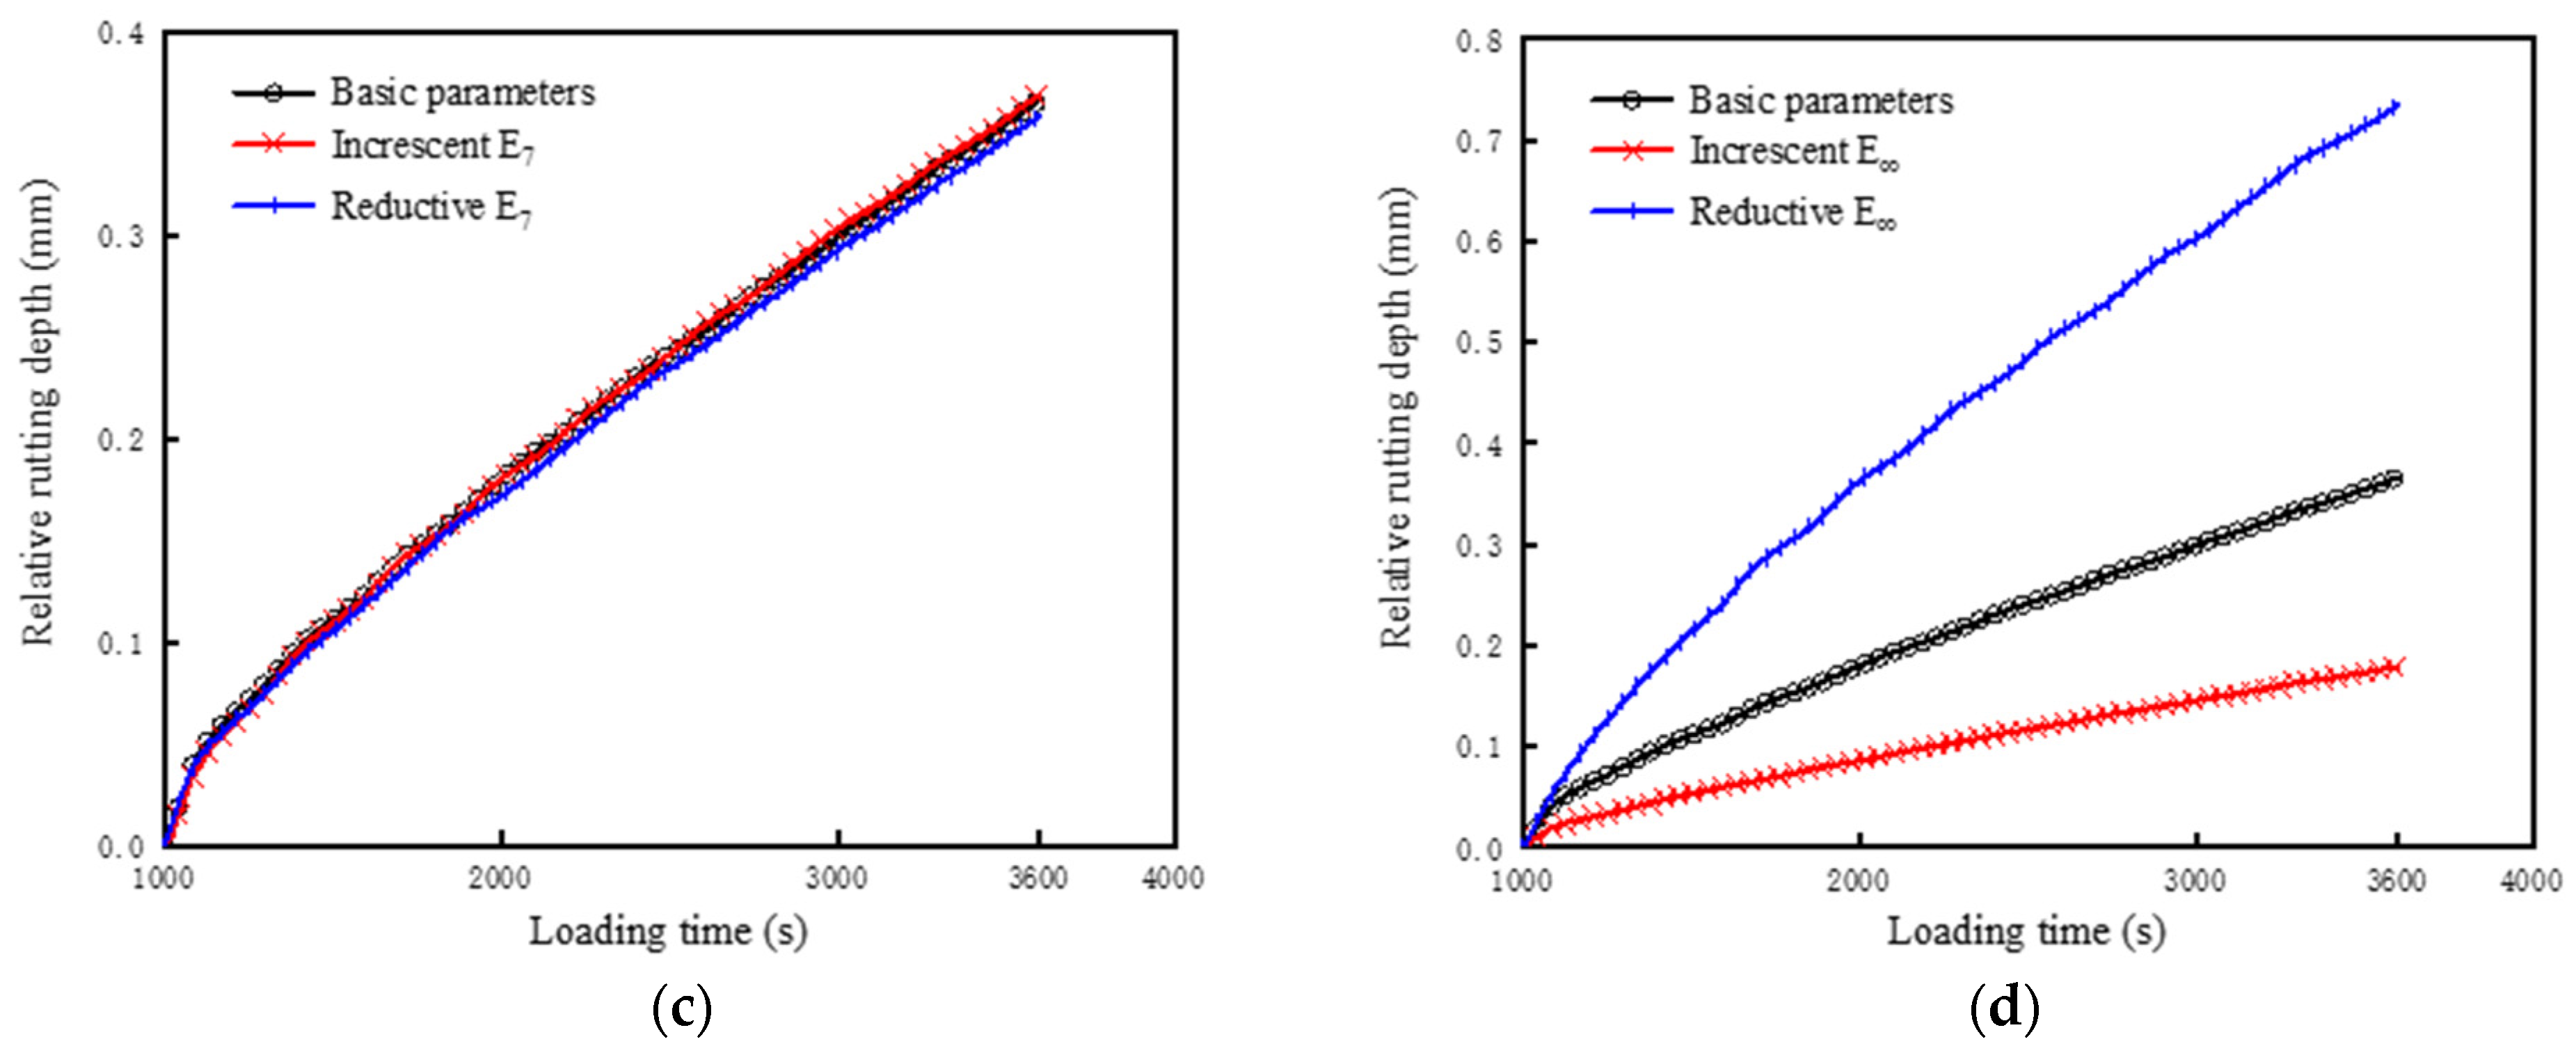
According to the p-value, the parameters E 1 ~ E 4 had no significant correlation with SAE, while the rest were significantly correlated with SAE. The correlation coefficient shows that as the relaxation time increases, the correlation between its corresponding modulus of elasticity and SAE also gradually increases. In addition, C 1 and C 2 were significantly correlated with SAE. They were used as material-related regression parameters, and the reasons for the variation in them have been analyzed in the previous section. Therefore, the sensitivity analysis of the material constants was not analyzed in this study, whereas the sensitivity analysis of E 5 ~ E 7 and E indicated a more significant correlation with SAE. The values of E 1 ~ E 4 , C 1 , and C 2 were obtained through optimization and remained consistent. According to the different parameter combinations shown in Table 11, FEM simulation was conducted to analyze the influence of each parameter on the rutting resistance of the asphalt mixture. In combination with the SAE listed in Table 11, the curves of relative rutting depth with loading time and SAE for different combinations of viscoelastic parameters in Table 11 were plotted, as shown in Figure 12.
From Figure 12, it can be seen that the modulus of elasticity corresponding to a larger relaxation time is more likely to affect SAE, and its influence on SAE increases as the relaxation time increases. The most significant parameter affecting the SAE was E , and the increase or decrease in E would result in SAE error rates of 1575.12% and 3077.11%, respectively. In addition, E has the most significant effect on both the rutting deformation rate and the rutting depth. The larger the E , the smaller the rutting deformation rate and the rutting depth. E is the equilibrium modulus of the material, which represents the modulus when the time is infinite, and represents the recoverable modulus of elasticity as well. The higher the equilibrium modulus, the higher the stiffness of the material and the smaller the deformation rate and permanent deformation under the same loading mode. The sensitivity analysis of these parameters concluded that E 5 ~ E 7 , E , and the material constants C 1 and C 2 had significant effects on the rutting deformation rate and deformation depth. For the subsequent optimization of other viscoelastic parameters of asphalt mixtures, only these six parameters can be optimized under the premise of ensuring the accuracy of the optimization results to improve the optimization efficiency.

5. Conclusions

In this study, a novel method distinct from the traditional test method for determining the viscoelastic parameters of asphalt mixtures was proposed. Kriging models were used in the GA to determine the viscoelastic parameters in the generalized Maxwell model of the asphalt mixture based on the WTT data, in order to characterize the rutting development pattern. The viscoelastic parameters of the asphalt mixture were measured by uniaxial compression tests. The FEM of the WTT was utilized to compare the accuracy of the two sets of parameters. Finally, sensitivity analysis was performed on the viscoelastic parameters. The following conclusions were drawn from this study:
  • The generalized Maxwell model used in the finite element models could accurately reflect the rutting development of asphalt mixtures under high temperatures. The rutting depth variation curves obtained from the finite element models using the optimized parameters were in a high agreement with the WTT curve, showing that the proposed method could determine the viscoelastic parameters of the asphalt mixture for rutting study and prediction.
  • Compared with experimental parameters, the optimized parameters could more accurately simulate the trend of the flow-type rutting depths and reflect the rutting resistance of the asphalt mixture compared to parameters from the experiment. In addition, there was a large error in the simulation of the rutting deformation with the viscoelastic parameters obtained under the uniaxial compression loading mode. This might be related to the inability of this loading mode to reflect the shear properties of the material.
  • Among the 10 parameters mentioned above, the dynamic modulus corresponding to a larger relaxation time was more sensitive to the mechanical response of the asphalt mixture. The equilibrium modulus had the most significant influence on the growth rate and rutting depth. Therefore, the number of parameters can be appropriately reduced to improve the optimization efficiency in the subsequent parameters’ optimization.

Author Contributions

Conceptualization, J.Z. (Jinxi Zhang) and W.Z.; methodology, J.Z. (Jia Zhang) and W.Z.; software, W.Z.; validation, W.Z. and D.C.; formal analysis, W.Z.; data curation, W.Z.; writing—original draft preparation, J.Z. (Jinxi Zhang) and W.Z.; writing—review and editing, J.Z. (Jinxi Zhang) and W.Z.; supervision, J.Z. (Jinxi Zhang); funding acquisition, J.Z. (Jinxi Zhang). All authors have read and agreed to the published version of the manuscript.

Funding

This research was funded by the National Natural Science Foundation of China [Grant Number 52278423].

Data Availability Statement

The data presented in this study are available on request.

Conflicts of Interest

The authors declare no conflict of interest.

References

  1. Wang, H.; Zhang, Q.S.; Tan, J.Q. Investigation of Layer Contributions to Asphalt Pavement Rutting. J. Mater. Civ. Eng. 2009, 21, 181–185. [Google Scholar] [CrossRef]
  2. Guo, R.; Nian, T.F.; Zhou, F. Analysis of factors that influence anti-rutting performance of asphalt pavement. Constr. Build. Mater. 2020, 254, 119237. [Google Scholar] [CrossRef]
  3. Zhang, J.P.; Zhu, C.Z.; Li, X.Q.; Pei, J.Z.; Chen, J. Characterizing the three-stage rutting behavior of asphalt pavement with semi-rigid base by using UMAT in ABAQUS. Constr. Build. Mater. 2017, 140, 496–507. [Google Scholar] [CrossRef]
  4. Shan, L.Y.; Tan, Y.Q.; Zhang, H.; Xu, Y.A. Analysis of Linear Viscoelastic Response Function Model for Asphalt Binders. J. Mater. Civ. Eng. 2016, 28, 04016010. [Google Scholar] [CrossRef]
  5. Rameshkhah, S.; Olounabadi, M.M.; Malekzadeh, P.; Meraji, S.H. Dynamic response analysis of viscoelastic pavement using differential quadrature element method. Int. J. Pavement Eng. 2020, 21, 1321–1335. [Google Scholar] [CrossRef]
  6. Alimohammadi, H.; Zheng, J.X.; Buss, A.; Schaefer, V.R.; Williams, C.; Zheng, G.F. Field and simulated rutting behavior of hot mix and warm mix asphalt overlays. Constr. Build. Mater. 2020, 265, 120366. [Google Scholar] [CrossRef]
  7. Sun, Y.Z.; Gu, B.C.; Gao, L.; Li, L.J.; Guo, R.; Yue, Q.Q.; Wang, J.C. Viscoelastic Mechanical Responses of HMAP under Moving Load. Materials 2018, 11, 2490. [Google Scholar] [CrossRef] [PubMed]
  8. Fan, Y.L.; Wu, Y.; Chen, H.M.; Liu, S.N.; Huang, W.; Wang, H.Z.; Yang, J. Performance Evaluation and Structure Optimization of Low-Emission Mixed Epoxy Asphalt Pavement. Materials 2022, 15, 6472. [Google Scholar] [CrossRef]
  9. Chen, H.; Hoff, I.; Liu, G.; Zhang, X.M.; Barbieri, D.M.; Wang, F.S.; Liu, J.A. Development of finite element model based on indirect tensile test for various asphalt mixtures. Constr. Build. Mater. 2023, 394, 132085. [Google Scholar] [CrossRef]
  10. Ho, C.H.; Romero, P. Alternative Function to Represent Relaxation Modulus of Viscoelastic Materials. J. Mater. Civ. Eng. 2012, 24, 152–158. [Google Scholar] [CrossRef]
  11. Alae, M.; Ling, M.; Haghshenas, H.F.; Zhao, Y.Q. Three-dimensional finite element analysis of top-down crack propagation in asphalt pavements. Eng. Fract. Mech. 2021, 248, 107736. [Google Scholar] [CrossRef]
  12. Li, L.L.; Li, W.L.; Wang, H.; Zhao, J.N.; Wang, Z.Y.; Dong, M.S.; Han, D. Investigation of Prony series model related asphalt mixture properties under different confining pressures. Constr. Build. Mater. 2018, 166, 147–157. [Google Scholar] [CrossRef]
  13. Liu, H.Q.; Luo, R.; Lv, H.J. Establishing continuous relaxation spectrum based on complex modulus tests to construct relaxation modulus master curves in compliance with linear viscoelastic theory. Constr. Build. Mater. 2018, 165, 372–384. [Google Scholar] [CrossRef]
  14. Jamshidi, A.; White, G.; Hosseinpour, M. Revisiting the correlation between the dynamic modulus and the flexural modulus of hot mixture asphalt. Constr. Build. Mater. 2021, 296, 123697. [Google Scholar] [CrossRef]
  15. Di Benedetto, H.; Partl, M.N.; Francken, L.; De La Roche Saint Andre, C. Stiffness testing for bituminous mixtures. Mater. Struct. 2001, 34, 66–70. [Google Scholar] [CrossRef]
  16. Chen, H.; Saba, R.G.; Liu, G.; Barbieri, D.M.; Zhang, X.M.; Hoff, I. Influence of material factors on the determination of dynamic moduli and associated prediction models for different types of asphalt mixtures. Constr. Build. Mater. 2023, 365, 130134. [Google Scholar] [CrossRef]
  17. Cui, L.L.; Ling, T.Q.; Sun, F.; Zhang, Z.Y.; Xin, J.Z. Study of in situ dynamic modulus prediction of asphalt mixture utilizing Ground penetrating radar technology. Constr. Build. Mater. 2022, 350, 128695. [Google Scholar] [CrossRef]
  18. Pronk, A.C. Calibration of 4PB Tests Taking into Account Shear Forces and other Equipment Factors. Road Mater. Pavement Des. 2009, 10, 373–386. [Google Scholar] [CrossRef]
  19. Huang, Y.; Liu, C.H.; Wang, X.D. Comparison of HMA dynamic modulus between trapezoid beam test and SPT. J. Cent. South Univ. (Sci. Technol.) 2017, 48, 3092–3099. [Google Scholar]
  20. Ruan, L.; Luo, R.; Hu, X.D.; Pan, P. Effect of bell-shaped loading and haversine loading on the dynamic modulus and resilient modulus of asphalt mixtures. Constr. Build. Mater. 2018, 161, 124–131. [Google Scholar] [CrossRef]
  21. Qin, X.C.; Ma, L.; Wang, H. Comparison analysis of dynamic modulus of asphalt mixture: Indirect tension and uniaxial compression test. Transp. A-Transp. Sci. 2019, 15, 165–178. [Google Scholar] [CrossRef]
  22. Cheng, H.L.; Wang, Y.H.; Liu, L.P.; Sun, L.J. Effects of using different dynamic moduli on predicted asphalt pavement responses in mechanistic pavement design. Road Mater. Pavement Des. 2022, 23, 1860–1876. [Google Scholar] [CrossRef]
  23. Coleri, E.; Harvey, J.T.; Yang, K.; Boone, J.M. Investigation of asphalt concrete rutting mechanisms by X-ray computed tomography imaging and micromechanical finite element modeling. Mater. Struct. 2013, 46, 1027–1043. [Google Scholar] [CrossRef]
  24. Cheng, H.L.; Wang, Y.H.; Liu, L.P.; Sun, L.J.; Zhang, Y.N.; Yang, R.K. Estimating Tensile and Compressive Moduli of Asphalt Mixture from Indirect Tensile and Four-Point Bending Tests. J. Mater. Civ. Eng. 2021, 33, 04020402. [Google Scholar] [CrossRef]
  25. Phan, H.T.; Le, V.P.; Lee, H.J. Application of Dynamic Stability Criterion in Evaluating Field Rutting of Asphalt Pavements Using the Wheel Tracking Test. J. Transp. Eng. Part B-Pavements 2022, 148, 04022019. [Google Scholar] [CrossRef]
  26. Taherkhani, H.; Jalali, M. Investigating the performance of geosynthetic-reinforced asphaltic pavement under various axle loads using finite-element method. Road Mater. Pavement Des. 2017, 18, 1200–1217. [Google Scholar] [CrossRef]
  27. Tschoegl, N.W. The Phenomenological Theory of Linear Viscoelastic Behavior; Springer: Berlin/Heidelberg, Germany, 1989. [Google Scholar]
  28. Liao, J.; Sargand, S. Viscoelastic FE Modeling and Verification of a U.S. 30 Perpetual Pavement Test Section. Road Mater. Pavement Des. 2010, 11, 993–1008. [Google Scholar] [CrossRef]
  29. Han, Z.H.; Gortz, S. Hierarchical Kriging Model for Variable-Fidelity Surrogate Modeling. Aiaa J. 2012, 50, 1885–1896. [Google Scholar] [CrossRef]
  30. Kwon, H.; Yi, S.; Choi, S. Numerical investigation for erratic behavior of Kriging surrogate model. J. Mech. Sci. Technol. 2014, 28, 3697–3707. [Google Scholar] [CrossRef]
  31. Zhao, Y.; Lu, W.X.; Xiao, C.N. A Kriging surrogate model coupled in simulation-optimization approach for identifying release history of groundwater sources. J. Contam. Hydrol. 2016, 185, 51–60. [Google Scholar] [CrossRef]
  32. Zhang, J.; Zhang, J.X.; Cao, D.D. Genetic algorithm optimization for cohesive zone modeling of viscoelastic asphalt mixture fracture based on SCB test. Eng. Fract. Mech. 2022, 271, 108663. [Google Scholar] [CrossRef]
  33. Plati, C.; Georgouli, K.; Cliatt, B.; Loizos, A. Incorporation of GPR data into genetic algorithms for assessing recycled pavements. Constr. Build. Mater. 2017, 154, 1263–1271. [Google Scholar] [CrossRef]
  34. Rakesh, N.; Jain, A.K.; Reddy, M.A.; Reddy, K.S. Artificial neural networks—Genetic algorithm based model for backcalculation of pavement layer moduli. Int. J. Pavement Eng. 2006, 7, 221–230. [Google Scholar] [CrossRef]
  35. Kouevidjin, A.B.; Barthélémy, J.F.; Somé, S.C.; Ben Dhia, H.; Mouillet, V. Modelling of viscoelastic properties and crack growth in bituminous mixtures: Application to the simulation of crack growth in semi-circular samples subjected to oxidative ageing. Eng. Fract. Mech. 2022, 271, 108580. [Google Scholar] [CrossRef]
  36. Zhang, J.; Zhang, J.; Cao, D.; Ding, Y.; Zhou, W. Mechanistic analysis of bottom-up crack in asphalt pavement using cohesive zone model. Theor. Appl. Fract. Mech. 2023, 125, 103904. [Google Scholar] [CrossRef]
  37. Dorea, C.C.Y.; Guerra, J.A.; Morgado, R.; Pereira, A.G.C. Multistage Markov Chain Modeling of the Genetic Algorithm and Convergence Results. Numer. Funct. Anal. Optim. 2010, 31, 164–171. [Google Scholar] [CrossRef]
  38. JTG E20-2011; Standard Test Methods of Bitumen and Bituminous Mixtures for Highway Engineering. Ministry of Transport: Beijing, China, 2011.
  39. AASHTO T 342-11; Standard Method of Test for Determining Dynamic Modulus of Hot Mix Asphalt Concrete Mixtures. AASHTO: Washington, DC, USA, 2001.
  40. Ashokan, B.K.; Kokini, J.L. Determination of the WLF constants of cooked soy flour and their dependence on the extent of cooking. Rheol. Acta 2005, 45, 192–201. [Google Scholar] [CrossRef]
  41. Zhao, Y.Q.; Cao, D.D.; Chen, P.S. Dynamic backcalculation of asphalt pavement layer properties using spectral element method. Road Mater. Pavement Des. 2015, 16, 870–888. [Google Scholar] [CrossRef]
  42. Hua, J. Finite Element Modeling and Analysis of Accelerated Pavement Testing Devices and Rutting Phenomenon. Ph.D. Thesis, ProQuest, Ann Arbor, MI, USA, 2000. [Google Scholar]
  43. Gao, Y.X.; Zeng, H.X.; Zhang, D.S. Research on Influencing Factors on Asphalt Mixture Shear Strength. J. Highw. Transp. Res. Dev. 2009, 26, 28–32. [Google Scholar]
  44. Bartolomeo, P.; Chailan, J.F.; Vernet, J.L. On the use of WLF equation to study resin curing by dielectric spectroscopy. Polymer 2001, 42, 4385–4392. [Google Scholar] [CrossRef]
Figure 1. Components of the generalized Maxwell model.
Infrastructures 08 00169 g001
Figure 2. Flowchart of the optimization process.
Infrastructures 08 00169 g002
Figure 3. The WTT of AC-13.
Infrastructures 08 00169 g003
Figure 4. Rutting depth curve: (a) total rutting depth curve over time; (b) rutting depth curve after a loading duration of 1000 s.
Infrastructures 08 00169 g004
Figure 5. Determination of dynamic modulus of materials by uniaxial compression.
Infrastructures 08 00169 g005
Figure 6. Dynamic modulus master curve of AC-13.
Infrastructures 08 00169 g006
Figure 7. Finite element model of the wheel tracking test: (a) division of the FEM; (b) loading and boundary conditions of the FEM simulation.
Infrastructures 08 00169 g007
Figure 8. Simplified load contact model.
Infrastructures 08 00169 g008
Figure 9. Optimization iteration convergence curve.
Infrastructures 08 00169 g009
Figure 10. Comparison of rut depth variation trend between simulation and experiment.
Infrastructures 08 00169 g010
Figure 11. The vertical sheer stress distribution along the X = 0 plane in the FEM.
Infrastructures 08 00169 g011
Figure 12. Influence of viscoelastic parameters on the simulation results: (a) E5; (b) E6; (c) E7; (d) E.
Infrastructures 08 00169 g012aInfrastructures 08 00169 g012b
Table 1. Prony series parameters.
τ i ( s ) E i ( M P a )
0.001 E 1
0.01 E 2
0.1 E 3
1 E 4
10 E 5
100 E 6
1000 E 7
Infinity E
Table 2. The range of optimized parameter values.
Viscoelastic ParametersMinimum ValueMaximum Value
E 1 015,000 MPa
E 2 010,000 MPa
E 3 08000 MPa
E 4 05000 MPa
E 5 03000 MPa
E 6 02000 MPa
E 7 01000 MPa
E 0100 MPa
C 1 1030
C 2 10300
Table 3. Physical properties of the SBS-modified asphalt.
ItemsPenetration
(25 °C, 0.1 mm)
Ductility
(25 °C, cm)
Softening Point
(°C)
Viscosity
(135 °C, Pa∙s)
SBS-modified asphalt69>15081.52.263
Table 4. The gradation of aggregate in the AC-13 asphalt mixture.
Sieve size/mm16.013.29.54.752.361.180.60.30.150.075
Passing rate/%100.095.076.553.037.026.519.013.510.06.0
Table 5. WTT test results.
MaterialsRelative Rutting Depth (mm)Rutting Depth (mm)DS (Times/mm)
AC-130.3551.3287875
Table 6. Prony series parameters of AC-13.
τ i ( s ) E i ( M P a )
0.00110,445.190
0.017307.682
0.14157.773
11697.304
10825.104
100158.589
1000203.613
Infinity40.232
Table 7. Specifics of the 25 sets of initial sample points.
E 1
(MPa)
E 2
(MPa)
E 3
(MPa)
E 4
(MPa)
E 5
(MPa)
E 6
(MPa)
E 7
(MPa)
E
(MPa)
C 1 C 2 SAE
(mm)
14,234.667921.824879.952146.03877.61214.35346.2948.0314.53177.4569.4
5714.479778.505249.521326.611647.28312.9173.1337.4410.49252.9221.0
9962.966257.963831.731882.121630.42275.32203.6149.4521.14181.13190.3
11,330.955723.034463.771236.601051.13322.6462.6449.4921.12197.1028.0
6474.037112.444693.832387.69995.12142.901.7149.5411.33130.3159.2
7902.771769.874880.033252.78877.61214.2494.3743.2011.24230.8126.6
5452.405737.014754.711066.521256.93493.06102.9134.6321.01270.3957.6
11,707.557383.455049.702427.011462.02364.5741.7351.0615.31229.4132.1
13,779.476259.294879.952145.981078.85111.75255.8351.3711.24135.0371.1
6155.029163.473339.411472.471579.49430.89398.1825.7815.81290.35186.9
7033.776666.794879.952005.771152.97189.8975.6452.8917.59176.5745.8
11,919.995439.853735.722981.71763.80173.23216.8953.0816.85182.7747.6
14,437.678353.784880.322126.11877.61214.2989.8554.1710.01133.8182.0
7459.345357.243782.131389.791929.09101.98157.0355.3712.57107.72190.0
7658.087921.823018.702327.111293.32232.09199.0056.1824.75263.2851.6
5879.708965.314879.952146.03877.61110.91249.1257.5410.76130.3129.7
7943.796229.673966.842617.61835.60168.1486.2359.1819.32157.79104.3
9677.716152.514879.952146.031265.92232.09198.9959.2021.20169.10193.6
10,383.759718.843134.271497.97788.03386.57139.8931.4112.44122.2727.9
13,369.459963.373884.262757.35637.19357.26279.9343.9713.81294.36149.8
14,636.837818.664936.382894.79587.86411.26131.8239.9623.08137.1432.8
13,326.935172.035783.641212.751818.82328.38307.0249.0513.89280.1493.8
11,445.297796.165774.632227.541788.96157.95445.1851.9513.13240.1023.4
7344.107338.864693.832389.09690.83335.2593.4822.0712.03232.6222.6
Table 8. Optimized results.
E 1
(MPa)
E 2
(MPa)
E 3
(MPa)
E 4
(MPa)
E 5
(MPa)
E 6
(MPa)
E 7
(MPa)
E
(MPa)
C 1 C 2 SAE
(mm)
10,133.337753.274879.952147.25877.58214.29255.6441.2111.1129.26.03
Table 9. Comparison between simulation and test results.
ItemsRelative Rutting Depth (mm)DS (Time/min)Error Rate of Relative Rutting Depth (%)Error Rate of DS (%)
WTT0.3557875--
Simulation of OP0.36677563.11.5
Simulation of EP0.33960334.523.4
Table 10. Correlation analysis between viscoelastic parameters and SAE.
Items E 1 E 2 E 3 E 4 E 5 E 6 E 7 E C 1 C 2
Correlation coefficient−0.0220.105−0.046−0.0340.2450.222−0.4140.3940.4270.359
p-value0.7310.0990.4750.597<0.001<0.001<0.001<0.001<0.001<0.001
p-value less than 0.05 indicates a significant correlation with SAE.
Table 11. The viscoelastic parameter combinations and the corresponding error rate of SAE.
Items E 5
(MPa)
E 6
(MPa)
E 7
(MPa)
E
(MPa)
SAE
(mm)
Error Rate of SAE (%)
Basic parameters877.58214.29255.6441.216.03-
Increscent E 5 1755.15214.29255.6441.216.6610.45
Reductive E 5 438.79214.29255.6441.217.0416.75
Increscent E 6 877.58428.58255.6441.217.1819.07
Reductive E 6 877.58107.15255.6441.217.0817.41
Increscent E 7 877.58214.29511.2841.216.6810.78
Reductive E 7 877.58214.29127.8241.219.8062.52
Increscent E 877.58214.29255.6482.42101.011575.12
Reductive E 877.58214.29255.6420.60191.583077.11
Disclaimer/Publisher’s Note: The statements, opinions and data contained in all publications are solely those of the individual author(s) and contributor(s) and not of MDPI and/or the editor(s). MDPI and/or the editor(s) disclaim responsibility for any injury to people or property resulting from any ideas, methods, instructions or products referred to in the content.