Abstract
The applications of the deep belief network (DBN) for addressing practical engineering issues have recently emerged all over the world thanks to its accuracy and availability of data. In this paper, a predictive model using DBN was employed to investigate the factors that affect the ground-penetrating radar (GPR) signals from the rebar embedded in concrete structures. Four variables, namely temperature, relative humidity, chloride contamination level, and rebar surface corrosion condition were used as the model inputs for the investigation. Comprehensive data acquired from previously published documents were used to establish the proposed DBN model. It was shown that temperature and chloride contamination level variables generated significant effects on the GPR amplitude signal from rebar. In contrast, the relative humidity and rebar surface corrosion condition parameters were found to yield a minimal influence on the output of the proposed model. The DBN model can be used to predict the amplitude of GPR signals from the four inputs with a high level of accuracy. Specifically, the coefficient of determination (R2) was 0.9634 and 0.9681 for the testing dataset and the entire database, respectively.
1. Introduction
Ground-penetrating radar is a non-destructive and reliable method that is commonly employed to scan and image immersed objects. GPR was originally developed in geologic engineering to study the earth’s structure. Along with the development of technology and demand, the applications of the GPR technique have been expanded in many sectors including civil engineering [1]. GPR utilizes high-frequency electromagnetic waves between 10 to 7000 MHz to obtain subsurface information through the variation in electric permittivity, conductivity, and magnetic permeability of the survey medium. The GPR method for subsurface investigation has been standardized by ASTM D6432 [2].
Figure 1a shows a common GPR device. It normally consists of a transmitter and receiver antenna, a radar control unit, and a display. The GPP works by emitting electromagnetic pulses to the targeted survey through the transmitting antenna and receiving the reflected waves from the medium via a receiving antenna. The process of collecting data on a sub-surface object using a GPR device is shown in Figure 1b. In civil engineering, the GPR method has been widely used for condition assessment of concrete structures [3,4,5], evaluating the strength of materials [6,7], detecting the delamination or deterioration of concrete structures [8,9], estimating concrete thickness cover and rebar diameter [10,11], and localizing/pinpointing the rebar in concrete [12].
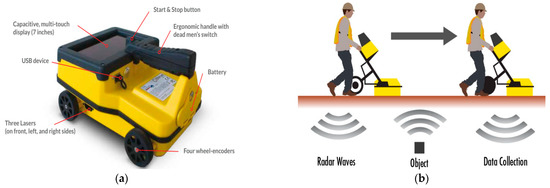
Figure 1.
GPR unit and the data collection process [1]: (a) Configuration of an GPR unit; (b) Field GPR data collection practice.
Experimental GPR data can be collected either through the contact or contactless method. In the contact method, the GPR device was placed directly on the surface of the survey area. GPR device is manually operated, and data are collected by the users. The travel distances of the antenna/device are determined using the encoder to monitor the number of rotating cycles of the attached wheels. The greatest benefit of this method is that it can be conducted in a narrow area or a vertical direction. The method, however, is less advantageous when rapid screening is required for the survey of large areas such as bridge decks or highway road surfaces.
The contactless GPR technique or auto is a widely used method to collect GPR data for large areas. In this method, the GPR device was attached to the vehicle at a distance from the surface of the survey areas. The GPR device operates while the vehicle moves at a certain speed. The data collected from the GPR device are automatically synchronized with the traveling distance of the moving vehicle. This technique can collect GPR data at the traffic speed, and as a result, can significantly decrease the inspection timelines as well as reduce the need for road closure and traffic control.
The impacts of chloride contamination, surface rust on rebar, and environmental conditions on GPR signals have been investigated by various researchers [13,14,15,16,17,18,19,20]. For instance, Hugenschmidt and Loser [15] studied the effects of moisture and chloride contamination on the reflected radar signals. A measurable influence of both moisture and chloride contamination factors on the radar signal was reported in their work. In a more recent study, Senin and Hamid [16] concluded in their study that chloride content in concrete produced a higher signal amplitude attenuation compared to that of moisture.
Relating to the effects of rebar surface rust, Martino [17] stated in their study that there was no significant difference in the reflection amplitude of the radar signals between rebar with a 5 mm thick layer of rust and the intact rebar. A recent study by Liu et al. [18], however, reported that the rust on the rebar surface was sensitive to the radar signals, as a result, they stated that the early stage of corrosion can be detected and visualized by analyzing the reflected radar signal. Besides the influence of the rust and chloride contamination, the effects of environmental conditions such as temperature and relative humidity on the radar signal were also found in the work of several investigators such as Varnavina et al. [19] and Dinh et al. [20].
Recently, researchers [21,22,23,24,25,26,27,28,29,30,31] have also applied intelligence-based methods to analyze the experimental data as well as to investigate the factors that affect the GPR signals. For instance, Dinh et al. [30] employed an ANN technique to process the experimental GPR data for examining the effects of concrete cover thickness on rebar reflection amplitude and establishing the relationship between the input variables and the output GPR signals. The results from the study showed that the ANN model produced a high level of accuracy in establishing the input and output correlation. In a recent study, Liu et al. [31] utilized an adaptive linear neural network to evaluate the backscattering properties of GPR data. Results from the research revealed the inverted backscattering intensity with a relative error rate of less than three percent.
A DBN model was employed in this study to analyze the GPR amplitude output from the various inputs. Experimental GPR data obtained from previous publications were used to establish the proposed model. Presently, very few intelligence-based models have been used to analyze GPR data [30,31]. To the best of the authors’ knowledge, no available publications employ the DBN method to analyze the experimental GPR data. The main aim of this research is to fill the knowledge of utilizing the machine learning-based technique to investigate the influences of the input factors on the output. Additionally, the authors would like also to create a non-linear relationship between the amplitude of GPR signals and the input variables.
2. Methodology
In the subsequent sections, the structure of the proposed predictive model using the DBN method will be introduced. The proposed model aimed at establishing the non-linear relationship between various inputs to the reflection amplitude of GPR signals. The DBN subroutine was adopted from Tanaka [32] using MATLAB R2022 Runtime Environment. Additionally, information on different indicators employed to evaluate the performance of the proposed DBN model will be briefly described.
2.1. Deep Belief Networks Structure
Deep belief networks are learning algorithms employing probabilities to generate the output. The structure of the common DBN consists of several restricted Boltzmann machine (RBM) units that connect to each other as illustrated in Figure 2. The first RBM unit is the visible layer, and the following ones are the hidden layers.
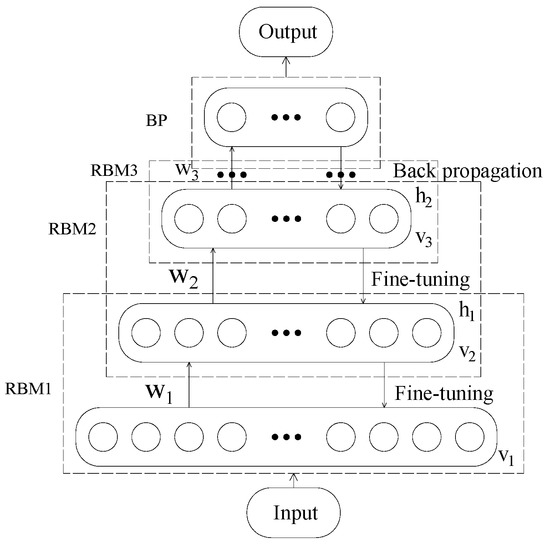
Figure 2.
Deep belief network structure.
The structure of RBM consists of one visible and one hidden layer. The neurons between the two layers are fully connected. However, there is no connection between neurons in the same layer [23]. Figure 3 presents a typical framework of an RBM. In this figure, vi designates the unit in the visible layer v, and hi is the unit in the hidden layer h. W is the connection weight between two layers, ai denotes the offset vector of the visible unit and bi represents the bias of the hidden unit.
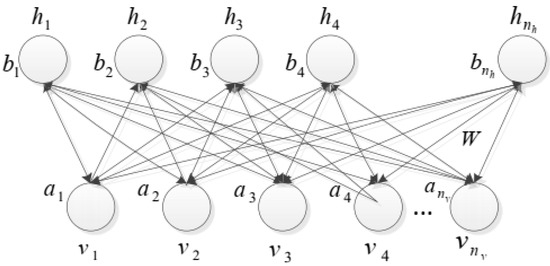
Figure 3.
Restricted Boltzmann machine architecture.
2.2. Performance Metrics
The performance of the DBN model was assessed based on the coefficient of determination (R2) and root mean squared error (RMSE), which were presented in Equations (1) and (2), respectively.
where xi is the ith actual output; is the mean of the actual outputs; is the ith predicted outputs; n is the total number of data records.
3. Data Description
The GPR data used in this study were obtained from the previously published source [25]. The data set was collected inside an environmental chamber with the temperature varied from 5 °C to 40 °C at three ambient relative humidity levels of 55%, 70%, and 85%, respectively. Six specimens with an overall dimension of 36.5 × 114.3 × 17.8 cm (width × length × thickness) containing contaminated concrete with a chloride level varied from 0 to 0.1 percent (of weight) were used. In each specimen, one pre-corroded and one non-corroded #5 rebar were installed at an identical depth from the surface. The detail of these parameters is listed in Table 1.

Table 1.
Parameters related to GPR data.
3.1. Characteristics of the Experimental Data
The raw GPR data were processed and converted to decibels (dB). The complete data set was achieved in a matrix with 288 rows and five columns. Columns 1 to 5 stored information on five properties, namely temperature (T), relative humidity (RH), chloride contamination level (CL), rebar surface corrosion condition (CS), and amplitude of the signal from rebar (A), respectively. The range of these parameters is shown in Table 2. Note that the rebar corrosion status data were converted into a readable format for the DBN model (i.e., numerical number) with 0 represented for the non-corroded rebar and 1 designated for the corroded rebar.

Table 2.
Descriptive statistics of the experimental data.
Before employing data for training and testing the DBN model, the data were normalized within the range [0, 1] using Equation (3)
where X and Xnorm represent the original and normalized values, respectively. Xmax and Xmin indicate the largest and smallest values of X, respectively.
Figure 4 presents the histogram of the output. The detailed relationship between the output with each input parameter in the entire experimental data is shown in Figure 5.
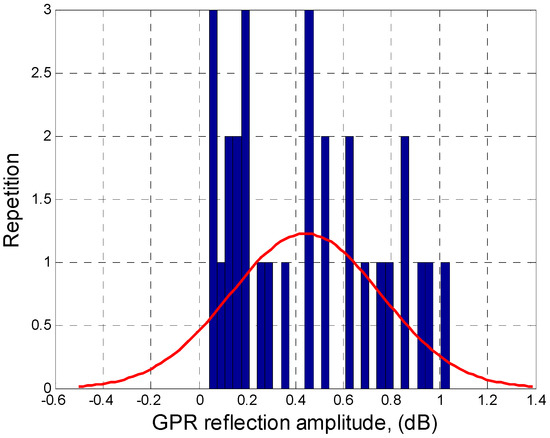
Figure 4.
Histogram of output parameters.
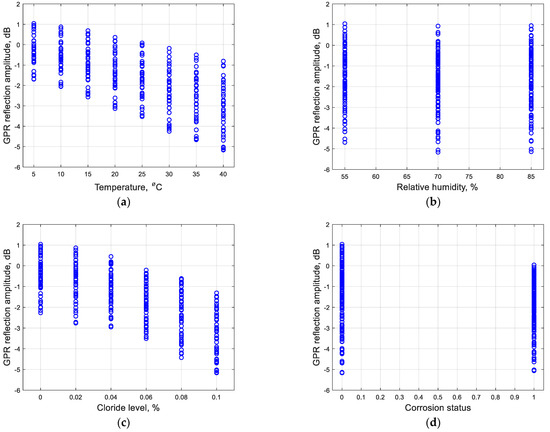
Figure 5.
Input and output relationship of the experimental data: (a) Temperature; (b) Relative humidity; (c) Chloride contamination level; (d) Rebar corrosion status.
3.2. Application of the DBN Model to Predict GPR Amplitude
The applications of a predictive model using the DBN method have been widely applied among researchers in addressing both unsupervised problems [33,34,35,36] and supervised issues [37,38,39]. In this research, a supervised DBN model was used to predict the GPR amplitude from the concrete structures using various inputs. A comprehensive database consisting of 288 experimental records obtained from the previous publication was used for training and testing the proposed DBN model.
4. Results and Discussion
As previously mentioned, four input variables, namely temperature, relative humidity, chloride contamination level, and rebar surface corrosion condition were utilized to predict the amplitude of the signal from the rebar of concrete slabs. The entire database was arbitrarily divided into training and testing datasets at a ratio of 80/20. That means the testing dataset consisted of 244 instances while 44 data points were in the testing dataset. The k-fold cross-validation method was used for hyperparameter tuning of the predictive DBN model. The performance of the predictive model was evaluated based on R2 and RMSE meters. Finally, the parameter analysis was also conducted. Details of mentioned work are presented in the following sections.
4.1. Influence Factor Investigation
A parametric study was conducted to evaluate the influence of the inputs on the amplitude of GPR signals from rebar of concrete structures. With the interaction of multiple input variables to the estimation value of the output, the couple considered input parameters were changed from the lowest to the highest range while the rest input variables stayed at their mean value. It is worth noting that the symbols Low, ML, Mean, MH, and High in Table 3 are the abbreviation of the smallest, middle-low, mean, middle-high, and largest values of each input parameter.

Table 3.
Quantities of four input variables.
Figure 6a,b shows the influence of changing the temperature parameter (i.e., T) coupled with a variation of other input variables (i.e., CL, and CS, respectively) on the output. During the variation of temperature, other variables were also changed to estimate the interaction effects between temperature variables and other parameters on the reflection amplitude of GPR signals. It should be noted that up to two-order interactions are considered in this study. The influence of the relative humidity parameter coupled with other input variables on the output is presented in Figure 6d,e.
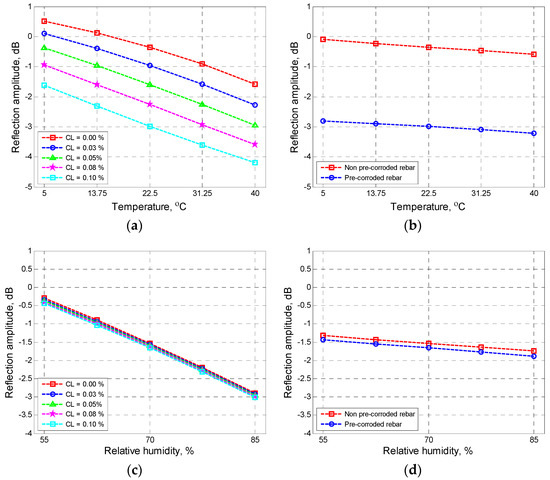
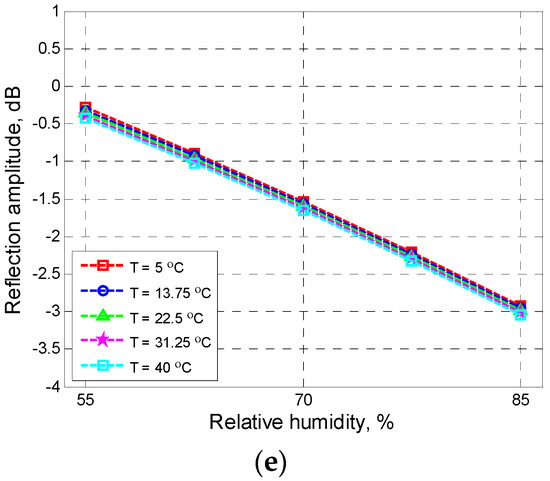
Figure 6.
Effect of temperature (a,b) and relative humidity (c–e).
By the same token, the influence of changing chloride contamination level parameters (i.e., CL) and varying rebar corrosion status variables (i.e., CS) coupled with changing other input parameters to the output is presented in Figure 7. While Figure 7a–c represents the changing chloride contamination level, Figure 7d–f presents the effects of variation of rebar corrosion status on the amplitude of GPR signals from rebar.
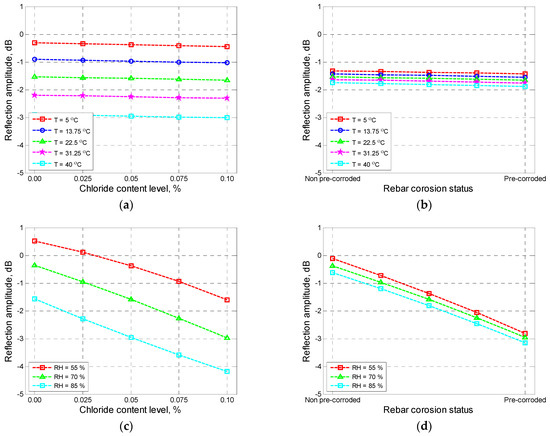
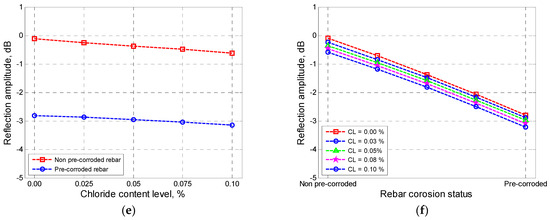
Figure 7.
Effect of chloride contamination level (a–c) and rebar corrosion status (d–f).
Sensitivity analysis was conducted to examine the effect of input factors on the output using a one-at-a-time (OAT) method. In order to do that, the value of one factor was selected from the Low, ML, Mean, MH, and High, while the value of the other factors remain at the mean. Measure the output and then repeat the process for the rest of the parameters. The results are depicted in Figure 8. As can be seen, the temperature variable (T) was the most influential variable on the output of the predictive model, followed by the chloride contamination level parameter (CL). In the meantime, the relative humidity variable (RH) was found to have limited influence on the prediction capacity of the proposed DBN model. The finding was in line with the previous study [25]. It is noted that the impact of uncertainty of the input parameters was not considered in this study.
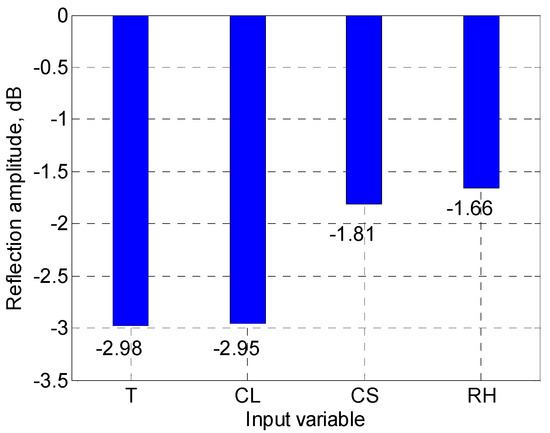
Figure 8.
Sensitivity of input parameters to the output.
4.2. Performance of Proposed DBN Model
Table 4 presents the performance results from the proposed DBN model using R2 and RMSE indicators. It is worth noting that the closing value of R2 to 1, the better the predicted model would be. As can be seen, the proposed DBN model performed excellence for both training and testing datasets with the value of R2 were 0.9687 and 0.9734, respectively. With regard to the RMSE indicator, the proposed model can produce the output with a high level of accuracy with the value of RMSE for the entire database only at 0.1274.

Table 4.
Performance of the selected DBN model.
To gain a better understanding of the ability of the proposed DBN model in predicting the output, scatter plots were employed to visualize the performance results. Figure 9a–c presents the experimental GPR data versus the prediction values generated from the proposed model for training, testing, and the entire database, respectively. As can be observed, the fitting line of the data was roughly coincident with the diagonal line, meaning that the proposed DBN model can yield very reliable outputs.
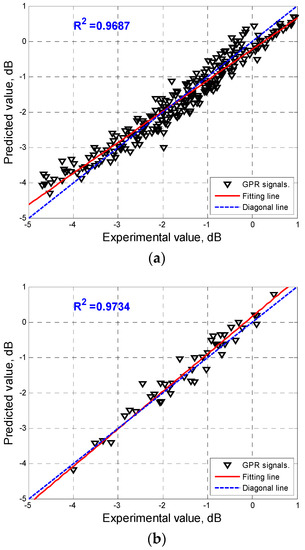
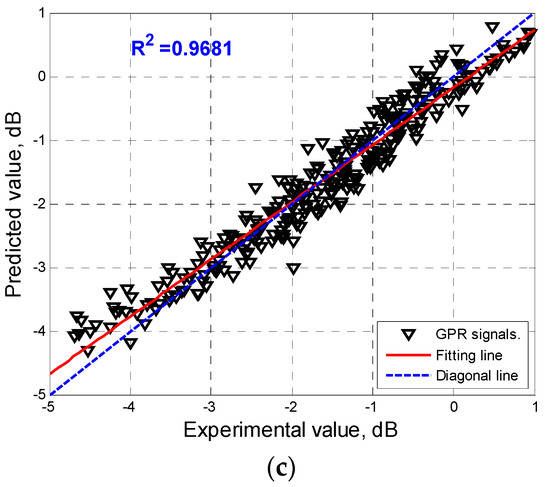
Figure 9.
Scatter of the predicted and actual amplitude of GPR signals: (a) Training; (b) Testing; (c) Overall.
5. Conclusions
In this paper, an AI-based model using the DBN method to analyze GPR data obtained from the previously published source was presented. The proposed DBN model with four inputs, namely temperature (T), relative humidity (RH), chloride level (CL), and rebar surface corrosion condition (CS) was employed to predict the amplitude of GPR signals. A total of 288 experimental records were utilized to train and test the proposed predictive DBN model. The model showed excellent performance in the prediction of the output with the value of the coefficient of determination was 0.9681 for the entire database.
Regarding the sensitivity analysis, the results revealed that the temperature (T) was found as the most influential variable in the prediction of the amplitude of the GPR signal. In the meantime, the relative humidity parameter (RH) was found less sensitive to the output of the predictive DBN model. It is worth noting that the limited amount of available GPR experimental data in developing the predictive DBN model might be a drawback of this study. The performance of this intelligence-based model should be compared to the other traditional model such as the regression model or other data-driven models in future studies.
Author Contributions
T.T.N.: Conceptualization, Data curation, Formal analysis, Investigation, Methodology, Software, Resources, Writing—original draft, Writing—review & editing; P.T.T.: Project administration, Conceptualization, Investigation, Methodology, Resources, Supervision, Writing—review & editing; N.N.T.: Investigation, Resources, Supervision, Validation, Writing—review & editing; N.N.L.: Investigation, Resources, Supervision, Visualization, Review & editing; T.T.L.: Data curation, Investigation, Resources, Software, Supervision, Validation. All authors have read and agreed to the published version of the manuscript.
Funding
This research received no external funding.
Data Availability Statement
The data used to support the findings of this study are included in the cited article.
Acknowledgments
The research group of Development and Application of Advanced Materials and Modern Technologies in Construction would like to thank the Hanoi University of Civil Engineering, Vietnam for funding this research.
Conflicts of Interest
The authors hereby declare no potential conflict of interest regarding the research, authorship, and/or publication of this article.
References
- KCI. 2021. Available online: https://www.kci.com/resources-insights/innovator/ground-penetrating-radar-as-part-of-sue-and-damage-prevention/ (accessed on 15 May 2022).
- ASTM D6432-19; Standard Guide for Using the Surface Ground Penetrating Radar Method for Subsurface Investigation. ASTM International: West Conshohocken, PA, USA, 2019. Available online: https://www.astm.org/ (accessed on 15 May 2022).
- Tarussov, A.; Vandry, M.; De La Haza, A. Condition assessment of concrete structures using a new analysis method: Ground-penetrating radar computer-assisted visual interpretation. Constr. Build. Mater. 2013, 38, 1246–1254. [Google Scholar] [CrossRef]
- Zaki, A.; Johari, M.A.M.; Hussin, W.M.A.W.; Jusman, Y. Experimental Assessment of Rebar Corrosion in Concrete Slab Using Ground Penetrating Radar. Int. J. Corros. 2018, 2018, 5389829. [Google Scholar] [CrossRef]
- Dinh, K.; Gucunski, N.; Kim, J.; Duong, T.H. Method for attenuation assessment of GPR data from concrete bridge decks. NDT&E Int. 2017, 92, 50–58. [Google Scholar]
- Morris, I.M.; Kumar, V.; Glisic, B. Predicting material properties of concrete from ground-penetrating radar attributes. Struct. Health Monit. 2020, 1475921720976999. [Google Scholar] [CrossRef]
- Tosti, F.; Ferrante, C. Using Ground Penetrating Radar Methods to Investigate Reinforced Concrete Structures. Surv. Geophys. 2020, 41, 485–530. [Google Scholar] [CrossRef]
- Dinh, K.; Gucunski, N. Factors affecting the detectability of concrete delamination in GPR images. Constr. Build. Mater. 2021, 274, 121837. [Google Scholar] [CrossRef]
- Wiwatrojanagul, P.; Sahamitmongkol, R.; Tangtermsirikul, S.; Khamsemanan, N. A new method to determine locations of rebars and estimate cover thickness of RC structures using GPR data. Constr. Build. Mater. 2017, 140, 257–273. [Google Scholar] [CrossRef]
- Dinh, K.; Pham, T.T.; Nguyen, T.T.; Vu, H.H. Application of Synthetic Aperture Focusing Technique to visualize GPR data from reinforced concrete structures. IOP Conf. Ser. Mater. Sci. Eng. 2020, 869, 052072. [Google Scholar] [CrossRef]
- Chang, C.W.; Lin, C.H.; Lien, H.S. Measurement radius of reinforcing steel bar in concrete using digital image GPR. Constr. Build. Mater. 2009, 23, 1057–1063. [Google Scholar] [CrossRef]
- Dinh, K.; Gucunski, N.; Duong, T.H. An algorithm for automatic localization and detection of rebars from GPR data of concrete bridge decks. Autom. Constr. 2018, 89, 292–298. [Google Scholar] [CrossRef]
- Dinh, K.; Gucunski, N.; Tran, K.; Novo, A.; Nguyen, T. Full-resolution 3D imaging for concrete structures with dual-polarization GPR. Autom. Constr. 2021, 125, 103652. [Google Scholar] [CrossRef]
- Hong, S.; Lai, W.W.-L.; Wilsch, G.; Helmerich, R.; Helmerich, R.; Günther, T.; Wiggenhauser, H. Periodic mapping of reinforcement corrosion in intrusive chloride contaminated concrete with GPR. Constr. Build. Mater. 2014, 66, 671–684. [Google Scholar] [CrossRef]
- Hugenschmidt, J.; Loser, R. Detection of chlorides and moisture in concrete structures with ground penetrating radar. Mater. Struct. 2007, 41, 785–792. [Google Scholar] [CrossRef]
- Senin, S.F.; Hamid, R. Ground penetrating radar wave attenuation models for estimation of moisture and chloride content in concrete slab. Constr. Build. Mater. 2016, 106, 659–669. [Google Scholar] [CrossRef]
- Martino, N.M. Quantifying Reinforced Concrete Bridge Deck Deterioration Using Ground Penetrating Radar. Ph.D. Thesis, Northeastern University, Boston, MA, USA, 2013. [Google Scholar]
- Liu, H.; Zhong, J.; Ding, F.; Meng, X.; Liu, C.; Cui, J. Detection of early-stage rebar corrosion using a polarimetric ground penetrating radar system. Constr. Build. Mater. 2022, 317, 125768. [Google Scholar] [CrossRef]
- Varnavina, A.V.; Khamzin, A.K.; Torgashov, E.V.; Sneed, L.H.; Goodwin, B.T.; Anderson, N.L. Data acquisition and processing parameters for concrete bridge deck condition assessment using ground-coupled ground penetrating radar: Some considerations. J. Appl. Geophys. 2015, 114, 123–133. [Google Scholar] [CrossRef]
- Dinh, K.; Zayed, T.; Romero, F.; Tarussov, A. Method for analyzing time-series GPR data of concrete bridge decks. J. Bridge Eng. 2014, 20, 04014086. [Google Scholar] [CrossRef]
- Prasad, K.; Gorai, A.K.; Goyal, P. Development of ANFIS models for air quality forecasting and input optimization for reducing the computational cost and time. Atmos. Environ. 2016, 128, 246–262. [Google Scholar] [CrossRef]
- Nguyen, T.T.; Dinh, K. Prediction of bridge deck condition rating based on artificial neural networks. J. Sci. Technol. Civ. Eng. (STCE)—NUCE 2019, 13, 15–25. [Google Scholar] [CrossRef]
- Hong, E.; Yeneneh, A.M.; Sen, T.K.; Ang, H.M.; Kayaalp, A. ANFIS based Modelling of dewatering performance and polymer dose optimization in a wastewater treatment plant. J. Environ. Chem. Eng. 2018, 6, 1957–1968. [Google Scholar] [CrossRef]
- Nguyen, T.T.; Dinh, K. An artificial intelligence approach for concrete hardened property estimation. J. Sci. Technol. Civ. Eng. (STCE)—NUCE 2020, 14, 40–52. [Google Scholar] [CrossRef]
- Zatar, W.; Nguyen, T.T.; Nguyen, H. Predicting GPR signals from concrete structures using Artificial Intelligence-based method. Adv. Civ. Eng. 2021, 2021, 6610805. [Google Scholar] [CrossRef]
- Hakim SJ, S.; Razak, H.A. Structural damage detection of steel bridge girder using artificial neural networks and finite element models. Steel Compos. Struct. 2013, 14, 367–377. [Google Scholar] [CrossRef]
- Nguyen, T.T.; Ngoc, L.T.; Vu, H.H.; Thanh, T.P. Machine learning-based model for predicting concrete compressive strength. Int. J. Geomate 2021, 20, 197–204. [Google Scholar] [CrossRef]
- Nguyen, T.T.; Pham, D.H.; Pham, T.T.; Vu, H.H. Compressive strength evaluation of Fiber-Reinforced High Strength Self-Compacting Concrete with artificial intelligence. Adv. Civ. Eng. 2020, 2020, 3012139. [Google Scholar] [CrossRef]
- Pham, T.T.; Nguyen, T.T.; Nguyen, L.N.; Nguyen, P.V. A neural network approach for predicting hardened property of Geopolymer concrete. Int. J. Geomate 2020, 19, 193–201. [Google Scholar] [CrossRef]
- Dinh, K.; Gucunski, N.; Kim, J.; Duong, T.H. Improved GPR-based condition assessment of reinforced concrete bridge decks using artificial neural network. HDKBR INFO Mag. 2015, 5, 3–13. [Google Scholar]
- Liu, T.; Su, Y.; Huang, C. Inversion of Ground Penetrating Radar Data Based on Neural Networks. Remote Sens. 2018, 10, 730. [Google Scholar] [CrossRef]
- Tanaka, M. Deep Neural Network. 2013. Available online: https://www.mathworks.com/matlabcentral/fileexchange/42853-deep-neural-network14 (accessed on 15 May 2022).
- Asja, F.; Christian, I. Training restricted Boltzmann machines: An introduction. Pattern Recognit. 2014, 47, 25–39. [Google Scholar]
- Hao, X.; Guo, T.; Huang, G.; Shi, X.; Zhao, Y.; Yang, Y. Energy consumption prediction in cement calcination process: A method of deep belief network with sliding window. Energy 2020, 207, 118256. [Google Scholar] [CrossRef]
- Xu, F.; Fang, Z.; Tang, R.; Li, X.; Tsui, K.L. An unsupervised and enhanced deep belief network for bearing performance degradation assessment. Meas. J. Int. Meas. Confed. 2020, 162, 107902. [Google Scholar] [CrossRef]
- Lv, Z.; Qiao, L. Deep belief network and linear perceptron based cognitive computing for collaborative robots. Appl. Soft Comput. J. 2020, 92, 106300. [Google Scholar] [CrossRef]
- Rafiei, M.H.; Khushefati, W.H.; Demirboga, R.; Adeli, H. Supervised Deep Restricted Boltzmann Machine for Estimation of Concrete. ACI Mater. J. 2017, 114, 237–244. [Google Scholar] [CrossRef]
- Lu, P.; Guo, S.; Zhang, H.; Li, Q.; Wang, Y.; Wang, Y.; Qi, L. Research on Improved Depth Belief Network-Based Prediction of Cardiovascular Diseases. J. Healthc. Eng. 2018, 2018, 8954878. [Google Scholar] [CrossRef]
- Fud, G. Deep belief network based ensemble approach for cooling load forecasting of air-conditioning system. Energy 2018, 148, 269–282. [Google Scholar] [CrossRef]
Publisher’s Note: MDPI stays neutral with regard to jurisdictional claims in published maps and institutional affiliations. |
© 2022 by the authors. Licensee MDPI, Basel, Switzerland. This article is an open access article distributed under the terms and conditions of the Creative Commons Attribution (CC BY) license (https://creativecommons.org/licenses/by/4.0/).