1. Introduction
The steel plate shear wall (SPSW) system is a new type of lateral-force-resistant structure developed in the 1970s, and this system is composed of embedded steel plates, vertical boundary elements (column or vertical stiffener), and horizontal boundary elements (beam or horizontal stiffener) [
1,
2]. A large number of domestic and foreign researchers have conducted systematic experimental studies and theoretical analyses on SPSWs to date. Many experimental and numerical investigations based on SPSWs have proven that SPSWs are a lateral resistance component with superior energy dissipation capacity [
3,
4,
5]. Some researchers presented a study on the performance of unstiffened thin SPSW, but they have not fully established the design methodology [
6,
7]. Some studies related to RC structures have been proposed [
8,
9]. In a theoretical analysis, S. Sabouri-Ghomi et al. [
10] proposed an artificial neural network (ANN) to model the effects of different parameters on SPSW, and Khalilzadeh Vahidi et al. [
11] proposed the governing differential equations of motion of thin SPSWs.
Other steel thin elements such as plate girders are widely used in steel structures that need to resist high loads. Bedynek, A. et al. [
12] presented experimental and numerical research on tapered steel plate girders subjected to shear, and the estimation of the ultimate shear resistance is situated on the unsafe side for some cases. Sediek, O. A. et al. [
13] investigated the elastic buckling and ultimate shear strengths of tapered end web panels in plate girders, and the numerical results were used to establish a mathematical expression for the ultimate shear strength of prismatic and tapered-end web panels.
Most of the previous experimental studies on SPSW are based on the infill plates. Paslar, N. et al. [
14] analyzed infill plate interconnection effects in SPSW by establishing finite element methodology based on the verified models, and a parametric study of various SPSW systems was conducted through the proposed prediction equations for partially connected infill plate systems. Thereafter, Paslar, N. et al. [
15] further investigated the behavior of plates with circular cut-outs under different infill plate boundary conditions and the effect of opening dimensions on the behavior of SPSWs, boundary element stiffness and steel infill plate interconnection. The results indicate that any increase in the opening dimensions leads to the reduction of the ultimate strength, stiffness, ductility, and energy absorption in proportion to the effective wall height. In addition, the infill plate interconnection conditions, specifically with the beam member, have a significant effect on the tension field development inside of the infill plate leading to proper post-buckling resistance of the steel plate shear walls.
The corrugated steel plates are being used in steel shear walls as a different strategy to resist buckling. Farzampour, A. et al. [
16] examined a series of corrugated and simple shear walls with and without openings under different angles of corrugation and different thicknesses of infill plate. The results showed that utilizing trapezoidal corrugated panels increases the initial stiffness of the shear wall system, while it decreases the ultimate strength. In addition, corrugated steel shear walls postpone the ultimate strength and degradation compared with corresponding unstiffened steel shear walls, which is a highly beneficial seismic characteristic of these structural elements. However, stiffness, strength, and ductility of corrugated shear walls are significantly affected by varying the corrugation geometry under seismic loading. Farzampour, A. et al. [
17] explored steel shear wall models with corrugated or simple infill plates subjected to monotonic and cyclic loads. The results showed that incorporating corrugated plates would lead to better seismic damping ratios, specifically in the case of opening existence inside of the infill plate. The corrugated steel shear wall with a reduced boundary beam section (RBS-CSSW) and an analytical equation for estimating the strength of the RBS-CSSW was presented by Farzampour, A.et al. [
18], and the FE pushover analyses of two models showed that the accuracy of the equation is 95%.
For the thin SPSWs reliably connected with boundary elements, the post-buckling strength can be several times greater than its buckling load, which proves that thin SPSWs have reliable load-carrying capacity, good ductility, and excellent energy dissipation performance; however, different local structures greatly influence the stress performance of thin SPSWs [
19,
20,
21]. Out-of-plane instability usually occurs prematurely in thin SPSWs, and using thicker steel plates in practical engineering is not economical.
Stiffening ribs are often used in engineering practice to further improve the buckling load of thin SPSWs. The development of housing industrialization in our country in recent years has facilitated the wide use of reinforced thin SPSW structures in high-rise steel constructions due to its light self-weight, high strength, short construction period, and superior seismic performance [
22,
23,
24,
25,
26]. At the same time, the stiffening rib of thin steel plates (plate thickness of 3–6 mm) leads to a series of problems in machining and welding because of the wide area of residential buildings and a large amount of steel consumption, and further study on the mechanical properties is required.
In this study, the shear performance test and finite element analysis of stiffened thin SPSWs are conducted. The main research contents are as follows:
- (1)
The feasibility of the application of the new welding process in steel plate and the selection of welding materials;
- (2)
The shear failure pattern, hysteretic property, load-carrying capacity, and energy-dissipating capacity of the SPSWs;
- (3)
The effect of the new rib stiffener connection structure and welding process on failure pattern and the shear capacity of the SPSWs;
- (4)
The main effect of different frame lateral stiffnesses and different width–height ratios on the shear performance of the SPSWs.
2. Materials and Methods
2.1. Welding Process
In this study, the new welding process is adopted, and the stiffener size is C80 × 50 × 4. The bending structure is formed at one end of the steel plate by bending approximately 20 mm, and the concave structure is formed at the other end of the steel plate by bending three times according to the design size of the stiffener. The concave structure of one steel plate and the bending structure of another steel plate are overlapped to form the stiffened SPSW (
Figure 1). In this way, the stiffener and the SPSW are bent and formed as a whole.
The traditional welding process (
Figure 2) is the flat plate splicing process, which is the direct penetration welding of the joint of the steel plate. The number of welds in this process is three: one butt weld, and two fillet welds. The defects of large residual deformation and poor visual quality are prone to appear in the butt weld position when the thickness of the plate is thin.
The number of welds is reduced from 3 (
Figure 2) to 2 (
Figure 3). The steel plate is bent to form stiffening ribs, which can increase integrity and reduce welding residual stress and deformation significantly.
2.2. Specimen Design of Tensile Tests
The tensile tests are conducted on the thin steel plates with four thicknesses of 3, 4, 5, and 6 mm to study the applicability of the new welding process of steel plates with different thicknesses. The steel plate is Q235 grade steel, and each group of specimens is the same batch of steel plates. The welding method is carbon dioxide shield welding, and the welding material is solid wires.
The new welding process has three kinds of weld forms. For studying the influence of different weld forms on the welding performance, the specimen grouping and weld forms of each thickness are as follows: group A for flat butt weld, group B for folded plate concave weld, group C for folded plate flat weld, and group D for folded plate convex weld (
Figure 4). In specimens of 4 and 6 mm, groups B1 and C1 are adopted as the control group, and the flux-cored wire is used to study the effect of different welding materials on the new welding process.
The final specimen groups are shown in
Table 1, and each group has 3 specimens, with a total of 60 specimens.The test photos of partial specimen are shown in
Figure 5.
2.3. Specimen Design of Shear Performance Test
According to the project situation, the specimen thickness of the SPSWs is 4 mm, and the stiffener splicing form is shown in
Figure 1. On the basis of this situation, the main change parameters such as frame sections and aspect ratios of the wall are considered for specimen design, and the four full-scale specimens of single-layer and single-span steel frames embedded with SPSWs are designed, including two different sections of the steel columns and two different aspect ratios of the walls. The specimens of the SPSWs are made of Q235B steel, and the steel beams and steel columns are made of Q345B steel. The specimen parameters are shown in
Table 2, and the specimen is illustrated in
Figure 6. The connection mode between the SPSWs and steel columns, steel beams, and other boundary members are shown in
Figure 7.
A rigid ground beam is designed to anchor the specimen firmly on the ground. The lower part of the specimen is welded with the ground beam, and the ground beam is fixed on the ground through the ground anchor.
Out-of-plane supports are set on both sides of the upper steel beam to limit the out-of-plane distortion of specimens for preventing the specimen from losing stability outside the plane during the loading process.
2.4. Test Program
The horizontal cyclic loading is applied to the height of the center of the steel beam (quasi-static test). Load control should be adopted before the yielding specimens, and displacement control is adopted after yielding until specimen fails. The failure criterion is one of the following:
- (1)
The horizontal load decreases to lower than 85% of the peak load-carrying capacity.
- (2)
The specimen is damaged seriously, such as the plastic hinge at the pedestal, the failure of the main connection welds, and the tearing of the SPSWs.
- (3)
The specimen suffers serious out-of-plane instability.
The main contents of the measurement include the horizontal displacements, the out-of-plane deformation and the key parts strains of the specimens under different load levels, which are automatically collected and recorded by the real-time data collection system.
2.5. Finite Element Model
This numerical study is conducted on shear performance using finite element analysis software, ANSYS. The SPSWs are assumed to be rigidly connected to the surrounding frames, the connections are reliable during the entire loading process, and no slippage and weld cracking exist between the steel plate and the frame.
The SPSWs and peripheral frames are modeled by the SHELL181 element and the BEAM44 element, respectively. The elastic–perfectly plastic model is adopted as the constitutive model of steel. The ANSYS model of typical specimens is shown in
Figure 8.
3. Experimental Results and Analysis
3.1. Process Feasibility
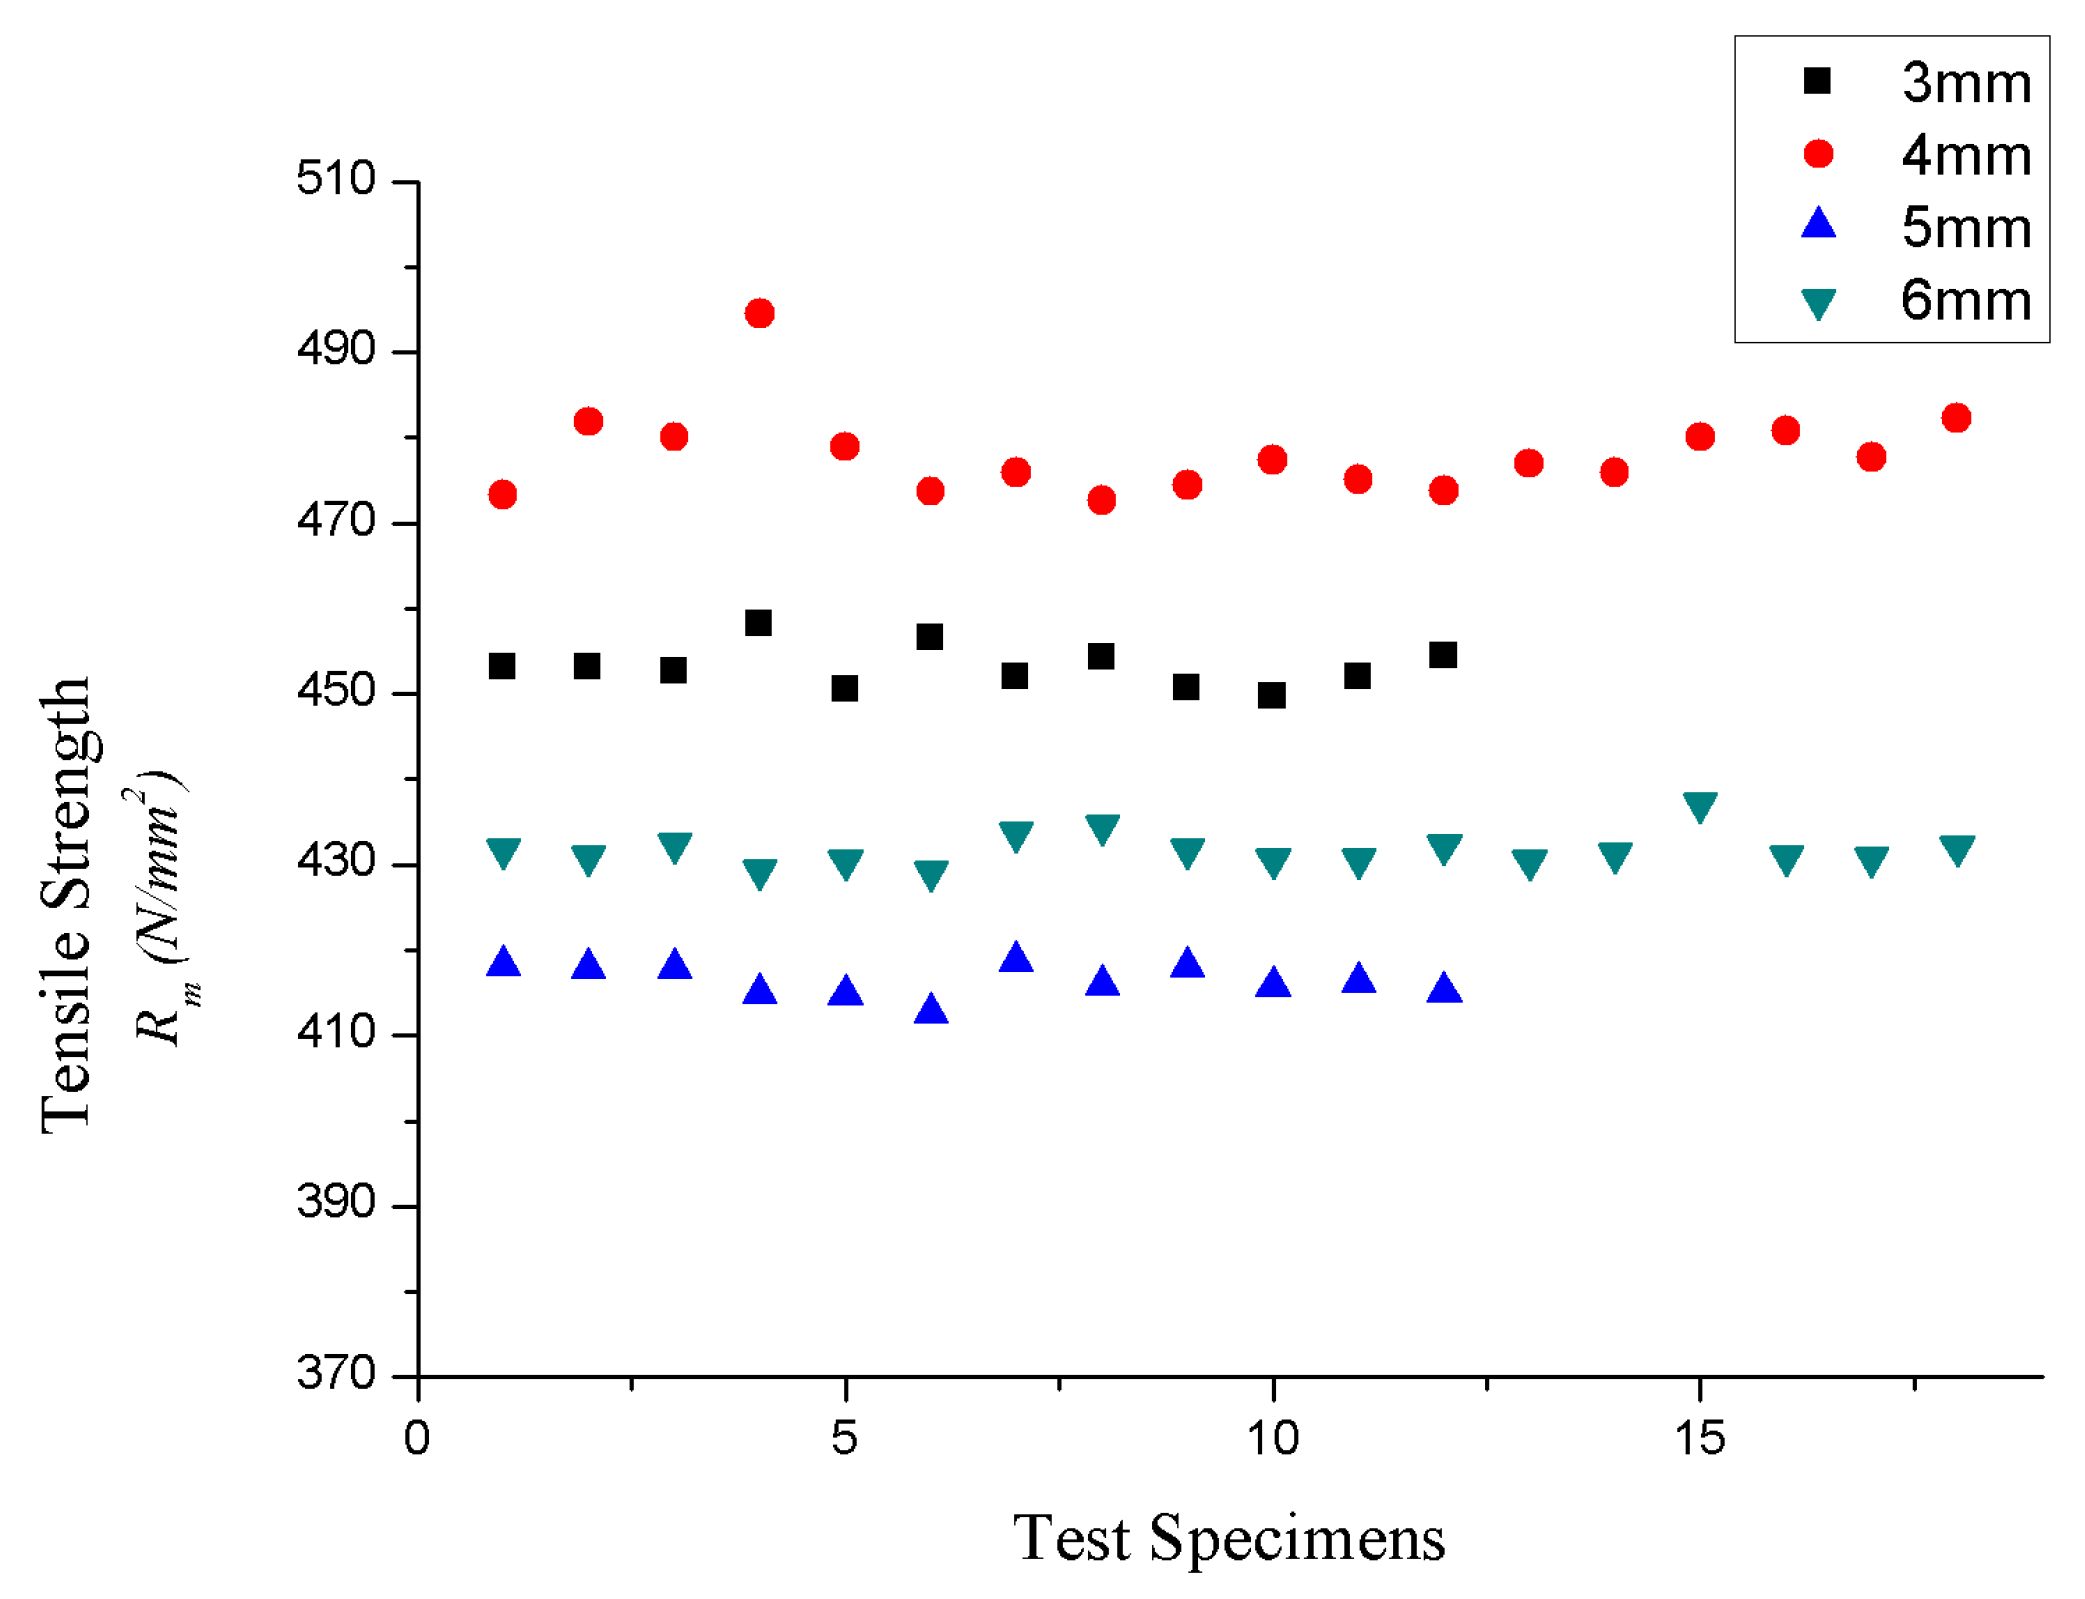
When the load is small, the elongation of specimens is not obvious, and the stress–strain curves increase linearly. When the load gradually increases to approach the ultimate load, the necking phenomenon begins to appear, and the crack appears and further extends until fracture. The test results show that the fracture positions of all specimens are in the base metal, and the distance from the center line of the weld is 55–65 mm (
Figure 9). Obviously, the necking and fracture positions of the specimens generally appear at the weak section stiffness.
The experimental results show that no fracture is observed at the weld position due to the high strength of the material in the weld area. In the tensile test, the butt weld is qualified when the base material steel grade of the butt joint is the same and the tensile strength of each sample is not lower than the lower limit specified in the corresponding specification of the base material standard. The steel grade adopted in this test is Q235 steel, and the lower limit of standard tensile strength is 370 N/mm
2. According to statistics, the tensile strength values of test specimens with different thicknesses are shown in
Figure 10. The tensile strength values of all specimens in this test are greater than 370 N/mm
2.
The experimental results show that the new welding process is feasible for the splicing of thin steel plates with a thickness of 3–6 mm.
3.2. Comparison of the Welding Properties of the Different Weld Forms
The new welding process has three kinds of weld forms: folded plate concave weld, folded plate flat weld, and folded plate convex weld. The weld form of the traditional welding process is flat butt welding.
The wire diameter used in the new process is small to reduce the residual deformation. The number of concave weld seams is one, while the number of convex weld seams is two. The flat weld needs to increase the process of weld grinding on the basis of the convex weld seam. The average tensile strength of the flat butt welding process specimens (Group A) is
Rm0, and the average tensile strength of groups B, C, and D of different welding processes is
Rmi. According to
Table 3, the tensile strength difference of each welding specimen with different thicknesses is within 1.5%.
The results show that the weld properties of the three welding forms of the new process are consistent with those of the flat butt welding process. When the new process is adopted, one weld seam of the concave weld can meet the weld performance requirements, which can be optimized to reduce the second welding process and welding grinding process and improve the economy of the splicing process.
3.3. Influence of Different Welding Materials
The mean tensile strengths of the specimens with flux-cored welding and solid wires are defined as
Rmi and
Rm0, respectively. Comparing the tensile strength of the components with flux-cored and solid wires shows that the differences in the mean tensile strength between the two types of components are within 2% (see
Table 4).
The results show that the flux-cored welding wire can be applied to the new welding process.
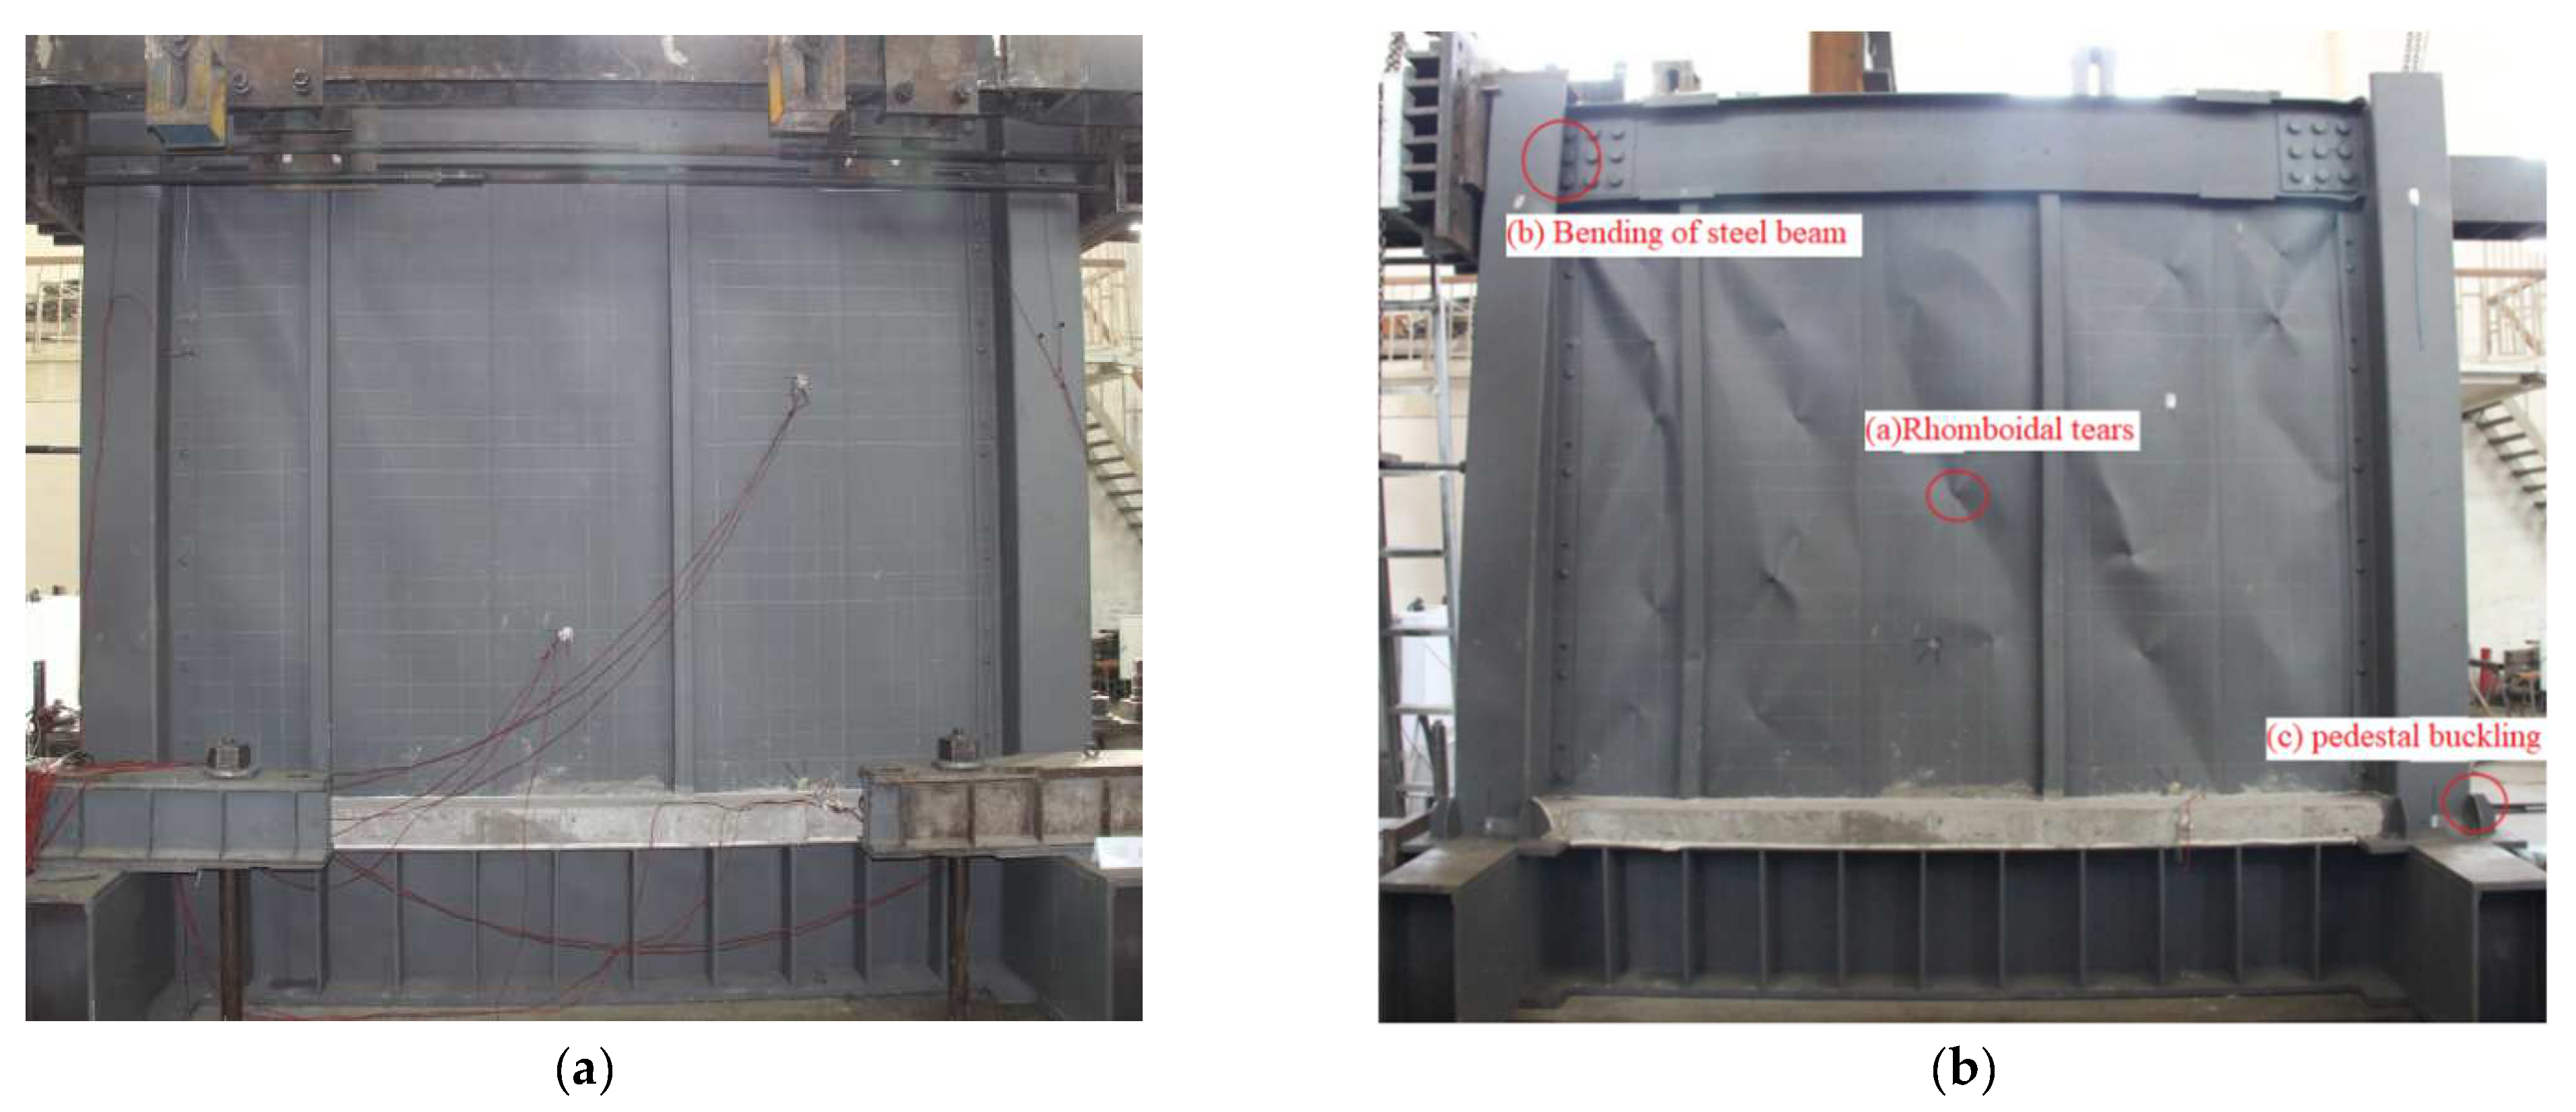
3.4. Destruction Patterns
The failure processes of four specimens under quasi-static loads are similar. At the inception phase of the loading process, the SPSWs are mainly in-plane shearing, and the surface of the steel plates is flat with no apparent buckling phenomenon. The elastic out-of-plane buckling first occurs between stiffeners of the SPSWs with the increase in the load because the thickness of the steel plates are only 4 mm and the height-to-thickness ratio is 1/725. The out-of-plane restraint effect of the vertical stiffener on the steel plate is also limited with the effect of initial imperfection. When the load further increases, yields occur at the upper and lower corners of the SPSW and at the joint seams of stiffeners. After the SPSW mainly forms a 45° tension strip to exert the post-buckling strength, multiple half wavelengths of shear buckling are observed, as shown in
Figure 11a. The end of the steel beam yields subsequently.
In the middle and later periods of loading, yield and cracking of the steel pedestal are observed with the increase in the inter-layer displacement angle. However, the SJ-2 is destroyed in advance due to the large out-of-plane bending at the middle span of the steel beam. The out-of-plane deformation of the SPSW also increases, and the snap-through buckling occurs repeatedly. During the failure of specimens, the SPSWs have many serious folds along the 45° direction, and many rhomboidal tears appear between vertical stiffeners, as shown in
Figure 11b.
Meanwhile, obvious cracks (such as specimen SJ-2) are observed on the upper of the stiffeners of the pedestal. Some of them are also accompanied with pedestal buckling (such as specimen SJ-3) and the serious bending of beam end flanges (such as specimen SJ-4). The typical failure modes are shown in
Figure 12.
3.5. Hysteresis Characteristics
Figure 13 shows the hysteretic curves of the specimens, which mainly present the following characteristics:
The shear wall specimens show high load-carrying capacity and stable energy dissipation capacity. However, SJ-2 exhibits premature out-of-plane buckling failure of the steel beam, and the area surrounded by the hysteretic loop increases linearly after entering the plastic stage.
As shown in
Figure 14, the finite element hysteretic curves of each of the specimens are obtained using the same loading levels as the test. SJ-2 is the first experimental specimen. Thus, the out-of-plane support device of the specimen steel beam fails in the loading process, which results in the early failure of SJ-2. The out-of-plane support device is adjusted in subsequent experiments. Comparing the results of the finite element analysis with the test shows that the change in hysteretic loop curves and the degree of “pinch” show excellent agreement. The finite element analysis cannot simulate the adverse effects of the SPSWs and pedestal cracking in the later stage of loading. Thus, the stiffness degradation and material damage of specimens after yield are smaller than the test results, and the load-carrying capacity is slightly higher than the experimental values.
3.6. Skeleton Curves
Figure 15 shows the skeleton curves of each specimen, which mainly present the following characteristics:
- (1)
The trend of the curves is the same, and it is divided into elastic rising section, elastic–plastic rising section, and falling section. The load and displacement of each specimen show a linear growth before the yielding load. It shows elastoplastic characteristics after the yielding load. Steel plate wall cracks and load decreases after the ultimate load is reached.
- (2)
Comparing SJ-1/2 and SJ-3/4 shows that the peak load-carrying capacity increases with the increment in lateral stiffness. Comparing SJ-1/3 and SJ-2/4 implies that the increase in width–height ratio can improve the peak load-carrying capacity.
The comparison of skeleton curves between the finite element models and test specimens is shown in
Figure 16. As observed, the calculated skeleton curves show great agreement with the experiments in general. Their elastic stages before yield are coincident, but the calculated load-carrying capacity after yield is slightly higher than that from tests.
In addition to the effect of component damage, the out-of-plane deformation of the steel beam in the later stage of loading from tests is larger than that from numerical modeling owing to the limited stiffness of lateral braces of the steel beam.
3.7. Load-Carrying Capacity
Table 5 shows the results of the load-carrying capacity of the specimens, which mainly present the following characteristics.
Comparing SJ-1 and SJ-2 shows that the lateral stiffness of the frame slightly affects the yielding load. Comparing SJ-1/3 and SJ-2/4 implies that the increase in width–height ratio of the steel plate wall can increase the yielding load. The peak load and displacement of SJ-2 are much smaller than those of others due to the premature out-of-plane buckling failure of the steel beam, and it cannot be used as a reference. Comparing SJ-3 and SJ-4 indicates that the moment of inertia of the steel column section increases by 77%, which increases the peak load by 13% and decreases the peak displacement by 18%. Comparing SJ-3 and SJ-4 shows that the width of the steel plate wall decreases by 24%, which results in a peak load decrease by 10% and a peak displacement increase by 33%.
The shear capacity design values of each specimen are calculated, as shown in
Table 6, on the basis of the design requirements and specimen size. As observed, the shear safety factor, that is, the ratio of the test yield load to the design value of shear capacity of each specimen, is above 3.0. This value indicates that the shear capacity of the SPSWs meets the requirements.
Table 7 shows the comparison of load-carrying capacity between the finite element method and test for various specimens, including the yielding load and peak load. No falling section is considered in the finite element analysis. Thus, the calculated peak load corresponds to the tested peak displacement.
As observed, the yielding load obtained through finite element analysis and the test greatly agree, and the deviation is less than 0.5%. The calculated value of the peak load is slightly higher than the tested value, and the maximum difference is only 6.1%.


