Figure 1.
Structural model of dynamically similar buildings connected with MR dampers in Configuration 1.
Figure 1.
Structural model of dynamically similar buildings connected with MR dampers in Configuration 1.
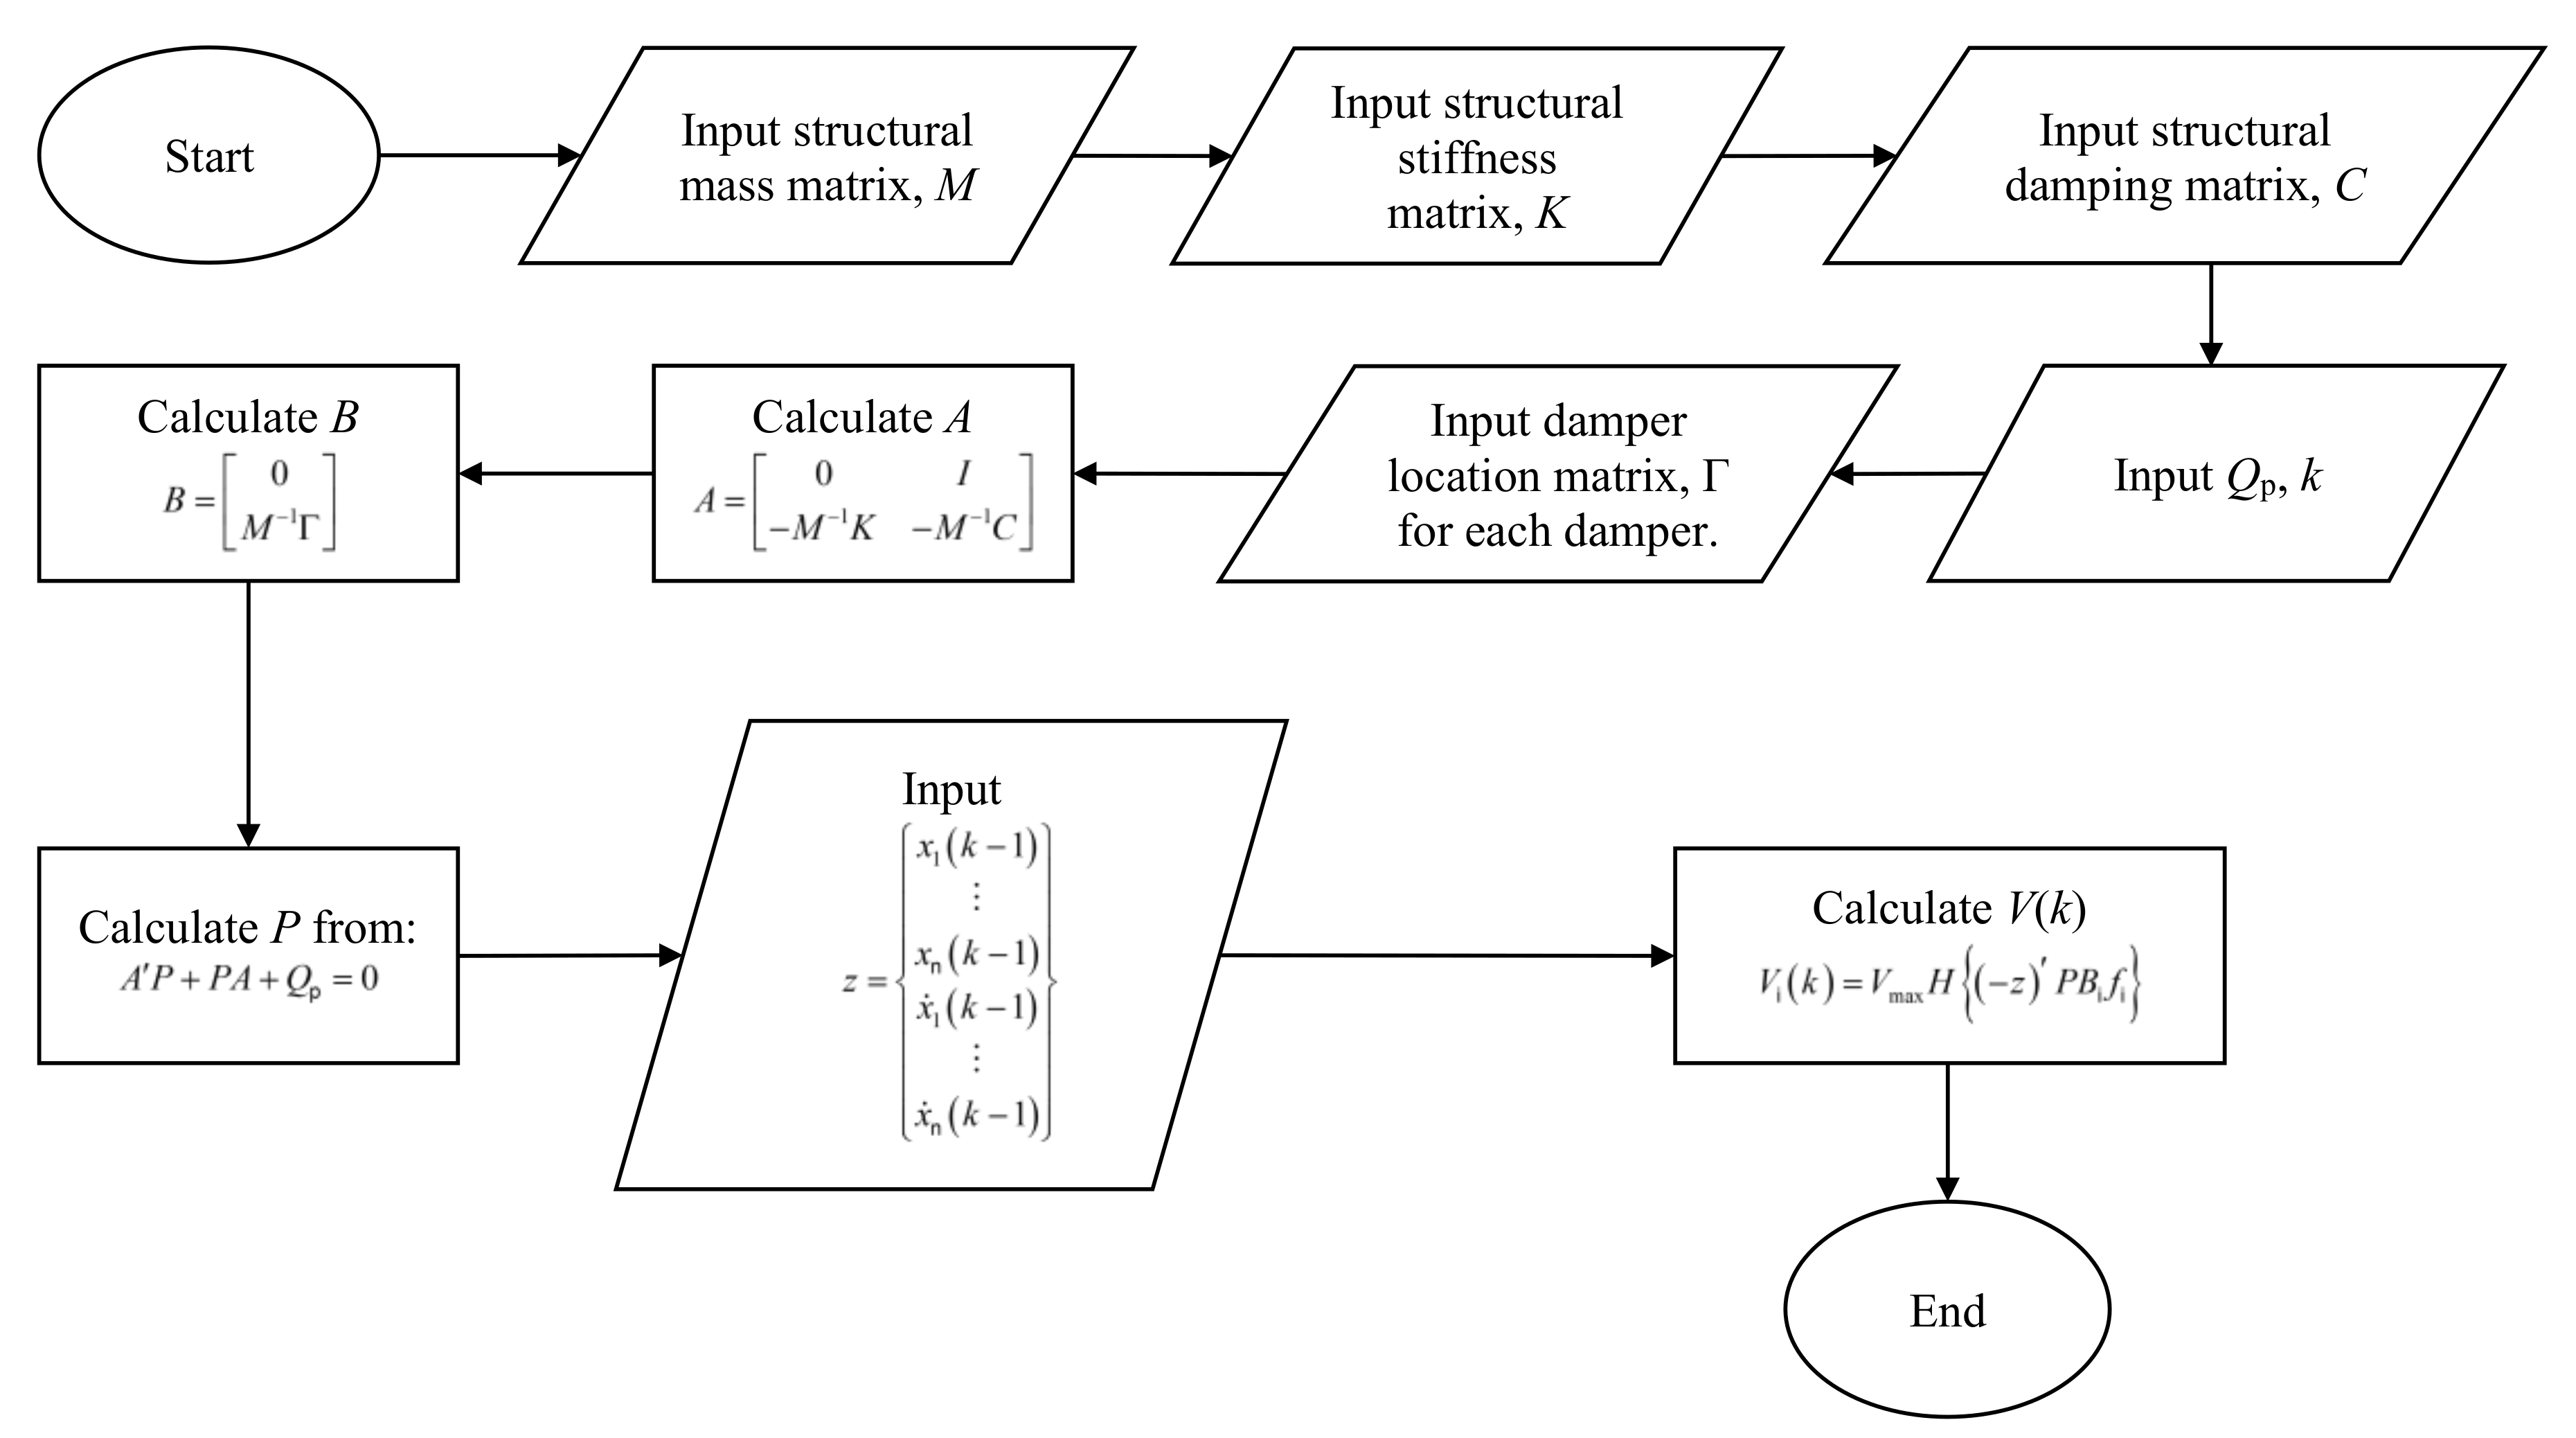
Figure 2.
Flowchart for simulating Lyapunov control algorithm.
Figure 2.
Flowchart for simulating Lyapunov control algorithm.
Figure 3.
Flowchart for simulating decentralized bang-bang control algorithm.
Figure 3.
Flowchart for simulating decentralized bang-bang control algorithm.
Figure 4.
Flowchart for simulating clipped optimal control algorithm.
Figure 4.
Flowchart for simulating clipped optimal control algorithm.
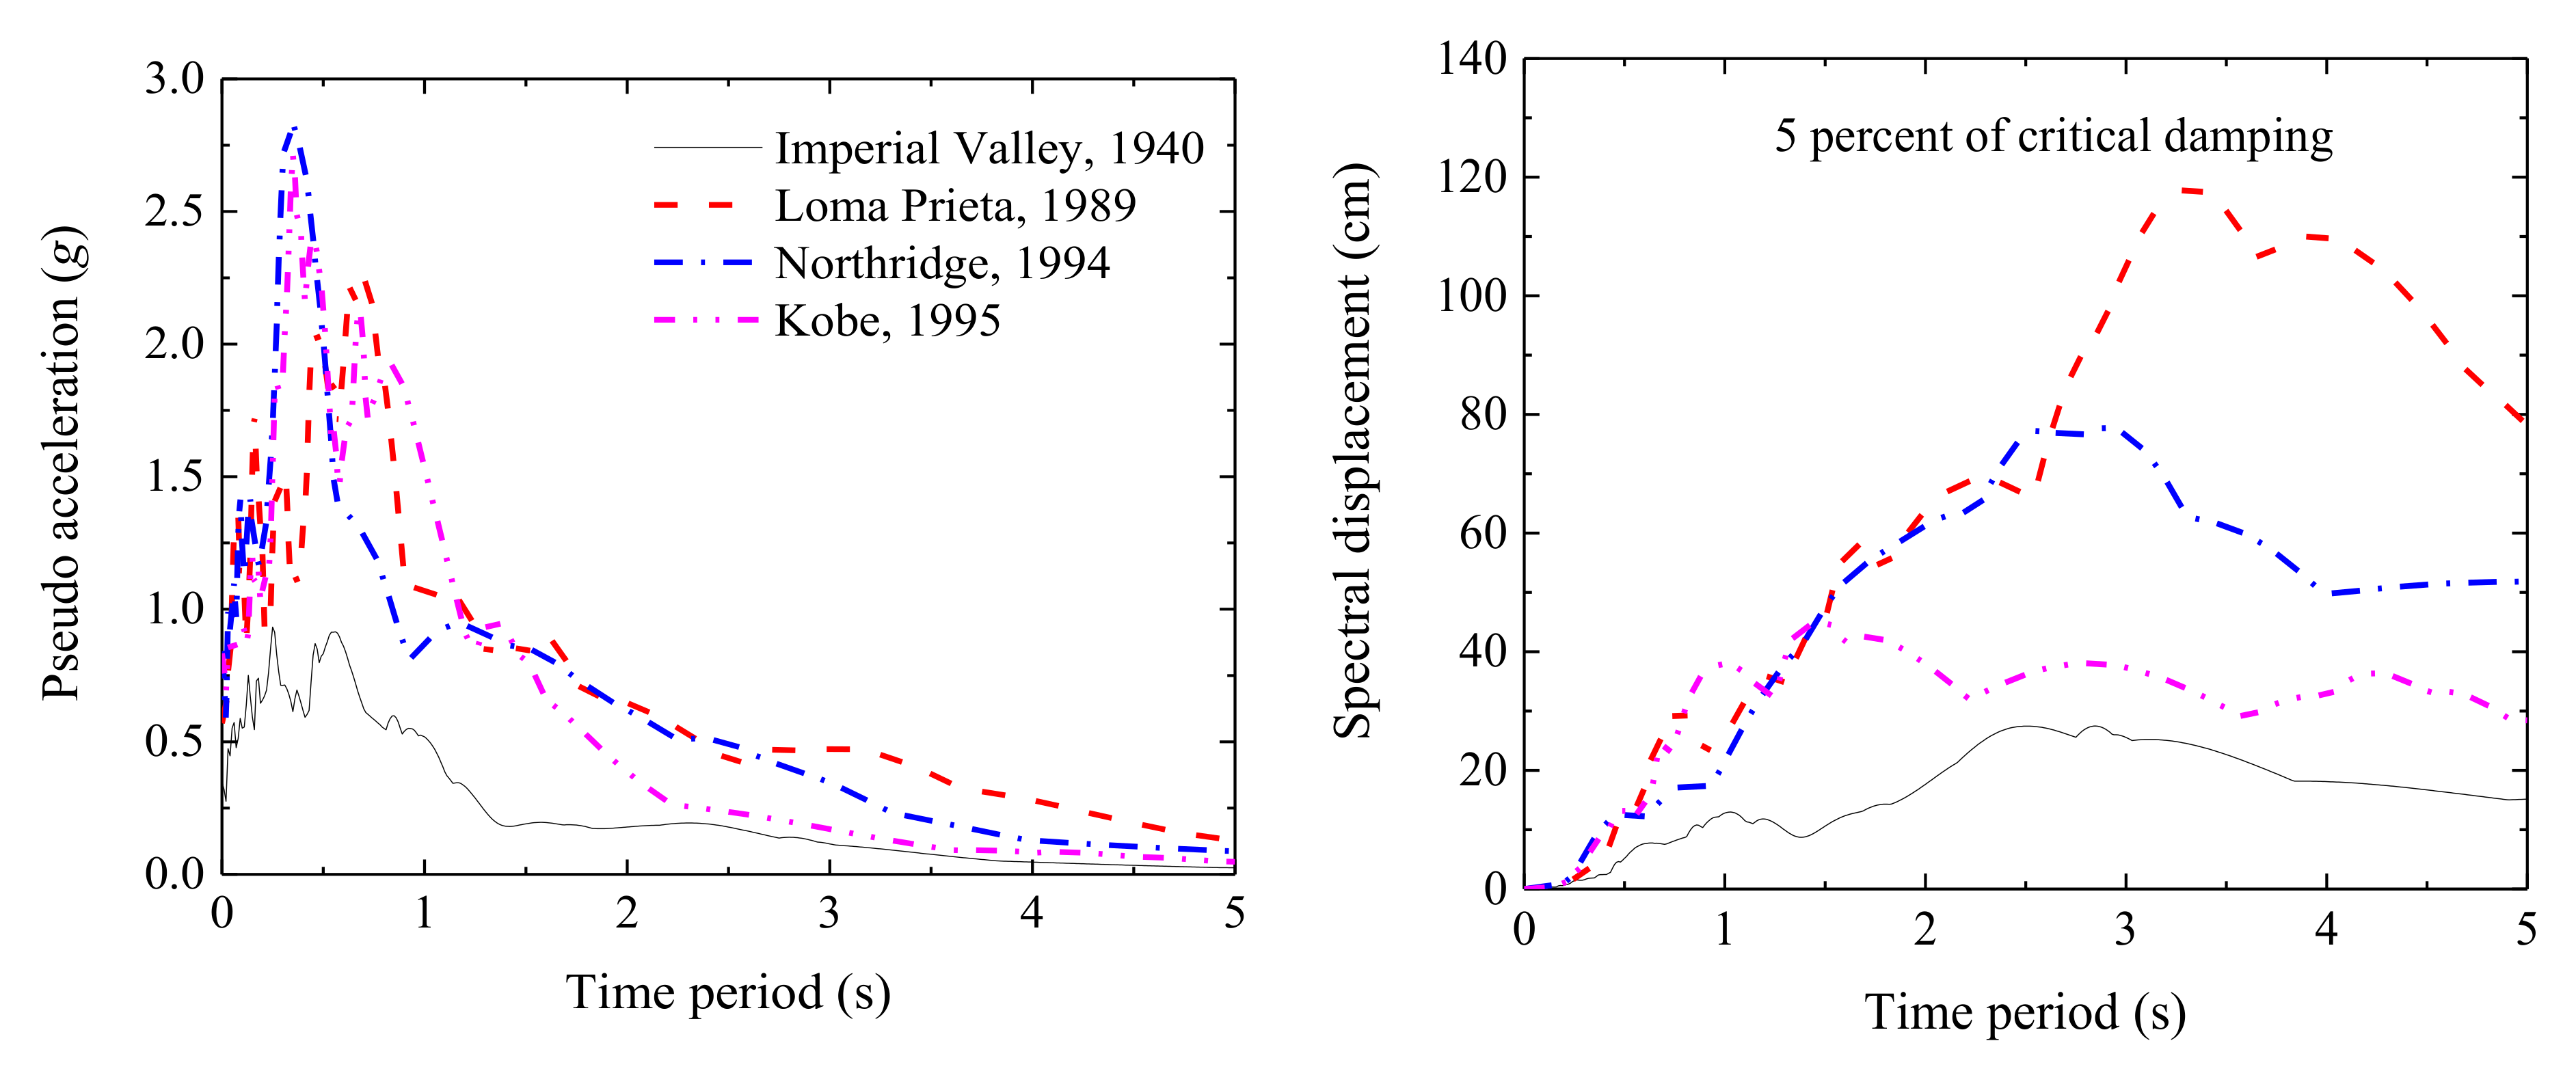
Figure 5.
Spectrum response, for 5% of critical damping, of earthquake events considered in the current study.
Figure 5.
Spectrum response, for 5% of critical damping, of earthquake events considered in the current study.
Figure 6.
Dynamic wind velocity profile and its characteristics, obtained for wind load case 1 separately for a stiff building (10-storey building) and a flexible building (20-storey building).
Figure 6.
Dynamic wind velocity profile and its characteristics, obtained for wind load case 1 separately for a stiff building (10-storey building) and a flexible building (20-storey building).
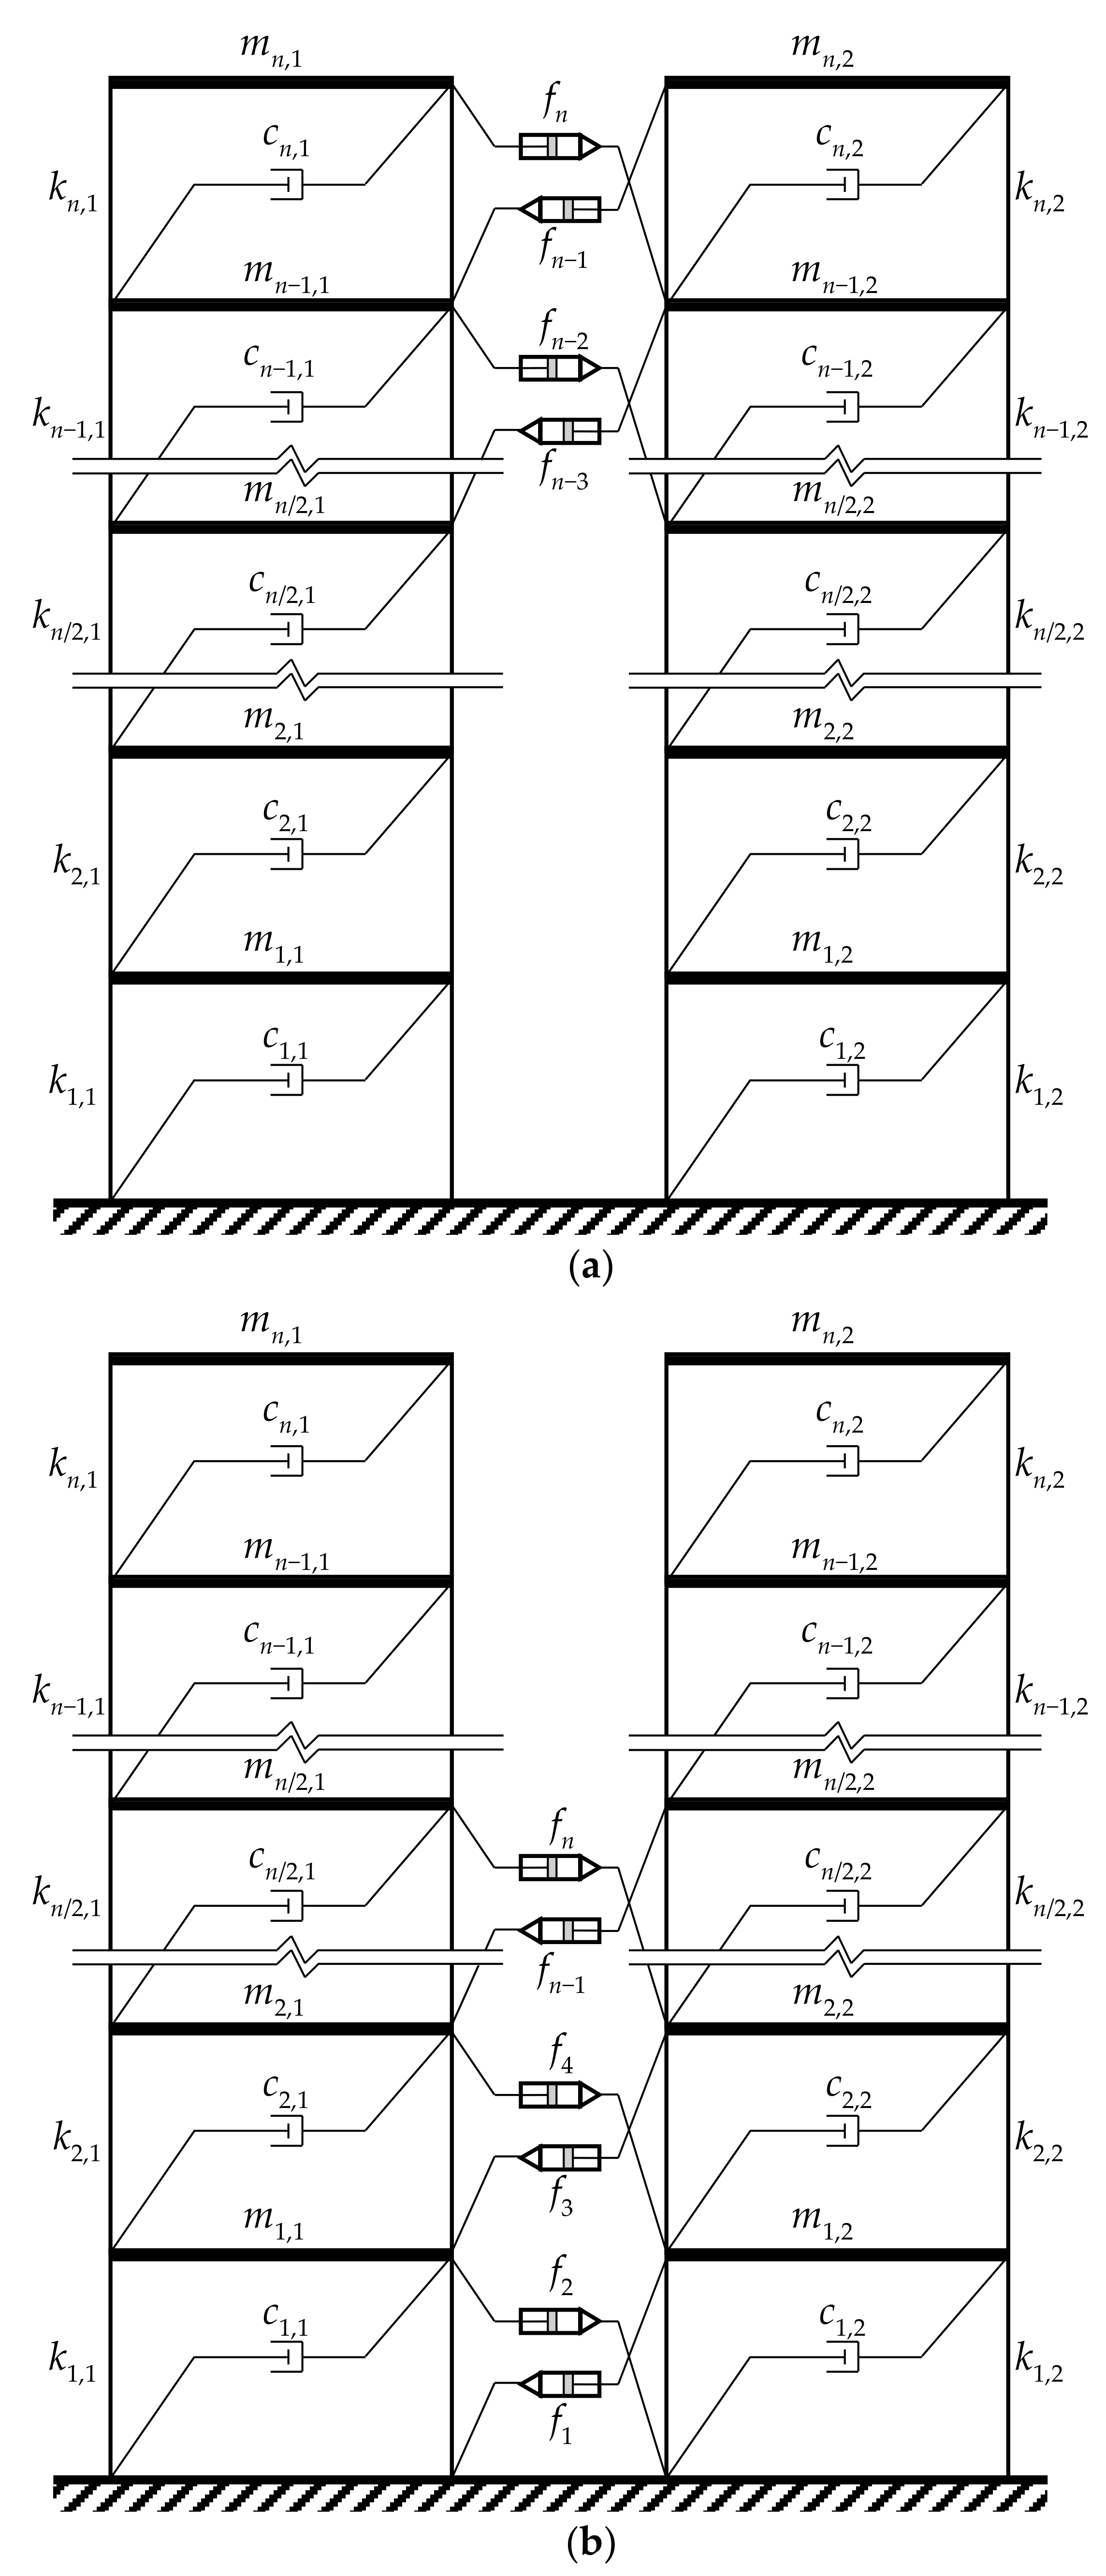
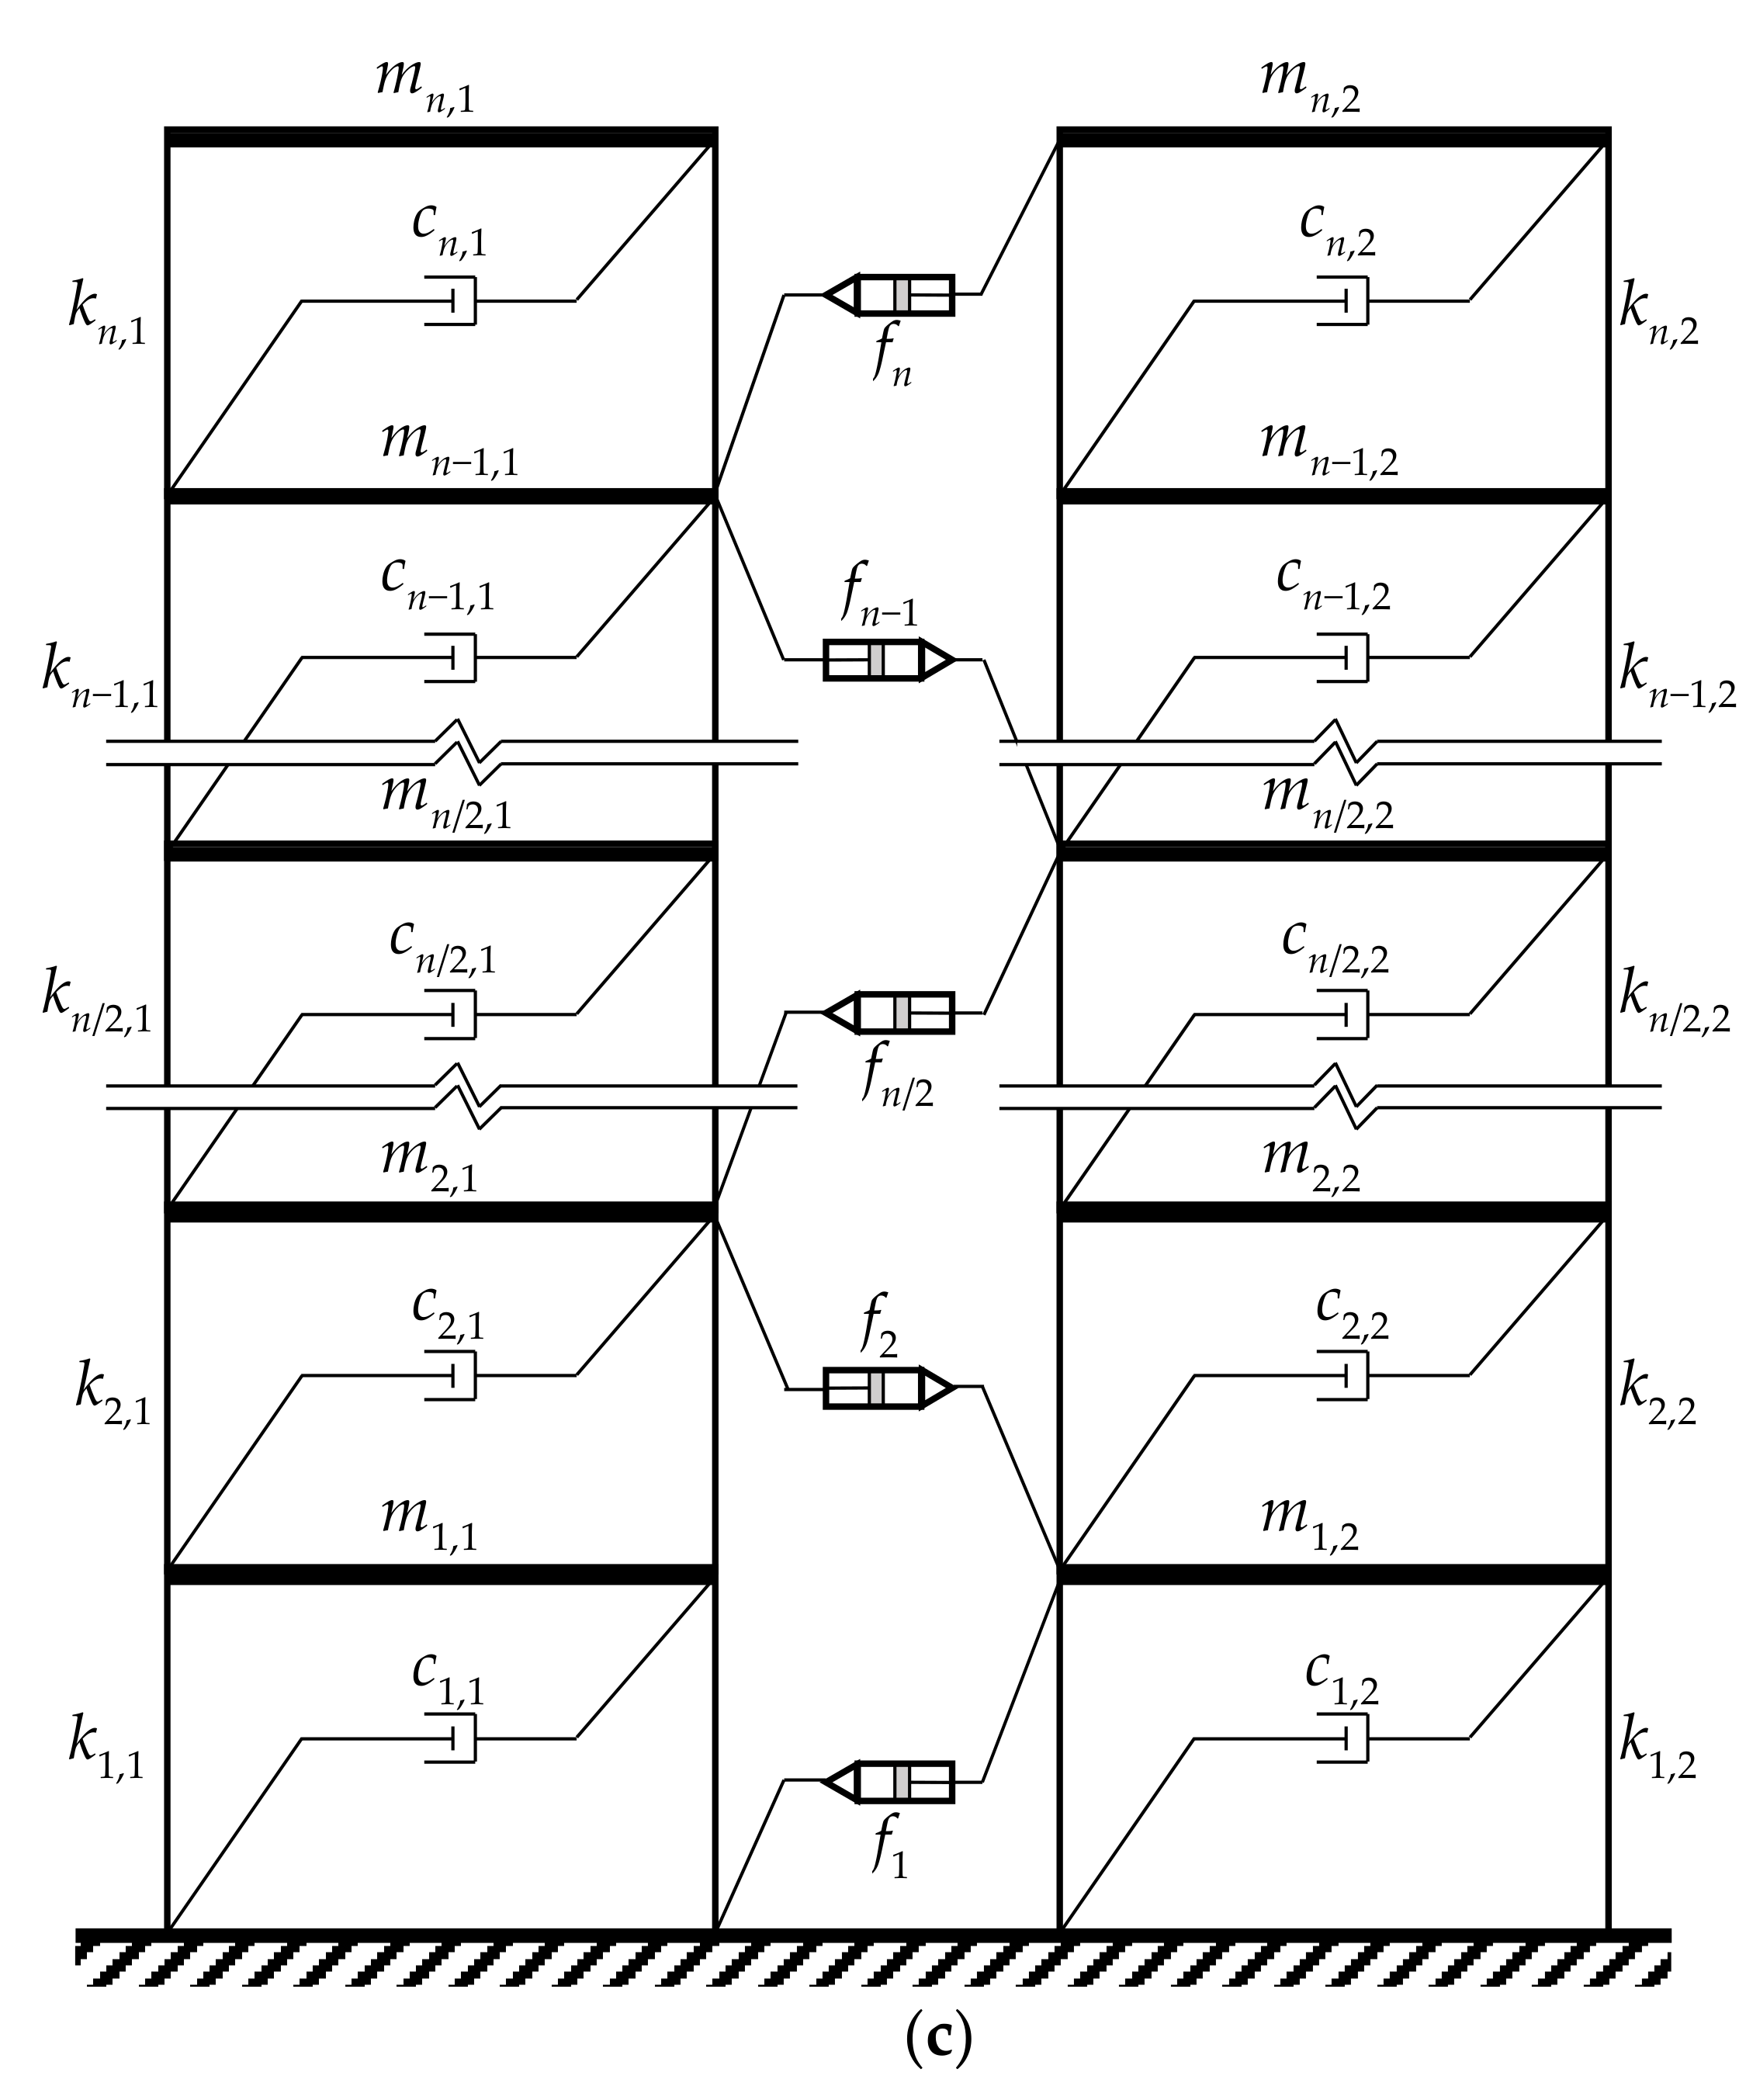
Figure 7.
Adjacent dynamically similar buildings connected by MR dampers in: (a) Configuration 2: MR dampers are used in the top half portion only; (b) Configuration 3: MR dampers are used in the bottom half portion only; and (c) Configuration 4: MR dampers are connected at alternate floors.
Figure 7.
Adjacent dynamically similar buildings connected by MR dampers in: (a) Configuration 2: MR dampers are used in the top half portion only; (b) Configuration 3: MR dampers are used in the bottom half portion only; and (c) Configuration 4: MR dampers are connected at alternate floors.
Figure 8.
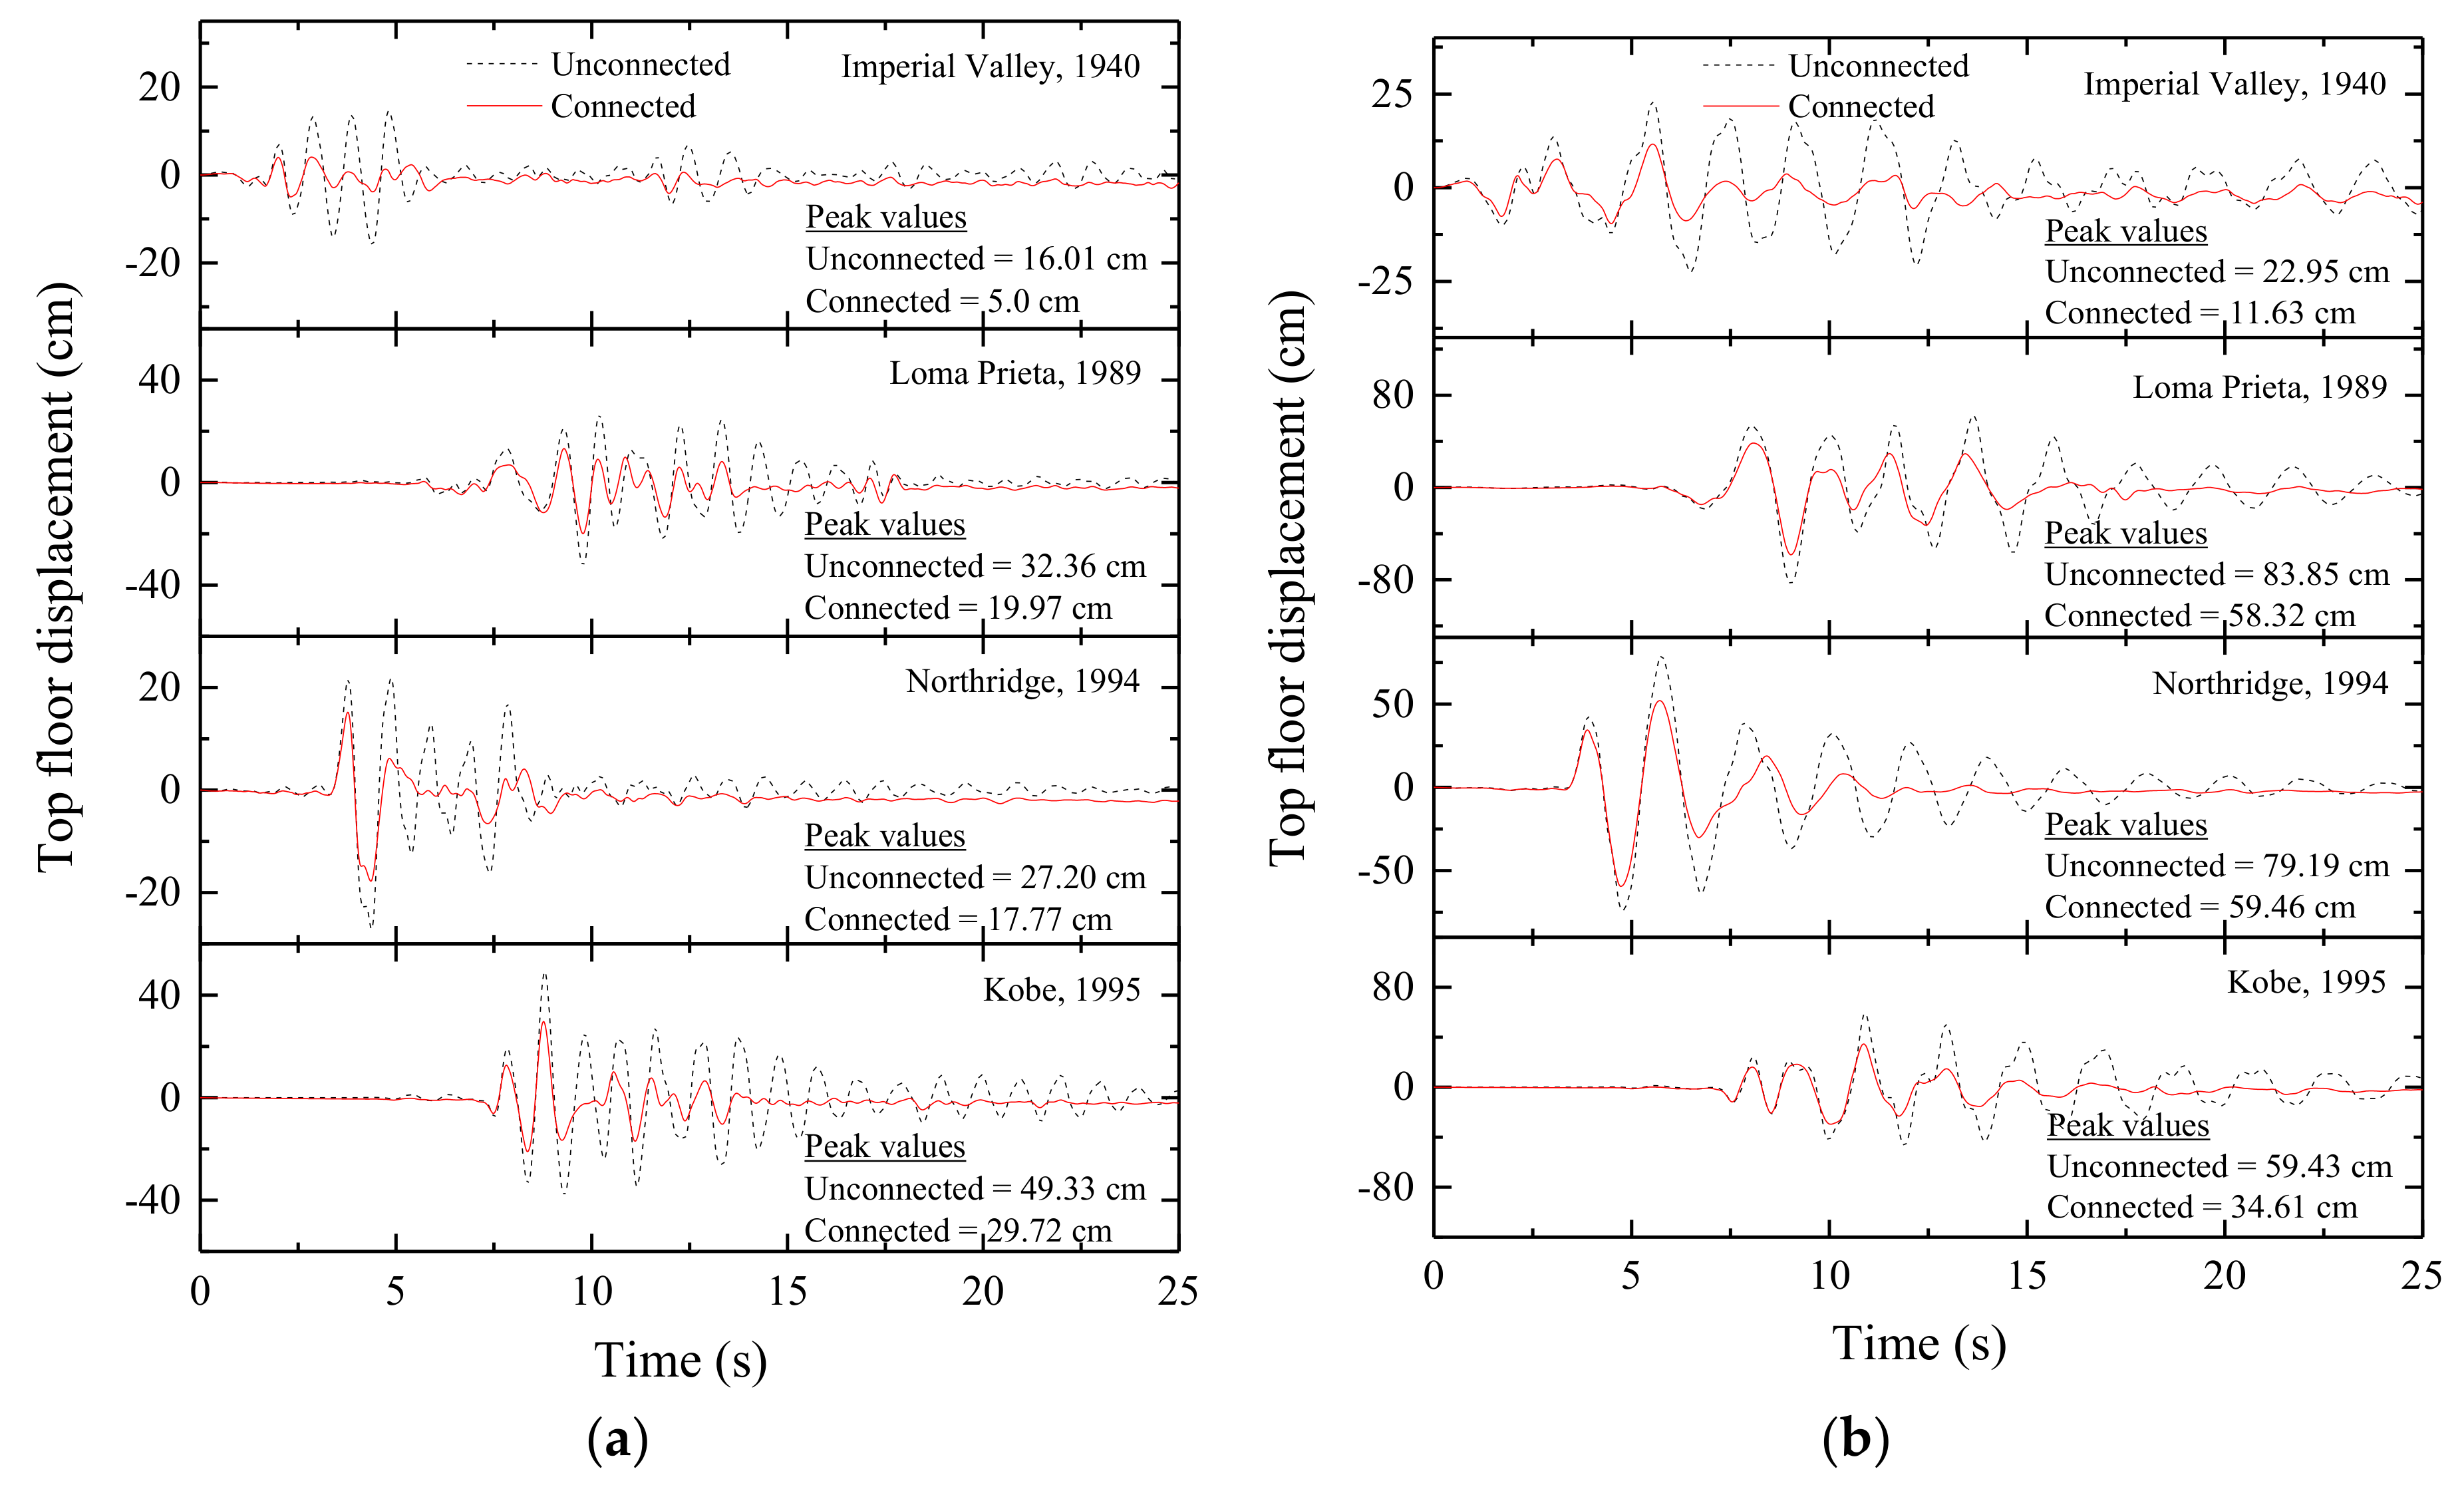
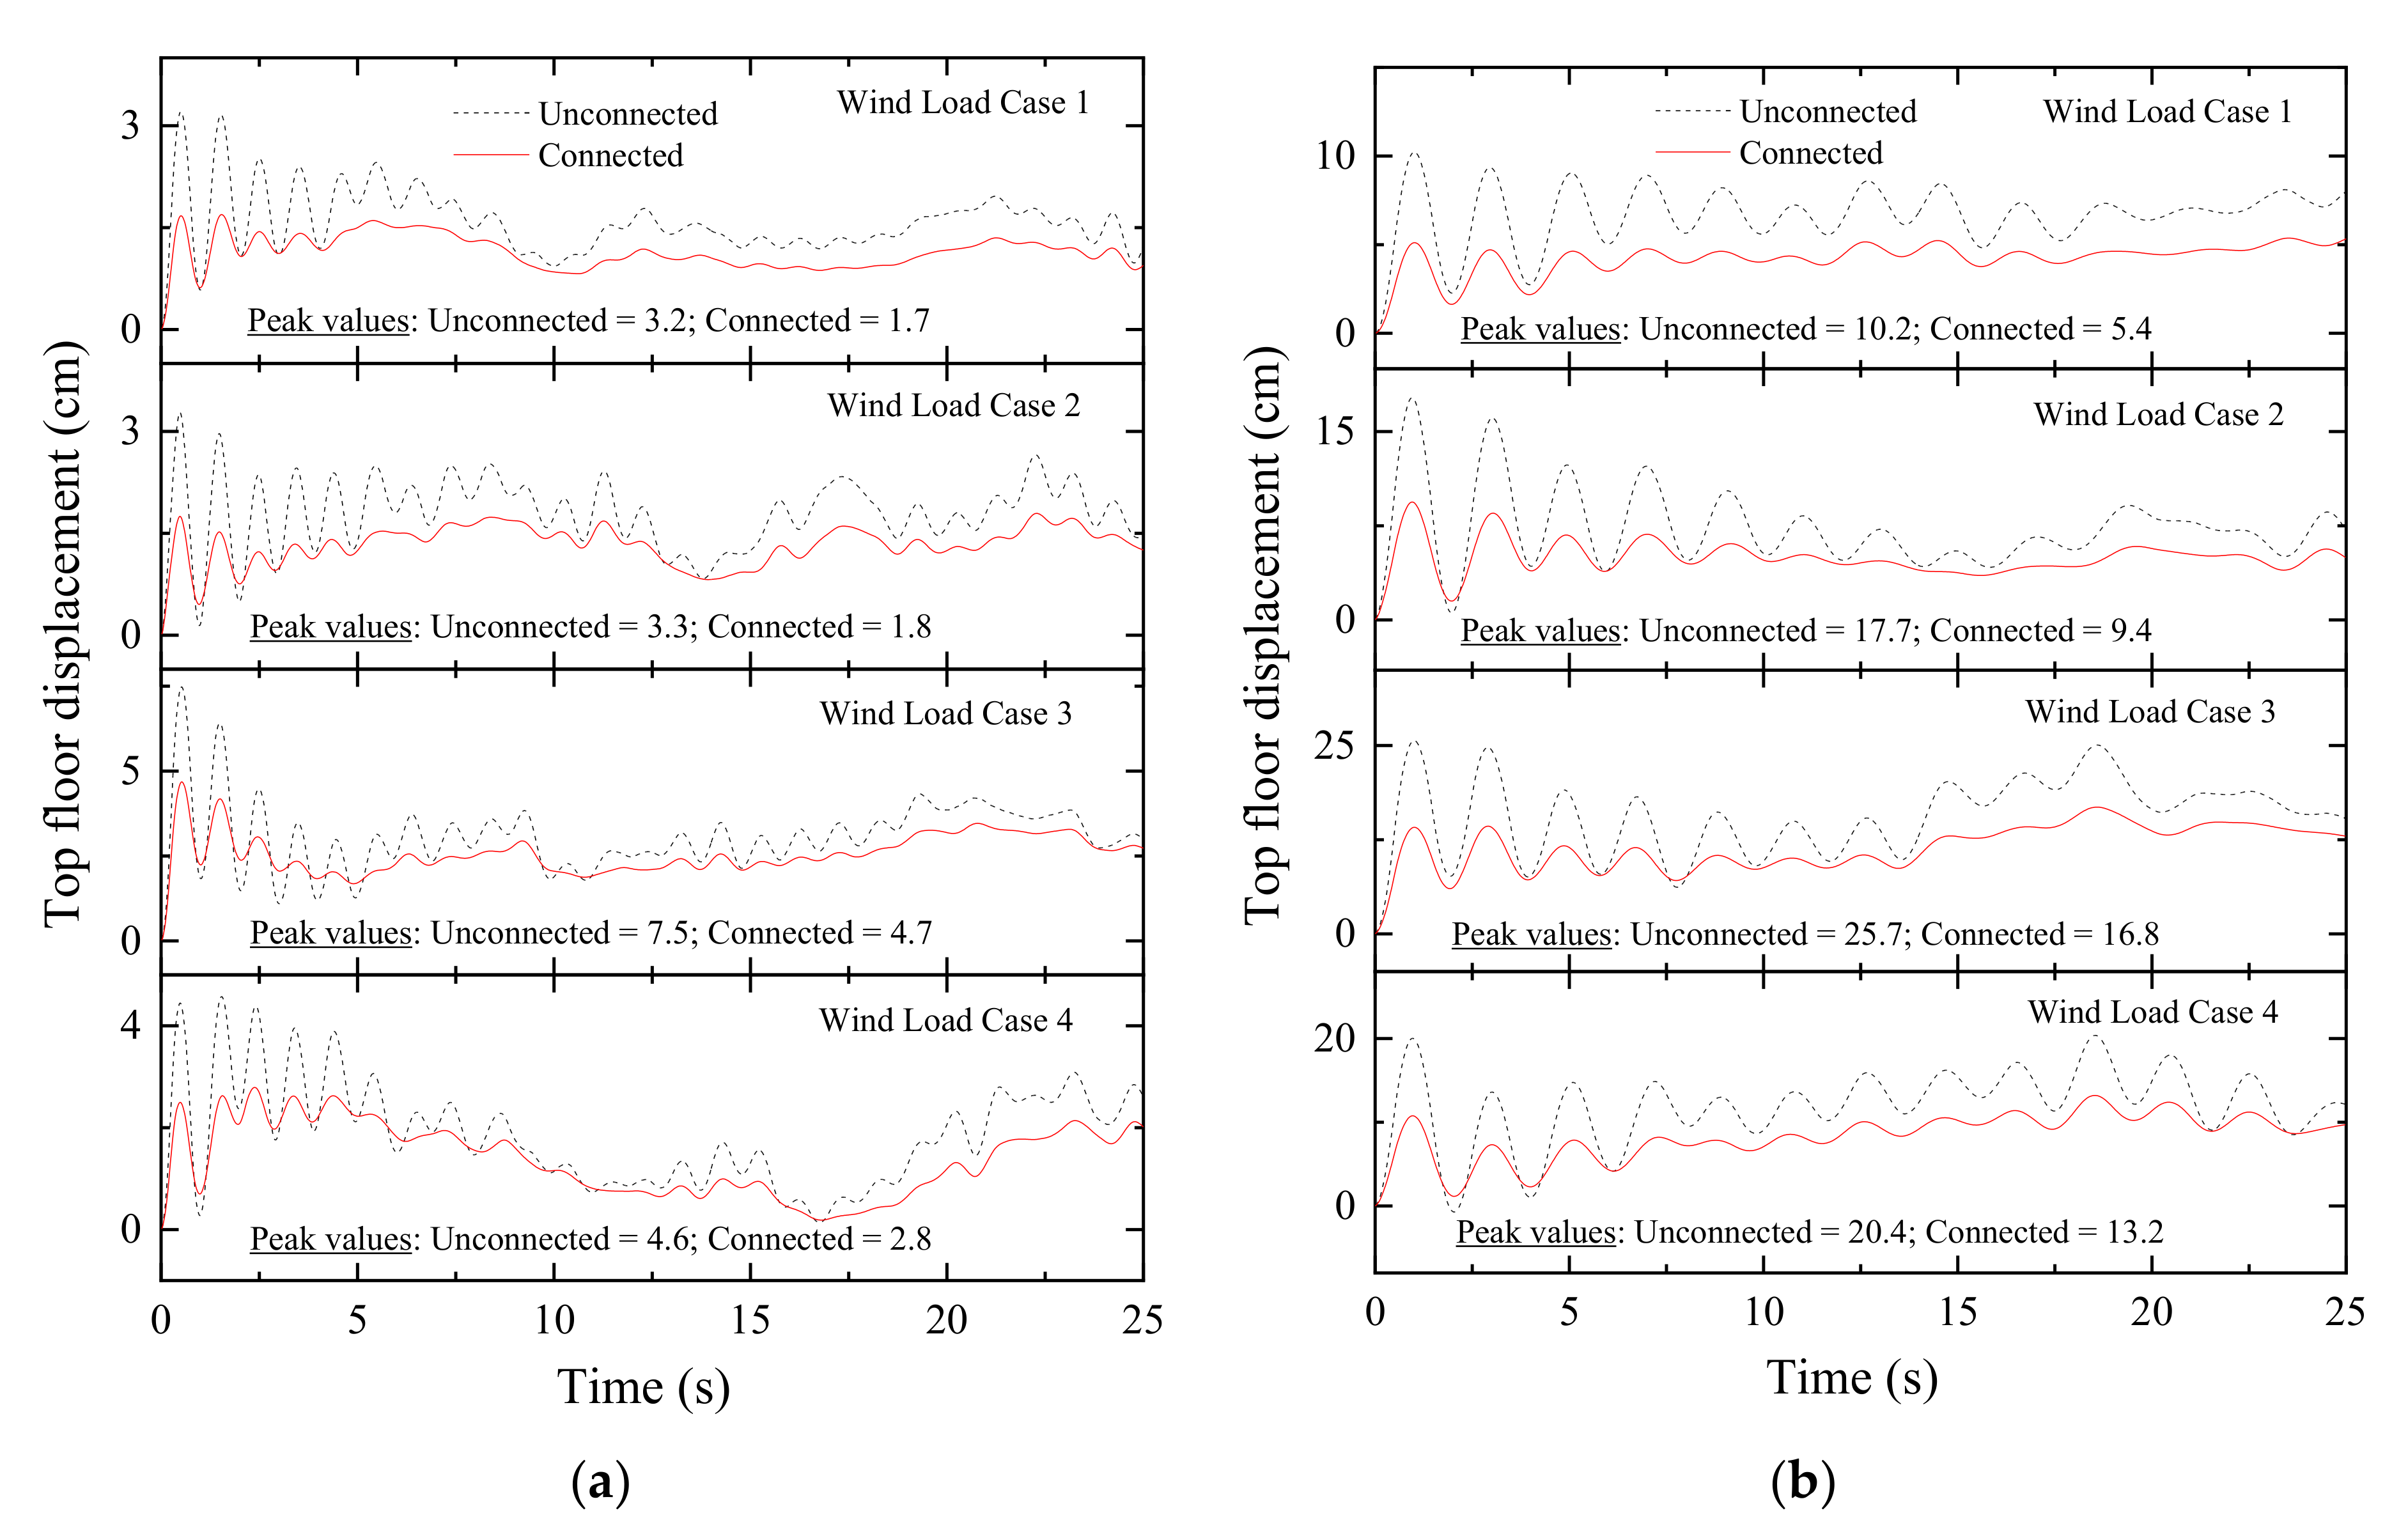
Time history of top floor displacement in: (a) a coupled stiff building and (b) a coupled flexible building when semi-active MR dampers are used as coupling devices in Configuration 1.
Figure 8.
Time history of top floor displacement in: (a) a coupled stiff building and (b) a coupled flexible building when semi-active MR dampers are used as coupling devices in Configuration 1.
Figure 9.
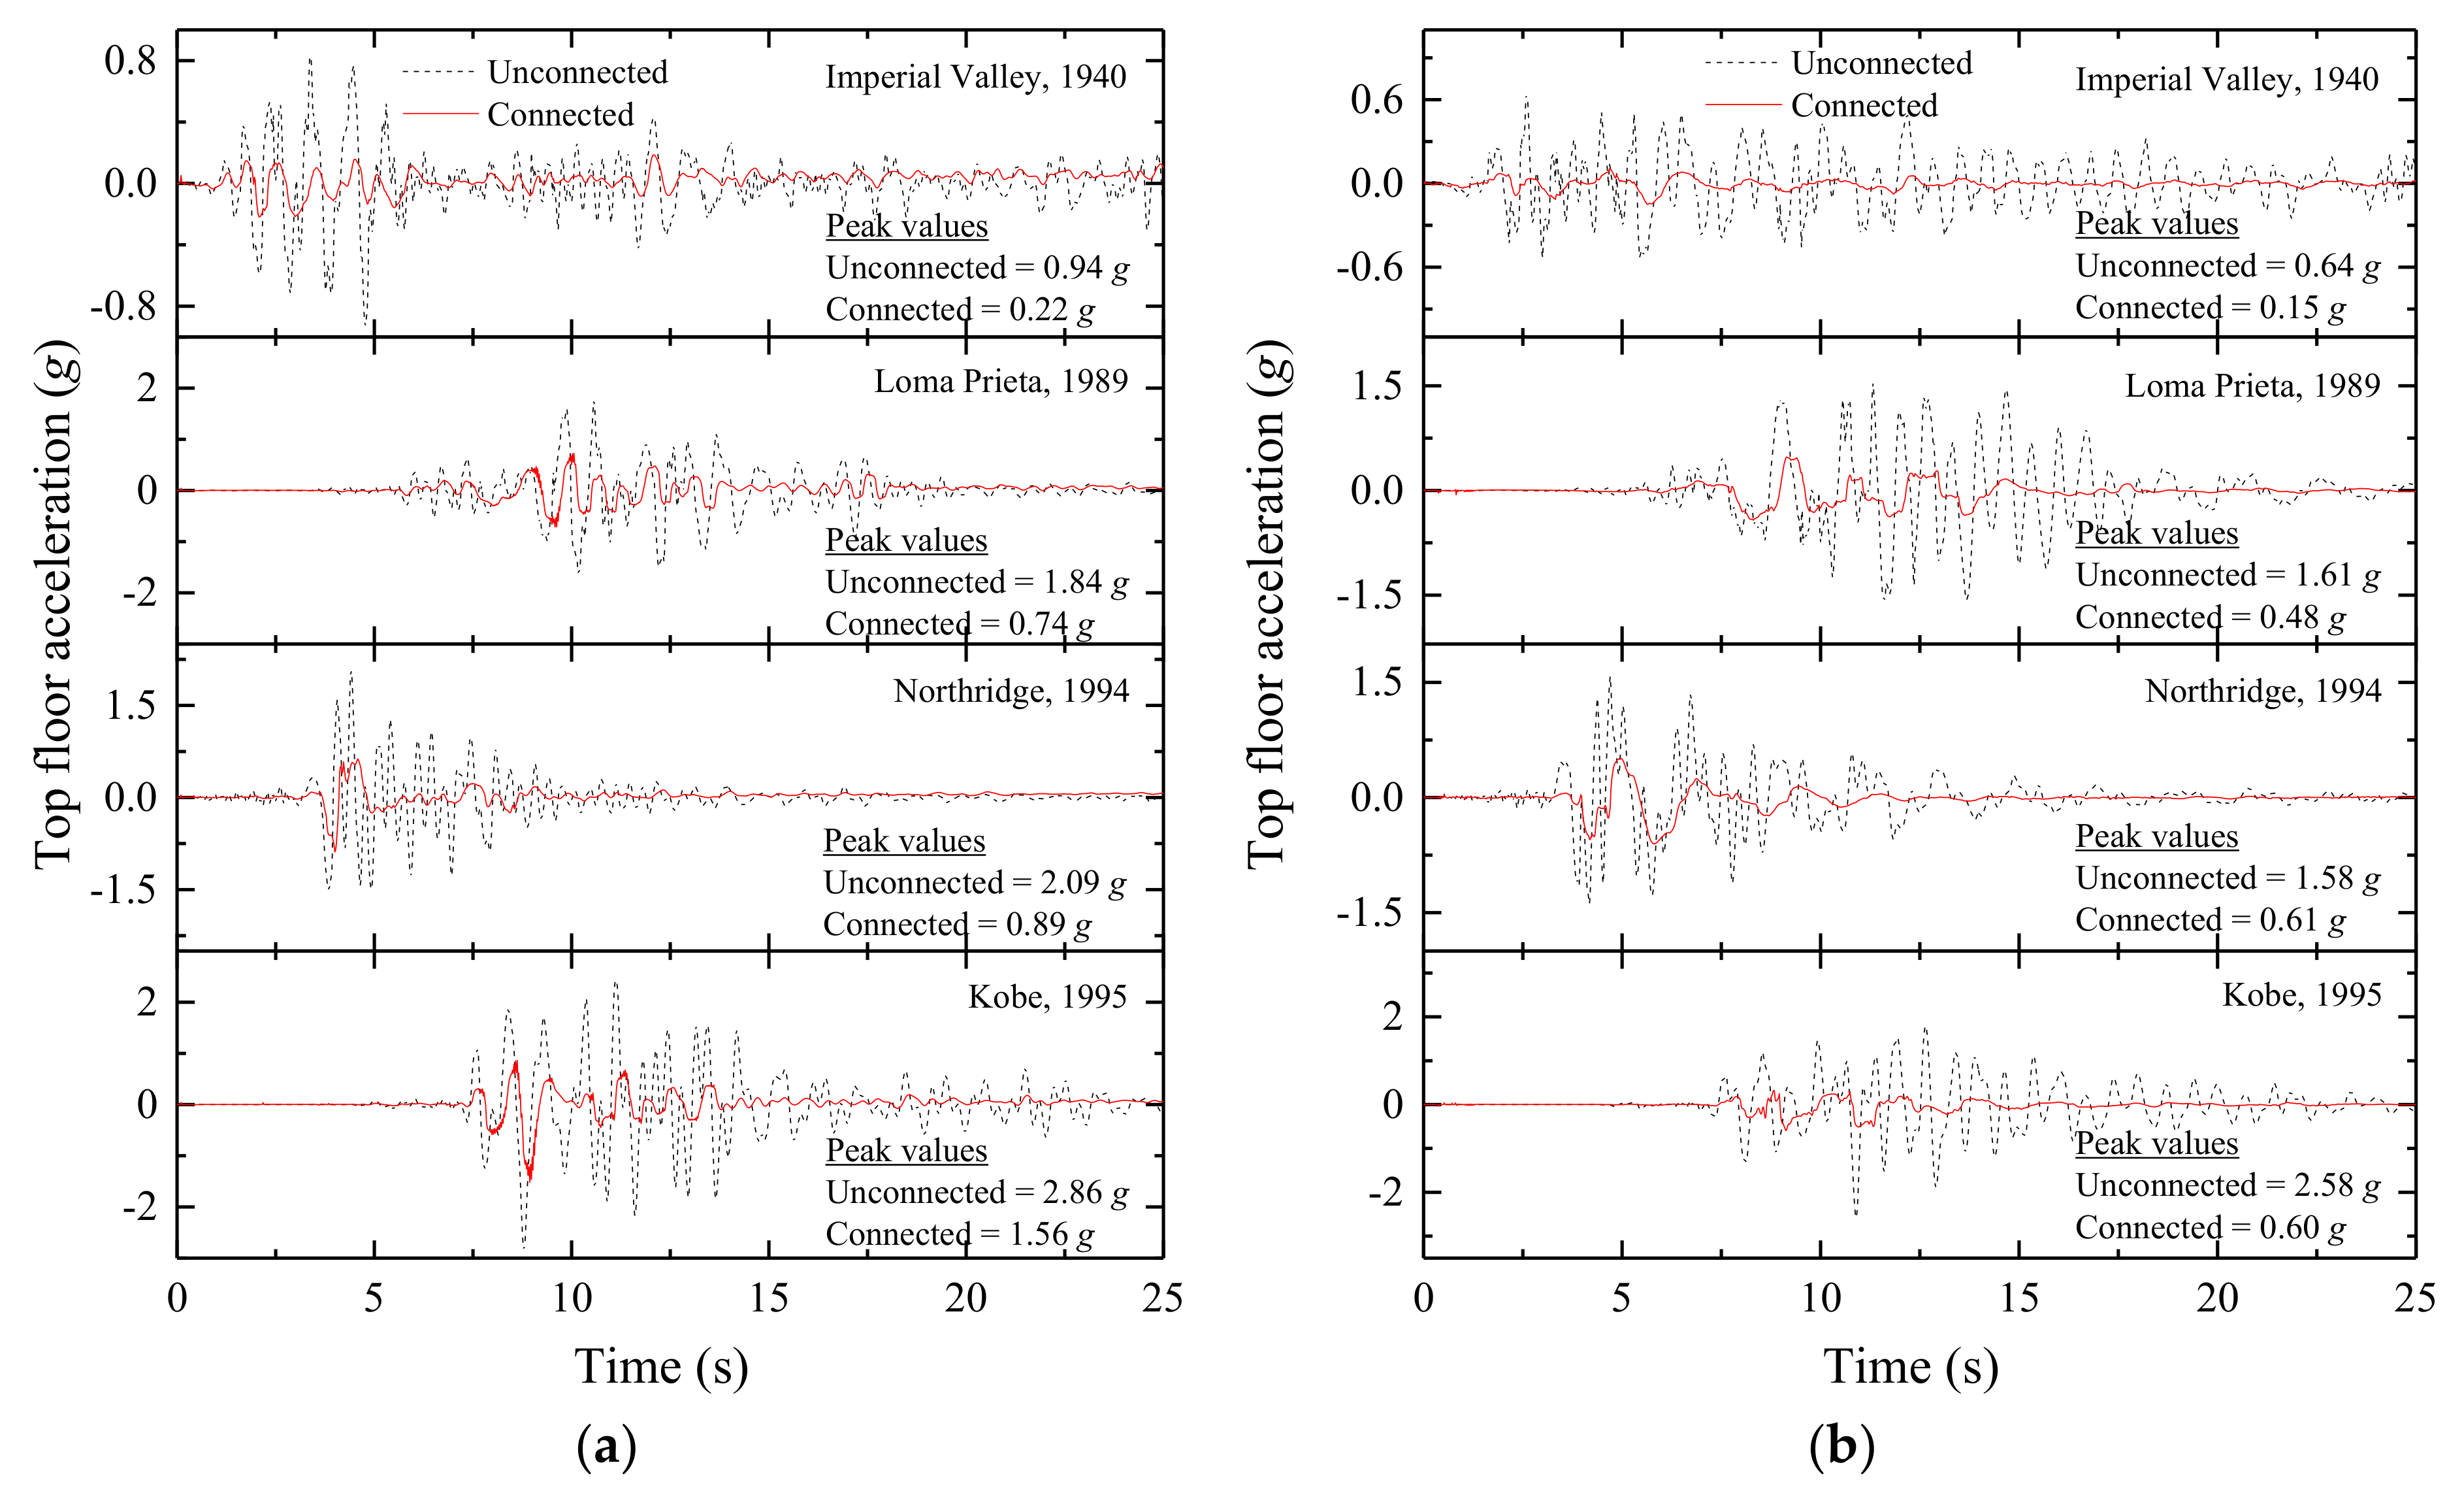
Time history of absolute top floor acceleration in: (a) a coupled stiff building and (b) a coupled flexible building when semi-active MR dampers are used as coupling devices in Configuration 1.
Figure 9.
Time history of absolute top floor acceleration in: (a) a coupled stiff building and (b) a coupled flexible building when semi-active MR dampers are used as coupling devices in Configuration 1.
Figure 10.
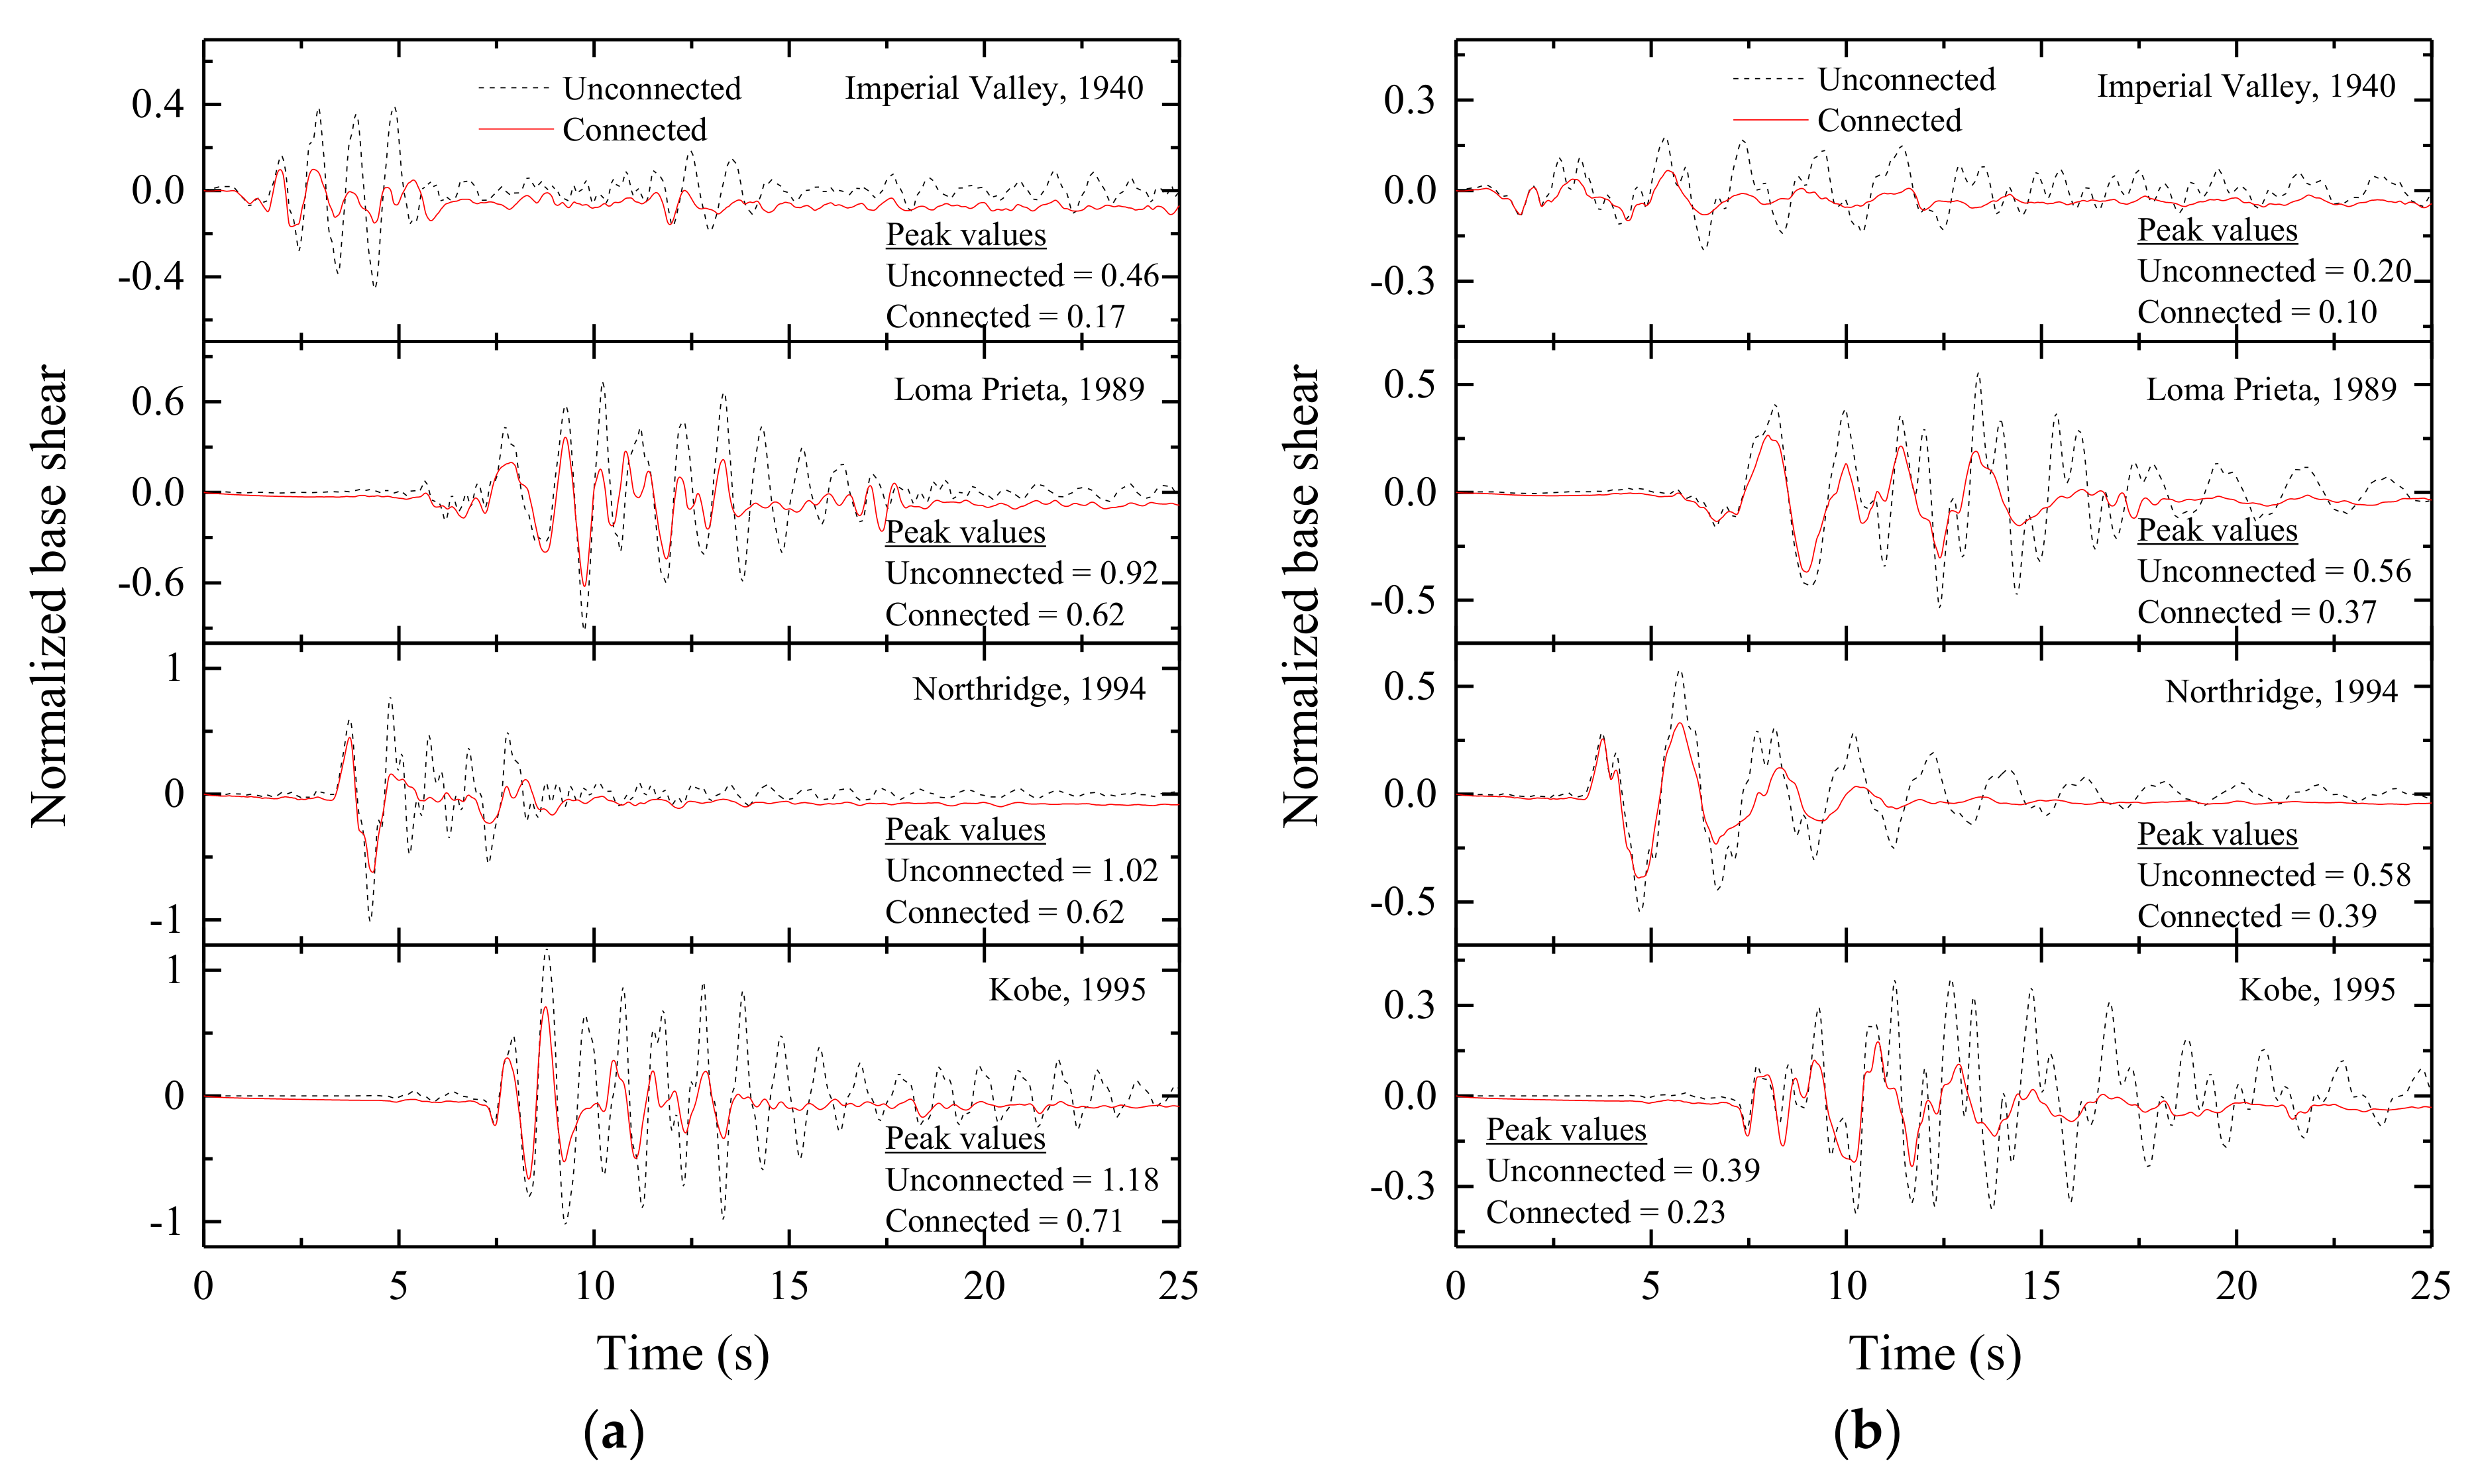
Time history of normalized base shear in: (a) a coupled stiff building and (b) a coupled flexible building when semi-active MR dampers are used as coupling devices in Configuration 1.
Figure 10.
Time history of normalized base shear in: (a) a coupled stiff building and (b) a coupled flexible building when semi-active MR dampers are used as coupling devices in Configuration 1.
Figure 11.
Peak floor displacement under different control states in: (a) a coupled stiff building and (b) a coupled flexible building when MR dampers are used as coupling devices in Configuration 1.
Figure 11.
Peak floor displacement under different control states in: (a) a coupled stiff building and (b) a coupled flexible building when MR dampers are used as coupling devices in Configuration 1.
Figure 12.
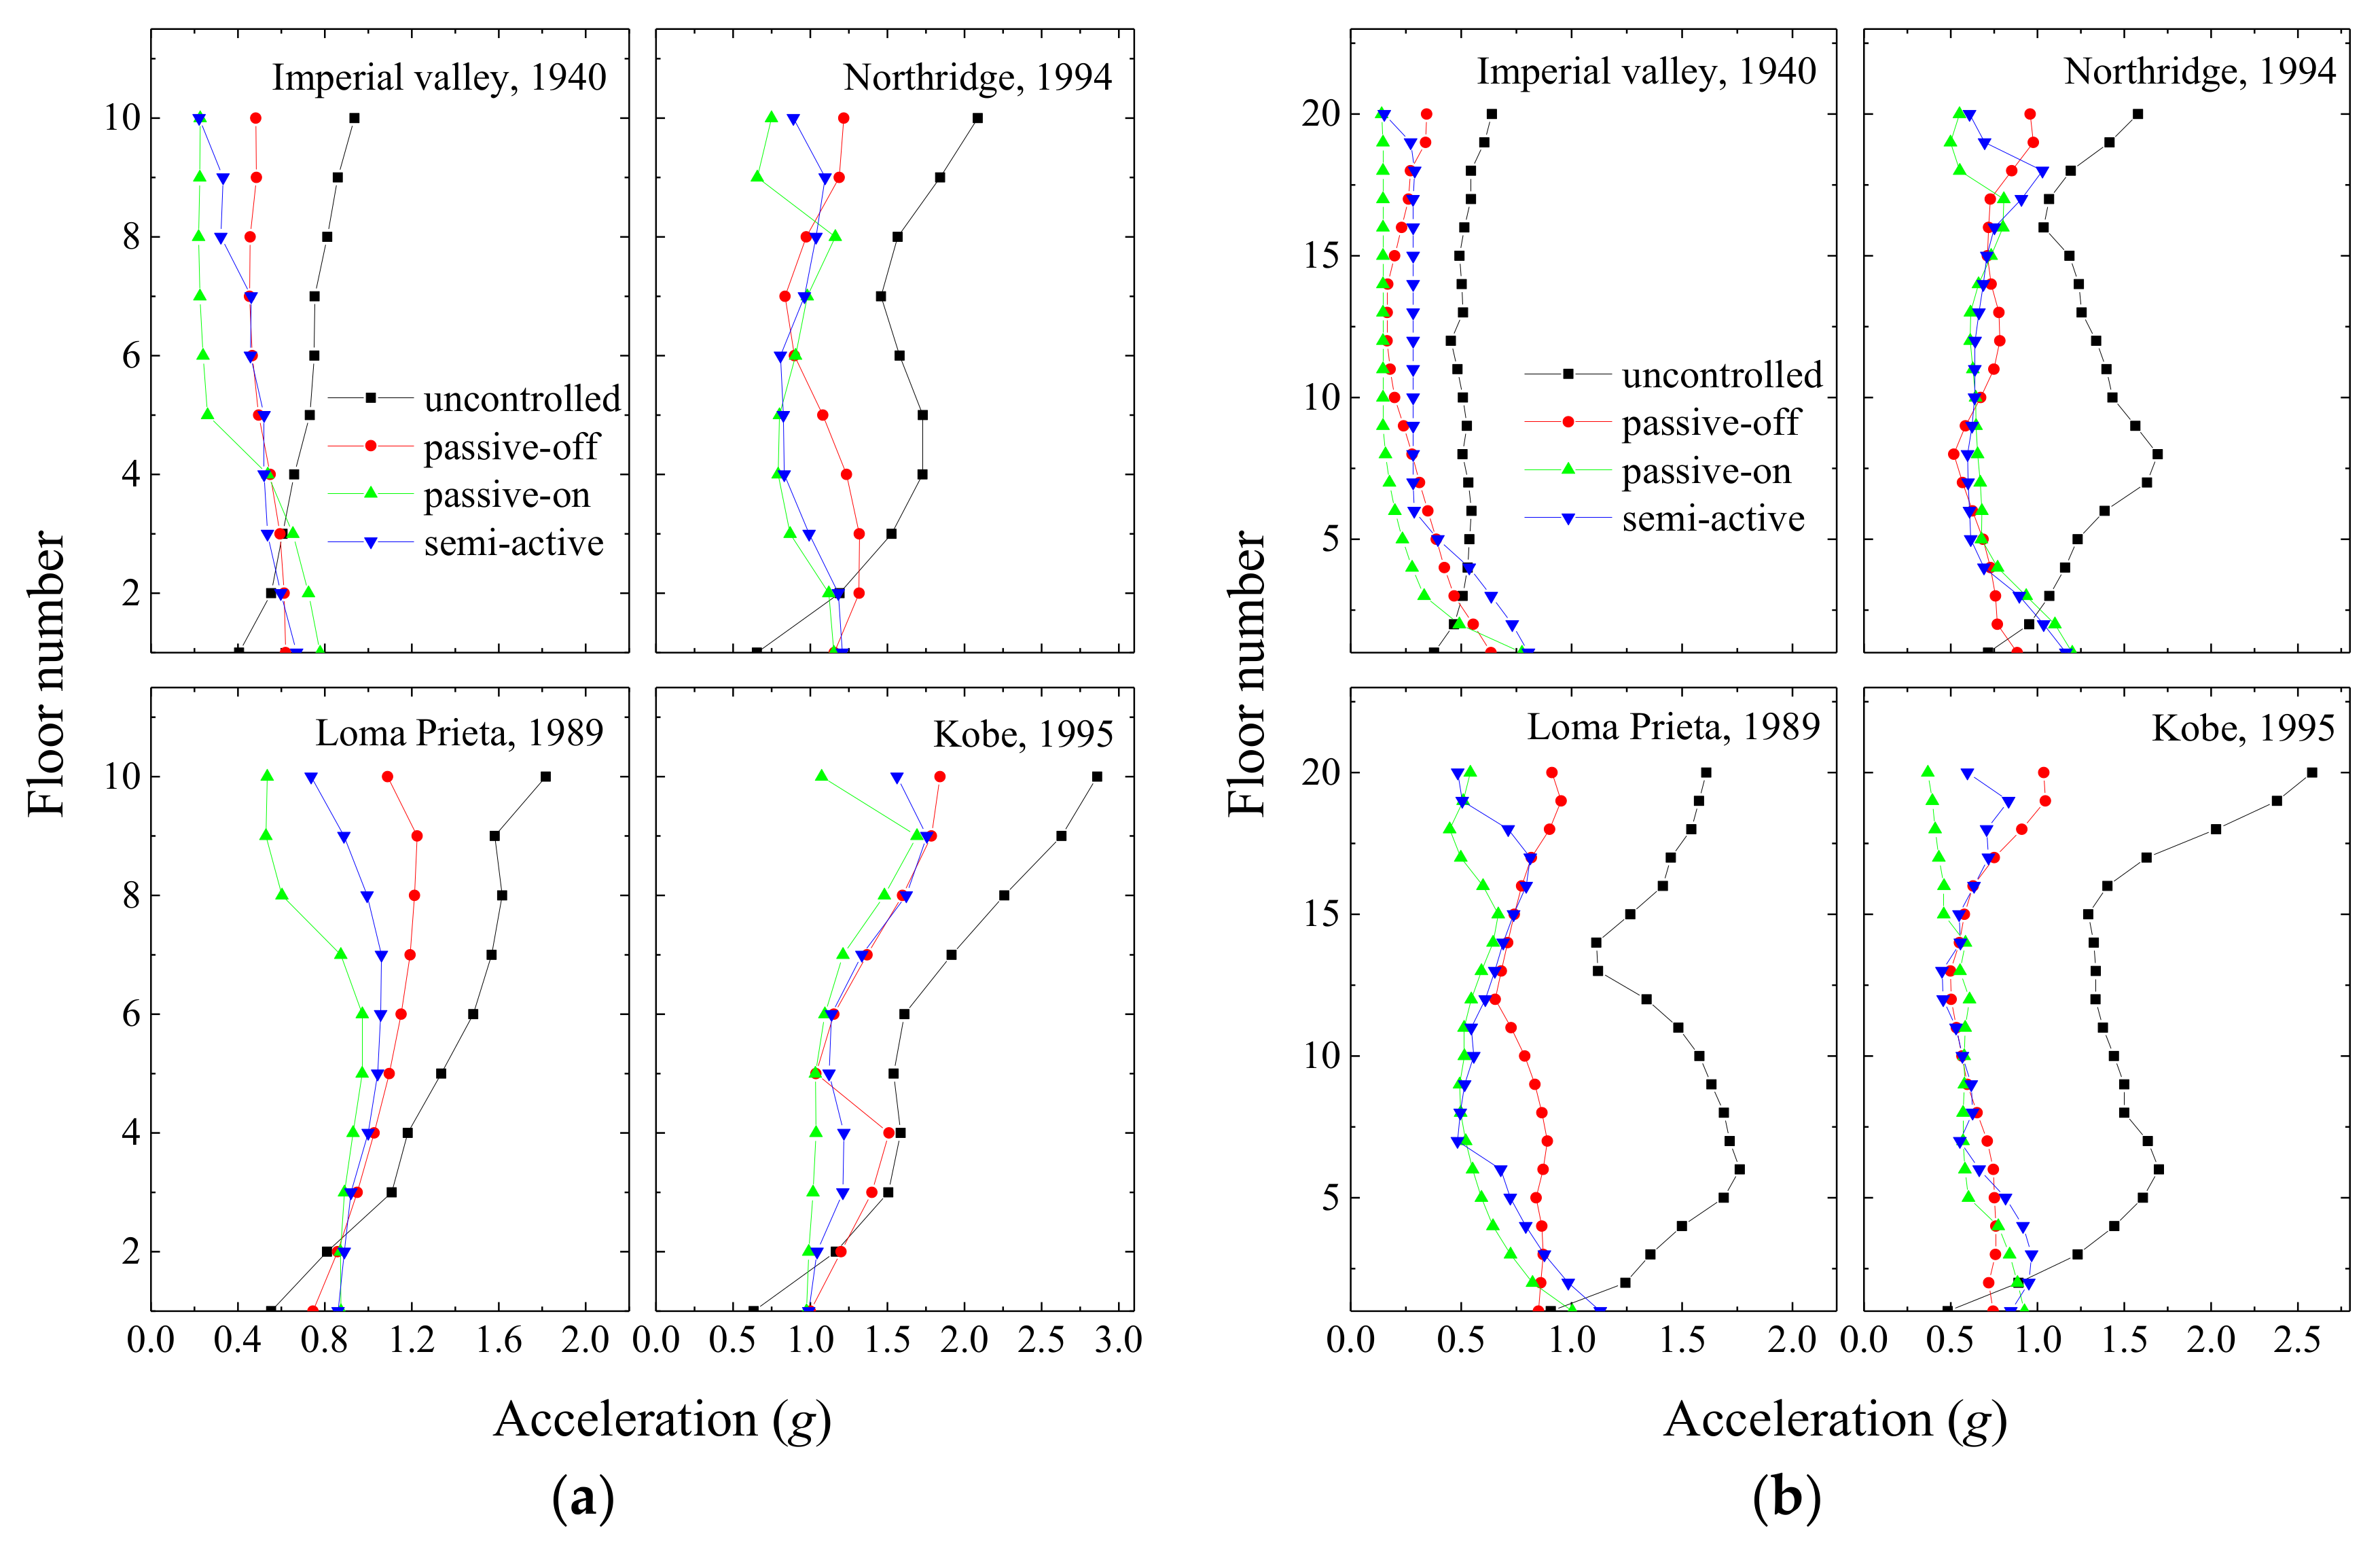
Peak floor acceleration under different control states in: (a) a coupled stiff building and (b) a coupled flexible building when MR dampers are used as coupling devices in Configuration 1.
Figure 12.
Peak floor acceleration under different control states in: (a) a coupled stiff building and (b) a coupled flexible building when MR dampers are used as coupling devices in Configuration 1.
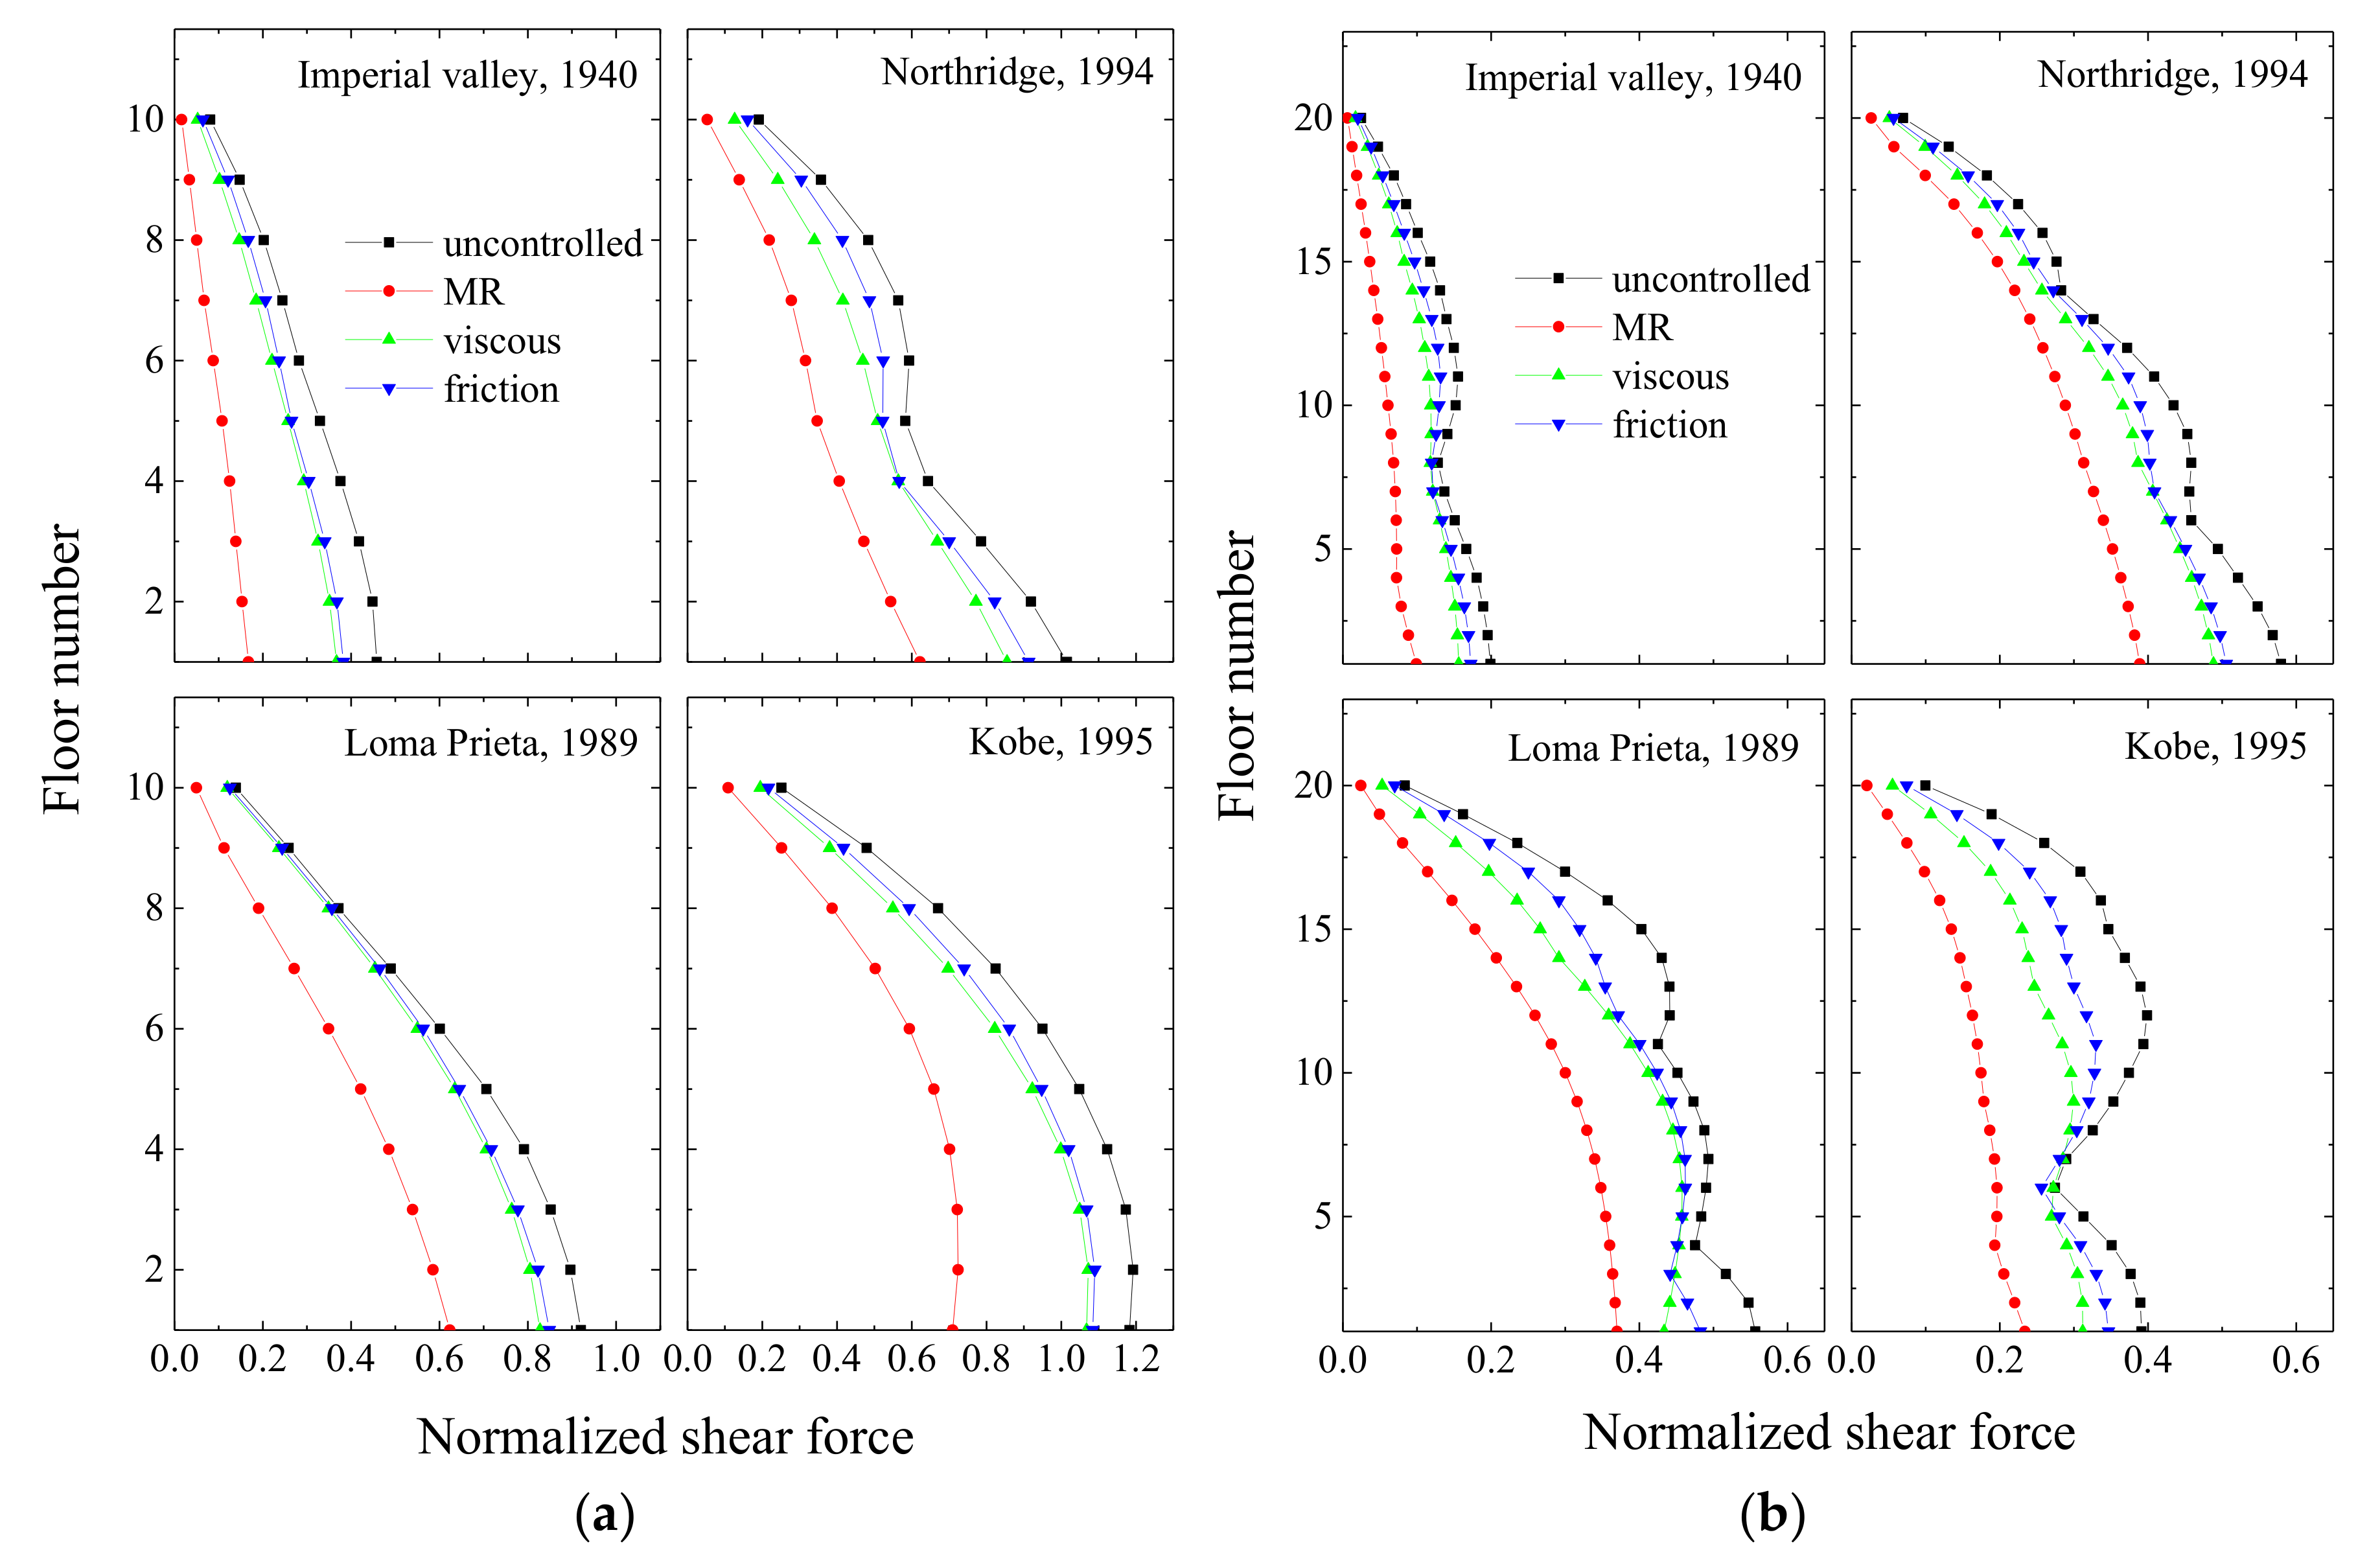
Figure 13.
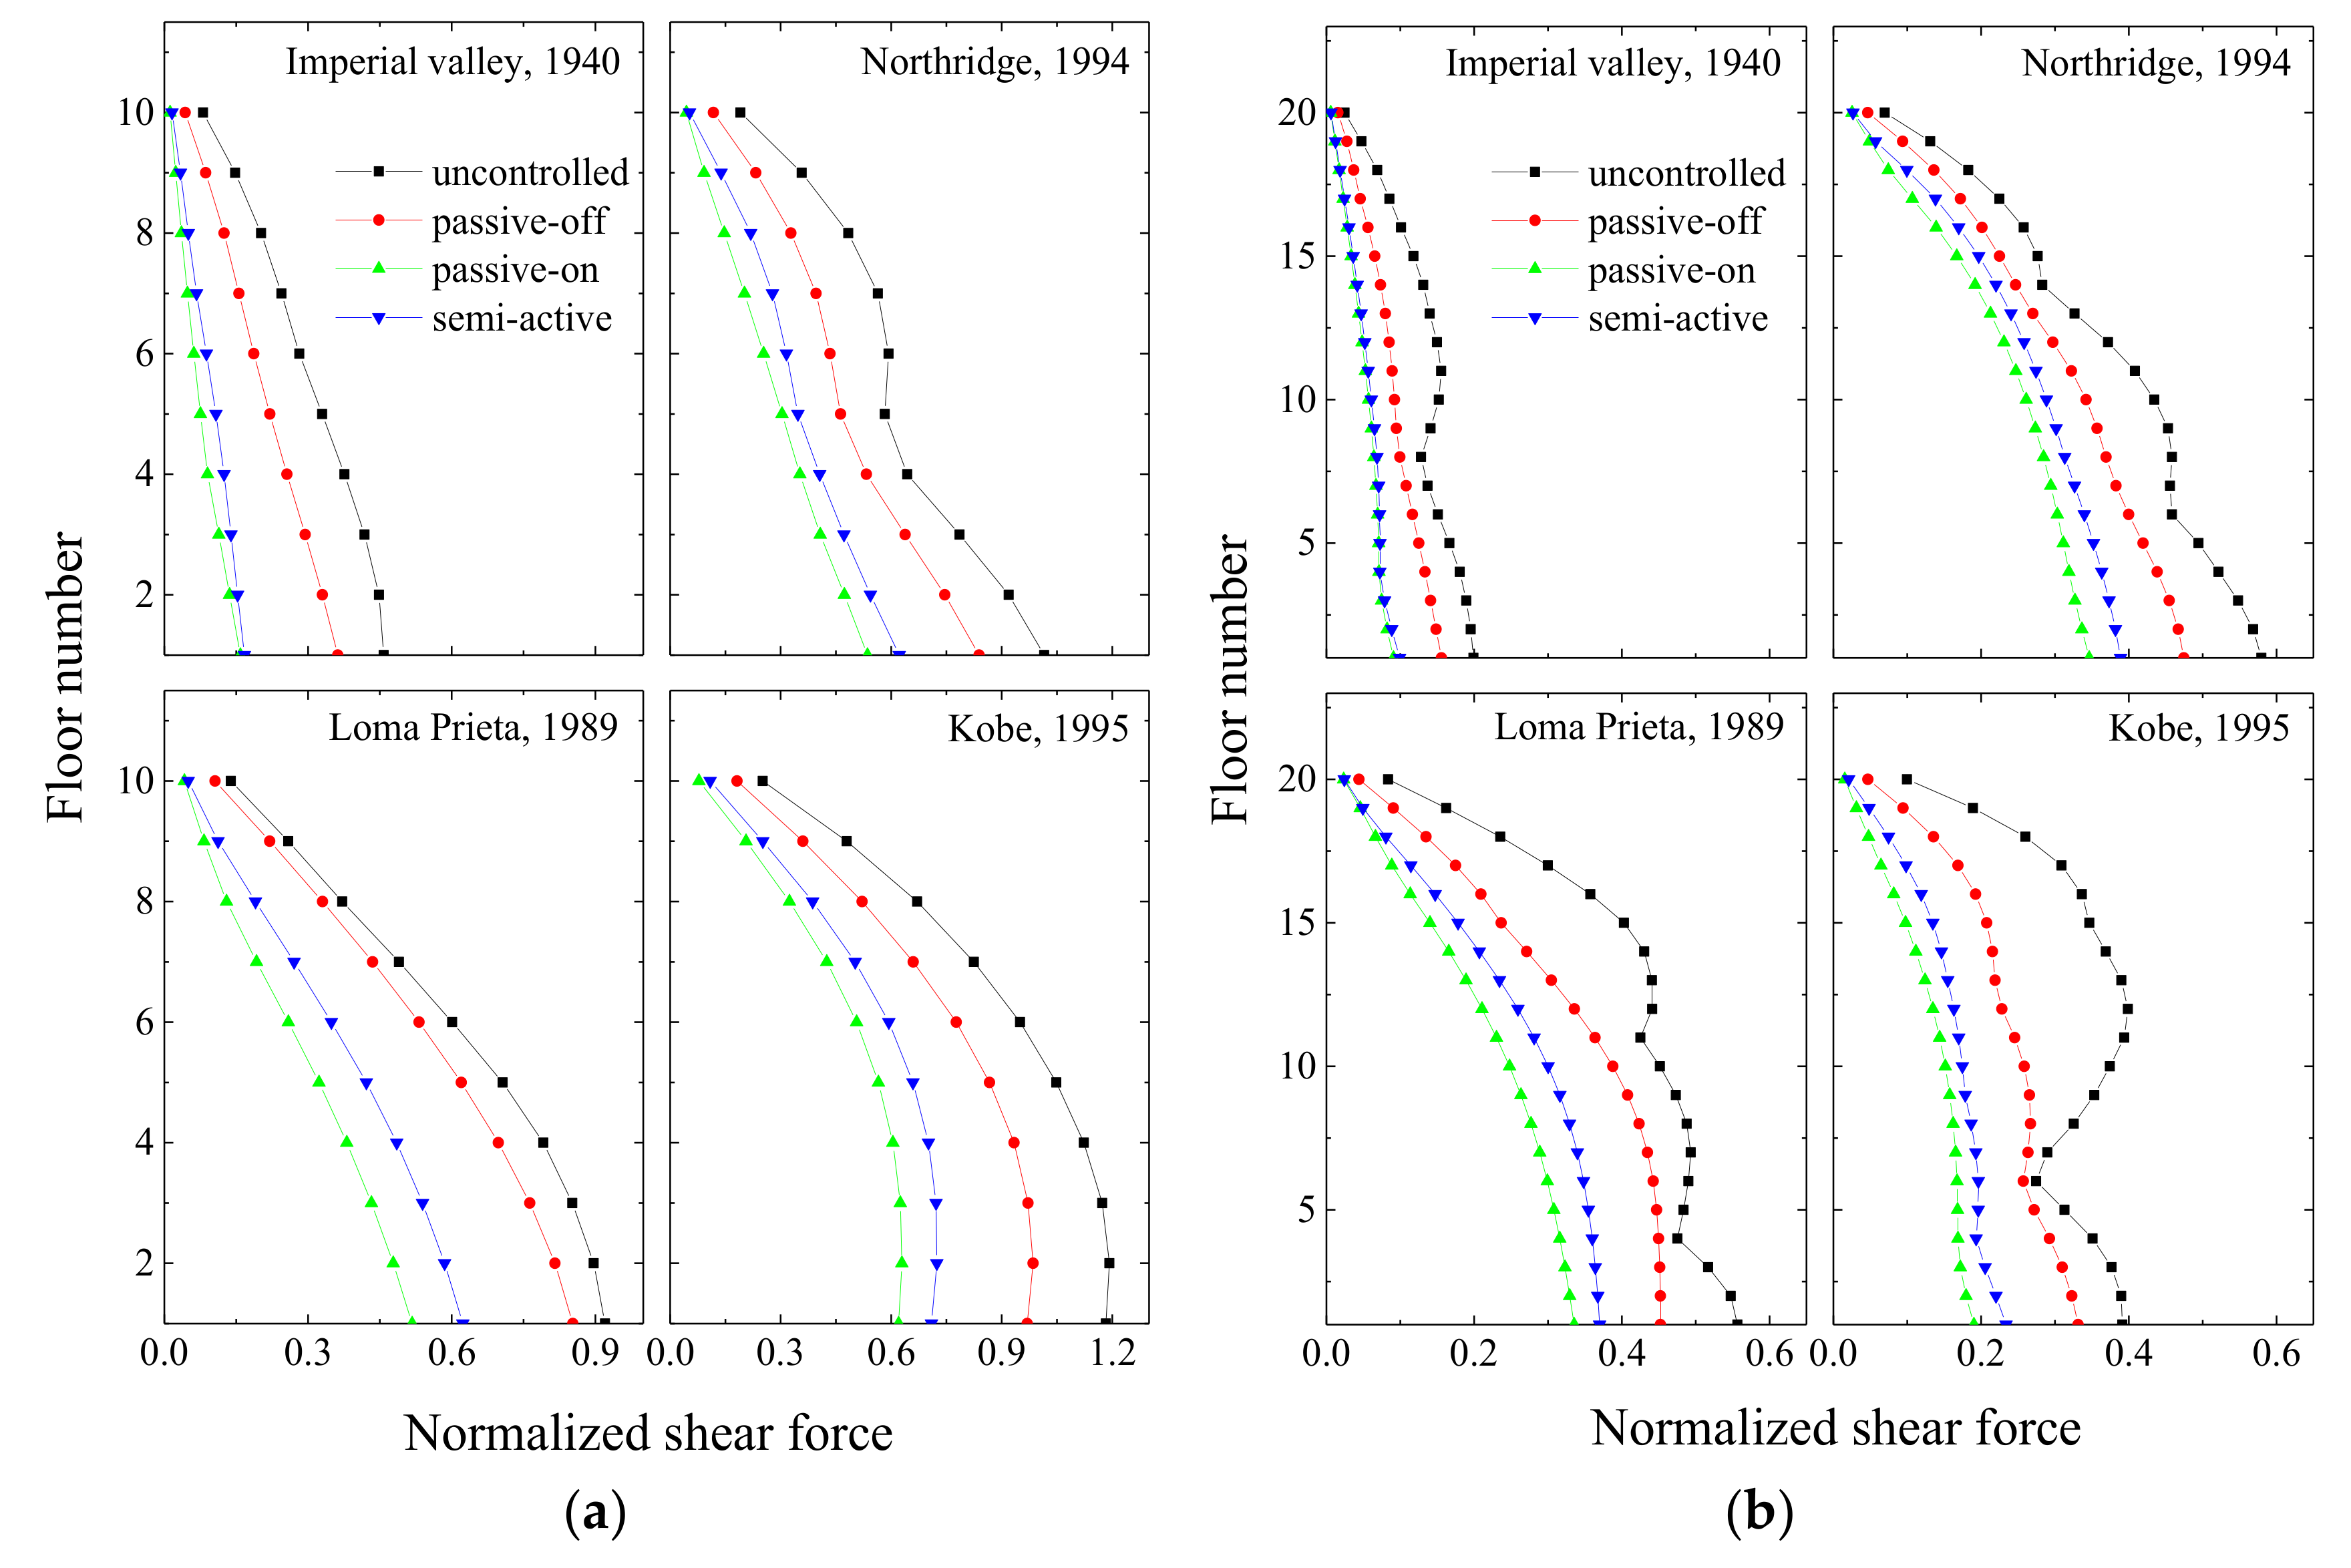
Peak floor shear under different control states in: (a) a coupled stiff building and (b) a coupled flexible building when MR dampers are used as coupling devices in Configuration 1.
Figure 13.
Peak floor shear under different control states in: (a) a coupled stiff building and (b) a coupled flexible building when MR dampers are used as coupling devices in Configuration 1.
Figure 14.
Peak floor displacement under different damper configurations in: (a) a coupled stiff building and (b) a coupled flexible building under semi-active control of the MR damper.
Figure 14.
Peak floor displacement under different damper configurations in: (a) a coupled stiff building and (b) a coupled flexible building under semi-active control of the MR damper.
Figure 15.
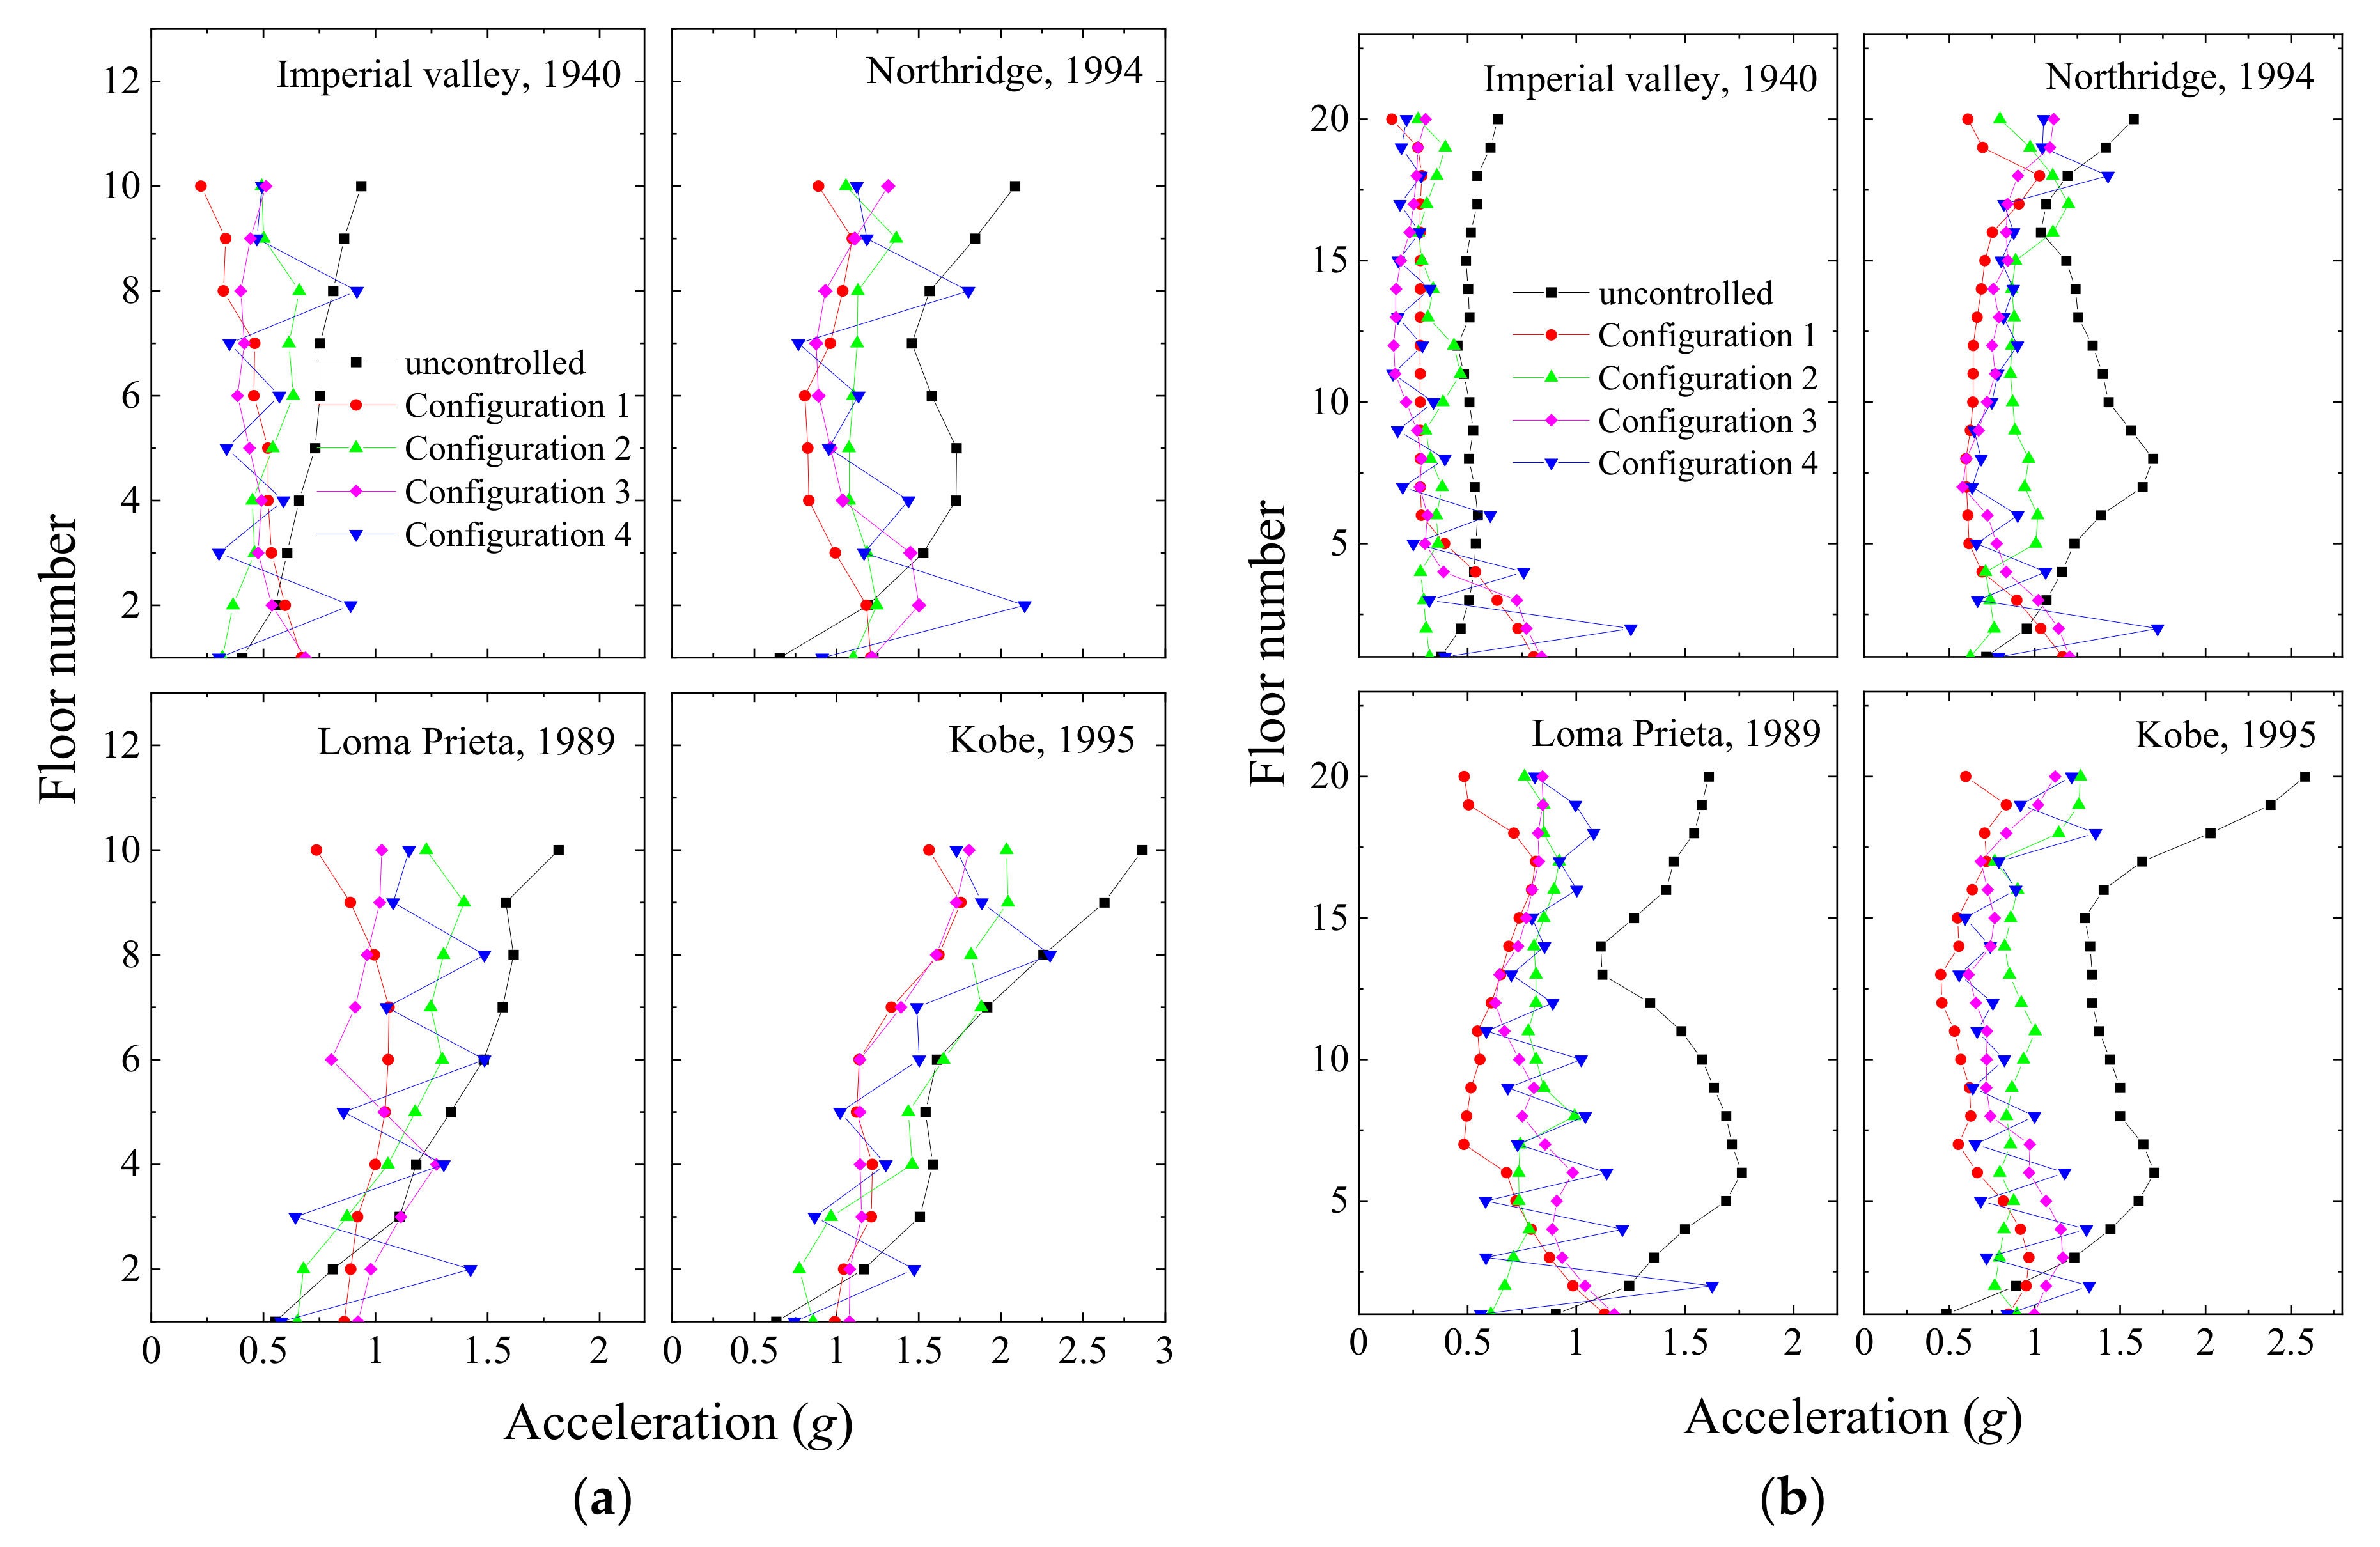
Peak floor acceleration under different damper configurations in: (a) a coupled stiff building and (b) a coupled flexible building under semi-active control of the MR damper.
Figure 15.
Peak floor acceleration under different damper configurations in: (a) a coupled stiff building and (b) a coupled flexible building under semi-active control of the MR damper.
Figure 16.
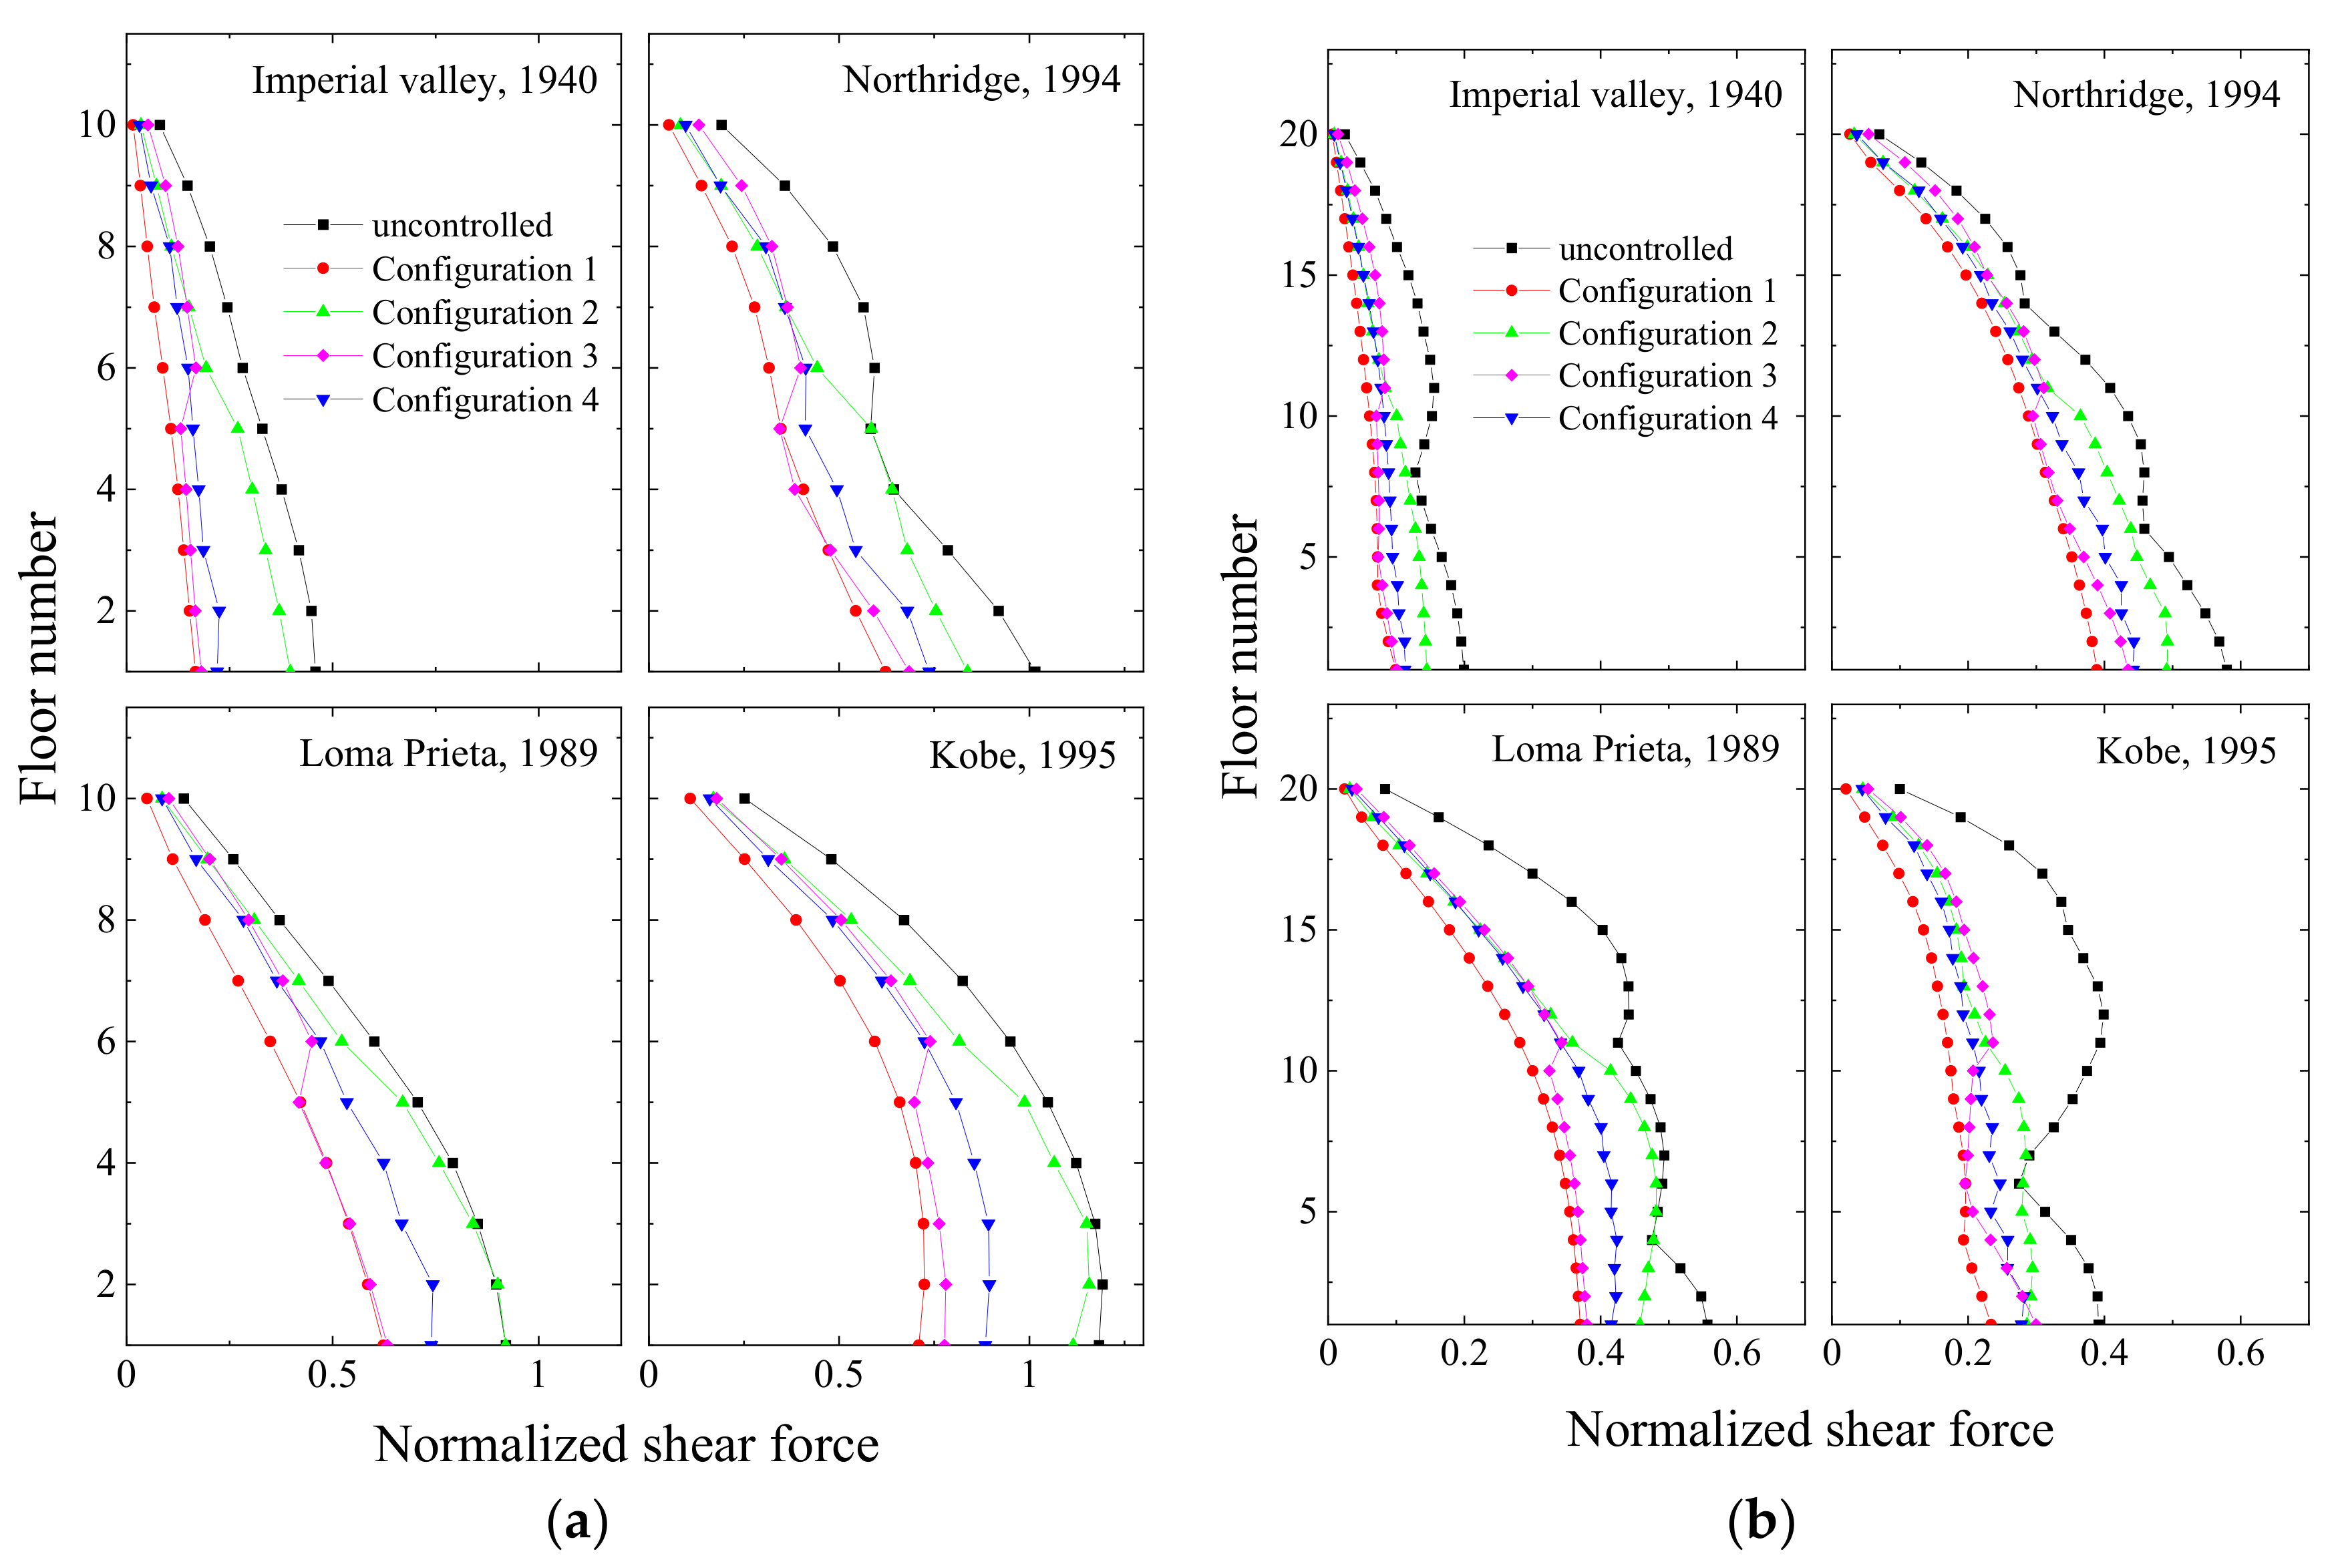
Peak floor shear force under different damper configurations in: (a) a coupled stiff building and (b) a coupled flexible building under semi-active control of the MR damper.
Figure 16.
Peak floor shear force under different damper configurations in: (a) a coupled stiff building and (b) a coupled flexible building under semi-active control of the MR damper.
Figure 17.
Peak floor displacement response of: (a) a coupled stiff building and (b) a coupled flexible building when they are connected with different types of dampers arranged in Configuration 1.
Figure 17.
Peak floor displacement response of: (a) a coupled stiff building and (b) a coupled flexible building when they are connected with different types of dampers arranged in Configuration 1.
Figure 18.
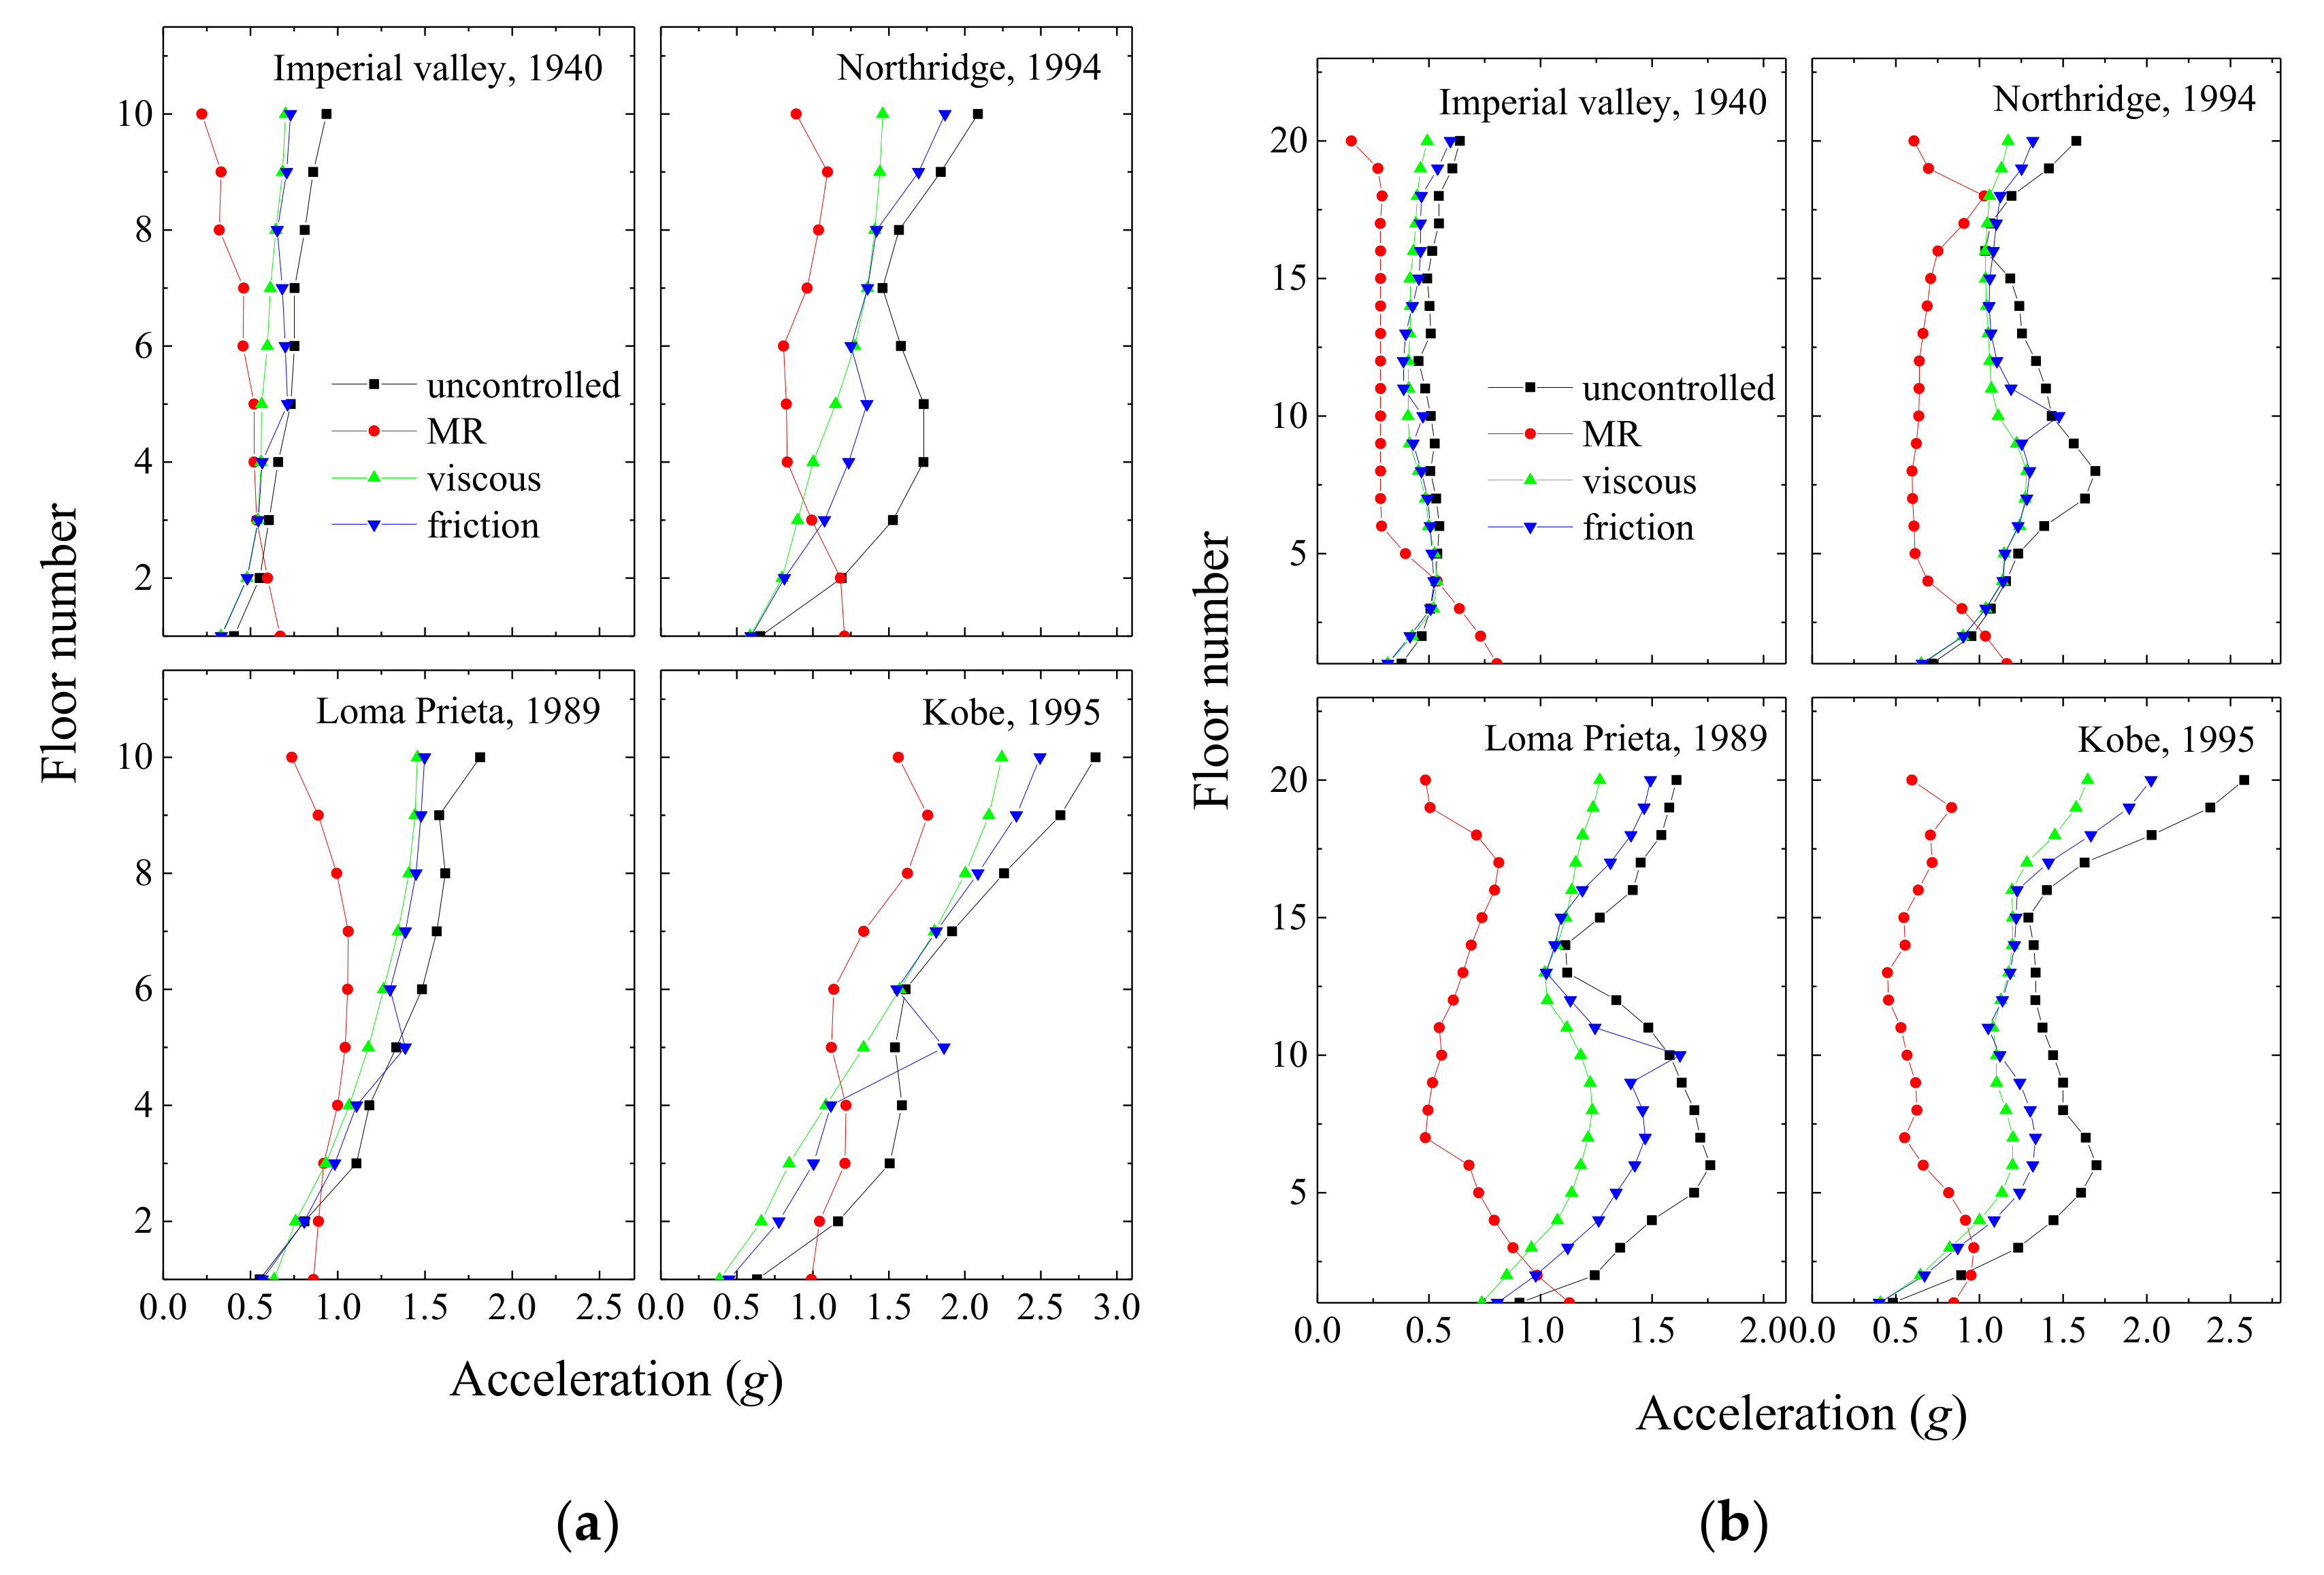
Peak floor acceleration response of: (a) a coupled stiff building and (b) a coupled flexible building when they are connected with different types of dampers arranged in Configuration 1.
Figure 18.
Peak floor acceleration response of: (a) a coupled stiff building and (b) a coupled flexible building when they are connected with different types of dampers arranged in Configuration 1.
Figure 19.
Peak normalized storey shear response of: (a) a coupled stiff building and (b) a coupled flexible building when they are connected with different types of dampers arranged in Configuration 1.
Figure 19.
Peak normalized storey shear response of: (a) a coupled stiff building and (b) a coupled flexible building when they are connected with different types of dampers arranged in Configuration 1.
Figure 20.
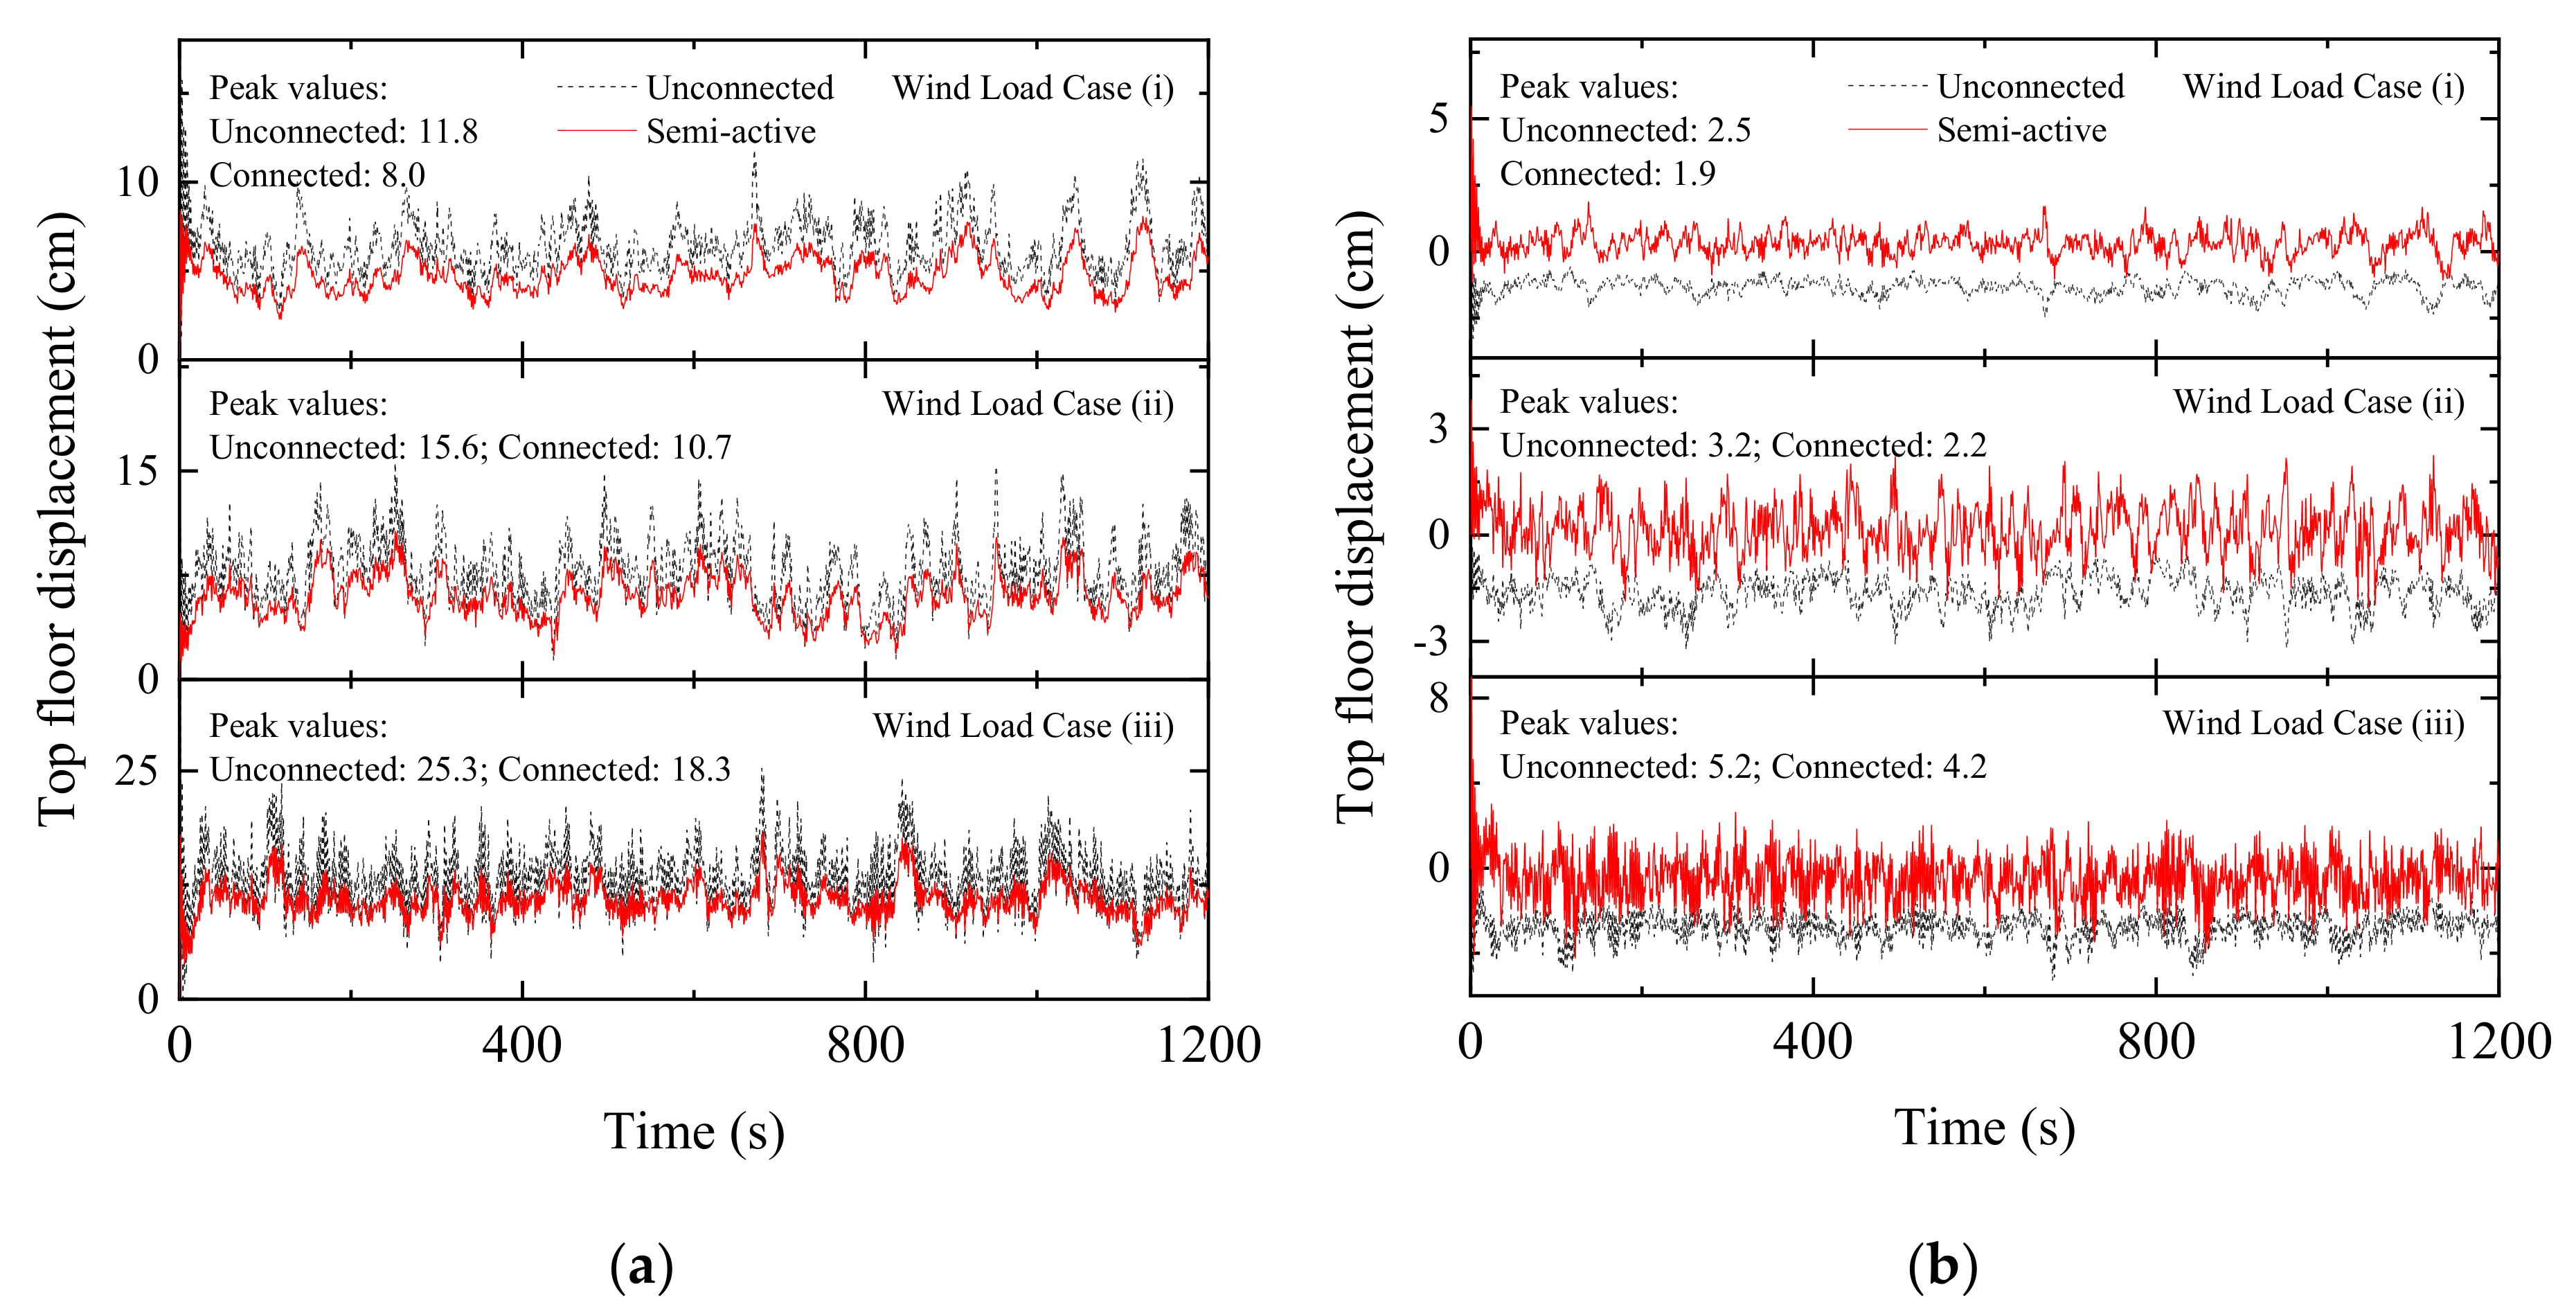
Time history of top floor displacement under wind excitation in: (a) a building on the upwind side and (b) a building on the downwind side when stiff adjacent buildings are connected using semi-active MR dampers following damper Configuration 1.
Figure 20.
Time history of top floor displacement under wind excitation in: (a) a building on the upwind side and (b) a building on the downwind side when stiff adjacent buildings are connected using semi-active MR dampers following damper Configuration 1.
Figure 21.
Time history of top floor acceleration under wind excitation in: (a) a building on the upwind side and (b) a building on the downwind side when stiff adjacent buildings are connected using semi-active MR dampers following damper Configuration 1.
Figure 21.
Time history of top floor acceleration under wind excitation in: (a) a building on the upwind side and (b) a building on the downwind side when stiff adjacent buildings are connected using semi-active MR dampers following damper Configuration 1.
Figure 22.
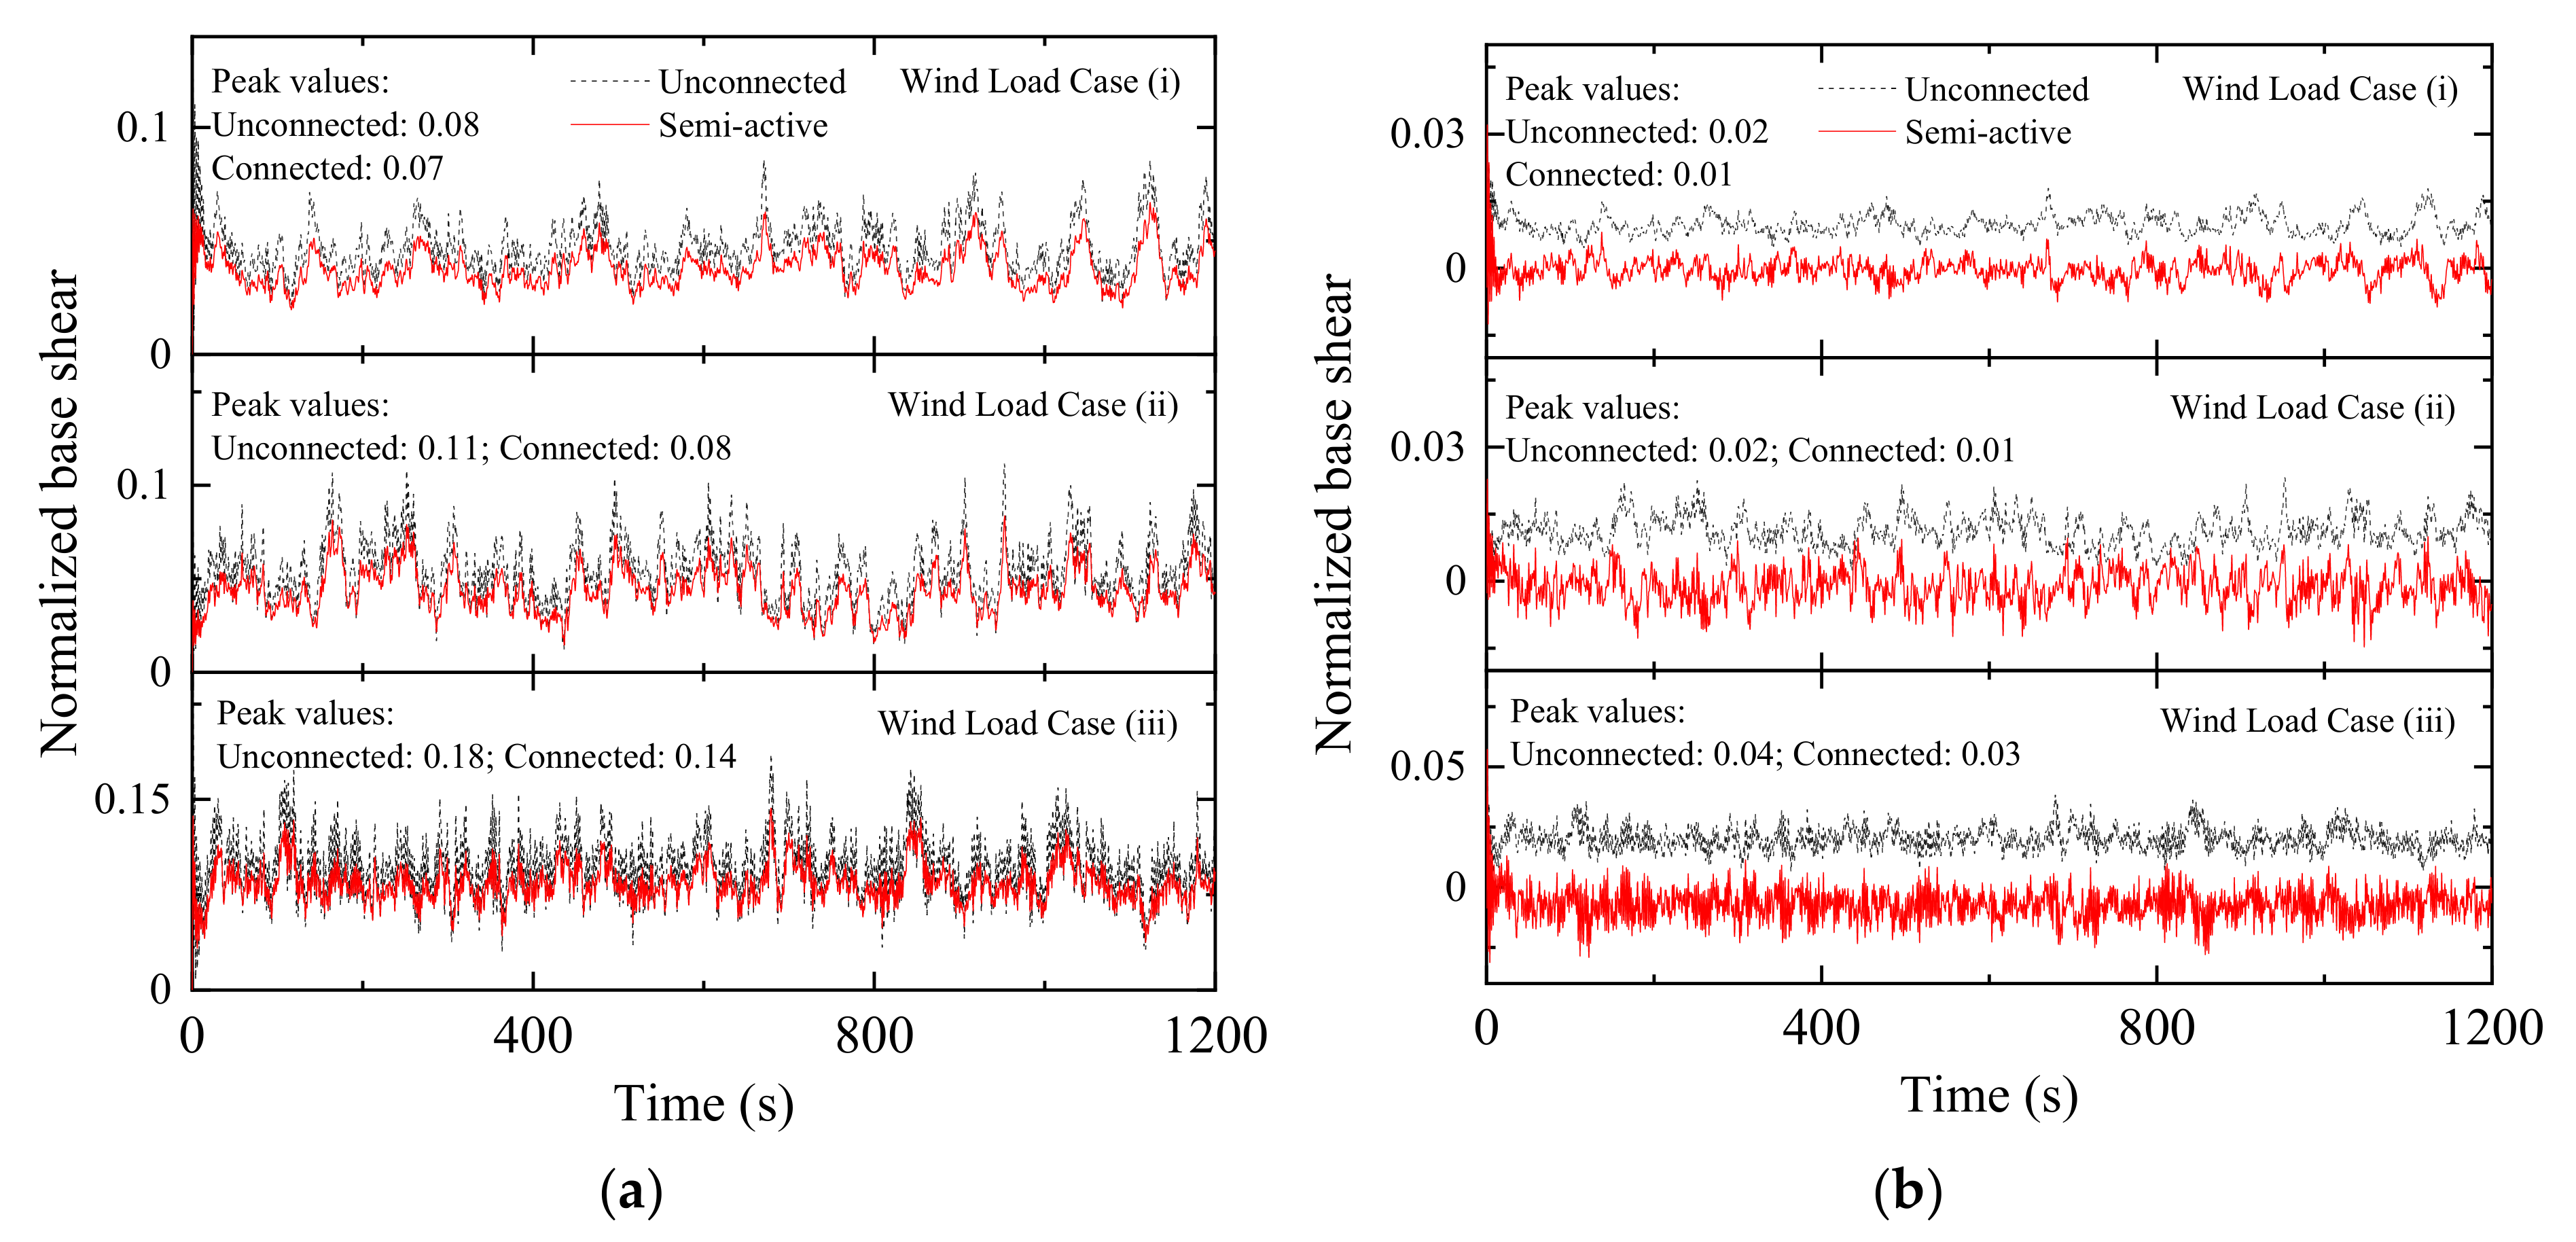
Time history of normalized base shear under wind excitation in: (a) a building on the upwind side and (b) a building on the downwind side when stiff adjacent buildings are connected using semi-active MR dampers following damper Configuration 1.
Figure 22.
Time history of normalized base shear under wind excitation in: (a) a building on the upwind side and (b) a building on the downwind side when stiff adjacent buildings are connected using semi-active MR dampers following damper Configuration 1.
Figure 23.
Time history of top floor displacement under wind excitation in: (a) a building on the upwind side and (b) a building on the downwind side when flexible adjacent buildings are connected using semi-active MR dampers following damper Configuration 1.
Figure 23.
Time history of top floor displacement under wind excitation in: (a) a building on the upwind side and (b) a building on the downwind side when flexible adjacent buildings are connected using semi-active MR dampers following damper Configuration 1.
Figure 24.
Time history of top floor acceleration under wind excitation in: (a) a building on the upwind side and (b) a building on the downwind side when flexible adjacent buildings are connected using semi-active MR dampers following damper Configuration 1.
Figure 24.
Time history of top floor acceleration under wind excitation in: (a) a building on the upwind side and (b) a building on the downwind side when flexible adjacent buildings are connected using semi-active MR dampers following damper Configuration 1.
Figure 25.
Time history of normalized base shear under wind excitation in: (a) a building on the upwind side and (b) a building on the downwind side when flexible adjacent buildings are connected using semi-active MR dampers following damper Configuration 1.
Figure 25.
Time history of normalized base shear under wind excitation in: (a) a building on the upwind side and (b) a building on the downwind side when flexible adjacent buildings are connected using semi-active MR dampers following damper Configuration 1.
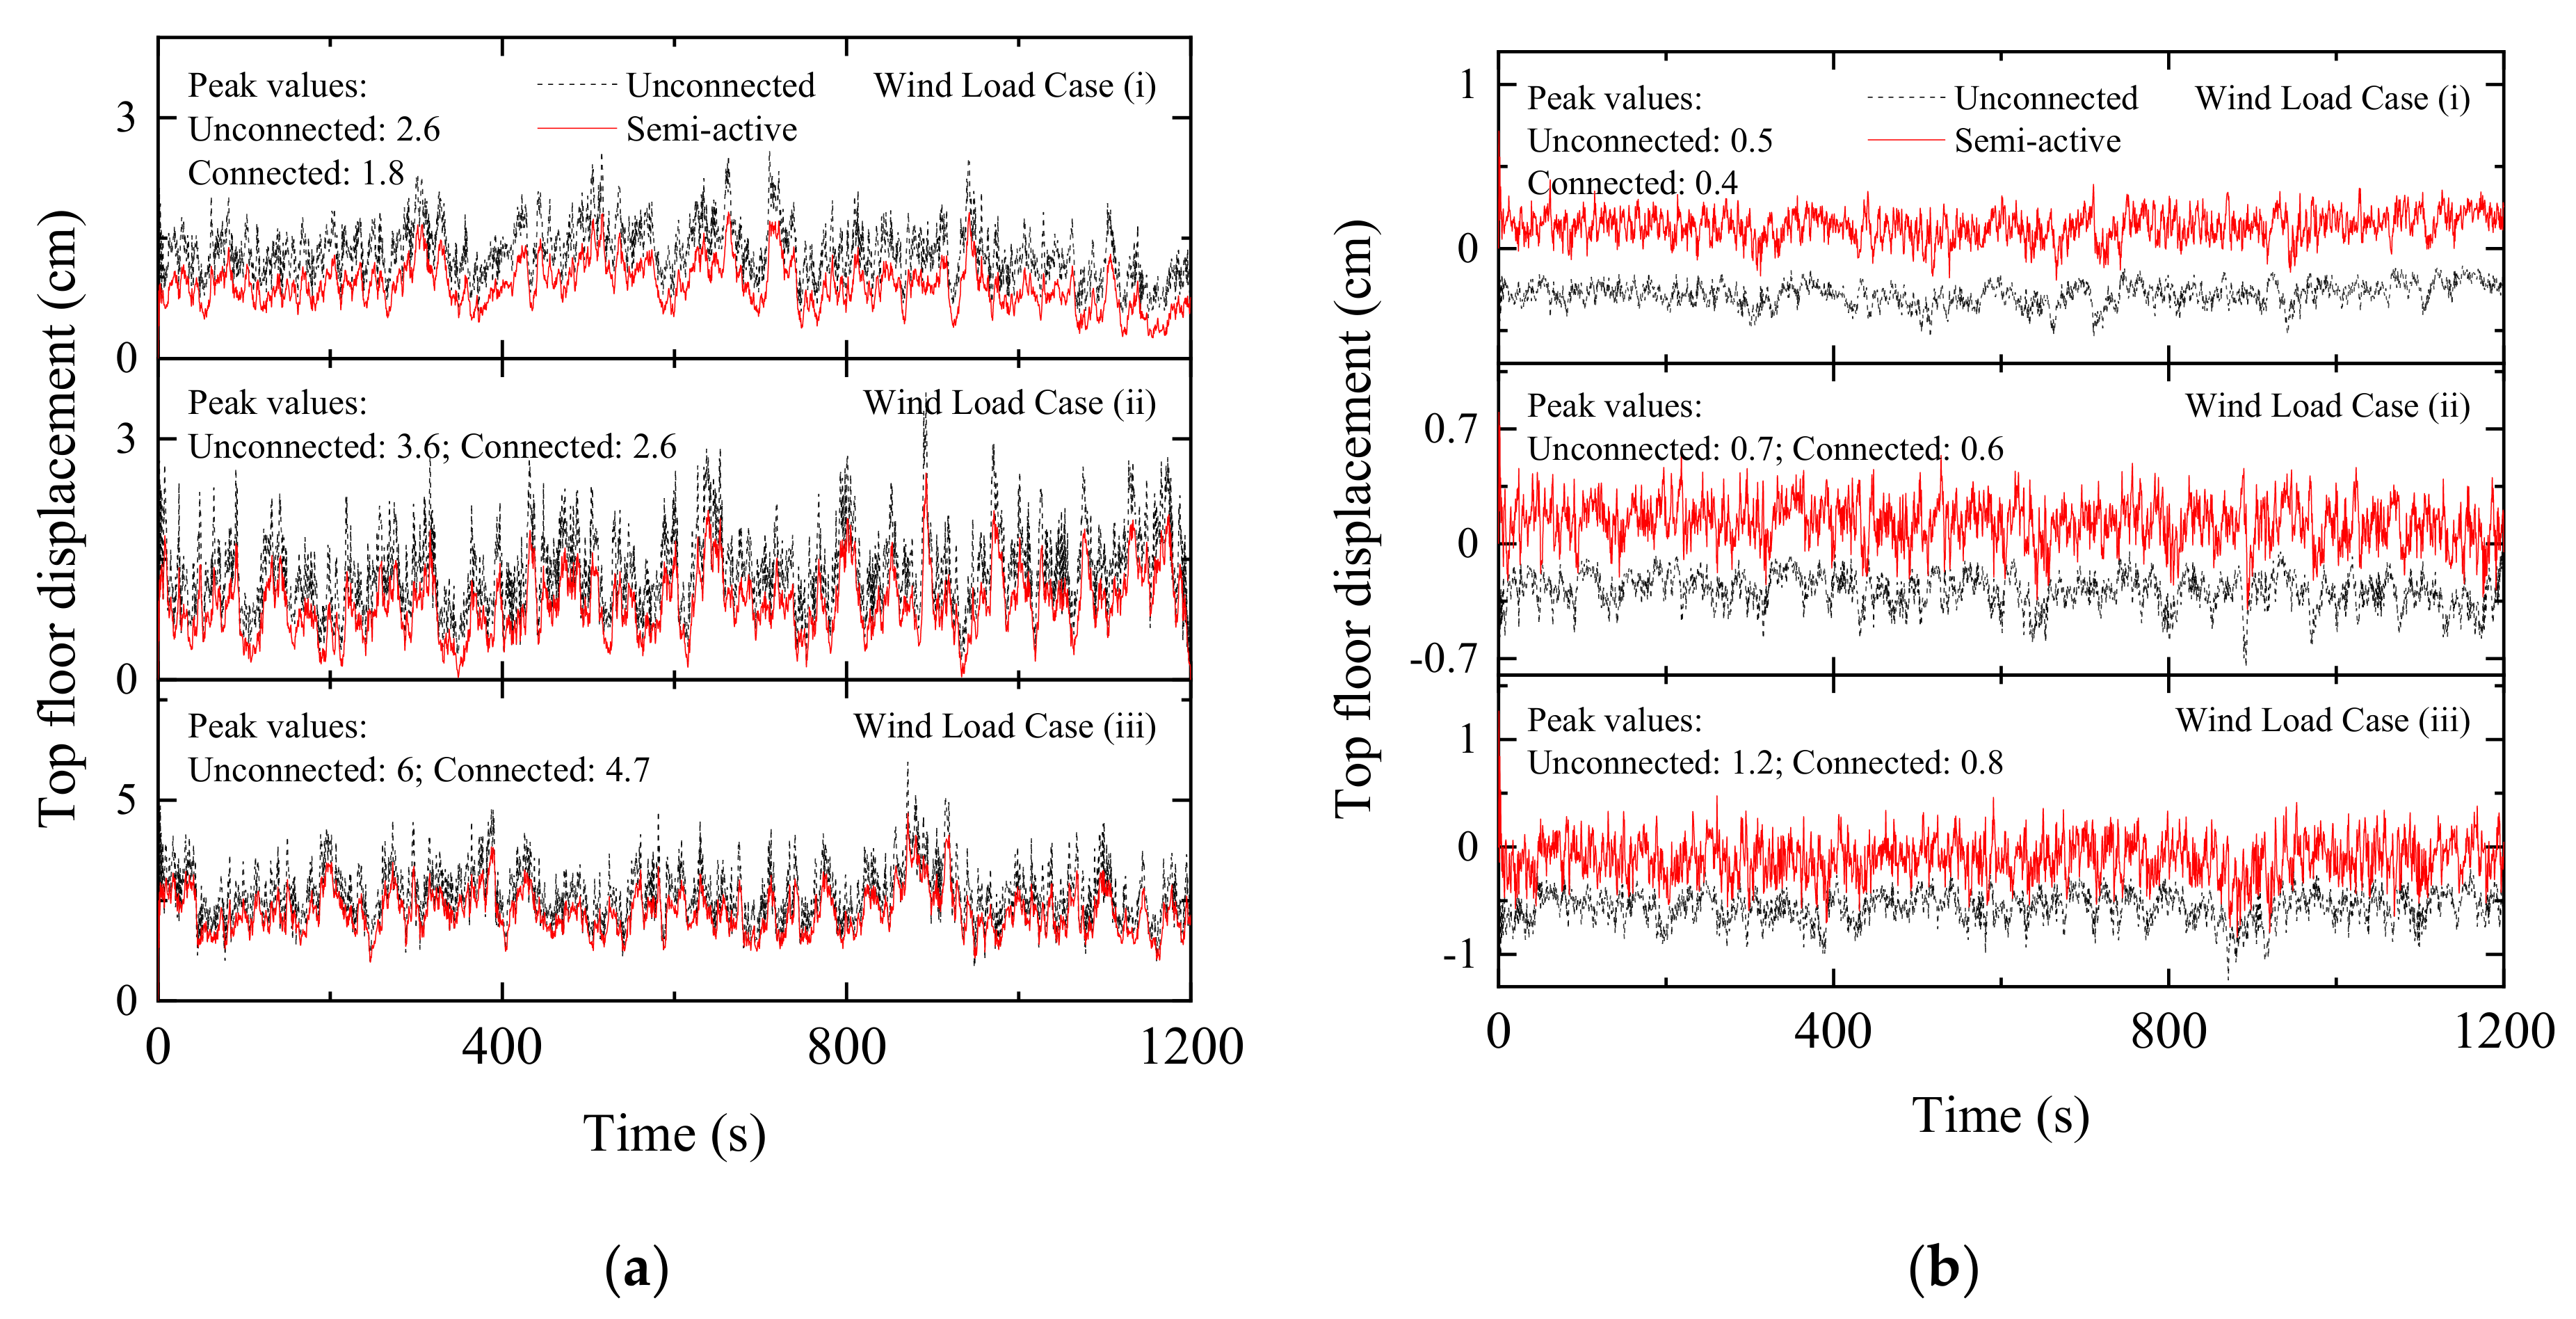
Figure 26.
Time history of top floor displacement under wind excitation in: (a) a coupled stiff building and (b) a coupled flexible building when semi-active MR dampers are used as coupling devices in Configuration 1.
Figure 26.
Time history of top floor displacement under wind excitation in: (a) a coupled stiff building and (b) a coupled flexible building when semi-active MR dampers are used as coupling devices in Configuration 1.
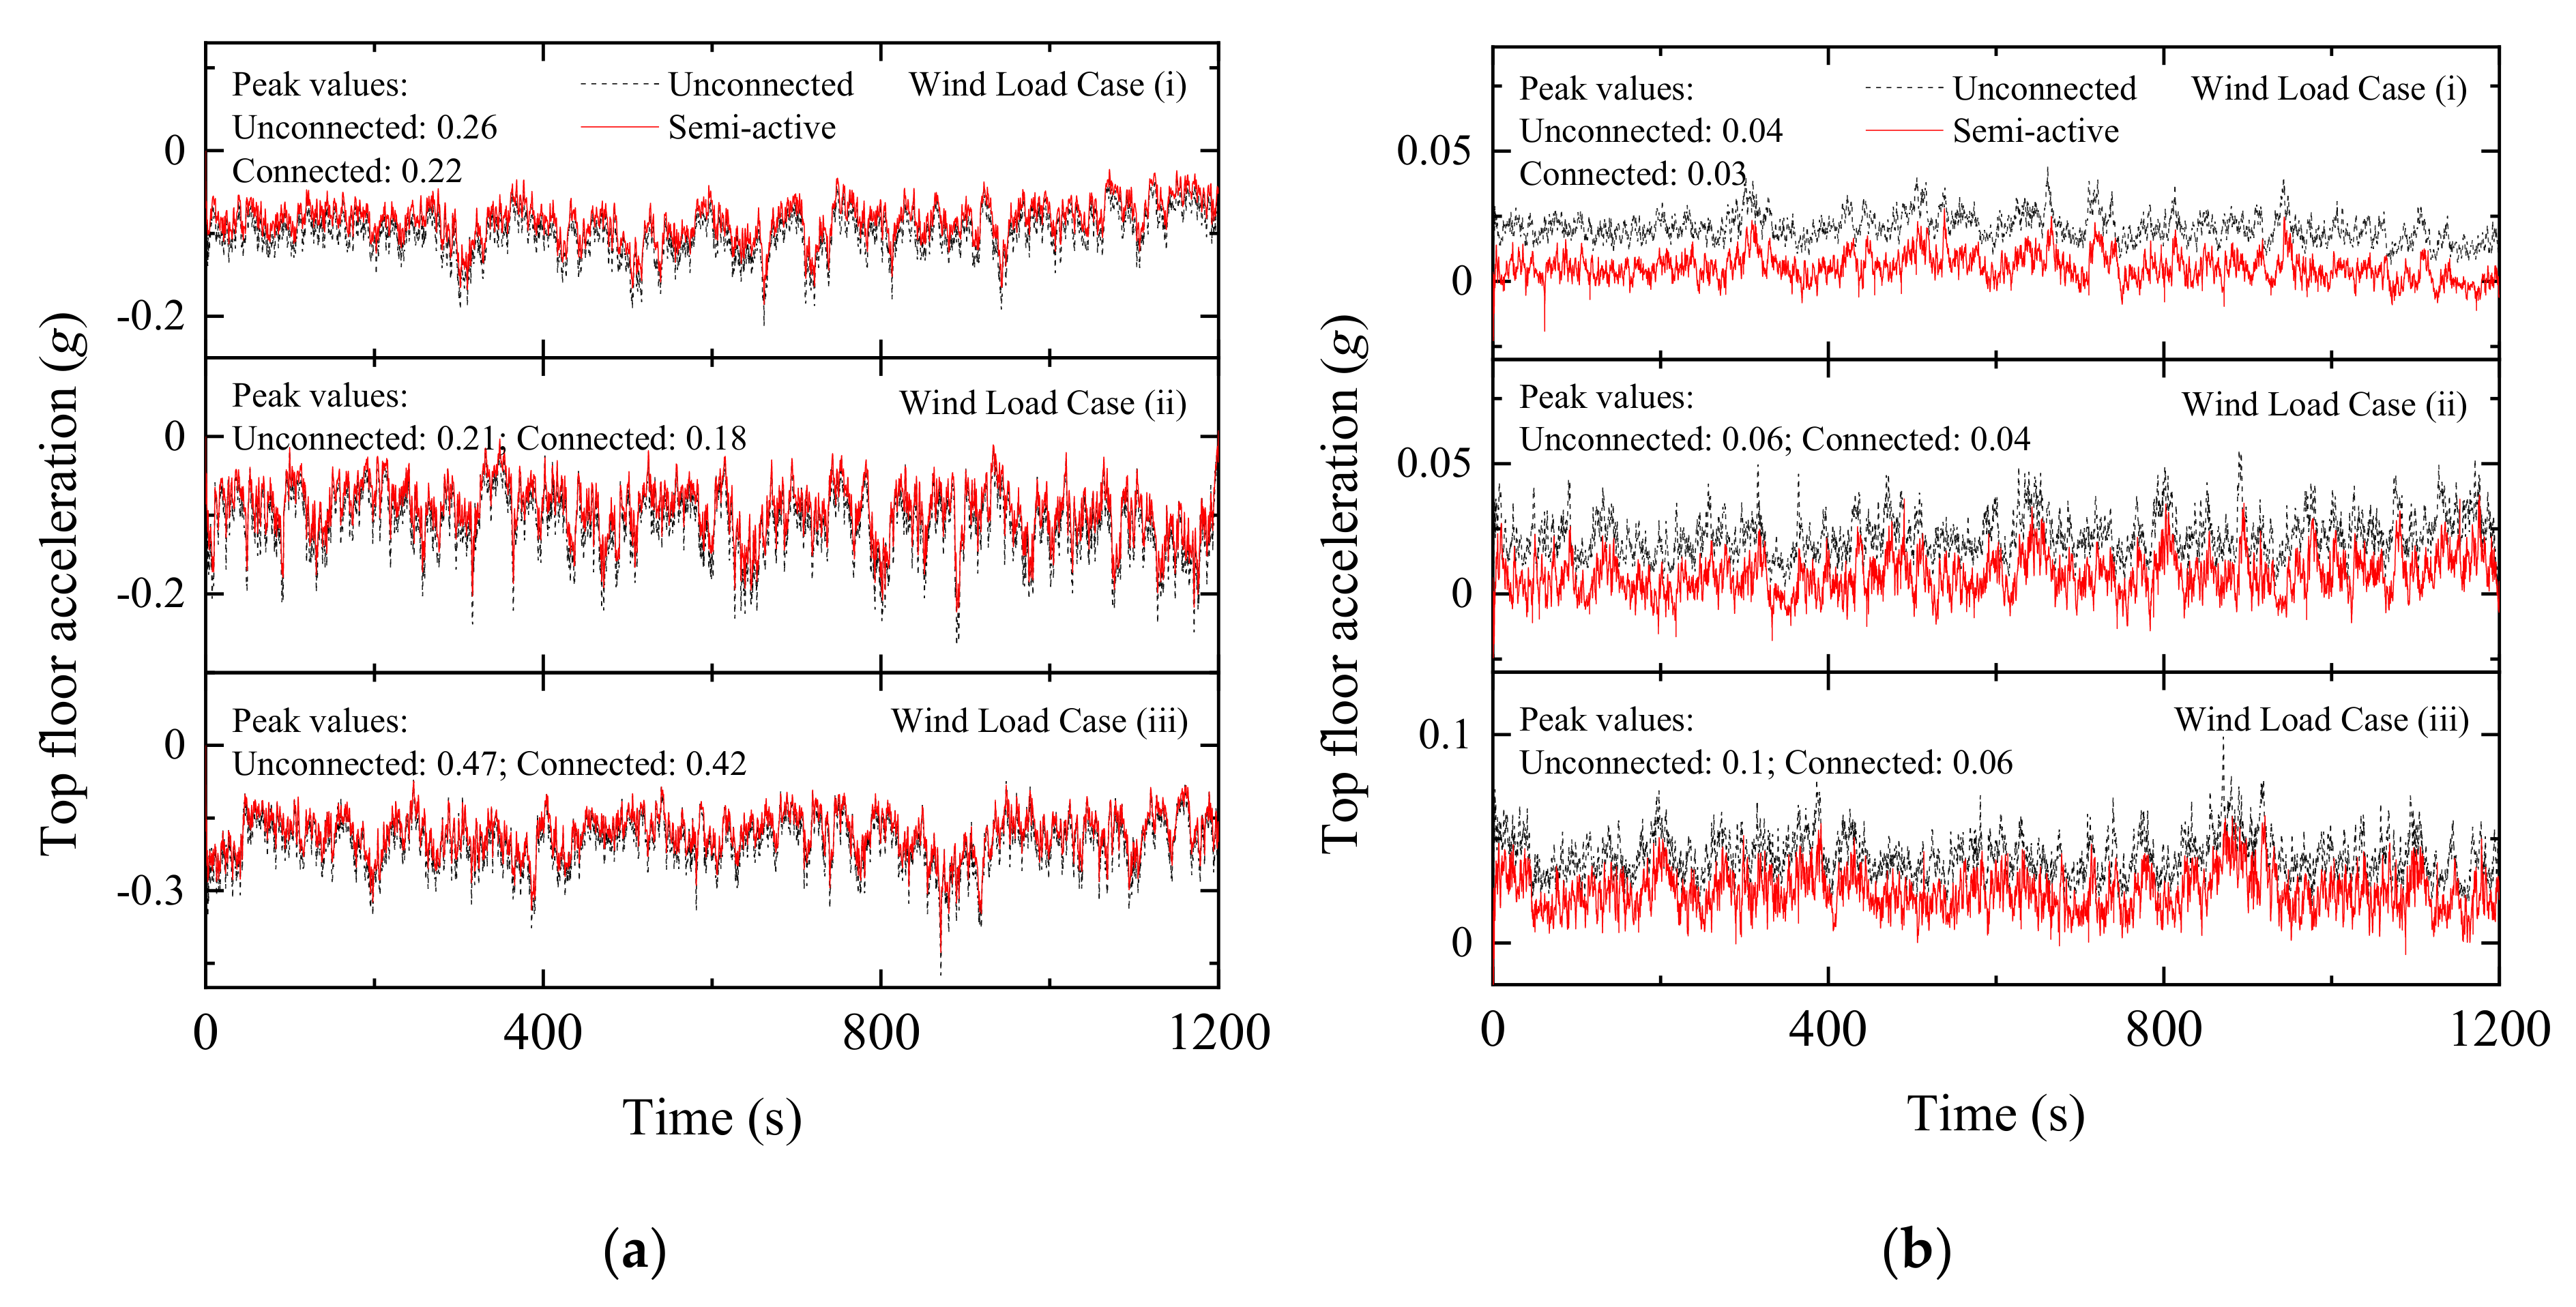
Figure 27.
Time history of top floor acceleration under wind excitation in: (a) a coupled stiff building and (b) a coupled flexible building when semi-active MR dampers are used as coupling devices in Configuration 1.
Figure 27.
Time history of top floor acceleration under wind excitation in: (a) a coupled stiff building and (b) a coupled flexible building when semi-active MR dampers are used as coupling devices in Configuration 1.
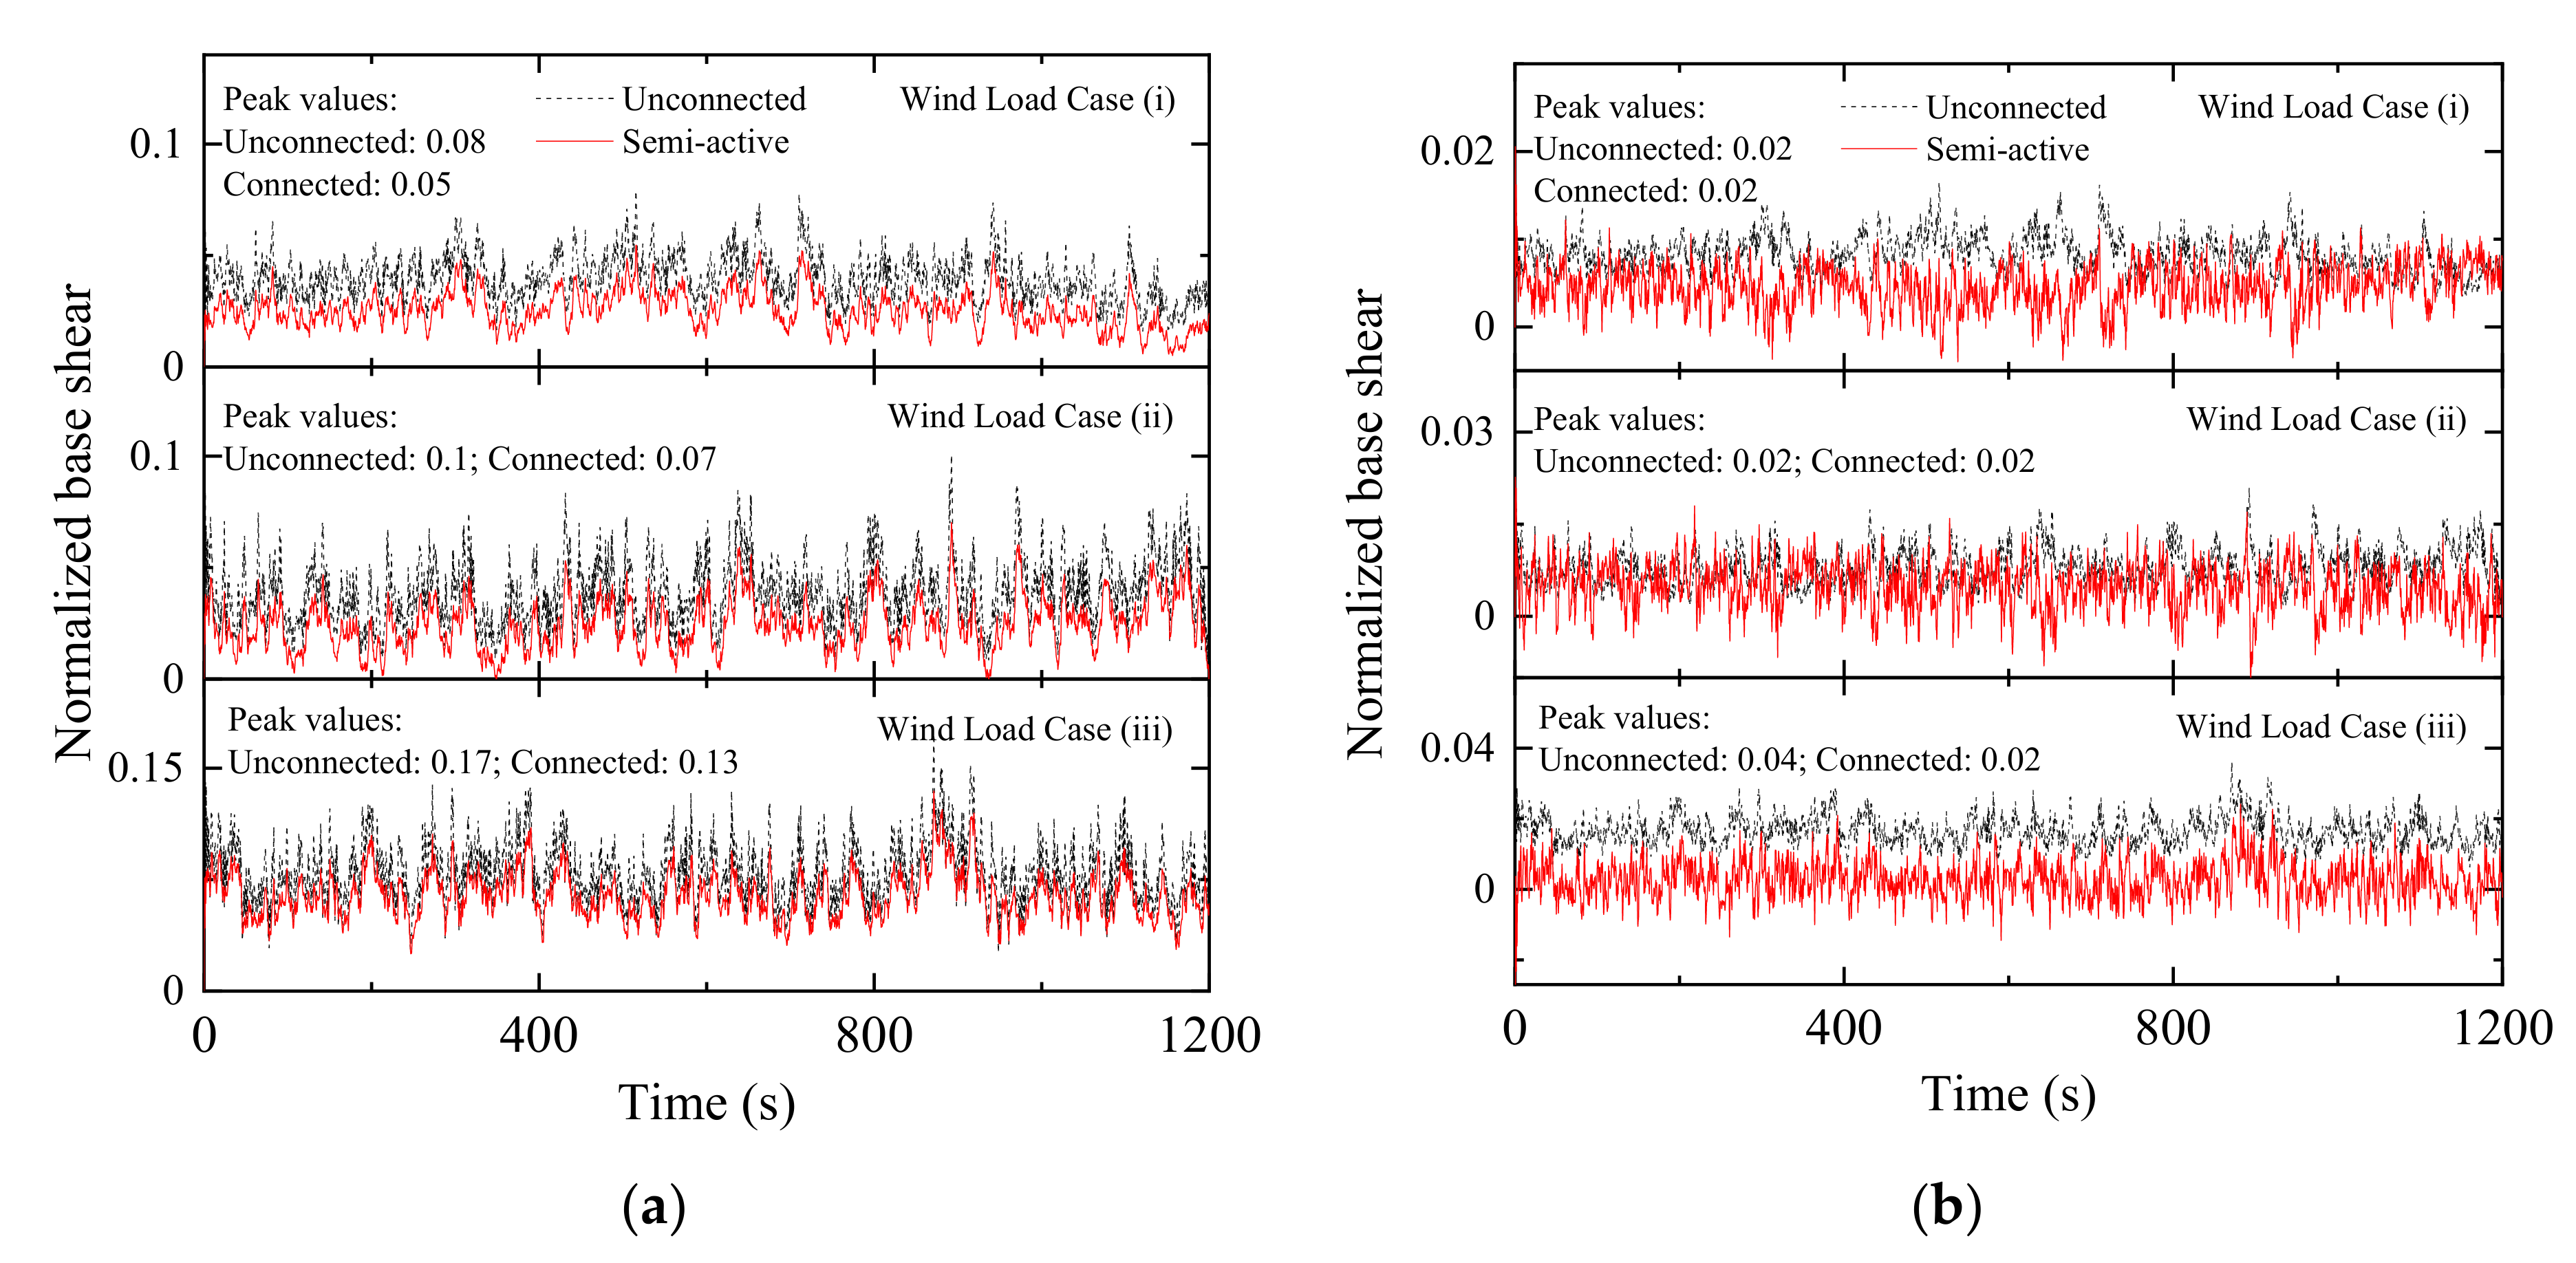
Figure 28.
Time history of normalized base shear under wind excitation in: (a) a coupled stiff building and (b) a coupled flexible building when semi-active MR dampers are used as coupling devices in Configuration 1.
Figure 28.
Time history of normalized base shear under wind excitation in: (a) a coupled stiff building and (b) a coupled flexible building when semi-active MR dampers are used as coupling devices in Configuration 1.
Figure 29.
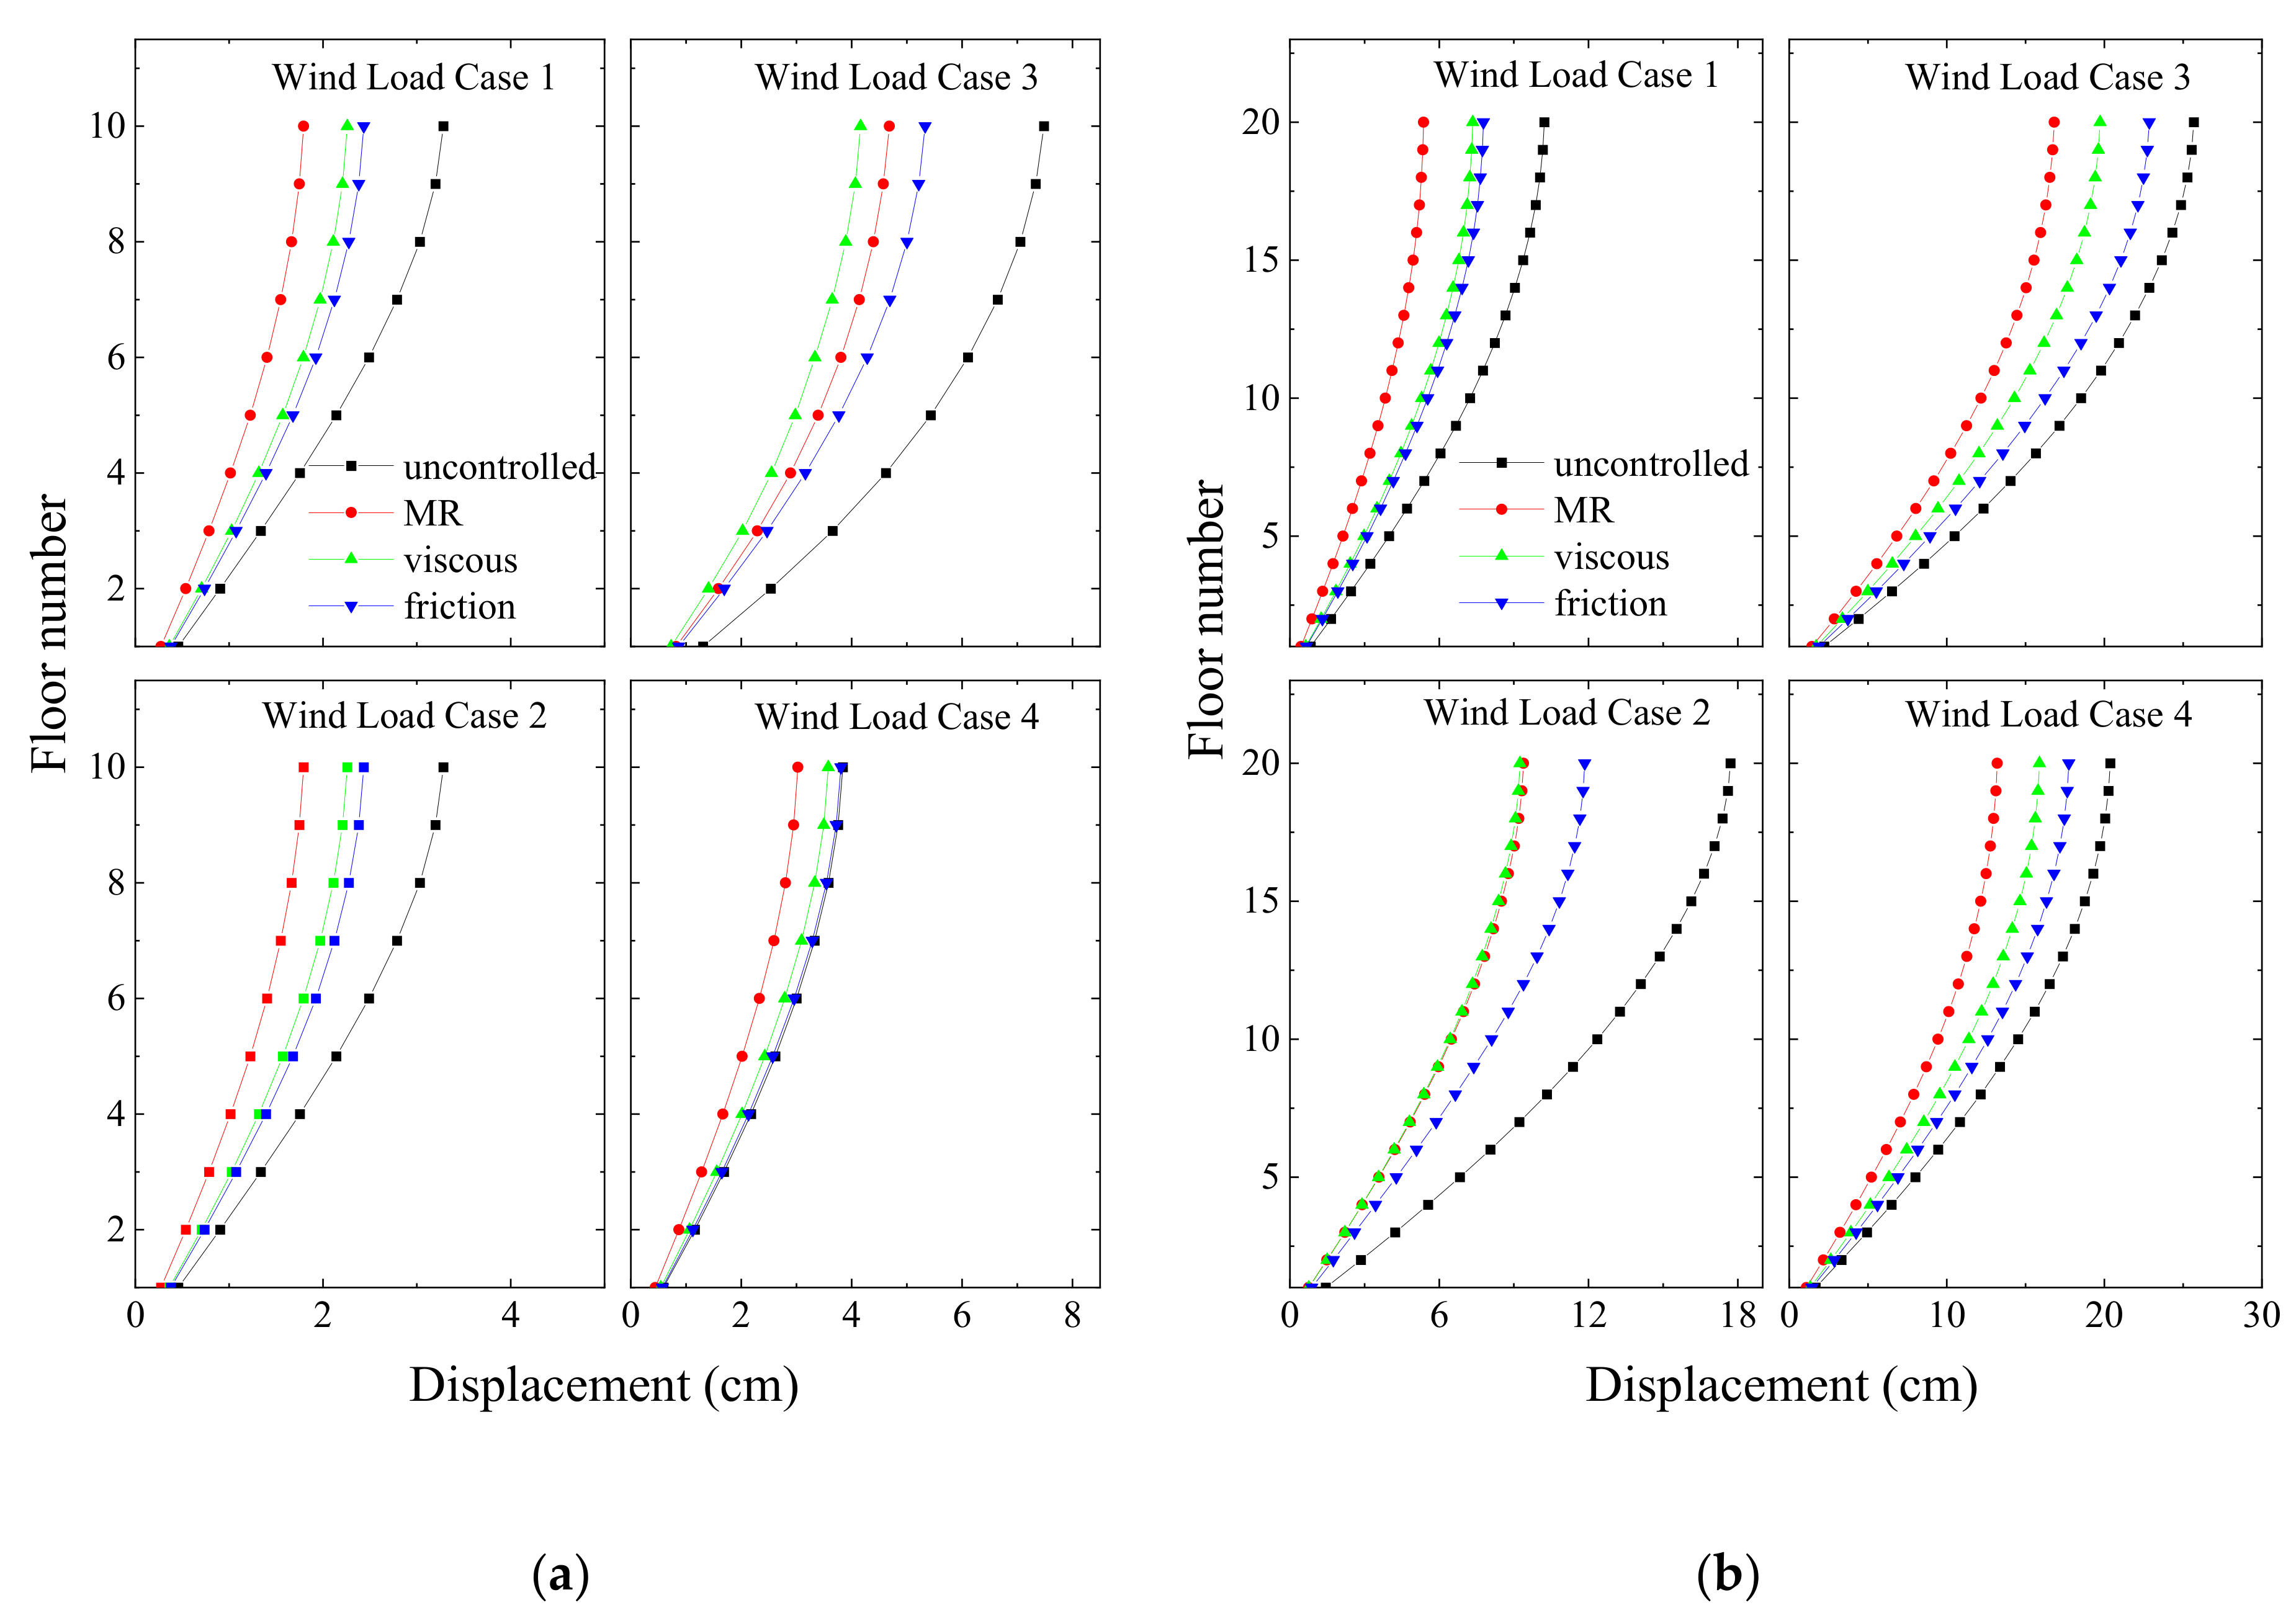
Peak floor displacement in wind excitation of: (a) a coupled stiff building and (b) a coupled flexible building in different damper configurations under semi-active control of the MR damper.
Figure 29.
Peak floor displacement in wind excitation of: (a) a coupled stiff building and (b) a coupled flexible building in different damper configurations under semi-active control of the MR damper.
Figure 30.
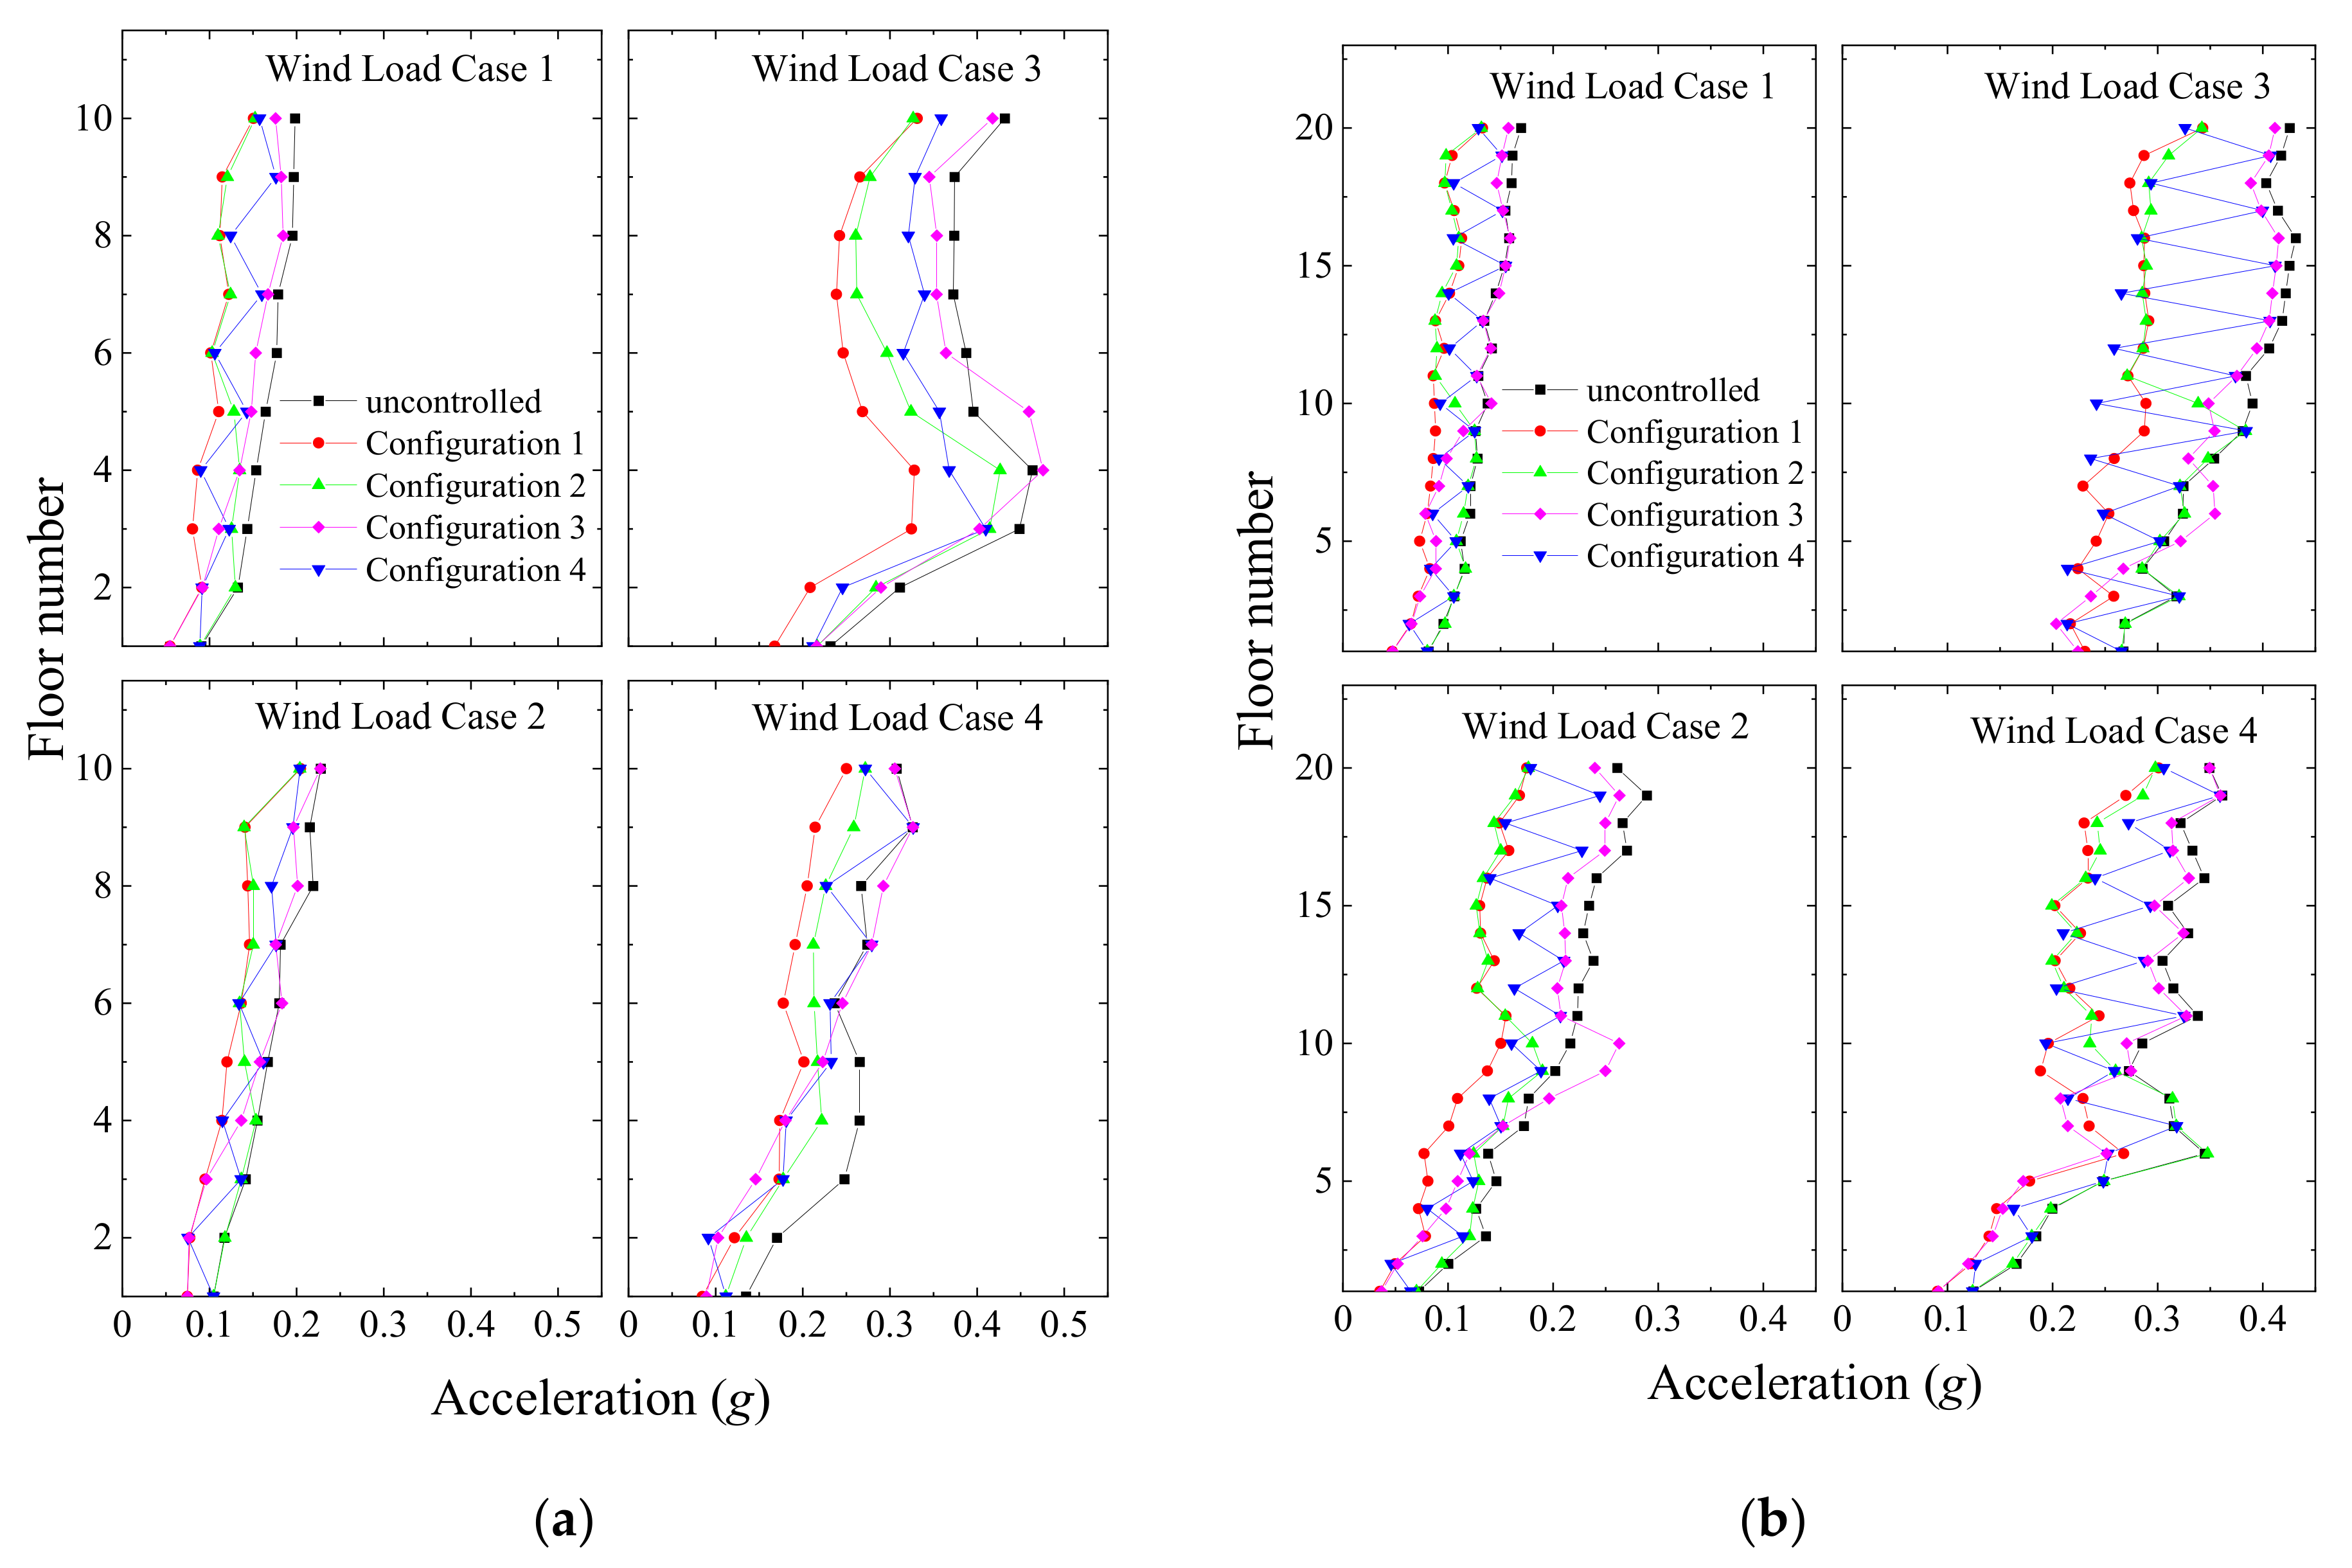
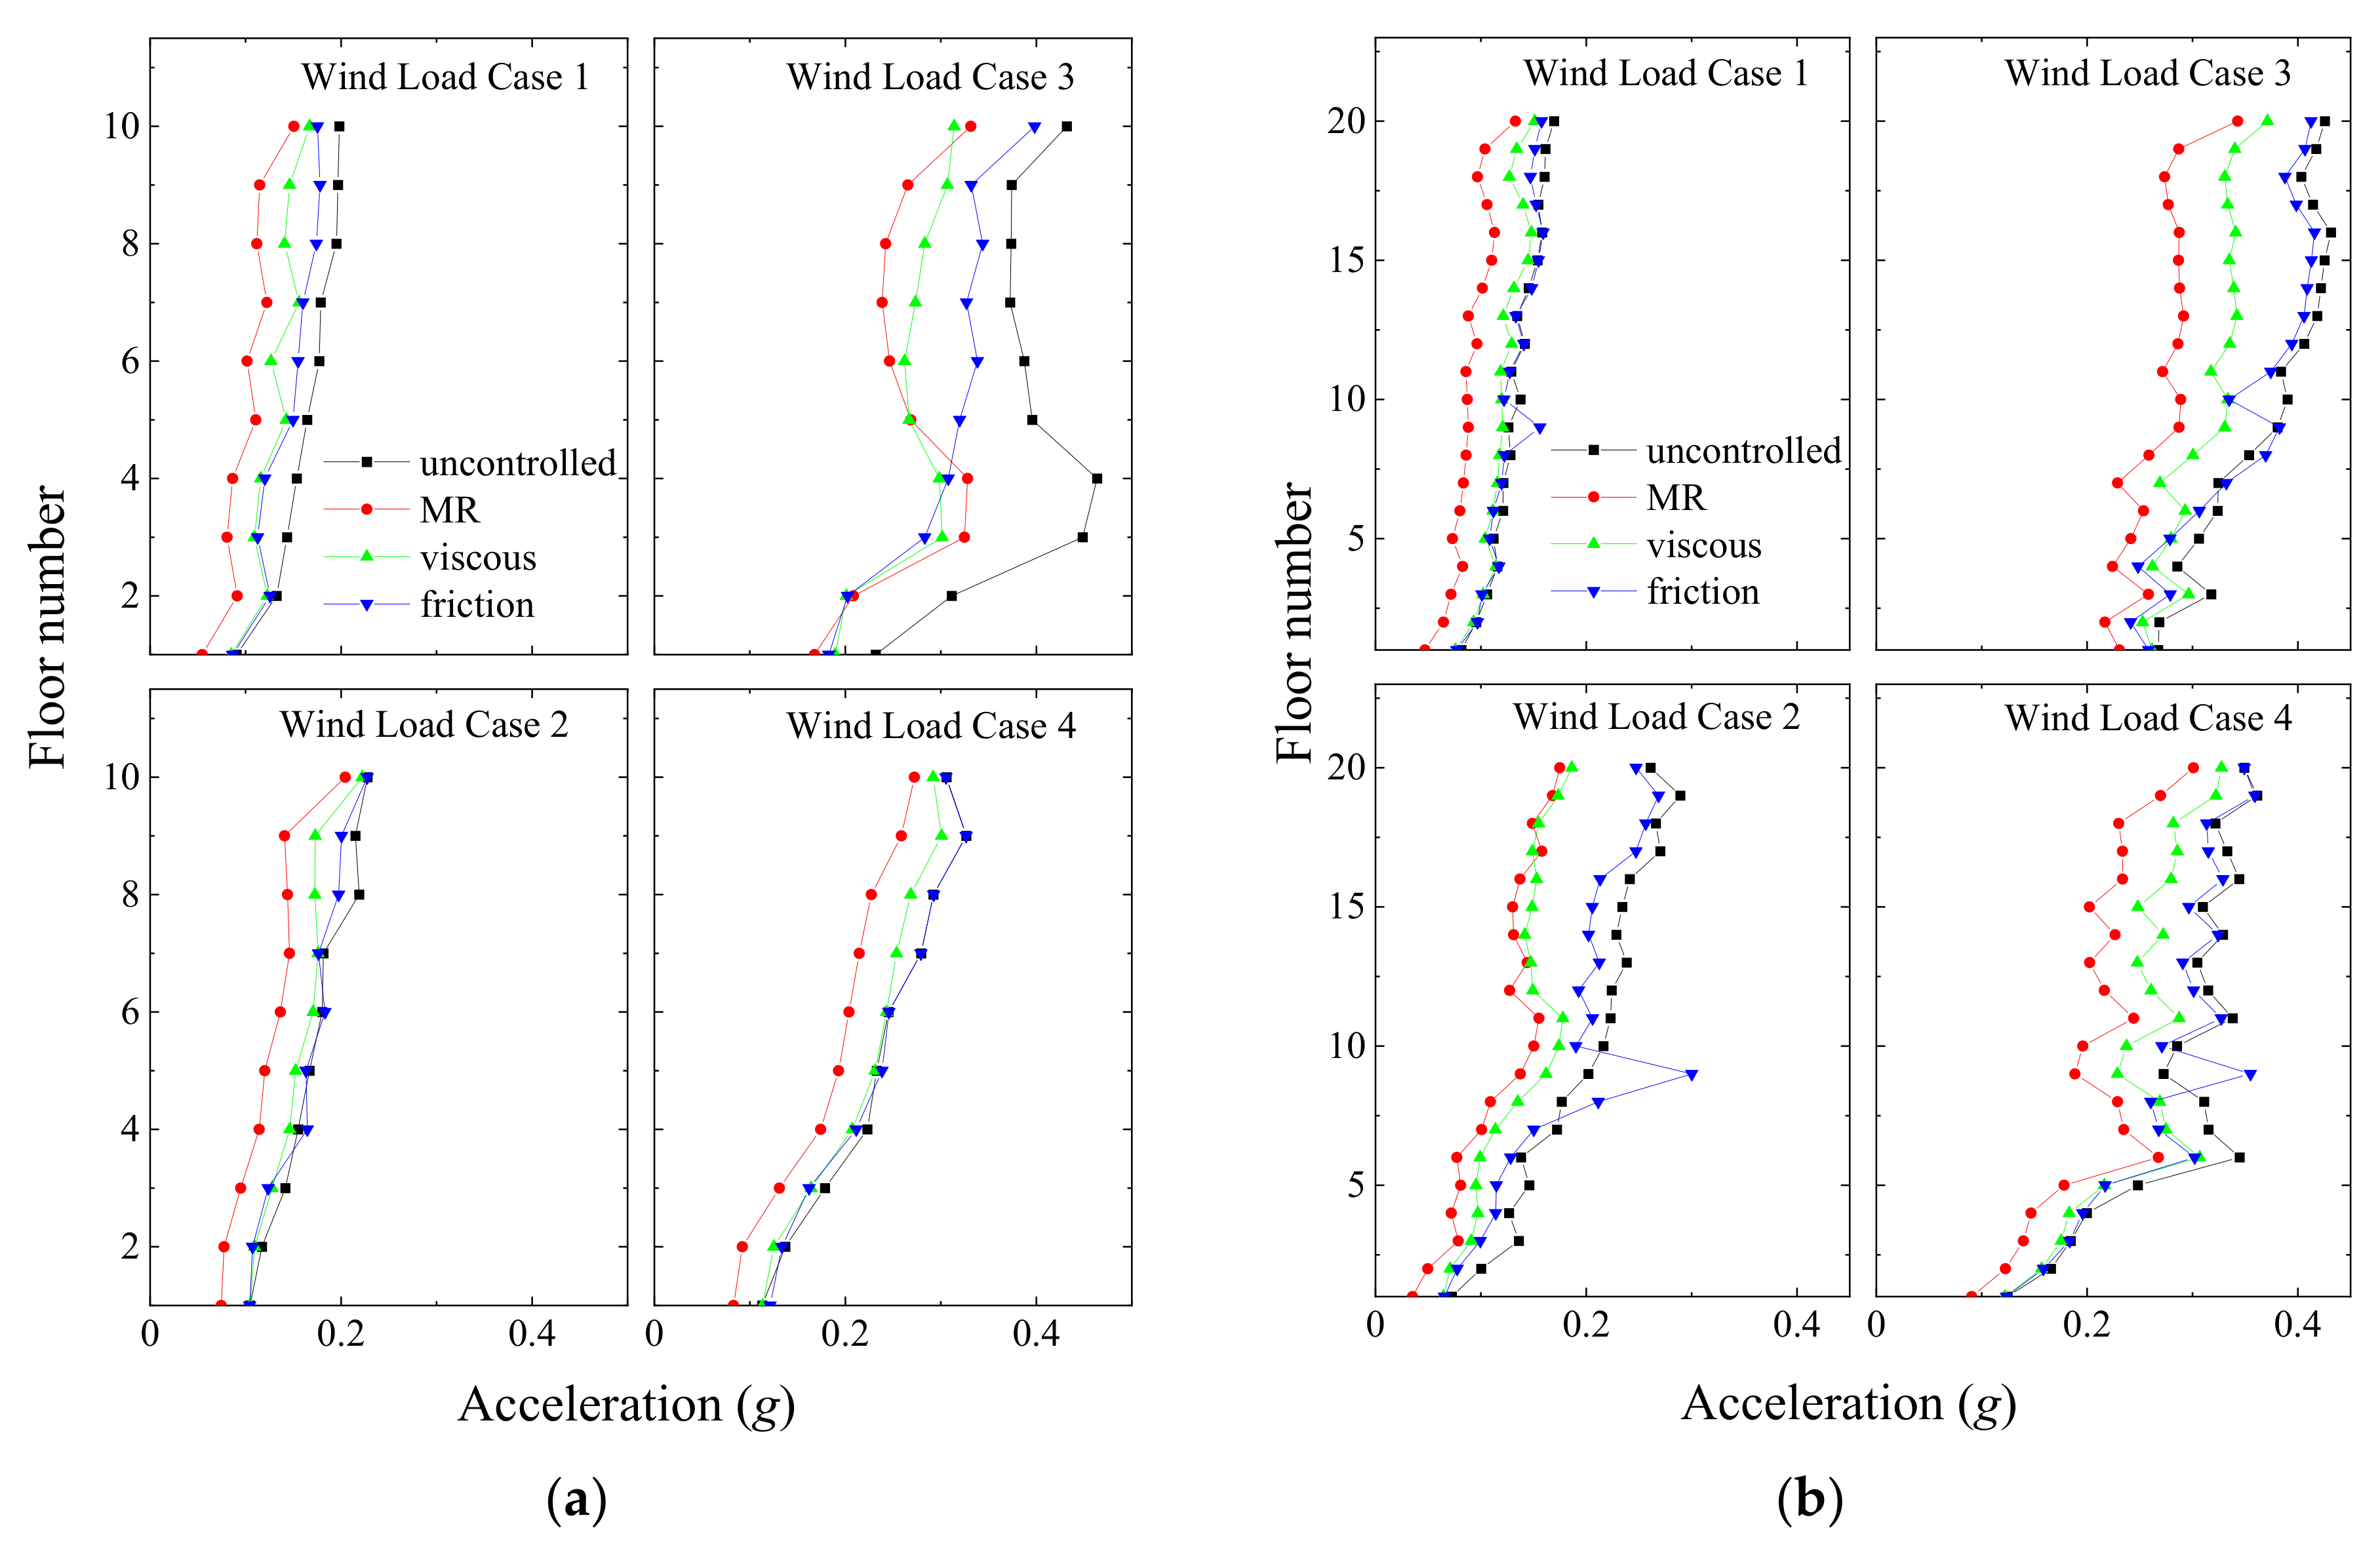
Peak floor acceleration under wind excitation in different damper configurations in: (a) a coupled stiff building and (b) a coupled flexible building under semi-active control of the MR damper.
Figure 30.
Peak floor acceleration under wind excitation in different damper configurations in: (a) a coupled stiff building and (b) a coupled flexible building under semi-active control of the MR damper.
Figure 31.
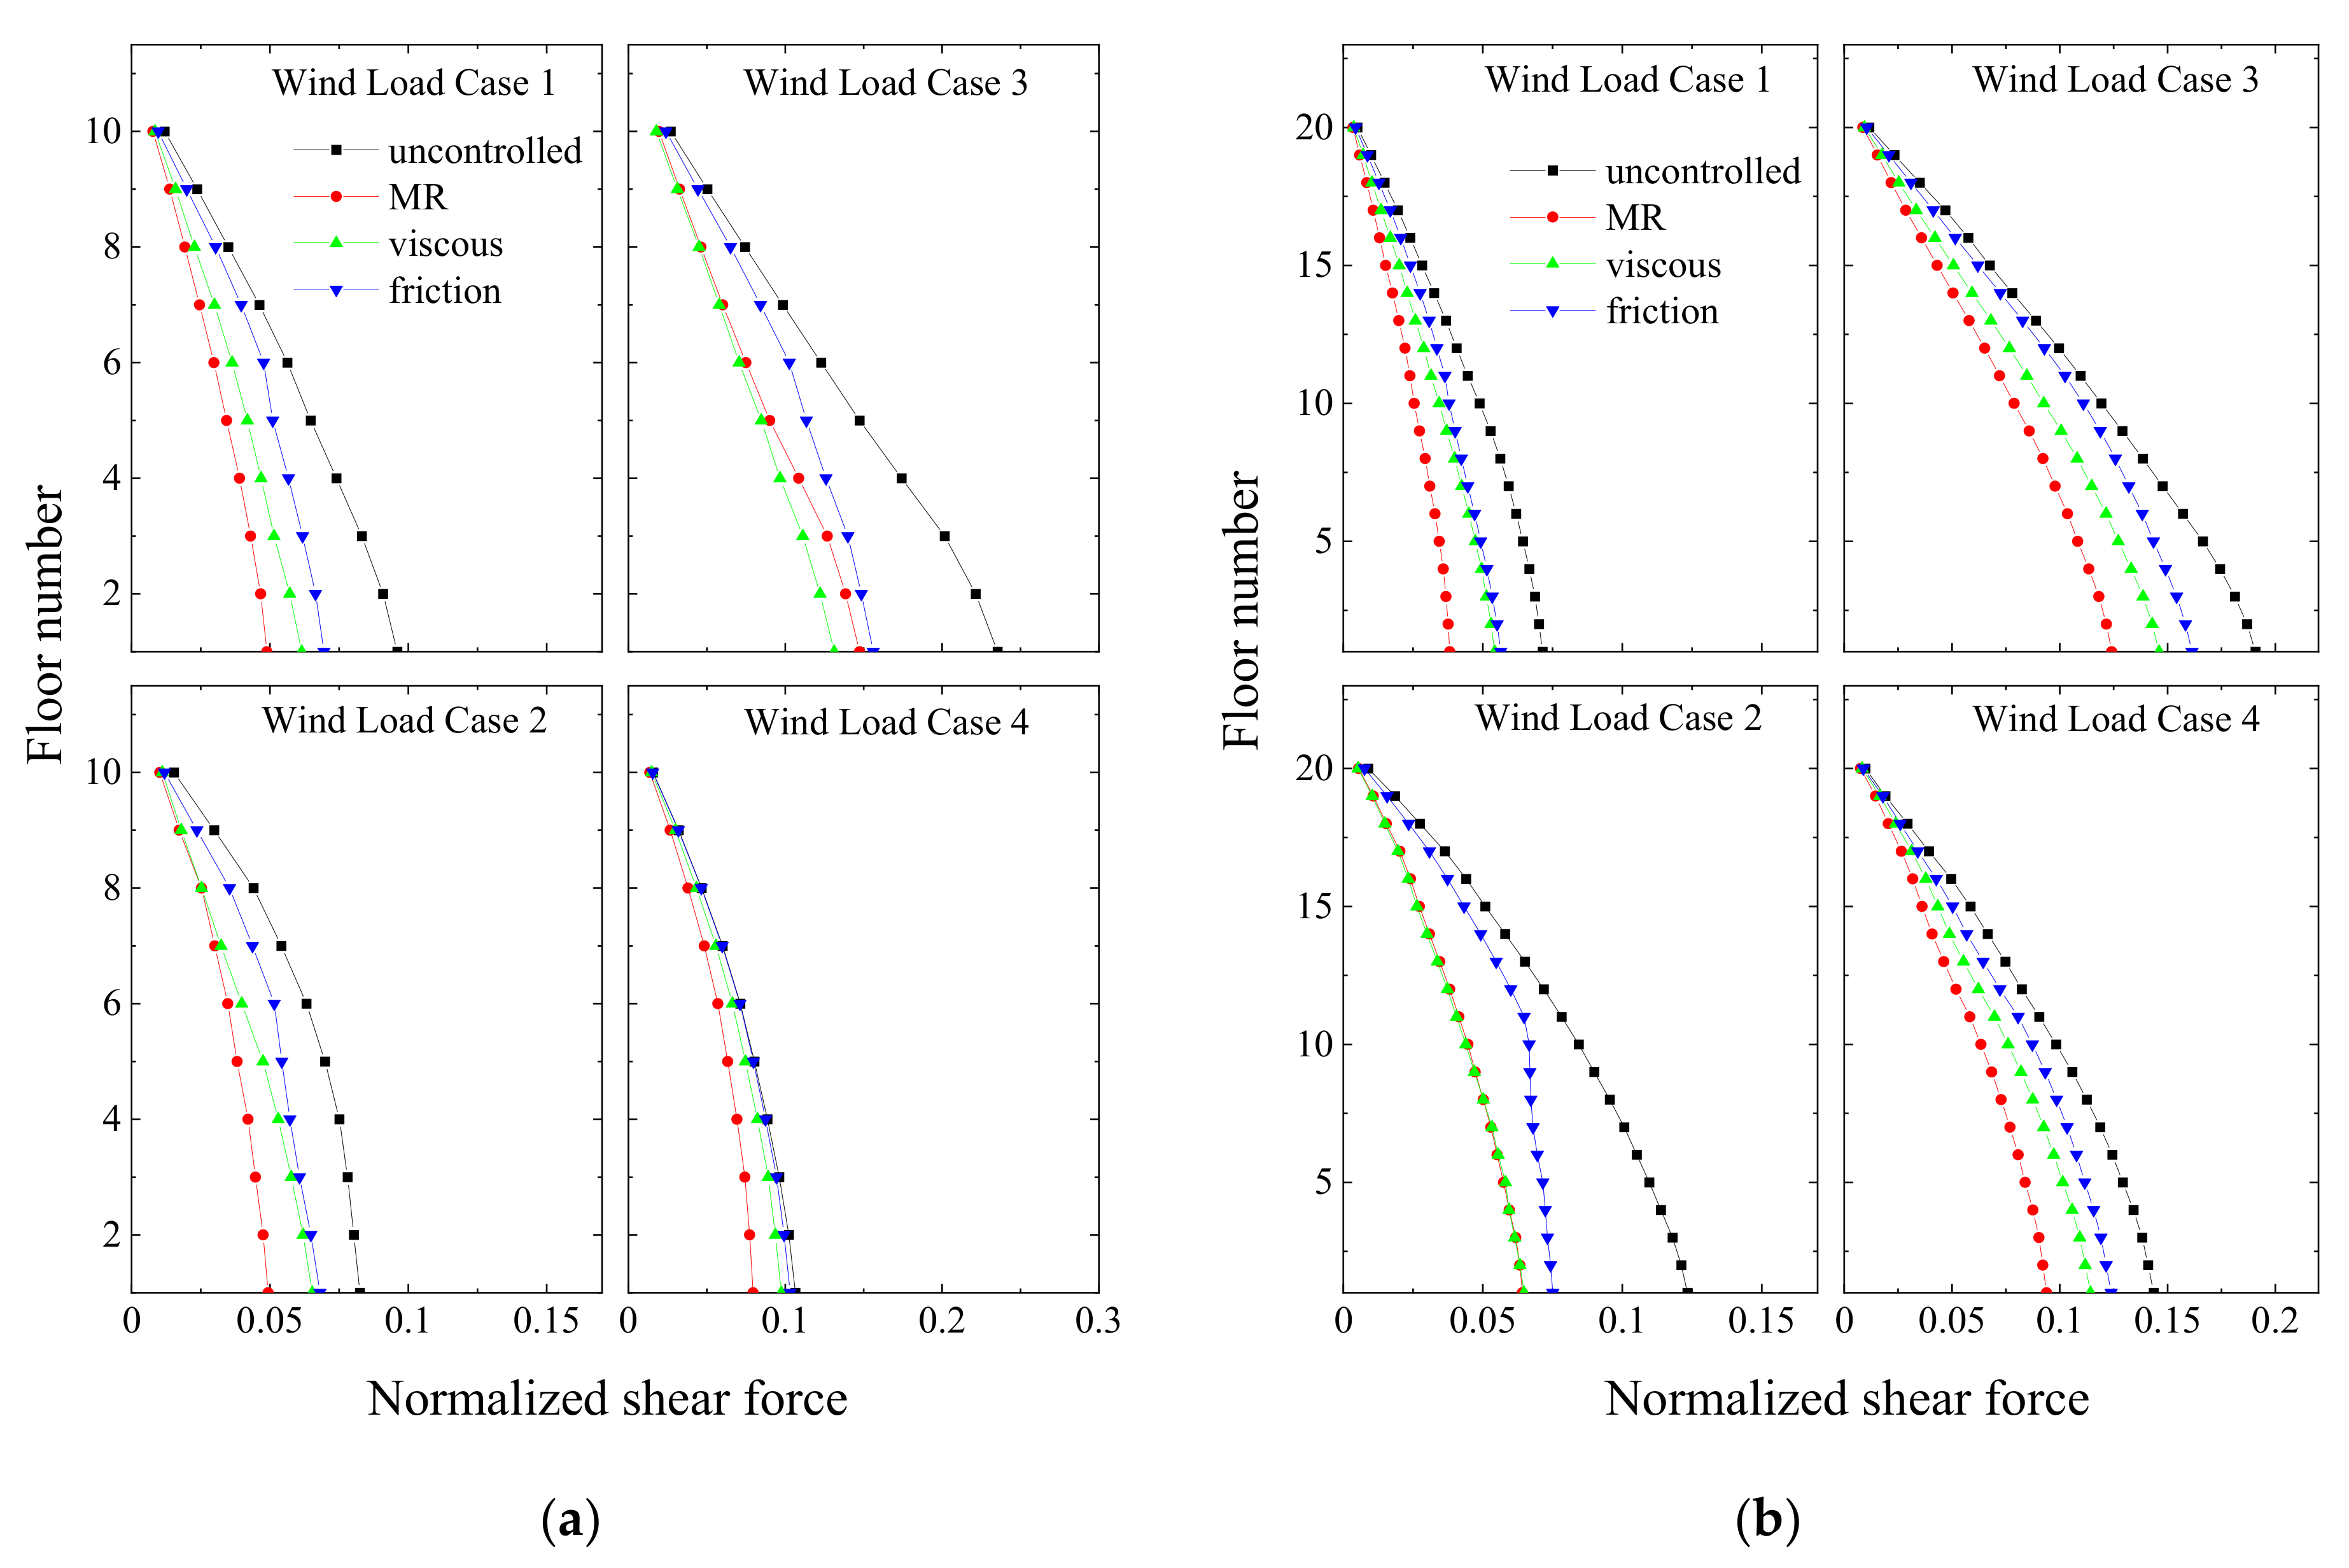
Peak floor shear under wind excitation in different damper configurations in: (a) a coupled stiff building and (b) a coupled flexible building under semi-active control of MR damper.
Figure 31.
Peak floor shear under wind excitation in different damper configurations in: (a) a coupled stiff building and (b) a coupled flexible building under semi-active control of MR damper.
Figure 32.
Peak floor displacement response under wind excitation obtained from different dampers in: (a) a coupled stiff building and (b) a coupled flexible building when dampers are arranged in Configuration 1.
Figure 32.
Peak floor displacement response under wind excitation obtained from different dampers in: (a) a coupled stiff building and (b) a coupled flexible building when dampers are arranged in Configuration 1.
Figure 33.
Peak floor acceleration response under wind excitation obtained from different dampers in: (a) a coupled stiff building and (b) a coupled flexible building when dampers are arranged in Configuration 1.
Figure 33.
Peak floor acceleration response under wind excitation obtained from different dampers in: (a) a coupled stiff building and (b) a coupled flexible building when dampers are arranged in Configuration 1.
Figure 34.
Peak normalized floor shear force response under wind excitation obtained from different dampers in: (a) a coupled stiff building and (b) a coupled flexible building when dampers are arranged in Configuration 1.
Figure 34.
Peak normalized floor shear force response under wind excitation obtained from different dampers in: (a) a coupled stiff building and (b) a coupled flexible building when dampers are arranged in Configuration 1.
Table 1.
Peak responses in a 3-storey structure [
48] when subjected to a time-scaled 1940 Imperial Valley earthquake under different control strategies.
Table 1.
Peak responses in a 3-storey structure [
48] when subjected to a time-scaled 1940 Imperial Valley earthquake under different control strategies.
| Response Quantity | Storey | Uncontrolled | LCA | DBBCA | COCA | Passive-Off | Passive-On |
|---|
Storey displacement
(cm) | 1 | 0.55 | 0.16 | 0.14 | 0.19 | 0.23 | 0.08 |
| 2 | 0.84 | 0.25 | 0.25 | 0.31 | 0.37 | 0.18 |
| 3 | 0.97 | 0.30 | 0.31 | 0.39 | 0.47 | 0.29 |
Inter-storey drift
(cm) | 1 | 0.55 | 0.16 | 0.14 | 0.19 | 0.23 | 0.08 |
| 2 | 0.32 | 0.11 | 0.11 | 0.13 | 0.15 | 0.16 |
| 3 | 0.20 | 0.09 | 0.07 | 0.10 | 0.10 | 0.11 |
Storey acceleration
(cm/s2) | 1 | 880.42 | 398.57 | 504.23 | 685.10 | 419.96 | 283.93 |
| 2 | 1069.38 | 580.24 | 470.77 | 604.60 | 489.10 | 501.11 |
| 3 | 1411.84 | 608.59 | 662.15 | 669.65 | 725.26 | 771.57 |
| f (N) | - | - | 859.42 | 944.86 | 615.78 | 330.77 | 1054.00 |
Table 2.
General characteristics of the seismic events considered in the current study.
Table 2.
General characteristics of the seismic events considered in the current study.
| Sl no. | Earthquake | Event Date | Recording Station | Component | PGA (g) |
|---|
| 1. | Imperial Valley | 18 May 1940 | El Centro | NS | 0.35 |
| 2. | Loma Prieta | 18 October 1989 | LGPC | 00 | 0.57 |
| 3. | Northridge | 17 January 1994 | Sylmar | 360 | 0.84 |
| 4. | Kobe | 17 January 1995 | JMA | NS | 0.83 |
Table 3.
General characteristics of site-specific wind load cases considered in the current study.
Table 3.
General characteristics of site-specific wind load cases considered in the current study.
| Sl no. | Wind Load Case | Location | U3s-10 (m/s) | Exposure Category |
|---|
| 1. | Case 1 | Bengaluru | 33 | C |
| 2. | Case 2 | Mumbai | 44 | B |
| 3. | Case 3 | Delhi | 47 | C |
| 4. | Case 4 | Kolkata | 50 | B |
Table 4.
Comparison of top storey peak displacement of the coupled stiff building under different control strategies when dampers are arranged in Configuration 1.
Table 4.
Comparison of top storey peak displacement of the coupled stiff building under different control strategies when dampers are arranged in Configuration 1.
| Ground Excitation | Displacement (cm) |
|---|
| Unconnected | Semi-Active MR | Passive-Off | Passive-On | Viscous | Friction |
|---|
| Imperial Valley, 1940 | 16.01 | 5.00 | 10.84 | 3.97 | 12.17 | 12.71 |
| Loma Prieta, 1989 | 32.56 | 19.97 | 29.50 | 15.58 | 29.72 | 30.29 |
| Northridge, 1994 | 27.20 | 17.77 | 22.73 | 15.53 | 24.15 | 25.09 |
| Kobe, 1995 | 49.33 | 29.72 | 40.11 | 25.37 | 43.05 | 44.62 |
Table 5.
Comparison of top storey peak acceleration of the coupled stiff building under different control strategies when dampers are arranged in Configuration 1.
Table 5.
Comparison of top storey peak acceleration of the coupled stiff building under different control strategies when dampers are arranged in Configuration 1.
| Ground Excitation | Acceleration (g) |
|---|
| Unconnected | Semi-Active MR | Passive-Off | Passive-On | Viscous | Friction |
|---|
| Imperial Valley, 1940 | 0.94 | 0.22 | 0.48 | 0.23 | 0.70 | 0.73 |
| Loma Prieta, 1989 | 1.82 | 0.74 | 1.09 | 0.53 | 1.46 | 1.50 |
| Northridge, 1994 | 2.09 | 0.89 | 1.22 | 0.75 | 1.46 | 1.87 |
| Kobe, 1995 | 2.86 | 1.56 | 1.84 | 1.07 | 2.24 | 2.49 |
Table 6.
Comparison of peak normalized base shear of the coupled stiff building under different control strategies when dampers are arranged in Configuration 1.
Table 6.
Comparison of peak normalized base shear of the coupled stiff building under different control strategies when dampers are arranged in Configuration 1.
| Ground Excitation | Normalized Base Shear |
|---|
| Unconnected | Semi-Active MR | Passive-Off | Passive-On | Viscous | Friction |
|---|
| Imperial Valley, 1940 | 0.46 | 0.17 | 0.36 | 0.16 | 0.37 | 0.38 |
| Loma Prieta, 1989 | 0.92 | 0.62 | 0.85 | 0.52 | 0.83 | 0.85 |
| Northridge, 1994 | 1.02 | 0.62 | 0.84 | 0.54 | 0.86 | 0.91 |
| Kobe, 1995 | 1.18 | 0.71 | 0.97 | 0.62 | 1.07 | 1.08 |
Table 7.
Comparison of top storey peak displacement of the coupled flexible building under different control strategies when dampers are arranged in Configuration 1.
Table 7.
Comparison of top storey peak displacement of the coupled flexible building under different control strategies when dampers are arranged in Configuration 1.
| Ground Excitation | Displacement (cm) |
|---|
| Unconnected | Semi-Active MR | Passive-Off | Passive-On | Viscous | Friction |
|---|
| Imperial Valley, 1940 | 22.95 | 11.63 | 18.77 | 11.12 | 20.92 | 21.65 |
| Loma Prieta, 1989 | 83.85 | 58.32 | 75.12 | 49.21 | 78.07 | 79.33 |
| Northridge, 1994 | 79.19 | 59.46 | 69.58 | 52.40 | 71.54 | 72.90 |
| Kobe, 1995 | 59.43 | 34.61 | 47.05 | 28.76 | 50.82 | 54.15 |
Table 8.
Comparison of top storey peak acceleration of the coupled flexible building under different control strategies when dampers are arranged in Configuration 1.
Table 8.
Comparison of top storey peak acceleration of the coupled flexible building under different control strategies when dampers are arranged in Configuration 1.
| Ground Excitation | Acceleration (g) |
|---|
| Unconnected | Semi-Active MR | Passive-Off | Passive-On | Viscous | Friction |
|---|
| Imperial Valley, 1940 | 0.64 | 0.15 | 0.34 | 0.14 | 0.49 | 0.60 |
| Loma Prieta, 1989 | 1.61 | 0.48 | 0.91 | 0.54 | 1.27 | 1.49 |
| Northridge, 1994 | 1.58 | 0.61 | 0.96 | 0.55 | 1.17 | 1.32 |
| Kobe, 1995 | 2.58 | 0.60 | 1.04 | 0.37 | 1.65 | 2.03 |
Table 9.
Comparison of peak normalized base shear of the coupled flexible building under different control strategies when dampers are arranged in Configuration 1.
Table 9.
Comparison of peak normalized base shear of the coupled flexible building under different control strategies when dampers are arranged in Configuration 1.
| Ground Excitation | Normalized Base Shear |
|---|
| Unconnected | Semi-Active MR | Passive-Off | Passive-On | Viscous | Friction |
|---|
| Imperial Valley, 1940 | 0.20 | 0.10 | 0.16 | 0.09 | 0.16 | 0.17 |
| Loma Prieta, 1989 | 0.56 | 0.37 | 0.45 | 0.34 | 0.43 | 0.48 |
| Northridge, 1994 | 0.58 | 0.39 | 0.47 | 0.35 | 0.49 | 0.51 |
| Kobe, 1995 | 0.39 | 0.23 | 0.33 | 0.19 | 0.31 | 0.35 |
Table 10.
Comparison of top storey peak displacement of the coupled stiff building under different control strategies when dampers are arranged in Configuration 1.
Table 10.
Comparison of top storey peak displacement of the coupled stiff building under different control strategies when dampers are arranged in Configuration 1.
| Wind Load | Displacement (cm) |
|---|
| Unconnected | Semi-Active MR | Passive-Off | Passive-On | Viscous | Friction |
|---|
| Case 1 | 3.21 | 1.69 | 1.73 | 1.61 | 2.06 | 2.46 |
| Case 2 | 3.28 | 1.79 | 1.79 | 1.79 | 2.26 | 2.43 |
| Case 3 | 7.48 | 4.68 | 4.68 | 3.79 | 4.16 | 5.33 |
| Case 4 | 4.58 | 2.79 | 2.88 | 2.55 | 3.58 | 3.81 |
Table 11.
Comparison of top storey peak acceleration of the coupled stiff building under different control strategies when dampers are arranged in Configuration 1.
Table 11.
Comparison of top storey peak acceleration of the coupled stiff building under different control strategies when dampers are arranged in Configuration 1.
| Wind Load | Acceleration (g) |
|---|
| Unconnected | Semi-Active MR | Passive-Off | Passive-On | Viscous | Friction |
|---|
| Case 1 | 0.20 | 0.15 | 0.15 | 0.15 | 0.17 | 0.18 |
| Case 2 | 0.23 | 0.20 | 0.20 | 0.20 | 0.22 | 0.23 |
| Case 3 | 0.43 | 0.33 | 0.33 | 0.30 | 0.31 | 0.40 |
| Case 4 | 0.31 | 0.25 | 0.25 | 0.24 | 0.29 | 0.31 |
Table 12.
Comparison of peak normalized base shear of the coupled stiff building under different control strategies when dampers are arranged in Configuration 1.
Table 12.
Comparison of peak normalized base shear of the coupled stiff building under different control strategies when dampers are arranged in Configuration 1.
| Wind Load | Normalized Base Shear |
|---|
| Unconnected | Semi-Active MR | Passive-Off | Passive-On | Viscous | Friction |
|---|
| Case 1 | 0.10 | 0.05 | 0.05 | 0.05 | 0.06 | 0.07 |
| Case 2 | 0.08 | 0.05 | 0.05 | 0.05 | 0.07 | 0.07 |
| Case 3 | 0.24 | 0.15 | 0.15 | 0.12 | 0.13 | 0.16 |
| Case 4 | 0.14 | 0.08 | 0.08 | 0.07 | 0.10 | 0.10 |
Table 13.
Comparison of top storey peak displacement of the coupled flexible building under different control strategies when dampers are arranged in Configuration 1.
Table 13.
Comparison of top storey peak displacement of the coupled flexible building under different control strategies when dampers are arranged in Configuration 1.
| Wind Load | Displacement (cm) |
|---|
| Unconnected | Semi-Active MR | Passive-Off | Passive-On | Viscous | Friction |
|---|
| Case 1 | 10.22 | 5.37 | 5.38 | 5.36 | 7.35 | 7.78 |
| Case 2 | 17.71 | 9.39 | 9.39 | 8.80 | 9.25 | 11.85 |
| Case 3 | 25.68 | 16.82 | 16.91 | 16.60 | 19.73 | 22.85 |
| Case 4 | 20.38 | 13.20 | 13.28 | 13.10 | 15.88 | 17.74 |
Table 14.
Comparison of top storey peak acceleration of the coupled flexible building under different control strategies when dampers are arranged in Configuration 1.
Table 14.
Comparison of top storey peak acceleration of the coupled flexible building under different control strategies when dampers are arranged in Configuration 1.
| Wind Load | Acceleration (g) |
|---|
| Unconnected | Semi-Active MR | Passive-Off | Passive-On | Viscous | Friction |
|---|
| Case 1 | 0.17 | 0.13 | 0.13 | 0.13 | 0.15 | 0.16 |
| Case 2 | 0.26 | 0.17 | 0.17 | 0.17 | 0.19 | 0.25 |
| Case 3 | 0.43 | 0.34 | 0.34 | 0.34 | 0.37 | 0.41 |
| Case 4 | 0.35 | 0.30 | 0.30 | 0.30 | 0.33 | 0.35 |
Table 15.
Comparison of peak normalized base shear of the coupled flexible building under different control strategies when dampers are arranged in Configuration 1.
Table 15.
Comparison of peak normalized base shear of the coupled flexible building under different control strategies when dampers are arranged in Configuration 1.
| Wind Load | Normalized Base Shear |
|---|
| Unconnected | Semi-Active MR | Passive-Off | Passive-On | Viscous | Friction |
|---|
| Case 1 | 0.07 | 0.04 | 0.04 | 0.04 | 0.05 | 0.06 |
| Case 2 | 0.12 | 0.06 | 0.06 | 0.06 | 0.06 | 0.08 |
| Case 3 | 0.19 | 0.12 | 0.12 | 0.12 | 0.15 | 0.16 |
| Case 4 | 0.14 | 0.09 | 0.09 | 0.09 | 0.11 | 0.12 |

