1. Introduction
In Japan, approximately 700,000 road bridges are 2.0 m or longer. In 2013, approximately 18% of these bridges had been in service for more than 50 years, which is considered the normal service life of a bridge; in 10 years, approximately 43% of Japan’s bridges will have reached this age, as the many bridges built during Japan’s period of rapid economic growth surpass this mark [
1]. Moreover, bridges containing components that have undergone emergency repairs or are exposed to harsh environments have exhibited deformation caused by the deterioration of the bridge structure. Over the past five years, the number of locally managed bridges that are subjected to traffic restrictions has more than doubled [
2]. Such traffic restrictions on these bridges would severely affect road transportation networks. In addition, continual declines in public work spending will further limit capacity to mobilize the resources required to address the structural integrity of the many bridges that will require service in the near future. The United States’ infrastructure is even older than Japan’s, and the former failed to budget for adequate maintenance, which has resulted in many people suffering losses caused by the collapse of deteriorated road bridges and subsequent road closures. Predictions indicate that infrastructure deterioration in the future will be a global problem. Therefore, establishing appropriate maintenance methods is an urgent challenge.
Since 2014, Japan’s Ministry of Land, Infrastructure, Transport, and Tourism has adopted a policy of extending the service lifetime of bridges, replacing corrective with preventive maintenance, and mandates visual inspections of bridges once every 5 years. Such regular inspections are conducted to monitor the state of deterioration of the bridges and evaluate their structural soundness. The results of the visual inspections form the basis for preventive maintenance plans, according to which maintenance projects can be executed to improve the bridge condition and reduce the deterioration rate. However, prioritizing certain bridges for maintenance based on inspection results is difficult because of the large number of inspection items. Currently, bridge priority is determined based on the soundness of bridges and their degree of importance; however, these determinations do not consider environmental factors that may impact repair priorities.
Globally, several regions of the world base bridge maintenance on regular inspections, and many research projects have applied those inspection results to different infrastructure concerns. Researchers have built models to predict deterioration based on the results of inspections of bridges [
3,
4]. The Markov model has been widely applied to predict the deterioration of roads based on inspection results [
5,
6,
7,
8]. Other research projects have verified exactly when and how repairs and retrofitting should be executed based on deterioration predictions to maximize efficiency [
9,
10]. Other studies have analyzed the factors affecting deterioration using a variety of methods [
11,
12,
13]. Z. Zhao and C. Chen [
14] analyzed the factors related to structural deterioration using a fuzzy theory system. A.K. Agrwal, A. Kawaguchi, and Z. Chen [
15] modeled the survival of 17,000 bridges on expressways in New York using a Weibull distribution to analyze the factors that influence deterioration. However, these studies limited their analyses to structural factors, neglecting environmental factors. Among those who considered environmental factors, P.C. Yianni, L.C. Neves, D. Rama, J.D. Andrews, and R. Dean [
16] used the Petri net theory to verify that the deterioration rate of railway bridges in England varies in different environments. Although various studies have analyzed the environmental factors affecting deterioration, they have generally been limited to railway bridges, and few such studies have been applied.
The study presented here is based on the prediction that bridges in different environments deteriorate at significantly different rates. Therefore, if maintenance plans do not reflect environmental conditions, appropriate bridge inspections and repair priorities cannot be set to consider the potentially advanced rates of deterioration exhibited by certain bridges. Identifying the environmental factors that influence deterioration can aid the development of more efficient and effective maintenance plans. This study analyzed the results of two past cycles of regular inspection to determine the environmental factors impacting the soundness of bridges statistically based on Hayashi’s quantification theory type I [
17]. Hayashi’s quantification theory type I is a method of predicting a quantitative external criterion or criterion variable on the basis of qualitative attributes and analyzing the influence of each attribute on the criterion variable. The analyzed region is located on the side of the country that faces the Japan Sea, which is a region that is very cold in the winter and is thus exposed to damage from salt and other anti-freezing agents, much like the aggressive maritime conditions on the Croatian coast [
18]. This region is also exposed to the freezing damage caused by extremely cold winter weather, an environmental condition that is particularly hard on bridges.
2. Data Analysis
This study analyzed the bridges managed by Ishikawa Prefecture. The climate of Ishikawa Prefecture differs by region, and is broadly divided as follows: the southern mountainous area with low temperature and heavy rain, the southern plain with a mild climate, and the northern region affected by the Sea of Japan. These different natural environments were predicted to have varying influences on bridge deterioration. In general, Ishikawa Prefecture’s environment is harsh on bridges, owing to factors such as the salt in the air associated with the meteorological characteristics of the region’s winters; the dispersal of anti-freezing agents, primarily in mountainous areas, to keep roads passable in winter; and fatigue caused by heavy loads and vehicular traffic in urban areas with a high traffic volume.
2.1. Data Sources
2.1.1. Regular Bridge Inspection Data
Data from the regular bridge inspections included bridge specifications as well as inspection data. The specifications include the year of construction; superstructure material; number of spans; bridge length; road width; maximum span length; road-traffic census data (daily traffic volume, daily large vehicle traffic volume); location, including latitude and longitude; and rehabilitation and reinforcement priority. Regular inspections were conducted once every five years, and the components inspected included the main girders, slabs, substructure, expansion joints, bearings, and deck. The soundness of the bridges was discretely evaluated using a descending five-point scale, with five meaning that the bridge was entirely sound with no apparent damage. The criteria used by Ishikawa Prefecture for evaluating the soundness of each component are shown in
Table 1.
2.1.2. Geographical Information System (GIS) Data
A GIS-based analysis was conducted using data from 2086 of the 2314 bridges managed by Ishikawa Prefecture, for which location information was included. Although each bridge has a length that spans multiple location points, in the bridge inspection data, the location information was represented by a single point. This representative location information corresponds to the point at which the bridge was inspected and does not necessarily correspond to the center point of the bridge. Nonetheless, in this study, this representative location information was used as the representative location point for each bridge. The bridge location identified by GIS supplemented the geographical information provided by the regular bridge inspection data. This study sourced geographical information from the National Land Numerical Information [
19]. The National Land Numerical Information represents numerical data from information related to the national lands, prepared to support the promotion and formulation of land planning instruments such as the Comprehensive National Development Plan, National Land Use Planning, and the National Spatial Strategy.
2.2. Data Types
2.2.1. Influence of Salt in the Air
One problem with concrete bridges located near the coastline is that they become permeated with salt, which corrodes their internal steel and causes the concrete to crack or break [
20]. In case of steel structures, the adhesion of salt in the air also influences the corrosion and deterioration of their exterior paint [
21]. In this study, the coastline data from the National Land Numerical Information were used to evaluate the influence of salt in the air based simply on the bridge distance from the coastline. No data were available regarding the wind direction and strength in Japan. Therefore, in this study, the wind direction and strength were not considered in the evaluation of the influence of salt in the air.
2.2.2. Disperse Anti-Freezing Agents
To assure road safety during the winter, the civil engineering offices in Ishikawa Prefecture disperse anti-freezing agents, and these agents have been observed to damage concrete bridges. This damage is concentrated in certain areas, with significant deterioration at the girder ends, overhanging portions of slabs, and substructure, among other elements [
22]. With steel structures, anti-freezing agents influence the corrosion and deterioration of their external paint [
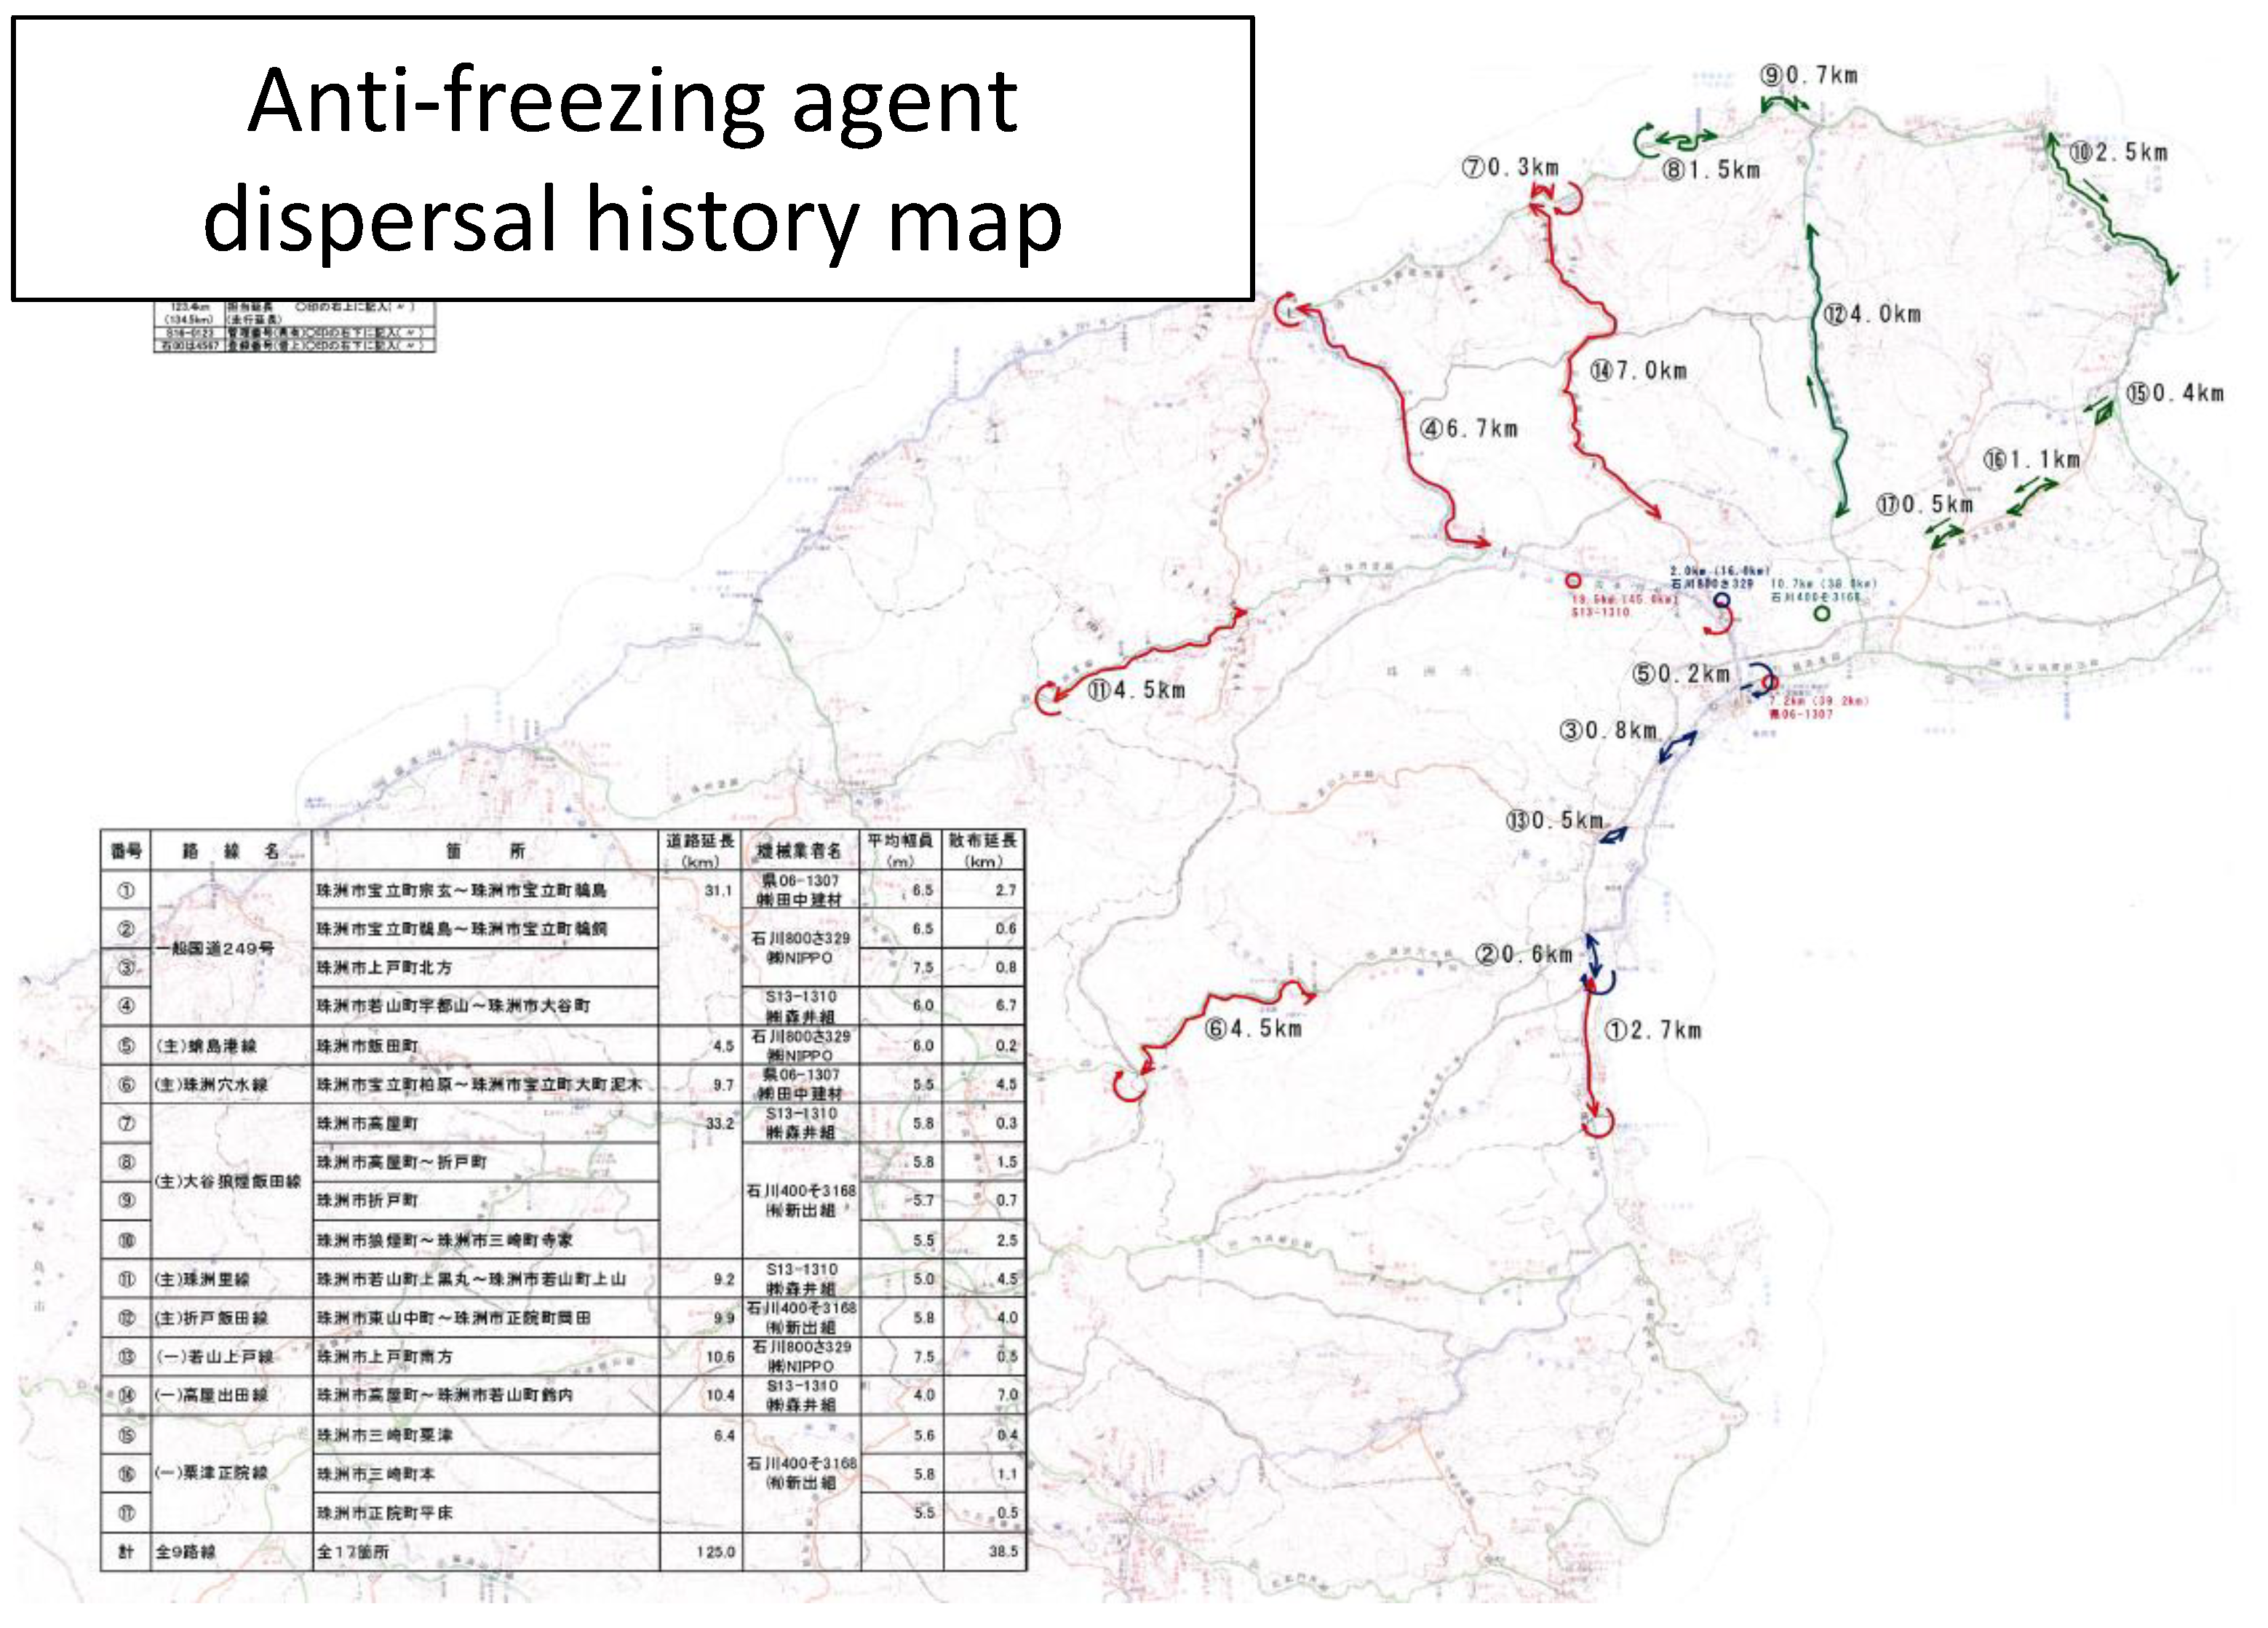
21]. Although the specific formats of each civil engineering office records differed, a map of the historical dispersal of anti-freezing agents was created for this study (
Figure 1), indicating, with a color code, the roads on which anti-freezing agents have been dispersed. Not all of the civil engineering offices kept thorough records of the amounts of agents dispersed. Therefore, this study evaluated the influence of anti-freezing agents based on whether or not they had been dispersed.
2.2.3. Influence of Traffic Volume
The primary damage suffered by bridges is the fatigue that manifests as cracking in the concrete and steel, caused by the accumulative damage from vehicular traffic and other repetitive outside forces [
23]. In order to account for vehicular weight, which is considered a primary cause of fatigue, this study used two indices from the road traffic census that are listed in the regular bridge inspection data: daily traffic volume and daily large vehicle traffic volume.
2.2.4. Influence of Rainfall
In the case of steel structures, high amounts of rainfall generally reduce the amount of adhered salt because the wind and rain wash it off the girders, thus, reducing the amount of salt from the air that accumulates on the structural components [
24]. In contrast, the influence of rain on concrete bridges is more complex: rain can flush out chlorides from the concrete surface, and hence, slow down corrosion initiation, but high-humidity environments generated by rainfall and other factors promote water absorption and swelling of gel, which causes alkali-aggregate reactions in concrete [
23]. Regarding the amount of rainfall thought to influence the damage to bridges, this study used the normal value mesh data from the National Land Numerical Information, which are calculated from the normal values for each 1 km mesh unit from the observation station, considering five meteorological factors (total amount of annual rainfall, air temperature, maximum snow depth, hours of sunlight, and amount of global solar radiation) over the past 30 years. Among these factors, this study used the total amount of annual rainfall as the index.
2.2.5. Influence of Accumulated Snow
One of the loads that bridges experience is the snow load owing to accumulated snow. While the fatigue damage caused by the snow load is not yet well-known, this load exerts at least some influence on the soundness of bridges in areas with heavy snowfall, such as Ishikawa Prefecture. Furthermore, in areas with significant snow accumulation, the frequency of anti-freezing agent dispersal is high. Therefore, to account for the influence of accumulated snow, this study used the annual maximum snow depth from the National Land Numerical Information normal mesh as an index.
2.2.6. Influence of Air Temperature
The temperature distributions in concrete bridges change in a complex manner in response to meteorological conditions, and temperature differentials in the components cause thermal stress [
25]. In general, bearings are installed between the piers and girders of a bridge, and thus, they are always in the shade. Therefore, little or no temperature difference is expected between the bearings and the ambient temperature. However, depending on their installation location, some bearings are exposed to direct sunlight, and the hotter the rubber bearings become, the faster the material deteriorates [
26,
27]. To consider the influence of temperature changes, this study used the normal value mesh data from the National Land Numerical Information as the index. The normal value mesh data contain three types of temperature data: monthly highs, lows, and averages. However, to account for temperature changes throughout the year, we used data on the highest and lowest temperatures from August and February, which are the hottest and coldest months in Ishikawa Prefecture, respectively, as well as data on the average amount of annual global solar radiation.
2.2.7. Influence of Altitude
The soundness of bridges at higher altitudes is influenced by many more factors compared to those at lower altitudes. These factors accumulate as snow, rainfall, and low temperatures, among others. This study used the average altitude from the altitude/slope 5D mesh data of the National Land Numerical Information as the altitude at each bridge location.
Table 2 shows the average, maximum, and minimum of each index used in this study.
3. Evaluation of Each Factor’s Influence on Bridge Soundness
This section presents the statistical analysis of the bridges managed by Ishikawa Prefecture to determine what level of influence the environmental factors and bridge specifications identified in the previous section have on bridge soundness. As previously stated, Ishikawa Prefecture’s regular bridge inspections are focused on six components: the main girders, slabs, substructure, expansion joints, bearings, and deck. However, our analysis targets four primary components: the main girders, slabs, substructure, and bearings.
3.1. Deterioration Index Definitions
Ishikawa Prefecture’s bridge inspections evaluate the level of damage to bridges every five years using a five-level scale. However, simply using the soundness of a bridge as an index of its deterioration causes several problems, including the following: First, this index hinders understanding of the bridge’s deterioration in relation to the structure’s real (as opposed to nominal) age, because the index considers the bridge’s state of damage at only one point in time. Second, the index does not represent how a bridge’s soundness may have recovered after rehabilitation. In Ishikawa Prefecture, data from the regular bridge inspections started to be collected in 2003. Therefore, data from two inspection cycles could be used to calculate a deterioration rate of each bridge. As shown in Formula (1), the deterioration rate was defined as the difference between the levels of soundness obtained in the first and second regular inspections divided by the time span between both inspections. We considered deterioration rates larger than 0 as normal deterioration, a deterioration rate of 0 as no deterioration, and deterioration rates of less than 0 as the possible result of previous rehabilitation or reinforcement. Therefore, even with Ishikawa Prefecture’s regular bridge inspection data, which do not contain thorough records of rehabilitation history, the real extent of deterioration could be examined by excluding samples with a deterioration rate of less than 0, which may have been rehabilitated or reinforced.
v: Deterioration rate
s1: Soundness during first inspection
s2: Soundness during second inspection
t1: Year of first inspection
t2: Year of second inspection
3.2. Analysis Methods
Hayashi’s quantification method type I was used to analyze the level of influence of the environmental factors on the soundness of bridges [
17]. Hayashi’s quantification method type I is a method of investigating the relationship between the objective and explanatory variables by creating a relational expression that clarifies the degree of influence of the explanatory variables on the objective variables, the importance of the explanatory variables, and the predictions that can be made in relation to the objective variable. This method differs from a multiple regression analysis in terms of the data format for the explanatory variable [
28]. Multiple regression analyses use quantitative data, whereas Hayashi’s quantification method type I uses category data. In this study, we have applied Hayashi’s quantification method type I by quantifying the level of each environmental factor as an explanatory variable. Furthermore, to compare the levels of influence exerted by environmental factors and bridge specifications, the bridge specifications were quantified within each level and added to the explanatory variables.
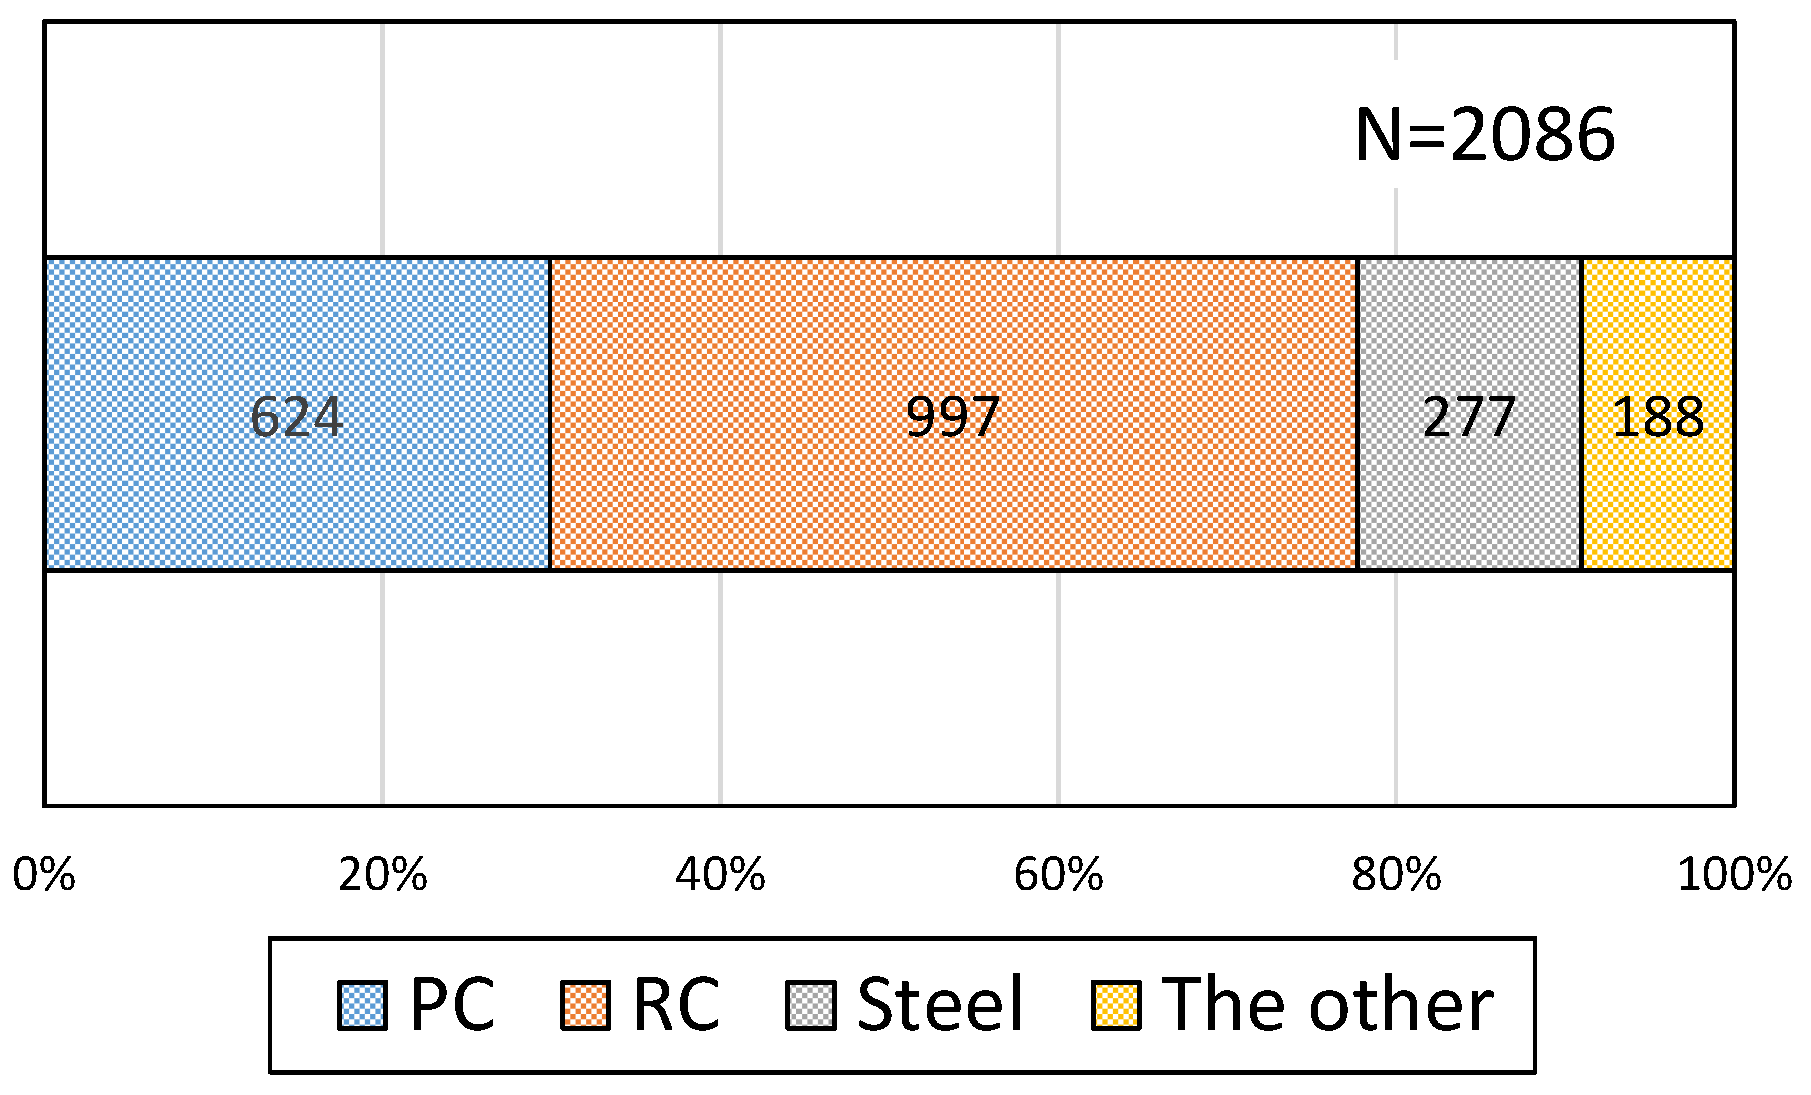
In addition, each factor was divided into several levels to distinguish conditions within each factor. Ideally, these conditions should be set based on established standards; however, such standards have not yet been instituted. Furthermore, determining levels based on nationwide standard values would bias the sample size of the levels for environmental factors that are more prominent in Ishikawa Prefecture than in the rest of the country. Therefore, we decided to classify each environmental factor into five levels such that the sample size of each level would be equal. However, because the data on the dispersal of anti-freezing agents often indicated only whether anti-freezing agents had been dispersed or not, only two levels were used for that factor: dispersal and no dispersal. For years in service, we established six levels: 0–10 years, 10–20 years, 20–30 years, 30–40 years, 40–50 years, and >50 years. For the superstructure material, we established four categories: PC, RC, Steel, and Other (
Figure 2).
3.3. Results of Analysis
The deterioration rate calculated from the soundness of each component was defined as the objective variable, and the environmental factors and bridge specifications were defined as the explanatory variables. Environmental factors with large ranges, as identified by Hayashi’s quantification method type I, were considered to have a large influence on the deterioration rate, elucidating the positive and negative environmental influences that affect the deterioration rate.
3.3.1. Main Girder Deterioration Rate
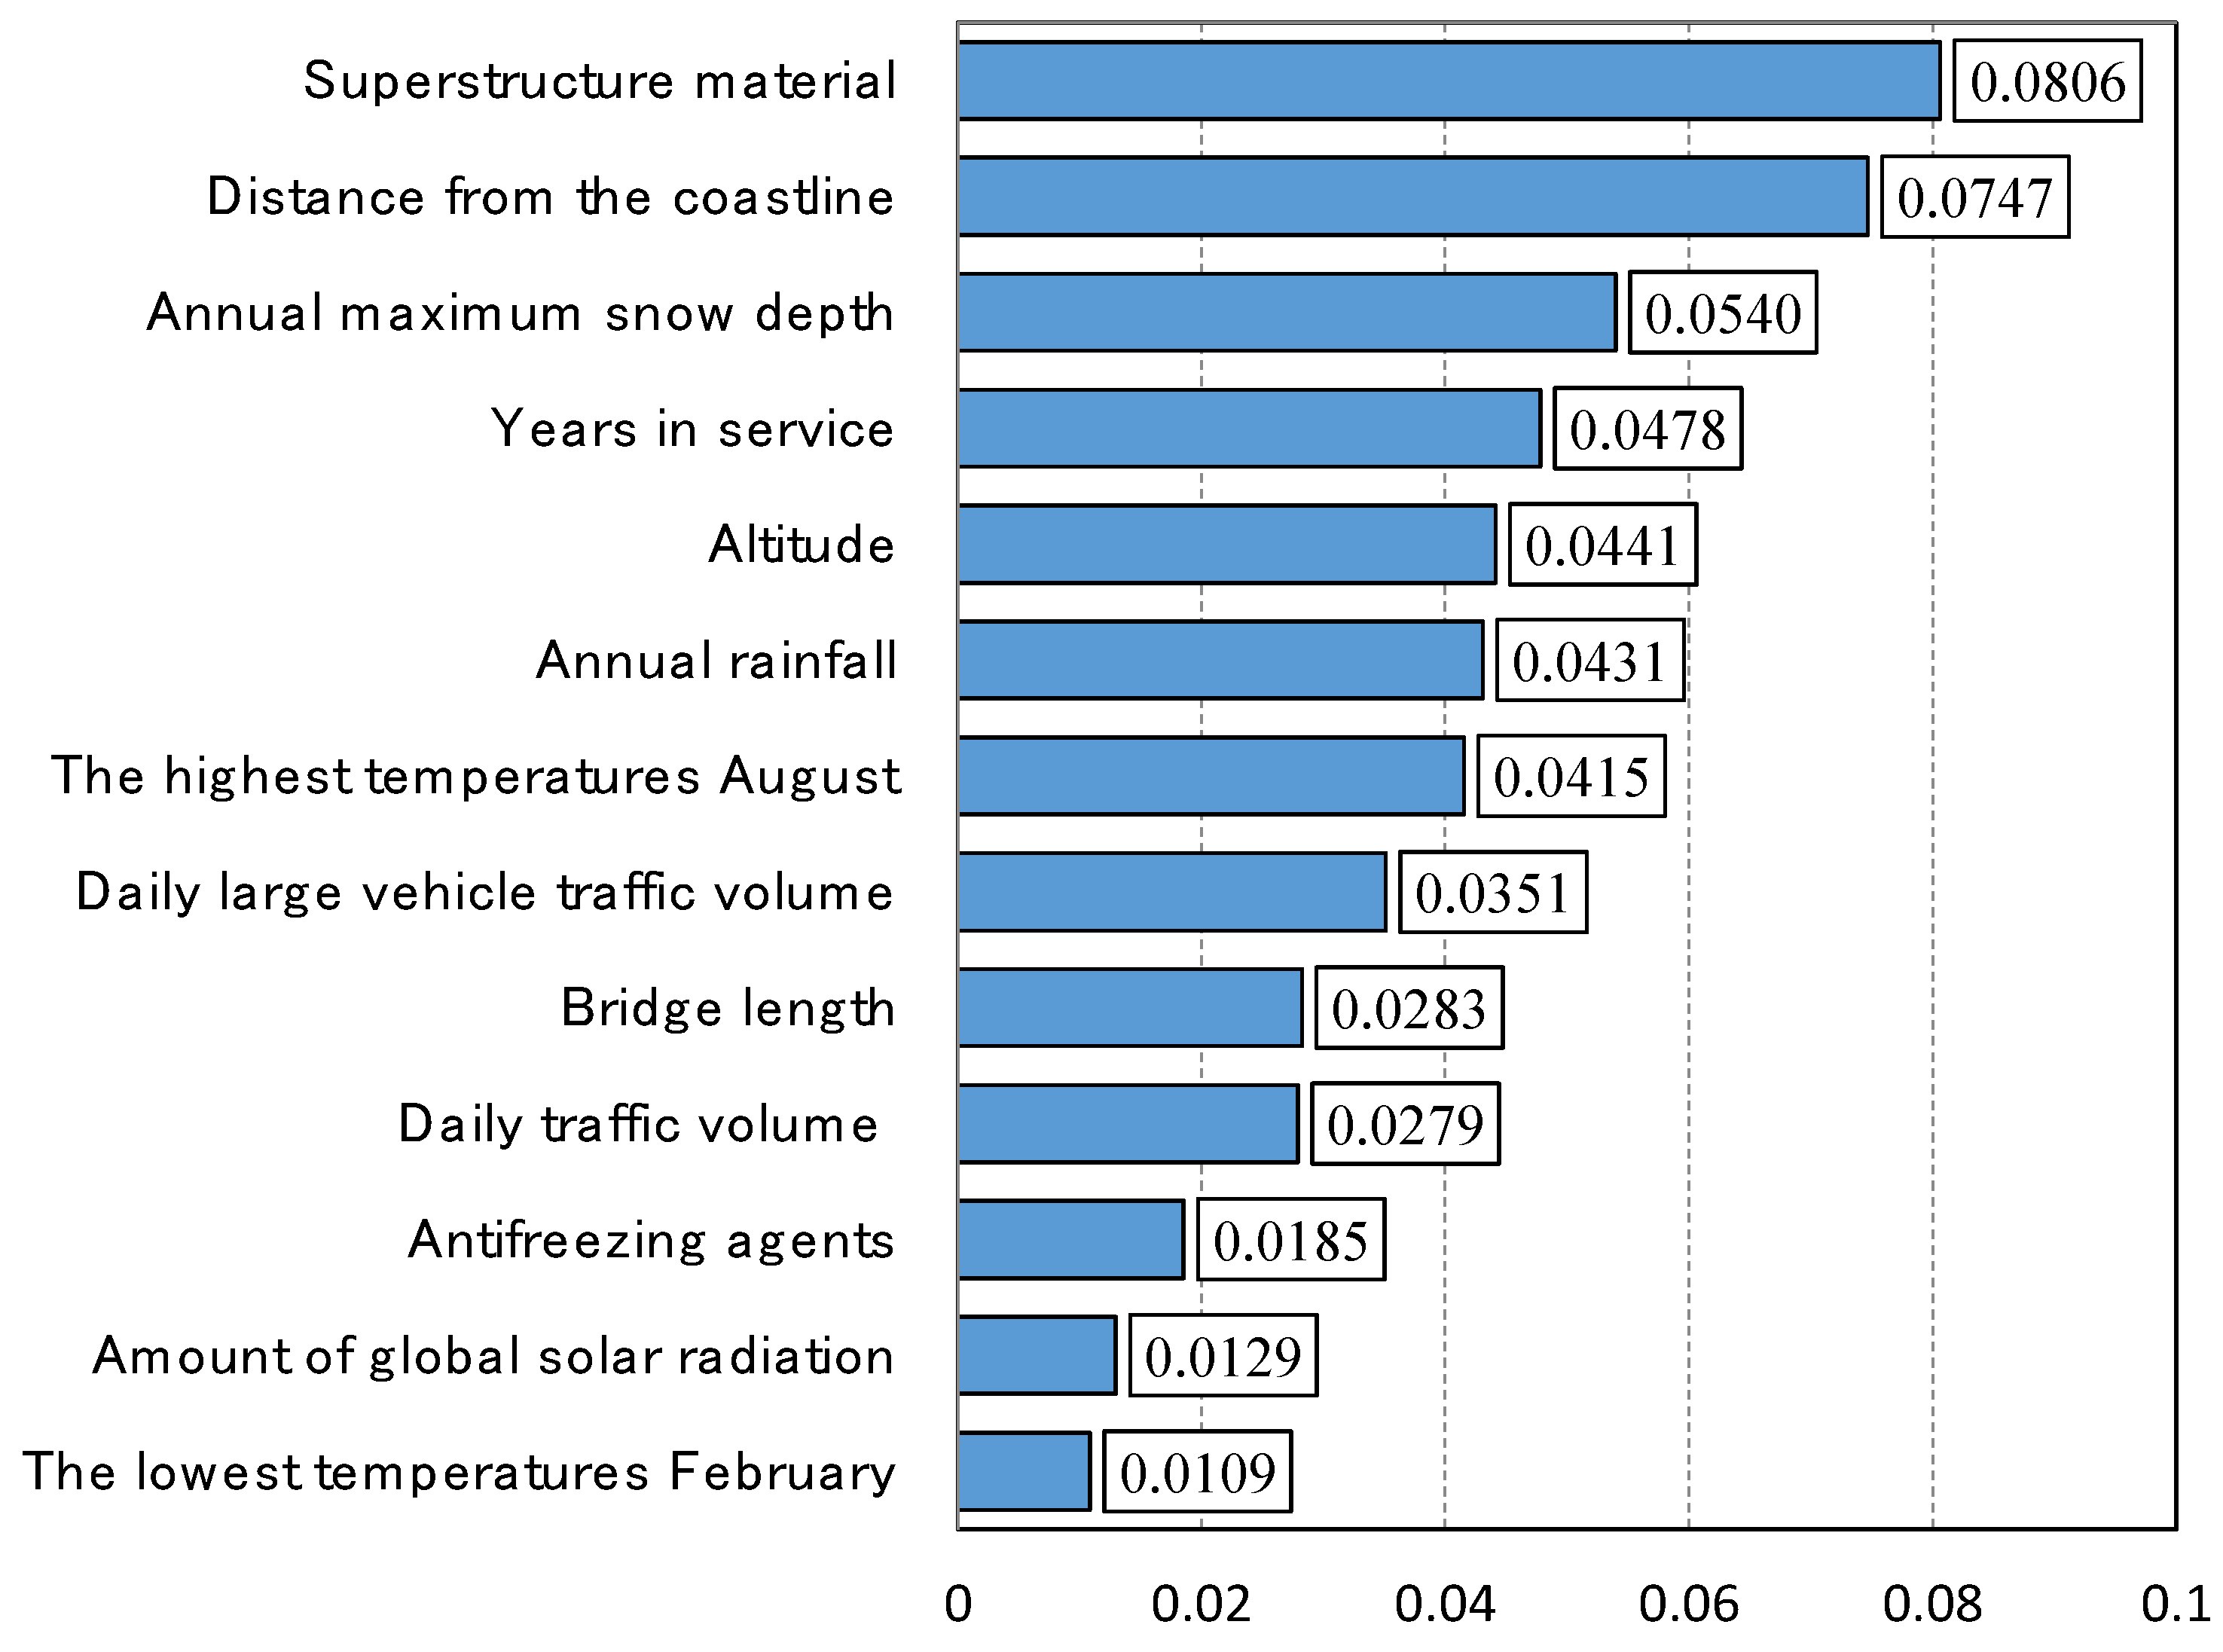
The sample size used in our analysis of main girders was 964 bridges; the multiple correlation coefficient was 0.33.
Figure 3 shows the level of influence that each factor had on the deterioration rate of main girders, where the most significant factor was the superstructure material, followed closely by the distance from the coastline. According to the category scores for the superstructure material (
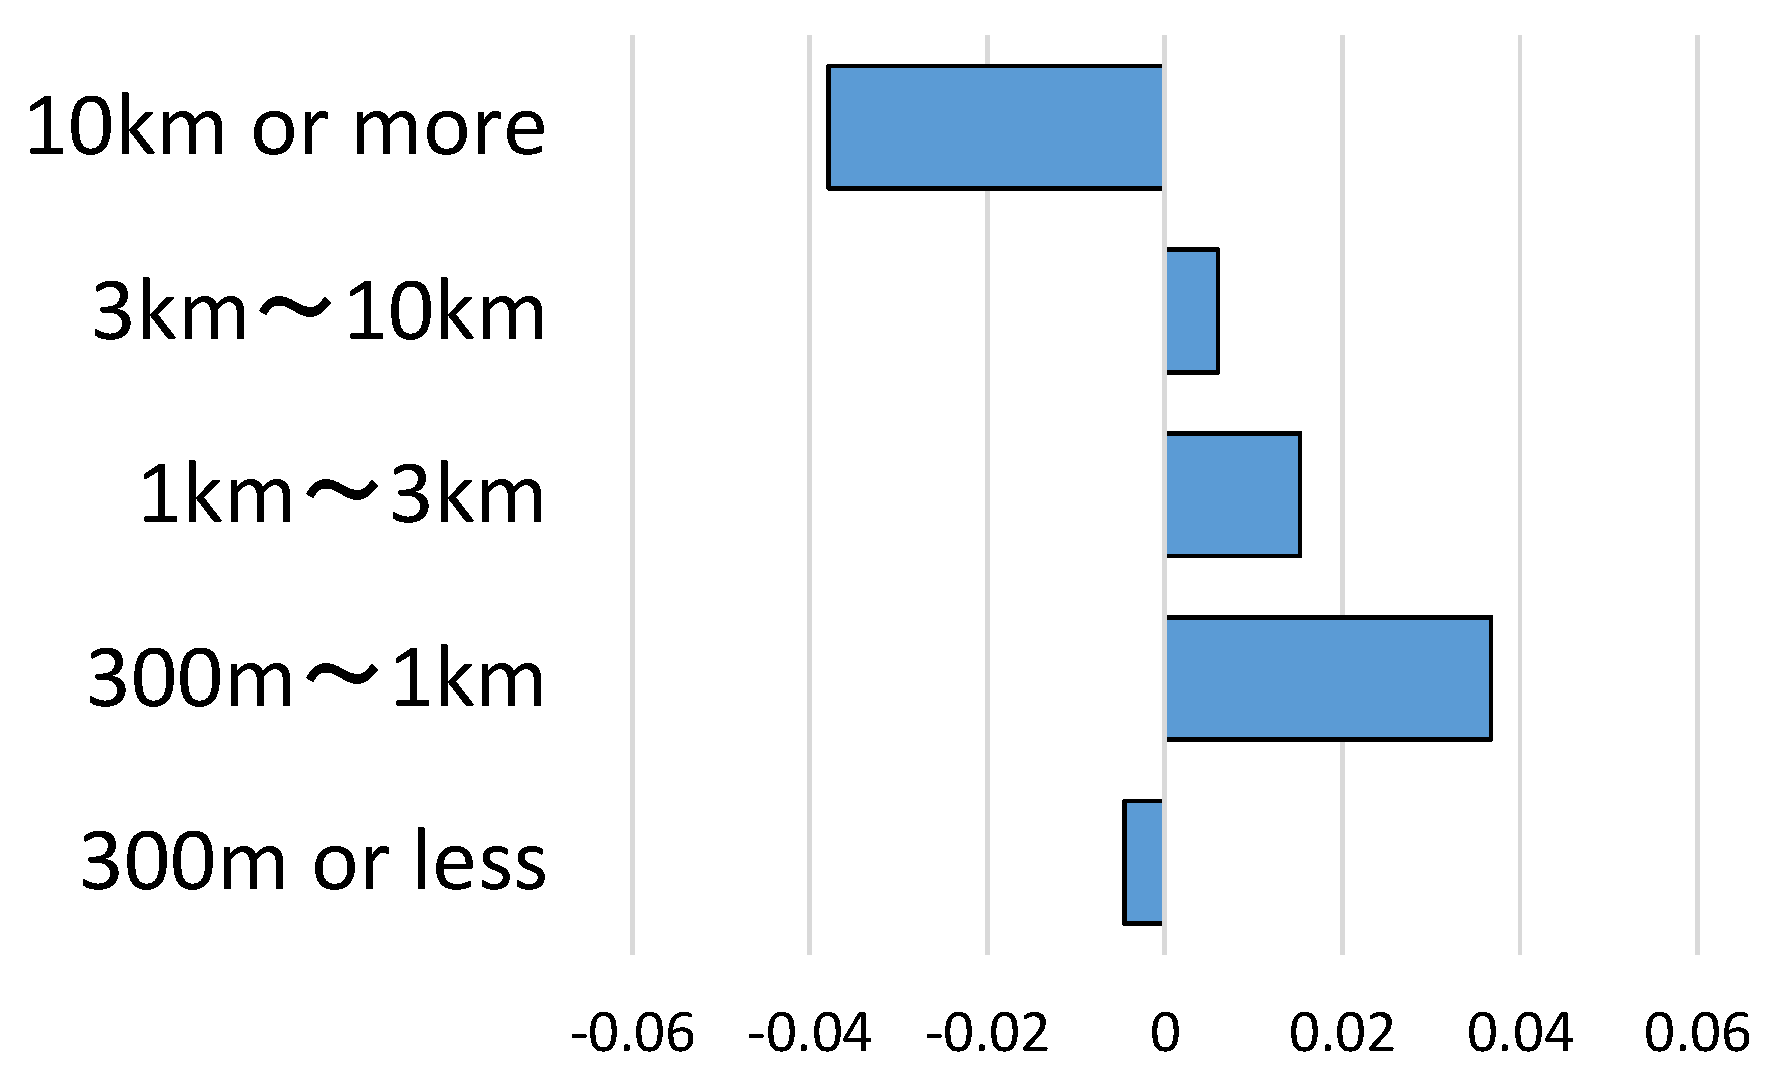
Figure 4), the steel and PC categories accelerate the deterioration of the main girders. Possible causes for the accelerated deterioration of steel bridges are that they may be more easily subjected to damage and that the damage is more visible. According to the category scores for distance from the coastline (
Figure 5), excluding distances of 300 m or less, the greater the distance from the coastline, the less the deterioration rate. However, despite the fact that bridges within 300 m of the coastline are the most influenced by salt in the air, the overall influence is negative. One possible cause is that measures to mitigate salt damage have already been implemented in bridges within 300 m of the coastline.
3.3.2. Slab Deterioration Rate
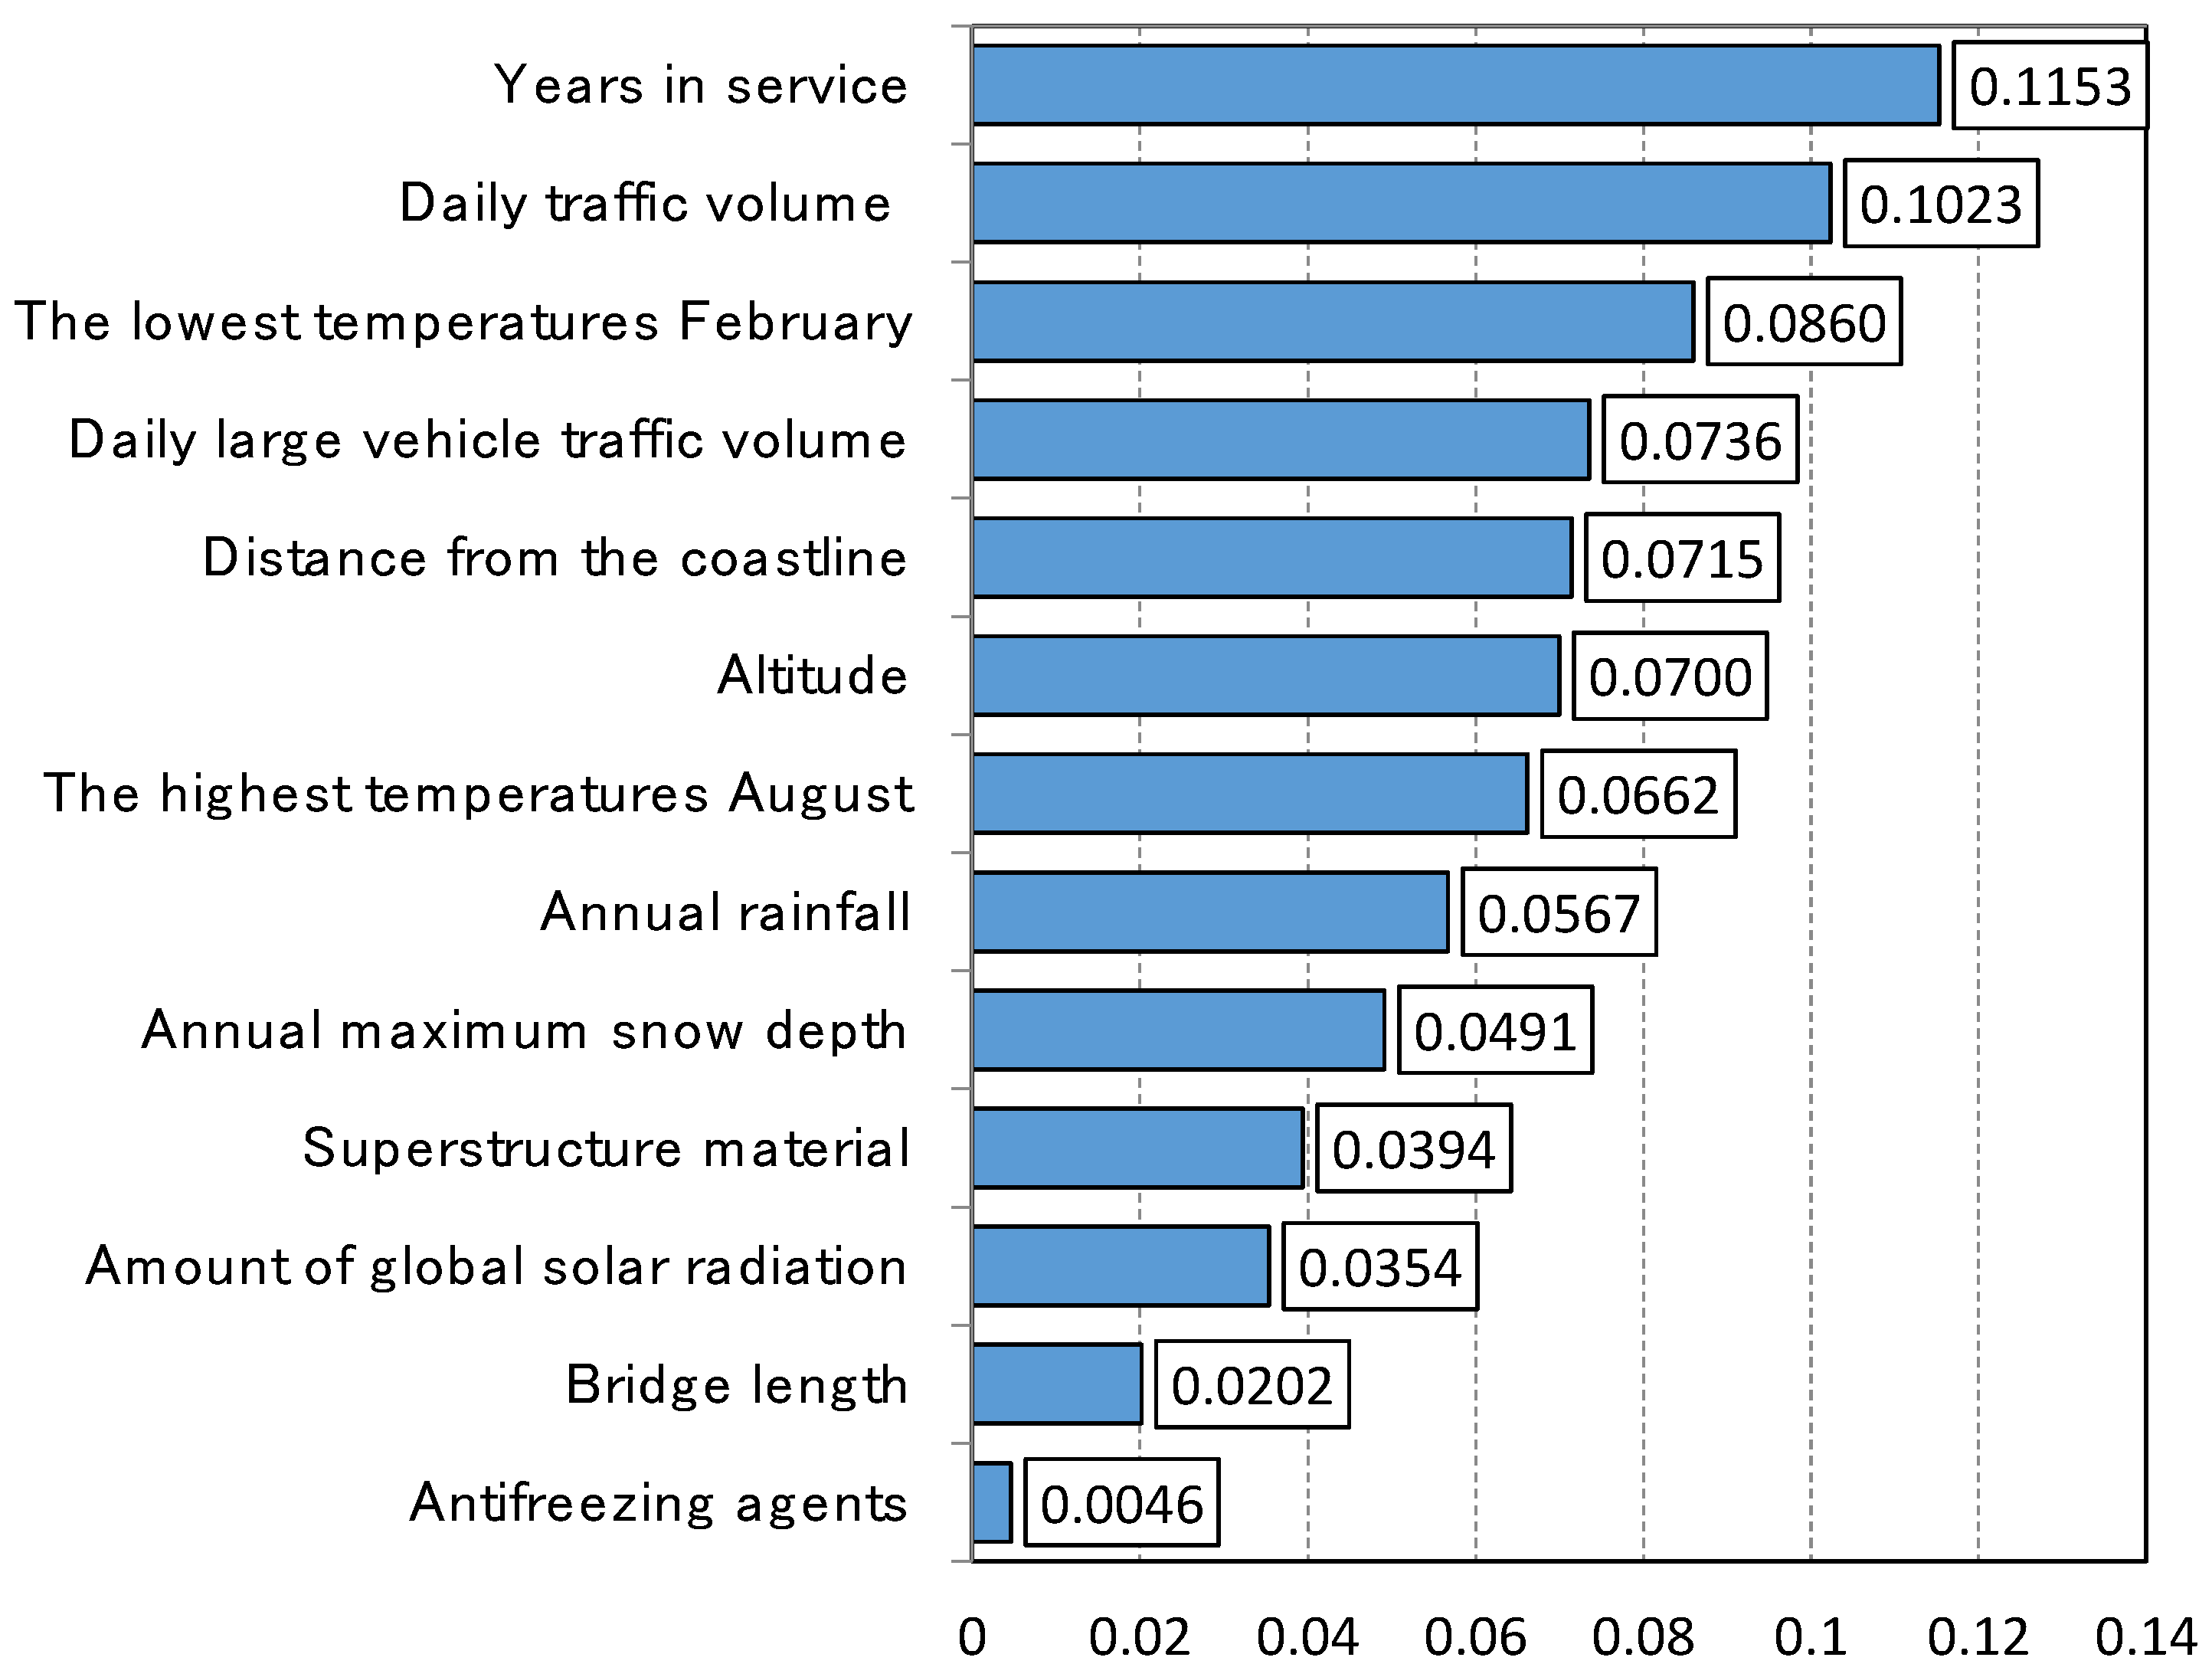
The sample size used in our analysis of slabs was 936 bridges; the multiple correlation coefficient was 0.33.
Figure 6 shows the level of influence that each factor had on the deterioration rate of slabs, where the most significant factor was years in service, followed by daily traffic volume. According to the category scores for years in service (
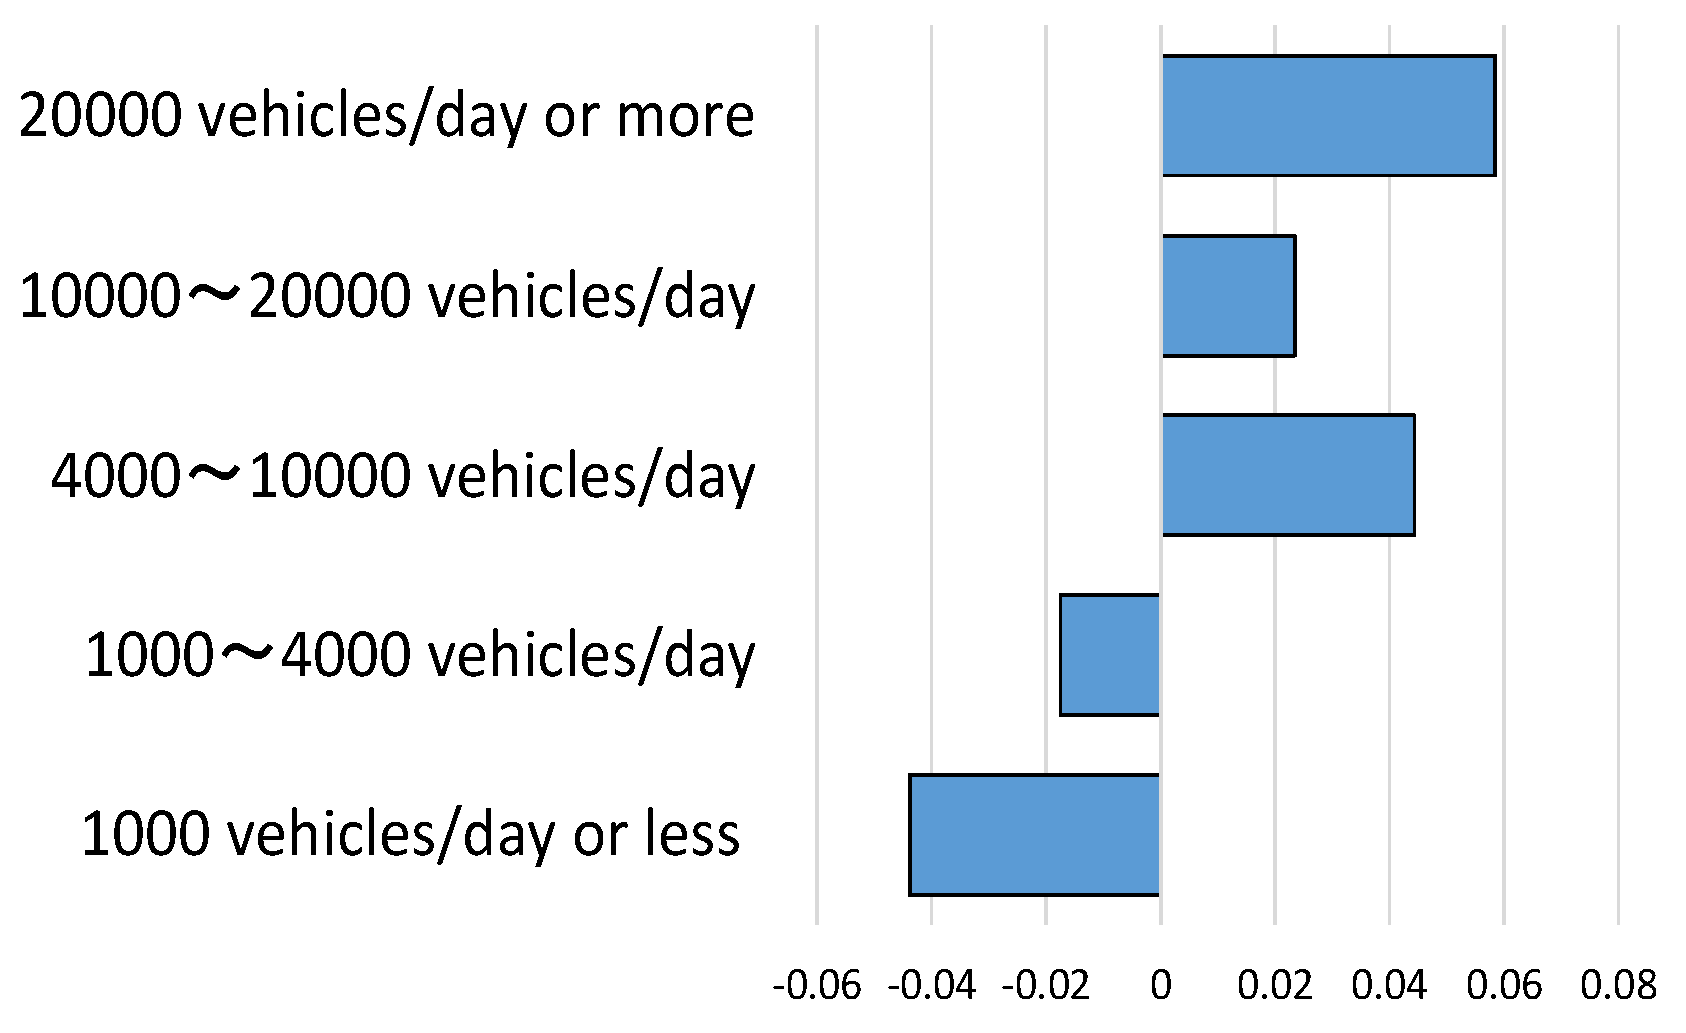
Figure 7), this category starts to accelerate the slab deterioration rate at approximately 40 years in service. Therefore, the slabs of bridges with more than 40 years in service require countermeasures to mitigate the associated deterioration. According to the category scores for daily traffic volume (
Figure 8), in general, the larger the daily traffic volume, the more accelerated the slab deterioration rate. These results indicate that the slabs of bridges with a daily traffic volume of more than 4000 vehicles/day require countermeasures to mitigate the associated deterioration.
3.3.3. Substructure Deterioration Rate
The sample size used in our analysis of substructures was 1079 bridges; the multiple correlation coefficient was 0.27.
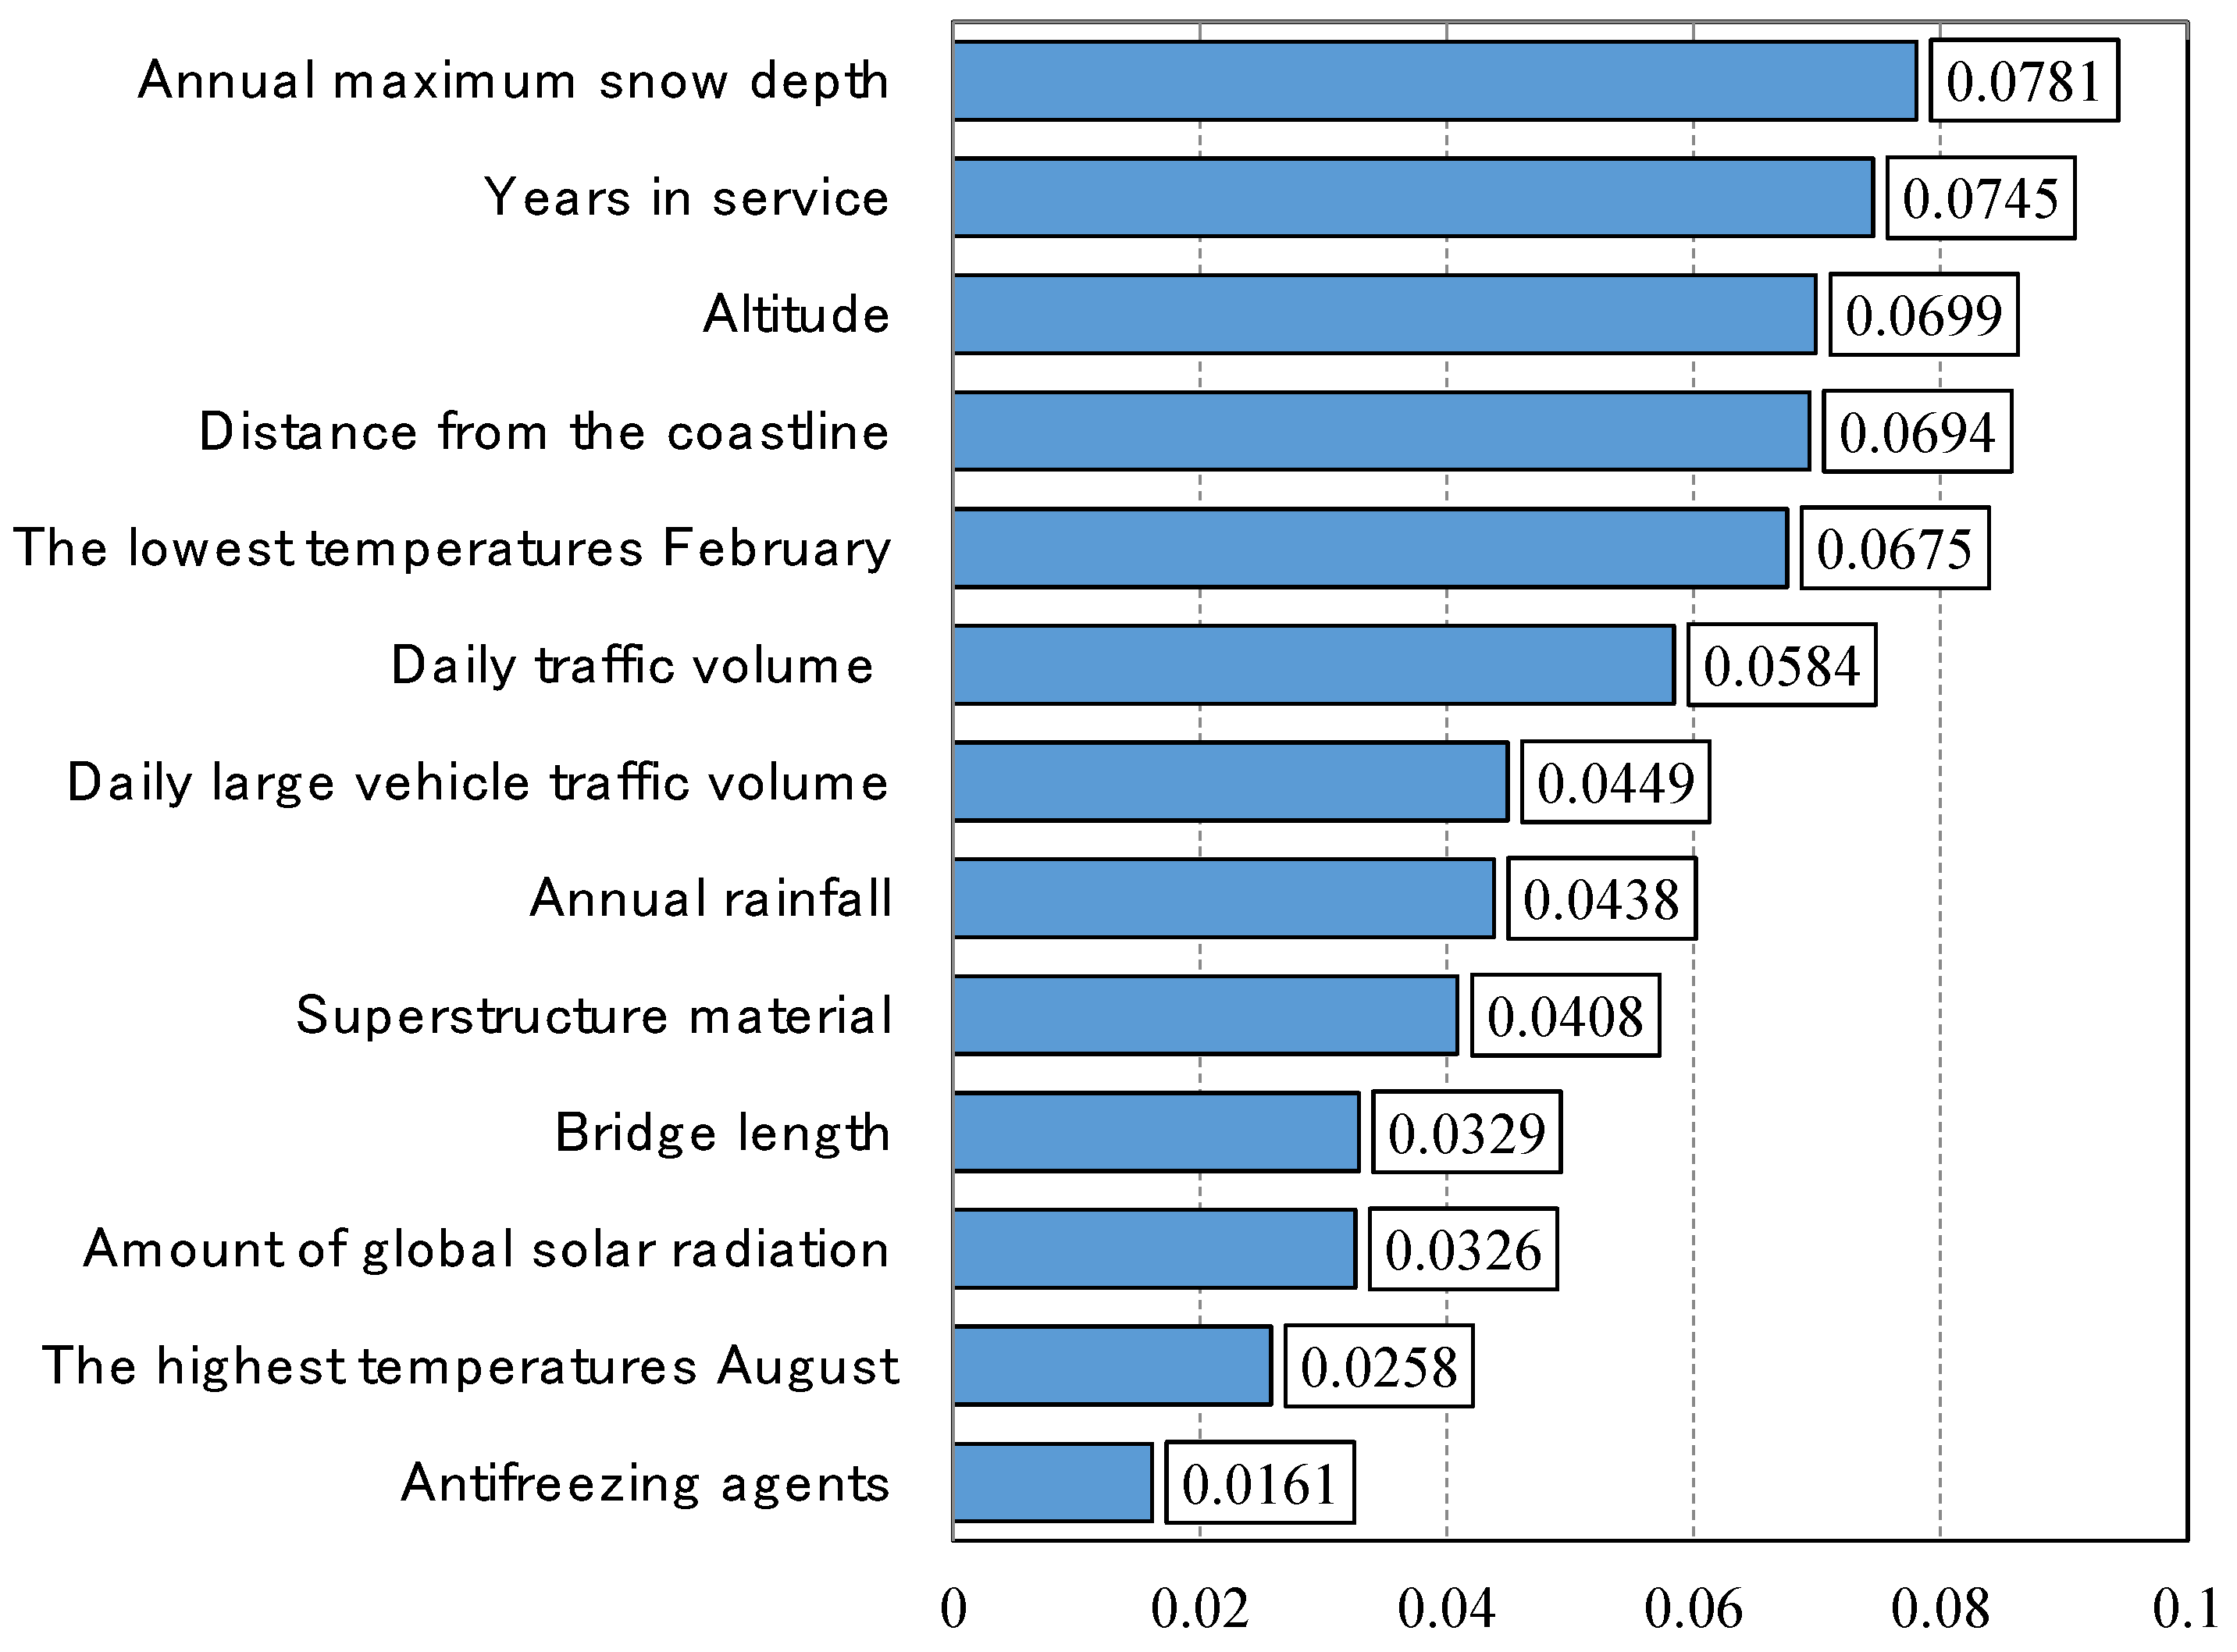
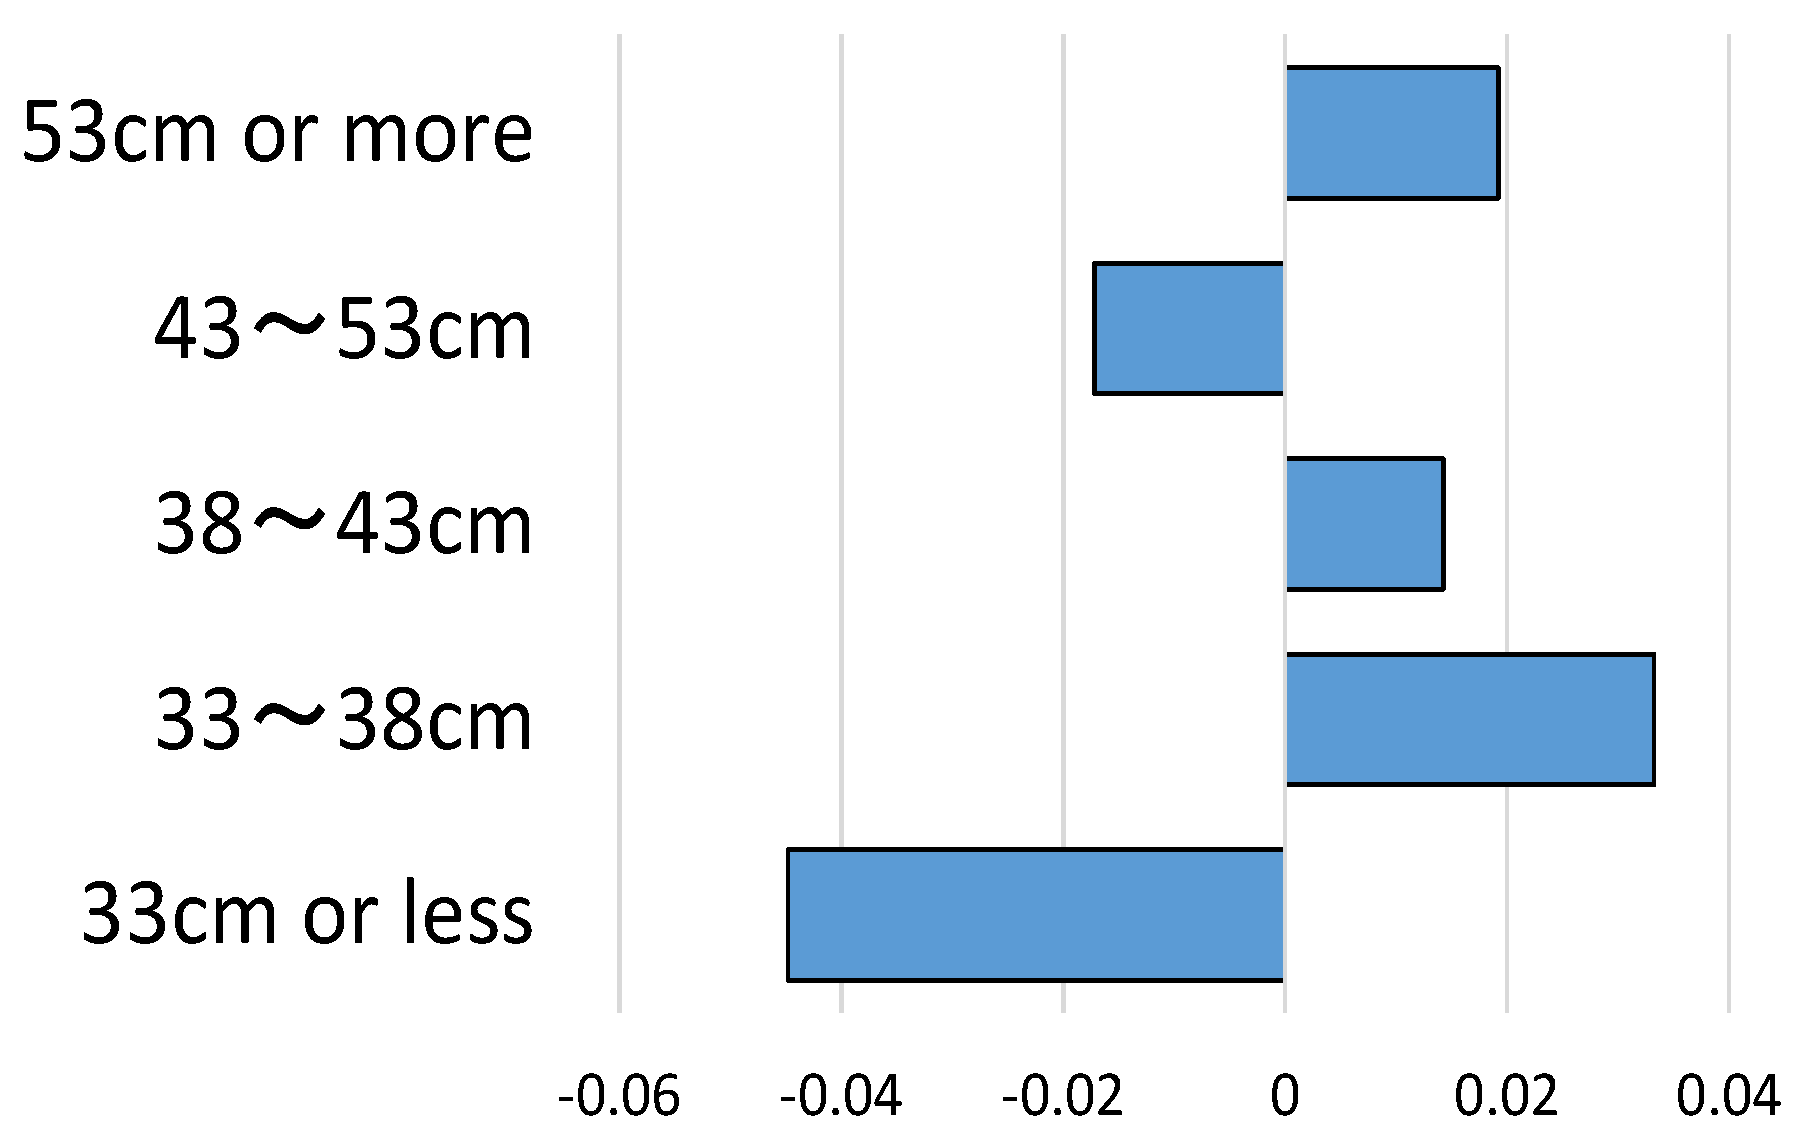
Figure 9 shows the level of influence each factor had on the deterioration rate of the substructures, where the most significant factor was the annual maximum snow depth, followed by years in service. According to the category scores for annual maximum snow depth (
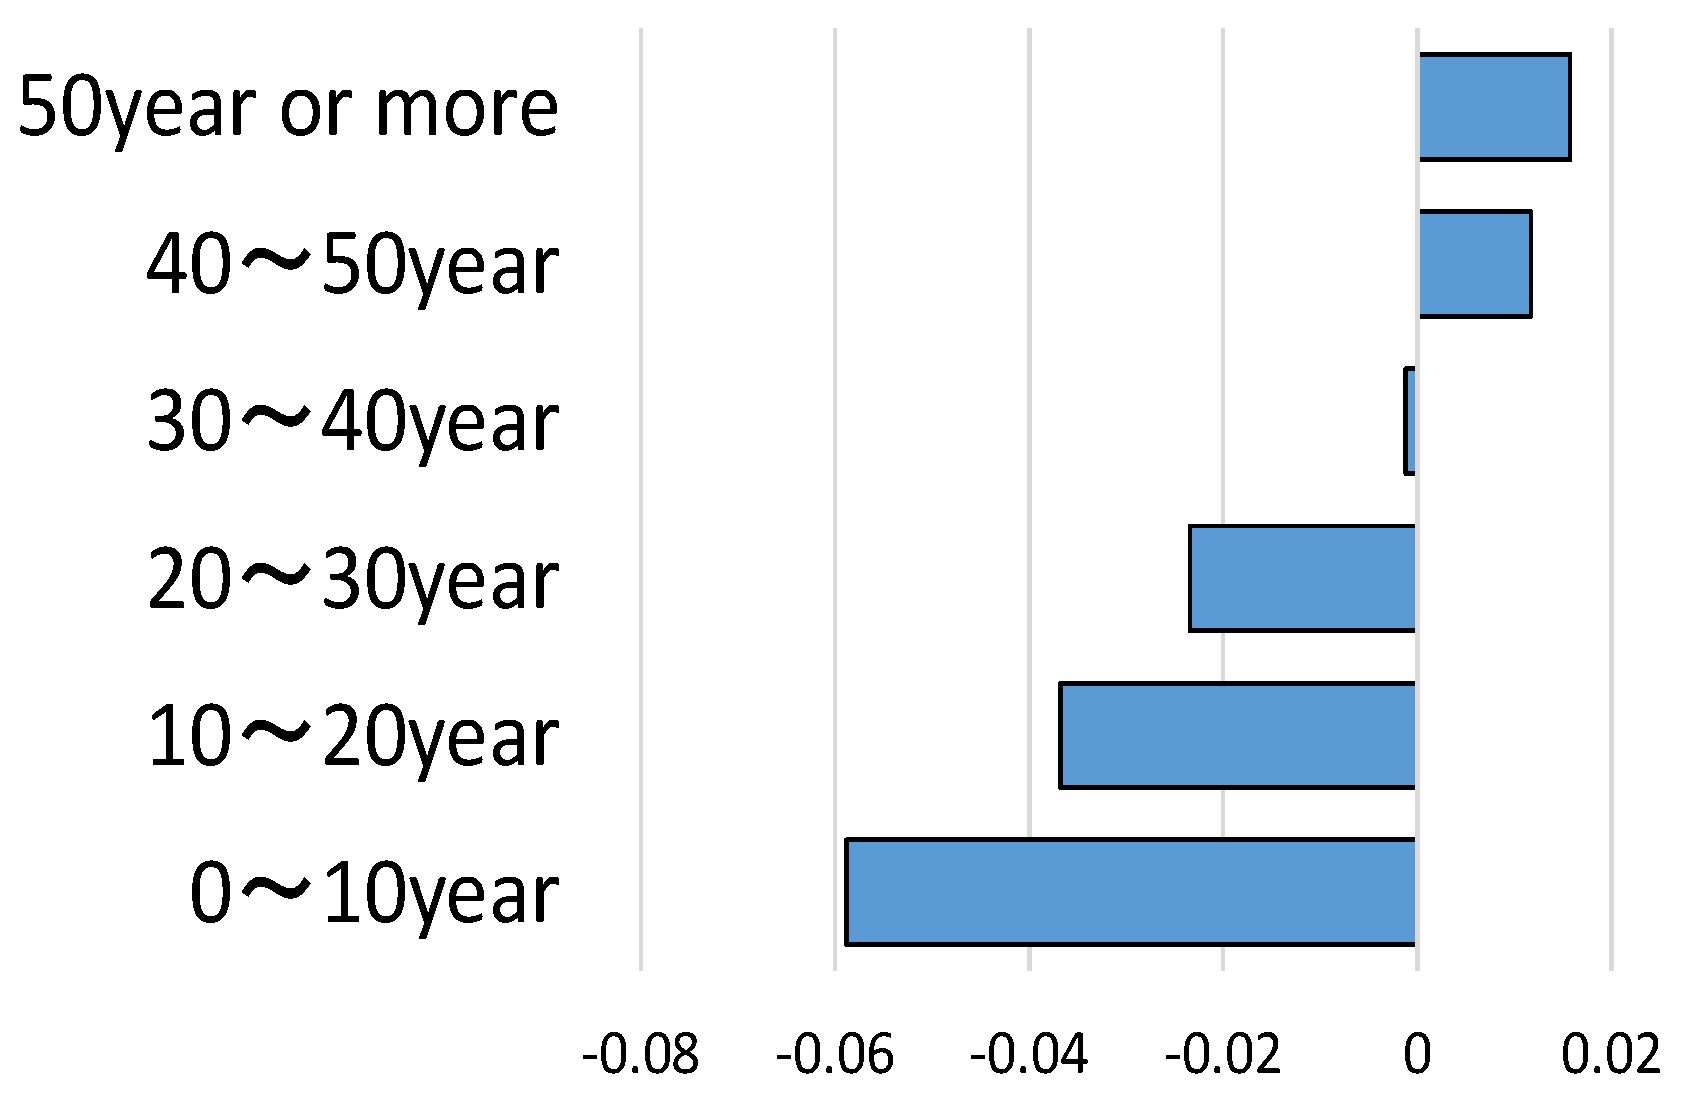
Figure 10), when the annual maximum snow depth was 33 cm or less, the factor decelerated deterioration; however, when the annual maximum snow depth was 33 cm or more, the factor accelerated deterioration, except when the snow depth was 43–53 cm. These results clearly show that the substructure deterioration rate is large in areas with much snow accumulation, possibly because the frequency of anti-freezing agent dispersal is high. According to the category scores for years in service (
Figure 11), as was the case for slabs, longer years in service accelerate the deterioration rate of substructures, starting at approximately 40 years in service.
3.3.4. Bearing Deterioration Rate
The sample size used in our analysis of bearings was 822 bridges; the multiple correlation coefficient was 0.39.
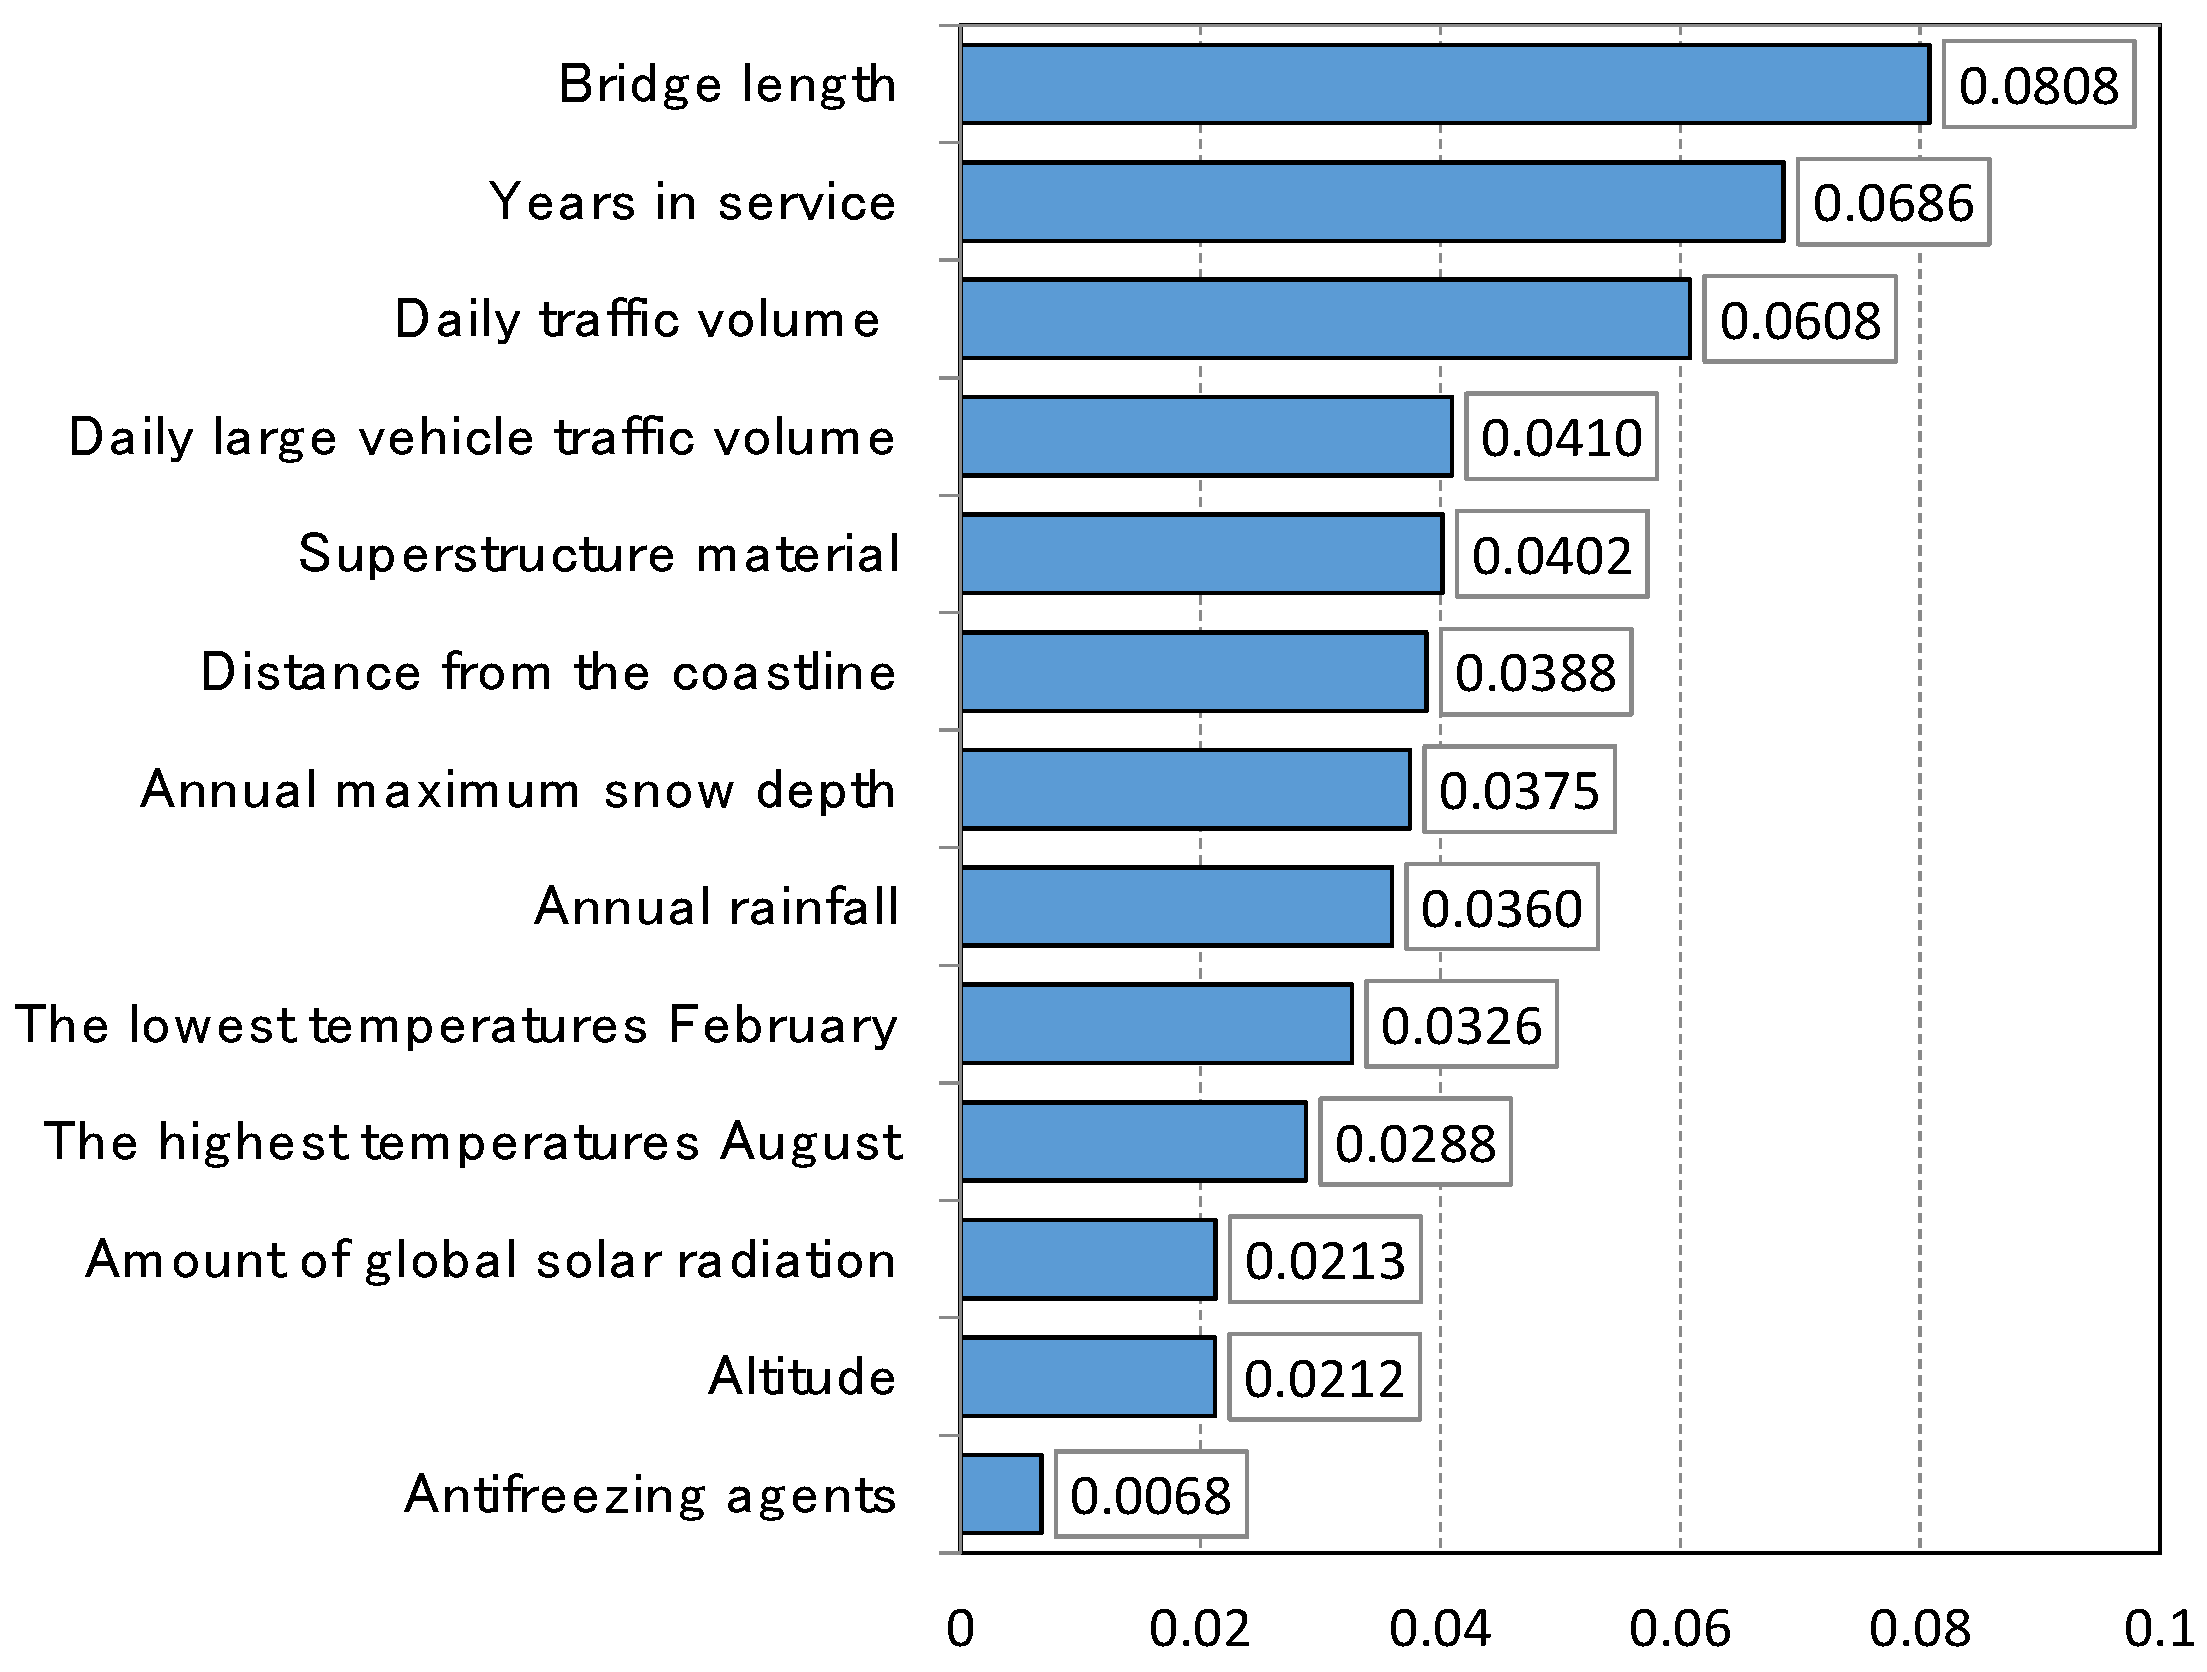
Figure 12 shows the level of influence that each factor had on the deterioration rate of bearings, where the most significant factor was bridge length, followed by years in service, daily traffic volume, and large vehicle traffic volume. These results indicate that traffic volume has a strong influence on the soundness of bearings. According to the category scores for bridge length (
Figure 13), bridge lengths of 15 m or greater accelerate deterioration, and this influence is especially significant with bridge lengths of 50–100 m. Therefore, such bridges require countermeasures to mitigate the associated deterioration. According to the category scores for daily traffic volume (
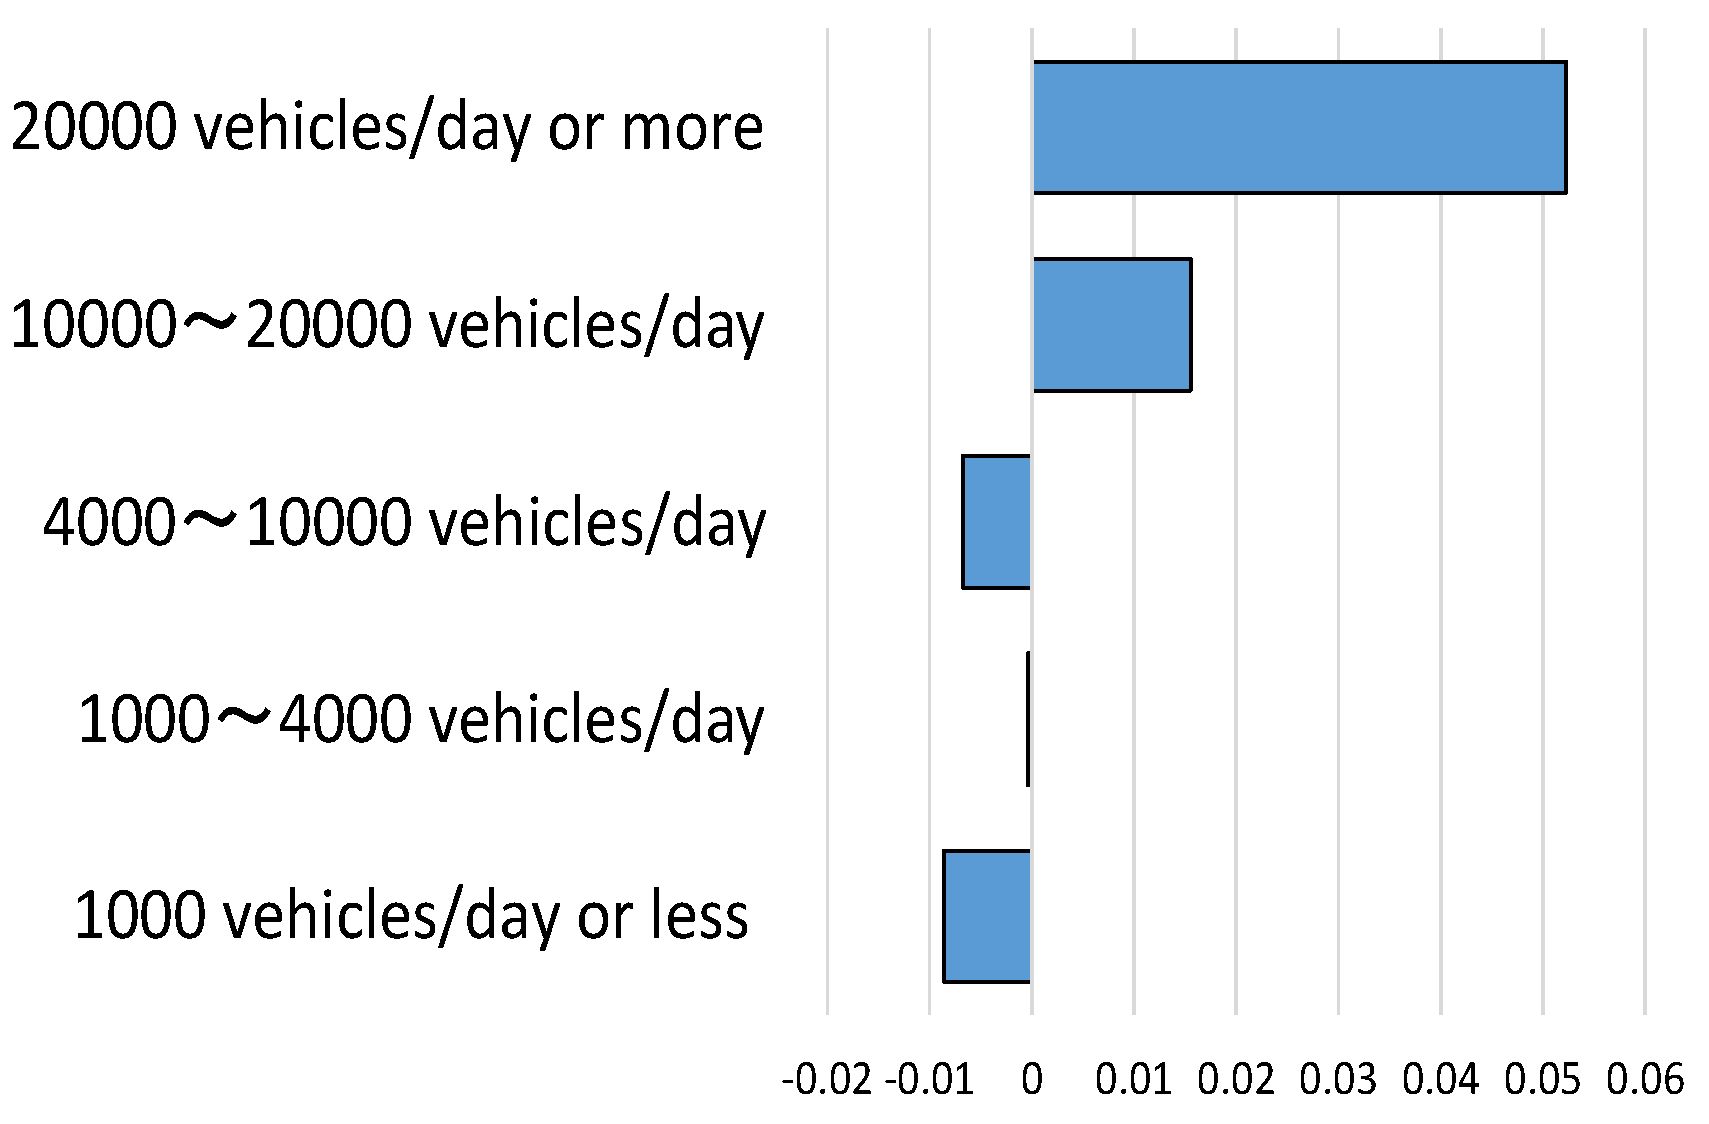
Figure 14), daily traffic volumes of more than 10,000 vehicles/day accelerate the bearing deterioration rate. Furthermore, daily traffic volumes of more than 20,000 vehicles/day have the most accelerating influence on the bearing deterioration rate.
4. Significance of the Factors That Influence the Soundness of Bridges
In
Section 3, the level of influence that environmental factors have on the soundness of bridges was analyzed. This section analyzes the significance of those factors.
4.1. Analysis Methods
We investigated the mean deterioration rates of the levels within each of the environmental factors, taking into account the dispersion of the raw data and determining whether differences among levels were within the margin of error. To determine the margin of error requires an analysis of variance [
29]. The analysis of variance separates the variance of meaningless fluctuations (error fluctuations) and meaningful fluctuations (fluctuations induced by the factor), thus, determining the variance ratios, and then observes whether the fluctuations owing to the factor are sufficiently larger than the margin for error. The analysis of variance can be one-way or multi-factor; in this study, the one-way analysis of variance was adopted, focusing simply on whether there was a significant difference between the mean deterioration rates among the levels within each factor.
4.2. Results of Analysis
An analysis of variance was conducted on the factors that, according to the findings in
Section 3, have a large influence on the deterioration rate of each of the components.
4.2.1. Main Girder Deterioration Rate
The factors with a large influence on the deterioration rate of the main girders were the superstructure material and distance from the coastline; therefore, we analyzed the mean main girder deterioration rates of every level of each of these two factors, as well as the significance of the difference between the means. The superstructure material exhibited significant differences, with a significance level of 1%. The distance from the coastline also exhibited significant differences, with a significance level of 5%. Because both showed significant differences between each level, these factors are considered to influence the deterioration rate of the main girders.
4.2.2. Slab Deterioration Rate
The factors with a large influence on the deterioration rate of slabs were years in service and daily traffic volume; therefore, we analyzed the mean slab deterioration rates of every level of each of these two factors, as well as the significance of the difference between the means. Because years in service and daily traffic volume both exhibited significant differences, with significance levels of 1%, these factors were considered to influence the slab deterioration rate.
4.2.3. Substructure Deterioration Rate
The factors with a large influence on the deterioration rate of sub-structures were annual maximum snow depth and years in service; therefore, we analyzed the mean substructure deterioration rates of every level of each of these two factors, as well as the significance of the difference between the means. The annual maximum snow depth exhibited significant differences between the levels, with a significance level of 1%. However, no significance was seen for years in service; therefore, those fluctuations may have been caused by the margin of error of the data.
4.2.4. Bearing Deterioration Rate
The factors with a large influence on the deterioration rate of bearings were bridge length and daily traffic volume; therefore, we analyzed the bearing deterioration rates of every level of each of the two factors, as well as the significance of the difference between the means. Bridge length exhibited significant differences between the levels, with a significance level of 1%. However, no significance was seen for daily traffic volume; therefore, those fluctuations may have been caused by the margin of error of the data.
5. Environmental Factor Analysis Based on Characteristics of Concrete Beams
As shown in
Figure 3, certain specifications of a bridge such as the materials used for the superstructure as well as the number of years in service have a significant impact on the deterioration rate of the main beam. Therefore, rather than making comparisons between “specifications of the bridge” such as the materials for the superstructure and number of years in service and “environmental conditions” such as the distance from the coast and traffic volume, this chapter classifies data based on the specifications (materials, number of years in service) that have a significant impact on degradation, and perform an analysis on environmental factors. Through this analysis, this chapter aims to quantify the difference in the degree of impact of environmental conditions on bridge degradation by number of years in service. Approximately 80% of the bridges managed by the Ishikawa Prefecture in Japan are made of concrete, and it is important to implement safety measures for the protection of concrete bridges. Therefore, this chapter presents an analysis of the environmental factors that have had an impact on the degradation rate of the concrete bridges that have been in service for at least twenty years, and fall under the management of the Ishikawa Prefecture. The components inspected during periodic bridge inspections by the Ishikawa Prefecture authority include the main beam, floor slab, substructure, and bearings; however, in this chapter, the main beam whose member material is identifiable is considered. Hayashi’s quantification method type I assesses the degree of contribution by an explanatory variable against a target variable. In this case, the degree of impact by environmental factors on the degradation rate of a concrete beam is assessed as a range. This chapter considers environmental factors with respect to the impact they have on the degradation rate of the concrete beam over a number of years in service, and discusses the environmental factors that should be considered at each stage. The constant term (i.e., the average degradation rate) obtained by Hayashi’s quantification method type I, the aggregate value of the degree of impact by each environmental factor (i.e., the aggregate value of the range), and the precision of the analysis (i.e., the multiple regression coefficient) are shown in
Table 3. The average degradation rate was assumed to increase as the number of years in service increases, but the results showed that the average degradation rate was greatest for concrete beams that had been in service for 30–40 years. As shown in
Figure 3, this is due to the ratio of the sample—the soundness has recovered for concrete beams with over 50 years in service, thereby removing samples with significant degradation.
The total range is the sum of the impact (range) of each environmental factor on the degradation rate, which was calculated as an index that represents the degree of variation in degradation rate that results from considering the environmental factors. The total range tends to decrease as the number of years in service increases, indicating that relatively new concrete beams are more prone to the impact of environmental factors. Compared to Chapter 3, which reports on an analysis that was performed without combining conditions across specifications (i.e., by number of years in service, by material type), the multiple regression coefficient, which represents the precision of the analysis, resulted in a higher value when focusing on concrete beams and classifying the impact by the number of years in service. Even the lowest multiple regression coefficient was more than 0.4, and the degradation rate could thus be simulated with greater precision by limiting the target of the number of service years of the bridge. The environmental factors that have an impact on the degradation rate of concrete beams are discussed based on the number of years in service. Ranges obtained by Hayashi’s quantification method type I are shown in
Figure 15,
Figure 16,
Figure 17 and
Figure 18 according to the number of years in service.
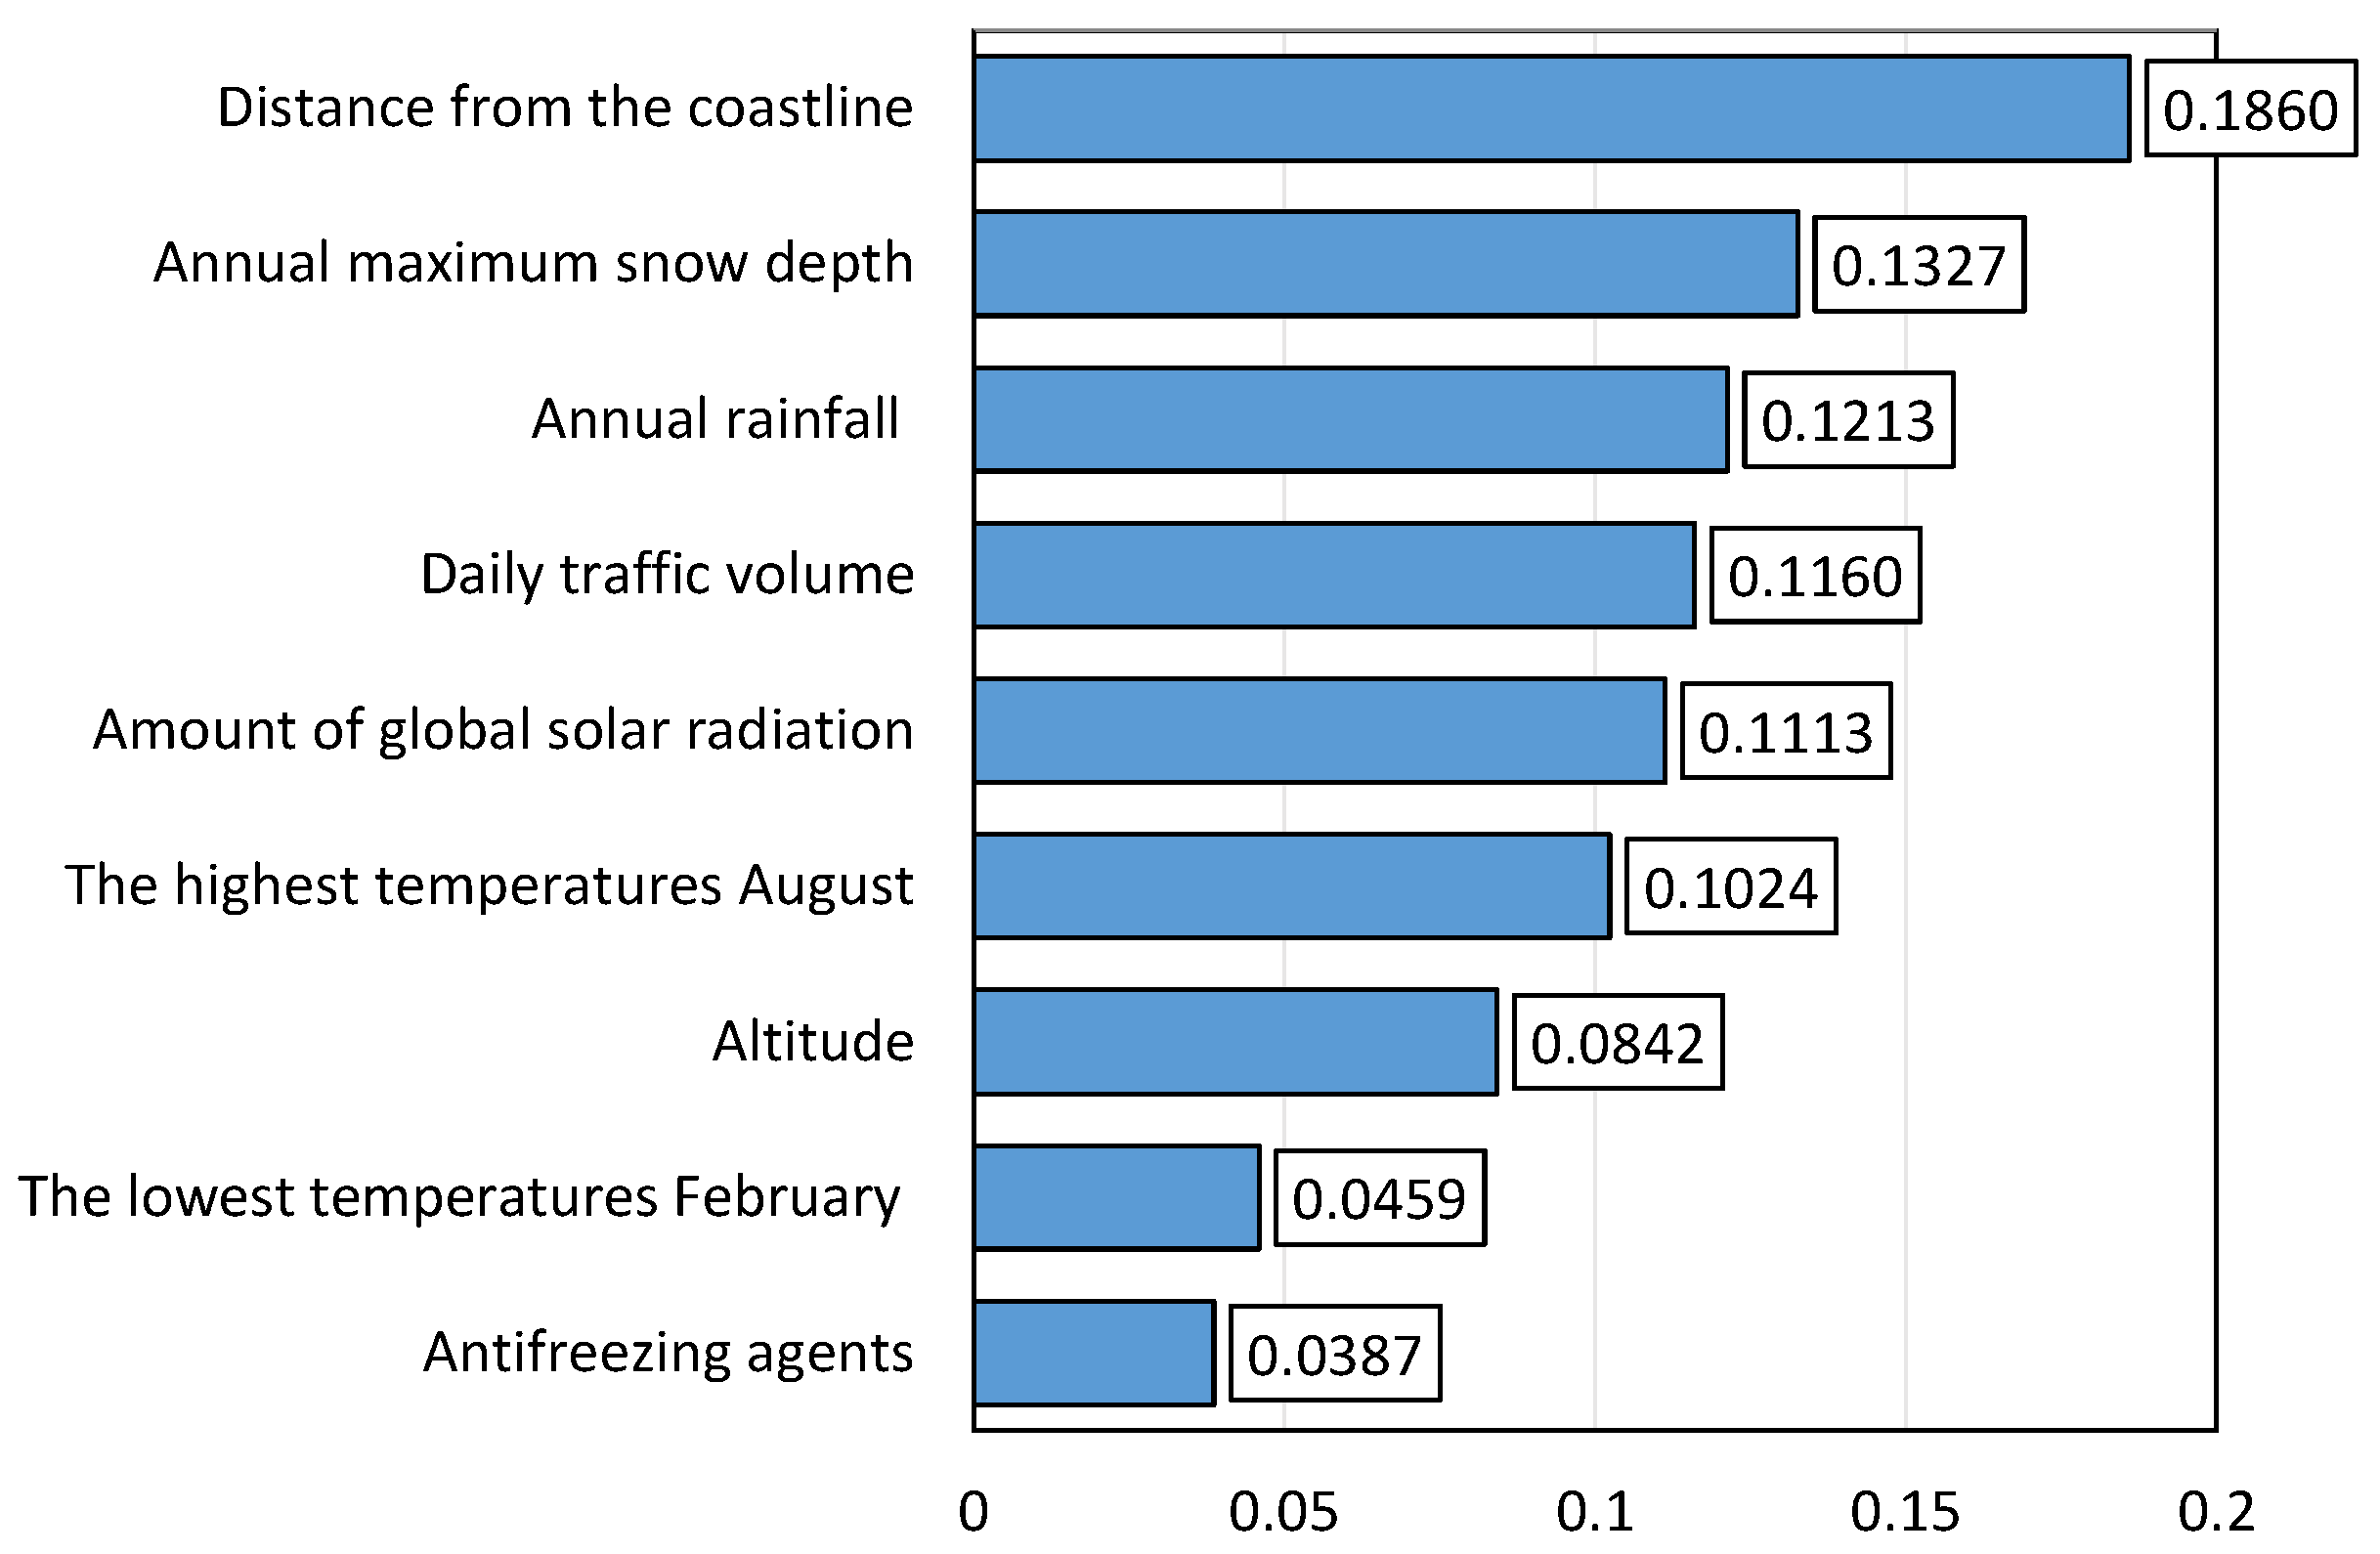
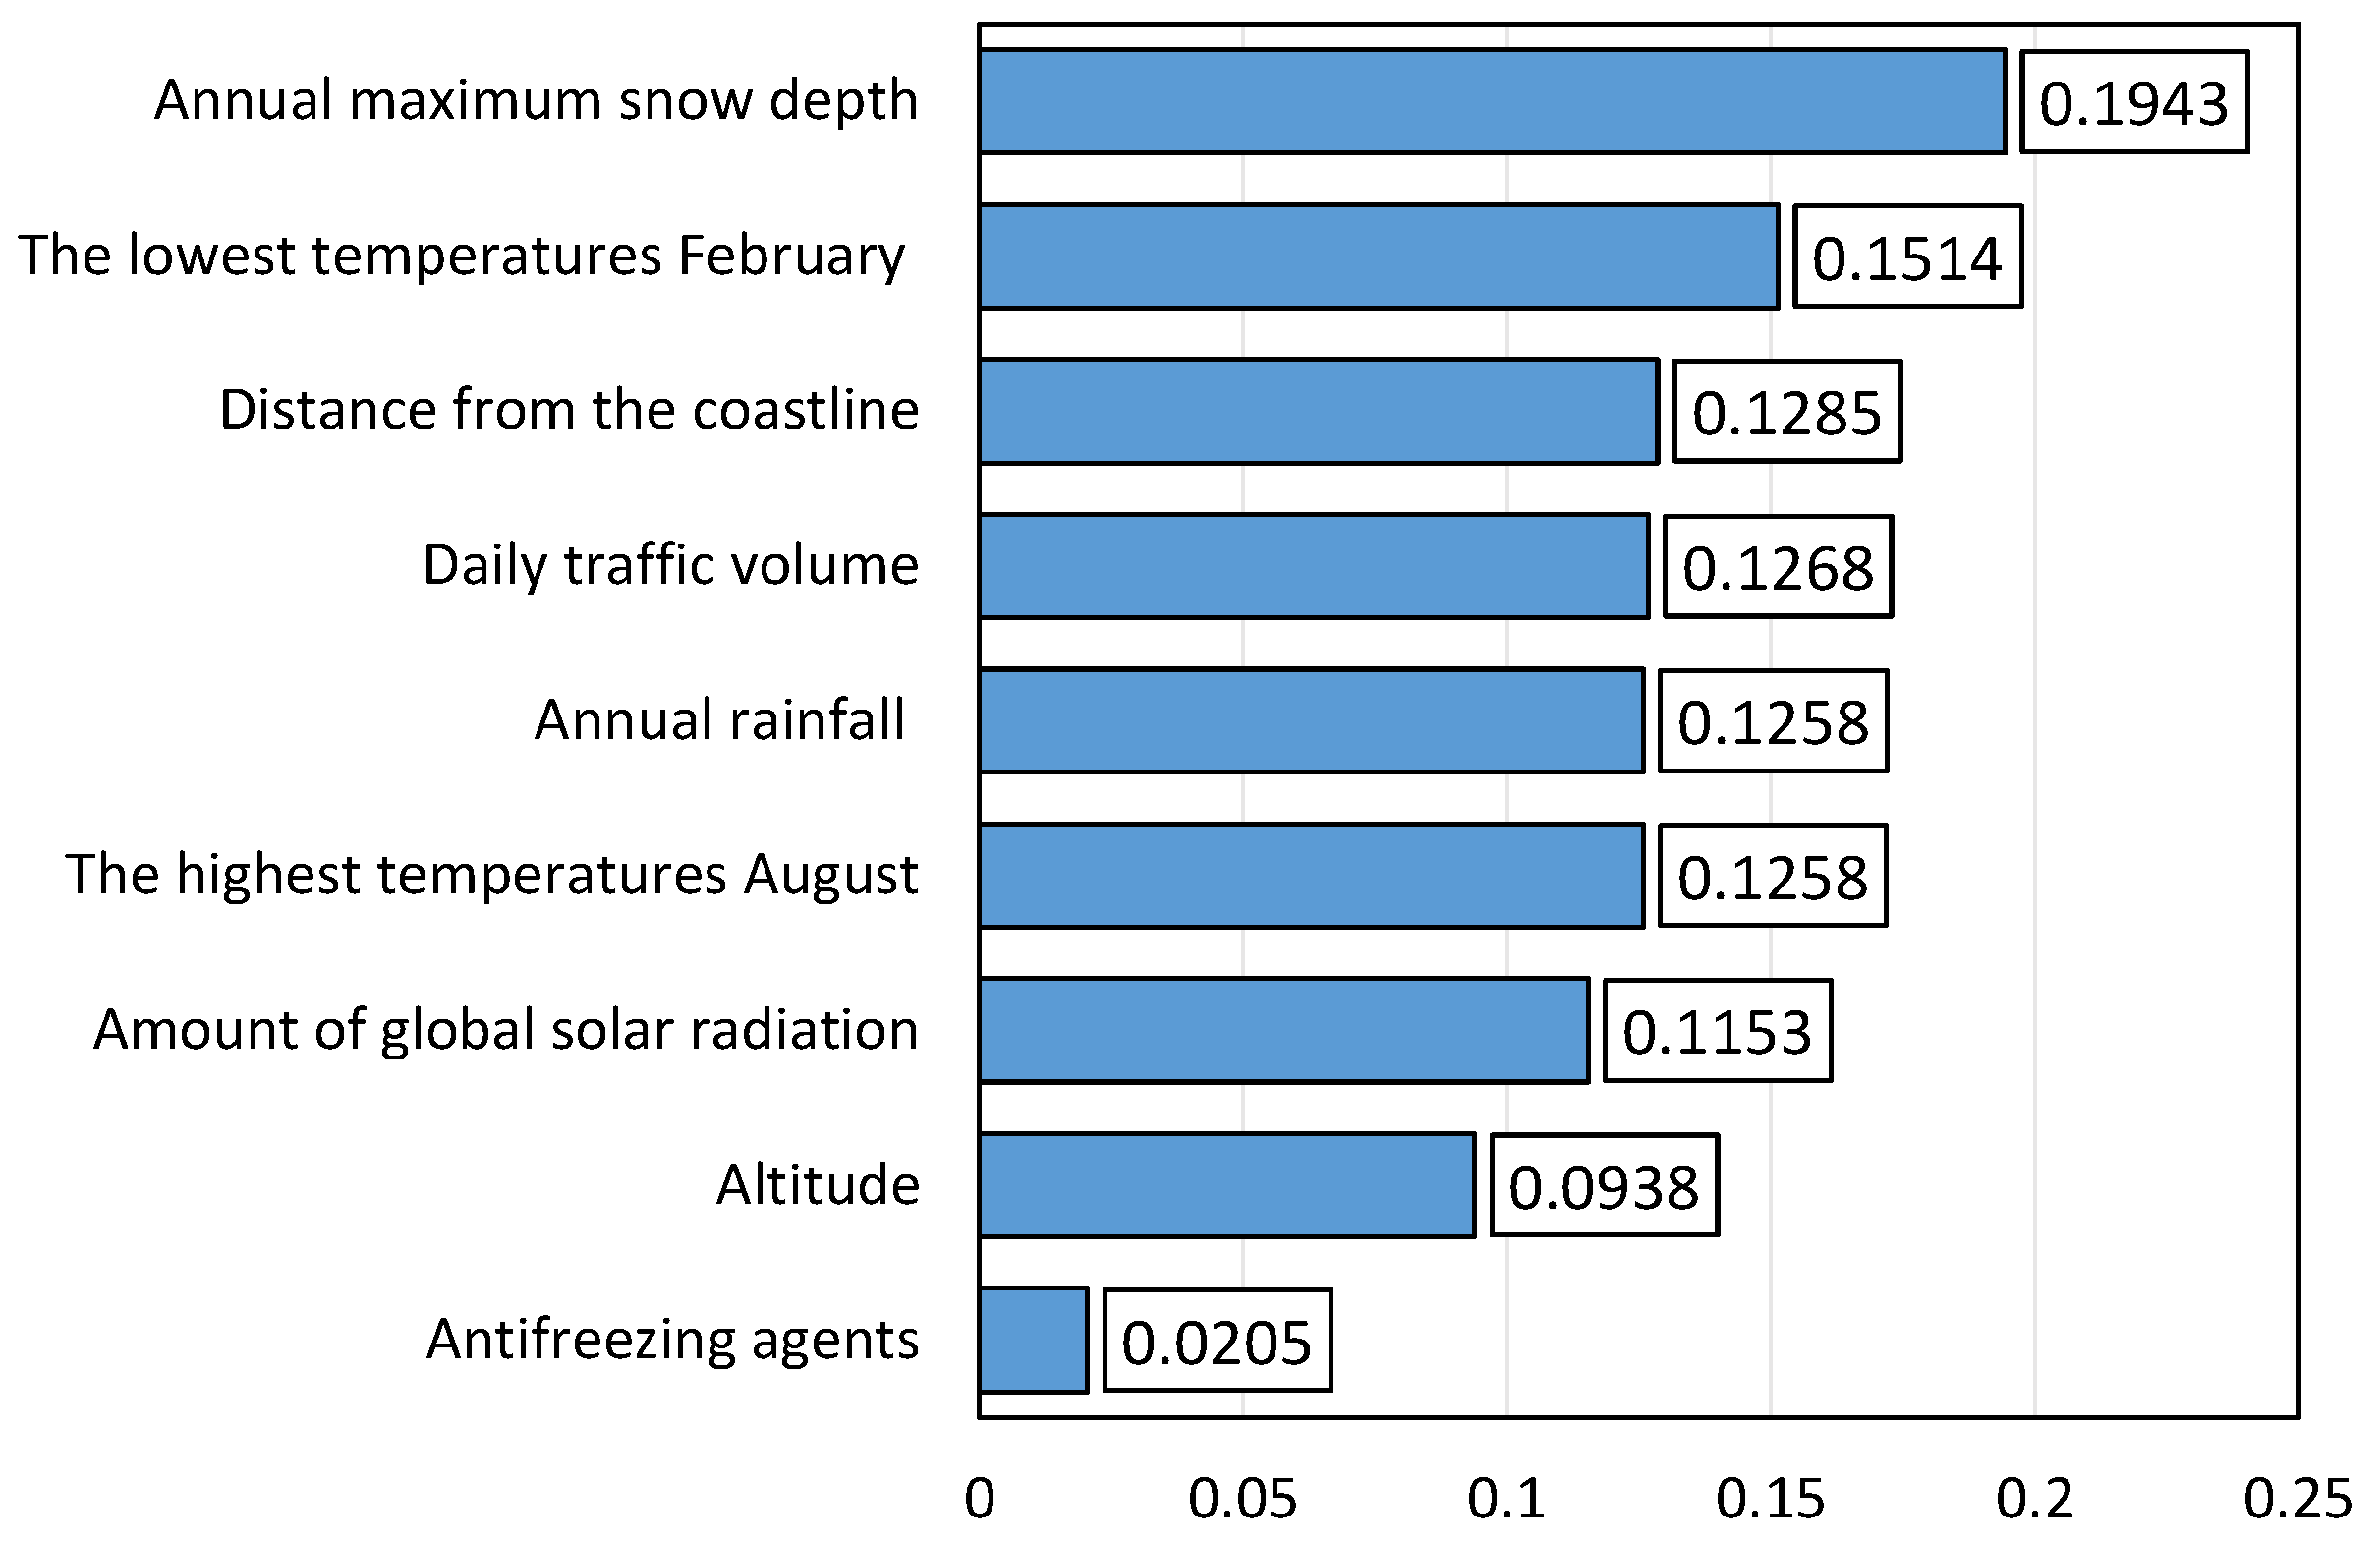
Figure 15 indicates that the annual snowfall with maximum depth had the greatest degree of impact on the degradation rate of concrete beams that had been in service for 20–30 years, followed by the lowest temperature in February and the distance from the coastline.
Figure 16 shows that the distance from the coastline had the greatest degree of impact on the degradation rate of concrete beams that had been in service for 30–40 years, followed by the maximum depth of the annual snowfall and annual precipitation. As shown in
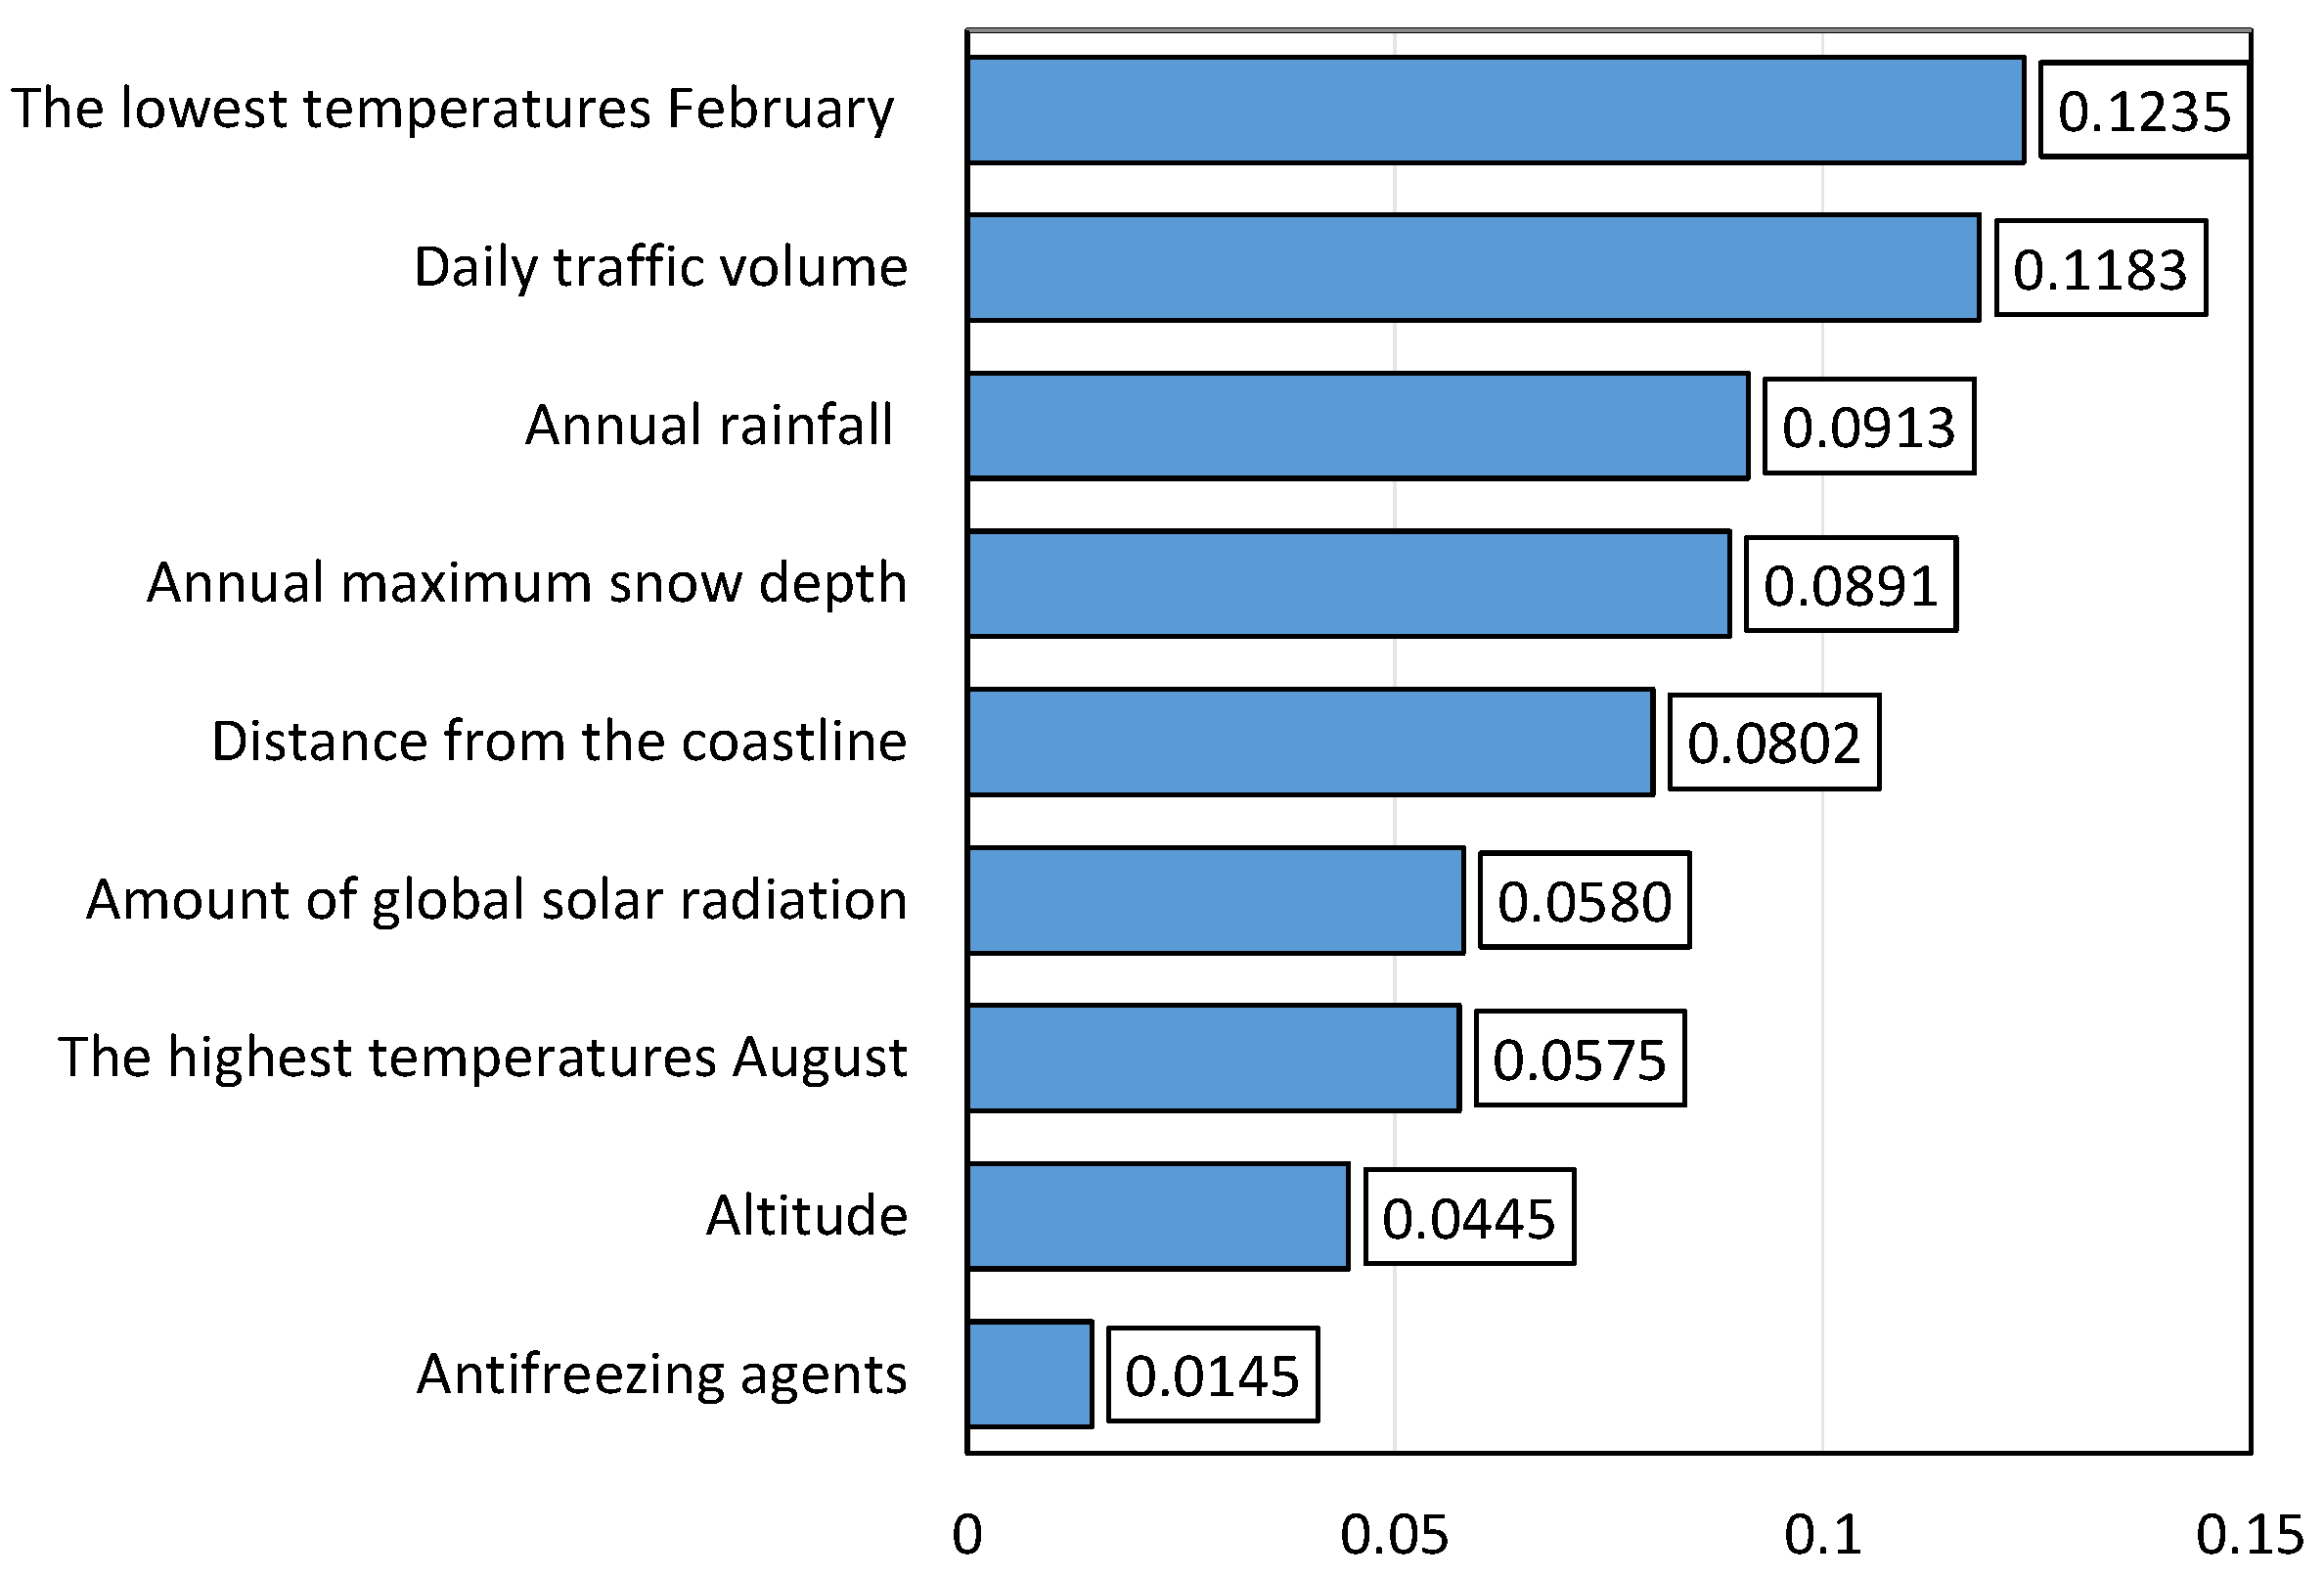
Figure 17, the lowest temperature in February had the greatest degree of impact on the degradation rate of concrete beams that had been in service for 40–50 years, followed by daily traffic volume and annual precipitation.
Figure 18 shows that the lowest temperature in February had the greatest degree of impact on the degradation rate of concrete beams that had been in service for over 50 years, followed by annual precipitation and annual snowfall with the maximum depth. The results showed that the environmental factors that affect degradation rate of a concrete beam vary with the number of years in service, suggesting a need for measures against such factors, which also address the abovementioned considerations.
6. Summary and Future Issues
This study analyzed data from regular bridge inspections, focusing on the environmental conditions that surround bridges, and the factors that influence the soundness of bridges. By calculating an index referred to as the deterioration rate and using inspection data from two bridge inspection cycles, we statistically analyzed the level and significance of the influence exerted by several factors using Hayashi’s quantification method type I and analysis of variance.
Regarding the main girders, the results showed that the superstructure material and distance from the coastline were significant factors affecting the girder deterioration rate, with neither owing to the margin of error of the data. With respect to slabs, the results showed that years in service and daily traffic volume were the most significant factors affecting the slab deterioration rate, with neither owing to the margin of error of the data. Regarding the substructures, the results showed that the annual maximum snow depth and years in service had a large influence; however, through the analysis of variance, we found significant differences in relation to the annual maximum snow depth, but not years in service; therefore, the influence of the latter may have been caused by the margin of error of the data. With respect to bearings, bridge length, years in service, and daily traffic volume, all had large influences; however, the analysis of variance showed no significance difference for daily traffic volume, and therefore, its influence may have been caused by the margin of error of the data. The cumulative results showed that although bridge specifications (superstructure material, bridge length, year of construction) had a large influence on the deterioration rate of each component, the environmental factors also had an equivalent influence. Therefore, environmental factors must be considered when determining the rehabilitation priority of bridges. The results of this study are considered significant because they have clarified which factors have a relatively large impact, according to the range obtained by Hayashi’s quantification type I. The results also clarified which level of each factor is the boundary between positive and negative impacts on the rate of deterioration, which could aid the development of efficient maintenance plans.
This study used the results of periodic inspections required for preventive and conservative maintenance work on road structures. A statistical analysis using Hayashi’s quantification method type I was performed on the environmental factors that have an impact on the degradation rate of the concrete beams managed by the Ishikawa Prefecture, which have been in use for over 20 years. The results showed that the degradation rate, the degree of impact by environmental factors, and the factors that affect the rate all vary with the number of years in service. Therefore, measures against environmental factors must be implemented according to the number of years the bridge has been in service, and preventive and conservative maintenance can be managed efficiently and effectively by raising the priority of repair for environmental factors with a high degree of impact on degradation rate.
In this study, the multiple correlation coefficients were very low. This is because there were many factors that were not considered in this study, such as bridge materials, structure, and design standards. The mechanism of deterioration depends on the construction materials; therefore, an independent analysis of the environmental influences on concrete and steel structures is a topic for future study. Another limitation of this study is that only the bridges in Ishikawa Prefecture were analyzed, and a comparison between at least two regions with different environments and/or climates is necessary to analyze the influence of environmental factors in detail. In addition, a bridge’s repair history also affects the rate of deterioration; however, in this study, data on repair history were insufficient, and thus, this parameter was not considered.
Considering that this study focused only on bridges managed by Ishikawa Prefecture, the results are insufficient for setting the levels for each environmental factor, which presents several challenges for future research. First, bridges from several prefectures in different environments should be compared. Second, appropriate levels for each environmental factor should be determined. Finally, the inclusion of incomplete historical repair data is another future research challenge. The results of these studies should be used to propose methods of predicting deterioration and determining rehabilitation priorities. It is also necessary to compare the specific characteristics of concrete bridges constructed in Japan (type of concrete, type of reinforcement, additives, construction techniques, etc.) with those in other parts of the world and to study the factors that contribute to deterioration.


