Article

Joint Layout Design: Finding the Strongest Connections within Segmental Masonry Arched Forms

Department of Structures for Engineering and Architecture, University of Naples Federico II, Via Forno Vecchio 36, 80134 Naples, Italy
*
Author to whom correspondence should be addressed.
Infrastructures 2022, 7(1), 9; https://doi.org/10.3390/infrastructures7010009
Submission received: 10 December 2021 / Revised: 5 January 2022 / Accepted: 6 January 2022 / Published: 9 January 2022
(This article belongs to the Special Issue Multi-Hazard Approach to Infrastructures Risk Reduction)

Abstract

:
Segmental arched forms composed of discrete units are among the most common construction systems, ranging from historic masonry vaults to contemporary precast concrete shells. Simple fabrication, transport, and assembly have particularly made these structural systems convenient choices to construct infrastructures such as bridges in challenging environmental conditions. The most important drawback of segmental vaults is basically the poor mechanical behaviour at the joints connecting their constituent segments. The influence of the joint shape and location on structural performances has been widely explored in the literature, including studies on different stereotomy, bond patterns, and interlocking joint shapes. To date, however, a few methods have been developed to design optimal joint layouts, but they are limited to extremely limited geometric parameters and material properties. To remedy this, this paper presents a novel method to design the strongest joint layout in 2D arched structures while allowing joints to take on a range of diverse shapes. To do so, a masonry arched form is represented as a layout of potential joints, and the optimization problems developed based on the two plastic methods of classic limit analysis and discontinuity layout optimization find the joint layout that corresponds to the maximum load-bearing capacity.

1. Introduction

1.1. Segmentation of Masonry Curved Structures throughout History

Curved structural forms, including shells, domes, vaults, and arches, are strong geometries [1] that can bear large amounts of external loads through the optimal distribution of materials. These complex shapes usually need to be segmented into smaller parts to simplify fabrication [2,3], facilitate transport [4], and improve assembly [5,6]. Historic segmental vaults and domes were composed of masonry tiles, bricks, or stone blocks and were frequently used in the built environments to span large spaces. Furthermore, historically, masonry (and particularly stone) arches were used to construct bridges in the challenging environmental conditions stayed functional in the transport networks for decades or even centuries [7].
Later, masonry arched forms evolved in the form of precast concrete shells widely applied in contemporary architecture, engineering, and construction (AEC) industry. Precise quality control during the manufacturing and fabrication process, rapid assembly, and a relatively low waste production during the construction are the main advantages of the precast concrete when compared to the one cast in situ [8]. Furthermore, advances in computational fabrication such as additive manufacturing with concrete or digital stereotomy of stones map a promising future for the sustainable design and construction of freeform segmental masonry arched forms.
Basically, segmenting a structure can result in weakening its response to loads; e.g., the load that it bears may decrease since a continuum is broken up into segments. To remedy this situation, the constituent blocks of a segmental structure can be kept together, using fillers such as mortars usually applied in historic masonry vaults, and grouts and epoxy resins implemented between the precast concrete blocks. The fillers, however, can be eroded over time and reduce the tensile strength of masonry, as shown in [9]. Therefore, several analyses carried out on historic masonry buildings [10,11] as well as precast concrete structures [8] simply consider zero tensile resistance at joints as if they are mortarless (dry) joints. Furthermore, the typical strategies to improve the masonry capacity are the consolidation techniques with tie-rods or strength anchors [12,13] or the use of tie roads in particular to improve the stability of vaults or support walls [14].
The position of the joints in an assemblage of units and their shape can also significantly affect the structural behaviour. Apparently, finding the right place and shapes for the joints can improve the assemblage load-bearing capacity. In this case, even if the fillers between the joints or the tie rods connecting the segments are eroded, the joint resistance does not significantly change. As a result, finding the appropriate joint shape and layout can be considered a long-term strategy to segment a vault without considerable loss of its structural load bearing capacity.
The influence of the joint shape and location on the mechanical behaviour of segmental assemblages has been widely considered in the literature. In the context of historic masonry vaults, it has been observed that different brick bond patterns determining the joint shape and location may have considerably different load-bearing capacities even when the joints are considered cohesionless [10]. One straightforward example is a hemispheric dome with stacked and running bond patterns. Carrying its self-weight, the former should have at least the minimum thickness-to-radius ratio of 0.0425 according to [15], while the latter can remain stable with a thickness close to zero if the friction coefficient at the joints is considered large enough [15,16]. Along the same line, the structural performance of different types of masonry vaults, including cross-vaults, barrel vaults and domes, constructed by bond patterns such as running bond and herringbone patterns, have been extensively investigated in the literature, as reviewed by Boni et al. [17]. The influence of bond patterns, such as the English bond [18,19] and herringbone patterns [20], as well as that of the orientation of the masonry apparatus [21], on the homogenization techniques implemented in finite element analyses has also been considered for both flat and arched form assemblages.
Stereotomy (the art of cutting stones) is another common historic construction method that determines the joint layout. For example, considering the friction of the joints to be finite, several studies were carried out to find the minimum thickness of semi-circular [22,23,24], elliptical [22], corbel, and triangular arches [25] with different stereotomy models such as those with radial, vertical, and horizontal orientations [17]. Another good example carried out by Forgács et al. [26] focused on the influence of three stereotomy techniques of (1) the false skew arch, (2) the helicoidal method, and (3) the logarithmic method (Figure 1) on the load bearing capacity of a skew masonry arch subjected to its weight and a uniformly distributed vertical load parallel to its abutments. The study showed that the logarithmic skew arches have the highest load bearing capacity, even though they were not so popular in the 19th century, due to the complex geometry of the constituent blocks, which needed a demanding stereotomy at the time. As presented in the following, such construction constraints, though, have been gradually eliminated through the emergence of the digital fabrication techniques. In addition, innovative production techniques [27] nowadays allow new perspectives to design units with customised shape and with a reduced economic and environmental costs [28].

1.2. Innovative Design and Construction Methods for Masonry Curved Structures

Contemporary manufacturing techniques, mostly developed based on the casting processes, facilitated fabrication of clay and concrete blocks with complex geometries. For example, most of the precast concrete panels have non-planar faces, allowing them to be simply interlocked to each other. Similarly, interlocking masonry blocks are commonly used to construct the contemporary masonry walls. Interlocking joints have usually one or several keys (locks) with, e.g., rectangular, trapezoidal, and circular cross-sections. Recently, several works have addressed the relationship between different joint shapes (keys’ shape and number) and the load bearing capacity of structures, including simple flat walls [29,30,31,32,33], cylindrical assemblages [34], and arched form bridges with shear keys [8,35].
However, these works focused their investigation on the influence of a limited number of geometric parameters of the modular interlocking blocks, since the current manufacturing industry has been mostly developed based on casting processes using modular casts. On the other hand, recent transformations in digital manufacturing, including additive manufacturing techniques to print masonry blocks [36,37] and concrete panels with parallel [38,39] and non-parallel [40] layers, as well as cutting stones with CNC machines [41], have enabled us to construct segmental shells such that each of their constituent blocks has a unique shape [38,39,40,41,42,43,44,45]. These promising manufacturing advancements have motivated architects and industrial designers, as well as civil, mechanical, and industrial engineers, both in academia and industry, to develop the design methods generating segmental assemblages composed of segments with complex shapes optimizing fabrication, construction process, etc. [1,2,3,4,5,6].
On the other hand, to date, very few research works have paved the way for the development of methods to design the specific shape and location for each individual joint with the aim to maximize the load an assemblage can bear. Rippmann [46] showed that the bearing capacity of a compression-only, rigid, and frictionless body does not change after being tessellated by the joints normal to the flow of axial forces. The authors of this paper developed SiDMACIB, in the frame of a MCSA_IF [47], as one of the first efforts to design structurally sound interlocking blocks with finite shear and friction. In that project, the static approach of limit analysis was extended to the interlocking joints with orthotropic sliding behaviour governed by combined frictional and material shear strength properties. A method was developed to quantify the infeasibility of interlocking assemblages due to the sliding failure, namely the sliding infeasibility [48,49]. Additionally, an optimization method was developed in which the shape of the interlocking joints was automatically adjusted to minimize the sliding infeasibility [50]. These results, however, remain limited to corrugated interlocking faces at this stage.

1.3. Research Objectives

The objective of this paper is to find the strongest joints of a curved structure, which can take on a wide range of shapes. Given the overall geometry of a structure and a loading scheme, this work investigates the joint shapes and locations (i.e., joint layout) providing the strongest connections between the blocks so that the load-bearing capacity of the structure is maximized. To this aim, limit analysis [51] and discontinuity layout optimization (DLO) [52] are adopted to develop two optimization methods that find the strongest joint layout within a masonry structure.
These fall into the discontinuous analysis methods abstracting structural systems to solid and interface elements, which basically are the planes of weakness within a model [53]. It is worth highlighting that finite-element (FE) [54] and discrete-element (DE) [55] approaches are based on the deformability of solids, while interfaces between the solids make jumps in the possible stress–strain rate fields. On the contrary, the two considerably computational efficient and yet perfectly accurate methods of limit analysis and DLO set the solids to be fully rigid while the stresses are solely distributed on the potential failure interfaces. These two methods allow calculating the maximum load factor by which the internal forces on the interfaces are statically admissible (lower bound theorem or static approach) or the minimum load factor by which the flow rule at the interfaces is met (upper bound theorem or kinematic approach). The main difference between the static approach of the classic limit analysis (used in this paper) and DLO is that the former solves the equilibrium problem for every rigid element spanning the interfaces to obtain the stress state at the interfaces, while the latter solves the equilibrium problem for each individual interface (discontinuity) so that the forces at the endpoints of an interface equilibrate the shear and normal forces acting on that interface as well as the external normal and tangential forces applied to it [52].
Using the limit analysis approach, a continuum can be represented by a limited number of interfaces where the major cracks in an assemblage may occur, as proposed by macro-block [56,57] and NURBS-based [58] limit analyses; as an alternative, the continuum can be represented by several interfaces considered as joints between the constituent units of an assemblage [59,60] as well as by potential failure planes within a micro-block at which the unit may crack [48,61]. Then, an assemblage of blocks with finite shear and tensile resistances can be represented by a set of so called “internal interfaces” within the constituent blocks (depicted in red dashed lines in Figure 2b), and “peripheral interfaces” at the boundary of those blocks (depicted in green continuous lines in Figure 2b). The peripheral interfaces are in fact joints between the blocks (Figure 2c), and from now on, only the former name is used in this paper.
Assuming an overall geometry with a network of interfaces (depicted in blue dotted lines in Figure 2a), the designer can choose the peripheral ones between the constituent blocks, so that the rest of the interfaces are taken as the internal interfaces within the blocks. Different segmental models can then be presented as different sets of internal and peripheral interfaces with different load-bearing capacities. This paper in fact explores a set of internal and peripheral interfaces providing the maximum load bearing capacity as the strongest segmental model.
Apparently, this approach is highly mesh-dependent; i.e., the final result is fully dependent on the initial prescribed network of interfaces. Therefore, by increasing the number of interfaces, the more accurate collapse load would be obtained. However, in classic limit analysis, the number of interfaces is rather limited since, as explained above, they are constrained to be at the boundaries of the prescribed rigid solid elements. Instead, by formulating the equilibrium problem of each interface independently of its adjacent elements, DLO can involve a large number of interfaces in the optimization algorithm. This method first propagates a large number of nodes over a continuum and then considers every line connecting two arbitrary nodes to be a potential failure interface, and that considerably increases the number of interfaces involved [52]. Evidently, increasing the number of interfaces by implementing DLO allows us to expand the search space of the segmentation problem, increasing the accuracy of the results.
In the following, Section 2 introduces a segmentation method to find the strongest joint layout for a 2D problem. Giving some simple examples, this section first sets up a shape exploration approach showing the collapse load factors for different sets of internal and peripheral interfaces obtained by the lower bound theorem of limit analysis. Then, an optimization algorithm is developed based on the limit analysis model to find a set of internal and peripheral interfaces with the maximum load-bearing capacity. This section finally presents another segmentation algorithm developed based on DLO to allow exploring the optimal joint layout among the larger number of given interfaces. Section 3 demonstrates the application of the proposed segmentation method to find the optimally segmented semi-circular arch for various friction angles. In the end, the conclusions are provided in Section 4.

2. Joint Layout Optimization

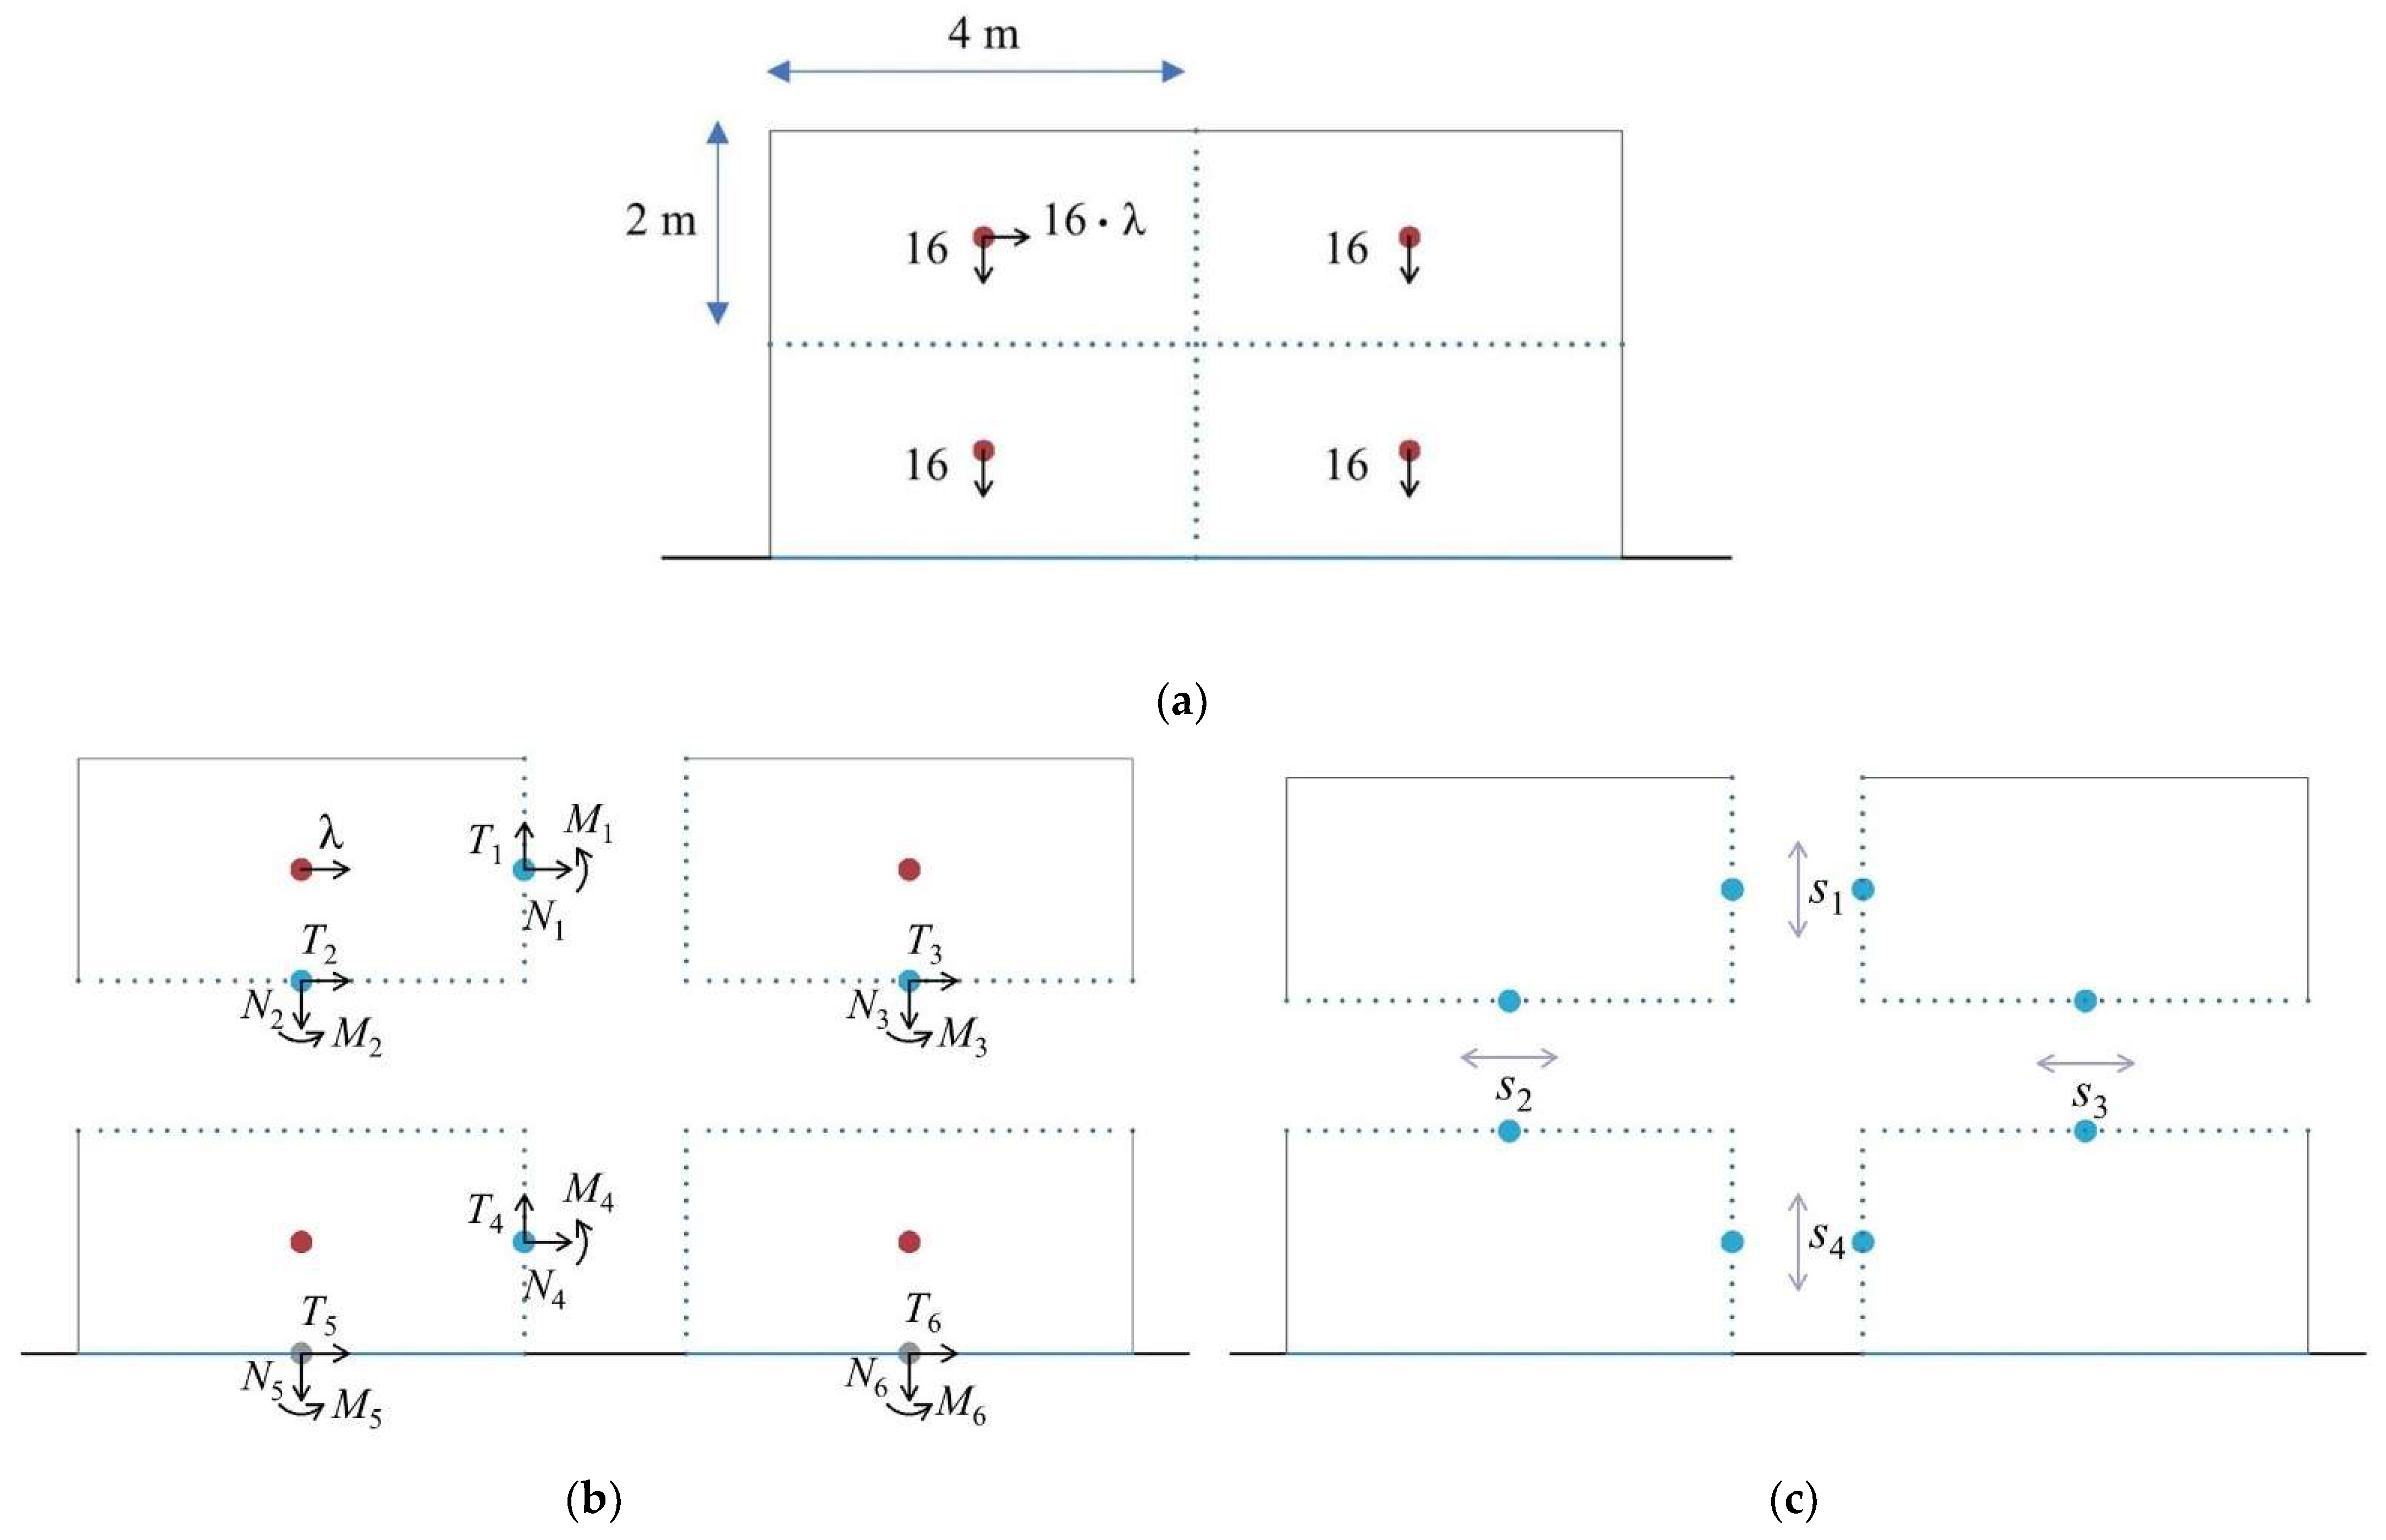
2.1. Load Bearing Capacity of a Segmental Model

In this section, the concept of the proposed segmentation method is presented for a simple 2D problem, for which the joint layout optimization is then developed in Section 2.2 and Section 2.3. For the sake of an easy explanation of the segmentation concept, this example is governed by the Tresca yield criterion (weightless cohesive material), involving shear resistances independent of normal forces [62]. The method, however, is easily extendable to include the Coulomb’s yield criterion, as presented in Section 3, to segment a semi-circular arch.
To find the best location and shape for its joints, the given unsegmented geometry of a structure is abstracted to a number of interfaces (segmenting lines), considered as potential joints. Two sets of interfaces are introduced, i.e., internal and peripheral interfaces, and internal forces and bending moments are applied to their centroid. These interfaces are spanned by rigid elements whose centroids are subjected to external forces (dead and live loads). All the segmenting lines are made of the same no-tension materials with finite shear. Adopting the Tresca model, the shear resistance of interface k is s, …, lk, where s is the shear strength of the interface and lk is length of the interface, whether internal or peripheral. The shear strength of an internal interface (within a segment) is equal to the segment material shear strength si, while the shear strength of a peripheral interface (e.g., mortared joint) is equal to the mortar shear strength sp. It is worth noting that in this paper, ‘resistance’ refers to the resultant force/moment on the overall interface, while ‘strength’ refers to the interfacial material property per unit length.
Based on the choice of internal or peripheral interface for each of them, different configurations of joints (represented by peripheral interfaces) can be assumed. The load bearing capacity of each configuration is assessed using the lower bound approach of limit analysis and the convex contact formulation [51], and the best configuration will be that providing the closest solution to the unsegmented structure.
Figure 3 demonstrates a simple example of a rectangular continuum with four blue dotted segmenting lines, while the segments can be convex or concave. As introduced above, when the model is discretised along a segmenting line, this line acts as a peripheral interface shared between two segments (green continuous lines in Figure 3). Otherwise, the segmenting line can simply be taken as an internal interface within a segment with zero tensile and finite shear resistance (red dashed lines in Figure 3).
Applying the lower bound theorem of limit analysis and the convex contact formulation [51], the internal forces and moments at the centroid of the internal and peripheral interfaces for each assumed configuration can be found by solving the problem formulated as:
{ max λ s u b j e c t e d   t o : λ ·   L + A · f =   D N k   0 | M k | 0.5   N k · l k   k   p e r i p h e r a l   i n t e r f a c e s   | T k |     s p · l k   k i n t e r n a l   i n t e r f a c e s   | T k |     s i · l k   k s u p p o r t s     | T k |     s b · l k
where λ is the collapse load factor; L and D, respectively, are the vectors of live and dead loads, applied to the centroids of the solid elements among the segmenting lines; f is the vector of internal forces and moments; A is the equilibrium coefficient matrix; for each interface k, Nk, Tk, and Mk are normal and tangential forces and bending moment at the interface centroid, respectively; and sp, si, and sb are the shear strengths of the peripheral, internal, and supporting interfaces, respectively.
For the load condition illustrated in Figure 4, when sp = 0 N/m, si = 1 N/m, and sb = 1 N/m, the obtained λ and internal forces (in Newton) for the unsegmented and one of the segmental models is reported in Figure 4. This problem, as well as all the other examples provided in Section 2 and Section 3, have been solved by MATLAB’s linprog function, developed to solve linear programming problems.
Given the same loading scheme and material properties, the computed λ for all the possible configurations of the segmental model, named Ep1 to Ep12, are presented in Table 1. It is evident that among them, only Ep4 has the same load factor as the unsegmented model.
Apparently, Ep4 is the strongest segmental model for the chosen loading scheme illustrated in Figure 4. Changing the load condition, e.g., through negation of the lateral force, the load factor of Ep4 becomes zero. This means that the ideal segmental configuration should be strong enough against several loading schemes. It is worth noting that this is a general challenge in various structural shape and topology optimization problems. This issue is however out of scope of this paper.

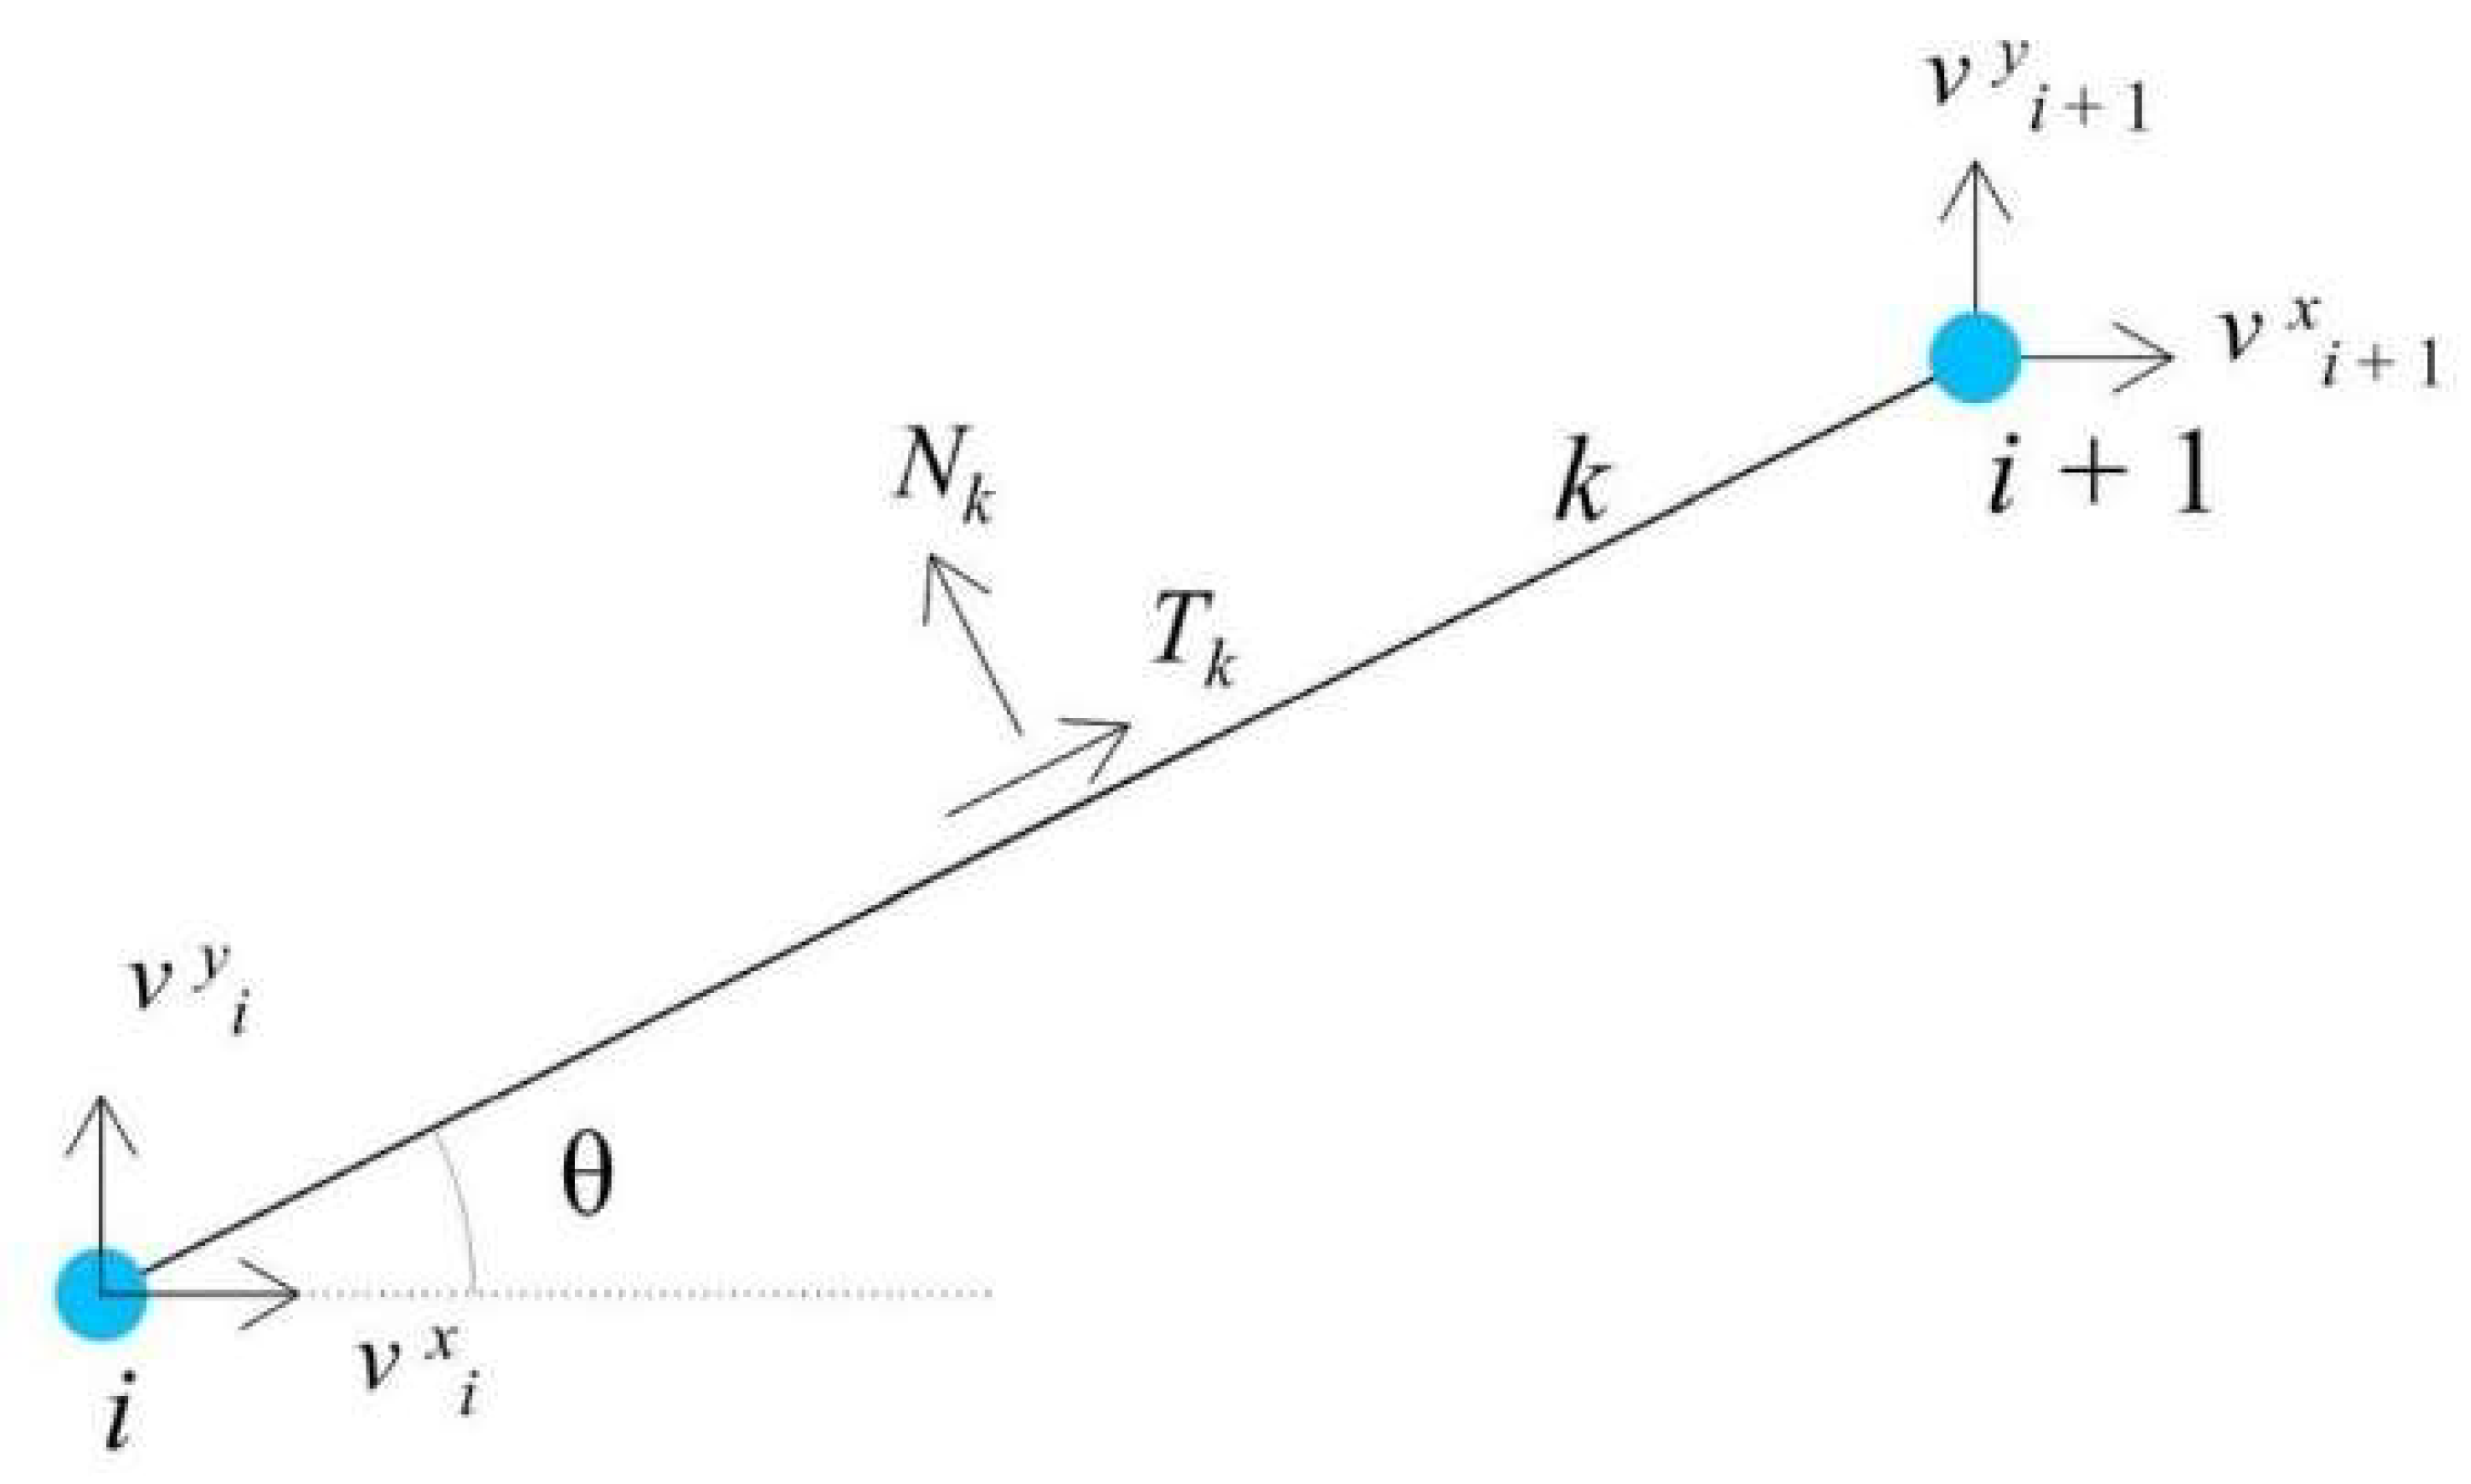
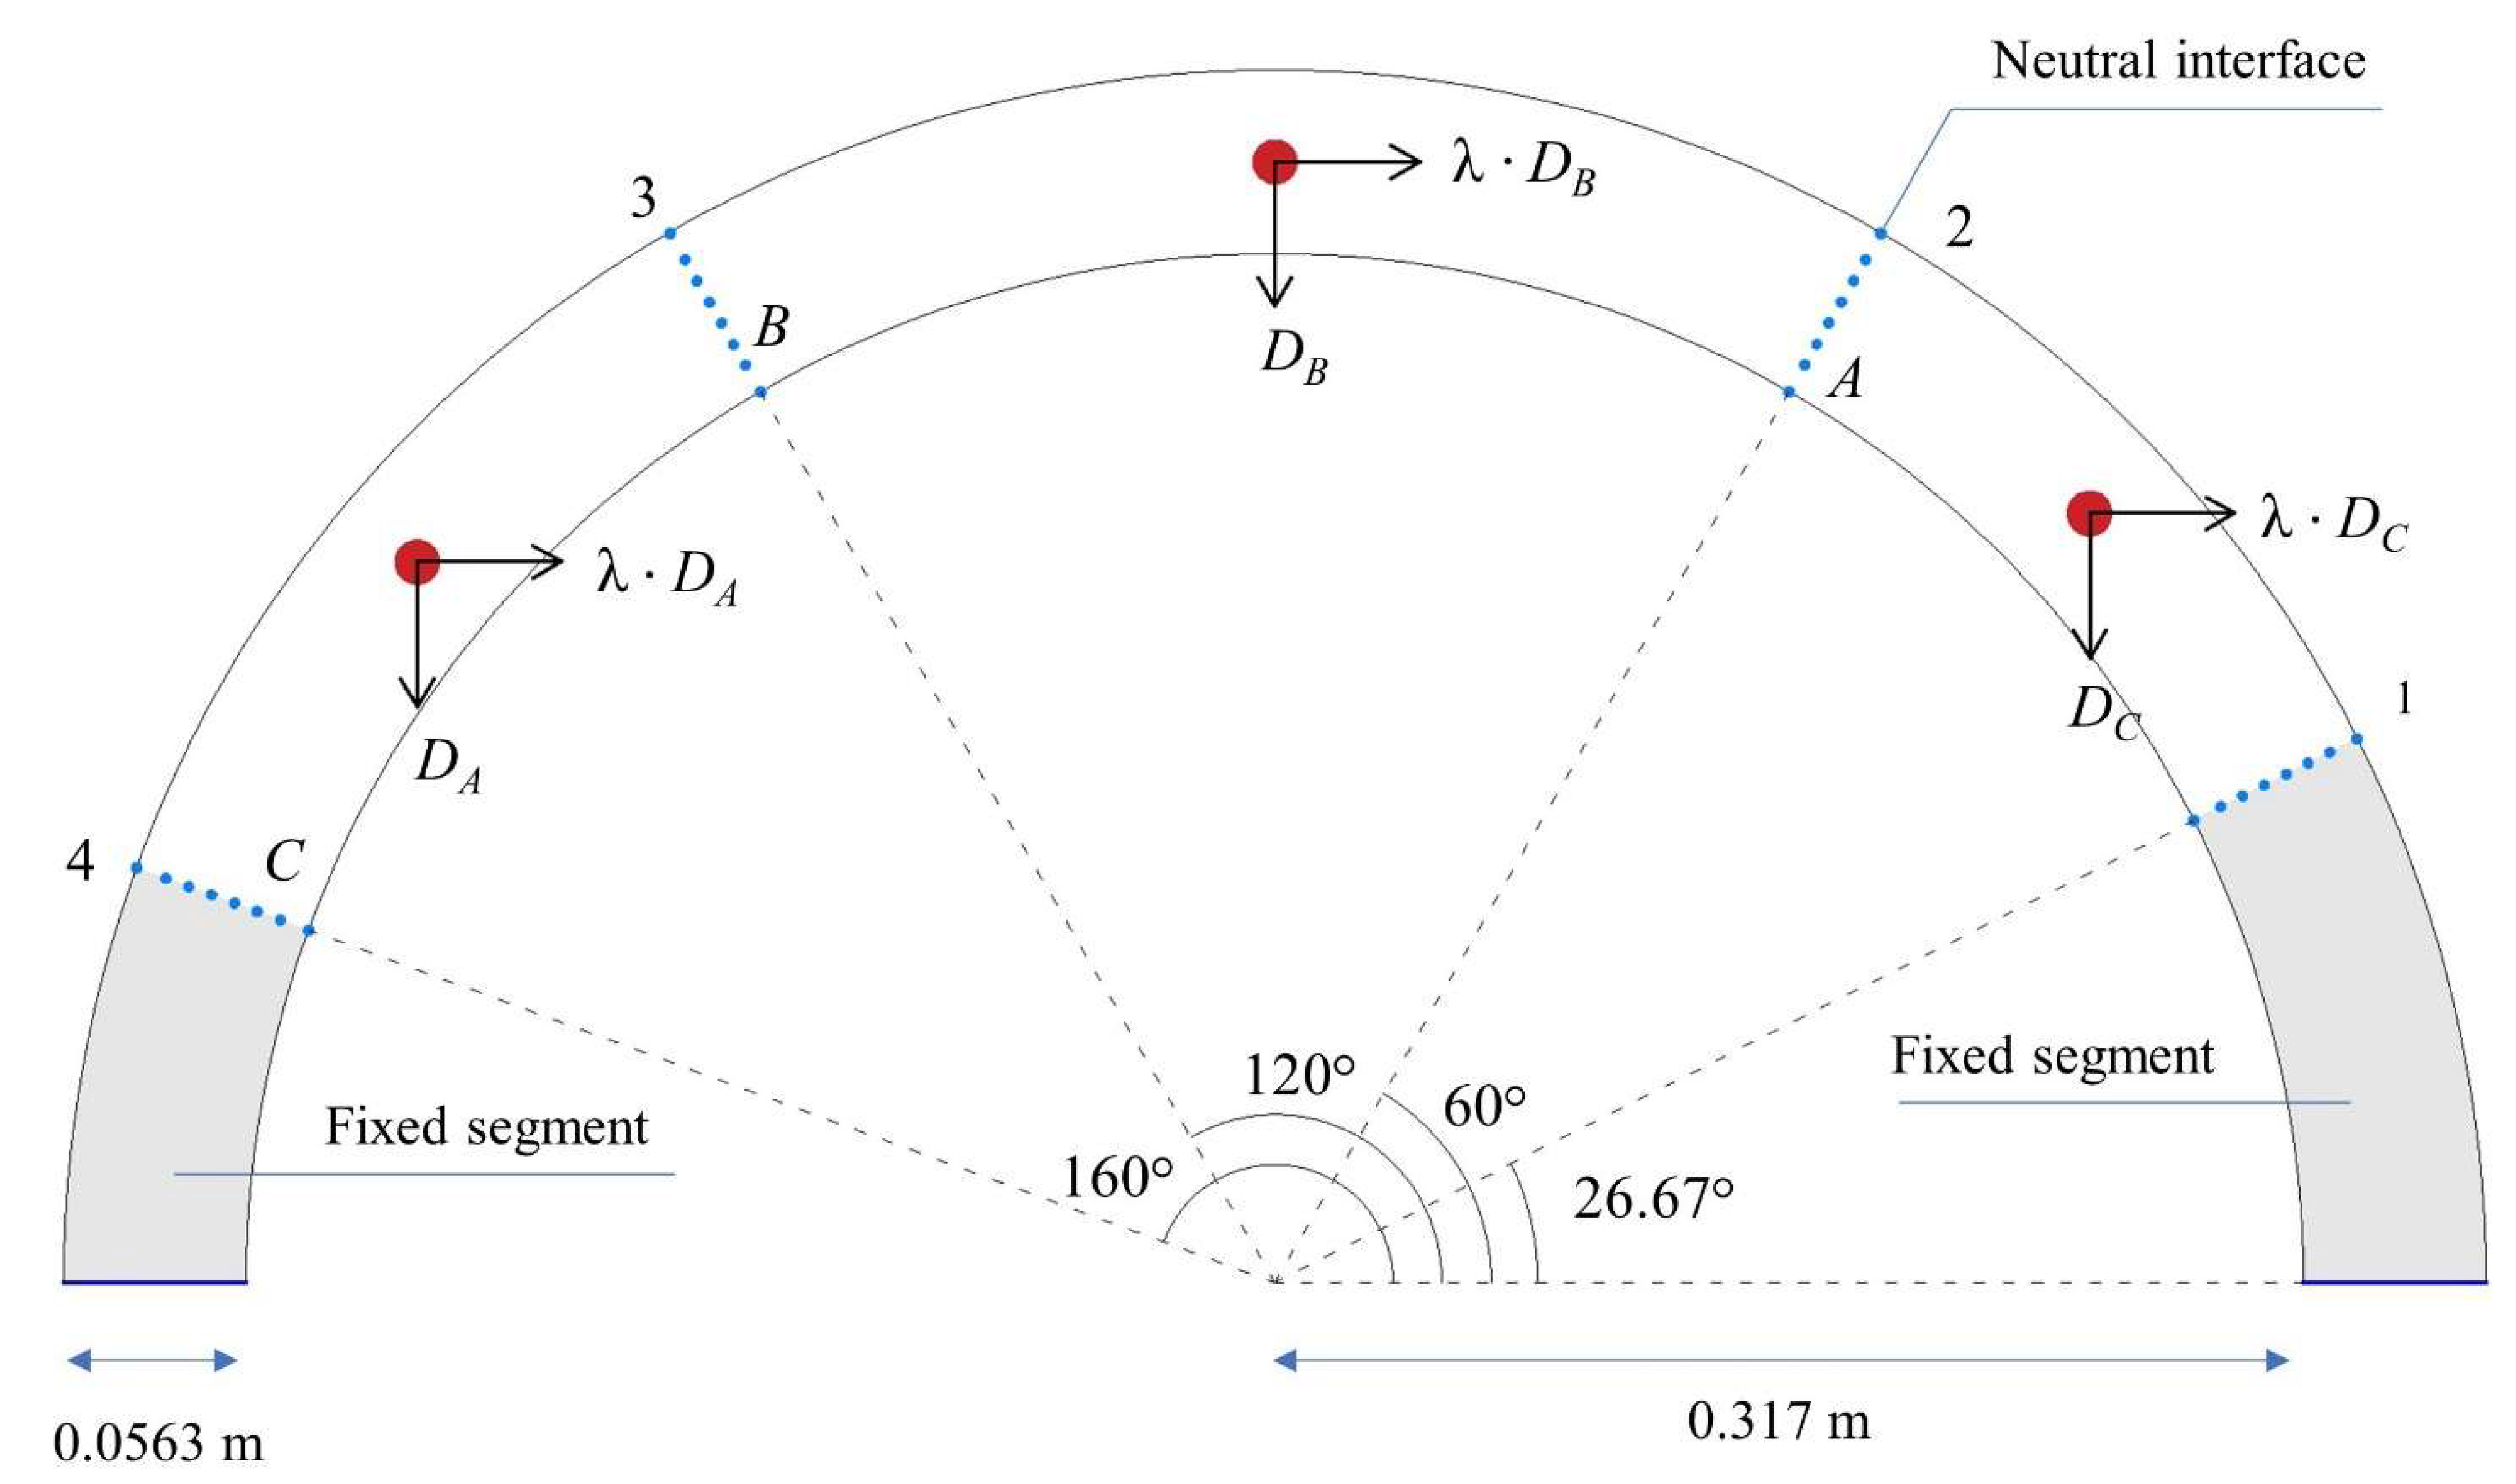
2.2. Joint Layout Optimization Based on Classic Limit Analysis

As presented in the previous section, two key inputs of the proposed segmentation method are a continuum and a network of segmenting lines only along which the model may be segmented. Every segmenting line may act as a peripheral interface at the boundary of a constituent segment or an internal interface inside the segment. From now on and to simplify the explanation, the segmenting lines (blue dotted lines in Figure 4a) are called neutral interfaces. When neutral interface k is considered to be a peripheral interface, its sliding resistance will be sp, …, lk, and when it is set to be an internal interface, its sliding resistance is increased to be si, …, lk, with si > sp. On the other hand, it is assumed that the continuum has no-tension behaviour and the elements bounded by the neutral interfaces are considered rigid elements.
In Section 2.1, all the possible sets of peripheral and internal interfaces are manually generated, and the related load factors are computed to observe which segmental models have the same load-bearing capacity as the unsegmented model. In this section, an optimization method is developed by which the segmental model with the minimum load-bearing capacity reduction with respect to the monolithic model is found automatically. This optimization method tries to maximize the load factor, while the optimization can choose a neutral interface to be an either peripheral or internal interface. To do so, the shear strength at neutral interface k (sk) is considered an optimization variable that can only take two values (sp or si), and the problem in Equation (1) can be re-formulated as:
{ max λ s u b j e c t e d   t o : λ ·   L + A · f =   D N k   0 | M k | 0.5   N k · l k   k   s u p p o r t s | T k |     s k · l k                           s k { s p   ,   s i }   k s u p p o r t s     | T k |     s b · l k
This optimization problem has some continuous variables, including the load factor and the internal forces and moments on the interfaces, and some discrete variables that are in fact the shear strengths at all the neutral interfaces, except those between the model and the supports.
This problem always has at least one optimal solution in which all the neutral interfaces are chosen to be the internal interfaces. This solution in fact represents the unsegmented model that is obviously not the desired solution. When two optimal models (segmental and unsegmented) with the same maximum load factors exist (like Ep1 and Ep4 in Table 1), the optimization algorithm should be encouraged to choose the segmental model; i.e., the optimization tool should be encouraged to choose sp over si.
One option to encourage optimization is to minimize the shear strengths (i.e., to maximise the negative value of shear strengths) at all the interfaces except the supports. Since sp is smaller than si, the optimization tends to choose sp over si. However, the main goal of the optimization is to maximize the load factor (and not to minimize the shear strengths at interfaces), and as a result, the load factor maximization should have the considerably greater weight in the optimization. To do so, the objective function of Equation (3) can be revised as follows:
max ( λ 10 c   ·   S )                         c
where S = {s1, s2, …, sm}, with m being the number of the neutral interfaces except those that are located at the supports.
Moreover, more than one segmental model with the maximum load factor may exist for a problem. The revised objective function would be able to choose the model that has the largest number of peripheral interfaces.
Finally, Equation (3) can be updated as follows:
{ max ( λ   10 c   ·   S )                         c N   s u b j e c t e d   t o : λ ·   L + A · f =   D N k   0 | M k | 0.5   N k · l k   k   s u p p o r t s | T k |     s k · l k                           s k { s p   ,   s i }   k s u p p o r t s     | T k |     s b · l k
Figure 5 presents the example manually developed in Section 2.1 along with all the variables involved in the optimization.
This problem was solved automatically, and the optimization results are presented in Figure 6, when c is set to be 2. The result is in fact the same as the segmental model Ep4 in Table 1, which is the only segmental model whose collapse load factor is identical to the unsegmented model.
Apparently, to segment more complex geometries, some geometrical constraints should be added to the optimization. First and foremost, the initial input interfaces can be divided to two subsets: one includes the neutral interfaces that can act as either peripheral or internal interfaces (blue dotted lines in Figure 7a); the other one represents the interfaces that can only act as internal interfaces and are added as planes of weakness within the segments to increase the accuracy of the results (red dashed lines in Figure 7b).
Furthermore, a set of internal and peripheral interfaces obtained by the optimization algorithm should generate a meaningful segmental model. For example, the peripheral interfaces should be able to model an individual block (Figure 7b). However, introducing geometric constraints to the optimization is beyond the scope of this paper and will be taken into consideration in future research.
In the next section, the same optimization concept will be developed based on the discontinuity layout optimization (DLO) method, which is highly mesh-independent compared to limit analysis.

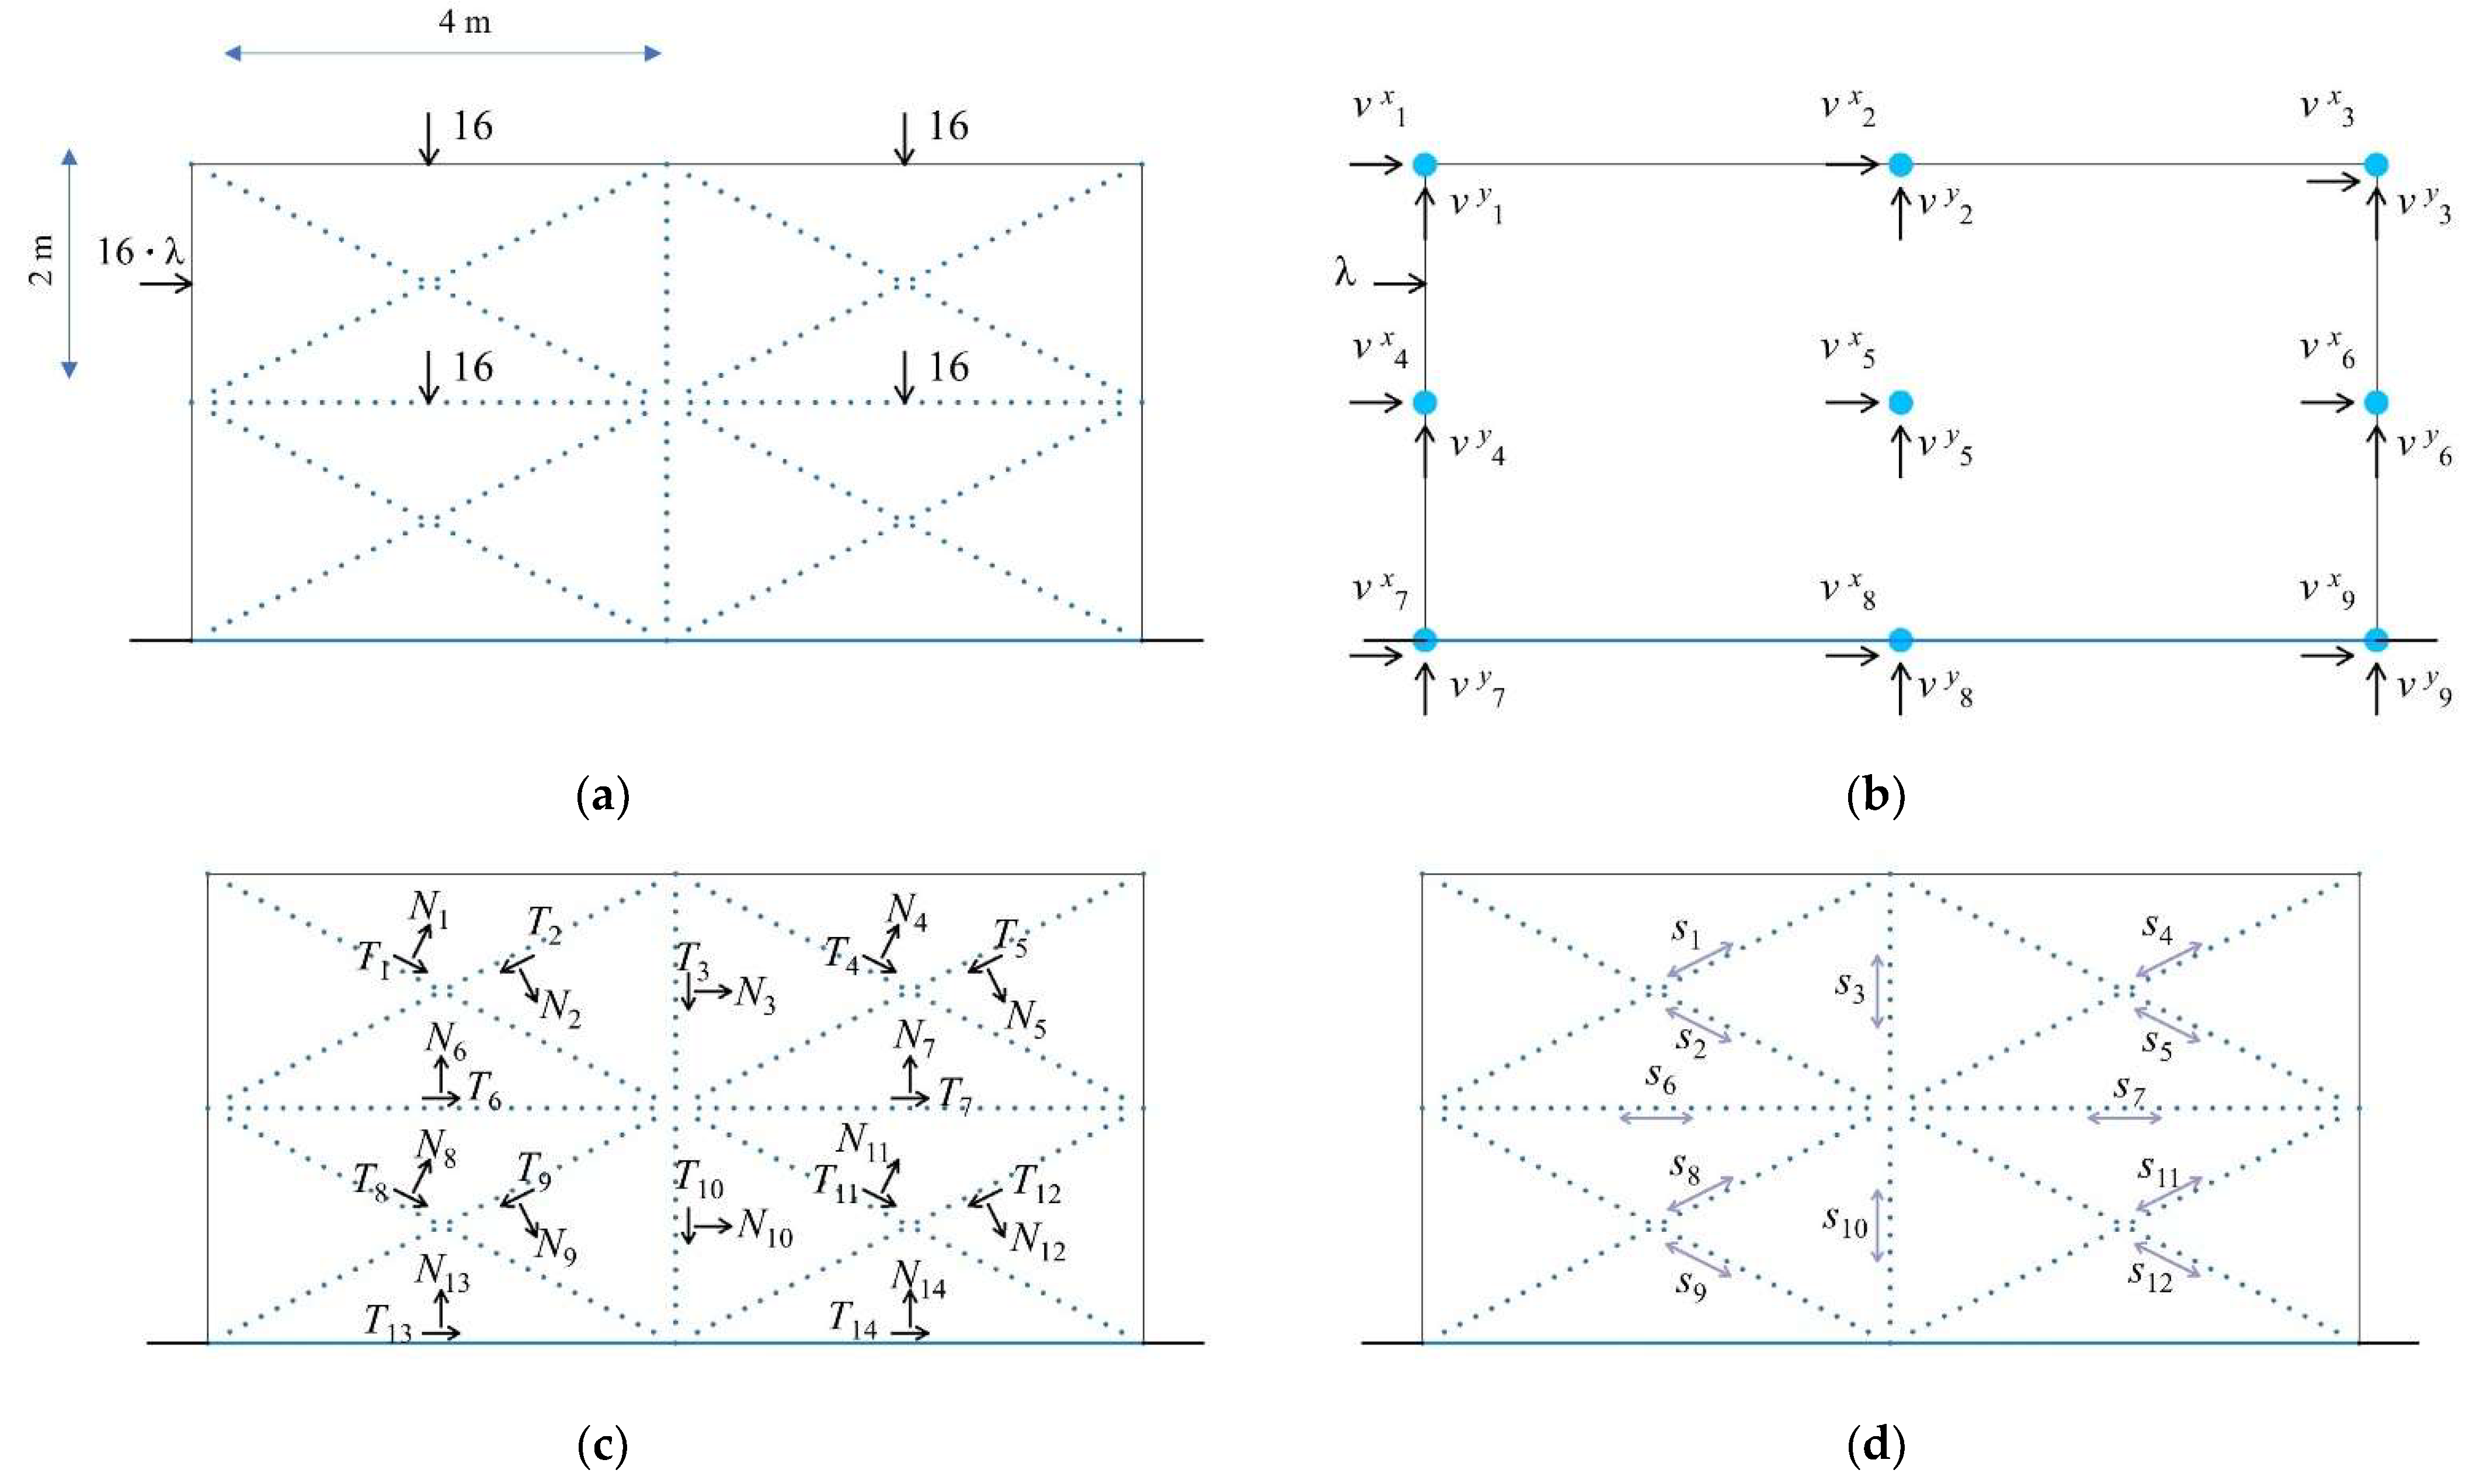
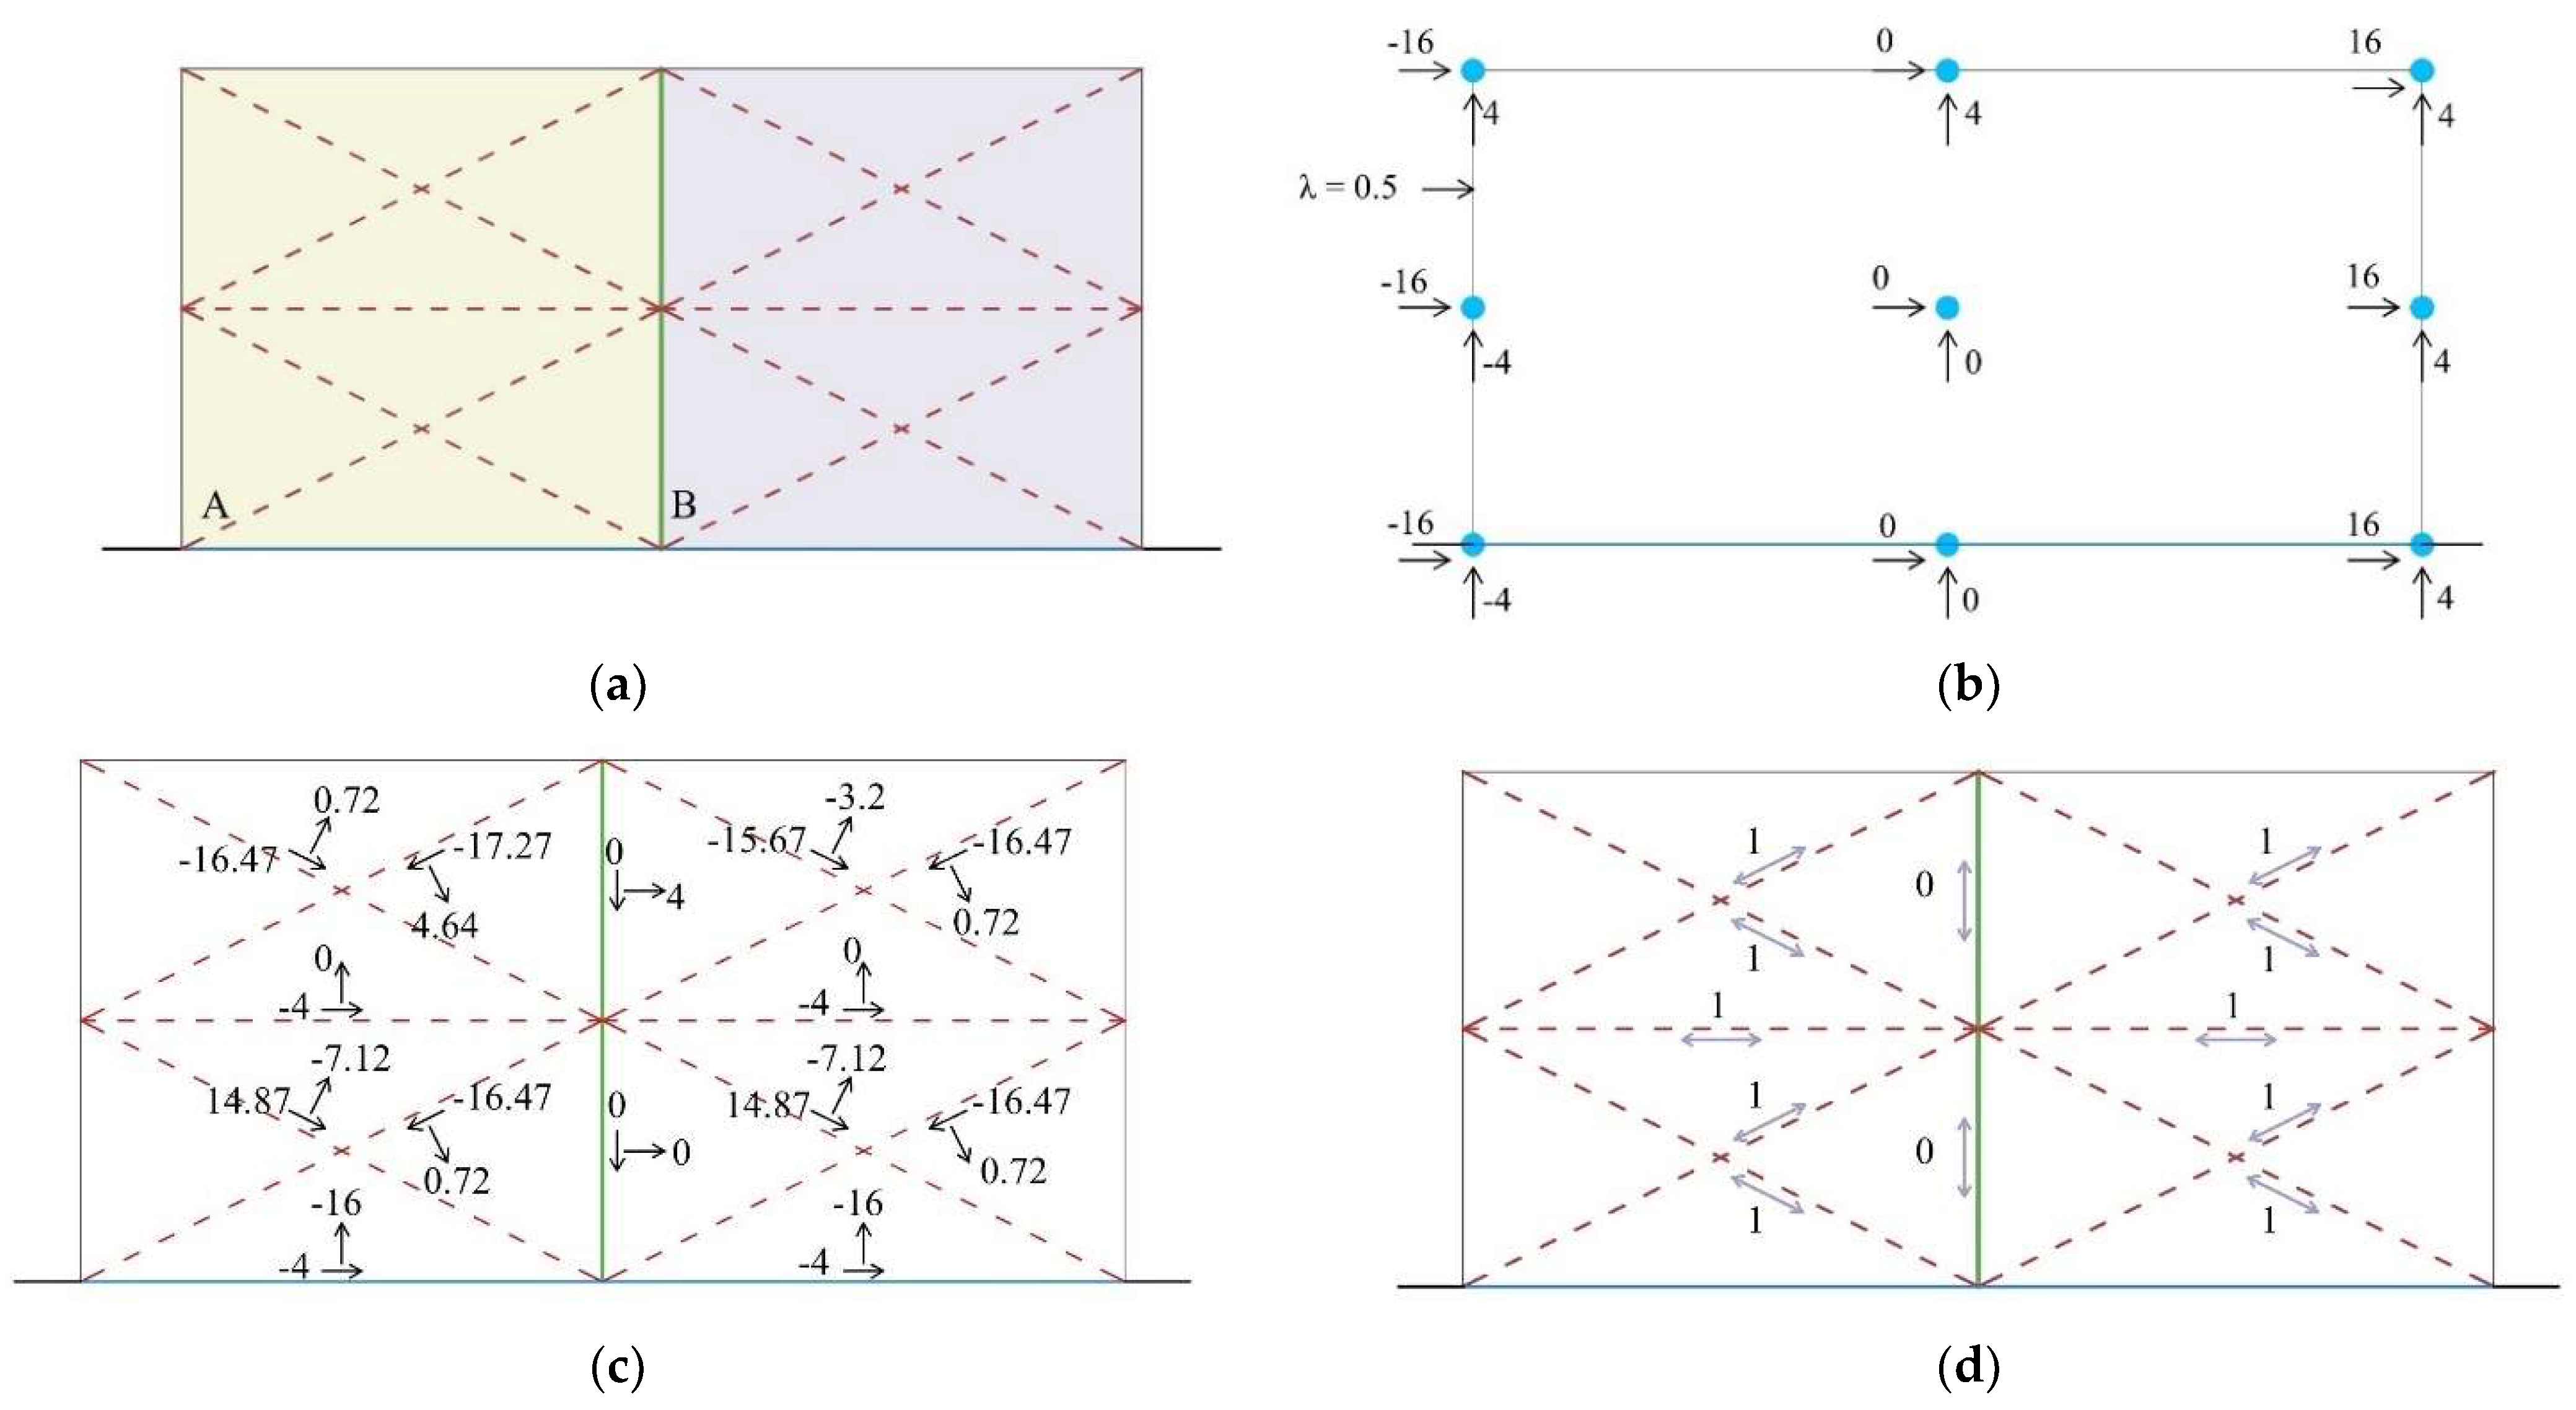
2.3. Joint Layout Optimization Based on DLO

As briefly explained in Section 1, using the DLO approach, a continuum is modelled as several nodes properly distributed on the continuum, and the optimization algorithm finds the maximum load factor by which each individual interface connecting two arbitrary nodes are in equilibrium, and the normal and tangential forces on the interfaces meet the related constraints.
DLO was initially developed based on the Tresca and Mohr-Coulomb failure criteria for 2D problems only involving shear failure [52] and later was extended to include the rocking failure [63]. However, for the sake of an easy explanation of the segmentation optimization for 2D problems, the Tresca model is herein adopted, and the rocking failure is excluded from the optimization so that interfaces can only undergo shear displacements (no rotation).
According to the static approach of DLO, shear Tk and normal Nk forces acting on interface k equilibrate the applied shear and normal dead loads (DTk and DNk) and live loads (LTk and LNk) on the interface as well as the horizontal (vxi and vxi+1) and vertical (vyi and vyi+1) forces at the nodes i and i+1 placed at the endpoints of the interface. Figure 8 illustrates an equilibrated interface with no applied external load, while the general equilibrium equation is [52]:
[ cos θ sin θ cos θ sin θ sin θ cos θ sin θ cos θ ] [ v i x v i y v i + 1 x v i + 1 y ] + λ [ L k T L k N ] [ T k N k ] = [ D k T D k N ]
The yield constraints on Tk and Nk can also be written as:
[ 1 0 1 0 ] [ T k N k ] [ s k   ·   l k   s k   ·   l k ]
where sk is the shear strength at interface k.
Then, to find the strongest set of internal and peripheral interfaces, an optimization problem can be formulated to maximize the load factor λ by finding the optimal shear strengths s1 to sm for the neutral interfaces 1 to m (all the interfaces except those that are located at supports), which can be of either peripheral sp or internal si type.
Same as the optimization problem formulated in Section 2.2, to encourage the algorithm to choose sp over si, minimization of s1 to sm is added to the objective function, while maximization of λ is weighted as the main objective of this function:
{ max ( λ   10 c   ·   S )                         c N   s u b j e c t e d   t o : λ ·   L + A · v q =   D   k   s u p p o r t s | T k |     s k · l k                           s k { s p   ,   s i }   k s u p p o r t s     | T k |     s b · l k
where v is the vector of horizontal and vertical loads on the nodes, A is the related equilibrium coefficient matrix, and q is the vector of tangential and normal forces on the interfaces.
Figure 9a depicts a continuum with a network of neutral interfaces, subjected to the loading scheme similar to the example provided in Section 2.1 and Section 2.2, taking into account that, using DLO, loads can only be applied to interfaces. The variables involved in the optimization are illustrated in Figure 9b–d.
The optimization problem of Equation (7) was solved, and the results are presented in Figure 10, when c is set to be 2. The result is in fact the same as the results provided by limit analysis, as well as the segmental model Ep4 in Table 1. This can be considered as a validation of the model proposed in Section 2.2.

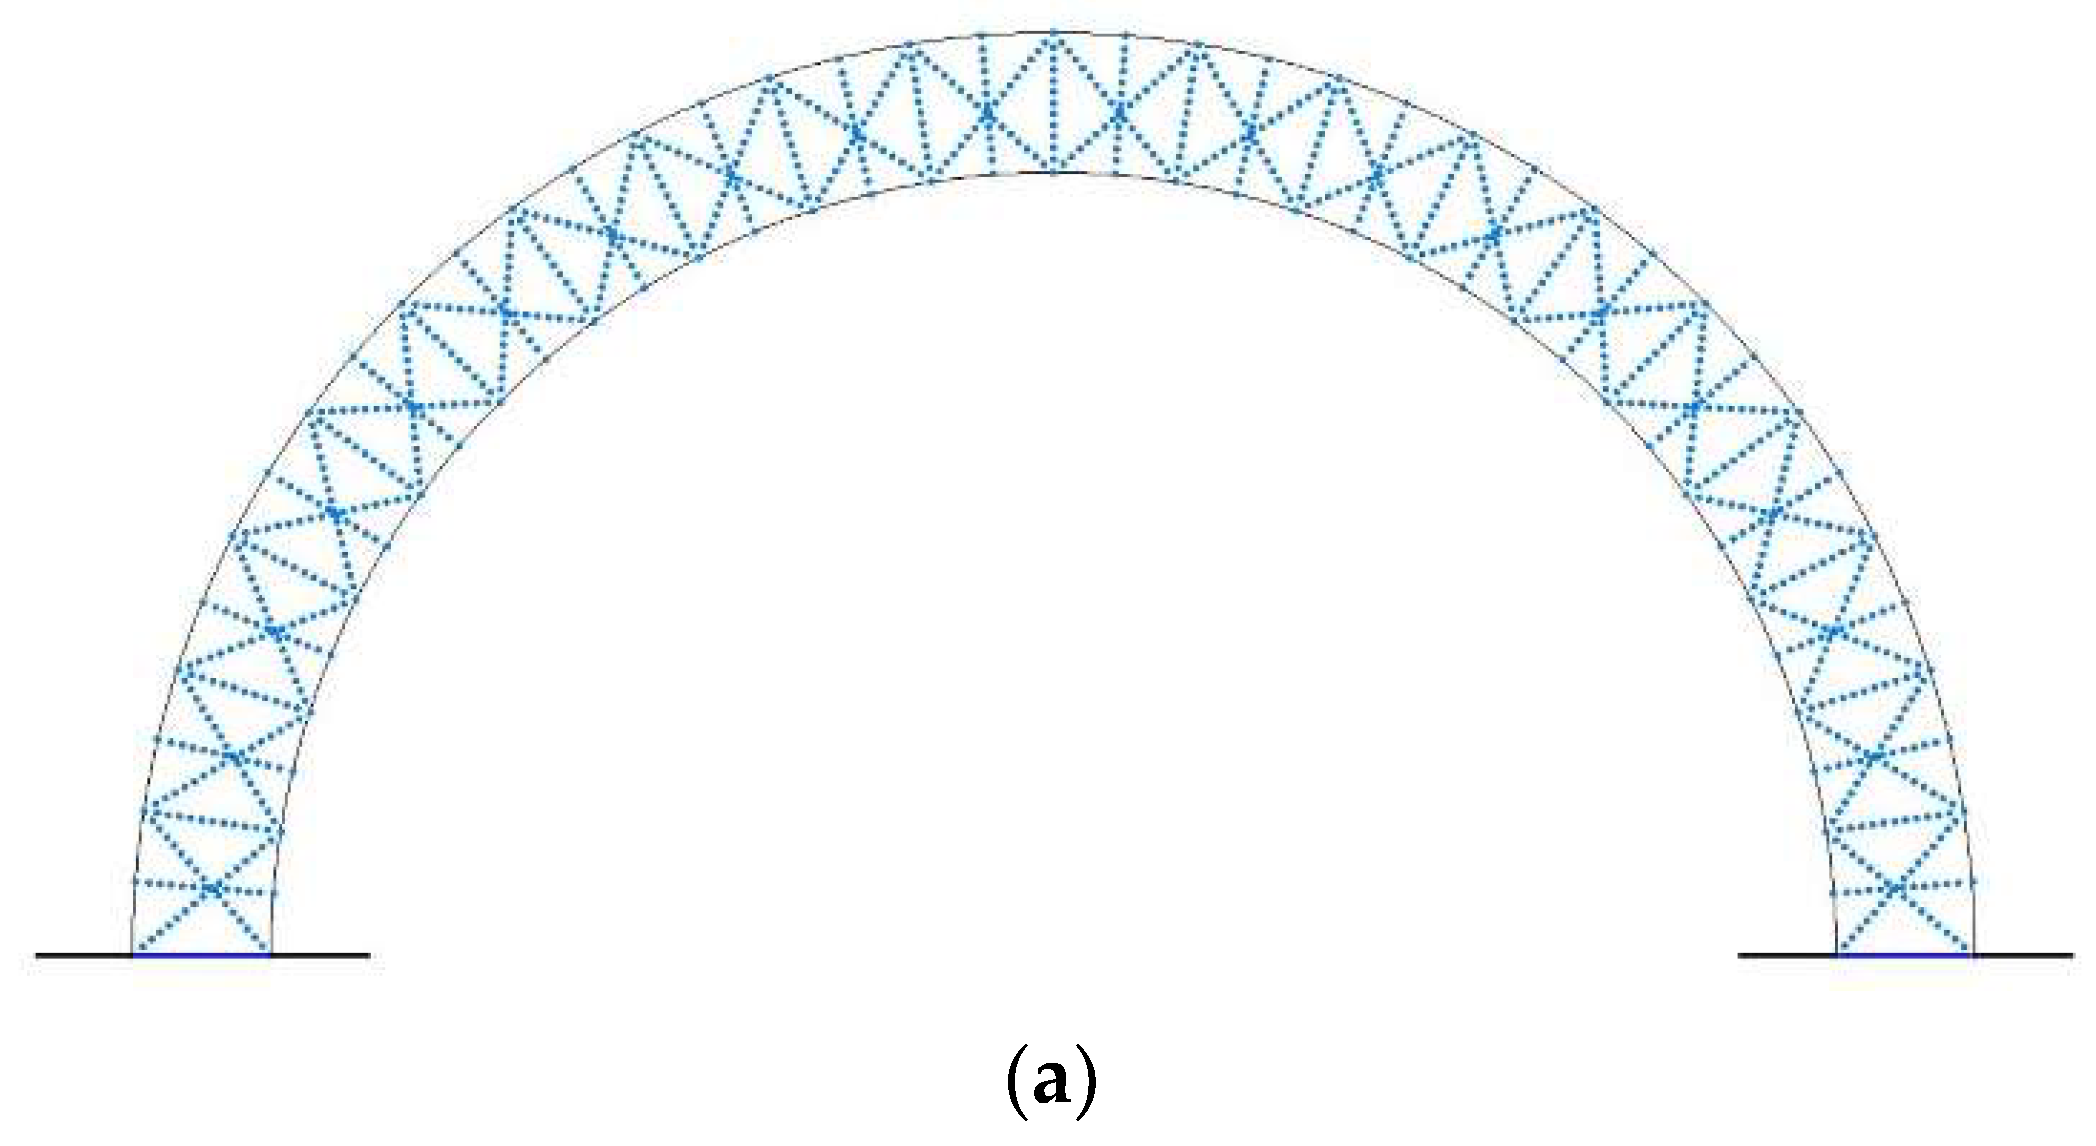
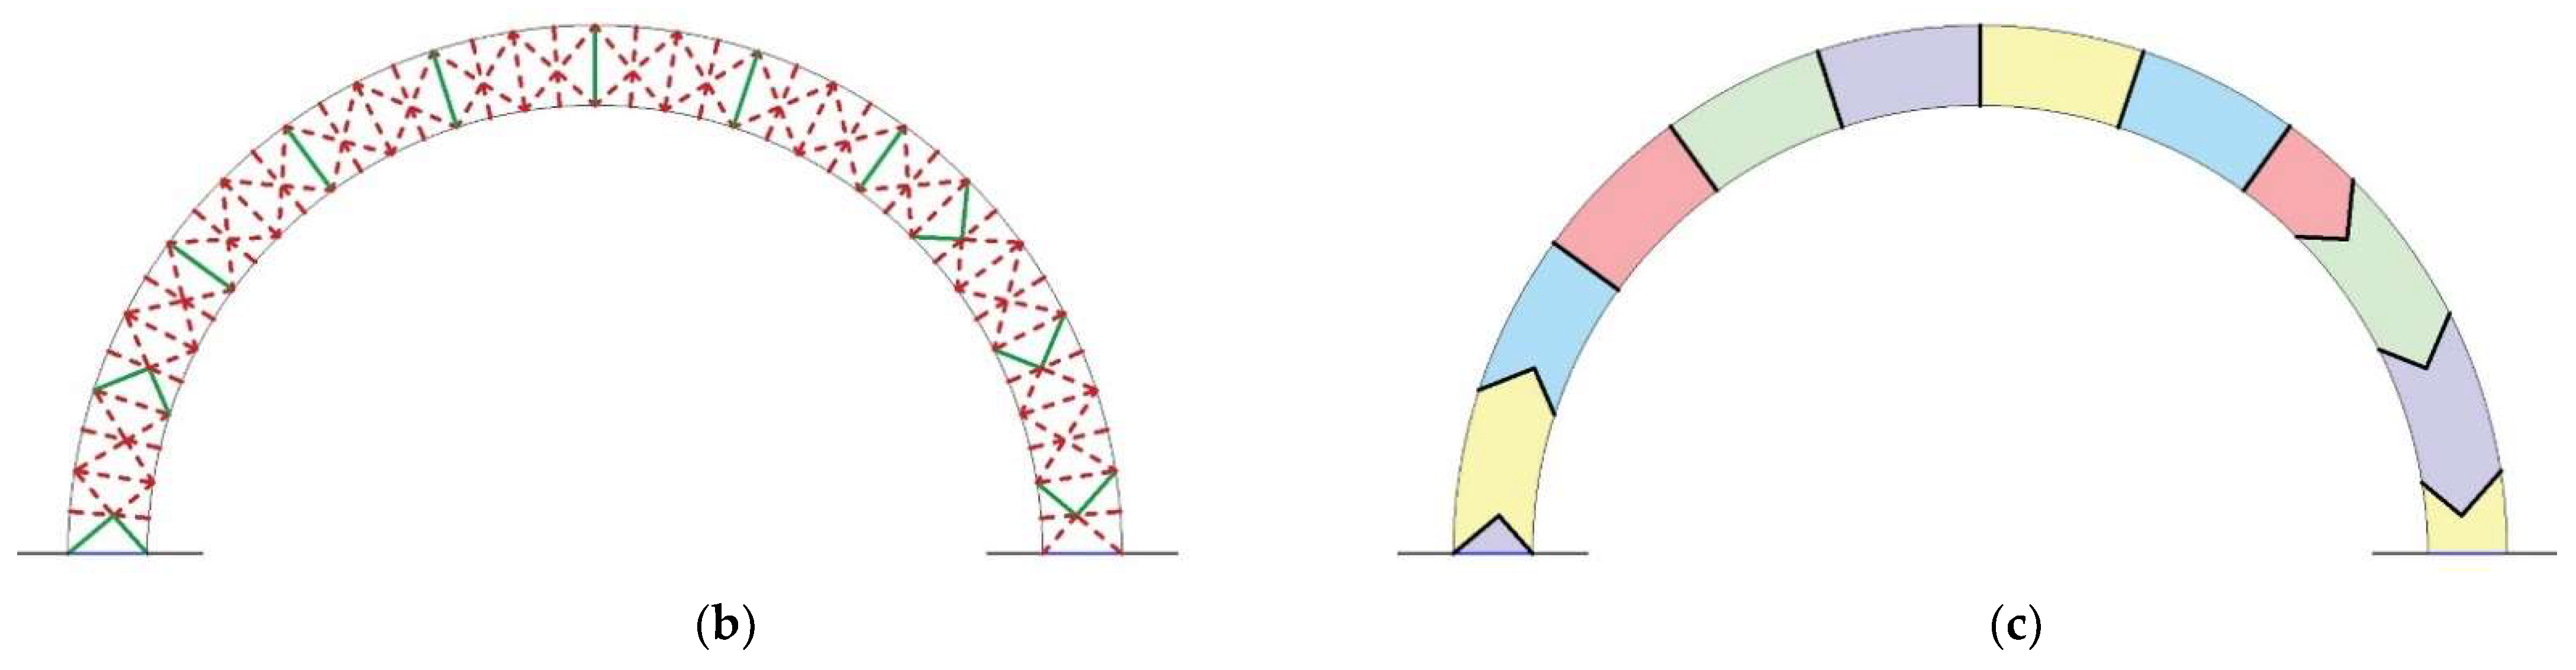
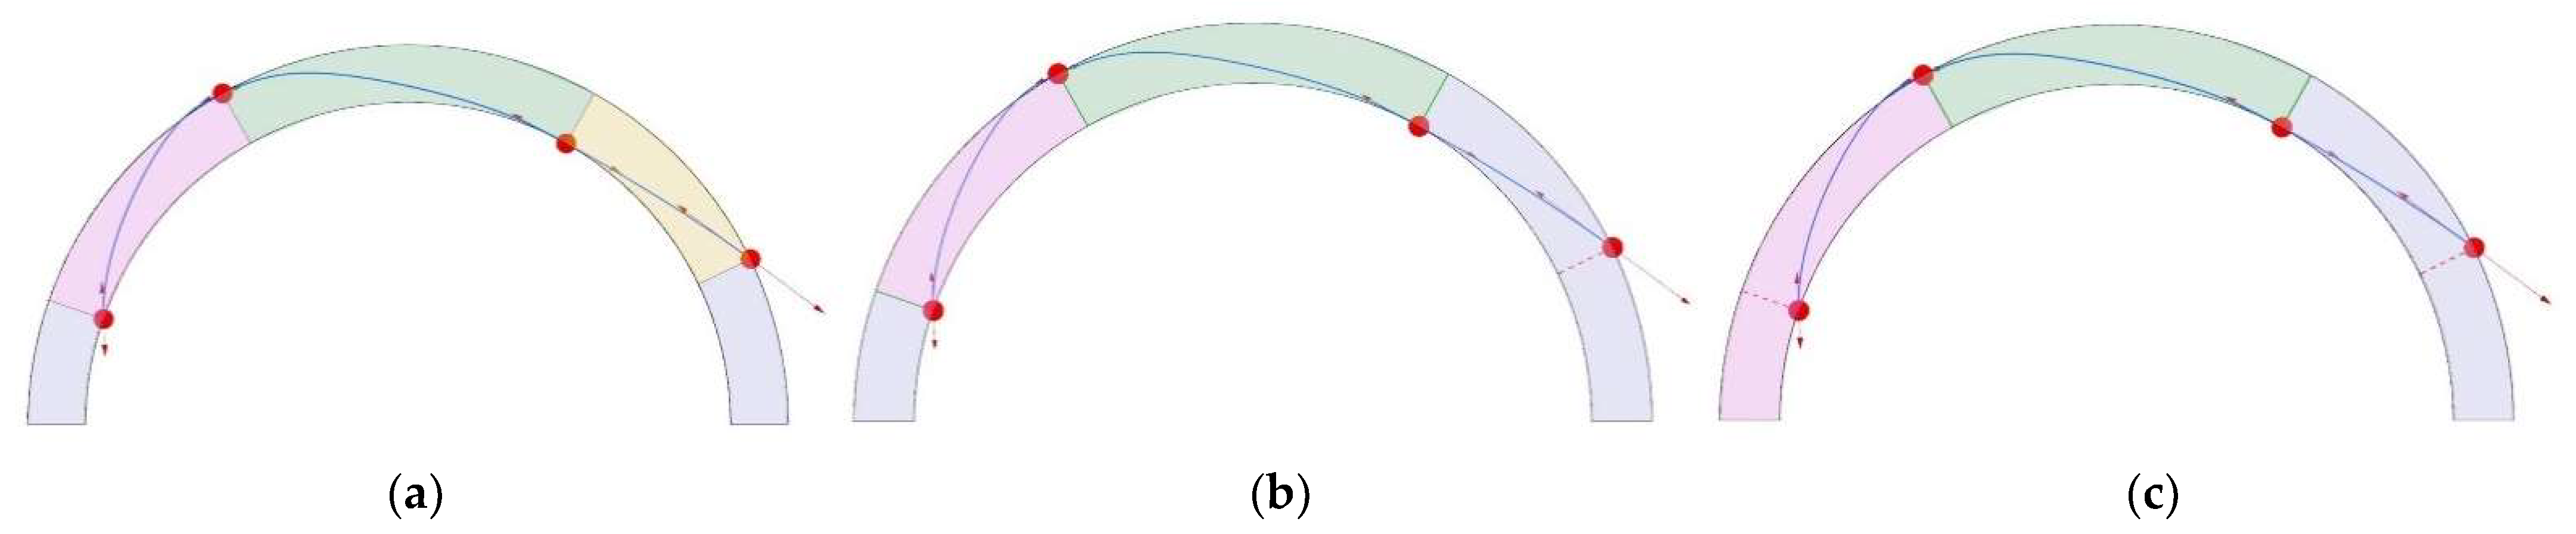
3. Implementation and Validation

In this section, and to assess the applicability of the segmentation method proposed in Section 2 to curved structural forms, a simple semi-circular arch with four radial neutral interfaces is considered, with angles of 26.67°, 60°, 120°, and 160° with respect to the horizontal line (Figure 11). Considering all the interfaces to be peripheral, the model is identical to the first example provided by Stockdale et al. [64]. The segments below interfaces 1 and 4 are fully fixed, while the arch is subjected to its weight and a constant lateral acceleration (in terms of load factor). The material density is also set to be 400 kg/m3. Stockdale et al. [64] used a kinematic collapse load calculator (KCLC) previously implemented as a MATLAB-CAD limit analysis tool, by which the designer can first choose a mechanism (with given location of hinges and/or slipping joints) among seven kinematically admissible ones for a dry stacked masonry arch subjected to its own weight and a constant lateral acceleration. Then, the tool checks the feasibility of the chosen mechanism configuration and (if it is feasible) computes the related load factor.
In this paper, the analysis is carried out for three different friction angles, while the peripheral interfaces (that are in fact dry joints) are governed by the cohesionless Coulomb’s law of friction. How the segmentation method of Section 2 is extended to the Coulomb’s friction law is presented in the following. It is worth noting that both the current paper and [64] adopt an associated sliding rule.
Finding the optimal joint layout for this simple example basically proves that the proposed method is perfectly applicable to the more complex problem of, e.g., Figure 12 with the denser network of neutral interfaces that, apparently, allows segmental arches to be generated with planar and/or non-planar interlocking joints. Modelling segmental arched forms having joints with complex geometries will be comprehensively investigated in future work.
For the model illustrated in Figure 11, when a neutral interface is chosen as an internal interface, the shear behaviour of the interface is independent of the normal force (i.e., it is a cohesive face with friction angle = 0). On the other hand, when a neutral interface is selected as a peripheral interface, the frictional behaviour of the interface is governed by the cohesionless Coulomb’s law of friction. To this aim, Equation (2) in Section 2.1 based on the lower bound theorem of limit analysis is updated as follows:
{ max λ s u b j e c t e d   t o : λ ·   L + A · f =   D N k   0 | M k | 0.5   N k · l k   k   p e r i p h e r a l   i n t e r f a c e s   | T k | tan φ · N k   k i n t e r n a l   i n t e r f a c e s   | T k | s i · l k
where φ is the friction angle at the peripheral joints, si is the masonry shear strength at the internal interfaces that here is set to be 3 × 10⁴ N/m2, and k refers to all interfaces, except the supports depicted by blue continuous lines in Figure 11.
Considering all the neutral interfaces to be peripheral, the first row of Table 2 reports the load factors λ found by Equation (8) for two friction angles (35° and 17.6°), while the second row shows the computed load factors λ reported by Stockdale et al. [64]. In particular, the first load factor reported in the second row of Table 2 (φ = 35°) is related to the standard (hinging) mechanism with four hinges when the frictional resistances are considered large enough, while the second one is related to the mechanism in which hinge 1 of the standard mechanism is exchanged with a slipping joint, when the friction angle is set to be 17.6°. As shown in the table, the results obtained by Equation (8) and Stockdale et al. [64] are in good agreement with each other.
Furthermore, the lines of thrust obtained by Equation (8) in Figure 13 evidently confirm that the arch with the high friction coefficient (φ = 35°) fails due to the standard four-hinge mechanism, while the expected collapse mechanism for an arch with a lower friction coefficient (φ = 17.6°) is similar to the second mechanism introduced in [64]. The thrust line is modelled through a spline whose points are the application points of the internal forces on the interfaces, while the curve is tangential to these forces.
After validating Equation (8) for the semi-circular arch with five segments (as elaborated above), this equation is used to find the load-bearing capacities of segmental arches modelled with different combinations of peripheral and internal interfaces.
First, it has been observed that for any set of peripheral and internal interfaces, the load factor becomes 0.8279 when the friction angle is 35°, and four hinges are generated at the interfaces 1 to 4 (standard failure mechanism). The results simply show that when the frictional resistance at the peripheral interfaces is large enough, all the segmental arches have the same load-bearing capacity as the unsegmented model, since both the internal and peripheral interfaces are resistant enough to tolerate the related shear forces.
On the other hand, Table 3 presents the computed load factors, thrust lines, and failure mechanisms of different segmental arches for two lower friction angles, i.e., 27.28° (second column) and 17.6° (third column).
As shown in the table, when φ = 27.28°, two different collapse mechanisms can be generated for different sets of peripheral and internal forces. First, it can be observed that interfaces 2 to 4 are strong enough against shear forces, being either of internal or peripheral type. On the contrary, interface 1 slips if acting as a peripheral interface and rotates when set to be an internal interface. In fact, for Eci with i = 1, 3, 5, 8, 10, 11, 12, 13, the four-hinge mechanism is always obtained with λ = 0.8279, while the obtained mechanism for Eci with i = 2, 4, 6, 7, 9, 15, 16 comprises a slipping joint on interface 1 and three hinges on interfaces 2 to 4 with the load factor reduced to 0.8084.
Given the lowest friction angle of 17.6°, three different collapse mechanisms can be generated for different sets of peripheral and internal forces. It can be noted that two interfaces 2 and 3 are strong enough against shear forces, being either peripheral or internal interfaces. Therefore, the obtained mechanisms for Eci with i = 1, 3, 10, 11 simply have four hinges with the highest load factor 0.8279. On the other hand, interface 1 acts as a slipping joint when it is peripheral and as a hinge when internal. As a result, the computed mechanisms for Eci with i = 2, 4, 6, 7, 9, 14, 15, 16 include a slipping joint on interface 1 and three hinges on interfaces 2 to 4 with the lowest load factor 0.483. Finally, interface 4 behaves as a slipping joint when it is peripheral and interface 1 is set to be internal, simultaneously. In this case, the obtained mechanisms for Eci with i = 5, 8, 12, 13 involve three hinges on interfaces 1 to 3 and a slipping joint on interface 4, while the computed load factor is 0.7969.
Apparently, to find the strongest shape and location of the joints, the search space should be expanded by increasing the number of neutral interfaces (e.g., Figure 12). As mentioned above, this will be taken into consideration in the future.
The results in Table 3 represent all the possible segmental arches manually developed to compare their load bearing capacities. In the following, the optimization algorithm presented in Section 2.2 is implemented to find the strongest segmental arch automatically. First, the optimization method formulated in Equation (4) can be updated to include the Coulomb’s friction law at the peripheral joints as follows:
{ max ( λ   10 c   ·   R )                         c N   s u b j e c t e d   t o : λ ·   L + A · f =   D N k   0 | M k | 0.5   N k · l k | T k |     r k                             r k { μ · N k ,   s i · l k } μ · N k r k s i · l k    
In this equation, the absolute value of the internal shear force at interface k is constrained to be less than the interface sliding resistance rk, which could be either µ · Nk or si · lk. In fact, through bounding this discrete variable to be between µ · Nk and si · lk as an optimization constraint, the problem includes both cohesionless peripheral interfaces depending on normal forces and cohesive interfaces independent of normal forces.
Figure 14 demonstrates the optimal segmental arches obtained through solving the optimization problem of Equation (9), assuming φ equals to 35°, 27.28°, and 17.6°, respectively. These solutions agree with the corresponding ones in Table 3, with load factors similar to the unsegmented arch (λ = 0.8279). In fact, according to this table, for each of the three selected friction angles, more than one segmental model with maximum load factor exists. As highlighted in Section 2.2, the developed optimization algorithm chooses the model with the largest number of peripheral interfaces, among all the models with the maximum load factor.

4. Conclusions and Future Work

This paper has presented a segmentation method that finds the strongest shapes and locations for the joints within segmental masonry arched forms. Historically, the shape of the constituent segments of a masonry assemblage and the shape of the joints between the segments have mostly been governed by the construction constraints. However, recent advances in digital fabrication such as 3D concrete printing and digital stone stereotomy by CNC machines considerably reduce the fabrication and construction constraints and allow the fabrication of blocks with complex geometries. These advances can, e.g., enable us to design joints with complicated shapes that strongly connect and interlock the segments of an assemblage together.
Two methods of analysis, i.e., classic limit analysis and discontinuity layout optimization (DLO), have been adopted to develop the segmentation method, in which a dense network of neutral interfaces are first considered on an arched form as a continuum. Each neutral interface can either be a joint (peripheral interface) between the segments or an internal interface within the segment at which the segment may crack. Any set of peripheral and internal interfaces represents a segmental model, and the developed optimization methods have found the sets by which the maximum load can be tolerated. This concept has first been presented for a simple example of a 2D rectangular continuum, while the simplest version of DLO that only includes the sliding failures has been adopted. Then, the method has been implemented to segment a 2D semi-circular arch with three different friction angles on the peripheral interfaces.
This issue opens five lines of research topics that will be pursued in the future.
1. Adopting limit analysis, a model can be represented by a network of neutral interfaces among rigid solids. These solids, however, can be considered deformable using, e.g., finite element limit analysis, incremental limit analysis, and discrete element analysis. So, the segmentation concept is extendable to quasi-brittle materials (such as concrete and mortar) for which cohesive fractures are simply produced and propagated at joints or internal interfaces. These fractures, though, can provide large ductility for the overall assemblage of rigid or deformable blocks in terms of displacement capacity, as can widely be recognised in the masonry assemblages with large displacements [65]. The concept would not be simply applicable to ductile materials (e.g., segmental models made of steel segments).
2. Due to the advantages of DLO compared to the classic limit analysis, to use the dense network of neutral interfaces, the extension of the segmenting optimization based on more complex versions of DLO considering the rocking failure and 3D models can be taken into consideration.
3. In this paper, the flow rule used by both classic limit analysis and DLO is based on the associative friction model (dilation angle = friction angle). It is expected that for any segmental model, the non-associative load factor (with dilation angle = 0) is less than or equal to the associative one. However, the difference between the associative and non-associative load factors may vary from one joint layout to another one. Therefore, the segmental configuration with the maximum non-associative load factor is not necessarily similar to that with the maximum associative load factor. This issue will be investigated and developed in future works.
4. Despite the advances in digital fabrications, several fabrication and construction limits must still be introduced to the segmenting optimization of the constructable segments. These limits usually are developed as geometric constraints that should be properly taken into account.
5. One of the most common limitations of the structural shape optimization and form-finding strategy is that they are highly dependent on the loading and boundary conditions. Therefore, the segmentation method must be extended to include multiple loading schemes to model more reliable segmental assemblages resistant against various loading conditions.

Author Contributions

Conceptualization, E.M.; methodology development, E.M.; methodology verification, C.C., software, E.M.; validation, E.M. and C.C.; formal analysis, E.M.; investigation, E.M.; data curation, E.M.; writing—original draft preparation, E.M.; writing—review and editing, E.M. and C.C.; visualization, E.M.; supervision, C.C. All authors have read and agreed to the published version of the manuscript.

Funding

This research received no external funding.

Institutional Review Board Statement

Not applicable.

Informed Consent Statement

Not applicable.

Data Availability Statement

Data are contained within the article.

Conflicts of Interest

The authors declare no conflict of interest.

References

  1. Block, P.; Van Mele, T.; Rippmann, M.; Ranaudo, F.; Calvo Barentin, C.J.; Paulson, N. Redefining structural art: Strategies, necessities and opportunities. Struct. Eng. 2020, 98, 66–72. [Google Scholar]
  2. Yıldız, A.R.; Saitou, K.; Yildiz, A.R. Topology Synthesis of Multi-Component Structural Assemblies in Continuum Domains. J. Mech. Des. 2011, 133, 1235–1245. [Google Scholar] [CrossRef]
  3. Luo, L.; Baran, I.; Rusinkiewicz, S.; Matusik, W. Chopper: Partitioning models into 3D-printable parts. ACM Trans. Graph. (TOG) 2012, 31, 129. [Google Scholar] [CrossRef] [Green Version]
  4. Chen, X.; Zhang, H.; Lin, J.; Hu, R.; Lu, L.; Huang, Q.; Benes, B.; Cohen-Or, D.; Chen, B. Dapper: Decompose-and-pack for 3D printing. ACM Trans. Graph. (TOG) 2015, 34, 213. [Google Scholar] [CrossRef]
  5. Araújo, C.; Cabiddu, D.; Attene, M.; Livesu, M.; Vining, N.; Sheffer, A. Surface2Volume: Surface segmentation conforming assemblable volumetric partition. ACM Trans. Graph. (TOG) 2019, 38, 80. [Google Scholar] [CrossRef]
  6. Song, P.; Fu, C.W.; Cohen-Or, D. Recursive interlocking puzzles. ACM Trans. Graph. (TOG) 2012, 31, 128. [Google Scholar] [CrossRef] [Green Version]
  7. Giresini, L.; De Paola, D.; Puppio, M.L.; Buratti, G. Graphical methods, kinematic and finite element analysis of the Premilcuore masonry bridge. In ECCOMAS Proceedia, Proceedings of the 8th International Conference on Computational Methods in Structural Dynamics and Earthquake Engineering (COMPDYN 2021), Athens, Greece, 28–30 June 2021; Papadrakakis, M., Fragiadakis, M., Eds.; National Technical University of Athens (NTUA): Athens, Greece, 2021; Volume 1, pp. 682–701. [Google Scholar]
  8. Jiang, H.; Chen, L.; Ma, Z.J.; Feng, W. Shear behavior of dry joints with castellated keys in precast concrete segmental bridges. J. Bridge Eng. 2015, 20, 04014062. [Google Scholar] [CrossRef]
  9. Puppio, M.L.; Giresini, L. Estimation of tensile mechanical parameters of existing masonry through the analysis of the collapse of Volterra’s urban walls. Frat. Ed. Integr. Strutt. 2019, 13, 725–738. [Google Scholar] [CrossRef]
  10. Chen, S.; Bagi, K. Crosswise tensile resistance of masonry patterns due to contact friction. Proc. R. Soc. A Math. Phys. Eng. Sci. 2020, 476, 20200439. [Google Scholar] [CrossRef]
  11. Lourenco, P.; Oliveira, D.; Roca, P.; Orduña, A. Dry Joint Stone Masonry Walls Subjected to In-Plane Combined Loading. J. Struct. Eng. 2005, 131, 1665–1673. [Google Scholar] [CrossRef] [Green Version]
  12. Ceroni, F.; Cuzzilla, R.; Pecce, M. Assessment of performance of steel and GFRP bars as injected anchors in masonry walls. Constr. Build. Mater. 2016, 123, 78–98. [Google Scholar] [CrossRef]
  13. Giresini, L.; Puppio, M.L.; Taddei, F. Experimental pull-out tests and design indications for strength anchors installed in ma-sonry walls. Mater. Struct. 2020, 53, 103. [Google Scholar] [CrossRef]
  14. Solarino, F.; Giresini, L. Fragility curves and seismic demand hazard analysis of rocking walls restrained with elastoplastic ties. Earthq. Eng. Struct. Dyn. 2021, 50, 3602–3622. [Google Scholar] [CrossRef]
  15. Mousavian, E.; Casapulla, C. The role of different sliding resistances in limit analysis of hemispherical masonry domes. Frat. Ed. Integr. Strutt. 2019, 14, 336–355. [Google Scholar] [CrossRef]
  16. D’Ayala, D.; Casapulla, C. Limit state analysis of hemispherical domes with finite friction. In Proceedings of the III Interna-tional Seminar on Structural Analysis of Historical Constructions (SAHC01), Guimarães, Portugal, 7–9 November 2001; pp. 617–626. [Google Scholar]
  17. Boni, C.; Ferretti, D.; Lenticchia, E. Effects of Brick Pattern on the Static Behavior of Masonry Vaults. Int. J. Arch. Herit. 2021, volume, 1–21. [Google Scholar] [CrossRef]
  18. Cecchi, A.; Milani, G. A kinematic FE limit analysis model for thick English bond masonry walls. Int. J. Solids Struct. 2008, 45, 1302–1331. [Google Scholar] [CrossRef] [Green Version]
  19. Silva, L.C.; Lourenço, P.B.; Milani, G. Numerical homogenization-based seismic assessment of an English-bond masonry pro-totype: Structural level application. Earthq. Eng. Struct. Dyn. 2020, 49, 841–862. [Google Scholar] [CrossRef]
  20. Milani, G.; Cecchi, A. Compatible model for herringbone bond masonry: Linear elastic homogenization, failure surfaces and structural implementation. Int. J. Solids Struct. 2013, 50, 3274–3296. [Google Scholar] [CrossRef] [Green Version]
  21. Alforno, M.; Calderini, C.; Monaco, A.; Venuti, F. Numerical modelling of masonry vaults with different brick pattern. In Proceedings of the IASS Annual Symposium 2019 on Form and Force, Barcelona, Spain, 7–10 October 2019; Lázaro, C., Bletzinger, K.U., Oñate, E., Eds.; International Association for Shell and Spatial Structures (IASS): Madrid, Spain, 2019; pp. 1626–1633. [Google Scholar]
  22. Gáspár, O.; Sajtos, I.; Sipos, A.A. Friction as a geometric constraint on stereotomy in the minimum thickness analysis of circular and elliptical masonry arches. Int. J. Solids Struct. 2021, 225, 111056. [Google Scholar] [CrossRef]
  23. Gáspár, O.; Sipos, A.A.; Sajtos, I. Effect of stereotomy on the lower bound value of minimum thickness of semi-circular ma-sonry arches. Int. J. Archit. Herit. 2018, 12, 899–921. [Google Scholar] [CrossRef]
  24. Makris, N.; Alexakis, H. The effect of stereotomy on the shape of the thrust-line and the minimum thickness of semicircular masonry arches. Arch. Appl. Mech. 2013, 83, 1511–1533. [Google Scholar] [CrossRef]
  25. Nikolich, D. Thrust line analysis of triangular arches. Arch. Appl. Mech. 2020, 90, 1861–1874. [Google Scholar] [CrossRef]
  26. Forgács, T.; Sarhosis, V.; Bagi, K. Influence of construction method on the load bearing capacity of skew masonry arches. Eng. Struct. 2018, 168, 612–627. [Google Scholar] [CrossRef]
  27. Sassu, M.; Giresini, L.; Bonannini, E.; Puppio, M.L. On the Use of Vibro-Compressed Units with Bio-Natural Aggregate. Buildings 2016, 6, 40. [Google Scholar] [CrossRef] [Green Version]
  28. Giresini, L.; Stochino, F.; Sassu, M. Economic vs environmental isocost and isoperformance curves for the seismic and energy improvement of buildings considering Life Cycle Assessment. Eng. Struct. 2021, 233, 111923. [Google Scholar] [CrossRef]
  29. Mirkhalaf, M.; Zhou, T.; Barthelat, F. Simultaneous improvements of strength and toughness in topologically interlocked ceramics. Proc. Natl. Acad. Sci. USA 2018, 115, 9128–9133. [Google Scholar] [CrossRef] [Green Version]
  30. Javan, A.R.; Seifi, H.; Lin, X.; Xie, Y.M. Mechanical behaviour of composite structures made of topologically interlocking concrete bricks with soft interfaces. Mater. Des. 2019, 186, 108347. [Google Scholar] [CrossRef]
  31. Liu, H.; Liu, P.; Lin, K.; Zhao, S. Cyclic Behavior of Mortarless Brick Joints with Different Interlocking Shapes. Materials 2016, 9, 166. [Google Scholar] [CrossRef] [PubMed]
  32. Hossain, M.A.; Totoev, Y.; Masia, M.J. Friction on mortar-less joints in semi interlocking masonry. In Proceedings of the 16th International Brick and Block Masonry Conference (IBMAC 2016), Padova, Italy, 26–30 June 2016; Modena, C., da Porto, F., Valluzzi, M.R., Eds.; pp. 1635–1643. [Google Scholar]
  33. Ali, M.; Gultom, R.J.; Chouw, N. Capacity of innovative interlocking blocks under monotonic loading. Constr. Build. Mater. 2012, 37, 812–821. [Google Scholar] [CrossRef]
  34. Xu, W.; Lin, X.; Xie, Y.M. A novel non-planar interlocking element for tubular structures. Tunn. Undergr. Space Technol. 2020, 103, 103503. [Google Scholar] [CrossRef]
  35. Kaneko, Y.; Connor, J.J.; Triantafillou, T.; Leung, C.K.Y. Fracture Mechanics Approach for Failure of Concrete Shear Key. I: Theory. J. Eng. Mech. 1993, 119, 681–700. [Google Scholar] [CrossRef]
  36. Quinonez, A.; Zessin, J.; Nutzel, A.; Ochsendorf, J. Small-Scale Models for Testing Masonry Structures. In Advanced Materials Research; Gu, X., Song, X., Eds.; Trans Tech Publications Ltd.: Freienbach, Switzerland, 2010; Volume 133, pp. 497–502. [Google Scholar]
  37. Geboers, E. Rebuilding the Notre Dame: A Phoenix Rising from the Ashes. Available online: https://medium.com/@eric_geboers/rebuiling-notre-dame-a-phoenix-rising-from-the-ashes-f087bf89f5ed (accessed on 1 January 2022).
  38. Menna, C.; Mata-Falcón, J.; Bos, F.P.; Vantyghem, G.; Ferrara, L.; Asprone, D.; Salet, T.; Kaufmann, W. Opportunities and challenges for structural engineering of digitally fabricated concrete. Cem. Concr. Res. 2020, 133, 106079. [Google Scholar] [CrossRef]
  39. Vantyghem, G.; De Corte, W.; Shakour, E.; Amir, O. 3D printing of a post-tensioned concrete girder designed by topology op-timization. Autom. Constr. 2020, 112, 103084. [Google Scholar] [CrossRef]
  40. Block Research Group. Striatus-3D Concrete Printed Masonry Bridge, Venice, Italy. 2021. Available online: https://www.block.arch.ethz.ch/brg/project/striatus-3d-concrete-printed-masonry-bridge-venice-italy-2021 (accessed on 1 January 2022).
  41. Rippmann, M.; Curry, J.; Escobedo, D.; Block, P. Optimising stone-cutting strategies for freeform masonry vaults. In Proceedings of the IASS Annual Symposium 2013, Wroclaw, Poland, 23–27 September 2013; Obrębski, J.B., Tarczewski, R., Eds.; International Association for Shell and Spatial Structures (IASS): Madrid, Spain; pp. 1–7.
  42. Weizmann, M.; Amir, O.; Grobman, Y.J. The effect of block geometry on structural behavior of topological interlocking as-semblies. Autom. Constr. 2021, 128, 103717. [Google Scholar] [CrossRef]
  43. Bast, K.M. Feasibility study of Leonardo da Vinci’s Bridge Proposal over the Golden Horn in Istanbul. Ph.D. Thesis, Massachusetts Institute of Technology, Cambridge, MA, USA, 2019. [Google Scholar]
  44. Heisel, F.; Schlesier, K.; Lee, J.; Rippmann, M.; Saeidi, N.; Javadian, A.; Hebel, D.E.; Block, P. Design of a load-bearing mycelium structure through informed structural engineering. In Proceedings of the World Congress on Sustainable Technologies (WCST-2017), Cambridge, MA, USA, 11–14 December 2017; Institute for Design and Construction Technology (IEB): Karlsruhe, Germany, 2017; pp. 45–49. [Google Scholar]
  45. Mele, T.V.; Mehrotra, A.; Echenagucia, M.T.; Frick, U.; Ochsendorf, J.; Dejong, M.; Block, P. Form finding and structural analysis of a freeform stone vault. In Proceedings of the IASS Annual Symposia 2016, Tokyo, Japan, 26–30 September 2016; International Association for Shell and Spatial Structures (IASS): Madrid, Spain, 2016; pp. 1–10. [Google Scholar]
  46. Rippmann, M. Funicular Shell Design: Geometric Approaches to Form Finding and Fabrication of Discrete Funicular Structures. Ph.D. Thesis, ETH Zurich, Zürich, Switzerland, 2016. [Google Scholar]
  47. Mousavian, E.; Casapulla, C. SiDMACIB Project. Marie Skłodowska-Curie Individual Fellowship, Grant Agreement No. 791235, (2018–2020). Available online: https://cordis.europa.eu/project/id/791235 (accessed on 1 January 2022).
  48. Mousavian, E.; Casapulla, C. Structurally informed design of interlocking block assemblages using limit analysis. J. Comput. Des. Eng. 2020, 7, 448–468. [Google Scholar] [CrossRef]
  49. Mousavian, E.; Casapulla, C. Quantifiable feasibility check of masonry assemblages composed of interlocking blocks. Adv. Eng. Softw. 2020, 149, 102898. [Google Scholar] [CrossRef]
  50. Mousavian, E.; Casapulla, C. Automated Shape Adjustment of Interlocking Joints for Structurally Informed Design of Masonry Block Assemblages. IOP Conf. Ser. Mater. Sci. Eng. 2021, 1044, 012006. [Google Scholar] [CrossRef]
  51. Ferris, M.C.; Tin-Loi, F. Limit analysis of frictional block assemblies as a mathematical program with complementarity con-straints. Int. J. Mech. Sci. 2001, 43, 209–224. [Google Scholar] [CrossRef] [Green Version]
  52. Smith, C.; Gilbert, M. Application of discontinuity layout optimization to plane plasticity problems. Proc. R. Soc. A Math. Phys. Eng. Sci. 2007, 463, 2461–2484. [Google Scholar] [CrossRef] [Green Version]
  53. Baraldi, D.; Reccia, E.; Cecchi, A. In plane loaded masonry walls: DEM and FEM/DEM models. A critical review. Meccanica 2017, 53, 1613–1628. [Google Scholar] [CrossRef] [Green Version]
  54. Lourenço, P.B. Masonry modeling. In Encyclopedia of Earthquake Engineering; Beer, M., Kougioumtzoglou, I., Patelli, E., Au, I.K., Eds.; Springer: Berlin/Heidelberg, Germany, 2014; pp. 1–13. [Google Scholar]
  55. Sarhosis, V.; Bagi, K.; Lemos, J.V.; Milani, G. (Eds.) Computational Modeling of Masonry Structures Using the Discrete Element Method; IGI Global: Harrisburg, PA, USA, 2016. [Google Scholar]
  56. Casapulla, C.; Argiento, L.U.; Maione, A.; Speranza, E. Upgraded formulations for the onset of local mechanisms in mul-ti-storey masonry buildings using limit analysis. Structures 2021, 31, 380–394. [Google Scholar] [CrossRef]
  57. Casapulla, C. Lower and upper bounds in closed form for out-of-plane strength of masonry structures with frictional resistances. Proceedings of Structural Analysis of Historic Constructions (SAHC08), Bath, UK, 2–4 July 2008; D’Ayala, D., Fodde, E., Eds.; Balkema: London, UK, 2008; Volume 2, pp. 1191–1198. [Google Scholar]
  58. Grillanda, N.; Chiozzi, A.; Milani, G.; Tralli, A. Efficient meta-heuristic mesh adaptation strategies for NURBS upper–bound limit analysis of curved three-dimensional masonry structures. Comput. Struct. 2020, 236, 106271. [Google Scholar] [CrossRef]
  59. Livesley, R.K. Limit analysis of structures formed from rigid blocks. Int. J. Numer. Methods Eng. 1978, 12, 1853–1871. [Google Scholar] [CrossRef]
  60. Livesley, R.K. A computational model for the limit analysis of three-dimensional masonry structures. Meccanica 1992, 27, 161–172. [Google Scholar] [CrossRef]
  61. Portioli, F.; Cascini, L.; Casapulla, C.; D’Aniello, M. Limit analysis of masonry walls by rigid block modelling with cracking units and cohesive joints using linear programming. Eng. Struct. 2013, 57, 232–247. [Google Scholar] [CrossRef]
  62. Dowling, N.E. Mechanical Behavior of Materials, 2nd ed.; Prentice-Hall: Englewood Cliffs, NJ, USA, 1998. [Google Scholar]
  63. Gilbert, M.; Smith, C.; Pritchard, T.J. Masonry arch analysis using discontinuity layout optimisation. Proc. Inst. Civ. Eng.-Eng. Comput. Mech. 2010, 163, 155–166. [Google Scholar] [CrossRef]
  64. Stockdale, G.L.; Sarhosis, V.; Milani, G. Seismic capacity and multi-mechanism analysis for dry-stack masonry arches subjected to hinge control. Bull. Earthq. Eng. 2020, 18, 673–724. [Google Scholar] [CrossRef]
  65. Iannuzzo, A.; Dell’Endice, A.; Van Mele, T.; Block, P. Numerical limit analysis-based modelling of masonry structures sub-jected to large displacements. Comput. Struct. 2021, 242, 106372. [Google Scholar] [CrossRef]
Figure 1. Three stereotomy techniques generating three different joint layouts with different load-bearing capacities: (a) false skew arch; (b) helicoidal method; (c) logarithmic method. Red arrows represent external loads applied to the arches beside their own weight.
Infrastructures 07 00009 g001
Figure 2. A pavilion vault with: (a) internal and peripheral interfaces at the boundary of the segments; (b) only peripheral interfaces; (c) a network of interfaces.
Infrastructures 07 00009 g002
Figure 3. Segmenting a continuum along the segmenting lines; each generated model includes a set of internal and/or peripheral interfaces. Capital letters A, B, and C are used to enumerate the segments.
Infrastructures 07 00009 g003
Figure 4. (a) A simple 2D problem of a rectangular continuum with no-tension material having four segmenting lines. Internal forces (in Newtons) and moments (in Newton-meters) at the interfaces of: (b) the unsegmented model with λ = 0.5; (c) the segmental model with λ = 0.25. Capital letters A and B are used to enumerate the segments.
Infrastructures 07 00009 g004
Figure 5. (a) Same 2D problem as Figure 4a developed using classic limit analysis. Variables involved in the segmentation method, including: (b) the load factor and the internal forces and moments; (c) the shear strength at each interface.
Infrastructures 07 00009 g005
Figure 6. (a) The optimization result with limit analysis for the 2D problem generating two segments, including: (b) the load factor and the internal forces (in Newton) and moments (in Newton-meter); (c) the shear strength at each interface. Capital letters A and B are used to enumerate the segments.
Infrastructures 07 00009 g006aInfrastructures 07 00009 g006b
Figure 7. (a,b) Two subsets of initial input interfaces for complex geometries; (c) a set of internal and peripheral interfaces generating (d) invalid and (e) valid segments.
Infrastructures 07 00009 g007
Figure 8. An equilibrated interface, with the tangential and normal forces acting on the interface as well as horizontal and vertical forces acting on the interface endpoints.
Infrastructures 07 00009 g008
Figure 9. (a) Similar 2D problem to Figure 4a developed using DLO. Variables involved in the segmentation method including: (b) the load factor and the loads acting on the nodes; (c) internal forces acting on the interfaces; (d) the shear strength at each interface.
Infrastructures 07 00009 g009
Figure 10. (a) The optimization result with DLO for the 2D problem generating two segments, including: (b) the load factor and the loads acting on the nodes; (c) the internal forces acting on the interfaces; (d) the shear strength at each interface. Capital letters A and B are used to enumerate the segments.
Infrastructures 07 00009 g010
Figure 11. Semi-circular arch as originally presented by Stockdale et al. [64].
Infrastructures 07 00009 g011
Figure 12. (a) A dense network of neutral interfaces, allowing the (b) modelling of arch-shaped structures having joints with complex shapes that can generate (c) interlocking concave segments.
Infrastructures 07 00009 g012aInfrastructures 07 00009 g012b
Figure 13. Internal forces (in Newtons) and moments (in Newton-meters) as well as the thrust line obtained by Equation (8) for the simple example of Figure 11 with peripheral joints, when the friction angle is: (a) 35° and (b) 17.6°.
Infrastructures 07 00009 g013
Figure 14. Optimal solutions found by Equation (9) for the three friction angles of: (a) 35°; (b) 27.28°, and (c) 17.6°.
Infrastructures 07 00009 g014
Table 1. Computed load factors for twelve configurations of the segmental models with no-tension material.
OptionsBlock CombinationInterface LayoutλOptionsBlock CombinationInterface Layoutλ
Ep1 Infrastructures 07 00009 i001 Infrastructures 07 00009 i0020.5Ep7 Infrastructures 07 00009 i003 Infrastructures 07 00009 i0040.25
Ep2 Infrastructures 07 00009 i005 Infrastructures 07 00009 i0060Ep8 Infrastructures 07 00009 i007 Infrastructures 07 00009 i0080.25
Ep3 Infrastructures 07 00009 i009 Infrastructures 07 00009 i0100Ep9 Infrastructures 07 00009 i011 Infrastructures 07 00009 i0120.25
Ep4 Infrastructures 07 00009 i013 Infrastructures 07 00009 i0140.5Ep10 Infrastructures 07 00009 i015 Infrastructures 07 00009 i0160.25
Ep5 Infrastructures 07 00009 i017 Infrastructures 07 00009 i0180Ep11 Infrastructures 07 00009 i019 Infrastructures 07 00009 i0200.25
Ep6 Infrastructures 07 00009 i021 Infrastructures 07 00009 i0220Ep12 Infrastructures 07 00009 i023 Infrastructures 07 00009 i0240.25
Table 2. Results obtained by Equation (8) and Stockdale et al. [64] for the simple example of Figure 11 when all the interfaces are peripheral.
φ = 35°φ = 17.6°
λ obtained by Equation (8)0.82790.483
λ obtained by Stockdale et al. [64]0.81180.4878
Table 3. Computed load factors of sixteen segmental arches for friction angles of 27.28° and 17.6°.
φ = 17.6° Infrastructures 07 00009 i025λ = 0.7969 Infrastructures 07 00009 i026λ = 0.483 Infrastructures 07 00009 i027λ = 0.483 Infrastructures 07 00009 i028λ = 0.7969
φ = 27.28° Infrastructures 07 00009 i029λ = 0.8279 Infrastructures 07 00009 i030λ = 0.8084 Infrastructures 07 00009 i031λ = 0.8084 Infrastructures 07 00009 i032λ = 0.8279
Ec5Ec6Ec7Ec8
φ = 17.6° Infrastructures 07 00009 i033λ = 0.8279 Infrastructures 07 00009 i034λ = 0.483 Infrastructures 07 00009 i035λ = 0.8279 Infrastructures 07 00009 i036λ = 0.483
φ = 27.28° Infrastructures 07 00009 i037λ = 0.8279 Infrastructures 07 00009 i038λ = 0.8084 Infrastructures 07 00009 i039λ = 0.8279 Infrastructures 07 00009 i040λ = 0.8084
Ec1Ec2Ec3Ec4
φ = 17.6° Infrastructures 07 00009 i041λ = 0.7969 Infrastructures 07 00009 i042λ = 0.483 Infrastructures 07 00009 i043λ = 0.483 Infrastructures 07 00009 i044λ = 0.483
φ = 27.28° Infrastructures 07 00009 i045λ = 0.8279 Infrastructures 07 00009 i046λ = 0.8084 Infrastructures 07 00009 i047λ = 0.8084 Infrastructures 07 00009 i048λ = 0.8084
Ec13Ec14Ec15Ec16
φ = 17.6° Infrastructures 07 00009 i049λ = 0.483 Infrastructures 07 00009 i050λ = 0.8279 Infrastructures 07 00009 i051λ = 0.8279 Infrastructures 07 00009 i052λ = 0.7969
φ = 27.28° Infrastructures 07 00009 i053λ = 0.8084 Infrastructures 07 00009 i054λ = 0.8279 Infrastructures 07 00009 i055λ = 0.8279 Infrastructures 07 00009 i056λ = 0.8279
Ec9Ec10Ec11Ec12
Publisher’s Note: MDPI stays neutral with regard to jurisdictional claims in published maps and institutional affiliations.

