Article

Energy Resilience Impact of Supply Chain Network Disruption to Military Microgrids

Department of Systems Engineering, Naval Postgraduate School, Monterey, CA 93940, USA
*
Author to whom correspondence should be addressed.
Infrastructures 2022, 7(1), 4; https://doi.org/10.3390/infrastructures7010004
Submission received: 19 November 2021 / Revised: 18 December 2021 / Accepted: 23 December 2021 / Published: 30 December 2021
(This article belongs to the Special Issue Infrastructure Resilience in Emergency Situations)

Abstract

:
The ability to provide uninterrupted power to military installations is paramount in executing a country’s national defense strategy. Microgrid architectures increase installation energy resilience through redundant local generation sources and the capability for grid independence. However, deliberate attacks from near-peer competitors can disrupt the associated supply chain network, thereby affecting mission critical loads. Utilizing an integrated discrete-time Markov chain and dynamic Bayesian network approach, we investigate disruption propagation throughout a supply chain network and quantify its mission impact on an islanded microgrid. We propose a novel methodology and an associated metric we term “energy resilience impact” to identify and address supply chain disruption risks to energy security. The proposed methodology addresses a gap in the literature and practice where it is assumed supply chains will not be disrupted during incidents involving microgrids. A case study of a fictional military installation is presented to demonstrate how installation energy managers can adopt this methodology for the design and improvement of military microgrids. The fictional case study shows how supply chain disruptions can impact the ability of a microgrid to successfully supply electricity to critical loads throughout an islanding event.

1. Introduction

The United States (US) Department of Defense (DoD) considers the microgrid an essential building block for improving energy resilience across its installations [1]. Microgrids offer protection from power disruptions, whether natural or man-made, through the utilization of distributed energy resources (DERs) independent of the utility grid. Military installations, especially those in remote areas, are similarly dependent on supply chain networks (SCNs) to ensure continuity of operations [2,3]. The past three decades of globalization and technological development have driven modern SCNs to become leaner and more efficient [4]; adversely, they are now increasingly complex and less resilient to disruption. The changing geopolitical situation (e.g., Nord Stream 2, trade tariffs etc.) amidst the ongoing COVID-19 pandemic has provided valuable insights on the weaponization of SCN vulnerabilities. In February 2021, Executive Order 14017 [5] directed the US government to conduct a thorough review of the nation’s critical SCNs. Results of the task force [6] elucidated significant risks to both economic and national security—necessitating new perspectives with respect to supply chain risk management (SCRM).
Current analysis techniques for microgrid resilience make assumptions about logistics which may not always hold true. The growing threat from near-peer competitors presents the very real possibility of deliberate attacks on critical infrastructures. As such, we investigate the consequences of SCN disruption to military microgrids operating under islanded conditions. We develop a corresponding methodology to assist installation energy managers (IEMs) in the identification and assessment of supply-related risks to energy security and, furthermore, provide an impact metric to link power interruption with mission impact.
The remainder of this article is organized as follows: Section 2 provides basic definitions and background information, Section 3 presents a methodology to evaluate the impact of SCN disruption to a military microgrid, Section 4 demonstrates the proposed methodology on a fictional military installation, Section 5 discusses conclusions and potential for future work, and Section 6 summarizes the article.

2. Background and Literature Review

This section provides background on concepts required to understand the specific contribution of this article. Established methodologies, related research, and initiatives are also discussed to identify the key drivers and current gaps within the literature.

2.1. Overview of Military Microgrids

The US Department of Energy defines a microgrid as “a group of interconnected loads and distributed energy resources within clearly defined electrical boundaries that acts as a single controllable entity with respect to the [utility] grid. A microgrid can connect and disconnect from the [utility] grid to enable it to operate in both grid-connected or island mode” [7]. This commonly cited definition highlights the three main requirements that characterize a microgrid [8]:
  • Identifiable. The system has both physical and functional boundaries with an external interface at the utility grid junction [9,10]. From a systems engineering perspective, the microgrid not only encompasses the physical equipment and software but also the people (e.g., operators, maintenance organizations, etc.) and processes required to ensure system operability [10,11].
  • Independent. The microgrid remains functional regardless of its connection status with the utility grid [8,12]. While operating in island mode, local generation sources (e.g., diesel generators, photovoltaics (PVs), etc.) provide power to critical loads and may be supplemented via energy storage systems (ESSs) [13,14].
  • Intelligent. A microgrid controller manages the resources defined within the system boundary (including the utility grid interface) [12,15] and may utilize cooperative control when operating in grid-connected mode [16]. Traditional microgrids have primarily focused on islanding, whereas newer “smart grids” use energy management systems (EMSs) to balance electrical demand, schedule the dispatch of resources, and preserve overall grid reliability [15,17,18].
The benefits to adopting a microgrid architecture are increased energy security, reduced life cycle costs, and increased utilization of renewable energy sources [8,19]. Of those three, the DoD prioritizes increased energy security to ensure the mission readiness of the armed forces [20]. Historically, DoD installations have relied on dedicated emergency diesel generators (EDGs) in a variety of configurations [21] to provide backup power to critical loads [22,23]; however, these architectures are typically not well integrated with internal resources or the utility grid [22,24]. Consequently, the installations are left vulnerable during extended power outages or periods of high stress on the larger transmission and distribution system [22,25,26]. Microgrids provide an electrical infrastructure that combines multiple forms of DERs and are better suited to withstand and recover from energy disruptions [22,24,27].
Threats to microgrids include component reliability, natural weather phenomena (e.g., hurricanes, floods, climate change, etc.), environmental changes, and other forces capable of disrupting power flow from the utility grid [14,28]. Microgrids designed for military use are particularly susceptible to various forms of deliberate attack (physical [29], human, and cyber [30]). As assets to national security, military microgrids must be approached with mission assurance at the forefront [31]. DoD Instruction 3020.45 [32] recognizes that energy resilience efforts addressing risks to critical infrastructure directly support the “Mission Assurance Construct”, a DoD-wide process to identify, assess, and monitor the risks to strategic missions. As such, a holistic approach based on risk and associated impact is required to effectively design a military microgrid [14,33].

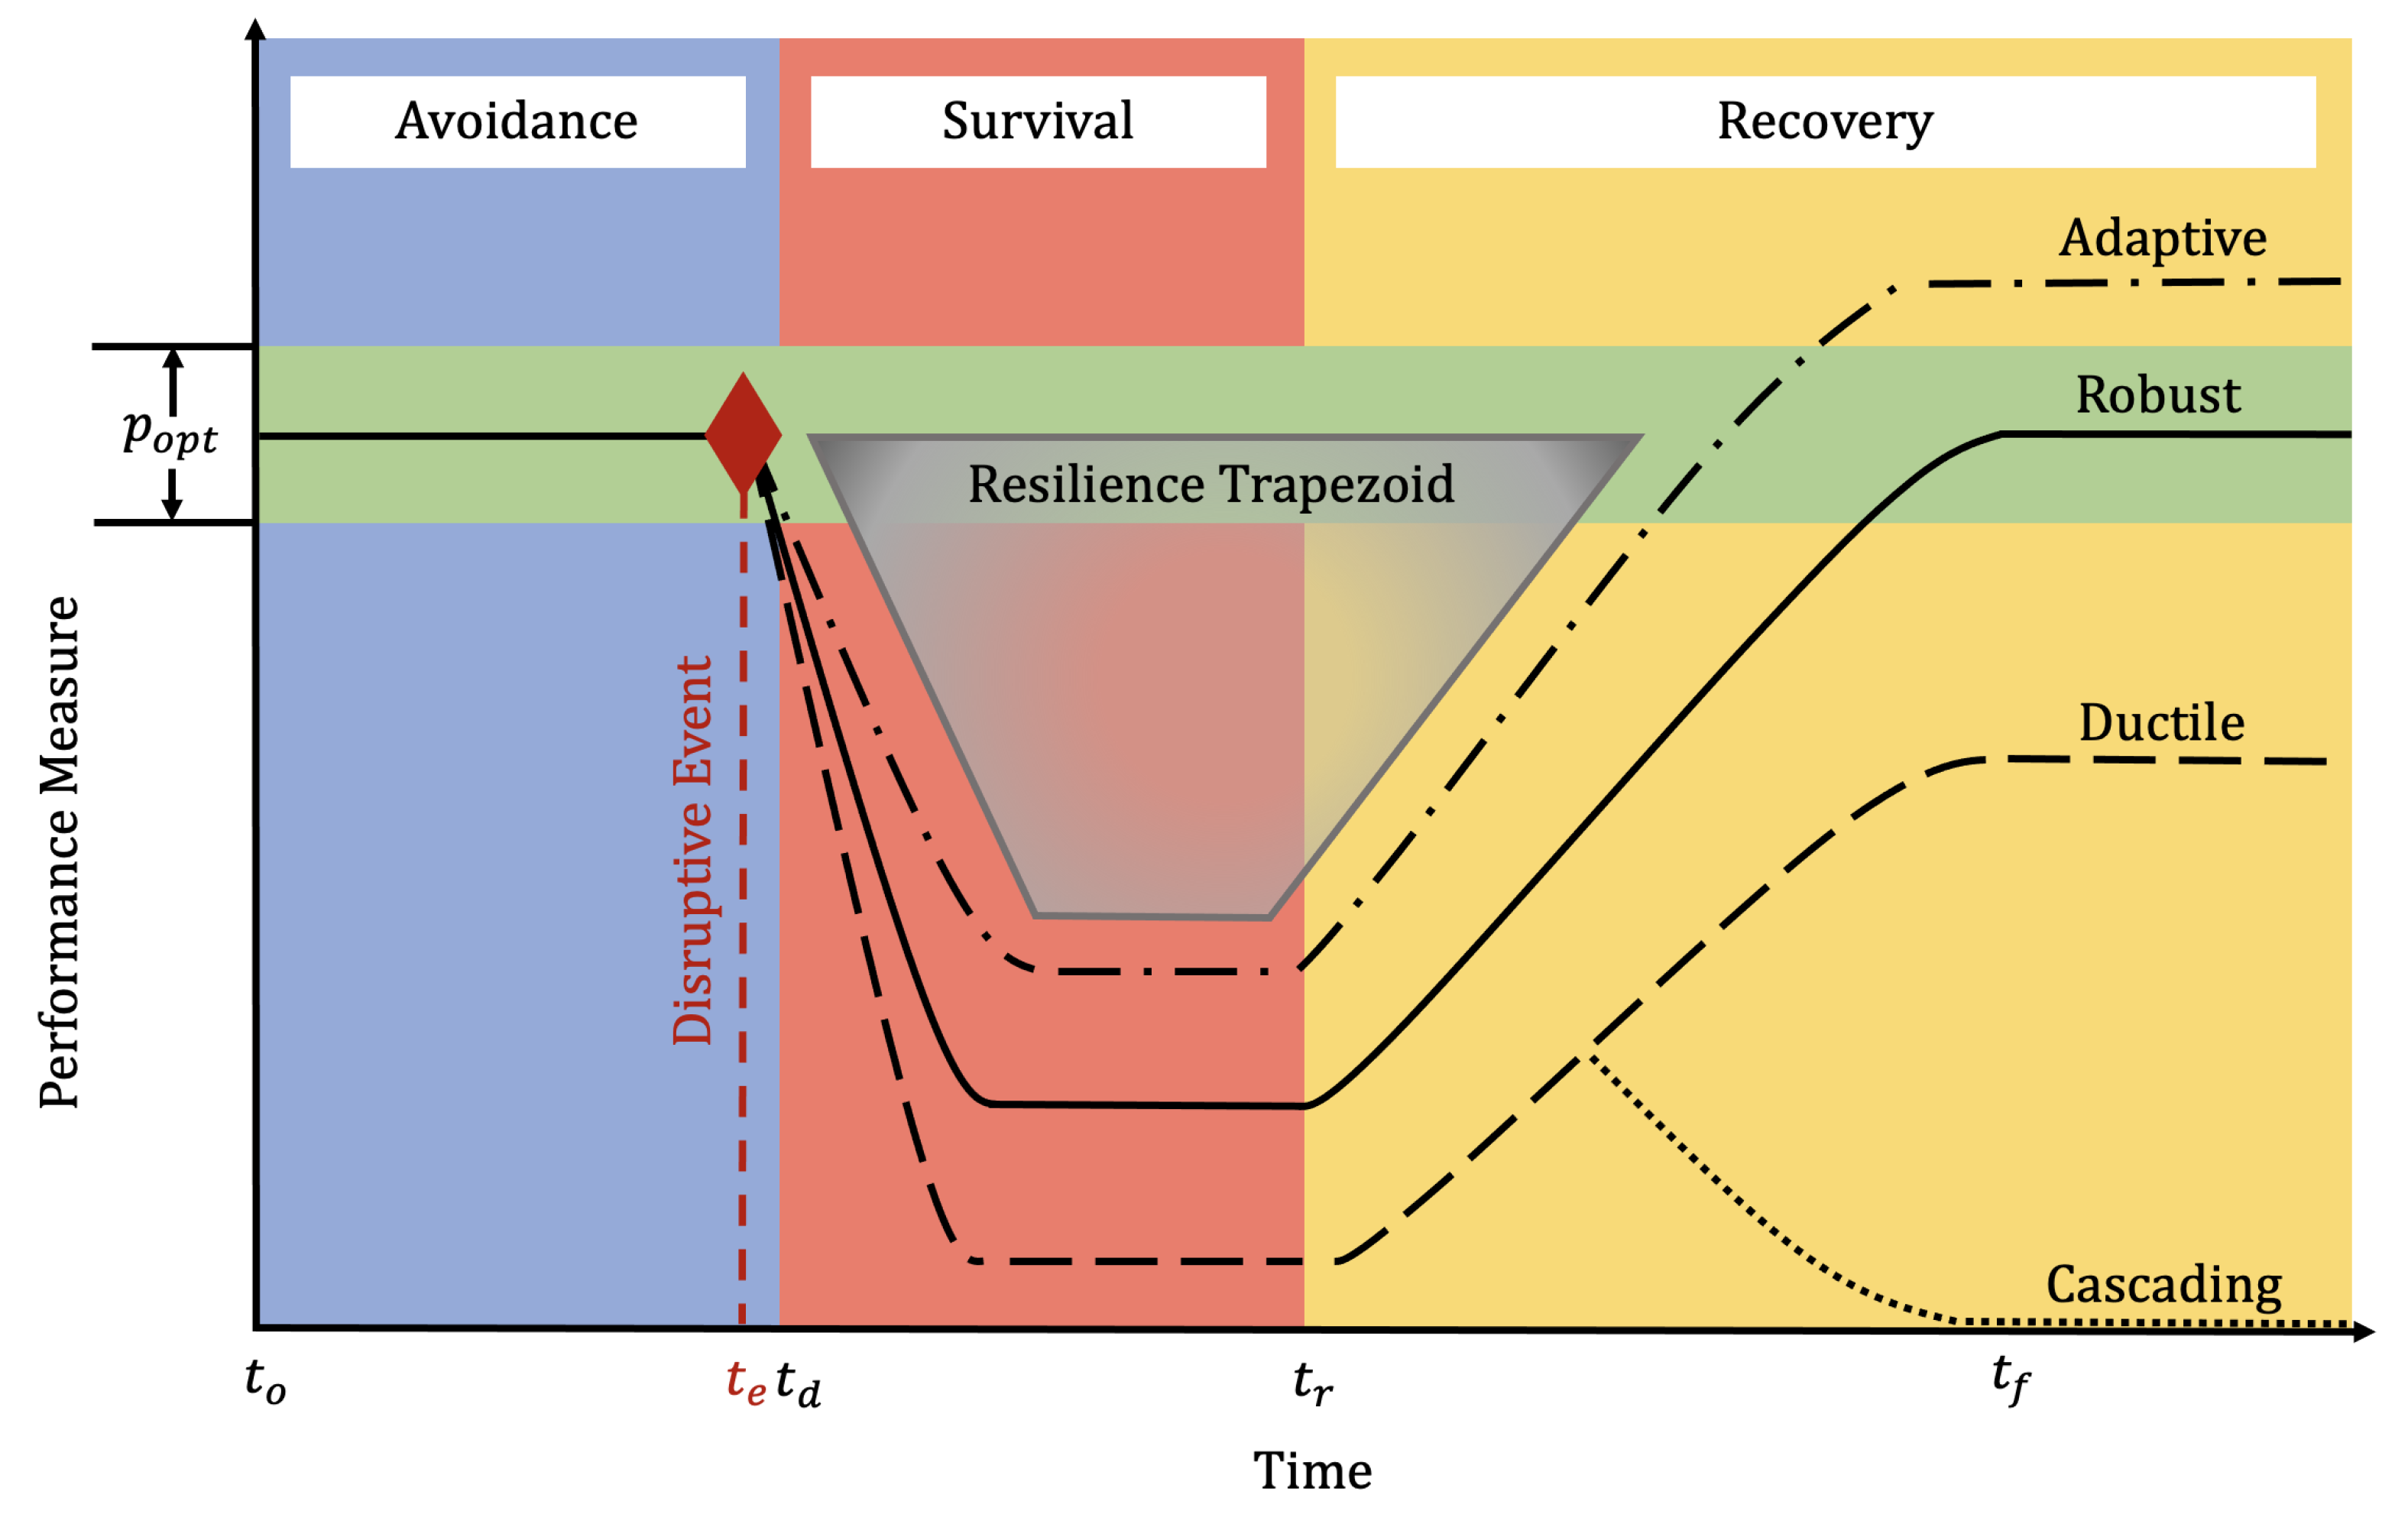
2.2. Measuring Energy Resilience

The Department of the Navy characterizes energy resilience as one of the three pillars of energy security, alongside energy reliability and efficiency [34]. While there are a variety of definitions that exist within the literature, resilience essentially refers to a system’s response and ability to maintain vital functions before, during, and after a disruptive event [35]. Military definitions of energy resilience typically align with their civilian counterparts but will notably incorporate the mission aspect as it pertains to critical loads [36,37]. Within the context of 10 U.S.C. § 101(e)(6) [38], energy resilience ensures “energy availability and reliability sufficient to”: (1) “provide for mission assurance and readiness”, and (2) “execute or rapidly reestablish mission essential requirements” after an unanticipated energy disruption. This working definition highlights the two main requirements for which military microgrids will be assessed in this article.
The first step towards establishing a suitable metric for energy resilience is to examine a microgrid under perturbation. The performance curve in Figure 1 is adapted from Bruneau et al.’s [39] framework for resilience and conceptualizes a microgrid’s response to a disruptive event as a function of time. Typically, system performance outlines a trapezoidal shape as it transitions through different phases of resilience (avoidance, survival, and recovery) [40]. During the avoidance phase [to, td), the microgrid is in a stable state and can anticipate, prepare, and take precautionary measures against disruptions [41]. The event itself occurs at te; however, depending on its severity and the microgrid’s absorptive features (e.g., physical configuration, casualty control procedures, etc.), system performance may not immediately decline (i.e., “invulnerability period”) [40,42]. Once the microgrid is unable to maintain optimal performance parameters (popt), it enters the survival phase [td, tr) and may take adaptive measures (e.g., load shedding [43], intentional islanding [44], etc.) to protect critical loads. Finally, the recovery phase [tr, tf] aims to restore the system from a degraded to normal operational state and may span from days to years contingent on the damage to critical infrastructure [45,46]. Depending on the extent of restoration, the microgrid’s recovery behavior may be characterized as either robust [39], adaptive [47], ductile [48], or cascading [49,50,51].
The increasing number of publications related to microgrids has introduced various measures for energy resilience [35,55,56,57,58,59,60,61,62,63,64,65]. Several methods are based on the performance curve depicted in Figure 1 and attempt to capture resilience within a single measure [41,66]. Henry and Ramirez-Marquez [67] quantified resilience as the comparison between recovery and loss, whereas Ouyang and Dueñas-Osorio [68] utilized the area between optimal and actual performance curves (the trapezoidal area). Furthermore, researchers [58,69,70,71,72,73,74] have defined specific components of the “resilience trapezoid” establishing concepts such as absorptive, adaptive, and restorative capacity (see Vugrin et al. [52]). However, not all measures are solely performance-based. Related studies [41,75,76,77] have also explored the resilience-cost tradespace. In particular, Giraldez et al. [78] proposed a customer damage function representing interruption cost as a function of outage duration. Hildebrand [79] and similarly Bolen et al. [80] applied net present value to ascertain the life-cycle cost of energy resilient solutions. A cost-based approach, however, proves difficult when assigning a monetary value to mission assurance and (to a greater extent) national security [36,81].
Instead, the DoD uses Mission Dependency Index ( M D I ) to distinguish between critical and non-critical facilities aboard military installations [82]:
M D I = 26.54 D W + 0.125 1 A k = 1 A D B + 0.1 ln A 25.54 ,
where D W is mission intradependency (i.e., “within”), D B is mission interdependency (i.e., “between”), and A is the number of mission areas identifying interdependency. Through expert elicitation of D W and D B , a normalized score between 0 and 100 is calculated for each facility, with 100 being most impactful to mission assurance [83,84]. The coefficients and resulting equation were based on three-years of extensive field testing [85]. Some researchers have adapted M D I into an overarching resilience metric or methodology. In Peterson et al.’s [14] approach, energy resilience is quantified by expected electrical disruption mission impact (EEDMI), wherein M D I provides the input to mission impact per unit time [86]. Moreover, Beaton [87] and Kain et al. [36] incorporated EEDMI in their investigation of resilient microgrid configurations (ESSs and nanogrids). However, despite its widespread use, several critiques [85,88,89] have disputed the efficacy of M D I ; notably, it neglects facility interdependencies and implies that supporting infrastructures (e.g., roads, power lines, etc.) remain operational to service high-scoring assets (an unrealistic assumption) [88]. Related research, particularly Smith [90] and Fish [88], further address these shortcomings.
In 2021, the DoD issued a memorandum [91] regarding energy metrics and standards at military installations, defining energy resilience for a critical load, R C , as:
R C = T U T = T U T U + T D ,
where T is the total assessment period, T U is the length of time it receives sufficient energy to provide for mission assurance (i.e., “uptime”), and T D is the remaining duration of insufficient energy throughput (i.e., “downtime”). By this definition, desired mission availability establishes the benchmark for energy resilience. For example, in order to achieve R C = 0.99 , T D cannot exceed 20 min in a two-week period; for R C = 0.98 , that number is approximately 400 min. While Equation (2) provides an initial metric for critical load analysis, an aggregate reading must be used to represent the microgrid as a whole [91]. Previous work by Kwasinski [92] used an analogous measure, which we adapt to express microgrid resilience, R M , for N critical loads as:
R M = i = 1 N T U , i N T = i = 1 N T U , i i = 1 N ( T U , i + T D , i ) ,
where T U , i and T D , i is uptime and downtime, respectively, for an individual critical load i. A distinct feature of Equation (3) is its scalability to portions of the microgrid. For instance, N can represent the critical loads in a specific lateral or feeder, or a given substation [92]. Also note that while Equations (2) and (3) resemble well-established definitions of energy availability [93,94], they are not synonymous and differ in application [46,92]. Energy availability is calculated from numerous maintenance and repair cycles, whereas energy resilience is based on a single disruptive event [92,95]. Additionally, if repeated over multiple occurrences, R M can measure subsequent improvements in design or operational policy [92]. For these reasons, we interpret Equation (3) as within DoD guidance and suitable for the research purposes presented in this article.

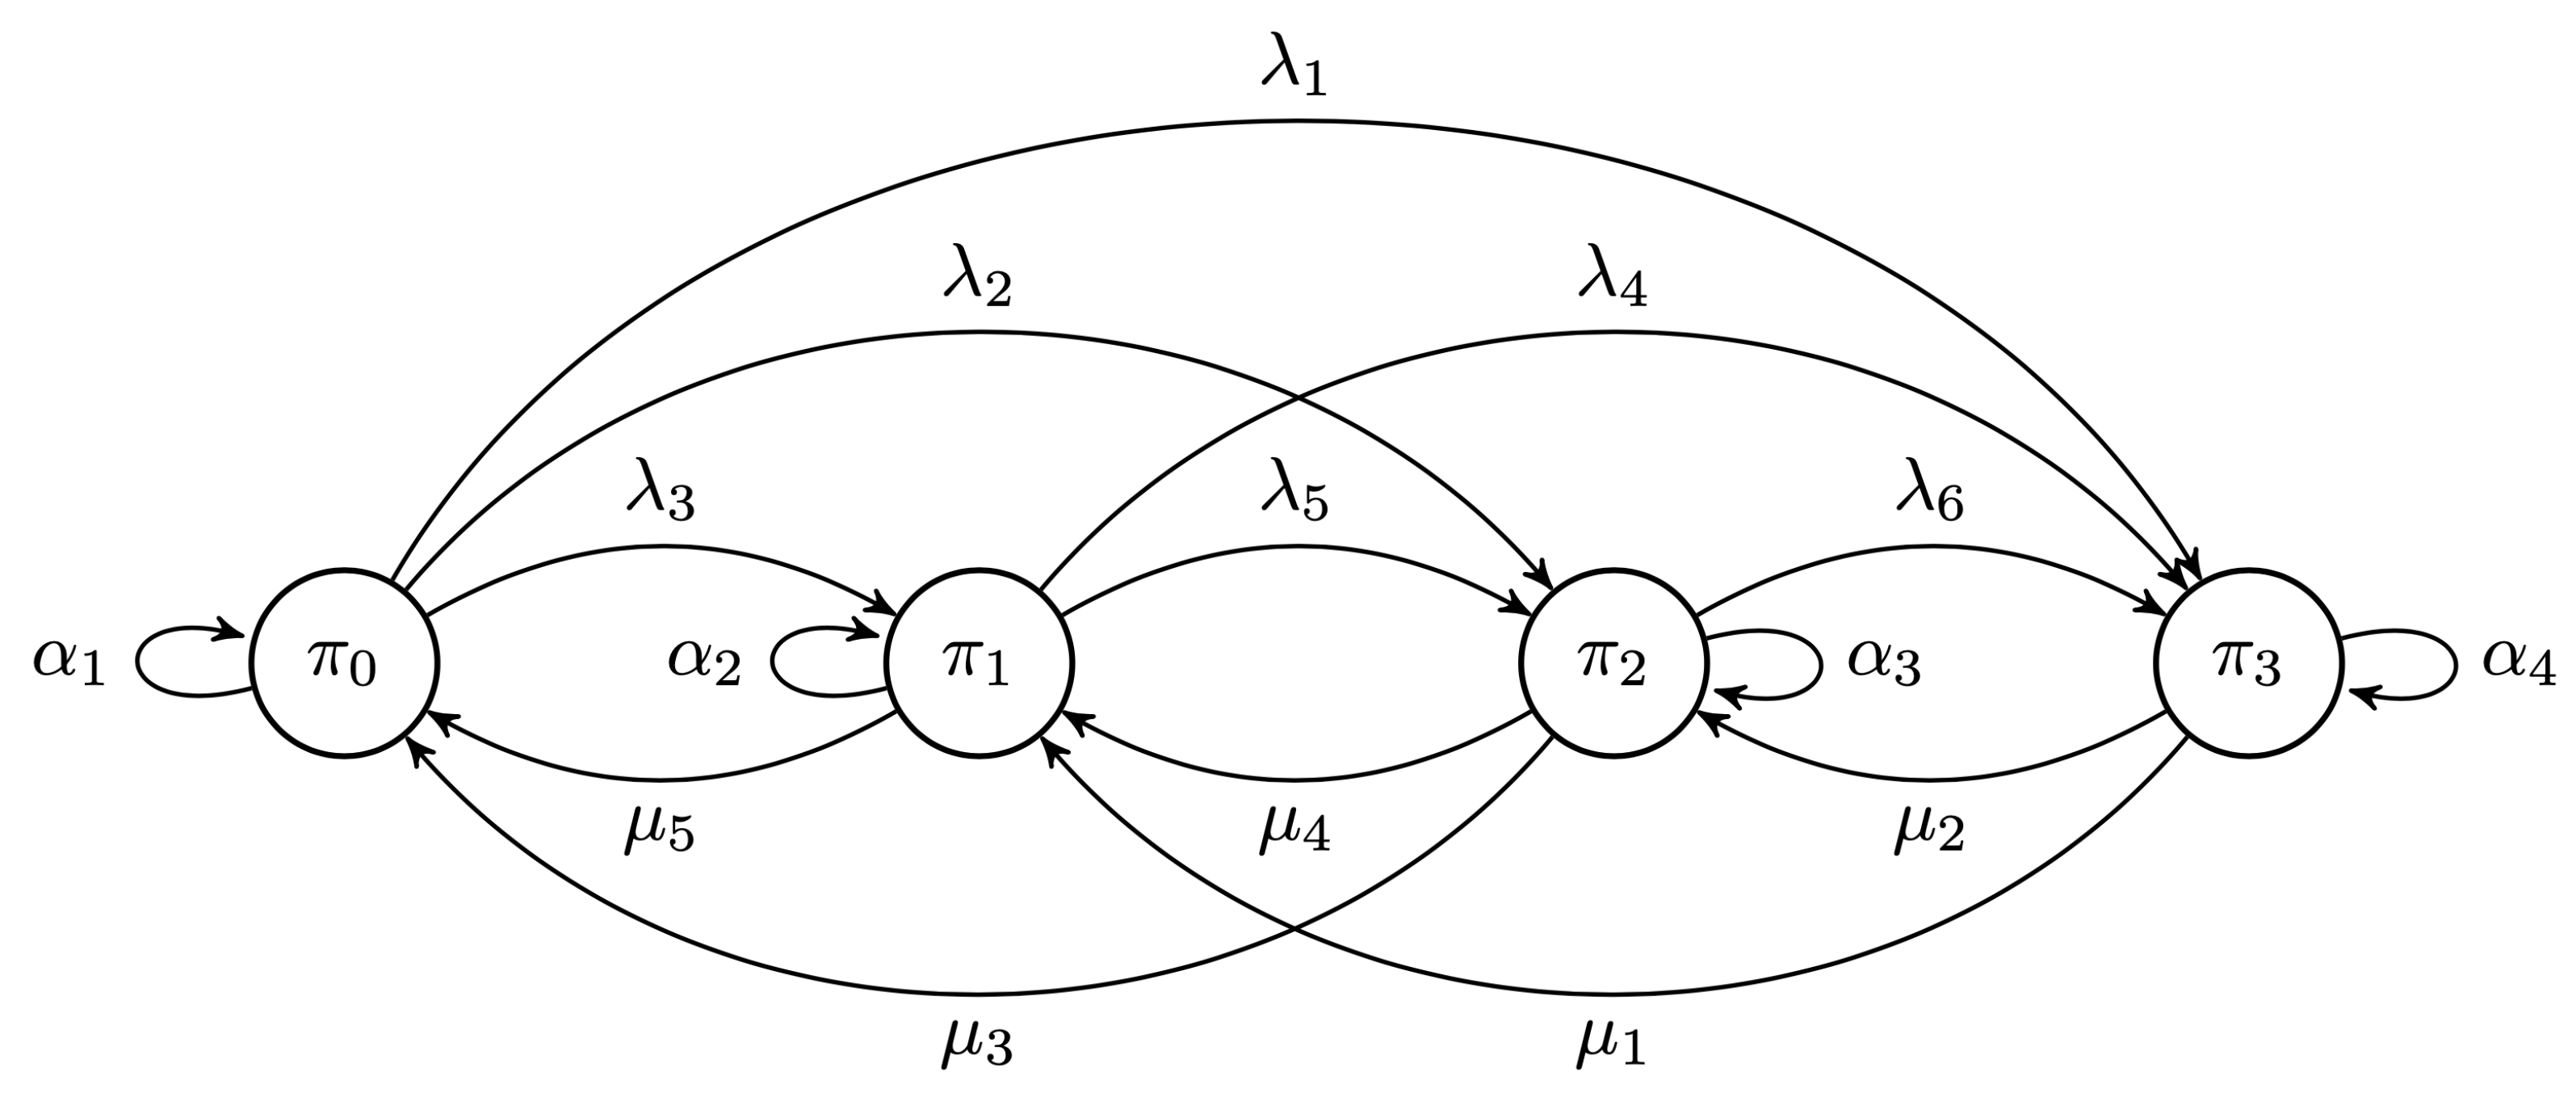
2.3. Modeling Supply Chain Network Disruption

A supply chain refers to the socio-technical network required to identify, target, and fulfill a specific demand [96]. Although fundamentally simple, SCNs are increasingly complex depending on the scope or perspective [97,98,99]. Consider the SCN depicted in Figure 2. The individual entities, referred to as “nodes” in graph lexicon, are involved in the conversion, logistics (e.g., distribution, storage, etc.), and transaction of materiel to an ultimate customer [100]. Relationships between nodes, or “arcs”, are physical and functional connections (e.g., routes, communications, etc.) represented by uni- or bi-directional flows [96,100]. Within the SCRM literature, the degradation and interdiction of specific arcs has been a key area of interest for civilians and military alike [101,102]. In many instances, cash-flow management is of specific interest to ensure business continuity and long-term profitability [103,104]. However, despite the private sector’s preference towards a financial perspective, the US government views SCRM through the lens of mission assurance. DoD Instruction 5200.44 [105] defines SCRM as a systematic process to protect mission critical functions by administering susceptibilities, vulnerabilities, and threats throughout a SCN. The process takes a four-step approach towards managing risk (identification, assessment, treatment, and monitoring) in line with International Standards Organization 31000 guidelines [106].
SCN risks fall into two broad categories according to source [107]. Operational risks are inherent uncertainties within the SCN (e.g., unknown supply and demand, safety recalls, etc.) and are typically low-impact-high-probability occurrences [108]; in contrast, disruption risks refer to high-impact-low-probability (HILP) events ordinarily caused by external forces [108]. Prominent examples are listed in Table 1 for reference. Specific to HILP events, a phenomena known as the “ripple effect” occurs when a disruption, rather than remain localized to a node or portion of the SCN, continues to cascade downstream (shown in Figure 2) [109]. The potential impacts may result in longer lead times or damaging financial implications throughout the network [109,110].
As such, there has been significant literature regarding the ripple effect and its consequences across various domains [109]. Gholami-Zanjani et al. [126] assessed its effect on the food industry as a basis for location-allocation and inventory-replenishment decisions. Chauhan et al. [127] developed a tripartite ripple effect model investigating the benefits of a nested SCN topology, whereas others have applied mathematical optimization (e.g., mixed-integer and stochastic programming, etc.) in their studies of disruption propagation [128,129]. Of note, an emerging research area within SCRM is the use of dynamic Bayesian networks (DBNs) as a method for transient analysis [130]. A DBN approach can effectively capture the temporal probabilistic dependencies between nodes through the use of conditional probability tables (CPTs) and interconnected time-slices [131]. Specifically, Hosseini et al. [132] proposed a ripple effect model integrating DBNs with discrete-time Markov chains (DTMCs), thereby also accounting for the dynamicity (e.g., vulnerability, recoverability, etc.) of individual nodes. The DMTCs are equalized into a greater DBN (representing the SCN) to simulate the propagating behavior of supplier disruption [132].
For example, consider the SCN node in Figure 3. The four states represent varying levels of operational capacity—fully operational ( π 0 ), semi-disrupted ( π 1 ), heavily-disrupted ( π 2 ), and fully disrupted ( π 3 ). As a Markovian process, predictions can be made of its future states based solely on its current state (i.e., memoryless) [133], with the transition probabilities associated with state changes reflecting nodal reaction and response. In this case, the initial shock due to disruption ( λ 1 , λ 2 , or λ 3 ) may result in a regression to one of three states depending on severity. Cascading failures ( λ 4 , λ 5 , and λ 6 ) represent scenarios in which the inability to complete satisfactory repairs incurs additional damage [134]. Otherwise, if repairs ( μ 2 , μ 4 , and μ 5 ) are successful, then the node may revert to a more operationally capable state or, if able, employ surge capacity ( μ 1 and μ 3 ) to accelerate the recovery timeline [135]. It is also possible for the node to remain in its current state ( α n ) rather than transition to another. Assuming that the Markov chain is irreducible and aperiodic, then there exists an equilibrium condition in which state probabilities no longer change after a sufficiently large time interval, irrespective of the initial state [136]. These steady-state probabilities may be solved for algebraically or through a series of matrix operations.
Subsequently, a collection of DTMCs may be integrated into a Bayesian network (e.g., the SCN in Figure 2), wherein the causal relationships between parent and child nodes are described by CPTs [137]. The Bayesian network is then characterized as dynamic when its random variables are indexed over a discretized timeline, allowing a node at ith time-slice to be conditionally dependent on its parents at the present time-slice and its own state in a previous one [138]. Thus, a DTMC-DBN approach is an effective tool for modeling not only disruption risks but also the ripple effect which occurs thereafter. Individual nodes or sections may be further examined to formulate observations regarding total expected utility, service level, and arc criticality [132]. But this method is not without its disadvantages. As the number of variables increase (e.g., states, parents, etc.), probability calculation quickly becomes intractable [139]. Specifically, the accuracy of CPTs is heavily dependent on expert elicitation or historical data, which may or may not be readily available [140,141]. To cope with the challenges of a scant data environment, Liu et al. [142] introduced a robust DBN optimization model for small-size instances and a simulated annealing (SA) algorithm to handle larger-scale problems.

2.4. Specific Contribution to the Literature
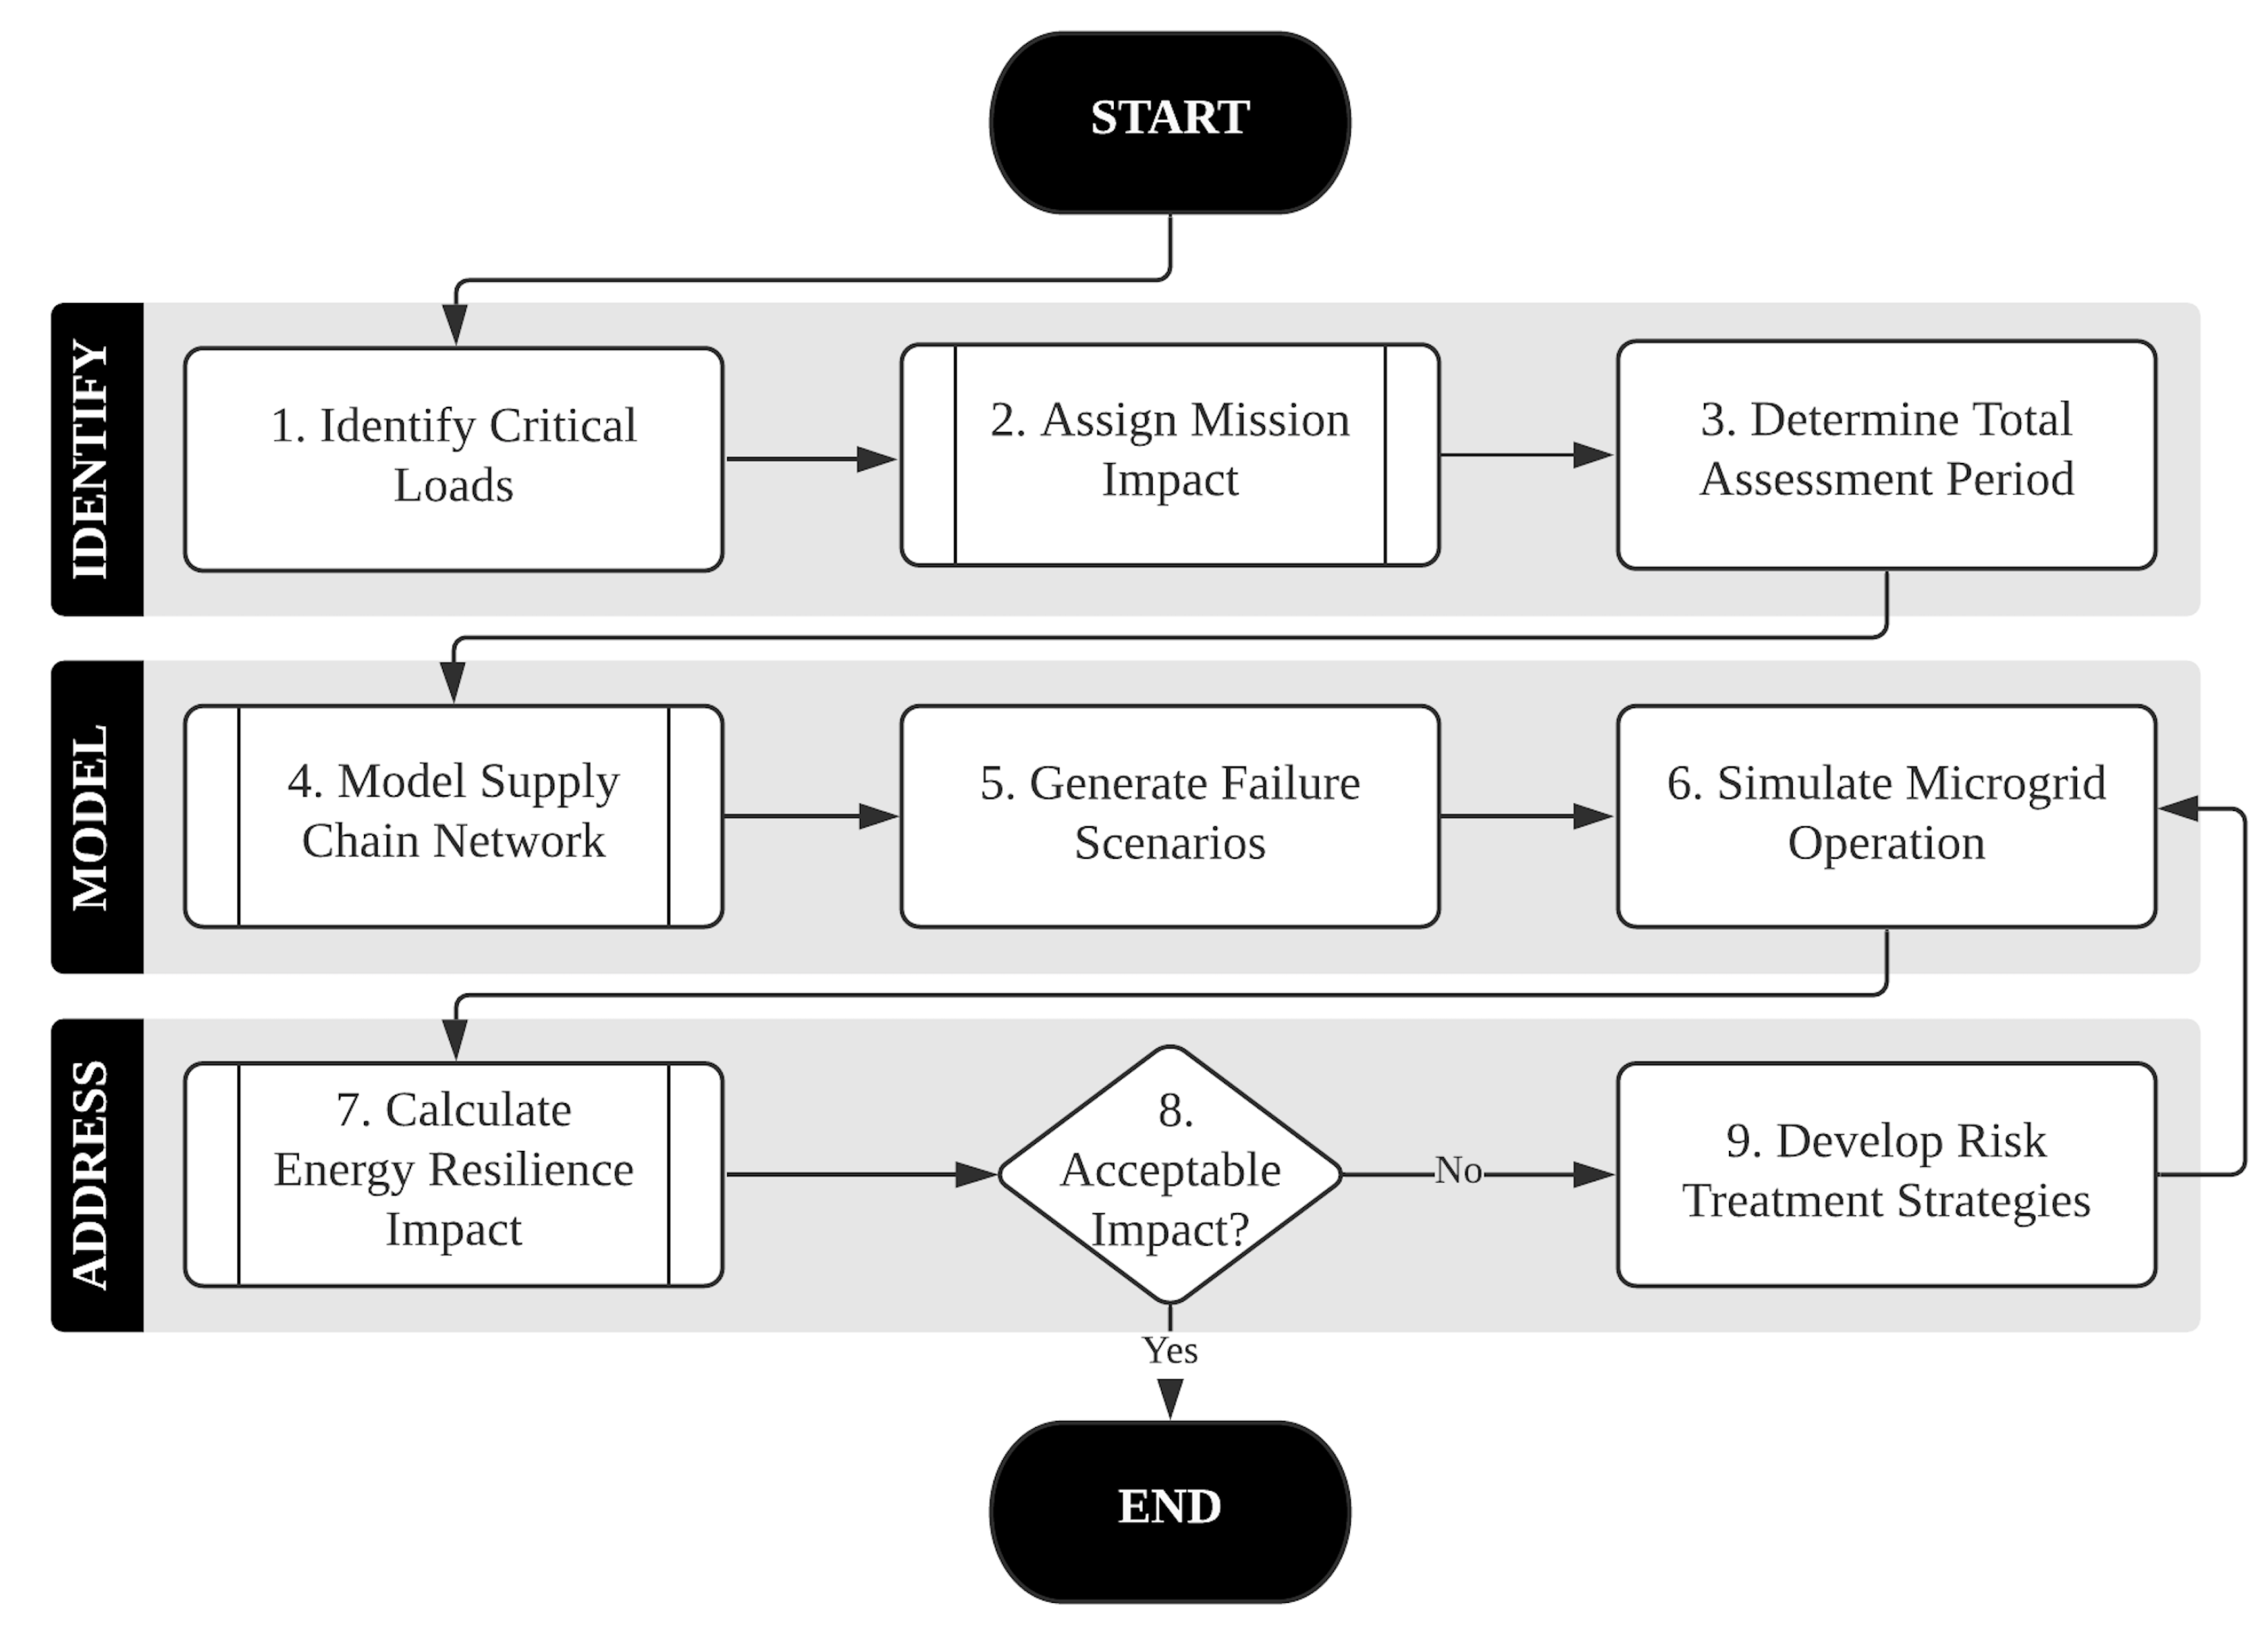
Existing research [10,14,22,25,36,79,80,86,87,143,144] has repeatedly identified SCN disruption as a significant threat to military microgrids. However, to our knowledge, the downstream impact has yet to be quantified. The interrelated study of energy-specific SCNs (e.g., petroleum, natural gas [145], etc.) has primarily focused on supply chain resilience [146], not necessarily translatable to our research purposes. In fact, islanding allows a microgrid to operate independent of the SCN for a period of time, yet for military installations reliant on EDGs the uncertainty of fuel resupply presents an interesting dichotomy. Hossain et al. [147] and Wang et al. [148] suggested incorporating these uncertainties (e.g., limited fuel, sparsity of solar irradiation, wind, etc.) into resilience-oriented operation models as part of future work.
This article contributes a novel methodology and associated metric to support the design and improvement of military microgrids subject to SCN disruption. We utilize an integrated DTMC-DBN approach to model these disruption risks and capture the resulting ripple effect in terms of “energy resilience impact”. Due to its quantitative nature, DoD IEMs can clearly compare between varying energy resilient solutions under worst-case scenario conditions. Additional benefits may be realized to include the identification of node and arc criticality with respect to installation energy security.

3. Methodology

This section presents a methodology to identify, model, and address supply chain disruption risks to military microgrids using the proposed energy resilience impact metric. We systematically integrate various methods into a comparative analysis tool for the purpose of minimizing mission impact. The steps are organized in accordance with Figure 4 and may be tailored to incorporate preferred practices directed by local installation guidance.

3.1. Step 1. Identify Critical Loads

First, the IEM must identify all critical loads necessary for mission fulfillment. This is best accomplished by decomposing the installation into individual facilities and delineating which require a continuous power source. While it is possible to provide further classification at the subsystem or component level, the added specificity may not be required. We recommend incorporating these facilities into an electrical one-line diagram to represent the collective microgrid. This will help conceptualize the problem space and, more importantly, distinguish power-flow requirements for later simulation.

3.2. Step 2. Assign Mission Impact

Subsequently, a mission impact ( M C ) score between 0–100 is assigned for each facility. As an adaptation of Peterson et al.’s [14] metric, M C is unitless and measures relative importance to mission assurance. The IEM may either utilize M D I from Equation (1) or develop a new method, though we advocate the former for M C . Essentially, this step quantifies the answers to the following questions [14,83]:
  • How long can functions cease without adversely affecting the installation’s mission?
  • To what degree can the mission continue assuming complete loss of functionality?
  • Does disruption propagate throughout the installation and cause additional losses?
  • Is there redundancy available? Or can functions be transferred to another facility?
M C scores are vetted by the relevant stakeholders to support emergency management decisions (e.g., load shedding schema, repair strategies, etc.) and later, in Step 9, evidence for funding prioritization (e.g., redundancy upgrades, military construction proposals, divestiture, etc.) [84].

3.3. Step 3. Determine Total Assessment Period

The IEM then determines the total assessment period, T, for follow-on calculations and simulation. T should encompass the required “days of autonomy” mandated by the applicable armed service although a larger time interval may be selected for analyzing alternative architectures. Note that, for an overly large duration, additional attributes (e.g., equipment reliability, maintainability, etc.) warrant consideration. We suggest sizing T to include at least two refueling cycles or 14 days, whichever is greater. Such a duration is sufficient to observe the aftereffects of SCN disruption whilst still adhering to DoD guidance and policy.

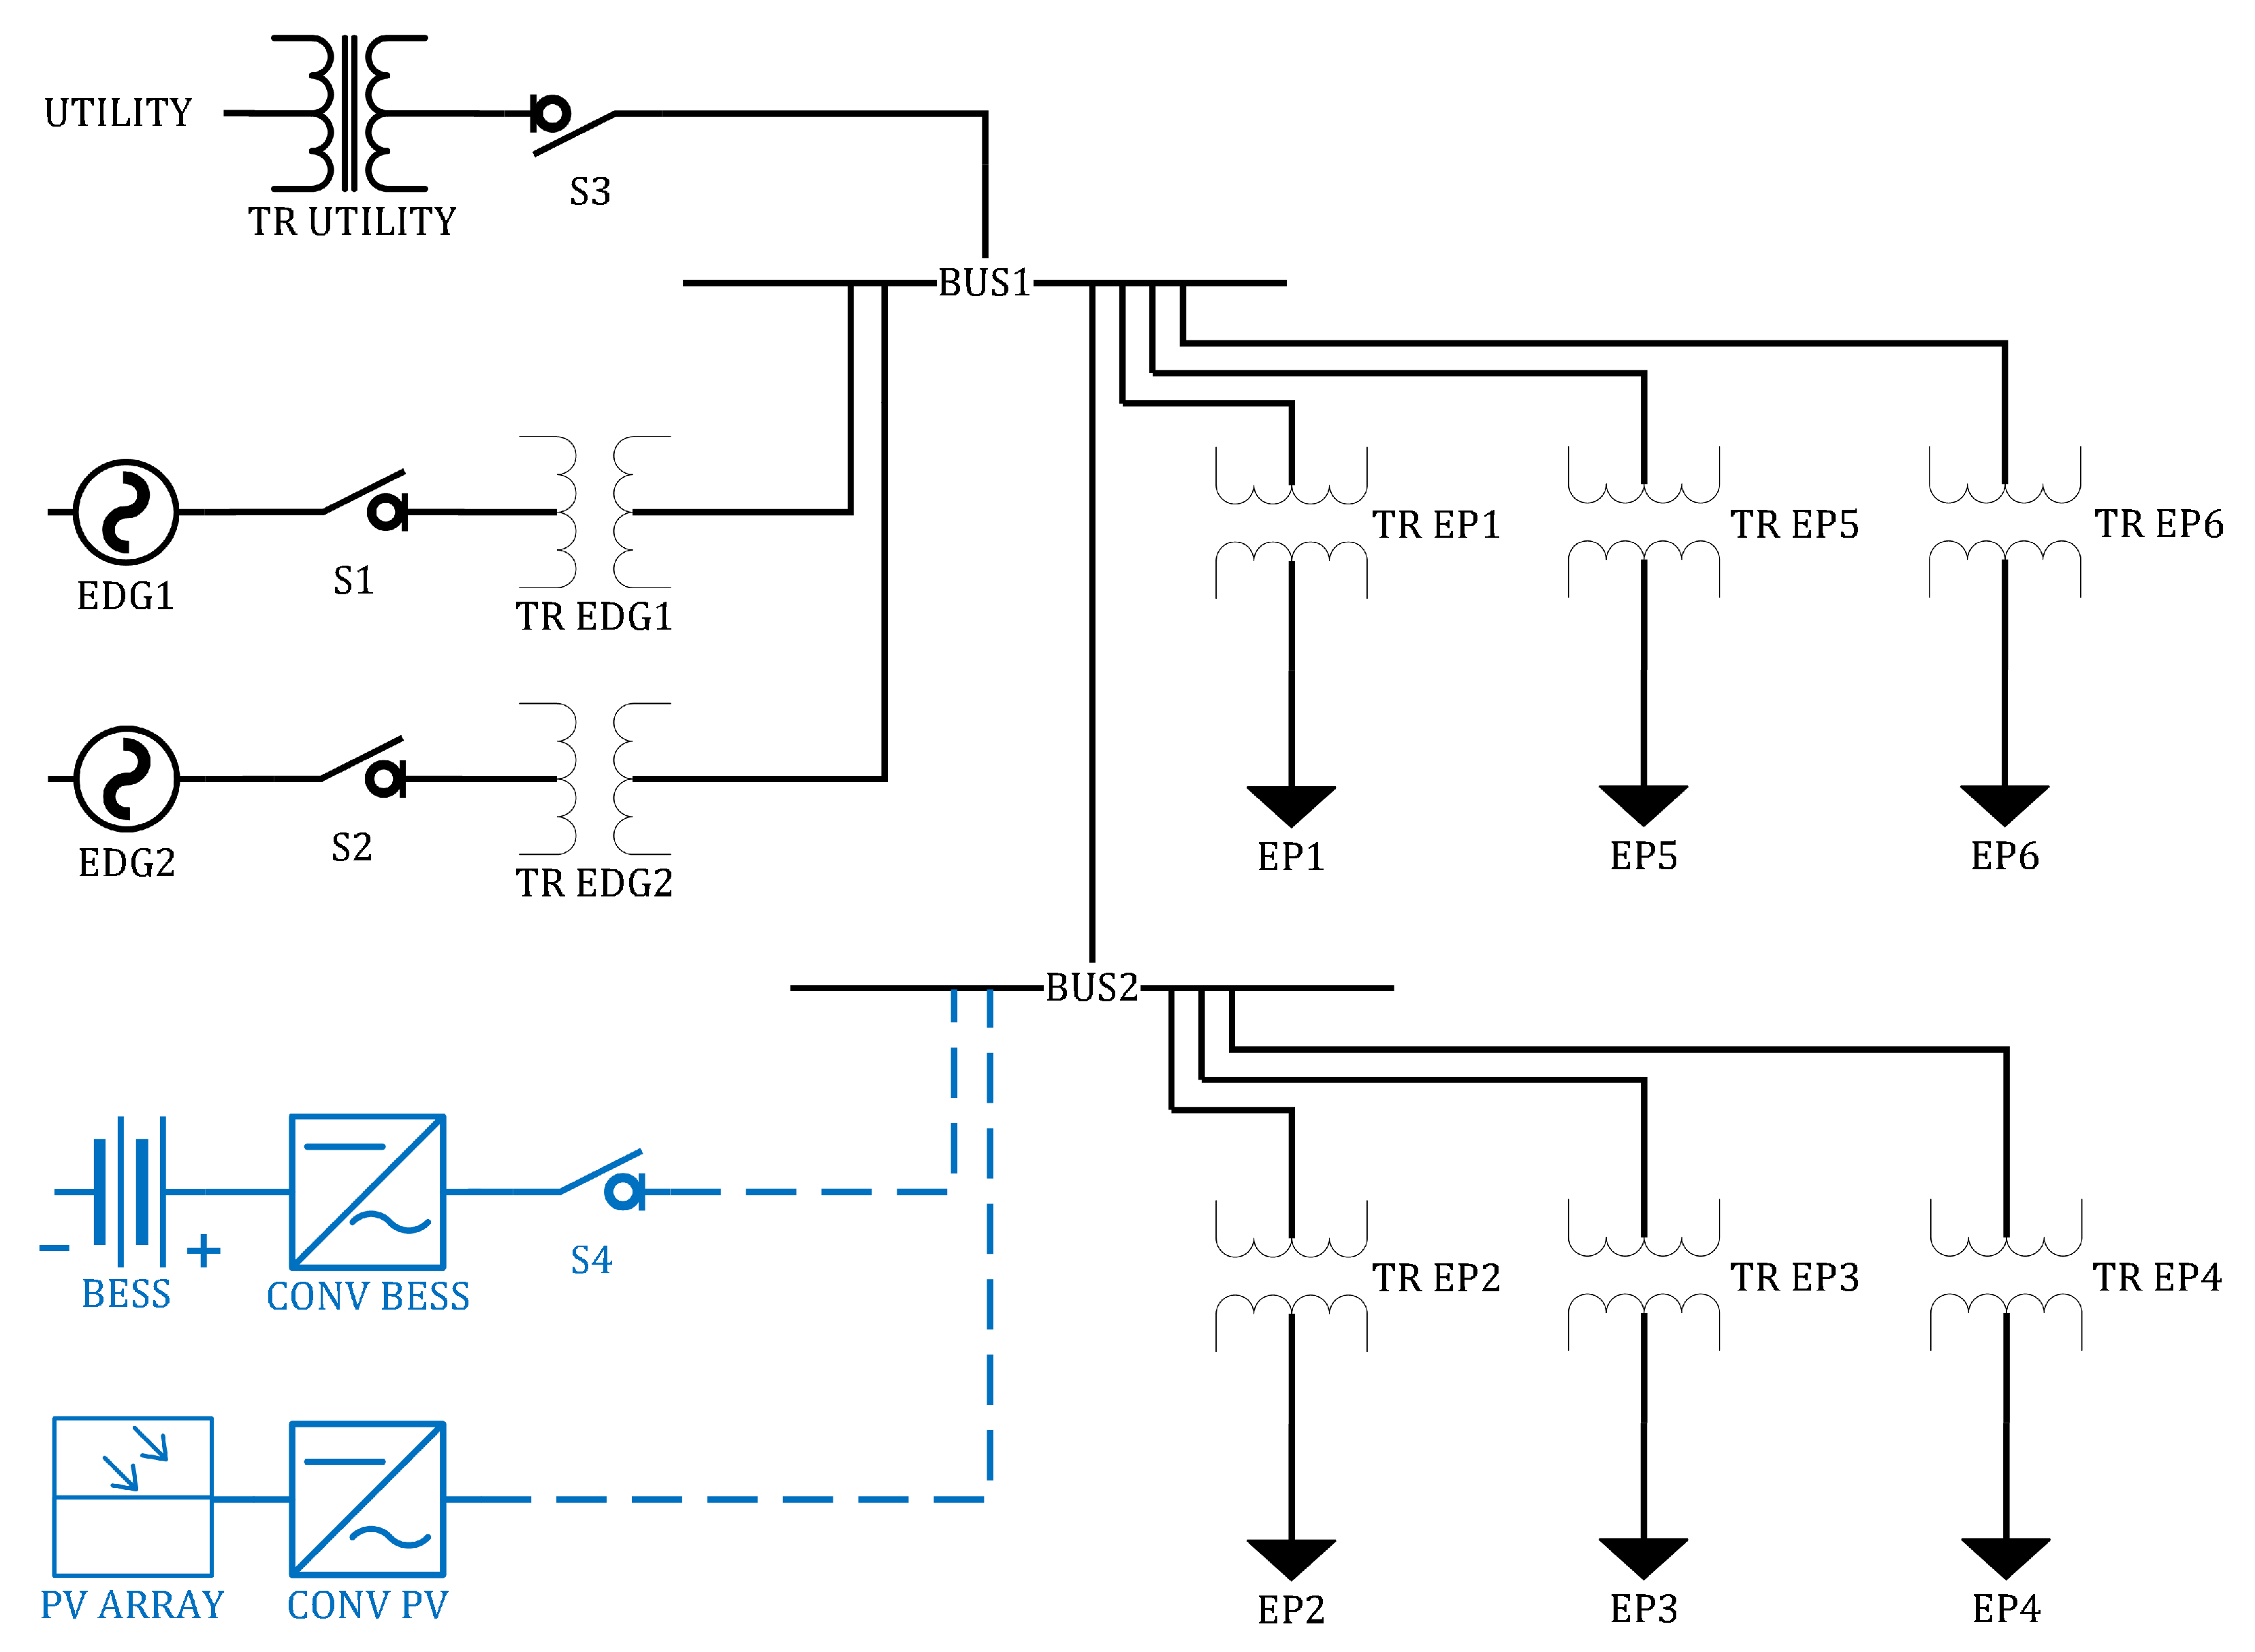
3.4. Step 4. Model Supply Chain Network

Next, the IEM employs Hosseini et al.’s [132] integrated DTMC-DBN approach to model the energy SCN. Beginning with the installation and working backwards, the IEM accounts for all entities that affect the value stream. Each node will have a corresponding DTMC to represent various operational states and, if parental dependency exists, an associated CPT. We encourage jointly developing this model with logistics specialists in order to accurately depict the transition and conditional probabilities. Moreover, mapping the entire SCN is likely extraneous when determining the (relatively) short-term sustainment of an islanded microgrid. The scope of analysis should in effect be driven by T. As T increases, disruptions farther upstream have increased potential to negatively impact the installation.

3.5. Step 5. Generate Failure Scenarios

Afterwards, the IEM generates a set of failure scenarios that can occur within the SCN. As there is no one-size-fits-all approach to identifying disruption risks, the distinct circumstances of each node must be examined. Historical data if available should serve as a primer for consideration. Different locales will also have area-specific threats (e.g., weather-related, waterborne, neighboring population, etc.) to coincide with those anticipated in the current geopolitical situation. As a guideline, we submit the following types of scenarios for use (refer to Table 1 for specific examples):
  • Baseline scenario. Normal SCN operation with zero disruptions throughout T;
  • Worst-case scenario. No access to the energy SCN for the entire duration of T;
  • Single node scenario(s). Disruption affecting a node integral to SCN function;
  • Multi-nodal scenario(s). Disruption affecting multiple nodes simultaneously.

3.6. Step 6. Simulate Microgrid Operation

Upon generating the failure set, the IEM is ready to simulate islanded microgrid operations. Relevant inputs include but are not limited to: EDG (generator sizing, refueling schedule); PV (array size and efficiency); ESS (capacity rating, charge and discharge efficiency); and EMS (load profile and shedding schema). The simulation should cover periods of high stress (e.g., peak load times, low irradiance levels, etc.) to further exascerbate microgrid vulnerability. Then, using power-flow analysis, the IEM calculates power generation and consumption at discrete time steps with unmet demand as the primary output of concern.

3.7. Step 7. Calculate Energy Resilience Impact

Energy resilience may now be calculated at specific critical loads or for the entire microgrid using Equations (2) and (3), respectively. However, these measures treat each load with equal importance—inaccurate as defined by M C . Hence in order to relate these metrics to mission assurance, we must establish a new relationship between terms. Assuming linearity between R C and M C , we can express energy resilience impact on a critical load, E C , as:
E C = M C ( 1 R C ) ,
essentially quantifying the ripple effect at that particular load. Repeating this process across the installation yields the maximum energy resilience impact, E C max , for N critical loads:
E C max = max i [ 1 , , N ] { E C , i } ,
allowing us to further define energy resilience impact on the microgrid, E M , as:
E M = E C max + i = 1 N E C , i E C max ( i = 1 N M C , i ) E C max ( 100 E C max ) impact modifier
Therefore, the most affected critical load sets the baseline value for E M which, in turn, is increased by the remaining ratio of expected to possible M C (i.e., “impact modifier”). If M D I was used for M C , then E M is likewise unitless and ranges from 0 to 100 depending on severity. A score of 100, while unrealistic, indicates instantaneous loss of mission support for the entirety of T; conversely, E M = 0 corresponds to complete invulnerability.

3.8. Step 8. Determine Acceptable Impact

Finally, E M is compared to predetermined threshold or objective values. Rather than establishing a subjective cutoff value, the IEM may utilize a percentage of total installation M C —e.g., 5% of a 200 M C total would yield a target of E M < 10 . If calculated impact is tolerable, then subsequent steps are unnecessary as the microgrid is deemed sufficiently resilient to all scenarios. Otherwise, the IEM proceeds to Step 9 for subsequent analysis.

3.9. Step 9. Develop Risk Treatment Strategies

The IEM examines the simulation results to pinpoint the main drivers of mission degradation. If multiple issues are identified, then SCN vulnerabilities are addressed in descending E M order as resolving higher priorities may have trickle-down effects. Potential microgrid improvements (e.g., system configuration, operational policies and procedures, etc.) are continuously iterated through Steps 6 to 8 in an effort to minimize E M . Once an adequate solution is obtained, design recommendations are forwarded to the installation commander for ultimate consideration.

4. Case Study

This section demonstrates the proposed methodology on a fictionalized version of Naval Support Activity Monterey (NSA Monterey). We investigate the consequences of SCN disruption on two separate microgrid architectures to illustrate how an IEM may utilize this method. The steps are organized in parallel with Section 3 (Methodology) for ease of reference.

4.1. Step 1. Identify Critical Loads

The naval installation depicted in Figure 5 is a typical office distribution found on military installations [14]. The microgrid consists of six facilities (EP1 through EP6) spread across two feeders (BUS1 and BUS2) and interconnected with the utility grid. During island mode operation (S3 = “open”), the critical loads are supported by two paralleled EDGs, each rated at 330 kW with approximately 1925 gal of diesel fuel between storage and service tanks. The blue elements indicate an alternate configuration explored later in Step 9.

4.2. Step 2. Assign Mission Impact

M C scores are assigned to each critical load using existing M D I values derived from Equation (1). Table 2 summarizes facility size, hourly power demand, and mission impact upon disruption. As evidenced by M C , EP4 is the most impactful load towards mission assurance, followed by EP6 and EP5. The three small offices (EP1, EP2, and EP3) are of relatively low importance. Furthermore, EP2 is designated as a non-critical load ( M C = 0 ) and will immediately shed upon introducing the islanded condition.

4.3. Step 3. Determine Total Assessment Period

Since EDGs serve as the primary source of backup power for NSA Monterey, Unified Facilities Criteria 3-540-01 [150] dictates at least seven days of fuel stored “either in a dedicated on-site main fuel tank or from a confirmed delivery source”. In that respect, both requirements are fulfilled with 3850 gal of stored diesel fuel and resupply scheduled every seven days. The total assessment period, T, is therefore set to 14 days.

4.4. Step 4. Model Supply Chain Network

The diesel fuel SCN is illustrated in Figure 6. NSA Monterey, N 1 , is supplied by the nearest bulk terminal, N 2 , on a weekly basis. Two refineries, N 3 and N 4 , provide regular fuel shipments (e.g., common pipeline, tanker, barge, etc.) to the bulk terminal station for storage and blending. Since T = 14 days, we refrain from developing this model further due to the inherent capacities of each entity. The solid arcs signify conditional probabilities between nodes, while the dashed arcs represent the state transitions at each time-slice ( t = 1 , 2 , , T ).

4.5. Step 5. Generate Failure Scenarios

The following scenario was developed for the purposes of this case study:
“A nation-state adversary has targeted NSA Monterey for an energy denial attack in an effort to probe DoD installation vulnerabilities. The event is triggered on the next occurrence of islanded operation. Following a severe wildfire, NSA Monterey is forced to operate independent of the utility grid for approximately two weeks. The nation-state adversary seizes this opportunity to strategically attack the nearest bulk terminal station. As a result, the regional fuel SCN is fully disrupted for three days.”

4.6. Step 6. Simulate Microgrid Operation

We modified Peterson’s [86] MATLAB simulation to accommodate fuel inputs on an hourly basis. The perspective is typical of high-level architectural methods and therefore does not account for phase imbalances, power factor issues, or other similar concerns [14]. At each time step, power generation is calculated and provided as necessary to each critical load. M C is used as the determining factor for shedding loads when total demand is unmet.
Figure 7 portrays the aforementioned scenario, wherein two slaved EDGs supply sufficient power to all critical loads while fuel is readily available. N 2 is subsequently disrupted from t = 160 to t = 231 (72 h), preventing weekly scheduled refueling at t = 168 ; consequently, the on-site fuel supply is fully exhausted and critical loads are shed from t = 178 to t = 287 (110 h), approximating to 33.4 MW·h of expected unserved energy (EUE). Note that while the disruption period is less than 110 h, the remaining 38 h correspond to the repair efforts to reestablish normal operational capacity.

4.7. Step 7. Calculate Energy Resilience Impact

E M is then calculated using Equations (4) through (6). The resulting values are summarized in Table 3.

4.8. Step 8. Determine Acceptable Impact

Threshold values were established to obtain both R M > 0.95 and E M < 10 . In this case, a more lenient value for R M was selected in comparison to prescribed DoD guidance (0.95 vice 0.999) as the evaluation period is relatively short [91]. E M was developed through expert elicitation and based on an 11.45% percentage of total installation M C . Since the current microgrid configuration fails to achieve the designated criteria, we move on to Step 9 to develop potential mitigation plans.

4.9. Step 9. Develop Risk Treatment Strategies

One possible solution is to incorporate other forms of DERs and reduce overall dependency on EDGs. Consider the alternate architecture presented in Figure 5. If we supplement the current configuration with a 19,000 m 2 PV array operating at 0.19 efficiency and a 330 kW/3.3 MW·h battery energy storage system (BESS), we are able to obtain the threshold values. In fact, the added DERs prolong the requirement for refueling by assisting in power consumption throughout the day. Figure 8 shows the given failure scenario on the updated microgrid. Some critical loads are still lost; however, this time, only those with lower M C scores (EP1, EP3, EP5) are shed during peak loading times (as seen in the sloped sections). Table 4 summarizes these results. Table 5 compares the results of the current microgrid configuration and the alternate microgrid configuration.

5. Discussion and Future Work

We found that even in a relatively small microgrid, there is substantial investment when incorporating PVs and BESSs. The area required to house the arrays is roughly a third of the facility footprint. In remote or crowded areas, real estate is a valued commodity which may or may not be justified in these design improvements. Another possible solution is to simply increase the on-site storage capacity to a minimum of 8000 gal total. As a result, the microgrid would be self-sufficient for up two weeks regardless of disruption duration. However, in doing so, the installation deepens its dependency on fuel resupply.
These types of dilemmas are ultimately up to the installation commander for adjudication, which E M aims to support. E M is not a replacement for established energy resilience measures but should rather be used in conjunction. The metric also builds on commonly accepted definitions and methodologies within the DoD, such as R and M D I . Additionally, while not a focus of our research, E M may be utilized to determine the impact of internal microgrid disruptions (e.g., equipment failure, deliberate attack, etc.). In a similar manner to identifying arc criticality, E M may be used to identify key areas requiring redundancy or protections within the microgrid boundary. For example, in Figure 5, the interconnection between BUS1 and BUS2 would likely result in a high M C score due to single point of failure. Progressing through the methodology could present potential solutions (e.g., line hardening, redundant lines, etc.) to further increase the installation resilience.
Of note, the IEM should consider the following limitations regarding this methodology. First is the dependency on M D I despite its flaws. The assigned values are only as accurate as the elicited responses to four surveyed questions. While our methodology provides the latitude to incorporate new methods, M D I is currently the best possible candidate for M C . Another limitation arises when the modeled SCN expands in size. The process of generating accurate CPTs and DTMCs becomes exhaustive, especially in cases with insufficient sample data. Future iterations of this methodology should consider other processes, such as noisy-or modeling or Liu et al.’s [142] SA algorithm. Finally, the developed metric, E M , only pertains to a specific installation. The calculative perspective is from the affected SCN node; therefore, the E M value on one installation has no bearing on another and provides no comparative value.
The research presented above is from a systems engineering perspective to evaluate the resilience of a microgrid to a variety of potential disruption scenarios including supply chain disruptions. The time steps used in this analysis are intentionally large and the analysis intentionally ignores issues such as voltage fluctuations, phase imbalances, transients, and other issues. After analysis is conducted using the above proposed methodology, installation energy managers will then likely conduct detailed electrical engineering analysis of proposed microgrid designs. For instance, analysis of potential means of controlling voltage fluctuations on islanded microgrids could be pursued [151].
As part of a larger analysis process that includes the proposed methodology and detailed electrical engineering studies, it may be possible to link this research with existing analysis methods that use Markov chains. For instance, methods to analyze energy sharing and frequency regulation of microgrids could be connected with the proposed methodology [152]. A variety of other methods are also available such as from the power electronics protection community [153].
The work presented above demonstrates the proposed methodology and an analysis of a fictionalized microgrid including a proposed alternative design to address the shortcomings of the original microgrid design for the case study’s failure scenario. However, to achieve broader practitioner acceptance, additional and expanded examples should be developed in future work. Case studies of real microgrids and SCNs would be preferable although publishing such case studies in the open literature is challenging due to the sensitive nature of military microgrids.
Based on our review of the literature, there are no other systems engineering approaches that analyze energy resilience impact from SCN disruptions for military microgrids. While many methods exist to analyze SCN disruptions and to analyse electrical energy resilience including for national defense and similar microgrids, none combines these aspects. Future work should include an attempt to benchmark the proposed method against against simulations conducted on microgrid testbeds and similar to build further confidence in and benchmark the analysis produced by the proposed method.
As indicated by our research, we recommend a fundamental shift from an over-dependency on diesel fuel to more sustainable energy generation sources. However, if conversion is unobtainable, then future research should look to harden the SCN. In particular, researchers can investigate various SCN topologies for military use or identify the necessary level of redundancy to reduce E M . While we intentionally disassociated from a cost-based approach, there is potential to correlate cost with E M . Prescribing a dollar amount to mission assurance would provide an additional dimension when justifying resilience improvements in the DoD context. Furthermore, power generation is only one of the critical infrastructures that affect M C . Other systems include water distribution, transportation services, and cyber networks. We surmise that it is possible to develop an overarching resilience framework to encompass multiple functional areas.

6. Conclusions

This article presented a novel methodology for conducting high-level resilience analysis of military microgrids. Instead of focusing on cost or performance alone, we developed a metric termed “energy resilience impact” to relate power interruption to mission assurance (key equations are summarized in Figure A1). We demonstrated its potential usefulness in evaluating the ripple effect due to supply chain disruption risks. In particular, we found that military installations overly reliant on EDGs as the primary source of backup power present liabilities towards mission assurance. By utilizing this methodology as a comparative analysis tool, IEMs can improve the design of current microgrid configurations. Lastly, several directions for future work were highlighted to extend on the research presented in this article.

Author Contributions

Conceptualization, E.A., D.L.V.B. and A.P.; methodology, E.A., D.L.V.B. and A.P.; software, E.A.; validation, E.A., D.L.V.B. and A.P.; formal analysis, E.A., D.L.V.B. and A.P.; investigation, E.A., D.L.V.B. and A.P.; resources, D.L.V.B. and A.P.; data curation, D.L.V.B. and A.P.; writing—original draft preparation, E.A.; writing—review and editing, E.A., D.L.V.B. and A.P.; visualization, E.A.; supervision, D.L.V.B. and A.P.; project administration, D.L.V.B.; funding acquisition, D.L.V.B. and A.P. All authors have read and agreed to the published version of the manuscript.

Funding

This research received no external funding.

Institutional Review Board Statement

Not applicable.

Informed Consent Statement

Not applicable.

Data Availability Statement

Data and source code is available upon request.

Acknowledgments

This research is partially supported by Naval Postgraduate School. Any opinions or findings of this work are the responsibility of the authors, and do not necessarily reflect the views of the Department of Defense or any other organizations. Approved for Public Release; distribution is unlimited.

Conflicts of Interest

The authors declare no conflict of interest.

Abbreviations

The following abbreviations are used in this manuscript:
BESSBattery energy storage system
CPTConditional probability table
DBNDynamic Bayesian network
DERDistributed energy resource
DoDDepartment of Defense
DTMCDiscrete-time Markov chain
EEDMIExpected electrical disruption mission impact
EMSEnergy management system
ESSEnergy storage system
EUEExpected unserved energy
HILPHigh-impact-low-probability
IEMInstallation energy manager
M D I Mission Dependency Index
NSANaval Support Activity
PVPhotovoltaic
SASimulated annealing
SCNSupply chain network
SCRMSupply chain risk management
USUnited States

Appendix A

Figure A1. Key equations.
Infrastructures 07 00004 g0a1

References

  1. Smith, M.; Ton, D. Key Connections: The U.S. Department of Energy’s Microgrid Initiative. IEEE Power Energy Mag. 2013, 11, 22–27. [Google Scholar] [CrossRef]
  2. Xiong, B.; Fan, R.; Wang, S.; Li, B.; Wang, C. Performance Evaluation and Disruption Recovery for Military Supply Chain Network. Complexity 2020, 2020, 9760604. [Google Scholar] [CrossRef]
  3. Reinders, B. Designing a Robust Supply Chain for Military Operations: A Multi-Agent Simulation Approach Considering Platooning. Master’s Thesis, Delft University of Technology, Delft, The Netherlands, 2019. [Google Scholar]
  4. Johnson, M.E. Supply Chain Management: Technology, Globalization, and Policy at a Crossroads. Interfaces 2006, 36, 191–193. [Google Scholar] [CrossRef] [Green Version]
  5. America’s Supply Chains, Executive Office of the President. Federal Register Volume 86, Issue 38. Office of the Federal Register, National Archives and Records Administration. Available online: https://www.govinfo.gov/app/details/FR-2021-03-01/2021-04280 (accessed on 1 March 2021).
  6. Report of the Defense Critical Supply Chain Task Force; Technical Report; House Armed Services Committee: Washington, DC, USA, 2021.
  7. Ton, D.T.; Smith, M.A. The U.S. Department of Energy’s Microgrid Initiative. Electr. J. 2012, 8, 84–94. [Google Scholar] [CrossRef]
  8. Hirsch, A.; Parag, Y.; Guerrero, J. Microgrids: A review of technologies, key drivers, and outstanding issues. Renew. Sustain. Energy Rev. 2018, 90, 402–411. [Google Scholar] [CrossRef]
  9. Marnay, C.; Bailey, O.C. The CERTS Microgrid and the Future of the Macrogrid. In Proceedings of the ACEEE Summer Study on Energy Efficiency in Buildings, Pacific Grove, CA, USA, 22–27 August 2004. [Google Scholar]
  10. Giachetti, R.E.; Peterson, C.J.; Van Bossuyt, D.L.; Parker, G.W. Systems Engineering Issues in Microgrids for Military Installations. INCOSE Int. Symp. 2020, 30, 731–746. [Google Scholar] [CrossRef]
  11. Blanchard, B.S.; Fabrycky, W.J. Systems Engineering and Analysis, 5th ed.; Pearson Education Limited: Harlow, Essex, UK, 2014; ISBN 978-013-221-735-4. [Google Scholar]
  12. Wood, E. What Is a Microgrid? Available online: https://microgridknowledge.com/microgrid-defined/ (accessed on 23 May 2021).
  13. Guerrero, J.M.; Chandorkar, M.; Lee, T.-L.; Loh, P.C. Advanced Control Architectures for Intelligent Microgrids—Part I: Decentralized and Hierarchical Control. IEEE Trans. Ind. Electr. 2013, 60, 1254–1262. [Google Scholar] [CrossRef] [Green Version]
  14. Peterson, C.J.; Van Bossuyt, D.L.; Giachetti, R.E.; Oriti, G. Analyzing Mission Impact of Military Installations Microgrid for Resilience. Systems 2021, 9, 69. [Google Scholar] [CrossRef]
  15. Ton, D.; Reilly, J. Microgrid Controller Initiatives: An Overview of R&D by the U.S. Department of Energy. IEEE Power Energy Mag. 2017, 15, 24–31. [Google Scholar] [CrossRef]
  16. Caldognetto, T.; Tenti, P.; Costabeber, A.; Mattavelli, P. Improving Microgrid Performance by Cooperative Control of Distributed Energy Sources. IEEE Trans. Ind. Appl. 2014, 50, 3921–3930. [Google Scholar] [CrossRef]
  17. Lee, E.-K.; Shi, W.; Gadh, R.; Kim, W. Design and Implementation of a Microgrid Energy Management System. Sustainability 2016, 8, 1143. [Google Scholar] [CrossRef] [Green Version]
  18. Bower, W.I.; Ton, D.T.; Guttromson, R.; Glover, S.F.; Stamp, J.E.; Bhatnagar, D.; Reilly, J. The Advanced Microgrid: Integration and Interoperability; Technical Report; Sandia National Laboratories: Albuquerque, NM, USA, 2014.
  19. Schwaegerl, C.; Tao, L.; Mancarella, P.; Strbac, G. Can microgrids provide a new paradigm for network operation? An evaluation of their technical, commercial and environmental benefits. In Proceedings of the 20th International Conference and Exhibition on Electricity Distribution, Prague, Czech Republic, 8–11 June 2009. [Google Scholar]
  20. 10, U.S.C. United States Code, 2019 Edition Title 10—ARMED FORCES, Subtitle A—General Military Law, PART IV—SERVICE, SUPPLY, AND PROCUREMENT, CHAPTER 173—ENERGY SECURITY, SUBCHAPTER I—ENERGY SECURITY ACTIVITIES, Sec. 2911—Energy policy of the Department of Defense, U.S. Government Publishing Office. Available online: https://www.govinfo.gov/content/pkg/USCODE-2019-title10/html/USCODE-2019-title10-subtitleA-partIV-chap173-subchapI-sec2911.htm (accessed on 24 May 2019).
  21. Elia, S.; Santini, E.; Tobia, M. Comparison between Different Electrical Configurations of Emergency Diesel Generators for Redundancy and Reliability Improving. Period. Polytech. Electr. Eng. Comput. Sci. 2018, 62, 144–148. [Google Scholar] [CrossRef] [Green Version]
  22. Van Broekhoven, S.; Judson, N.; Galvin, J.; Marqusee, J. Leading the Charge: Microgrids for Domestic Military Installations. IEEE Power Energy Mag. 2013, 11, 40–45. [Google Scholar] [CrossRef]
  23. Marqusee, J.; Jenket, D.; Ericson, S. Emergency Diesel Generator Backup Power Systems for Military Bases; Technical Report; National Renewable Energy Laboratory: Golden, CO, USA, 2020.
  24. Van Broekhoven, S.B.; Judson, N.; Nguyen, S.V.; Ross, W.D. Microgrid Study: Energy Security for DoD Installations; Technical Report; Lincoln Laboratory: Lexington, MA, USA, 2012. [Google Scholar]
  25. Schill, D. Improving Energy Security for Air Force Installations. Ph.D. Dissertation, Pardee RAND Graduate School, Santa Monica, CA, USA, 2015. [Google Scholar]
  26. Mercurio, A. Microgrids and Energy Security: The Business Case. Available online: https://www.iaee.org/en/publications/newsletterdl.aspx?id=217 (accessed on 24 May 2021).
  27. Shi, S.; Jiang, B.; Dong, X.; Bo, Z. Protection of microgrid. In Proceedings of the 10th IET International Conference on Developments in Power System Protection (DPSP 2010), Manchester, UK, 29 March–1 April 2010. [Google Scholar]
  28. Peyghami, S.; Wang, L.; Davari, P.; Blaabjerg, F. Mission-Profile-Based System-Level Reliability Analysis in DC Microgrids. IEEE Trans. Ind. Appl. 2019, 55, 5055–5067. [Google Scholar] [CrossRef]
  29. Griffith, T.E., Jr. Strategic Attack of National Electrical Systems. Master’s Thesis, Air University Press Maxwell AFB, Montgomery, AL, USA, 1994. [Google Scholar]
  30. Xiang, Y.; Wang, L.; Liu, N. Coordinated attacks on electric power systems in a cyber-physical environment. Electr. Power Syst. Res. 2017, 149, 156–168. [Google Scholar] [CrossRef]
  31. Mission Assurance Strategy; Department of Defense: Washington, DC, USA, 2012.
  32. DoD Instruction 3020.45: Mission Assurance (MA) Construct; Department of Defense: Washington, DC, USA, 2018.
  33. Hanley, C. The Growing Need for Resilience in an Evolving Electric Grid. Presented at the eT&D Workshop, Aalborg, Denmark, 7 November 2017; pp. 1–17. [Google Scholar]
  34. P-602: 3 Pillars of Energy Security; Naval Facilities Engineering Systems Command: Washington, DC, USA, 2018.
  35. Hosseini, S.; Barker, K.; Ramirez-Marquez, J.E. A review of definitions and measures of system resilience. Reliab. Eng. Syst. Saf. 2016, 145, 47–61. [Google Scholar] [CrossRef]
  36. Kain, A.; Van Bossuyt, D.L.; Pollman, A. Investigation of Nanogrids for Improved Navy Installation Energy Resilience. Appl. Sci. 2021, 11, 4298. [Google Scholar] [CrossRef]
  37. Judson, N.; Pina, A.L.; Dydek, E.V.; Van Broekhoven, S.B.; Castillo, A.S. Application of a Resilience Framework for Military Installations: A Methodology for Energy Resilience Business Case Decisions; Technical Report; Lincoln Laboratory: Lexington, MA, USA, 2016. [Google Scholar]
  38. Title 10—ARMED FORCES, Subtitle A—General Military Law, PART I—ORGANIZATION AND GENERAL MILITARY POWERS, CHAPTER 1—DEFINITIONS, Sec. 101—Definitions. 2019. Available online: https://www.govinfo.gov/app/details/USCODE-1994-title10/USCODE-1994-title10-subtitleA-partI-chap1-sec101 (accessed on 24 May 2019).
  39. Bruneau, M.; Chang, S.E.; Eguchi, R.T.; Lee, G.C.; O’Rourke, T.D.; Reinhorn, A.M.; Shinozuka, M.; Tierney, K.; Wallace, W.A.; von Winterfeldt, D. A Framework to Quantitatively Assess and Enhance the Seismic Resilience of Communities. Earthq. Spectra 2003, 19, 733–752. [Google Scholar] [CrossRef] [Green Version]
  40. Gholami, A.; Shekari, T.; Amirioun, M.H.; Aminifar, F.; Amini, M.H.; Sargolzaei, A. Toward a Consensus on the Definition and Taxonomy of Power System Resilience. IEEE Access 2018, 6, 32035–32053. [Google Scholar] [CrossRef]
  41. Giachetti, R.E.; Van Bossuyt, D.L.; Anderson, W.W., Jr.; Oriti, G. Resilience and Cost Tradespace for Microgrids on Islands. IEEE Syst. J. 2021. [Google Scholar] [CrossRef]
  42. Vugrin, E.D.; Warren, D.E.; Ehlen, M.A. A resilience assessment framework for infrastructure and economic systems: Quantitative and qualitative resilience analysis of petrochemical supply chains to a hurricane. Process Saf. Prog. 2011, 30, 280–290. [Google Scholar] [CrossRef]
  43. Shekari, T.; Aminifar, F.; Sanaye-Pasand, M. An Analytical Adaptive Load Shedding Scheme Against Severe Combinational Disturbances. IEEE Trans. Power Syst. 2016, 31, 4135–4143. [Google Scholar] [CrossRef]
  44. Esmaeilian, A.; Kezunovic, M. Prevention of Power Grid Blackouts Using Intentional Islanding Scheme. IEEE Trans. Ind. Appl. 2017, 53, 622–629. [Google Scholar] [CrossRef]
  45. Shahzad, U. Resilience in Electrical Power Systems. J. Electr. Eng. Electr. Control Comput. Sci. 2021, 7, 1–6. [Google Scholar]
  46. Kwasinski, A. Field technical surveys: An essential tool for improving critical infrastructure and lifeline systems resiliency to disasters. In Proceedings of the IEEE Global Humanitarian Technology Conference (GHTC 2014), San Jose, CA, USA, 10–13 October 2014. [Google Scholar]
  47. Ayyub, B. Systems Resilience for Multihazard Environments: Definition, Metrics, and Valuation for Decision Making. Risk Anal. 2013, 34, 340–355. [Google Scholar] [CrossRef]
  48. Decò, A.; Bocchini, P.; Frangopol, D.M. A probabilistic approach for the prediction of seismic resilience of bridges. Earthq. Eng. Struct. Dyn. 2013, 42, 1469–1487. [Google Scholar] [CrossRef]
  49. Nan, C.; Sansavini, G. A quantitative method for assessing resilience of interdependent infrastructures. Reliab. Eng. Syst. Saf. 2017, 157, 35–53. [Google Scholar] [CrossRef]
  50. Future Resilient Systems. Available online: https://ethz.ch/content/dam/ethz/special-interest/dual/frs-dam/documents/FRS-Booklet.pdf (accessed on 26 August 2021).
  51. Gasser, P.; Lustenberger, P.; Sun, T.; Kim, W.; Spada, M.; Burgherr, P.; Hirschberg, S.; Stojadinović, B. Security of electricity supply indicators in a resilience context. Saf. Reliab.–Theory Appl. 2017, 1, 1015–1022. [Google Scholar] [CrossRef]
  52. Vugrin, E.D.; Castillo, A.R.; Silva-Monroy, C.A. Resilience Metrics for the Electric Power System: A Performance-Based Approach; Technical Report; Sandia National Laboratories: Albuquerque, NM, USA, 2017.
  53. Francis, R.; Bekera, B. A metric and frameworks for resilience analysis of engineered and infrastructure systems. Reliab. Eng. Syst. Saf. 2014, 121, 90–103. [Google Scholar] [CrossRef]
  54. Abimbola, M.; Khan, F. Resilience modeling of engineering systems using dynamic object-oriented Bayesian network approach. Comp. Ind. Eng. 2019, 130, 108–118. [Google Scholar] [CrossRef]
  55. Roege, P.E.; Collier, Z.A.; Mancillas, J.; McDonagh, J.A.; Linkov, I. Metrics for energy resilience. Energy Policy 2014, 72, 249–256. [Google Scholar] [CrossRef]
  56. Willis, H.H.; Loa, K. Measuring the Resilience of Energy Distribution Systems; Technical Report; RAND Corporation: Santa Monica, CA, USA, 2015. [Google Scholar]
  57. Gasser, P.; Lustenberger, P.; Cinelli, M.; Kim, W.; Spada, M.; Burgherr, P.; Hirschberg, S.; Stojadinovic, B.; Sun, T.Y. A review on resilience assessment of energy systems. Sust. Resil. Infrastruct. 2019, 273–299. [Google Scholar] [CrossRef] [Green Version]
  58. Shandiz, S.C.; Foliente, G.; Rismanchi, B.; Wachtel, A.; Jeffers, R.F. Resilience framework and metrics for energy master planning of communities. Energy 2020, 203, 117856. [Google Scholar] [CrossRef]
  59. Kandaperumal, G.; Srivastava, A.K. Resilience of the electric distribution systems: Concepts, classification, assessment, challenges, and research needs. IET Smart Grid 2020, 3, 133–143. [Google Scholar] [CrossRef]
  60. Raoufi, H.; Vahidinasab, V.; Mehran, K. Power Systems Resilience Metrics: A Comprehensive Review of Challenges and Outlook. Sustainability 2020, 12, 9698. [Google Scholar] [CrossRef]
  61. Ahmadi, S.; Saboohi, Y.; Vakili, A. Frameworks, quantitative indicators, characters, and modeling approaches to analysis of energy system resilience: A Review. Renew. Sust. Energy Rev. 2021, 144. [Google Scholar] [CrossRef]
  62. Kahnamouei, A.S.; Bolandi, T.G.; Maghifam, M.-R. The conceptual framework of resilience and its measurement approaches in electrical power systems. In Proceedings of the IET International Conference on Resilience of Transmission and Distribution Networks (RTDN 2017), Birmingham, UK, 26–28 September 2017. [Google Scholar]
  63. Ioannou, A.; Angus, A.; Brennan, F. Risk-based methods for sustainable energy system planning: A review. Renew. Sustain. Energy Rev. 2017, 74, 602–615. [Google Scholar] [CrossRef]
  64. Cantelmi, R.; Di Gravio, G.; Patriarca, R. Reviewing qualitative research approaches in the context of critical infrastructure resilience. Environ. Syst. Decis. 2021, 41, 341–376. [Google Scholar] [CrossRef]
  65. Mahzarnia, M.; Moghaddam, M.P.; Baboli, P.T.; Siano, P. A Review of the Measures to Enhance Power Systems Resilience. IEEE Syst. J. 2020, 14, 4059–4070. [Google Scholar] [CrossRef]
  66. Bhusal, N.; Abdelmalak, M.; Kamruzzaman, M.; Benidris, M. Power System Resilience: Current Practices, Challenges, and Future Decisions. IEEE Access 2020, 8, 18064–18086. [Google Scholar] [CrossRef]
  67. Henry, D.; Ramirez-Marquez, J.E. Generic metrics and quantitative approaches for system resilience as a function of time. Reliab. Eng. Syst. Saf. 2012, 99, 114–122. [Google Scholar] [CrossRef]
  68. Ouyang, M.; Dueñas-Osorio, L. Multi-dimensional hurricane resilience assessment of electric power systems. Struct. Saf. 2014, 48, 15–24. [Google Scholar] [CrossRef]
  69. Panteli, M.; Mancarella, P.; Trakas, D.N.; Kyriakides, E.; Hatziargyriou, N.D. Metrics and Quantification of Operational and Infrastructure Resilience in Power Systems. IEEE Trans. Power Syst. 2017, 32, 4732–4742. [Google Scholar] [CrossRef] [Green Version]
  70. Panteli, M.; Trakas, D.N.; Mancarella, P.; Hatziargyriou, N.D. Power Systems Resilience Assessment: Hardening and Smart Operational Enhancement Strategies. Proc. IEEE 2017, 105, 1202–1213. [Google Scholar] [CrossRef] [Green Version]
  71. Lu, J.; Guo, J.; Jian, Z.; Yang, Y.; Tang, W. Resilience Assessment and Its Enhancement in Tackling Adverse Impact of Ice Disasters for Power Transmision Systems. Energies 2018, 11, 2272. [Google Scholar] [CrossRef] [Green Version]
  72. Moreno, R.; Panteli, M.; Mancarella, P.; Rudnick, H.; Lagos, T.; Navarro, A.; Ordonez, F.; Araneda, J.C. From Reliability to Resilience: Planning the Grid Against the Extremes. IEEE Power Energy Mag. 2020, 18, 41–53. [Google Scholar] [CrossRef]
  73. Donaldson, D.L.; Alvarez-Alvarado, M.S.; Jayaweera, D. Power System Resiliency During Wildfires Under Increasing Penetration of Electric Vehicles. In Proceedings of the 2020 International Conference on Probabilistic Methods Applied to Power Systems (PMAPS), Leige, Belgium, 18–21 August 2020. [Google Scholar]
  74. Ratnam, E.L.; Baldwin, K.G.H.; Mancarella, P.; Howden, M.; Seebeck, L. Electricity system resilience in a world of increased climate change and cybersecurity risk. Electr. J. 2020, 33, 106833. [Google Scholar] [CrossRef]
  75. Singh, S.; Gao, D.W.; Giraldez, J. Cost analysis of Renewable Energy-Based Microgrids. In Proceedings of the 2017 North American Power Symposium (NAPS), Morgantown, WV, USA, 17–19 September 2017. [Google Scholar]
  76. Anderson, W.W., Jr. Resilience Assessment of Islanded Renewable Energy Microgrids. Ph.D. Dissertation, Naval Postgraduate School, Monterey, CA, USA, 2020. [Google Scholar]
  77. Hamilton, M.C.; Lambert, J.H.; Connelly, E.B.; Barker, K. Resilience analytics with disruption of preferences and lifecycle cost analysis for energy microgrids. Reliab. Eng. Syst. Saf. 2016, 150, 11–21. [Google Scholar] [CrossRef]
  78. Giraldez, J.; Booth, S.; Anderson, K.; Massey, K. Valuing Energy Security: Customer Damage Function Methodology and Case Studies at DoD Installations; Technical Report; National Renewable Energy Laboratory: Golden, CO, USA, 2012.
  79. Hildebrand, J.P. Estimating the Life Cycle Cost of Microgrid Resilience. Master’s Thesis, Naval Postgraduate School, Monterey, CA, USA, 2020. [Google Scholar]
  80. Bolen, C.D.; Chu, V.; Dang, A.Q.; Kim, P.T.; Proctor, C.; Shideler, B.R. Integrating Power-flow, Resilience, and Cost Models for Naval Installation Microgrids; Technical Report; Naval Postgraduate School: Monterey, CA, USA, 2021. [Google Scholar]
  81. Grimaila, M.R.; Mills, R.F.; Haas, M.; Kelly, D. Mission Assurance: Issues and Challenges. In Proceedings of the 2010 International Conference on Security and Management (SAM10), Las Vegas, NV, USA, 12–15 July 2010. [Google Scholar]
  82. Grussing, M.N.; Gunderson, S.; Canfield, M.; Falconer, E.; Antelman, A.; Hunter, S.L. Development of the Army Facility Mission Dependency Index for Infrastructure Asset Management; Technical Report; Construction Engineering Research Laboratory: Champaign, IL, USA, 2010. [Google Scholar]
  83. Antelman, A.; Dempsey, J.J.; Brodt, B. Mission Dependency Index—A Metric for Determine Infrastructure Criticality. In Proceedings of the International Facility Management Association Facility Management Workshop, Washington, DC, USA, 9–13 January 2008. [Google Scholar]
  84. Gunderson, S.; Antelman, A.; Canfield, M.; Miller, A.; Brodt, B. The NASA Mission Dependency Index (MDI) User Guide; National Aeronautics and Space Administration: Washington, DC, USA, 2010.
  85. Kujawski, E.; Miller, G. The Mission Dependency Index: Fallacies and Misuses. INCOSE Int. Symp. 2009, 19, 1565–1580. [Google Scholar] [CrossRef]
  86. Peterson, C.J. Systems Architecture Design and Validation Methods for Microgrid Systems. Master’s Thesis, Naval Postgraduate School, Monterey, CA, USA, 2019. [Google Scholar]
  87. Beaton, D.T. Testing Whether Distributed Energy Storage Results in Greater Resilience of Microgrids. Master’s Thesis, Naval Postgraduate School, Monterey, CA, USA, 2021. [Google Scholar]
  88. Fish, A.B. Overcoming Flaws in the Mission Dependency Index (MDI) with Network Flow Analysis. Master’s Thesis, Naval Postgraduate School, Monterey, CA, USA, 2021. [Google Scholar]
  89. Nichols, M.J. A Delphi Study using Value-Focused Thinking for United States Air Force Mission Dependency Index. Master’s Thesis, Air Force Institute of Technology, Wright-Patterson Air Force Base, OH, USA, 2015. [Google Scholar]
  90. Smith, C.W. Mission Dependency Index of Air Force Built Infrastructure: Knowledge Discovery with Machine Learning. Master’s Thesis, Air Force Institute of Technology, Wright-Patterson Air Force Base, OH, USA, 2016. [Google Scholar]
  91. Metrics and Standards for Energy Resilience at Military Installations; Department of Defense: Washington, DC, USA, 2020.
  92. Kwasinski, A. Quantitative Model and Metrics of Electrical Grids’ Resilience Evaluated at a Power Distribution Level. Energies 2016, 9, 93. [Google Scholar] [CrossRef]
  93. Lie, C.H.; Hwang, C.L.; Tillman, F.A. Availability of Maintained Systems: A State-of-the-Art Survey. AIIE Eng. 1977, 9, 247–259. [Google Scholar] [CrossRef]
  94. Zhivov, A.M.; Stringer, A.; Fox, M.D.; Daniels, P.W.; Traver, T.J.; Benefiel, J. Defining, Measuring and Assigning Resilience Requirements to Electric and Thermal Energy Systems. ASHRAE Trans. 2021, 127, 673–692. [Google Scholar]
  95. Krishnamurthy, V.; Kwasinski, A. Effects of Power Electronics, Energy Storage, Power Distribution Architecture, and Lifeline Dependencies on Microgrid Resiliency During Extreme Events. IEEE J. Emerg. Sel. Top. Power Electr. 2016, 4, 1310–1323. [Google Scholar] [CrossRef]
  96. Supply Chain Resilience Guide; Department of Homeland Security: Washington, DC, USA, 2019.
  97. Cheng, C.-Y.; Chen, T.-L.; Chen, Y.-Y. An analysis of the structural complexity of supply chain networks. Appl. Math. Model. 2014, 38, 2328–2344. [Google Scholar] [CrossRef]
  98. Battini, D.; Persona, A.; Allesina, S. Towards a use of network analysis: Quantifying the complexity of Supply Chain Networks. Int. J. Electr. Cust. Relatsh. Manag. 2007, 1, 75–90. [Google Scholar] [CrossRef] [Green Version]
  99. Wang, H.; Gu, T.; Jin, M.; Zhao, R.; Wang, G. The complexity measurement and evolution analysis of supply chain network under disruption risks. Chaos Solitons Fractals 2018, 116, 72–78. [Google Scholar] [CrossRef]
  100. Craighead, C.W.; Blackhurst, J.; Rungtusanatham, M.J.; Handfield, R.B. The Severity of Supply Chain Disruptions: Design Characteristics and Mitigation. Decis. Sci. 2007, 38, 131–156. [Google Scholar] [CrossRef]
  101. Ivanov, D.; Dolgui, A.; Sokolov, B.; Ivanova, M. Literature Review on Disruption Recovery in the Supply Chain. Int. J. Prod. Res. 2017, 55, 6158–6174. [Google Scholar] [CrossRef]
  102. Shekarian, M.; Parast, M.M. An Integrative approach to supply chain disruption risk and resilient management: A literature review. Int. J. Logist. Res. Appl. 2021, 24, 427–455. [Google Scholar] [CrossRef]
  103. Fan, Y.; Stevenson, M. A review of supply chain risk management: Definition, theory, and research agenda. Int. J. Phys. Distrib. Logist. Manag. 2018, 48, 205–230. [Google Scholar] [CrossRef] [Green Version]
  104. Faisal, M.N.; Banwet, D.K.; Shankar, R. Management of Risk in Supply Chains: SCOR Approach and Analytic Network Process. Supply Chain Forum Int. J. 2007, 8, 66–79. [Google Scholar] [CrossRef]
  105. DoD Instruction 5200.44 (Change 3): Protection of Mission Critical Functions to Achieve Trust Systems and Networks (TSN); Department of Defense: Washington, DC, USA, 2018.
  106. Purdy, G. ISO 31000:2009—Setting a New Standard for Risk Management. Risk Anal. 2010, 30, 881–886. [Google Scholar] [CrossRef] [PubMed]
  107. Fattahi, M.; Govindan, K.; Keyvanshokooh, E. Responsive and resilient supply chain network design under operational and disruption risks with delivery lead-time sensitive customers. Trans. Res. Part E 2017, 101, 176–200. [Google Scholar] [CrossRef]
  108. Tang, C.S. Perspectives in supply chain risk management. Int. J. Prod. Econ. 2006, 103, 451–488. [Google Scholar] [CrossRef]
  109. Dolgui, A.; Ivanov, D.; Sokolov, B. Ripple effect in the supply chain: An analysis and recent literature. Int. J. Prod. Res. 2018, 56, 414–430. [Google Scholar] [CrossRef] [Green Version]
  110. Chopra, S.; Sodhi, M. Reducing the risk of supply chain disruptions. MIT Sloan Manag. Rev. 2014, 55, 72–80. [Google Scholar]
  111. Miller, S. Insider Threats Involving Supply Chain Risk. Available online: https://apps.dtic.mil/sti/pdfs/AD1088906.pdf (accessed on 5 November 2021).
  112. Crosignani, M.; Macchiavelli, M.; Silva, A.F. Pirates without Borders: The Propagation of Cyberattacks through Firms’ Supply Chains; Technical Report; Federal Reserve Bank of New York: New York, NY, USA, 2021. [Google Scholar]
  113. Khan, M.N.; Akhtar, P.; Merali, Y. Strategies and effective decision-making against terrorism affecting supply chain risk management and security: A novel combination of triangulated methods. Ind. Manag. Data Syst. 2018, 118, 1528–1546. [Google Scholar] [CrossRef]
  114. Cho, J.; Lim, G.J.; Kim, S.J.; Biobaku, T. Liquefied natural gas inventory routing problem under uncertain weather conditions. Int. J. Prod. Econ. 2018, 204, 18–29. [Google Scholar] [CrossRef]
  115. Wilson, M.C. The impact of transportation disruptions on supply chain performance. Trans. Res. Part E 2007, 43, 295–320. [Google Scholar] [CrossRef]
  116. Bai, X.; Jia, H.; Xu, M. Port congestion and the economics of LPG seaborne transportation. Marit. Policy Manag. 2021. [Google Scholar] [CrossRef]
  117. Yeletayşi, S. A Risk Analysis on the Continuity of the Petroleum Supply Chain Using GIS and Systems Simulation. Ph.D. Dissertation, The George Washington University, Washington, DC, USA, 2010. [Google Scholar]
  118. MacKenzie, C.A.; Santos, J.R.; Barker, K. Measuring changes in international production from a disruption: Case study of the Japanese earthquake and tsunami. Int. J. Prod. Econ. 2012, 138, 293–302. [Google Scholar] [CrossRef]
  119. Haces-Fernandez, F. Wind Energy Implementation to Mitigate Wildfire Risk and Preemptive Blackouts. Energies 2020, 13, 2421. [Google Scholar] [CrossRef]
  120. Handfield, R.B.; Graham, G.; Burns, L. Corona virus, tariffs, trade wars and supply chain evolutionary design. Int. J. Oper. Prod. Manag. 2020, 40, 1649–1660. [Google Scholar] [CrossRef]
  121. Lee, J.M.; Wong, E.Y. Suez Canal blockage: An analysis of legal impact, risks and liabilities to the global supply chain. MATEC Web Conf. 2021, 339. [Google Scholar] [CrossRef]
  122. Zhang, L.; Bai, W. Risk Assessment of China’s Natural Gas Importation: A Supply Chain Perspective. SAGE Open 2020, 10. [Google Scholar] [CrossRef]
  123. Tverberg, G.E. Oil supply limits and the continuing financial crisis. Energy 2012, 37, 27–34. [Google Scholar] [CrossRef]
  124. Hamilton, J.D. Causes and Consequences of the Oil Shock of 2007–2008; Technical Report; National Bureau of Economic Research: Cambridge, MA, USA, 2009. [Google Scholar]
  125. Butt, A.S. Strategies to mitigate the impact of COVID-19 on supply chain disruptions: A multiple case analysis of buyers and distributors. Int. J. Logist. Manag. 2021. [Google Scholar] [CrossRef]
  126. Gholami-Zanjani, S.M.; Jabalameli, M.S.; Klibi, W.; Pishvaee, M.S. A robust location-inventory model for food supply chains operating under disruptions with ripple effects. Int. J. Prod. Res. 2021, 59, 301–324. [Google Scholar] [CrossRef]
  127. Chauhan, V.K.; Perera, S.; Brintrup, A. The relationship between nested patterns and the ripple effect in complex supply networks. Int. J. Prod. Res. 2021, 59, 325–341. [Google Scholar] [CrossRef]
  128. Mishra, D.; Dwivedi, Y.K.; Rana, N.P.; Hassini, E. Evolution of supply chain ripple effect: A bibliometric and meta-analytic view of the constructs. Int. J. Prod. Res. 2021, 59, 129–149. [Google Scholar] [CrossRef]
  129. Nguyen, T.; Zhou, L.; Spiegler, V.; Ieromonachou, P.; Lin, Y. Big data analytics in supply chain management: A state-of-the-art literature review. Comp. Oper. Res. 2018, 98, 254–264. [Google Scholar] [CrossRef] [Green Version]
  130. Hosseini, S.; Ivanov, D. Baysian networks for supply chain risk, resilience and ripple effect analysis: A literature review. Expert Syst. Appl. 2020, 161, 113649. [Google Scholar] [CrossRef]
  131. Yodo, N.; Wang, P.; Zhou, Z. Predictive Resilience Analysis of Complex Systems Using Dyanmic Bayesian Networks. IEEE Trans. Reliab. 2017, 66, 761–770. [Google Scholar] [CrossRef]
  132. Hosseini, S.; Ivanonv, D.; Dolgui, A. Ripple effect modelling of supplier disruption: Integrated Markov chain and dynamic Bayesian network approach. Int. J. Prod. Res. 2020, 58, 3284–3303. [Google Scholar] [CrossRef]
  133. Perera, S.; Bell, M.G.H.; Kurauchi, F.; Kasthurirathna, D. Absorbing Markov Chain Approach to Modelling Disruptions in Supply Chain Networks. In Proceedings of the 2019 Moratuwa Engineering Research Conference (MERCon), Moratuwa, Sri Lanka, 3–5 July 2019. [Google Scholar]
  134. Dueñas-Osorio, L.; Vemuru, S.M. Cascading failures in complex infrastructure systems. Struct. Saf. 2009, 31, 157–167. [Google Scholar] [CrossRef]
  135. Phattharapornjaroen, P.; Glantz, V.; Carlström, E.; Holmqvist, L.D.; Sittichanbuncha, Y.; Khorram-Manesh, A. The Feasibility of Implementing the Flexible Surge Capacity Concept in Bangkok: Willing Participants and Educational Gaps. Int. J. Environ. Res. Public Health 2021, 18, 7793. [Google Scholar] [CrossRef] [PubMed]
  136. McGregor, A. Steady-State Theorem. Available online: https://people.cs.umass.edu/{\char‘~}mcgregor/240S17/lec15.pdf (accessed on 25 May 2021).
  137. Salem, A.B.; Muller, A.; Weber, P. Dynamic Bayesian Networks in System Reliability Analysis. In Proceedings of the 6th IFAC Symposium, Beijing, China, 30 August–1 September 2006. [Google Scholar]
  138. Khakzad, N. Application of dynamic Bayesian network to risk analysis of domino effects in chemical infrastructures. Reliab. Eng. Syst. Saf. 2015, 138, 263–272. [Google Scholar] [CrossRef]
  139. Kohda, T.; Cui, W. Risk-based reconfiguration of safety monitoring system using dynamic Bayesian network. Reliab. Eng. Syst. Saf. 2007, 92, 1716–1723. [Google Scholar] [CrossRef]
  140. Uusitalo, L. Advantages and challenges of Bayesian networks in environmental modelling. Ecol. Model. 2007, 203, 312–318. [Google Scholar] [CrossRef]
  141. Rebello, S.; Yu, H.; Ma, L. An integrated approach for system functional reliability assessment using Dynamic Bayesian Network and Hidden Markov Model. Reliab. Eng. Syst. Saf. 2018, 180, 124–135. [Google Scholar] [CrossRef]
  142. Liu, M.; Liu, Z.; Chu, F.; Zheng, F.; Chu, C. A new robust dynamic Bayesian network approach for disruption risk assessment under the supply chain ripple effect. Int. J. Prod. Res. 2021, 59, 265–285. [Google Scholar] [CrossRef]
  143. Kashem, S.B.A.; De Souza, S.; Iqbal, A.; Ahmed, J. Microgrid in military applications. In Proceedings of the 2018 IEEE 12th International Conference on Campatibility, Power Electronics and Power Engineering (CPE-POWERENG 2018), Doha, Qatar, 10–12 April 2018. [Google Scholar]
  144. Prehoda, E.W.; Schelly, C.; Pearce, J.M. U.S. strategic solar photovoltaic-powered microgrid deployment for enhanced national security. Renew. Sustain. Energy Rev. 2017, 78, 167–175. [Google Scholar] [CrossRef] [Green Version]
  145. Hossain, N.U.I.; Jaradat, R.; Mohammad, M. Assessing and Enhancing Oil and Gas Supply Chain Resilience: A Bayesian Network Based Approach. In Proceedings of the 2019 Industrial and Systems Engineering Conference, Semarang, Indonesia, 23–25 April 2019. [Google Scholar]
  146. Emenike, S.N.; Falcone, G. A review on energy supply chain resilience through optimization. Renew. Sustain. Energy Rev. 2020, 134, 110088. [Google Scholar] [CrossRef]
  147. Hossain, A.; Bui, V.-K.; Kim, H.-M. Microgrids as a resilience resource and strategies used by microgrids for enhancing resilience. Appl. Energy 2019, 240, 56–72. [Google Scholar] [CrossRef]
  148. Wang, Y.; Rousis, A.O.; Strbac, G. On microgrids and resilience: A comprehensive review on modeling and operational strategies. Renew. Sustain. Energy Rev. 2020, 134, 110313. [Google Scholar] [CrossRef]
  149. Deru, M.; Field, K.; Studer, D.; Benne, K.; Griffith, B. U.S. Department of Energy Commercial Reference Building Models of the National Building Stock; Technical Report; National Renewable Energy Laboratory: Golden, CO, USA, 2011.
  150. UFC 3-540-01: Engine-Driven Generator Systems for Prime and Standby Power Applications; Naval Facilities Engineering Systems Command: Washington, DC, USA, 2019.
  151. Hua, H.; Cao, J.; Yang, G.; Ren, G. Voltage control for uncertain stochastic nonlinear system with application to energy Internet: Non-fragile robust H approach. J. Math. Anal. Appl. 2018, 463, 93–110. [Google Scholar] [CrossRef]
  152. Hua, H.; Qin, Y.; He, Z.; Li, L.; Cao, J. Energy sharing and frequency regulation in energy Internet via mixed H 2/H control with Markovian jump. CSEE J. Power Energy Syst. 2020, 7, 1302–1311. [Google Scholar] [CrossRef]
  153. Palaniappan, K.; Sedano, W.; Vygoder, M.; Hoeft, N.; Cuzner, R.; Shen, Z.J. Short-Circuit Fault Discrimination Using SiC JFET-Based Self-Powered Solid-State Circuit Breakers in a Residential DC Community Microgrid. IEEE Trans. Ind. Appl. 2020, 56, 3466–3476. [Google Scholar] [CrossRef]
Figure 1. Generic microgrid resilience curves before, during, and after a disruptive event. Recovery behavior is dependent on a microgrid’s absorptive, adaptive, and restorative capacities [52,53,54].
Infrastructures 07 00004 g001
Figure 2. Directed acyclic graph of a supply chain network (SCN). A ripple effect occurs following a disruption (red diamond) between a manufacturer (M 2 ) and distributor (D 2 ), negatively affecting the distributor and three downstream customers (C 2 , C 3 , and C 4 ).
Infrastructures 07 00004 g002
Figure 3. DTMC model of a node with four operational states. The state transitions ( α n , λ n , and μ n ) represent various reactions and responses to disruption risks.
Infrastructures 07 00004 g003
Figure 4. Methodology overview. This method is offered as an evaluative tool to assist IEMs in minimizing microgrid susceptibility to supply chain disruption risks.
Infrastructures 07 00004 g004
Figure 5. Microgrid one-line diagram for Naval Support Activity Monterey (NSA Monterey). The current configuration is comprised of two EDGs, six loads (EP1–6), and a utility connection at BUS1. Other possible generation sources (blue elements) include ESSs and PV arrays. Adapted from Peterson et al. [14].
Infrastructures 07 00004 g005
Figure 6. Diesel fuel SCN for NSA Monterey. The military installation (N 1 ) is preceded by a bulk terminal (N 2 ), which in turn receives stock from two refineries (N 3 and N 4 ). The solid arcs correspond to conditional relationships between parent and child nodes. Dashed arcs denote discrete state transitions from t 1 to t.
Infrastructures 07 00004 g006
Figure 7. 72-h refueling disruption during islanded operation of current microgrid configuration. Two slaved 330 kW EDGs, each with 1925 gal storage capacity, support all critical loads after isolating from the utility grid. A SCN disruption occurs from t = 160 to t = 231 , preventing weekly scheduled refueling at t = 168 . The ripple effect reduces refueling expected utility (in gal) until normal operational capacity can be restored at t = 288 . Critical loads are unmet from t = 178 to t = 287 , approximating to 33.4 MW·h of EUE.
Infrastructures 07 00004 g007
Figure 8. 72-h refueling disruption during islanded operation of alternate microgrid configuration. The current architecture is supplemented with a 19,000 m 2 PV array operating at 0.19 efficiency and a 330 kW/3.3 MW·h battery energy storage system (BESS). The same disruption scenario occurs from t = 160 to t = 231 , preventing weekly scheduled refueling at t = 168 . Critical loads with lower mission impact ( M C ) scores are shed during peak loading times (sloped sections), totaling to 11.8 MW·h of EUE.
Infrastructures 07 00004 g008
Table 1. Example disruption risks to supply chain networks (SCNs).
Initial ImpactDisruption RiskExample
Single nodeDeliberate attackInsider threat [111]
Cyberattack [112]
Terrorist attack [113]
Logistics delayInclement weather [114]
Transportation accident [115]
Port congestion [116]
Multi-nodalNatural disasterHurricane [117]
Earthquake [118]
Wildfire [119]
Material shortageTrade tariffs [120]
Shipping route blockage [121]
Civil unrest [122]
Financial crisisMarket volatility [123]
Economic recession [124]
Global pandemic [125]
Table 2. Facility load data for NSA Monterey. Mission impact ( M C ) scores were assigned using Mission Dependency Index ( M D I ). Adapted from Peterson et al. [14], Kain et al. [36], and Deru et al. [149].
LoadFacility TypeFloor Area (ft 2 )Avg Load (kW)Max Load (kW) M C
EP1Small office55002.87.012
EP2Small office55002.87.00
EP3Small office55002.87.019
EP4Medium office53,62832.375.988
EP5Large office498,588267.0679.043
EP6Warehouse52,04510.926.667
Total 620,761318.6802.5229
Table 3. Failure scenario summary with current microgrid configuration.
Load M C EUE (kW·h)RE
EP112292.80.67263.9286
EP20---
EP319292.80.67266.2202
EP4883402.00.672628.8095
EP54328,304.80.672614.0774
EP6671141.00.672621.9345
Microgrid22933,433.40.672645.2249
Table 4. Failure scenario summary with alternate microgrid configuration.
Load M C EUE (kW·h)RE
EP112115.40.92560.8929
EP20---
EP319115.40.92561.4137
EP488010
EP54311,604.90.92563.1994
EP667010
Microgrid22911,835.70.95544.1882
Table 5. Summary of current and alternate microgrid configurations from data presented in Table 3 and Table 4. The reduced E of the alternate microgrid configuration indicates it is more resilient than the current microgrid configuration in the failure scenarios examined.
Microgrid Configuration M C EUE (kW·h)RE
Current Microgrid Configuration22933,433.40.672645.2249
Alternate Microgrid Configuration22911,835.70.95544.1882
Publisher’s Note: MDPI stays neutral with regard to jurisdictional claims in published maps and institutional affiliations.

