
Pollutant Emissions in Ports: A Comprehensive Review


Abstract
:1. About This Document and How to Consult It
2. Introduction
- A “positive” allometric result when the parameter is greater than 1; this means that the global fleets’ deadweight tonnage grows faster than the GHG emissions.
- A “negative” result when the parameter is lesser than 1, meaning that the global fleets’ deadweight tonnage grows slower than the GHG emissions.
- An “isogony” result when the parameter is equal to 1, meaning that the global fleets’ deadweight tonnage grows with a linear proportion law with the GHG emissions.
3. Background
- Exemplifying: Each port should aim to achieve optimum environmental performance, setting a good example for the other ports within the network
- Enabling: Proper operational and infrastructural conditions should be implemented and working, so to enable port users and external elements to access and operate within the port area improving environmental performance
- Encouraging: Incentives should be given to those port users that contribute to improve environmental performance
- Engaging: Port users, authorities and other interested stakeholders should be involved altogether, making them engage with each other to share knowledge and skills, with actions such as participating in common projects in order to chase environmental performance
- Enforcing: Compliance and positive environmental behavior should be enforced through the use of adequate instruments (e.g., fines or surveillance)
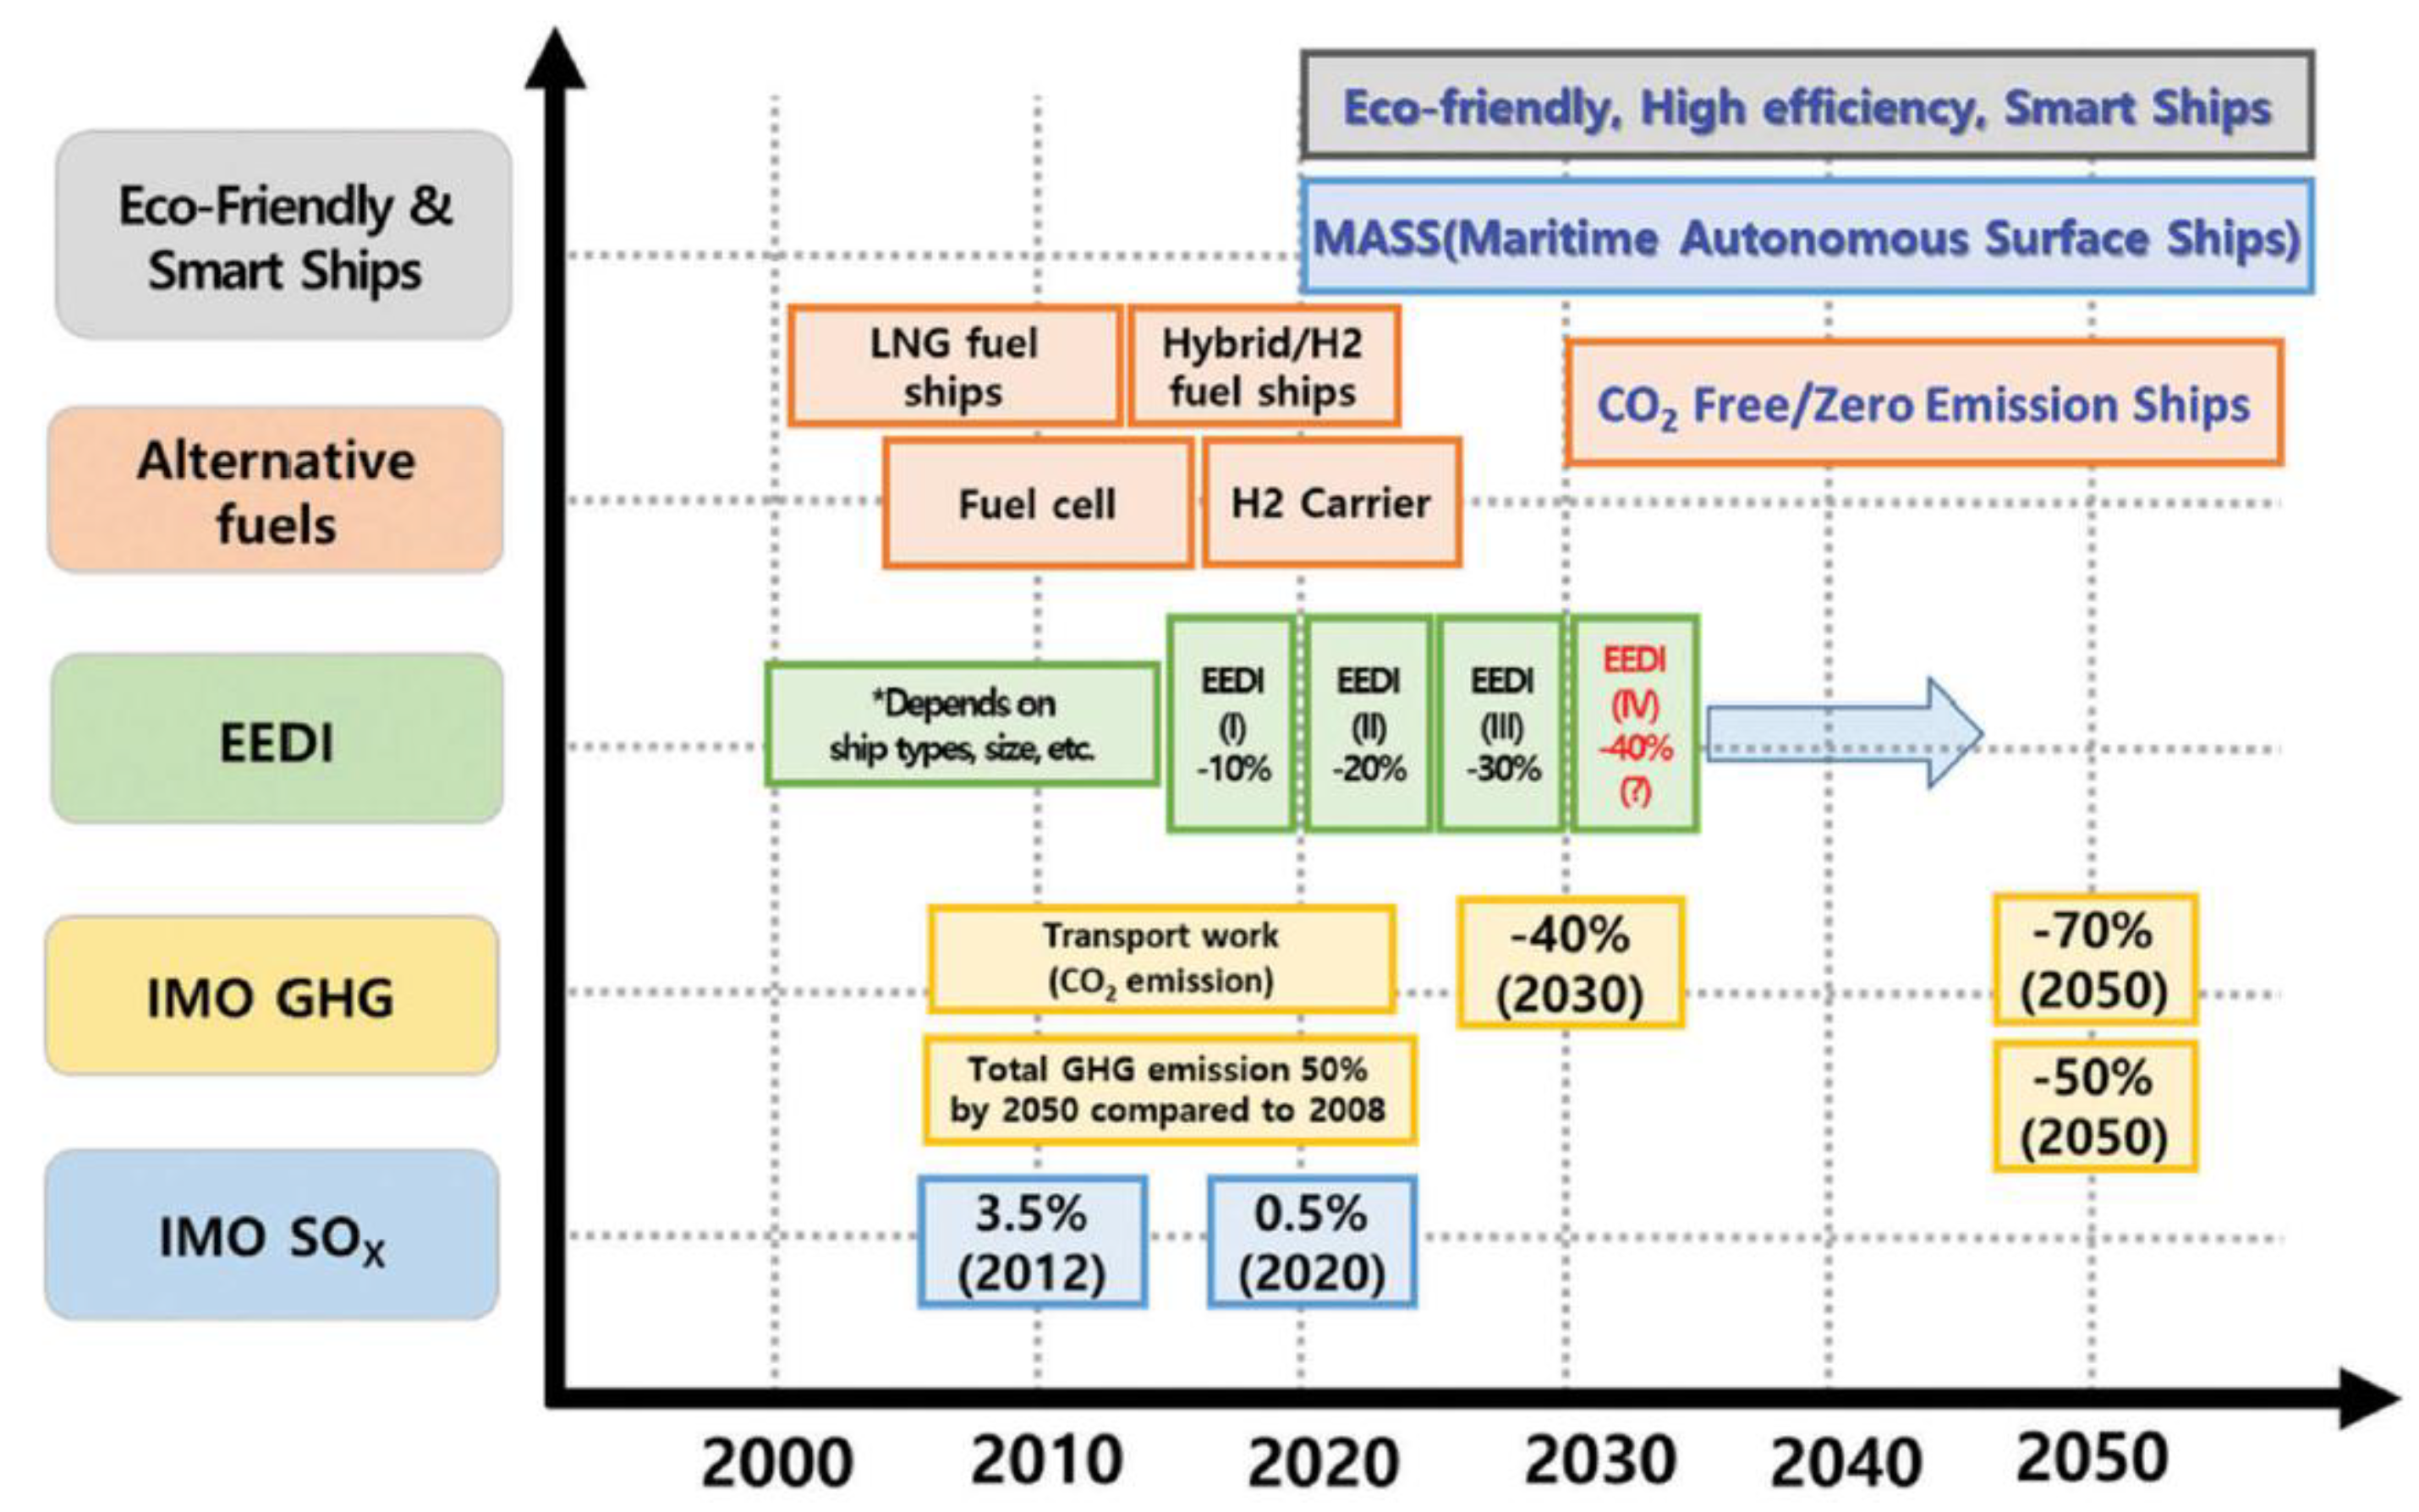
4. Pollutant Emissions in Maritime Transport
4.1. Greenhouse Gases (GHG)
4.2. Common Air Contaminants (CAC)
4.3. Other Airborne Pollutants
5. Estimating, Detecting, and Monitoring Emissions in Ports
5.1. Port of Volos, Greece (2018)
- Real time online system for better monitoring: trucks can transport greater amounts of bulk shipments by increasing the HGVs load factor; this optimization can be achieved through the use of real-time online smart systems that communicate info about remaining shipment volumes, unexpected events, etc. This implementation can lead to an increase in HGV load factors up to 95%
- Green Fleet: increase the number of HGVs powered by alternative fuels, increasing Compressed Natural Gas vehicles from 2% to 4% and Electric vehicles from 20% to 23%, while reducing the number of diesel-powered HGVs from 78% to 73%
- Local Traffic Management: implementation of Intelligent Transport Systems for traffic management and control, such as intervening on the timing of intersection signals; this leads to optimizing the acceleration and deceleration maneuvers for HGVs, therefore improving the traffic flow and allowing reduced noise, used fuel, and emissions.
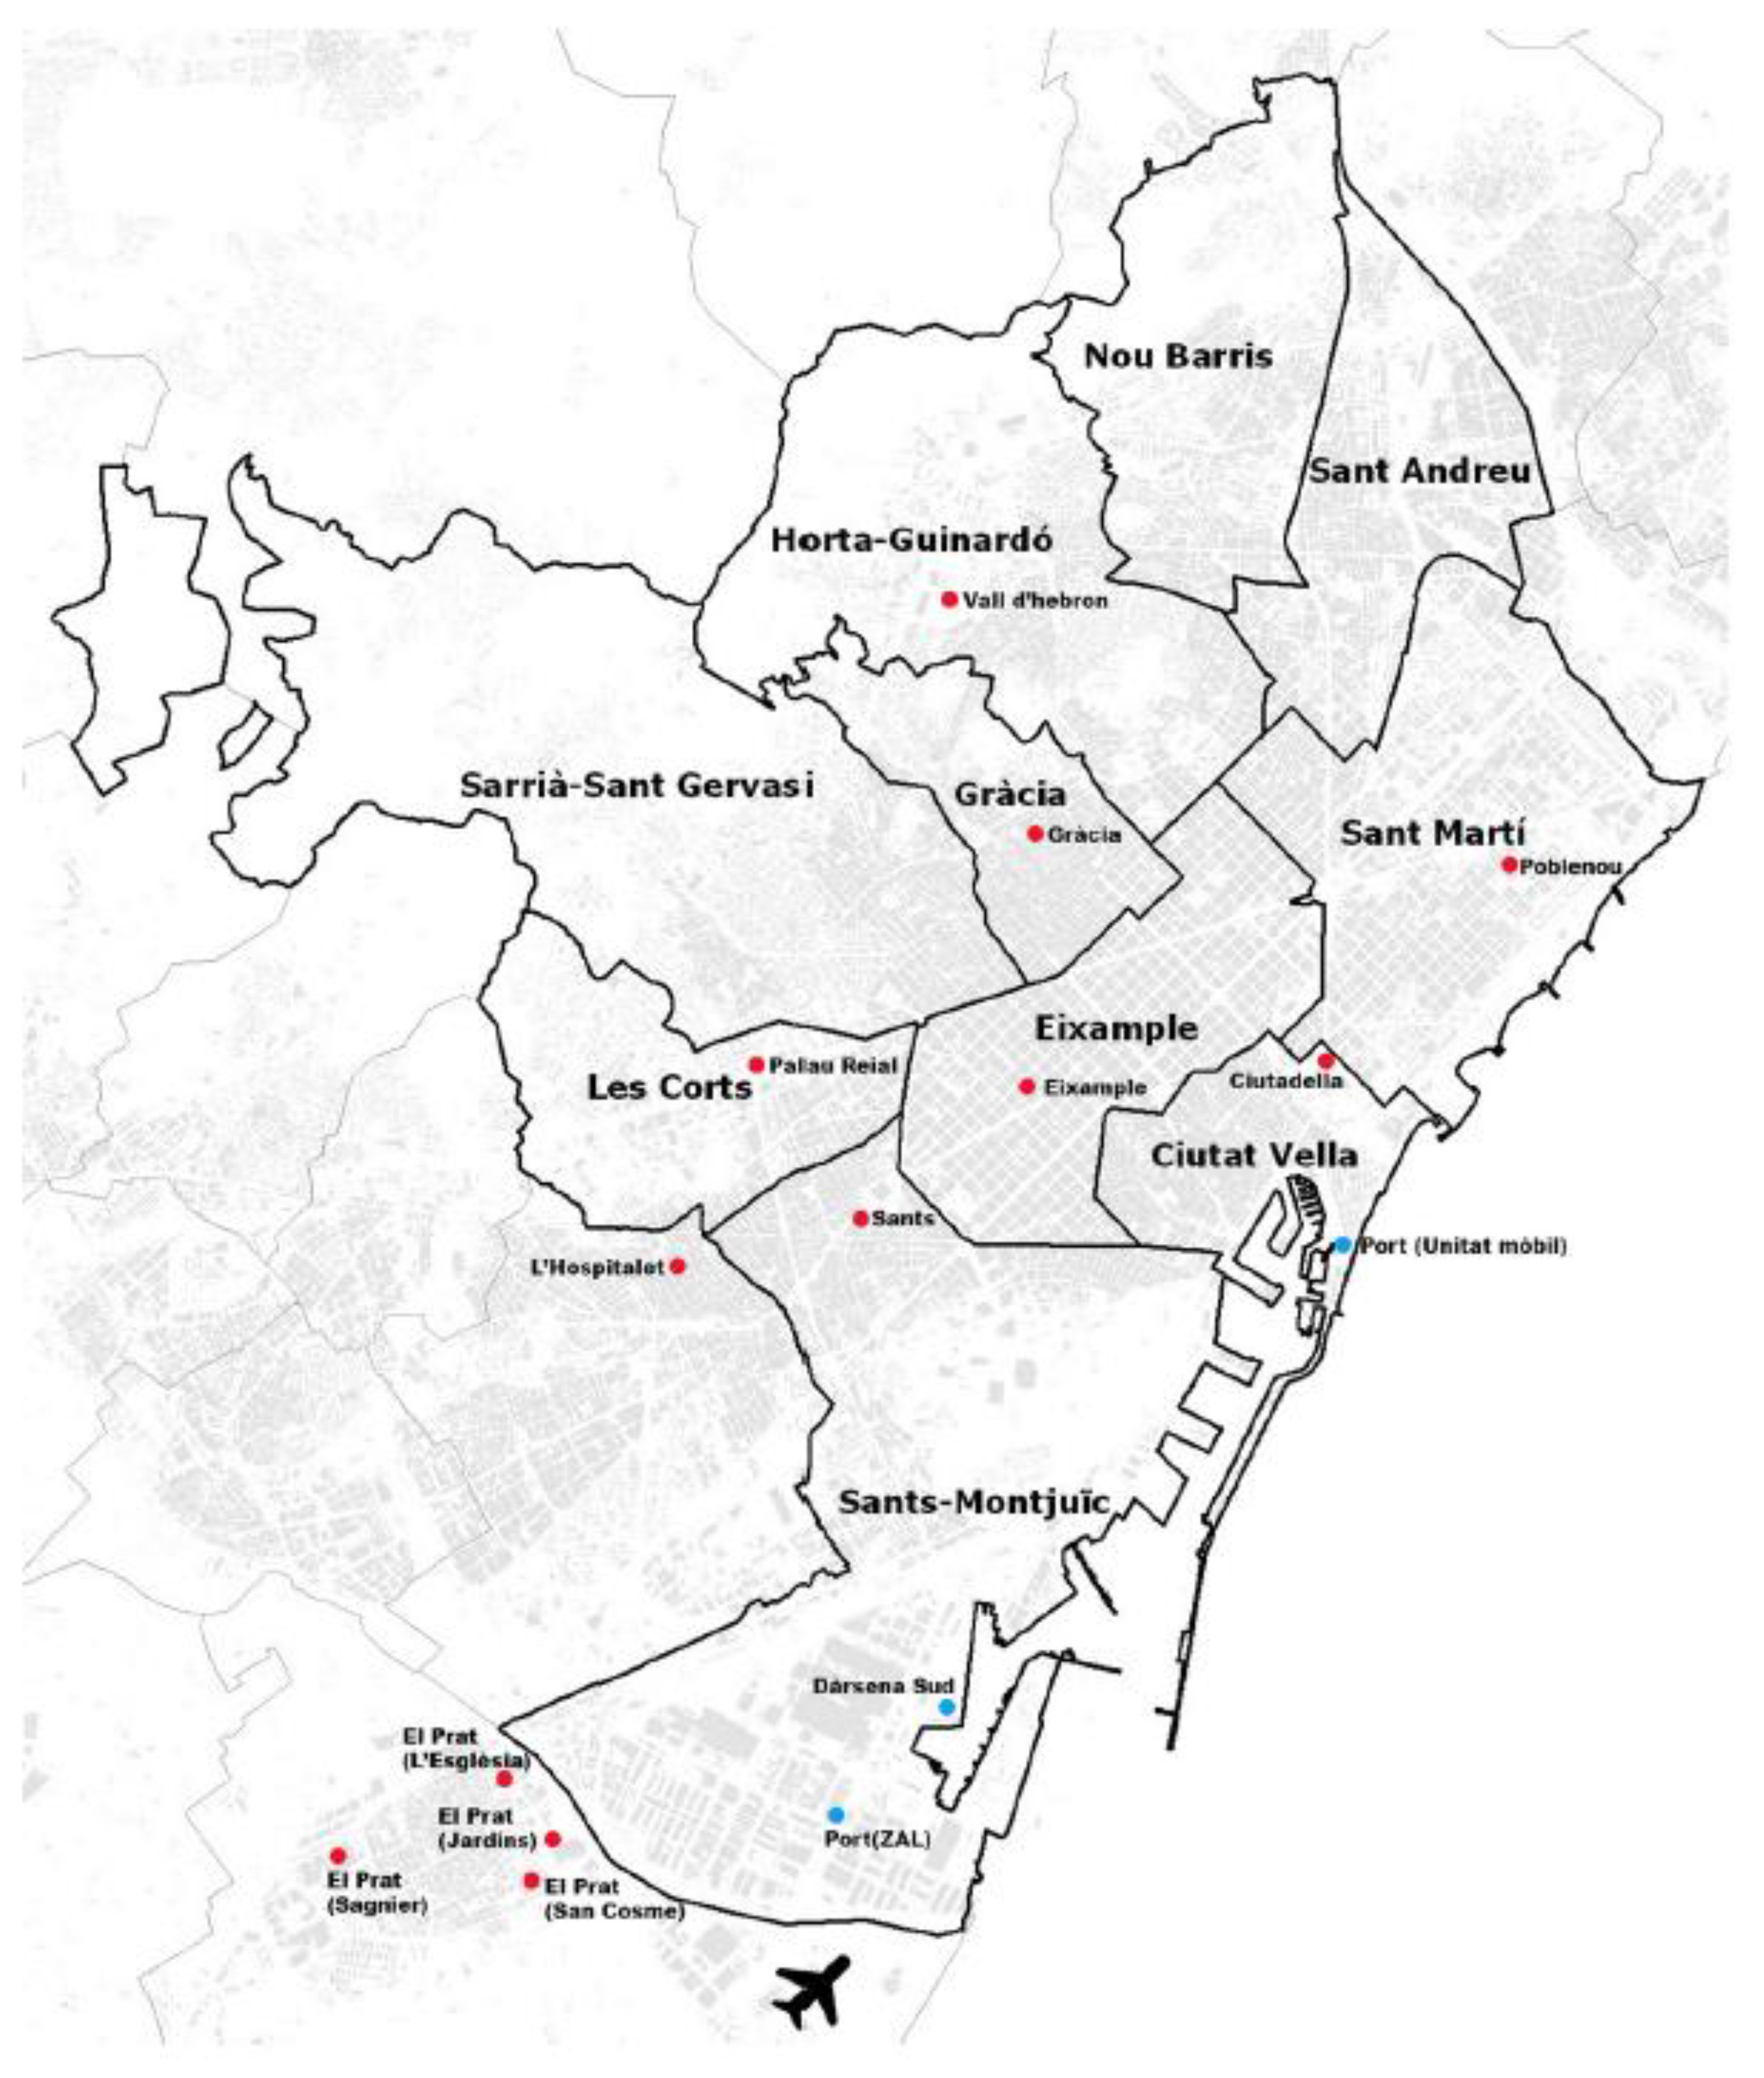
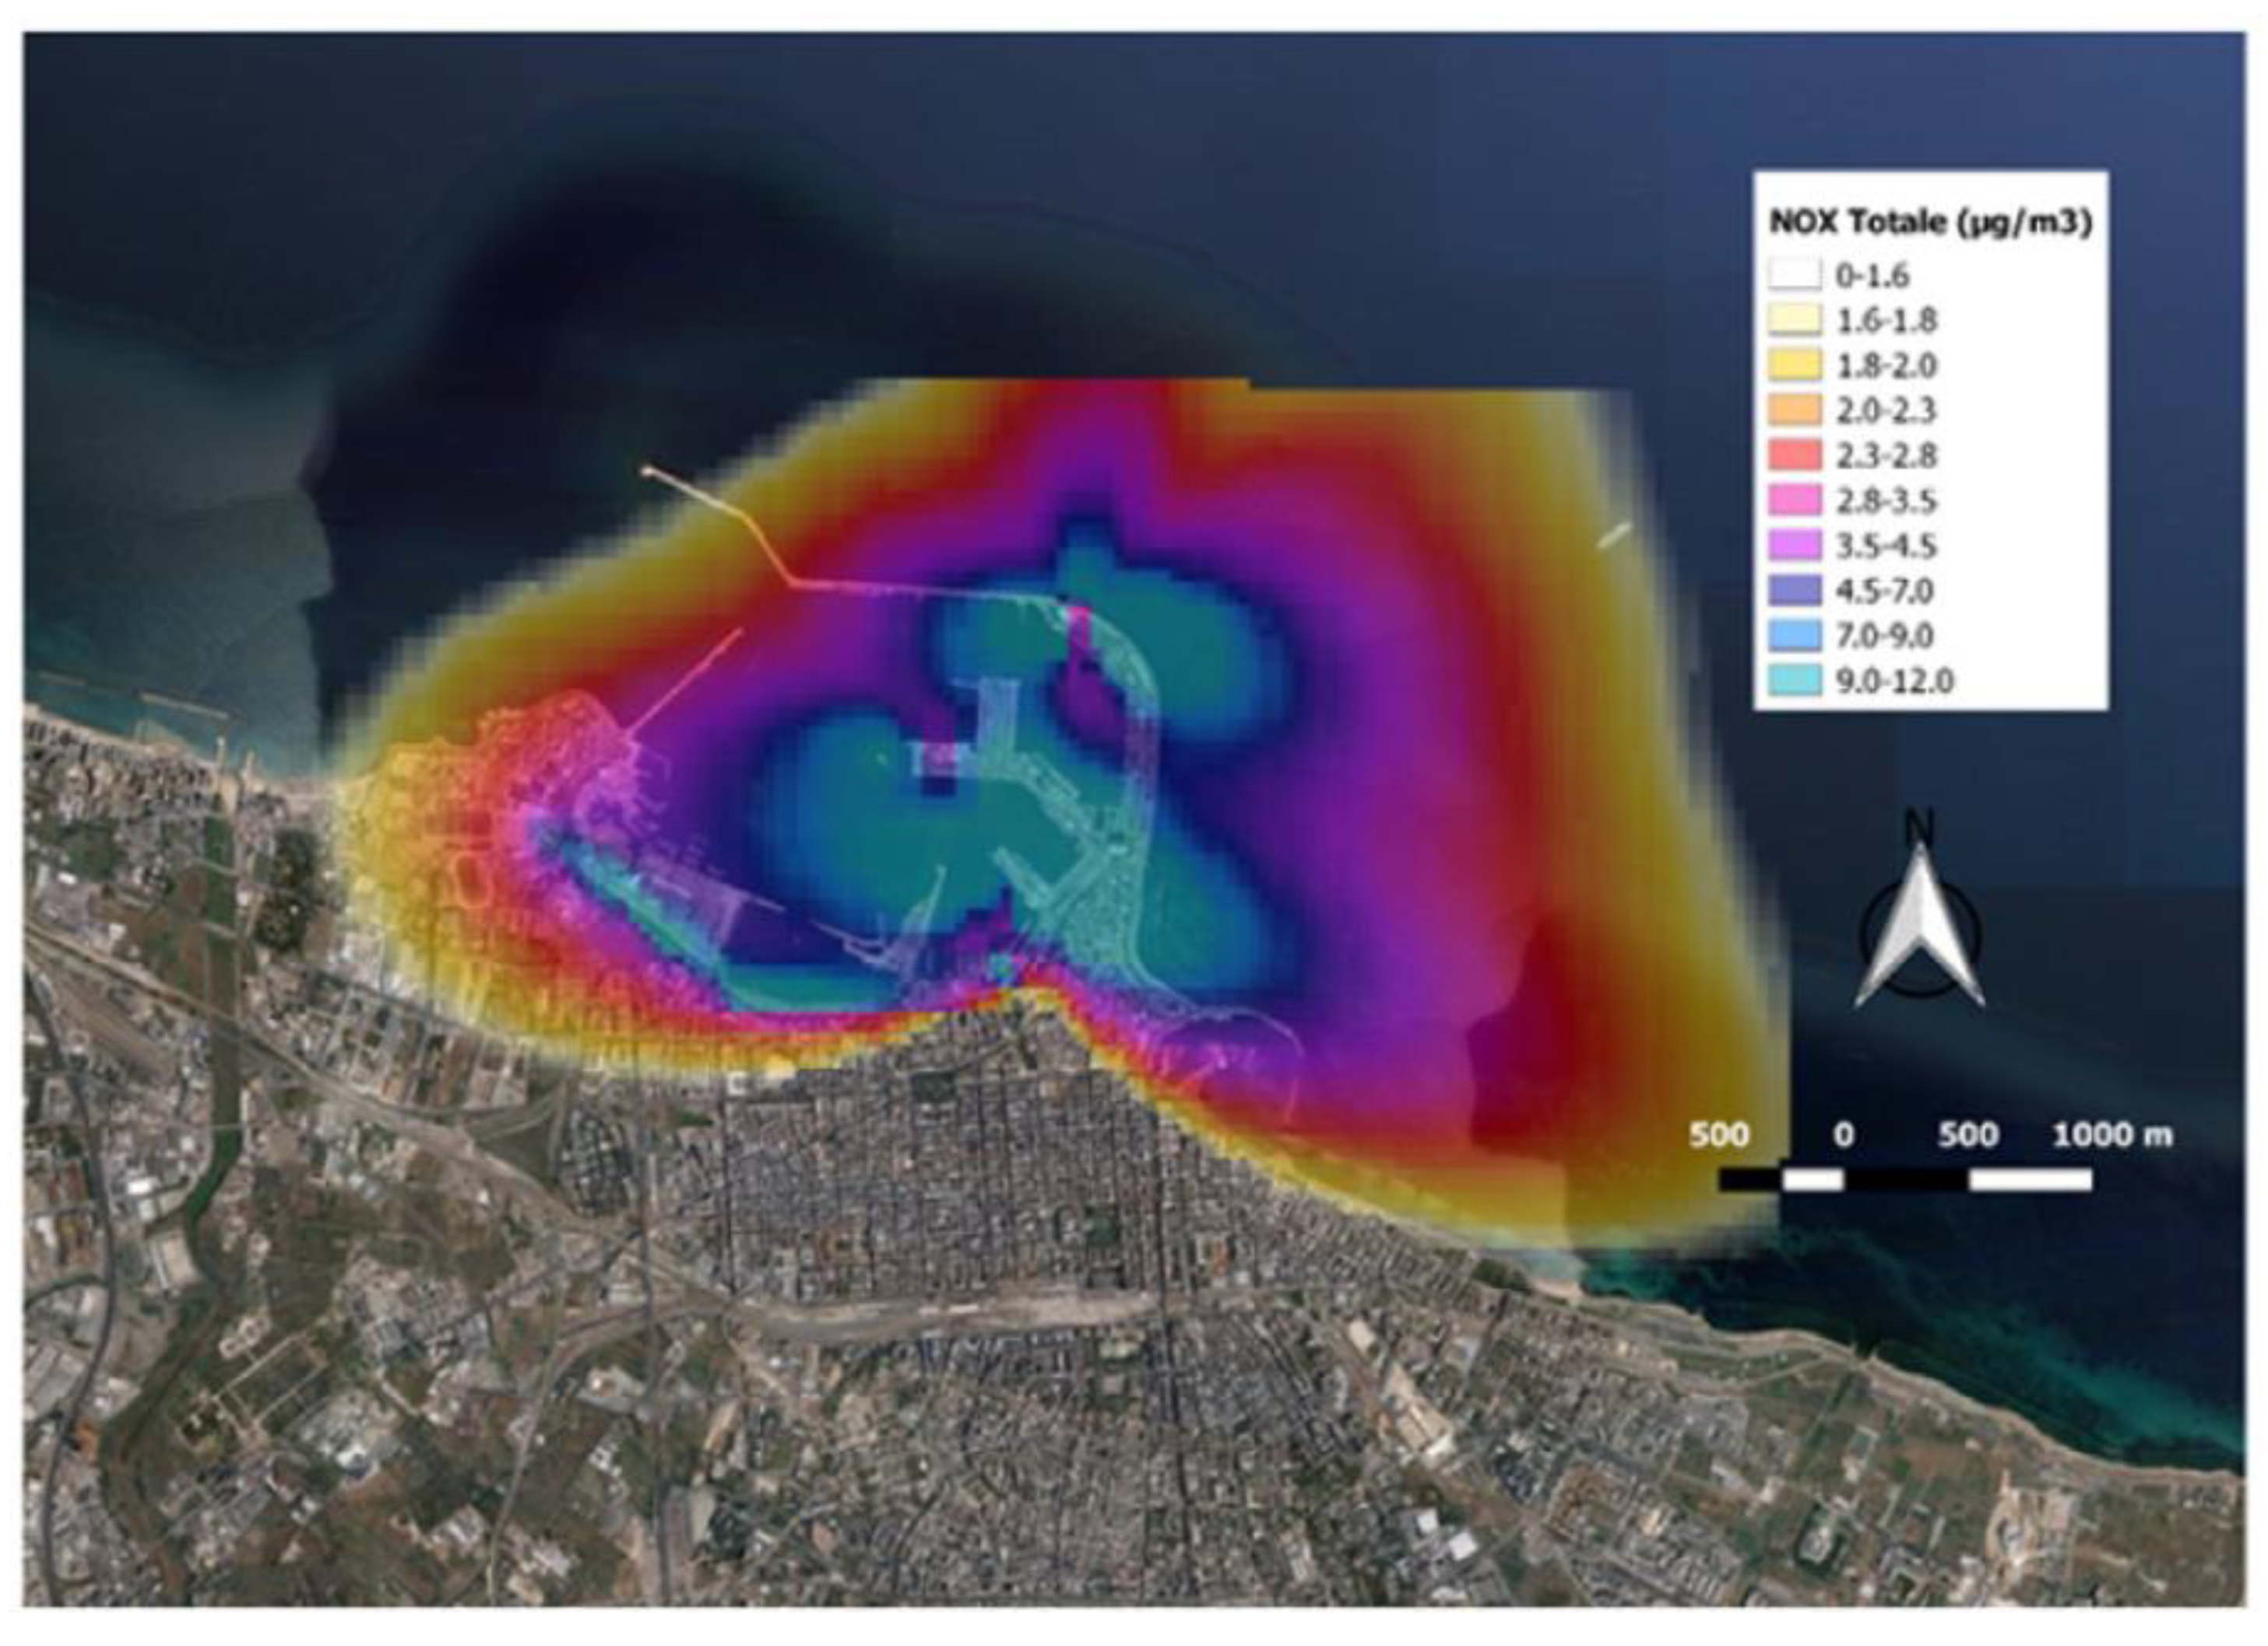
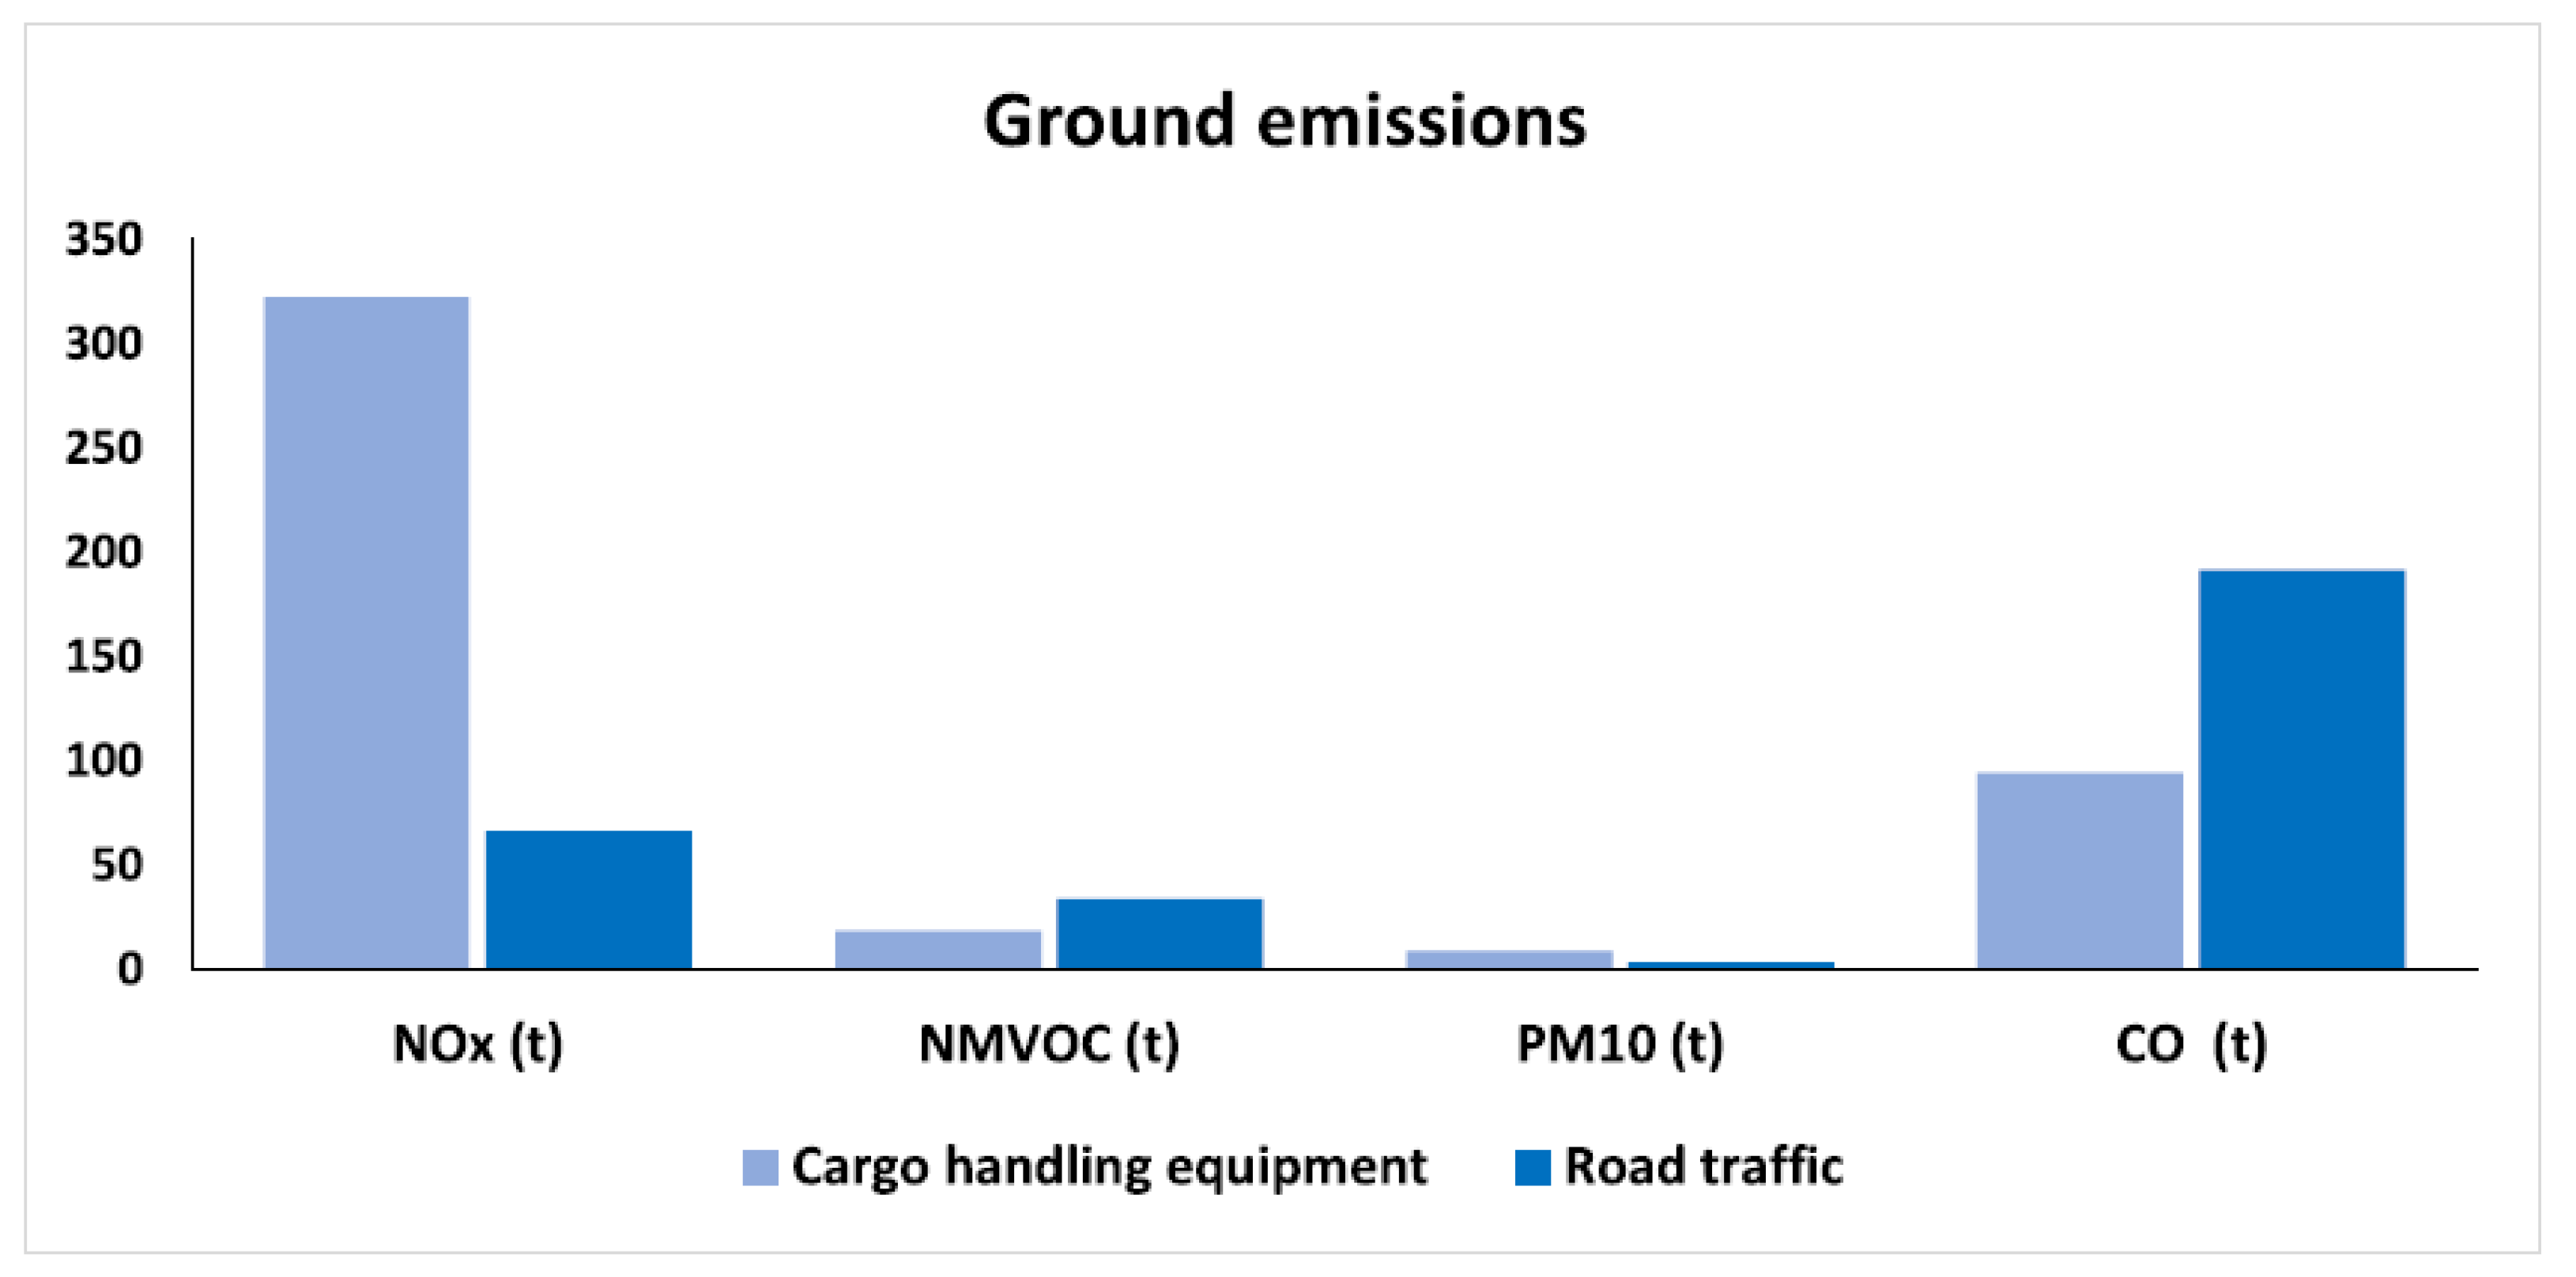
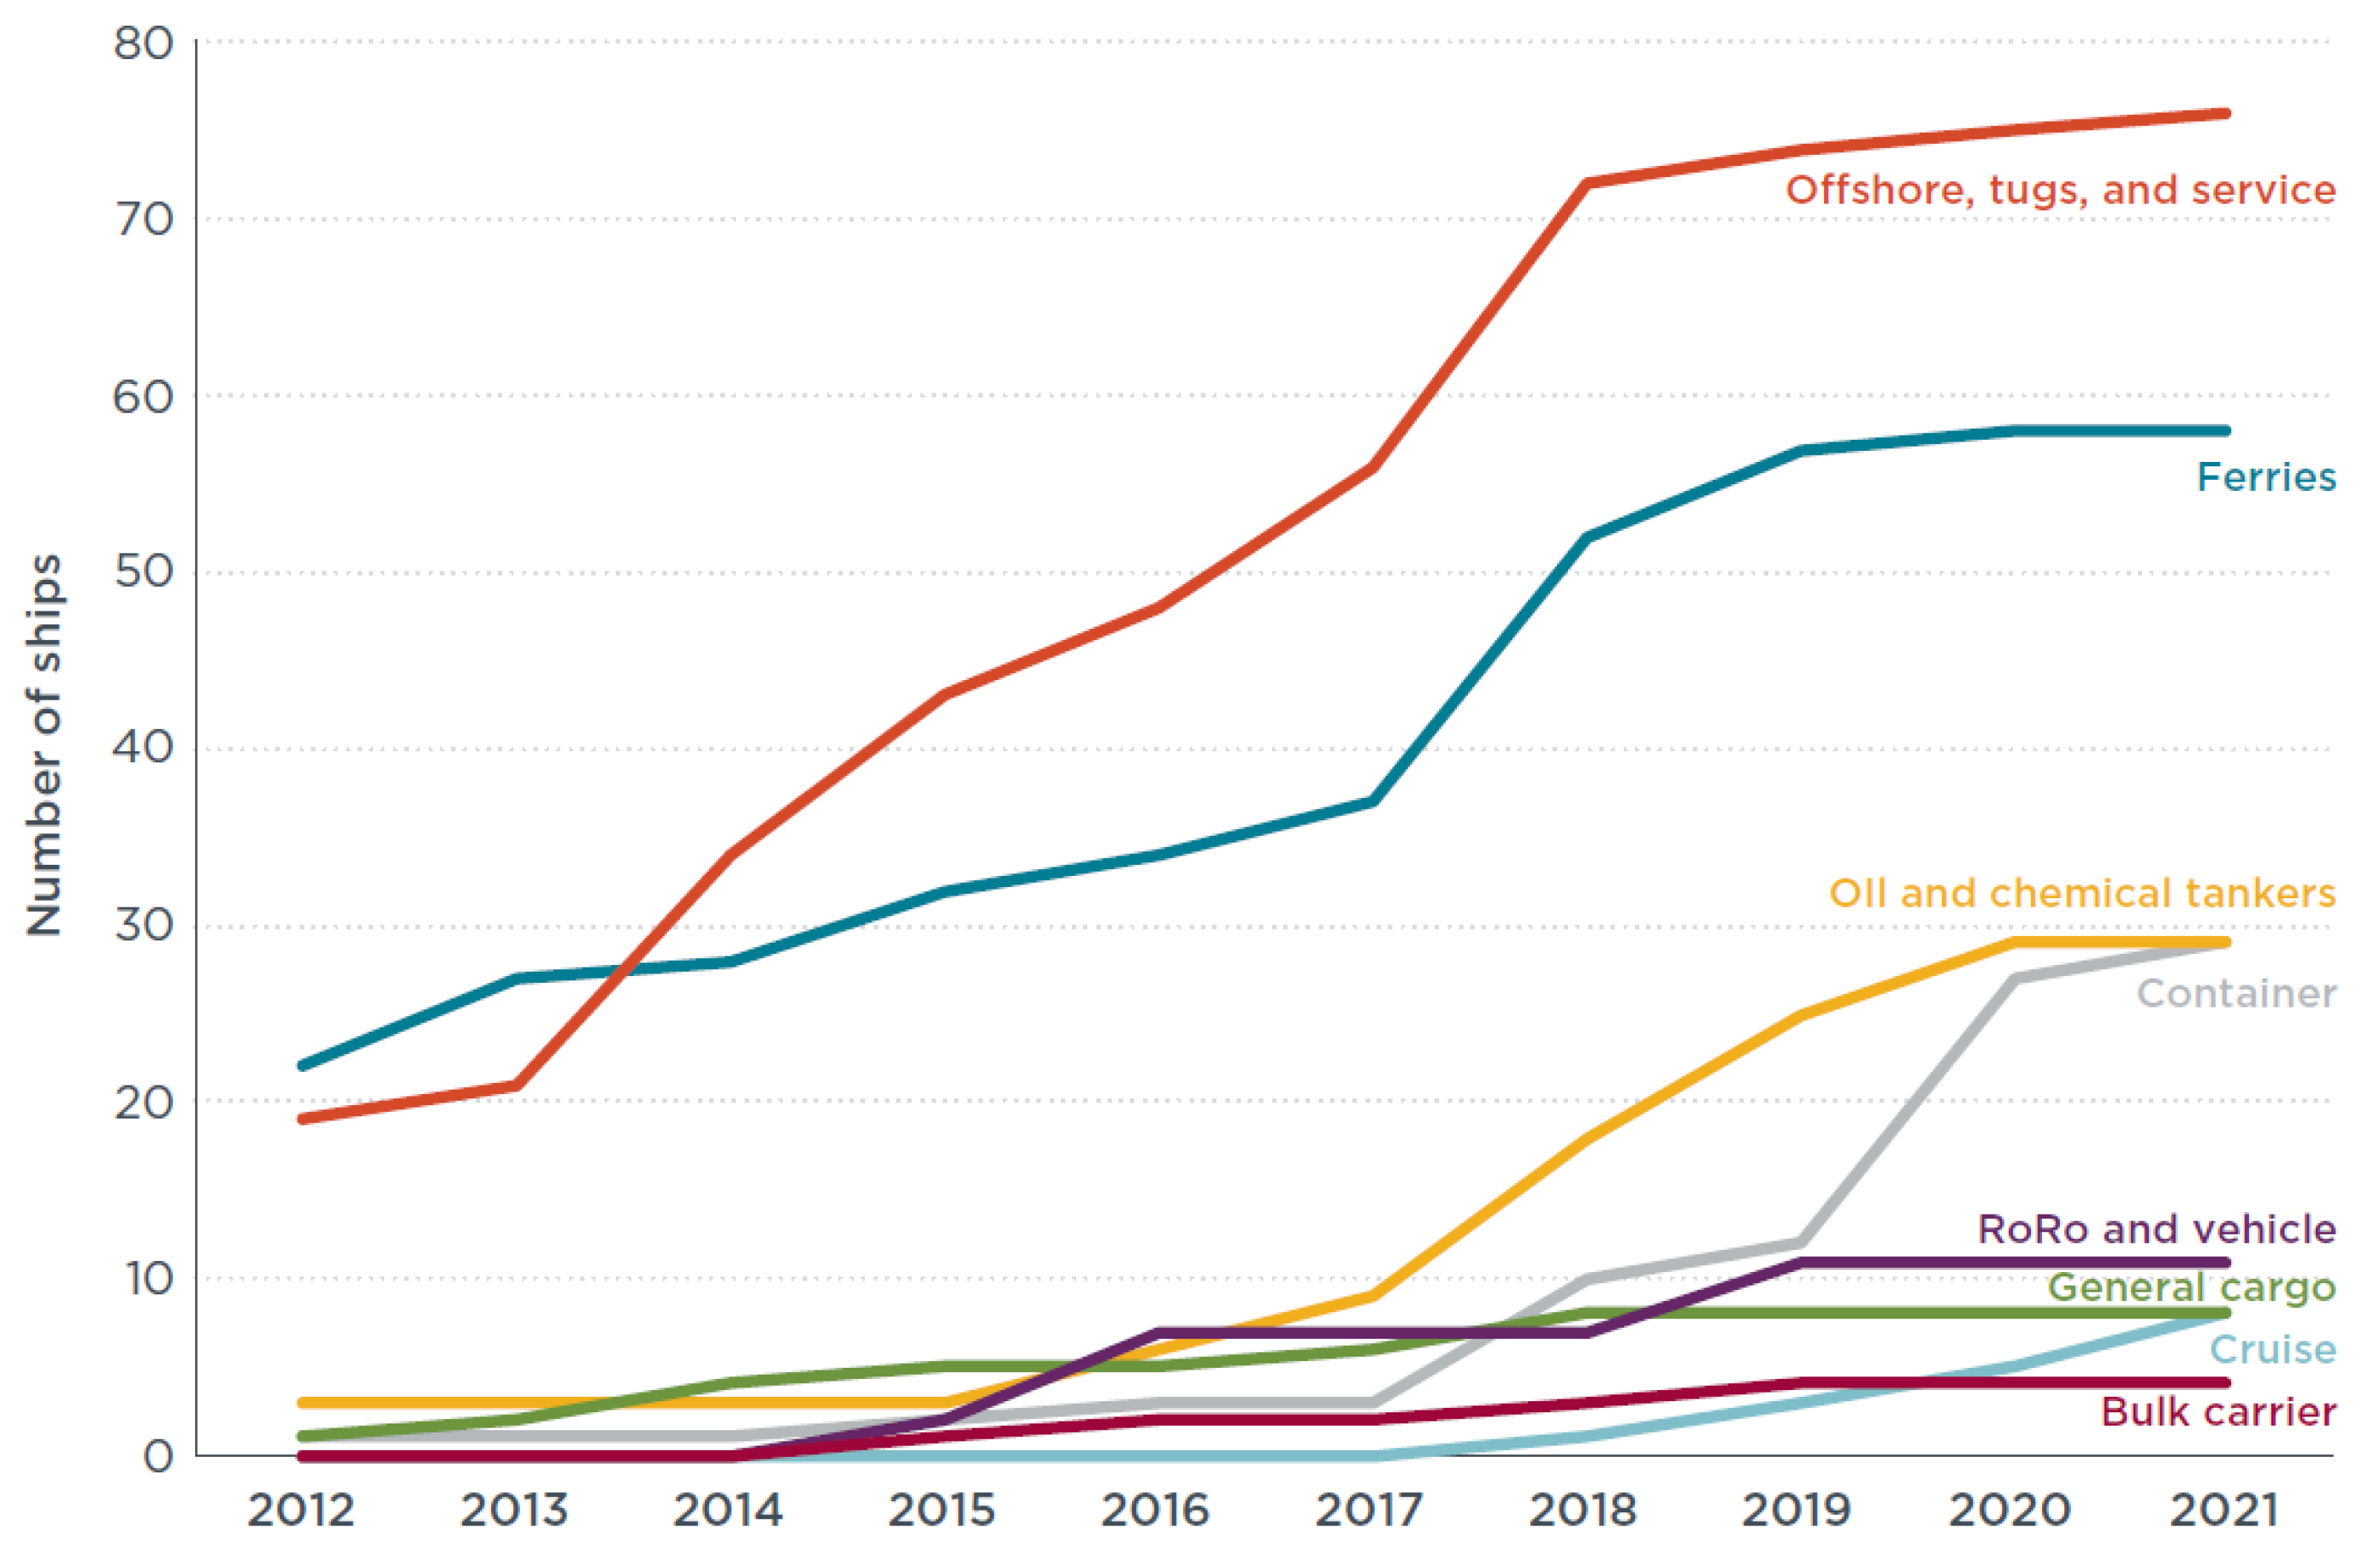
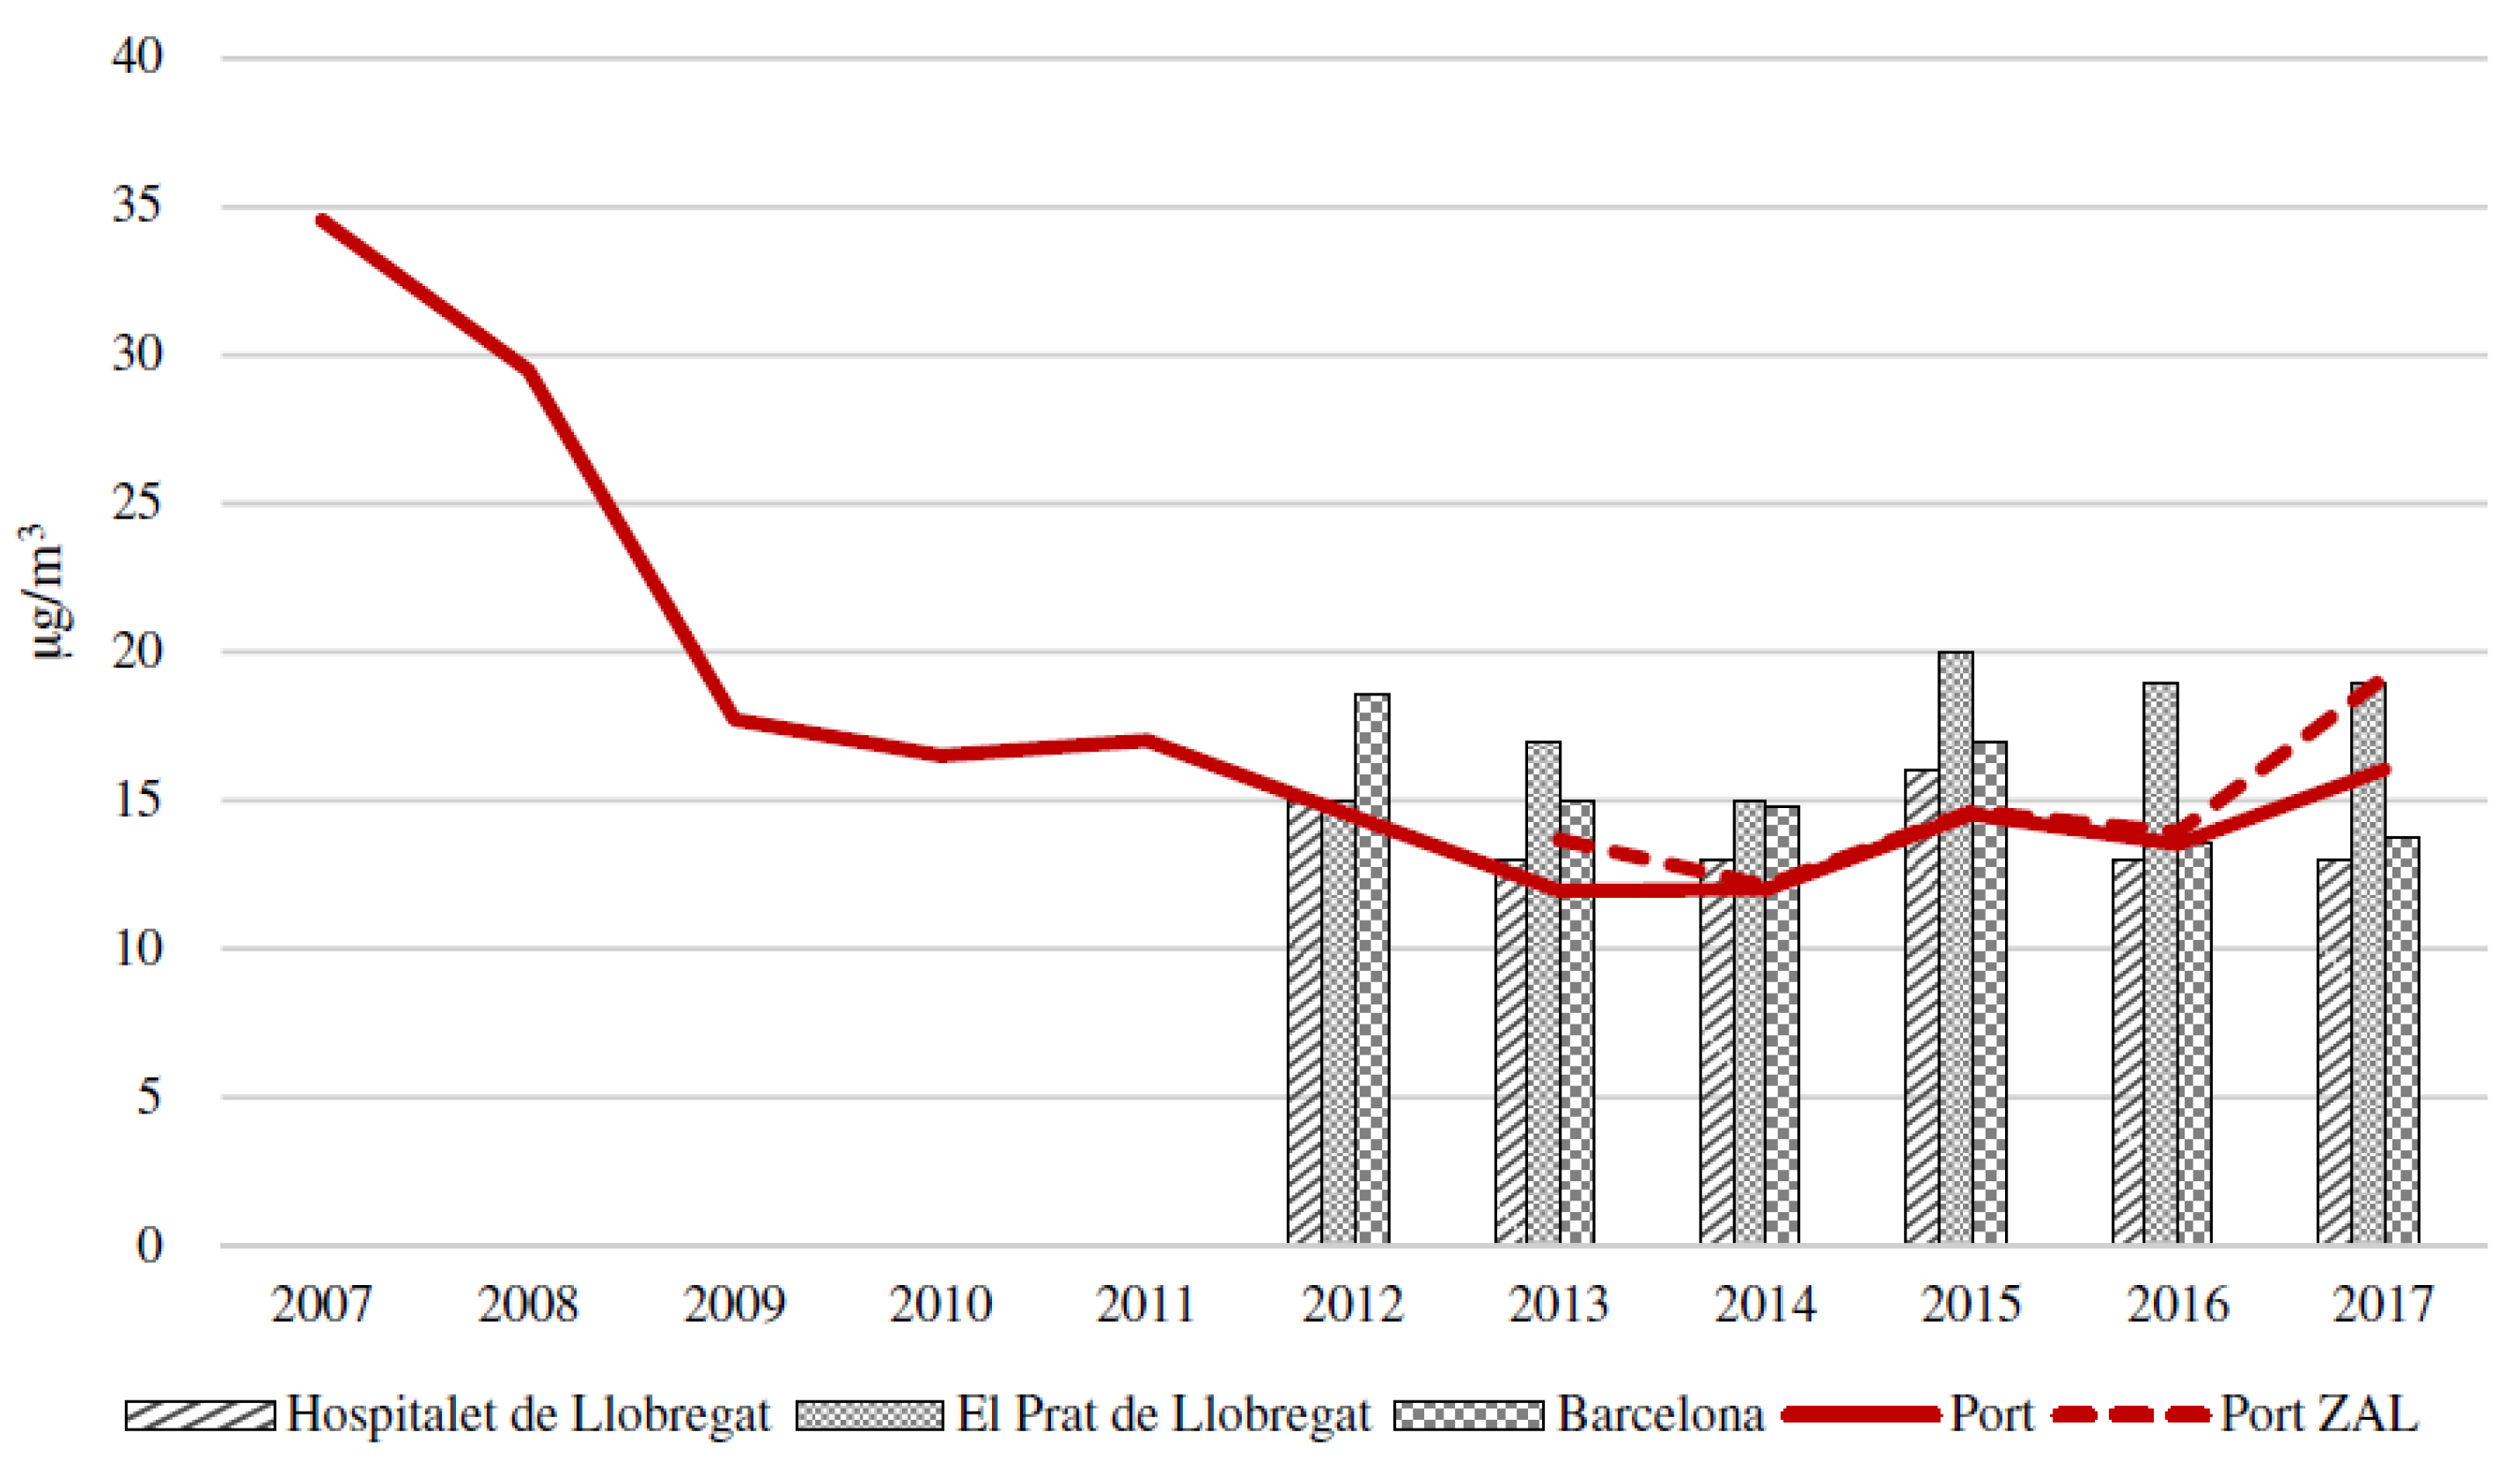
5.2. Port of Barcelona, Spain (2020)
- Investments into new infrastructure to encourage the use of alternative fuels (e.g., LNG);
- Provision of electric connection for marine vessels;
- Price discounts and port charge reductions as an incentive for virtuous shipping companies that improve environmental performance;
- Replacement of diesel-powered land vehicles with electric or natural gas;
- Electrification and gasification of port terminal machinery;
- Investments in better infrastructure to improve the use of rail and Short Sea Shipping (SSS) to reduce road transportation and traffic;
- Enhancement of collaboration with port customers and other external stakeholders to promote sustainable mobility.
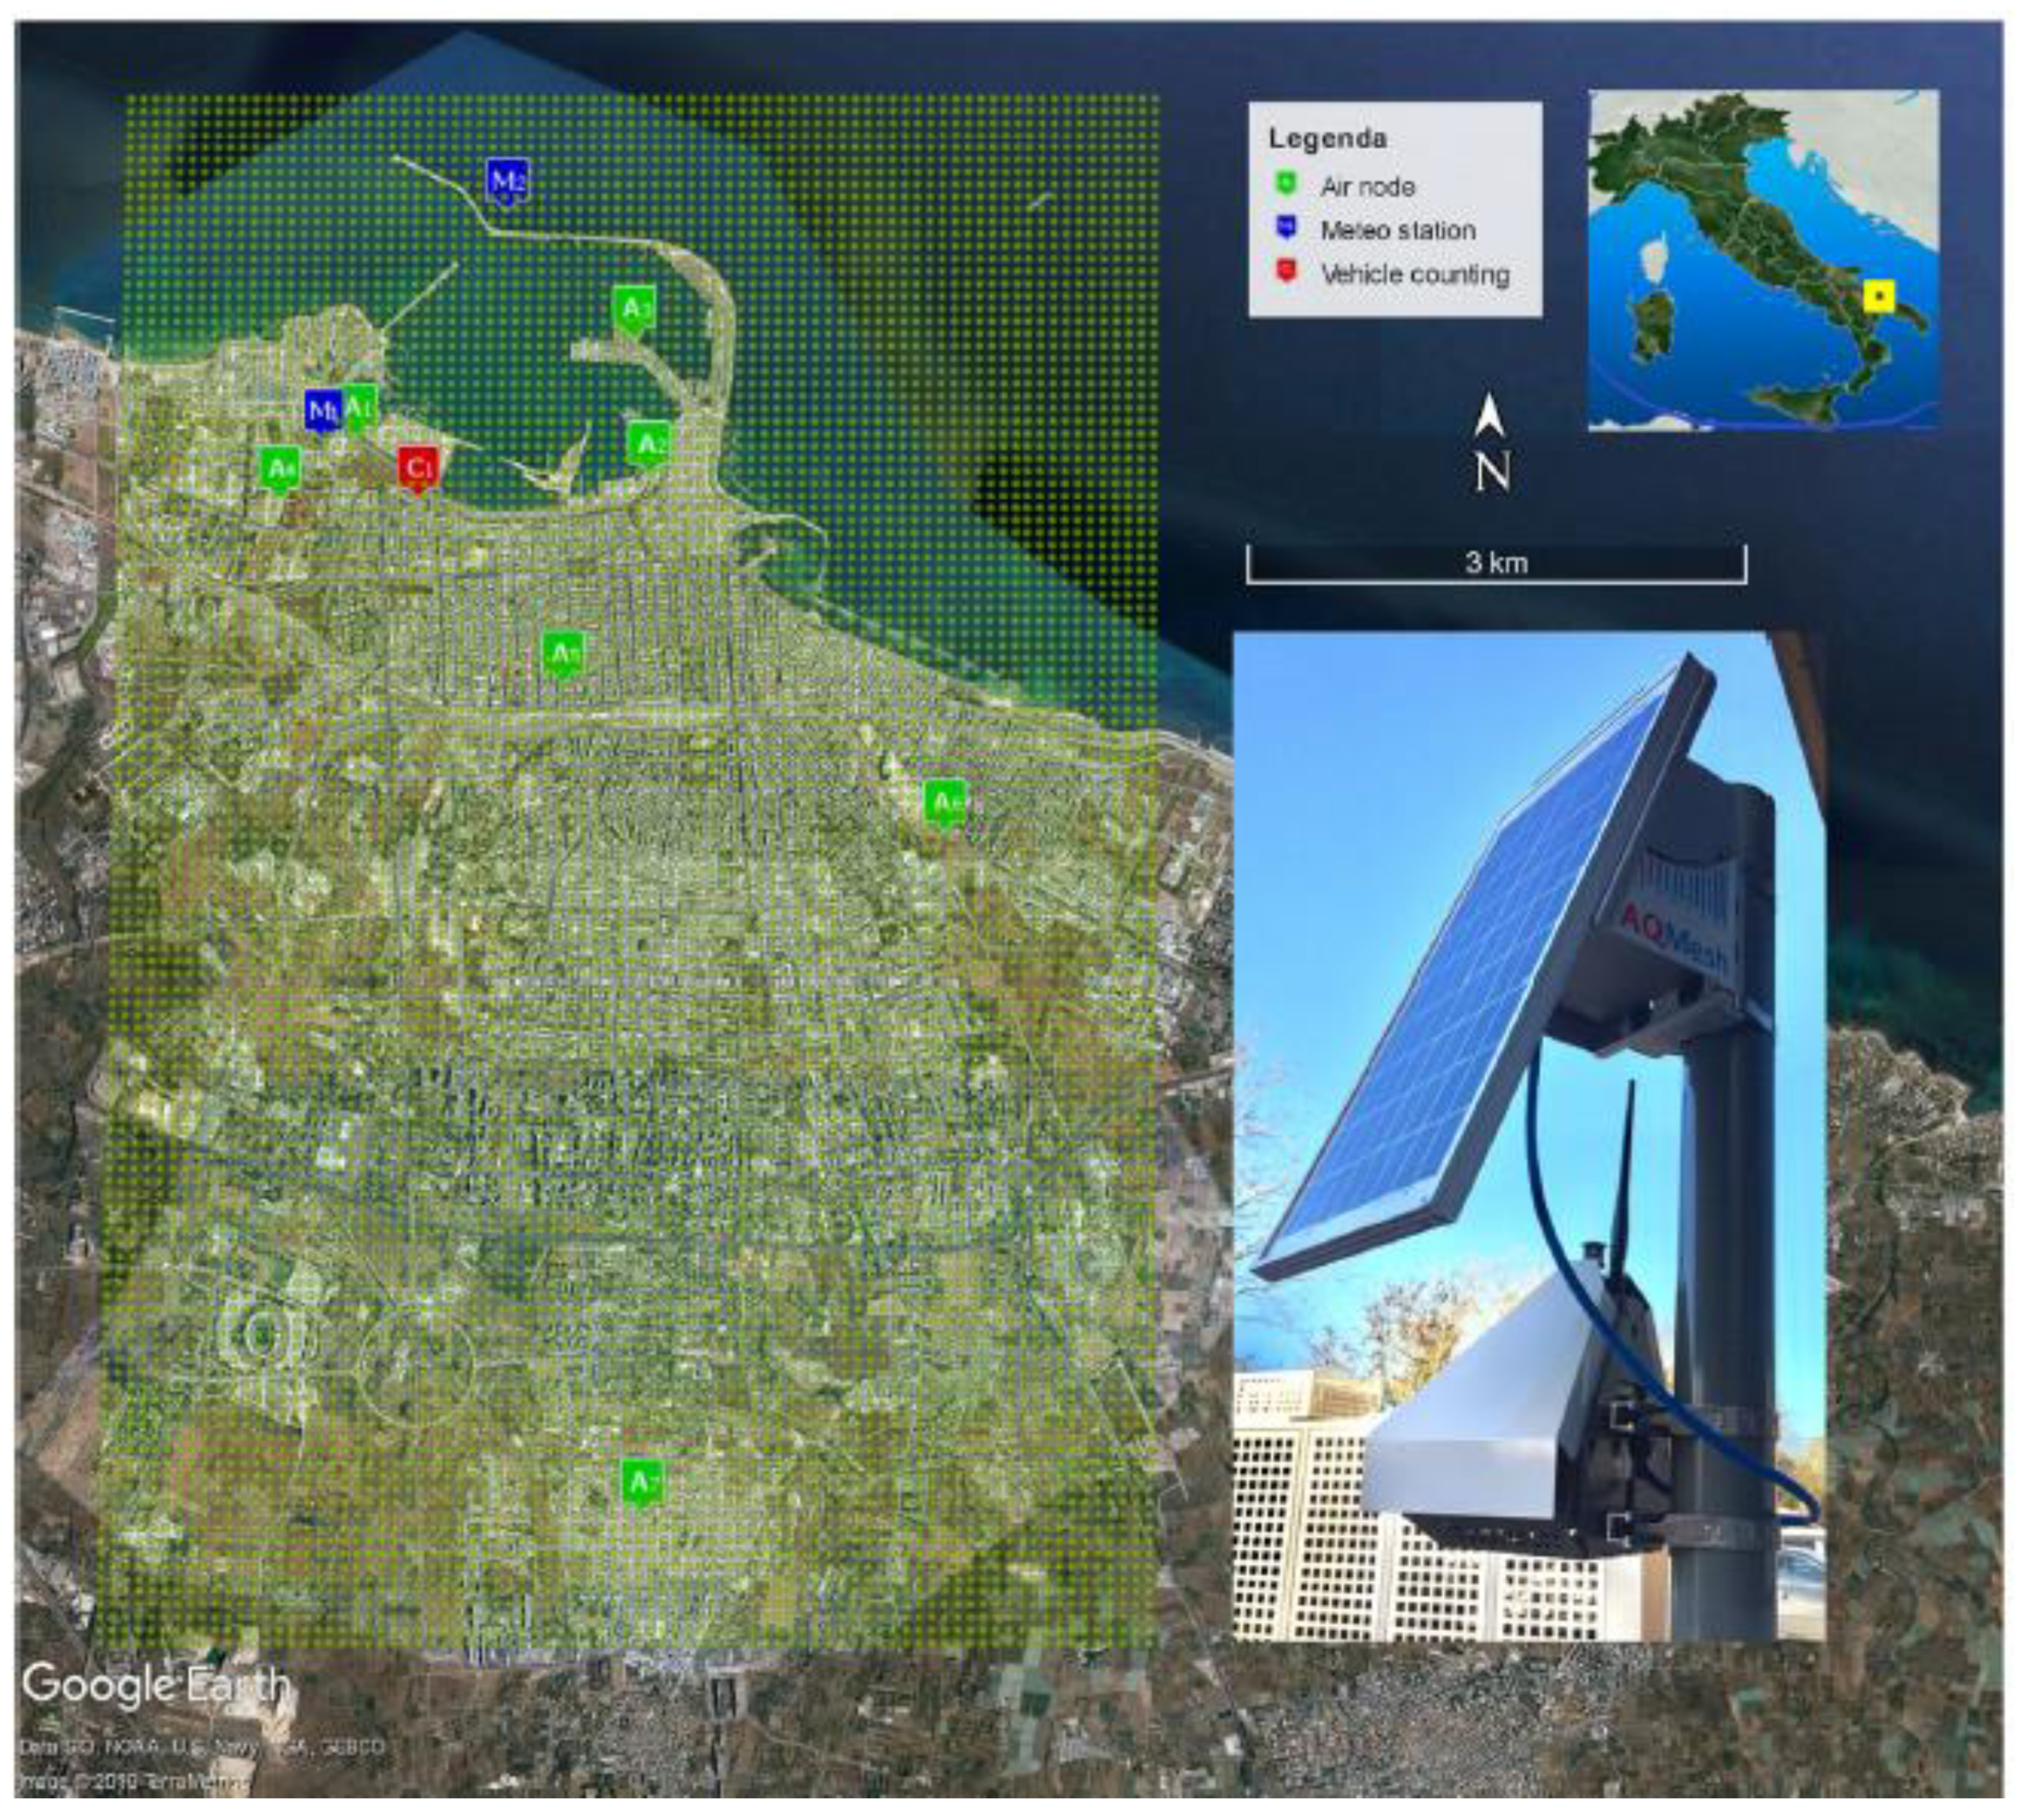
5.3. Port of Bari, Italy (2019)
5.4. Port of Piraeus, Greece (2021)
- Ei = total amount of ship emissions for a specific pollutant i ;
- p = phase of activity (hoteling, maneuvering);
- m = fuel type;
- j = engine type;
- e = engine category (main, auxiliary);
- T = time spent at each activity phase h;
- P = engine nominal power (in kW);
- LF = engine load factor (in %);
- EF = emission factor for the type of vessel and pollutant (in kg/kWh).
5.5. Port of Valencia, Spain (2019)
- CEx = Total weight of CO2 emissions produced at terminal in tonnes;
- ai = Yearly consumption of fuel in Tonnes of Oil Equivalaents (TOEs) with equipment i;
- ff = Emission factor in tonnes of CO2 emission per TOE;
- bj = Yearly consumption of electricity in kWh with equipment j;
- fe = Emission factor in tonnes of CO2 emission per kWh.
6. Proposed Actions and Technologies to Manage Emissions in Ports
6.1. Power and Propulsion Systems
- Ep = Engine power;
- Fc = Specific fuel consumption;
- CF = Carbon factor;
- Dt = Deadweight tonnage;
- v = Speed.
6.2. Alternative Fuels
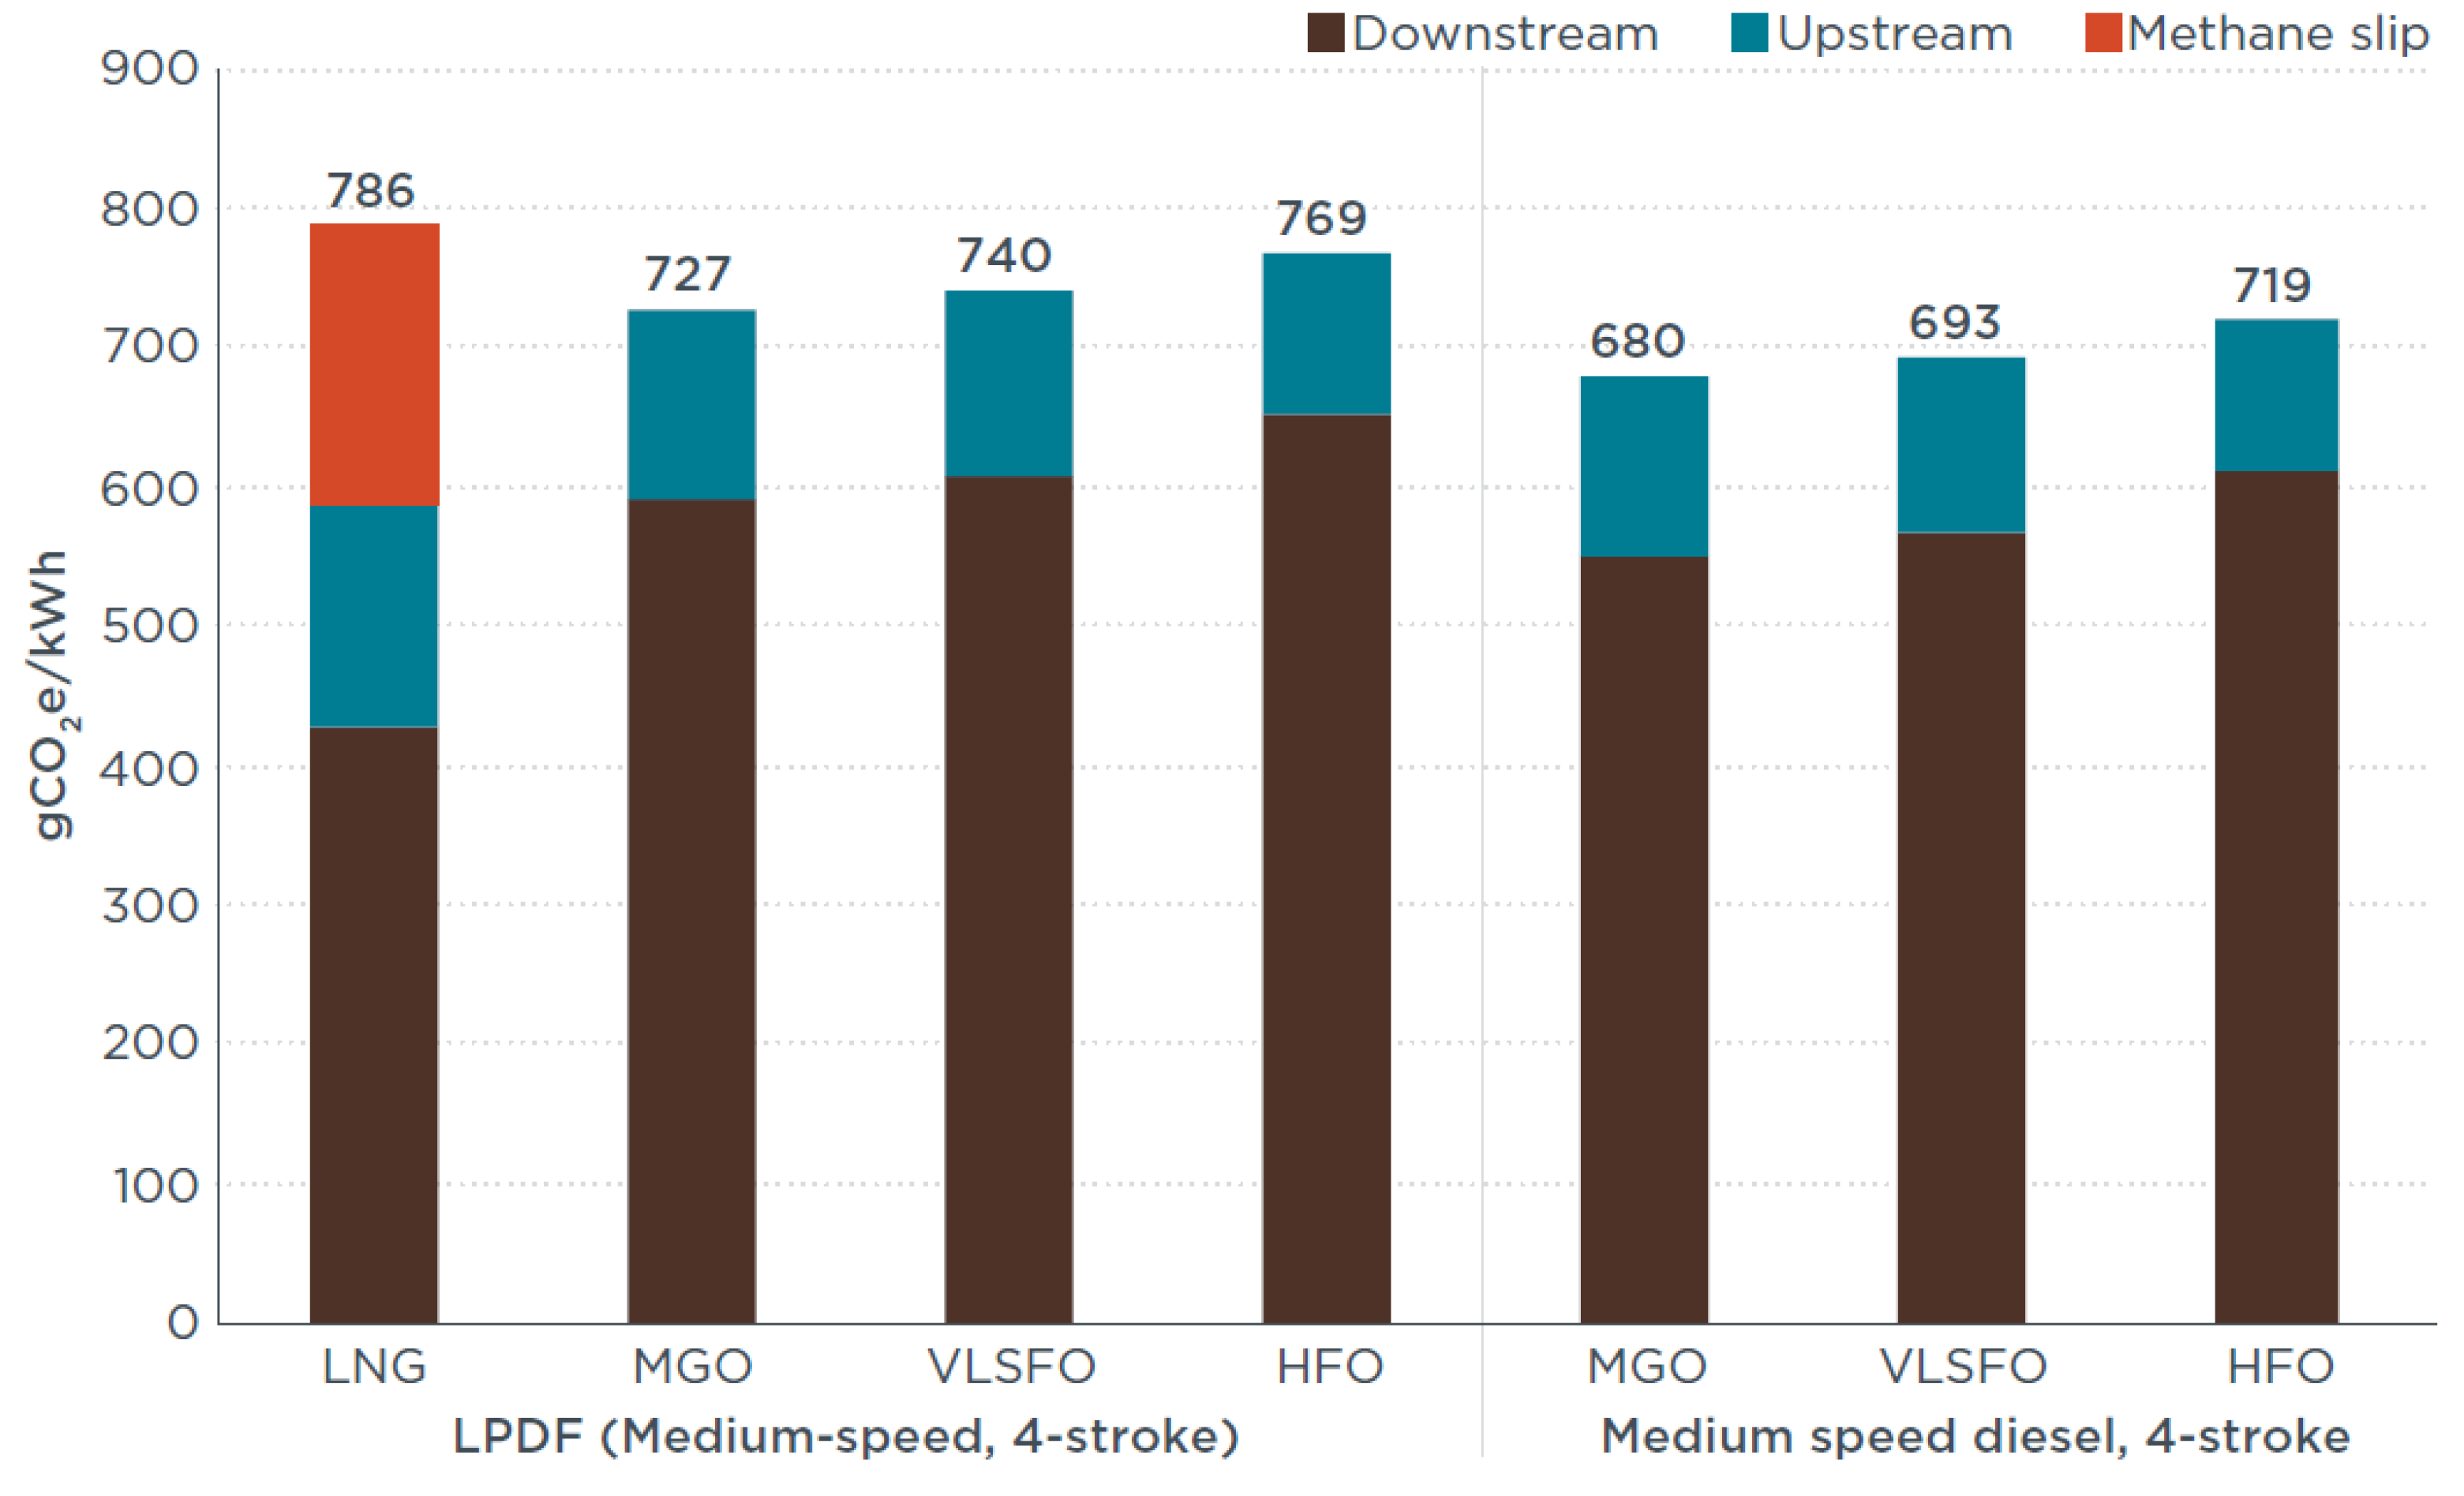
6.2.1. Liquid Natural Gas (LNG) and Liquid Propane Gas (LPG)
6.2.2. Biofuels
- Bio-Ethanol, the most widespread biofuel in the world, but not for seaborne transport. Almost exclusively produced from fermentation of starches and other food crop sugars, although new alternative extraction processes are in development. When not sided by other GHG reduction technologies, the achieved performance is however lower than for other biofuels such as Bio-Methanol. Its use for maritime transport is currently minimal, with few or no related projects at the moment [69,70].
- Bio-Methanol, produced from biomass instead of fossil fuels such as standard Methanol. The procurement of biomass can be challenging due to availability and logistic difficulties, eventually becoming an uneconomical process, in addition to production costs. Besides, biomass can also add a further impact upon GHG emissions on its own (for example from feedstock); Bio-Methanol has already been tested and used as a diesel fuel for marine engines, which appear to require technical adjustments to cope with its corrosive nature and high auto-ignition temperature. The levels of GHG emissions from Bio-Methanol are anyways lower when compared with common Heavy Fuel Oil (HFO) and Marine Gas Oil (MGO) [71,72].
- Bio-Dimethyl Ether, which can be a direct substitute of diesel fuels. It can be produced from processing Methanol with expensive production processes. It is hence derived from fossil fuels, and its production processes hold similar pros and cons of those for Methanol. Having a similar behavior to Propane, the same storage and distribution infrastructure can be used on ships and ports; it is more compatible than Methanol with diesel engines, requiring minor adjustments, although presenting low viscosity and lubricity that does not facilitate engine movements. It is characterized by a clean combustion and consequently by clean emissions [73,74].
- Bio-Liquid Natural Gas (Bio-LNG), and Liquefied Bio-Methane (LBM), obtained from several complex production processes, have the disadvantage of a limited supply, having to rely on feedstock availability and transportation, considering that feedstock is also used for other competing industries, as well as its derivate fuels. LNG can lead to a phenomenon called “methane slip”, meaning that part of the methane, which is a potentially hazardous GHG gas, can leak into the atmosphere during transfer operations or even during combustion. Bio-LNG is however a very attractive fuel for maritime transportation due to its clean emissions, considering for example the much lower SOx emissions compared to low-Sulphur distillate marine fuel [75,76,77,78].
6.2.3. Other Green Fuels
- Ammonia (NH3), commonly used as a fertilizer, can also be used as a fuel both by direct combustion and stored in fuel cells [79,80]. It is produced almost totally starting from fossil fuels (natural gas) and a sustainable ecological production would require significant renewable resources. GHG Emissions from marine engines using geothermal-based ammonia as dual fuel can decrease up to 33.5% tonne/Km, and up to 69% if used as a unique type of fuel [81].
- Hydrogen (H2), for electric engines. Can be produced either from fossil fuels but also from water electrolysis with green electricity, in this case meaning theoretically zero-emission ships. The required raw materials are only oxygen and nitrogen, and the byproducts are just heath and water. Hydrogen as a fuel needs large storage tanks both in liquid and gas forms, besides dedicated bunkering infrastructure currently not available [82,83].
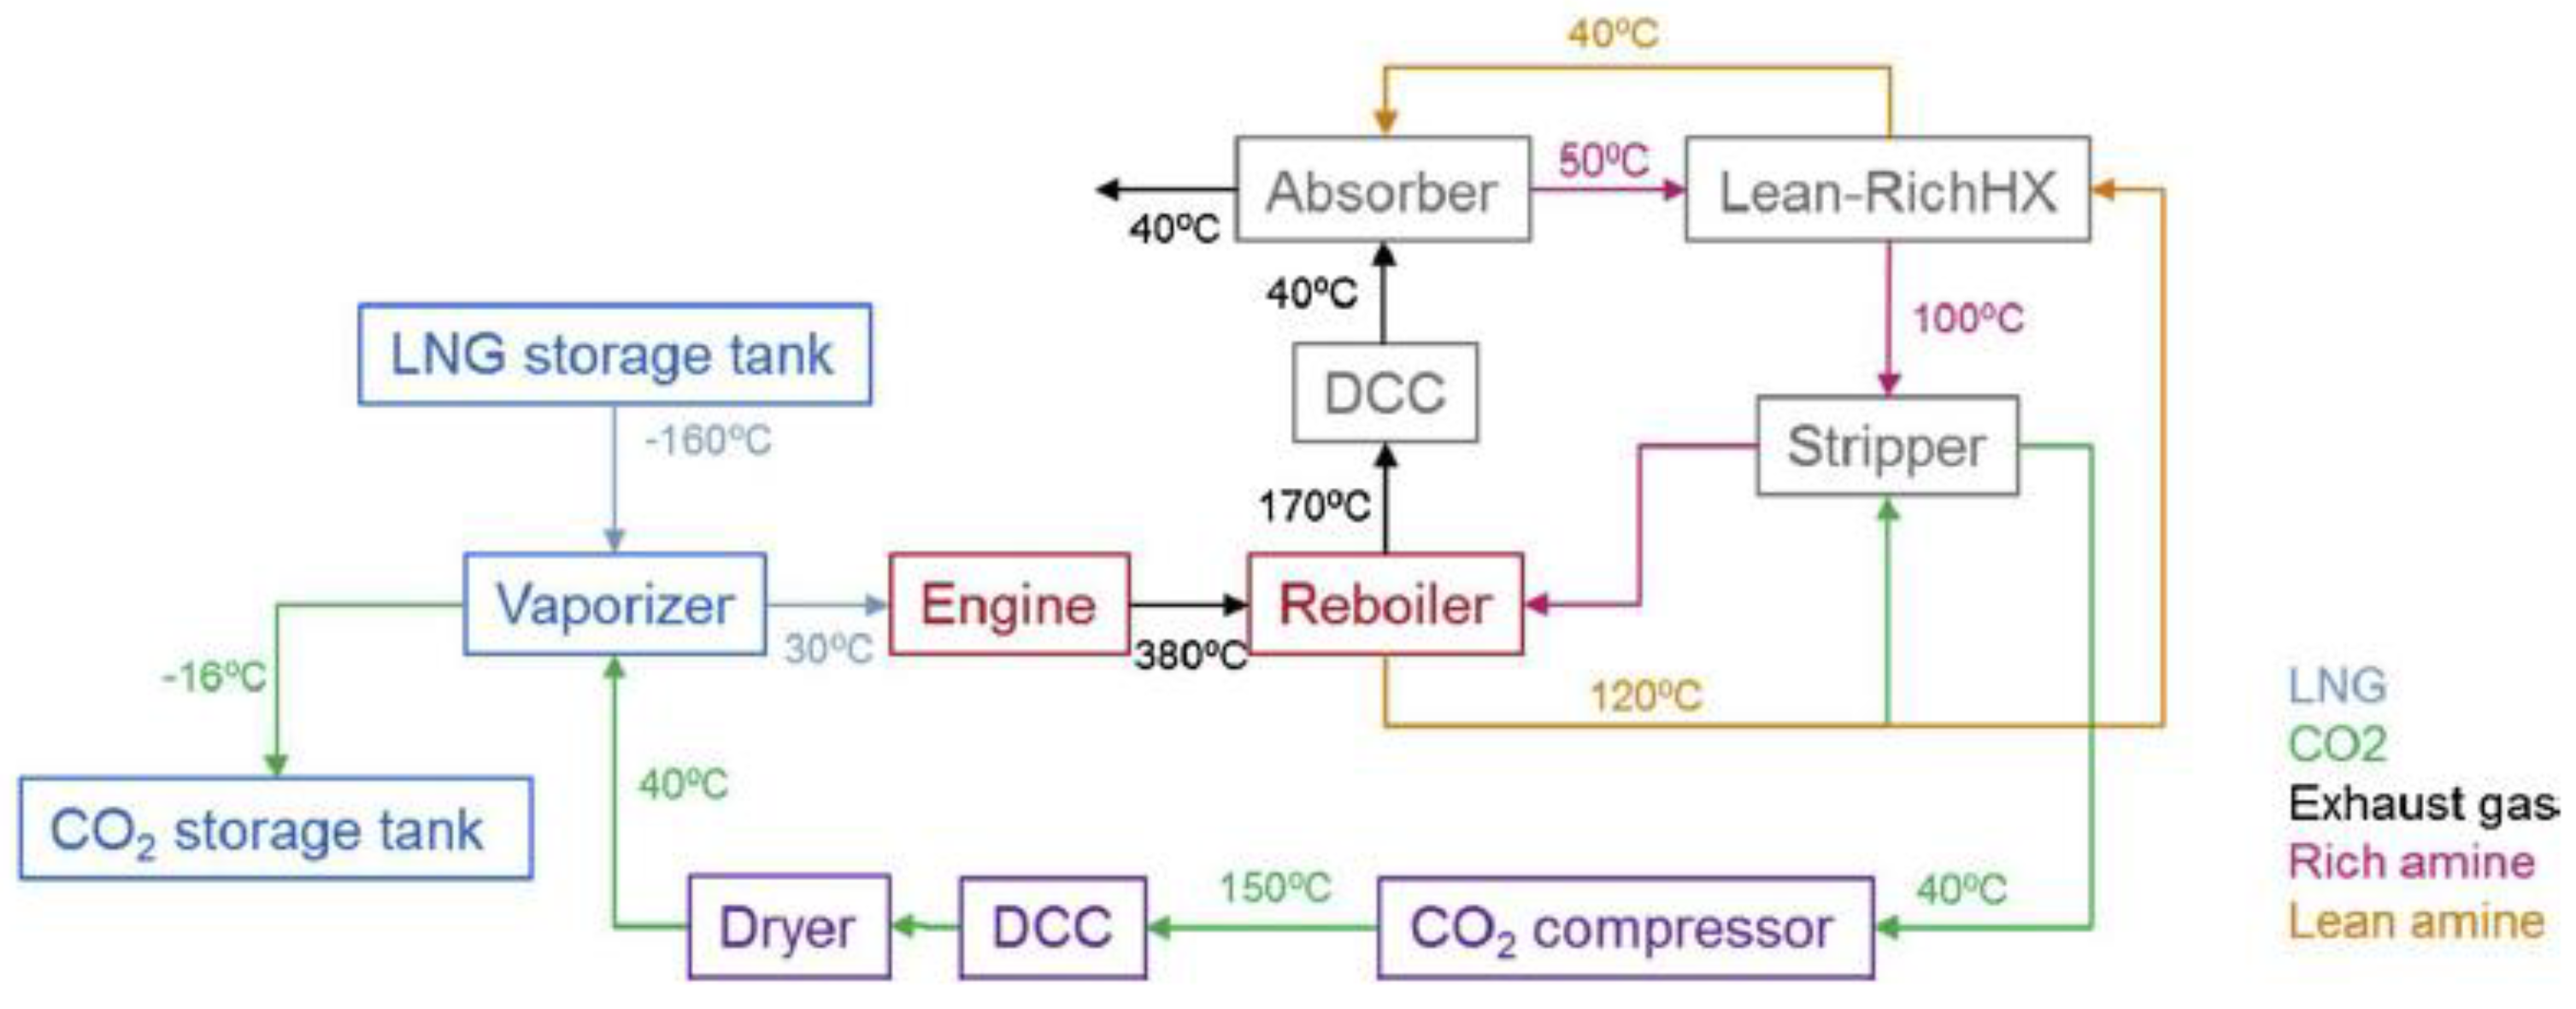
6.3. CO2 and Carbon Capture Systems
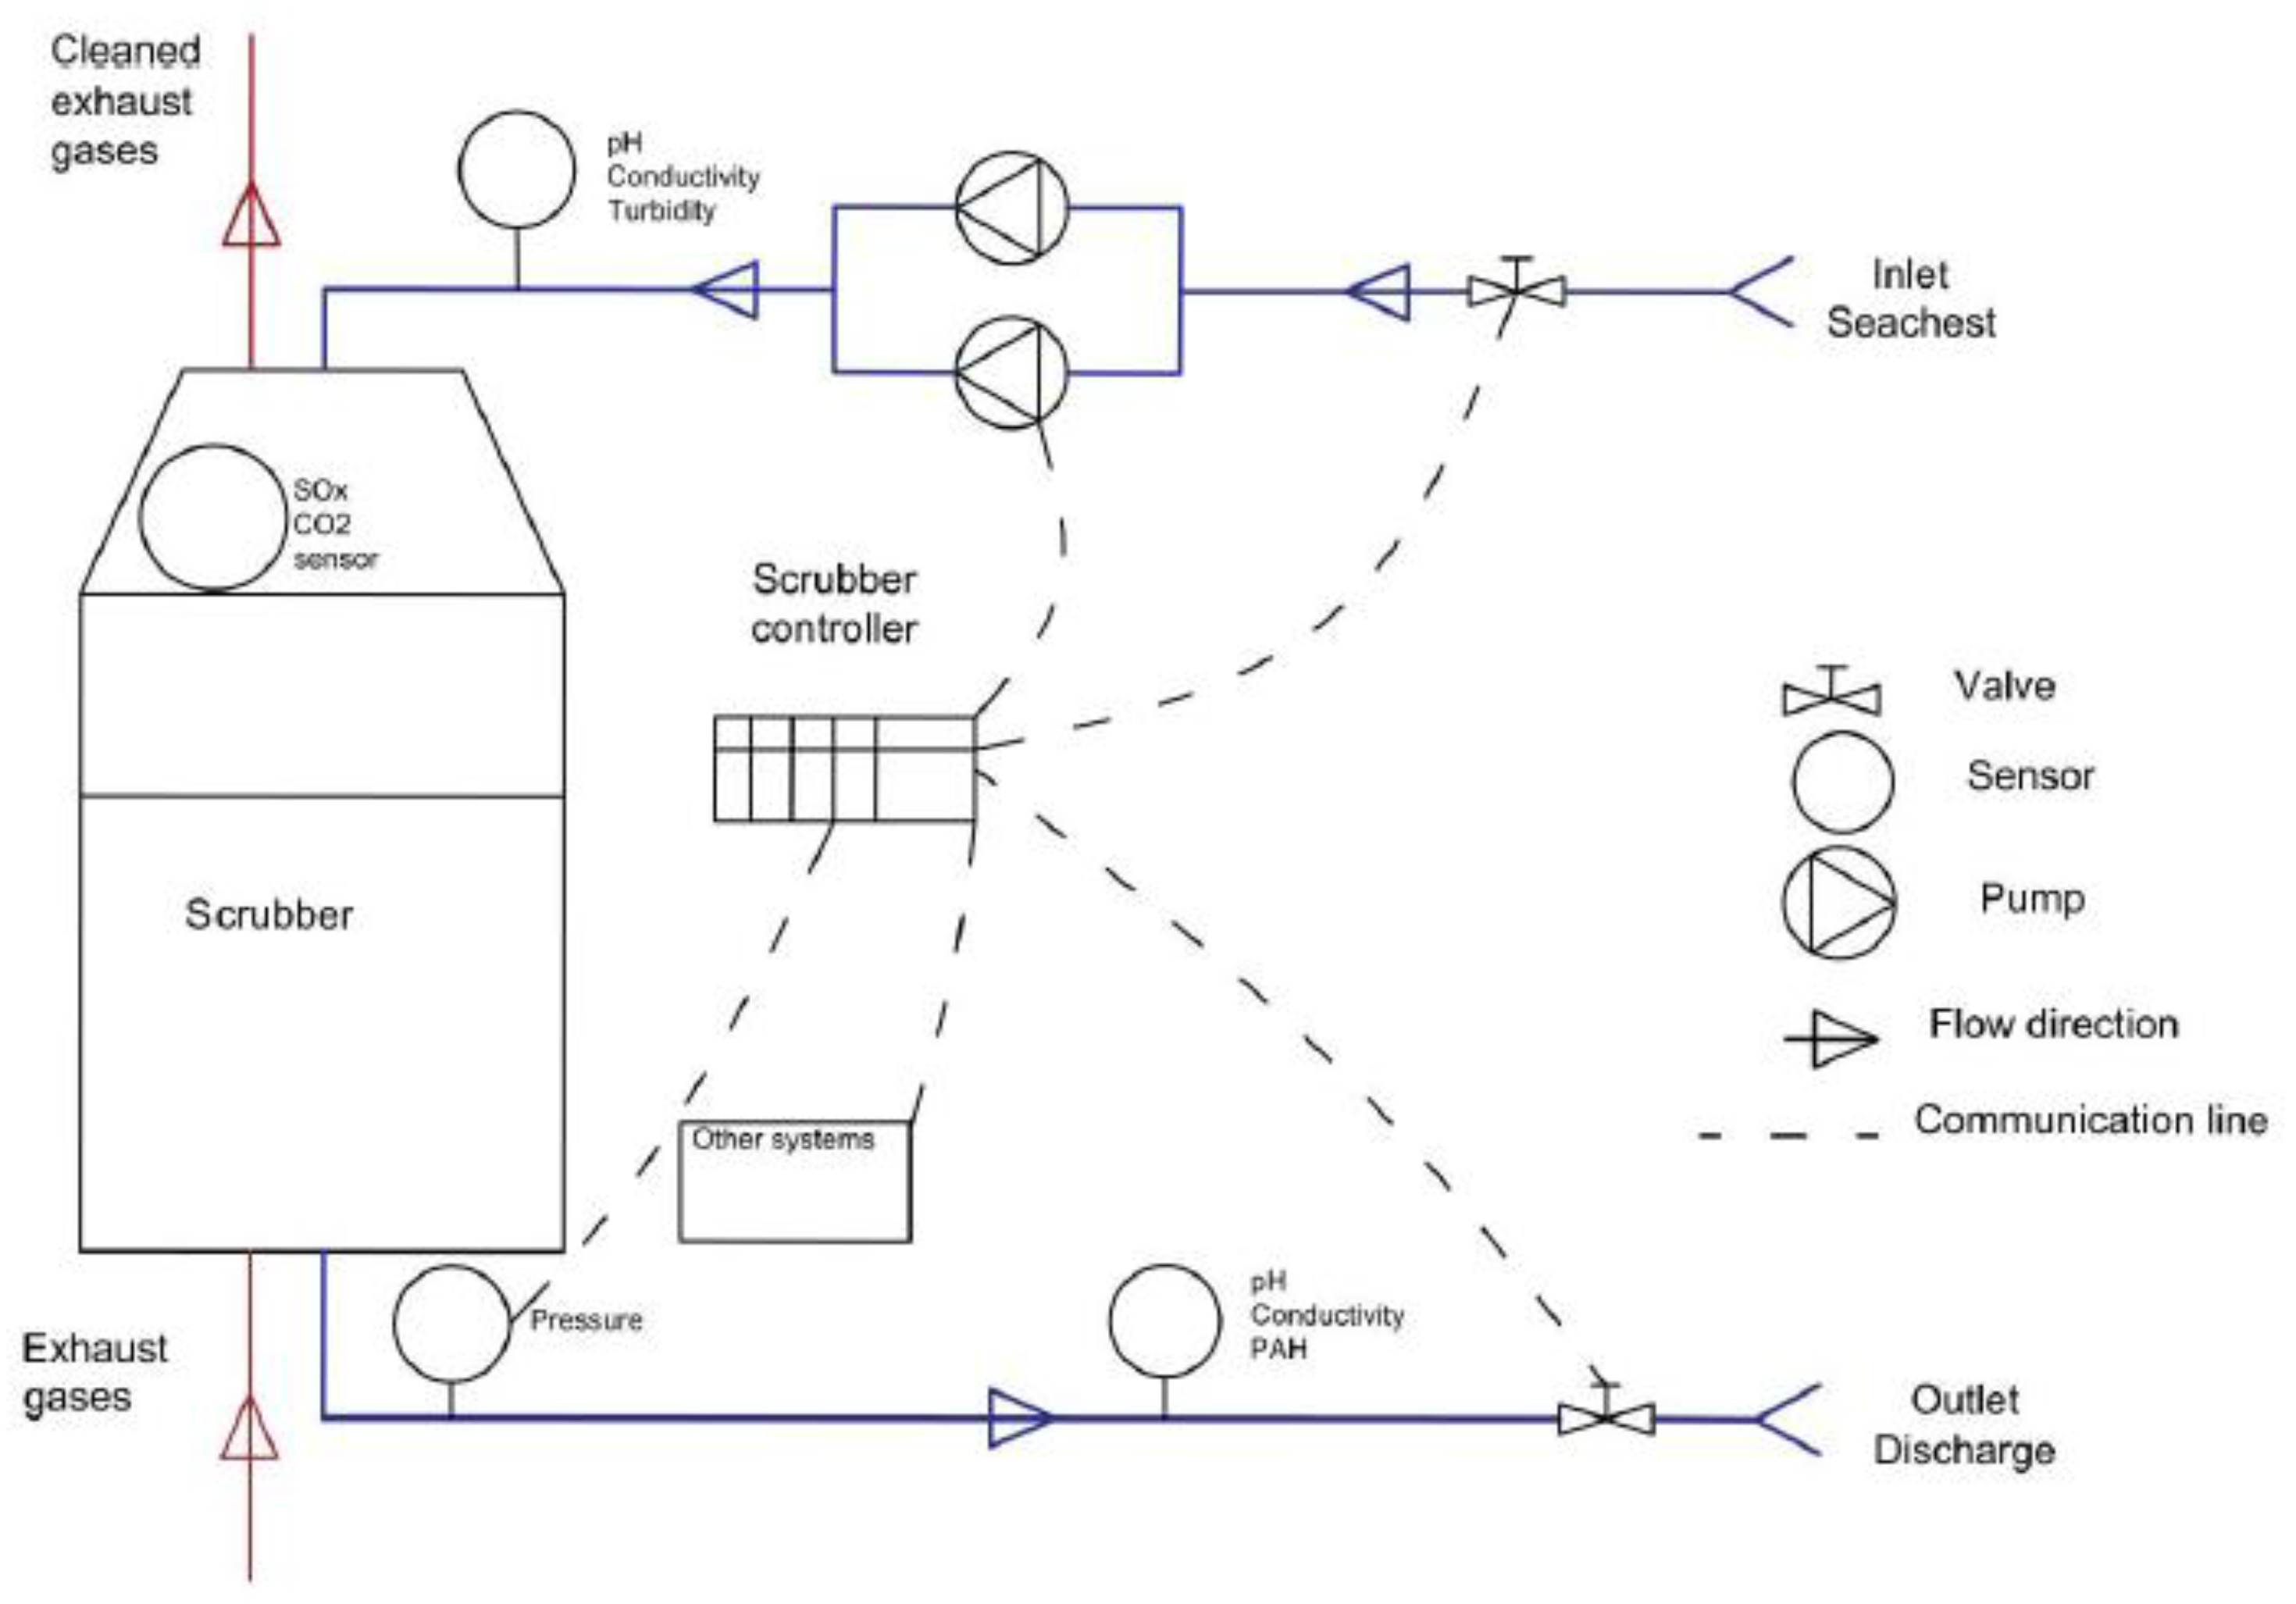
6.4. SO2 and Scrubbers
6.5. Renewable Energies: Photovoltaic, Wind, and Fuel Cells
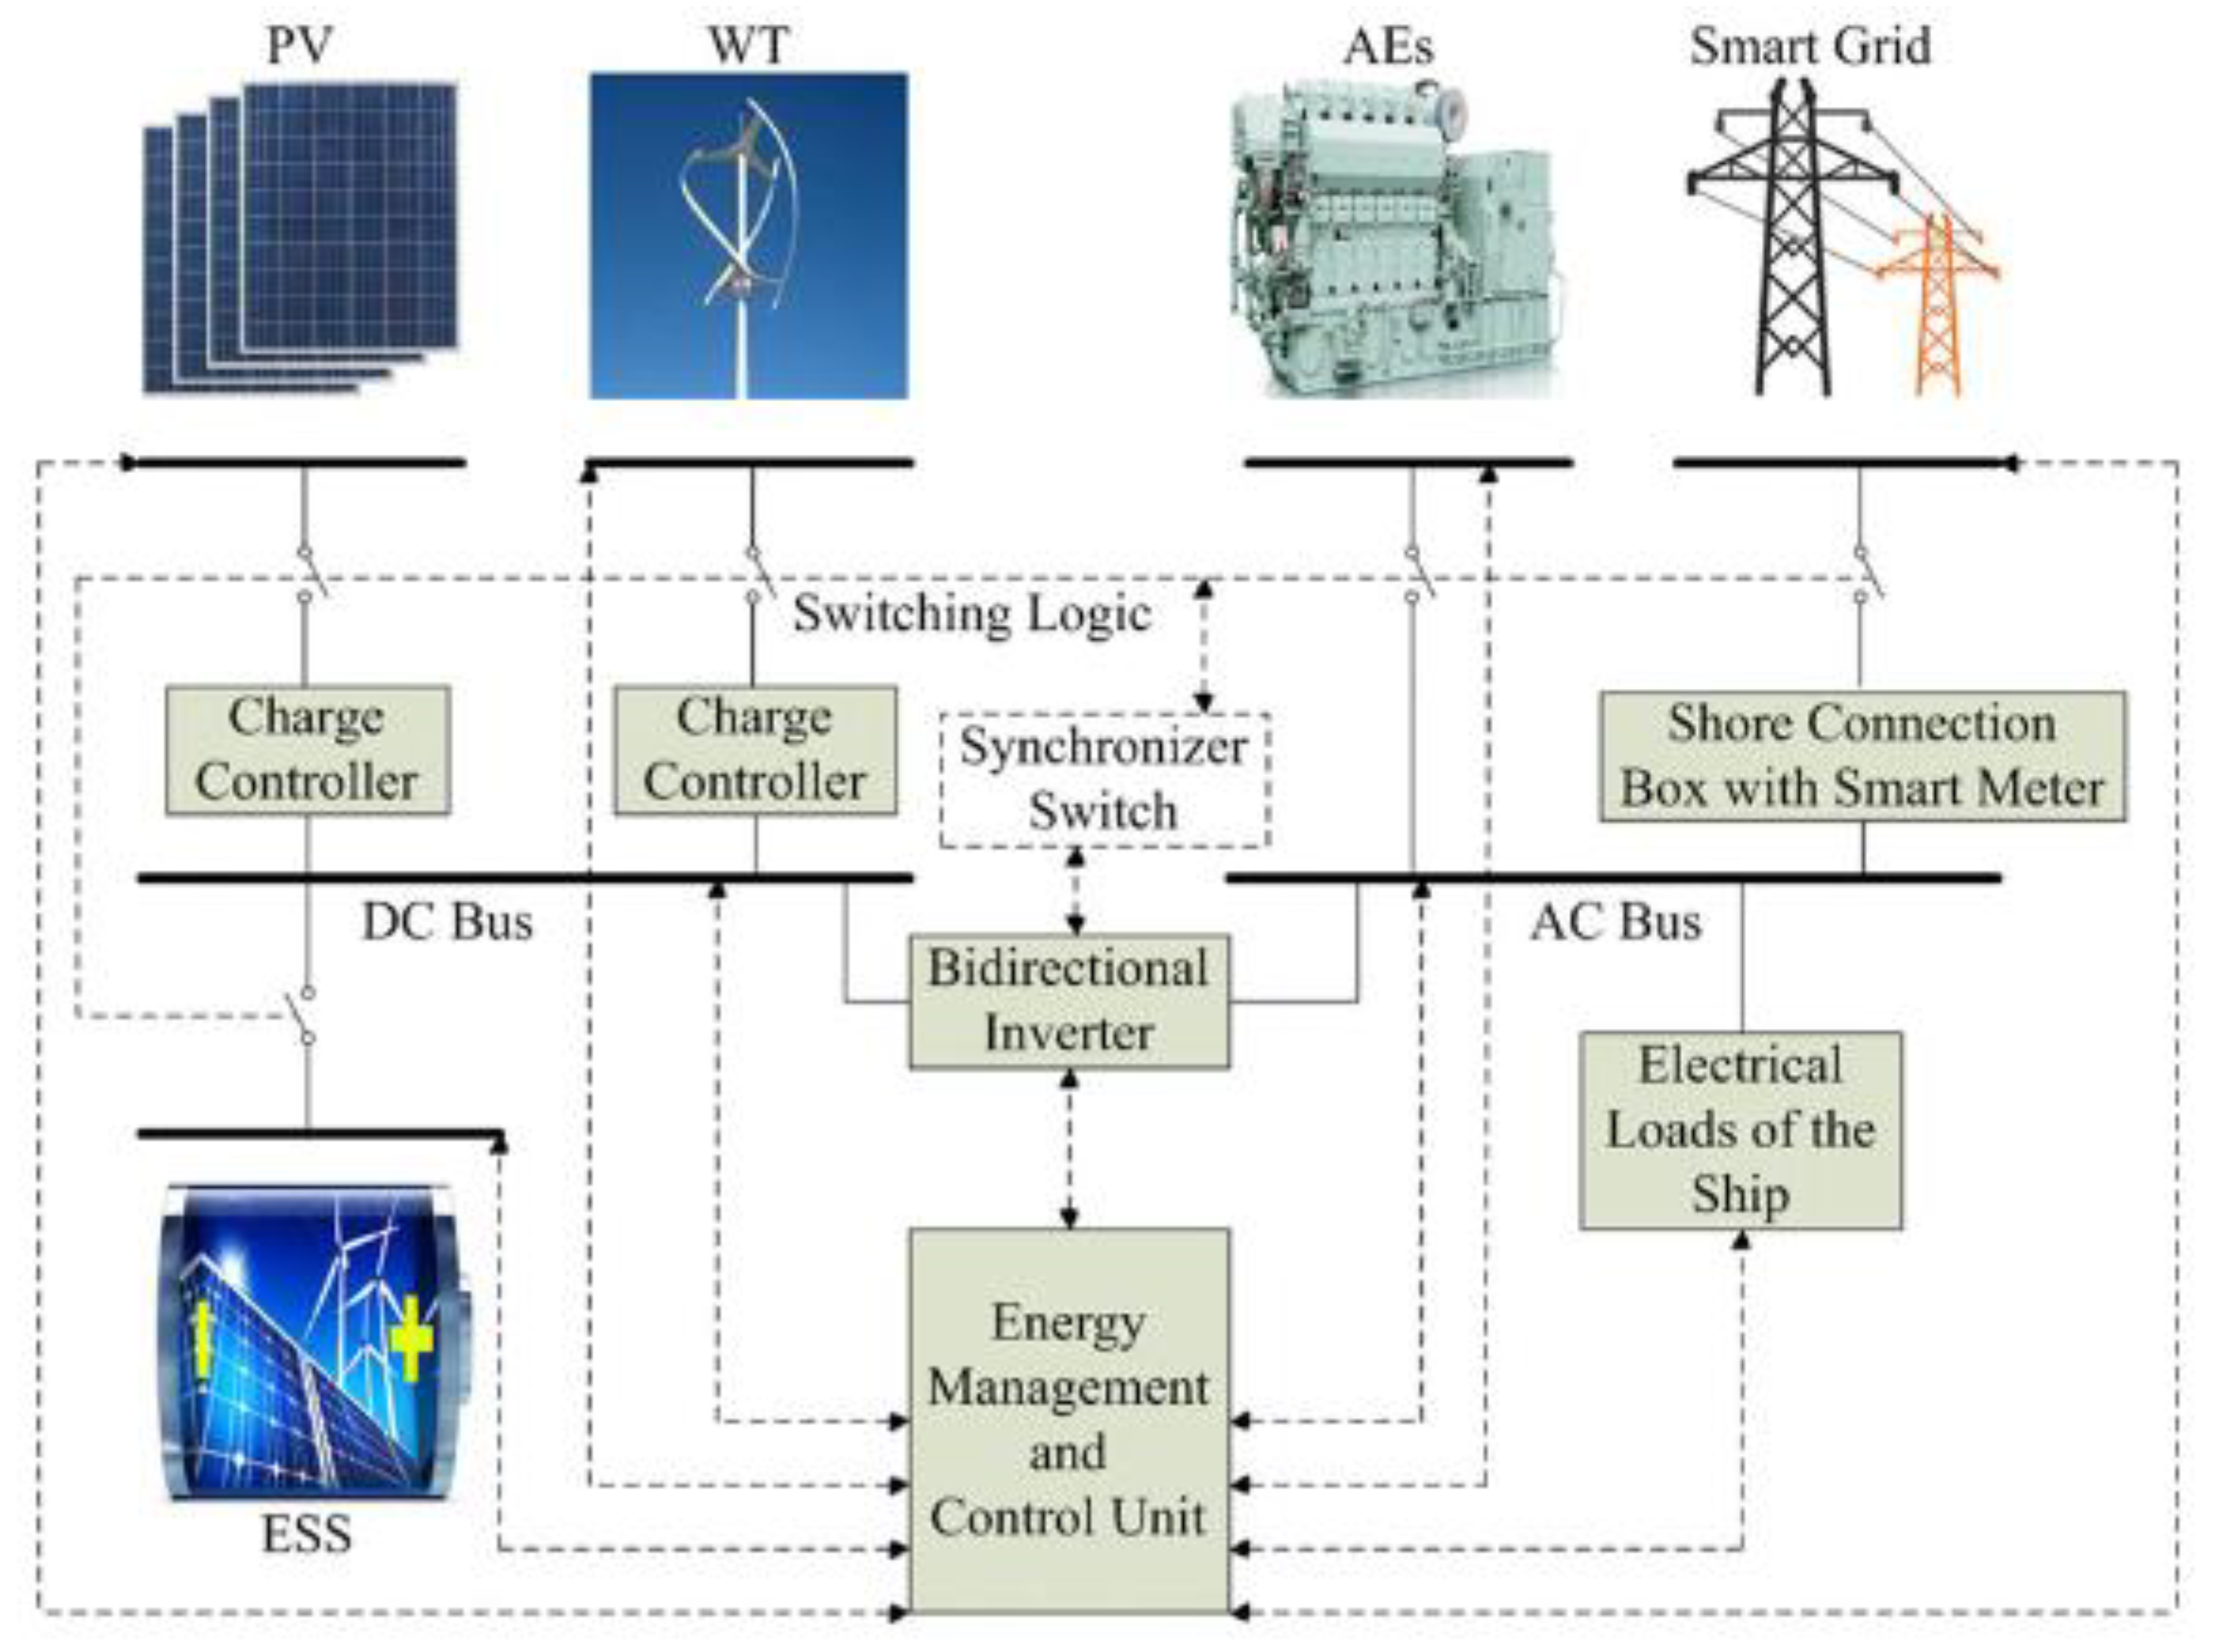
6.6. On-Board Energy Management Systems
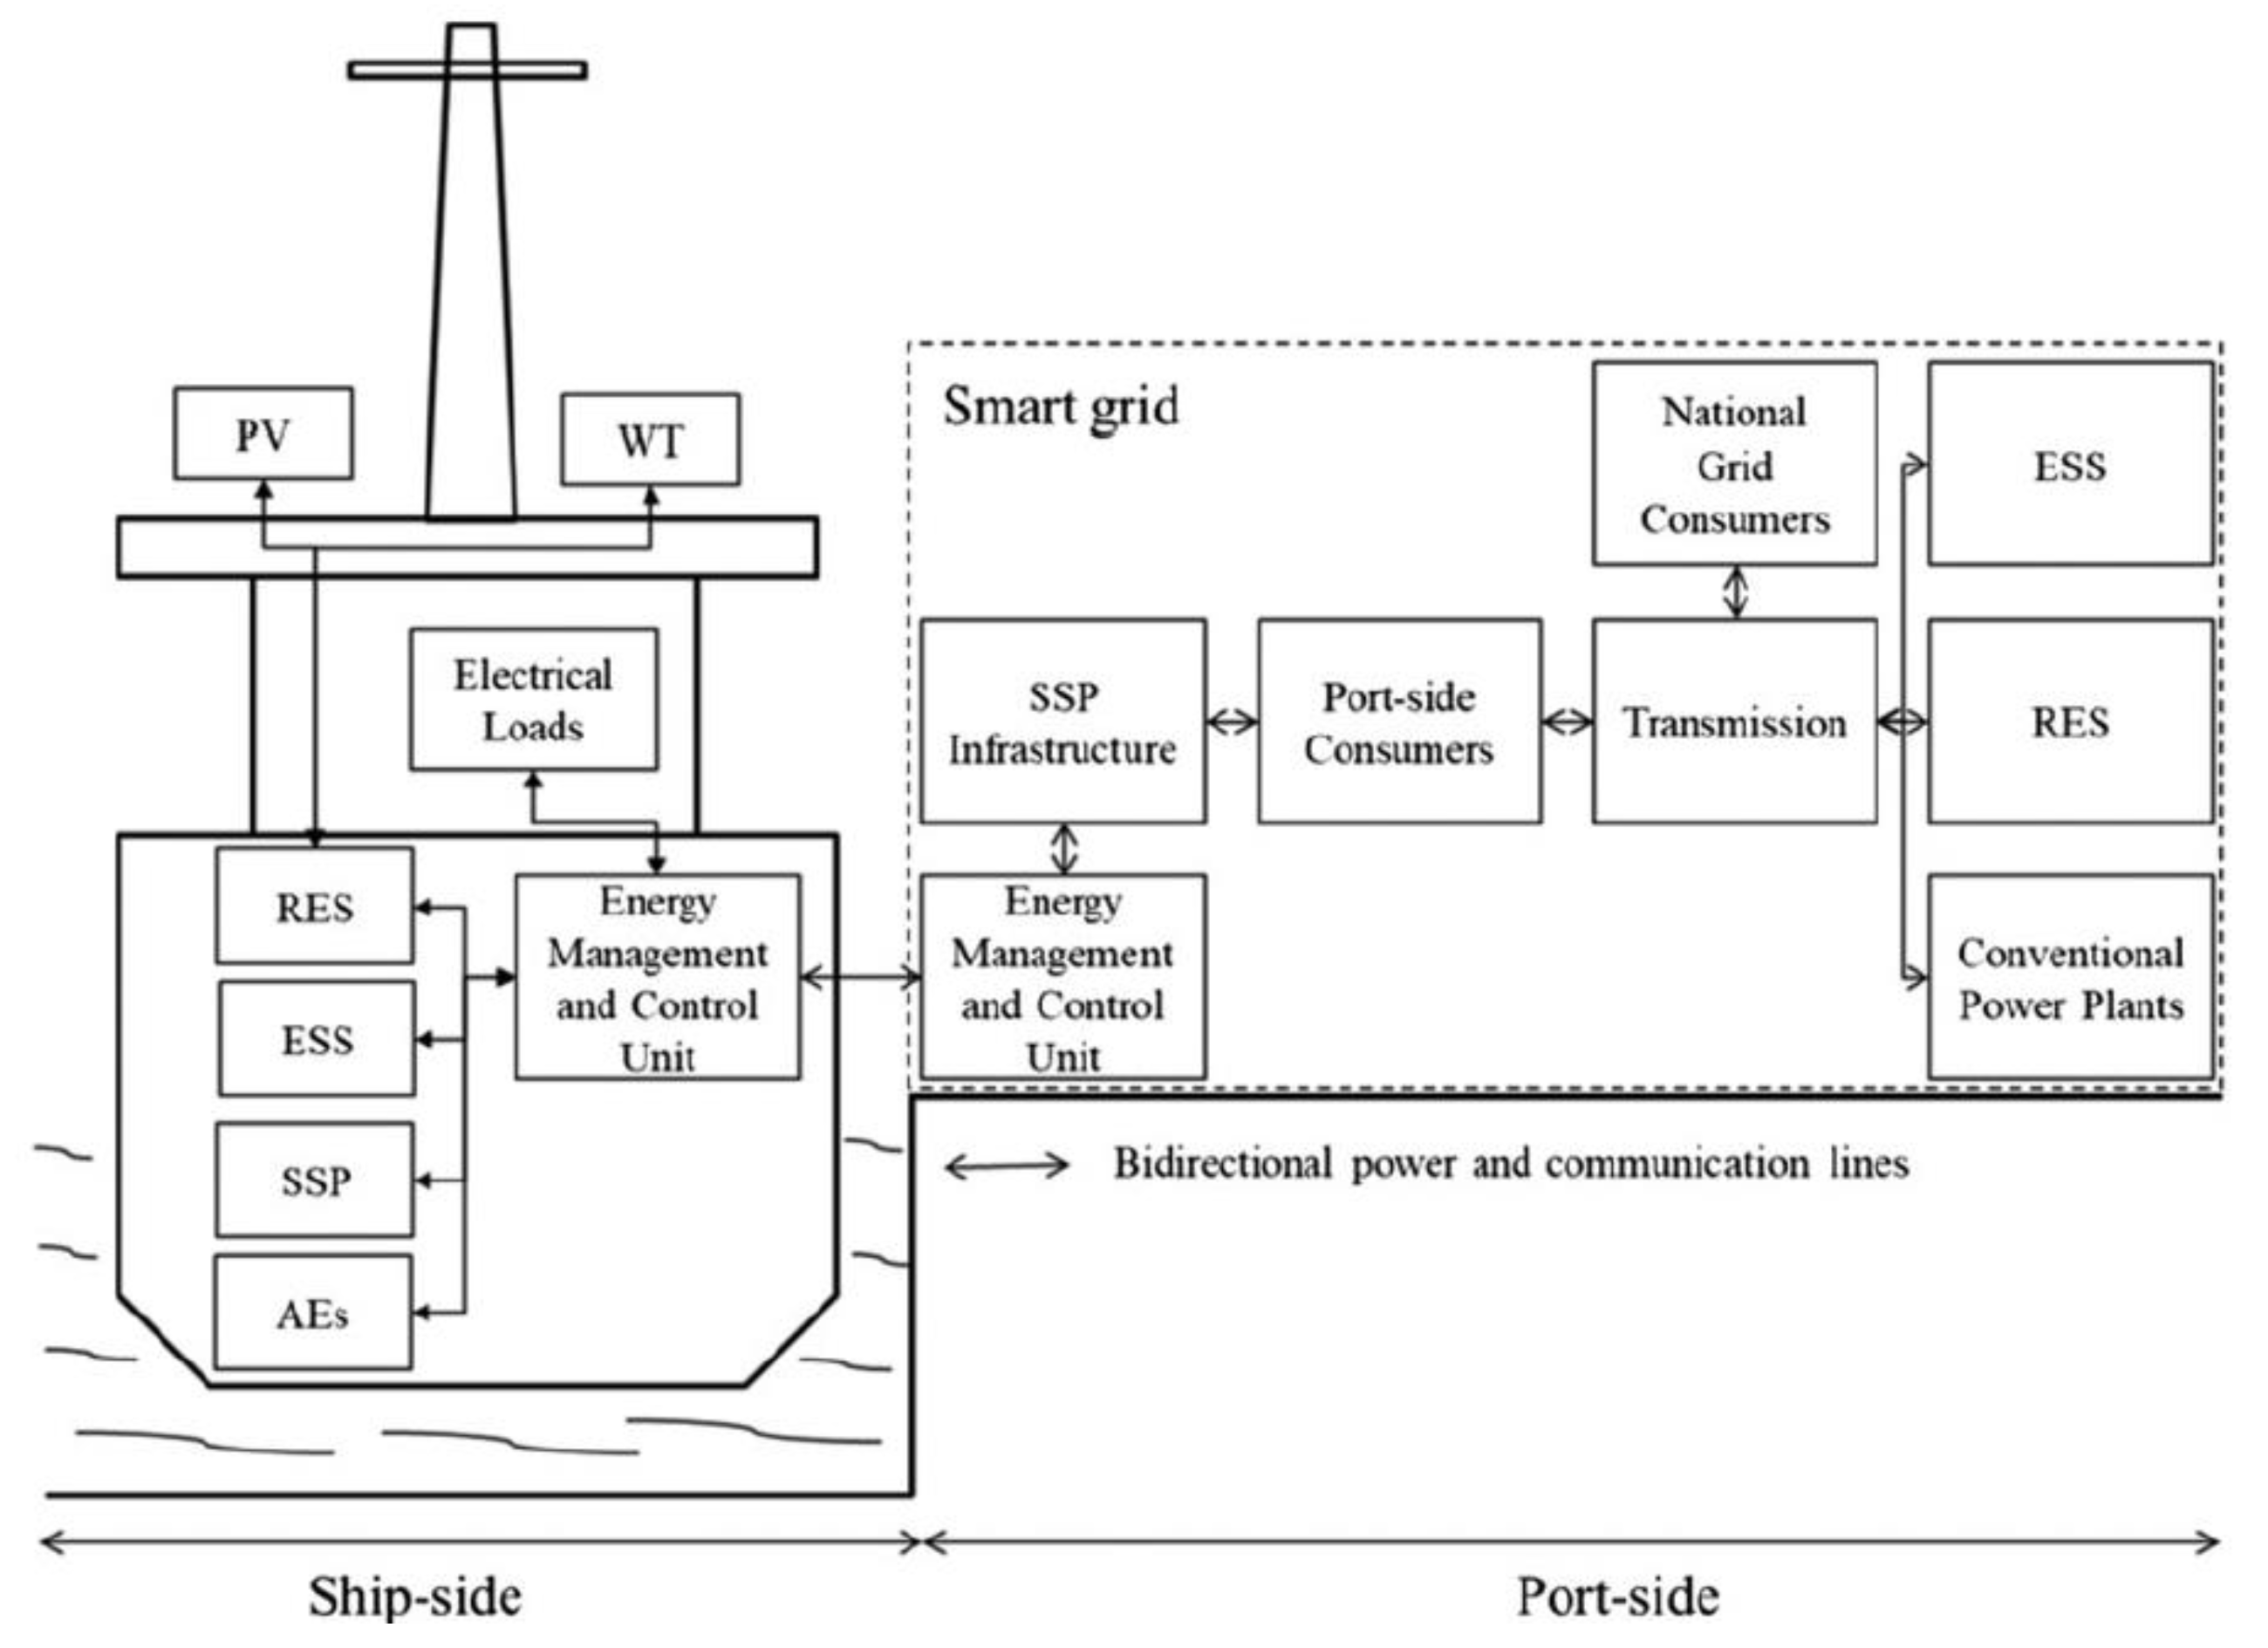
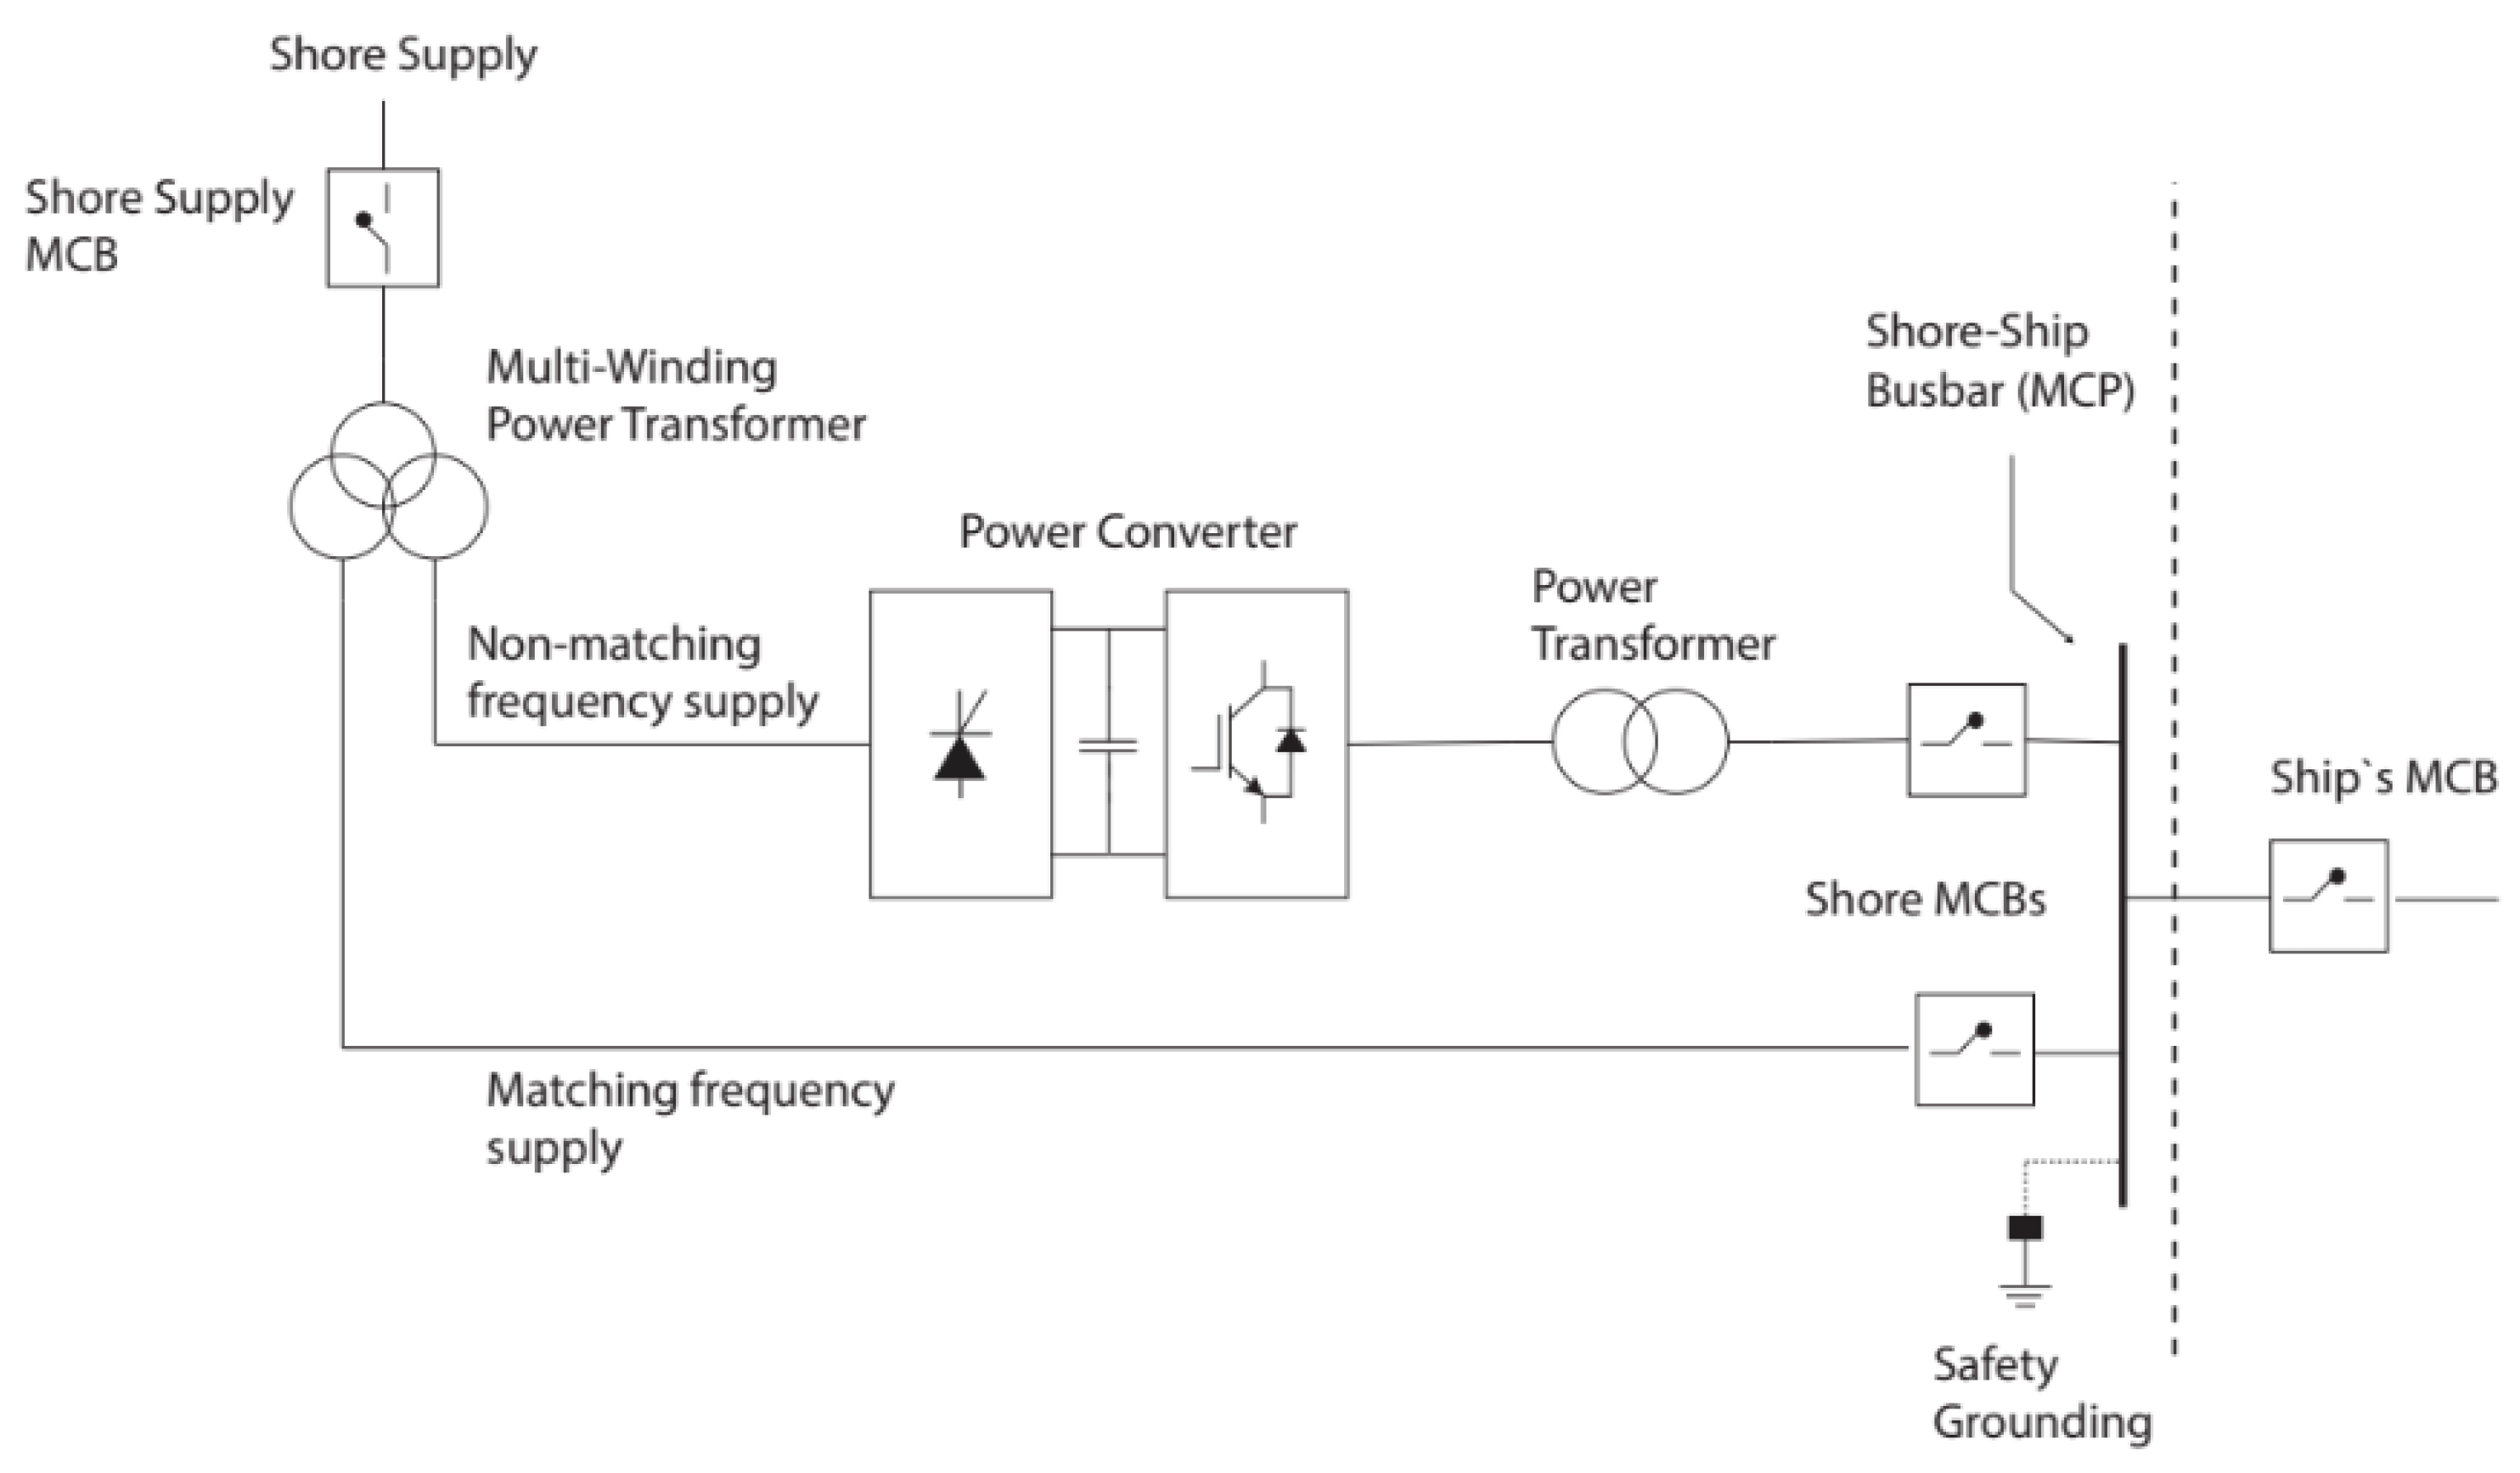
6.7. Smart Grids, Energy Management, and Cold Ironing
- SFOC = Specific Fuel Oil Consumption (g/kWh);
- EL = fractional load (%) of the nominal power EP;
- EP = Nominal Power (kW) of the auxiliary engines (a) and boilers (b);
- = Duration of the ship at berth.
7. Discussion
8. Conclusions
Author Contributions
Funding
Data Availability Statement
Acknowledgments
Conflicts of Interest
References
- Sardain, A.; Sardain, E.; Leung, B. Global Forecasts of Shipping Traffic and Biological Invasions to 2050. Nat. Sustain. 2019, 2, 274–282. [Google Scholar] [CrossRef]
- Pape, M. Decarbonising Maritime Transport: The EU Perspective. Eur. Parliam. Eur. Parliam. Res. Serv. (EPRS) 2020. Available online: https://www.europarl.europa.eu/thinktank/en/document.html?reference=EPRS_BRI(2020)659296 (accessed on 4 August 2021).
- Walsh, C.; Mander, S.; Larkin, A. Charting a Low Carbon Future for Shipping: A UK Perspective. Mar. Policy 2017, 82, 32–40. [Google Scholar] [CrossRef]
- Halim, R.A.; Kirstein, L.; Merk, O.; Martinez, L.M. Decarbonization Pathways for International Maritime Transport: A Model-Based Policy Impact Assessment. Sustainability 2018, 10, 2243. [Google Scholar] [CrossRef] [Green Version]
- Marino, L.; Pratelli, A.; Benenati, S.; Farina, A. A New Platform for the Management of Physical and Documental Flows at Italian and French Ligurian Ports. In Proceedings of the 2019 IEEE International Conference on Environment and Electrical Engineering and 2019 IEEE Industrial and Commercial Power Systems Europe (EEEIC/I&CPS Europe), Genova, Italy, 11–14 June 2019; pp. 1–7. [Google Scholar] [CrossRef]
- Walker, T.; Adebambo, O.; Feijoo, M.; Elhaimer, E.; Hossain, T.; Edwards, S.; Morrison, C.; Romo, J.; Sharma, N.; Taylor, S.; et al. Environmental Effects of Marine Transportation. In World Seas: An Environmental Evaluation, 2nd ed.; Ecological Issues and Environmental Impacts; Elsevier Ltd.: Amsterdam, The Netherlands, 2019; Volume III, Chapter 27; pp. 505–530. [Google Scholar] [CrossRef]
- Chen, J.; Fei, Y.; Wan, Z. The relationship between the development of global maritime fleets and GHG emissions from shipping. J. Environ. Manag. 2019, 242, 31–39. [Google Scholar] [CrossRef]
- ESPO. Environmental Code of Practice; European Sea Ports Organization: Bruxelles, Belgium, 2004; Available online: http://www.espo.be/publications/espo-environmental-code-of-practice (accessed on 6 August 2021).
- Covic Bajramajic, M.; Jelic-Mrcelic, G.; Belamaric, G.; Peric, T. Environmental Protection and Sustainable Ports. In Proceedings of the ICTS–19th International Conference on Transport Science, Portoroz, Slovenia, 17–18 September 2020. [Google Scholar]
- ESPO. Green Guide. In Toward Excellence in Port Environmental Management and Sustainability; ESPO—European Sea Ports Organization: Espo, Finland, 2012; p. 7. Available online: https://www.espo.be/publications/espo-green-guide-towards-excellence-in-port-enviro (accessed on 6 August 2021).
- ESPO. Environmental Report 2020 Eco Ports in Sight; ESPO: Espo, Finland, 2020. [Google Scholar]
- Joung, T.H.; Kang, S.G.; Lee, J.K.; Ahn, J. The IMO Initial Strategy for Reducing Greenhouse Gas (GHG) Emissions, and Its Follow-Up Actions towards 2050. J. Int. Marit. Saf. Environ. Aff. Shipp. 2020, 4, 1–7. [Google Scholar] [CrossRef] [Green Version]
- International Maritime Organization. Fourth IMO Greenhouse Gas Study 2020; International Maritime Organization: London, UK, 2020; Published in 2021 by the International Maritime Organization, 4 Albert Embankment, London (UK) SE1 7SR; Available online: www.imo.org (accessed on 6 August 2021).
- Chircop, A. The IMO Initial Strategy for the Reduction of GHGs from International Shipping; a Commentary. Int. J. Mar. Coast. Law 2020, 34, 482–512. [Google Scholar] [CrossRef]
- Repka, S.; Erkkila-Valimaki, A.; Eiof Jonson, J.; Posch, M.; Torronen, J.; Jalkanen, J.P. Assessing the Costs and Environmental Benefits of IMO Regulations of Ship-Originated SOx and NOx Emissions in the Baltic Sea. Ambio 2021, 50, 1718–1730. [Google Scholar] [CrossRef] [PubMed]
- Nunes, R.A.O.; Alvim-Ferraz, M.C.M.; Martins, F.G.; Sousa, S.I.V. The Activity-Based Methodology to Assess Ship Emissions–A Review. Environ. Pollut. 2017, 231, 87–103. [Google Scholar] [CrossRef] [PubMed]
- Van Fan, Y.; Perry, S.; Klemes, J.J.; Lee, C.T. A Review on Air Emissions Assessment: Transportation. J. Clean. Prod. 2018, 194, 673–684. [Google Scholar] [CrossRef]
- Zelenko, Y.; Zelenko, D.; Neduzha, L. Contemporary Principles for Solving the Problem in Noise Reduction from Railway Rolling Stock. IOP Conf. Ser. Mater. Sci. Eng. 2020, 985, 012015. [Google Scholar] [CrossRef]
- Kweku Darkwah, W.; Odum, B.; Addae, M.; Koomson, D.; Kwakye Danso, B.; Oti-Mensah, E.; Quachie Asenso, T.; Adormaa Buanya, B. Greenhouse Effect: Greenhouse Gases and Their Impact on Global Warming. J. Sci. Res. Rep. 2018, 1–9. [Google Scholar] [CrossRef]
- Gan, J.; Li, L.; Xiang, Q.; Ran, B. A Prediction Method of GHG Emissions for Urban Road Transportation Planning and Its Applications. Sustainability 2020, 12, 10251. [Google Scholar] [CrossRef]
- AlKheder, S. Promoting Public Transport as a Strategy to Reduce GHG Emissions from Private Vehicles in Kuwait. Environ. Chall. 2021, 3, 100075. [Google Scholar] [CrossRef]
- Psaraftis, H.N.; Kontovas, C.A. Decarbonization of Maritime Transport: Is There Light at the End of the Tunnel? Sustainability 2021, 13, 237. [Google Scholar] [CrossRef]
- Liou, J.L.; Wu, P.I. Monetary Health Co-Benefits and GHG Emissions Reduction Benefits: Contribution from Private On-the-Road Transport. Int. J. Environ. Res. Public Health 2021, 18, 5537. [Google Scholar] [CrossRef]
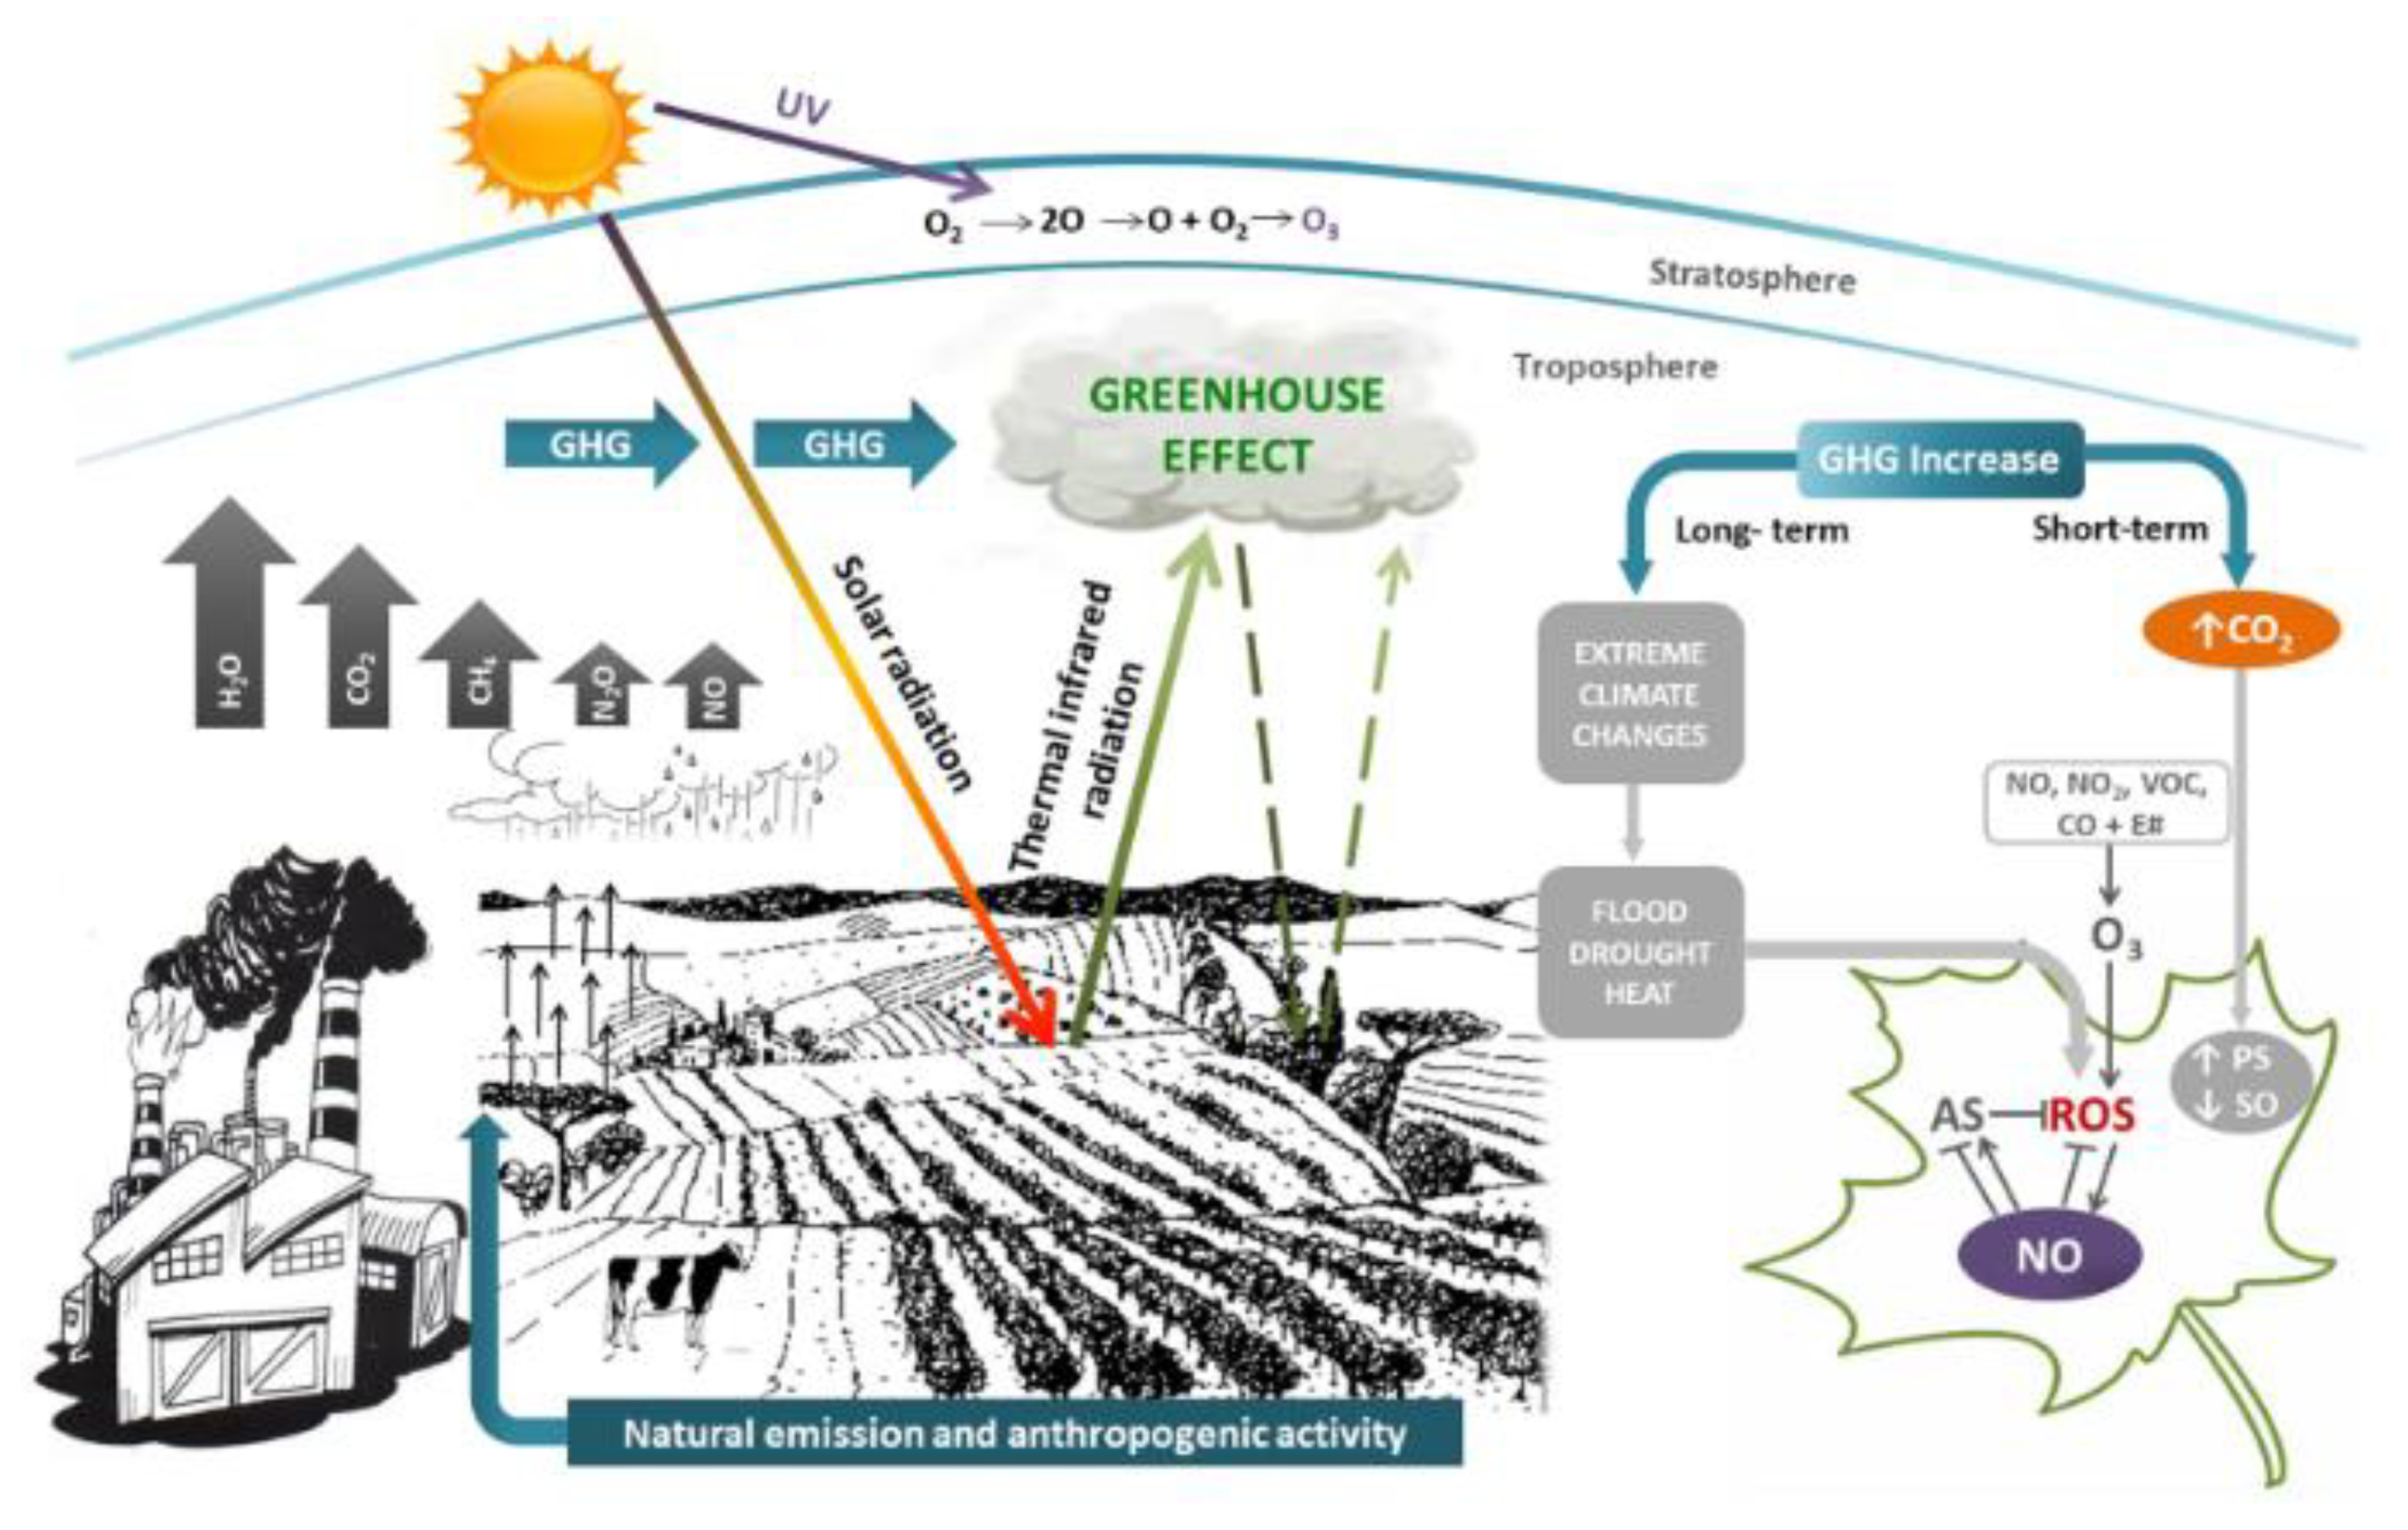
- Cassia, R.; Nocioni, M.; Correa-Aragunde, N.; Lamattina, L. Climate Change and the Impact of Greenhouse Gasses: CO2 and NO, Friends and Foes of Plant Oxidative Stress. Front. Plant Sci. 2018, 9, 273. [Google Scholar] [CrossRef]
- Fridell, E. Chapter 2-Emissions and Fuel Use in the Shipping Sector. Green Ports 2019, 19–33. [Google Scholar] [CrossRef]
- Zis, T.P.V.; Cullinane, K. The Desulphurization of Shipping: Past, Present and the Future under a Global Cap. Transp. Res. Part. D 2020, 82. [Google Scholar] [CrossRef]
- Lou, H.; Hao, Y.; Zhang, W.; Su, P.; Zhang, F.; Chen, Y.; Feng, D.; Li, Y. Emissions of Intermediate Volatility Organic Compounds from a Ship Main Engine Burning Heavy Fuel Oil. J. Environ. Sci. 2019, 84, 197–204. [Google Scholar] [CrossRef] [PubMed]
- Zhu, H.; Wang, H.; Jing, S.; Wang, Y.; Cheng, T.; Tao, S.; Lou, S.; Qiao, L.; Li, L.; Chen, J. Characteristics and Sources of Atmospheric Volatile Organic Compounds (VOCs) Along the Mid-Lower Yangtze River in China. Atmos. Environ. 2018, 190, 232–240. [Google Scholar] [CrossRef]
- Lin, H.; Tao, J.; Qian, Z.M.; Ruan, Z.; Xu, Y.; Hang, J.; Xu, X.; Liu, T.; Guo, Y.; Zeng, W.; et al. Shipping Pollution Emission Associated with Increased Cardiovascular Mortality: A Time Series Study in Guangzhou, China. Environ. Pollut. 2018, 241, 862–868. [Google Scholar] [CrossRef]
- Grennfelt, P.; Engleryd, A.; Forsius, M.; Hov, O.; Rodhe, H.; Cowling, E. Acid Rain and Air Pollution: 50 Years of Progress in Environmental Science and Policy. Ambio 2019, 49, 849–864. [Google Scholar] [CrossRef] [Green Version]
- Lubinski, W. Military Physician; Military Institute of Medicine: Warsaw, Poland, 2017. [Google Scholar]
- Soni, V.; Singh, P.; Shree, V.; Goel, V. Effects of VOCs on Human Health. Air Pollut. Control. 2018, 119–142. [Google Scholar] [CrossRef]
- Kowalska, M.; Skrzypek, M.; Kowalski, M.; Cyrys, J. Effect of NOx and NO2 Concentration Increase in Ambient Air to Daily Bronchitis and Asthma Exacerbation, Silesian Voivodeship in Poland. Int. J. Environ. Res. Public Health 2020, 17, 754. [Google Scholar] [CrossRef] [PubMed] [Green Version]
- Jonson, J.E.; Borken-Kleefeld, J.; Simpson, D.; Nyiri, A.; Posch, M.; Heyes, C. Impact of Excess NOx Emissions from Diesel Cars on Air Quality, Public Health and Eutrophication in Europe. Environ. Res. Lett. 2017, 12, 094017. [Google Scholar] [CrossRef] [Green Version]
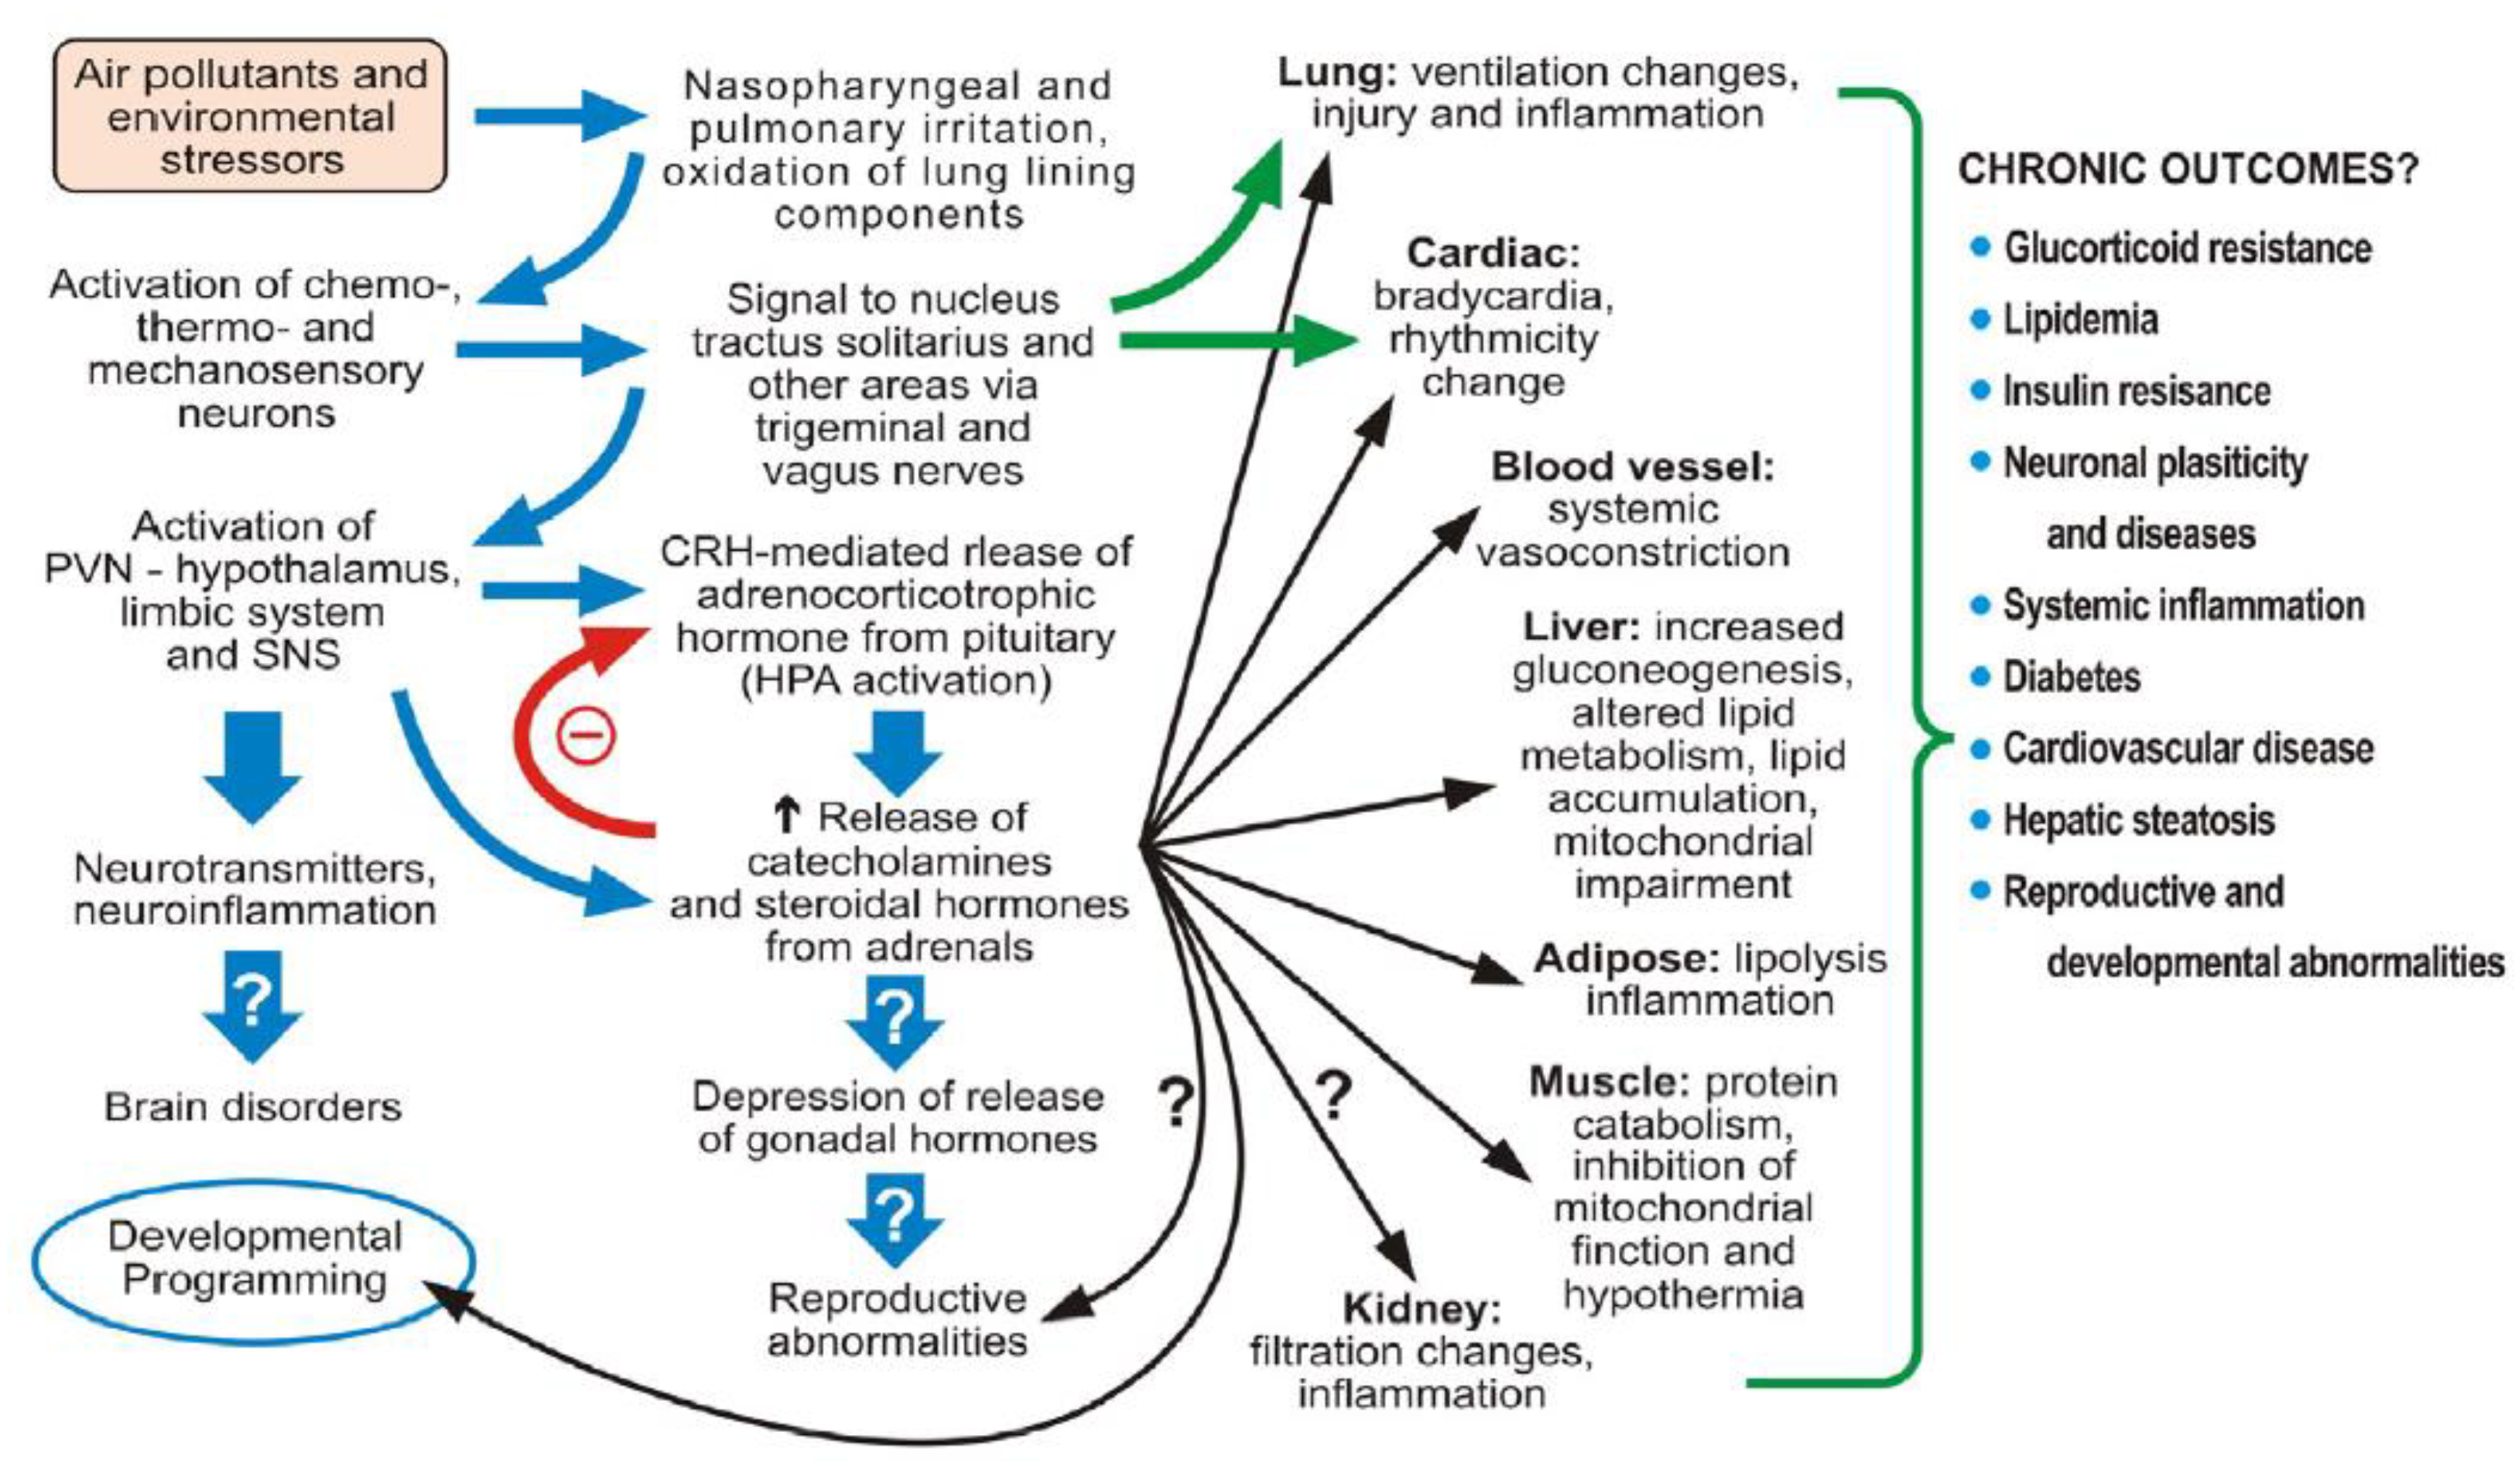
- Kodavanti, U.P. Stretching the stress boundary: Linking air pollution health effects to a neurohormonal stress response. Biochim. Biophys. Acta (BBA) Gen. Sub. 2016, 1860, 2880–2890. [Google Scholar] [CrossRef] [PubMed]
- Woo, J.K.; Moon, D.S.H.; Siu Lee Ham, J. The Impact of Environmental Policy on Ports and the Associated Economic Opportunities. Transp. Res. Part. A Policy Pract. 2018, 110, 234–242. [Google Scholar] [CrossRef]
- Zanne, M.; Twrdy, E. The Economic Analysis of Air Pollution Mitigation Measures in Smaller Ports. RFDS 2021, 33, 145–152. [Google Scholar] [CrossRef]
- Ksiazkiewicz, D. Clean Air Policy in European Marine Ports. Sci. Pap. Sil. Univ. Technol. 2020, 149, 371–381. [Google Scholar] [CrossRef]
- Zhu, S.; Sun, J.; Liu, Y.; Lu, M.; Liu, X. The Air Quality Index Trend Forecasting based on Improved Error Correction Model and Data Preprocessing for 17 Port Cities in China. Chemosphere 2020, 252. [Google Scholar] [CrossRef]
- Gobbi, G.P.; Di Liberto, L.; Barnaba, F. Impact of Port Emissions on EU-regulated and Non-regulated Air Quality Indicators: The Case of Civitavecchia (Italy). Sci. Total. Environ. 2020, 719. [Google Scholar] [CrossRef] [PubMed]
- Toscano, D.; Murena, F. Atmospheric Emissions in Ports: A Review. Correlation with Data of Ship Traffic. Atmos. Environ. X 2019, 4. [Google Scholar] [CrossRef]
- Shen, L.; Wang, Y.; Liu, K.; Yang, Z.; Shi, X.; Yang, X.; Jing, K. Synergistic Path Planning of Multi-UAVs for Air Pollution Detection of Ships in Ports. Transp. Res. Part. E 2020, 144. [Google Scholar] [CrossRef]
- Karakikes, I.; Hofmann, W.; Mitropoulos, M.; Savrasovs, M. Evaluation of Freight Measures by Integrating Simulation Tools: The Case of Volos Port, Greece. Transport Telecommun. J. 2018, 19, 224–232. [Google Scholar] [CrossRef] [Green Version]
- Gonzalez-Aregall, M.; Bergqvist, R. Green Port Initiatives for a More Sustainable Port-City Interaction: The Case Study of Barcelona. Marit. Transp. Reg. Sustain. 2020, 7, 109–132. [Google Scholar] [CrossRef]
- Merico, E.; Dinoi, A.; Contini, D. Development of an Integrated Modelling-Measurement System for Near-Real-Time Estimates of Harbor Activity Impact to the Atmospheric Pollution in Coastal Cities. Transp. Res. Part. D 2019, 73, 108–119. [Google Scholar] [CrossRef]
- Progiou, A.G.; Bakeas, E.; Evangelidou, E.; Kontogiorgi, G.; Lagkadinou, E.; Sebos, I. Air Pollutant Emissions from Piraeus port: External Costs and Air Quality Levels. Transp. Res. Part. D Transport Environ. 2021, 91. [Google Scholar] [CrossRef]
- EMEP/EEA Air Pollutant Emission Inventory Guidebook 2019; EEA (European Environment Agency), Publications Office of the European Union: Luxembourg, 2019.
- Handbook on External Costs of Transport—European Commission. Directorate-General for Mobility and Transport 2019; Publications Office of the European Union: Luxemburg, 2019. [Google Scholar] [CrossRef]
- Martinez-Moya, J.; Vazquez-Paja, B.; Jimenez Maldonado, J.A. Energy Efficiency and CO2 Emissions of Port Container Terminal Equipment: Evidence from the Port of Valencia. Energy Policy 2019, 131, 312–319. [Google Scholar] [CrossRef]
- Bordianu, A.; Samoilescu, G. Electric and Hybrid Propulsion in the Naval Industry. In Proceedings of the 2019 11th International Symposyum on Advanced Topics in Electrical Engineering (ATEE), Bucharest, Romania, 28–30 March 2019. [Google Scholar] [CrossRef]
- Elgohary, M.M.; Seediek, I.S.; Al-Baity, O. Design Consideration and Eco-Environmental Assessment for Electric Propulsion Ships: Case Study–Cruise ship. In Proceedings of the IEK 27th International Annual Conference, Mombasa, Kenya, 24–27 November 2020. [Google Scholar]
- Sui, C.; De Vos, P.; Stapersma, D.; Visser, K.; Ding, Y. Fuel Consumption and Emissions of Ocean-Going Cargo Ship with Hybrid Propulsion and Different Fuels over Voyage. J. Mar. Sci. Eng. 2020, 8, 588. [Google Scholar] [CrossRef]
- Geertsma, R.D.; Negenborn, N.N.; Visser, K.; Hopman, J.J. Design and Control of Hybrid Power and Propulsion Systems for Smart Ships: A Review of Developments. Appl. Energy 2017, 194, 30–54. [Google Scholar] [CrossRef]
- IRENA. Navigating to a Renewable Future: Solutions for Decarbonizing Shipping; Preliminary Findings; International Renewable Energy: Abu Dhabi, United Arab Emirates, 2019. [Google Scholar]
- Byeong-Yong, Y. Economic Assessment of Liquefied Natural Gas (LNG) as a Marine Fuel for CO2 Carriers Compared to Marine Gas Oil (MGO). Energy 2017, 121, 772–780. [Google Scholar] [CrossRef]
- Pfoser, S.; Schauer, O.; Costa, Y. Acceptance of LNG as an Alternative Fuel: Determinants and Policy Implications. Energy Policy 2018, 120, 259–267. [Google Scholar] [CrossRef]
- Iannacone, T.; Landucci, G.; Tugnoli, A.; Salzano, E.; Cozzani, V. Sustainability of Cruise Ship Fuel Systems: Comparison among LNG and Diesel Technologies. J. Clean. Prod. 2020, 260, 121069. [Google Scholar] [CrossRef]
- Pavlenko, N.; Comer, B.; Zhou, Y.; Clark, N.; Rutherford, D. The Climate Implications of Using LNG as a Marine Fuel–2020 International Council on Clean Transportation (ICCT), Working Paper 2020-02; ICCT Online Publication: Berlin, Germany, 2020. [Google Scholar]
- United Nations Framework Convention on Climate Change (UNFCCC). Shipping, World Trade and the Reduction of CO2 Emissions. International Chamber of Shipping (ICS), London EC3A 8BH (UK). 2014. Available online: https://www.sciencedirect.com/science/article/pii/S258900422030955X (accessed on 6 August 2021).
- Viana, M.; Rizza, V.; Tobias, A.; Carr, E.; Corbett, J.; Sofiev, M.; Karanasiou, A.; Buonanno, G.; Fann, N. Estimated Health Impacts from Maritime Transport in the Mediterranean Region and Benefits from The Use of Cleaner Fuels. Environ. Int. 2020, 138. [Google Scholar] [CrossRef] [PubMed]
- Mukherjee, A.; Bruijnincx, P.; Junginger, M. A Perspective on Biofuels Use and CCS for GHG Mitigation in the Marine Sector. iScience 2020, 23. [Google Scholar] [CrossRef] [PubMed]
- Sonthalia, A.; Kumar, N. Hydroprocessed Vegetable Oil as a Fuel for Transportation Sector: A Review. J. Energy Inst. 2019, 92, 1–17. [Google Scholar] [CrossRef]
- Sunnu, A.K.; Ayetor, G.K.; Gaye, J.M. Straight Vegetable Oil Fuel Performance and Exhaust Emissions under Turbocharged and Naturally Aspirated Conditions. Energy Sources Part. A Recovery Util. Environ. Eff. 2019. [Google Scholar] [CrossRef]
- Mat, S.C.; Idroas, M.Y.; Hamid, M.F.; Zainal, Z.A. Performance and Emissions of Straight Vegetable Oils and Its Blends as a Fuel in Diesel Engine: A Review. Renew. Sustain. Energy Rev. 2018, 82, 808–823. [Google Scholar] [CrossRef]
- Dimitriadis, A.; Natsios, I.; Dimaratos, A.; Katsaounis, D.; Samaras, Z.; Bezergianni, S.; Lehto, K. Evaluation of a Hydrotreated Vegetable Oil (HVO) and Effects on Emissions of a Passenger Car Diesel Engine. Front. Mech. Eng. 2018. [Google Scholar] [CrossRef] [Green Version]
- Rimkus, A.; Zaglinskis, J.; Stravinskas, S.; Rapalis, P.; Matijosius, J.; Berezky, A. Research on the Combustion, Energy and Emission Parameters of Various Concentration Blends of Hydrotreated Vegetable Oil Biofuel and Diesel Fuel in a Compression-Ignition Engine. Energies 2019, 12, 2978. [Google Scholar] [CrossRef] [Green Version]
- Shi, J.; Wang, T.; Zhao, Z.; Wu, Z.; Zhang, Z. Cycle to Cycle Variatioon of a Diesel Engine Fueled with Fischer-Tropsch Fuel Synthesized from Coal. Appl. Sci. 2019, 9, 2032. [Google Scholar] [CrossRef] [Green Version]
- Zang, G.; Sun, P.; Elgowainy, A.A.; Bafana, A.; Wang, M. Performance and Cost Analysis of Liquid Fuel Production from H2 and CO2 based on The Fischer-Tropsch Process. J. CO2 Util. 2021, 46, 101459. [Google Scholar] [CrossRef]
- Mohanty, S.K.; Swain, M. Chapter 3–Bioethanol Production from Corn and Wheat: Food, Fuel, and Future. Bioethanol. Prod. Food Crop. 2019, 45–99. [Google Scholar] [CrossRef]
- Jiao, J.; Li, J.; Bai, Y. Ethanol as a Vehicle Fuel in China: A Review from the Perspectives of Raw Material Resource, Vehicle, and Infrastructure. J. Clean. Prod. 2018, 180, 832–845. [Google Scholar] [CrossRef]
- Paulauskiene, T.; Bucas, M.; Laukinaite, A. Alternative Fuels for Marine Applications: Biomethanol-Biodiesel-Diesel Blends. Fuel 2019, 248, 161–167. [Google Scholar] [CrossRef]
- Wang, Z.; Paulauskiene, T.; Uebe, J.; Bucas, M. Characterization of Biomethanol-Biodiesel-Diesel Blends as Alternative Fuel for Marine Applications. J. Mar. Sci. Eng. 2020, 8, 730. [Google Scholar] [CrossRef]
- Chen, H.; He, J.; Chen, Z.; Geng, L. A Comparative Study of Combustion and Emission Characteristics of Dual-Fuel Engine Fueled with Diesel/Methanol and Diesel-Polyoxymethylene Dimethyl Ether Blend/Methanol. Process. Saf. Environ. Prot. 2021, 147, 714–722. [Google Scholar] [CrossRef]
- Lin, Q.; Tay, K.L.; Yu, W.; Zong, Y.; Yang, W.; Rivellini, L.H.; Ma, M.; King Yin Lee, A. Polyoxymethylene Dimethyl Ether 3 (PODE3) as an Alternative Fuel to Reduce Aerosol Pollution. J. Clean. Prod. 2021, 285, 124857. [Google Scholar] [CrossRef]
- Oumer, A.N.; Hasan, M.M.; Baheta, A.T.; Mamat, R.; Abdullah, A.A. Bio-based Liquid Fuels as a Source of Renewable Energy: A Review. Renew. Sustain. Energy Rev. 2018, 88, 82–98. [Google Scholar] [CrossRef]
- Kesieme, U.; Pazouki, K.; Murphy, A.; Chrysanthou, A. Biofuel as an Alternative Shipping Fuel: Technological, Environmental and Economic Assessment. Sustain. Energy Fuels 2019. [Google Scholar] [CrossRef] [Green Version]
- Maggioni, L. Bio-LNG on its way forward: Case Italy. In Proceedings of the European Biomethane Conference, Berlin, Germany, 2007; Available online: https://onlinelibrary.wiley.com/doi/abs/10.1002/adma.201805173 (accessed on 6 August 2021).
- Shanmugam, K.; Tysklind, M.; Upadhyayula, V.K.K. Use of Liquefied Biomethane (LBM) as a Vehicle Fuel for Road Freight Transportation: A Case Study Evaluating Environmental Performance of Using LBM for Operation of Tractor Trailers. Procedia CIRP 2018, 69, 517–522. [Google Scholar] [CrossRef]
- Feng, J.; Xu, B. Electrochemical Ammonia Synthesis and Ammonia Fuel Cells. Adv. Mater. 2018, 1805173. [Google Scholar] [CrossRef]
- Yapicioglu, A.; Dincer, I. A Review on Clean Ammonia as a Potential Fuel for Power Generators. Renew. Sustain. Energy Rev. 2019, 103, 96–108. [Google Scholar] [CrossRef]
- Bicer, Y.; Dincer, I. Environmental Impact Categories of Hydrogen and Ammonia Driven Transoceanic Vehicles: A Comparative Evaluation. Int. J. Hydrog. Energy 2018, 43, 4583–4596. [Google Scholar] [CrossRef]
- Manoharan, Y.; Hosseini, S.E.; Butler, B.; Alzhahrani, H.; Senior, B.T.F.; Ashuri, T.; Krohn, J. Hydrogen Fuel Cell Vehicles; Current Status and Future Prospect. Appl. Sci. 2019, 9, 2296. [Google Scholar] [CrossRef] [Green Version]
- Tanc, B.; Arat, H.T.; Baltacioglu, E.; Aydin, K. Overview of the Next Quarter Century Vision of Hydrogen Fuel Cell Electric Vehicles. Int. J. Hydrog. Energy 2019, 44, 10120–10128. [Google Scholar] [CrossRef]
- Awoyomi, A.; Patchigolla, K.; Anthony, E.J. CO2/SO2 Emission Reduction in CO2 Shipping Infrastructure. Int. J. Greenh. Gas. Control. 2019, 88, 57–70. [Google Scholar] [CrossRef]
- Awoyomi, A.; Patchigolla, K.; Anthony, E.J. Process and Economic Evaluation of an Onboard Capture System for LNG-Fueled CO2 Carriers. Ind. Eng. Chem. Res. 2020, 59, 6951–6960. [Google Scholar] [CrossRef]
- Feenstra, M.; Monteiro, J.; Van Den Akker, J.T.; Abu-Zahra, M.R.M.; Gilling, E.; Goetheer, E. Ship-based Carbon Capture Onboard of Diesel or LNG-fueled Ships. Int. J. Greenh. Gas. Control. 2019, 85, 1–10. [Google Scholar] [CrossRef]
- Lehtoranta, K.; Aakko-Saksa, P.; Murtonen, T.; Vesala, H.; Ntziachristos, L.; Ronkko, T.; Karjalainen, P.; Kuittinen, N.; Timonen, H. Particulate Mass and Nonvolatile Particle Number Emissions from Marine Engines Using Low-Sulfur Fuels, Natural Gas, or Scrubbers. Environ. Sci. Technol. 2019, 53, 3315–3322. [Google Scholar] [CrossRef] [PubMed]
- Comer, B.; Georgeff, E.; Osipova, L. Air Emissions and Water Pollution Discharges from Ships with Scrubbers. ICCT (International Council on Clean Transportation) Consulting Report; ICCT Online Publication: Berlin, Germany, 2020. [Google Scholar]
- Bolbot, V.; Theotokatos, G.; Boulougouris, E.; Psarros, G.; Hamann, R. A Novel Method for Safety Analysis of Cyber-Physical Systems–Application to a Ship Exhaust Gas Scrubber System. Safety 2020, 6, 26. [Google Scholar] [CrossRef]
- Misra, A.; Venkataramani, G.; Gowrishankar, S.; Ayyasam, E.; Ramalingam, V. Renewable Energy Based Smart Microgrids–A Pathway to Green Port Development. Strateg. Plan. Energy Environ. 2017, 37, 17–32. [Google Scholar] [CrossRef]
- Rezaei, M.; Mostafaeipour, A.; Qolipour, M.; Arabnia, H.R. Hydrogen Production using Wind Energy from Sea Water: A Case Study on Southern and Northern Coasts of Iran. Energy Environ. 2018, 29, 333–357. [Google Scholar] [CrossRef]
- Sadek, I.; Elgohary, M. Assessment of Renewable Energy Supply for Green Ports with a Case Study. Environ. Sci. Pollut. Res. 2020, 27, 5547–5558. [Google Scholar] [CrossRef] [PubMed]
- Seddiek, I.S. Application of Renewable Energy Technologies for Eco-Friendly Sea Ports. Ships Offshore Struct. 2019, 15, 953–962. [Google Scholar] [CrossRef]
- Fossile, D.K.; Frej, E.A.; Gouvea da Costa, S.; Pinheiro de Lima, E.; Teixeira de Almeida, A. Selecting the Most Viable Renewable Energy Source for Brazilian Ports using the FITradeoff Method. J. Clean. Prod. 2020, 260, 121107. [Google Scholar] [CrossRef]
- Hentschel, M.; Ketter, W.; Collins, J. Renewable Energy Cooperatives: Facilitating the Energy Transition at the Port of Rotterdam. Energy Policy 2018, 121, 61–69. [Google Scholar] [CrossRef]
- Balcombe, P.; Brierley, J.; Lewis, C.; Skatvedt, L.; Speirs, J.; Hawkes, A.; Staffell, I. How to decarbonize international shipping: Options for fuels, technologies and policies. En. Con. Man. 2019, 182, 72–88. [Google Scholar] [CrossRef]
- Banaei, M.; Boudjadar, J.; Khooban, M.H. Stochastic Model Predictive Energy Management in Hybrid Emission-Free Modern Maritime Vessels. IEEE Trans. Ind. Inform. 2021, 17, 5430–5440. [Google Scholar] [CrossRef]
- Yuan, Y.; Zhang, T.; Shen, B.; Yan, X.; Long, T. A Fuzzy Logic Energy Management Strategy for a Photovoltaic/Diesel/Battery Hybrid Ship Based on Experimental Database. Energies 2018, 11, 2211. [Google Scholar] [CrossRef] [Green Version]
- Zhang, Z.; Guan, C.; Liu, Z. Real-Time Optimization Energy Management Strategy for Fuel Cell Hybrid Ships Considering Power Sources Degradation. IEEE Access 2020, 8, 87046–87059. [Google Scholar] [CrossRef]
- Cetin, O.; Ziya Sogut, M. A New Strategic Approach of Energy Management Onboard Ships Supported by Exergy and Economic Criteria: A Case Study of a Cargo Ship. Ocean. Eng. 2019, 219, 108137. [Google Scholar] [CrossRef]
- Baldi, F.; Marechal, F.; Tammi, K. Process Integration as a Tool for the Improvement of Cruise Ships Energy Efficiency. In Proceedings of the Conference: Shipping in Changing Climates, London, UK, 2017; Available online: https://onlinelibrary.wiley.com/doi/abs/10.1002/er.4062 (accessed on 6 August 2021).
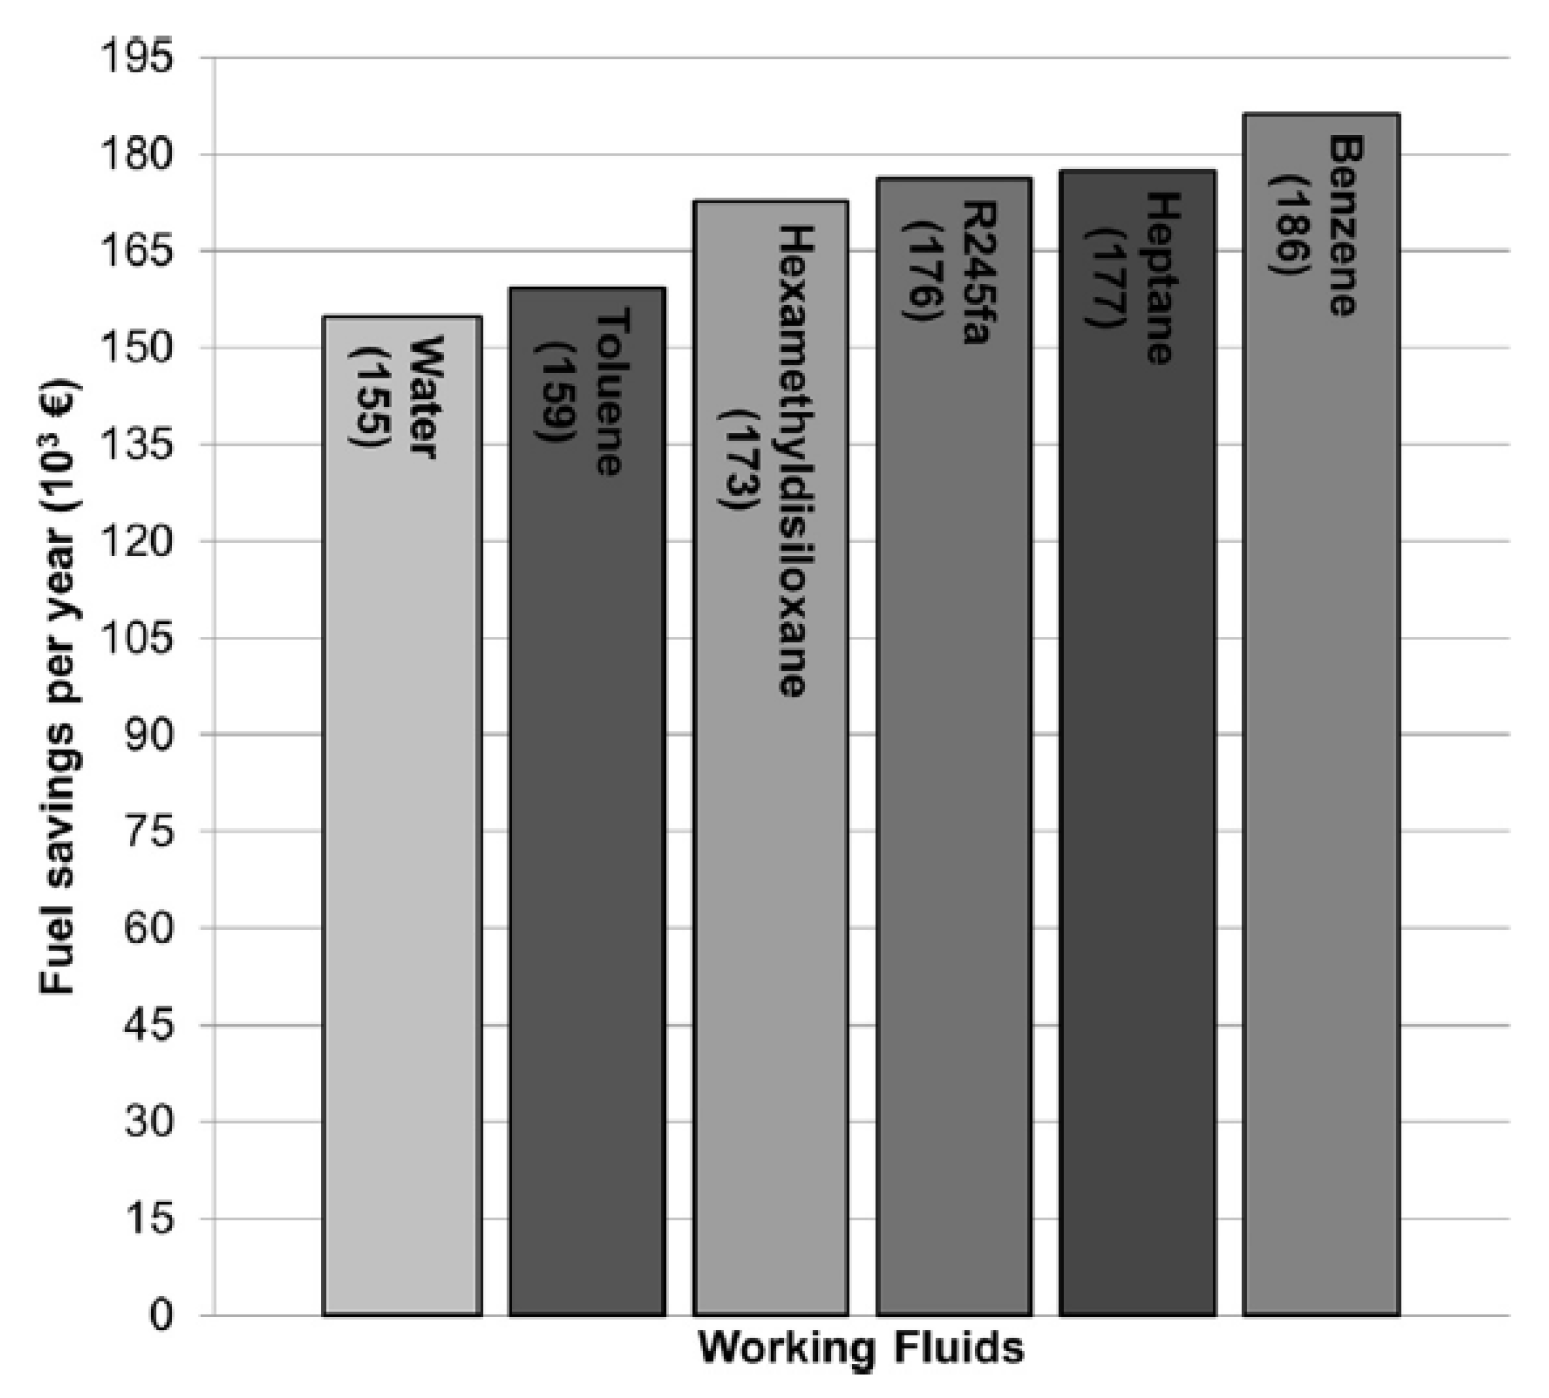
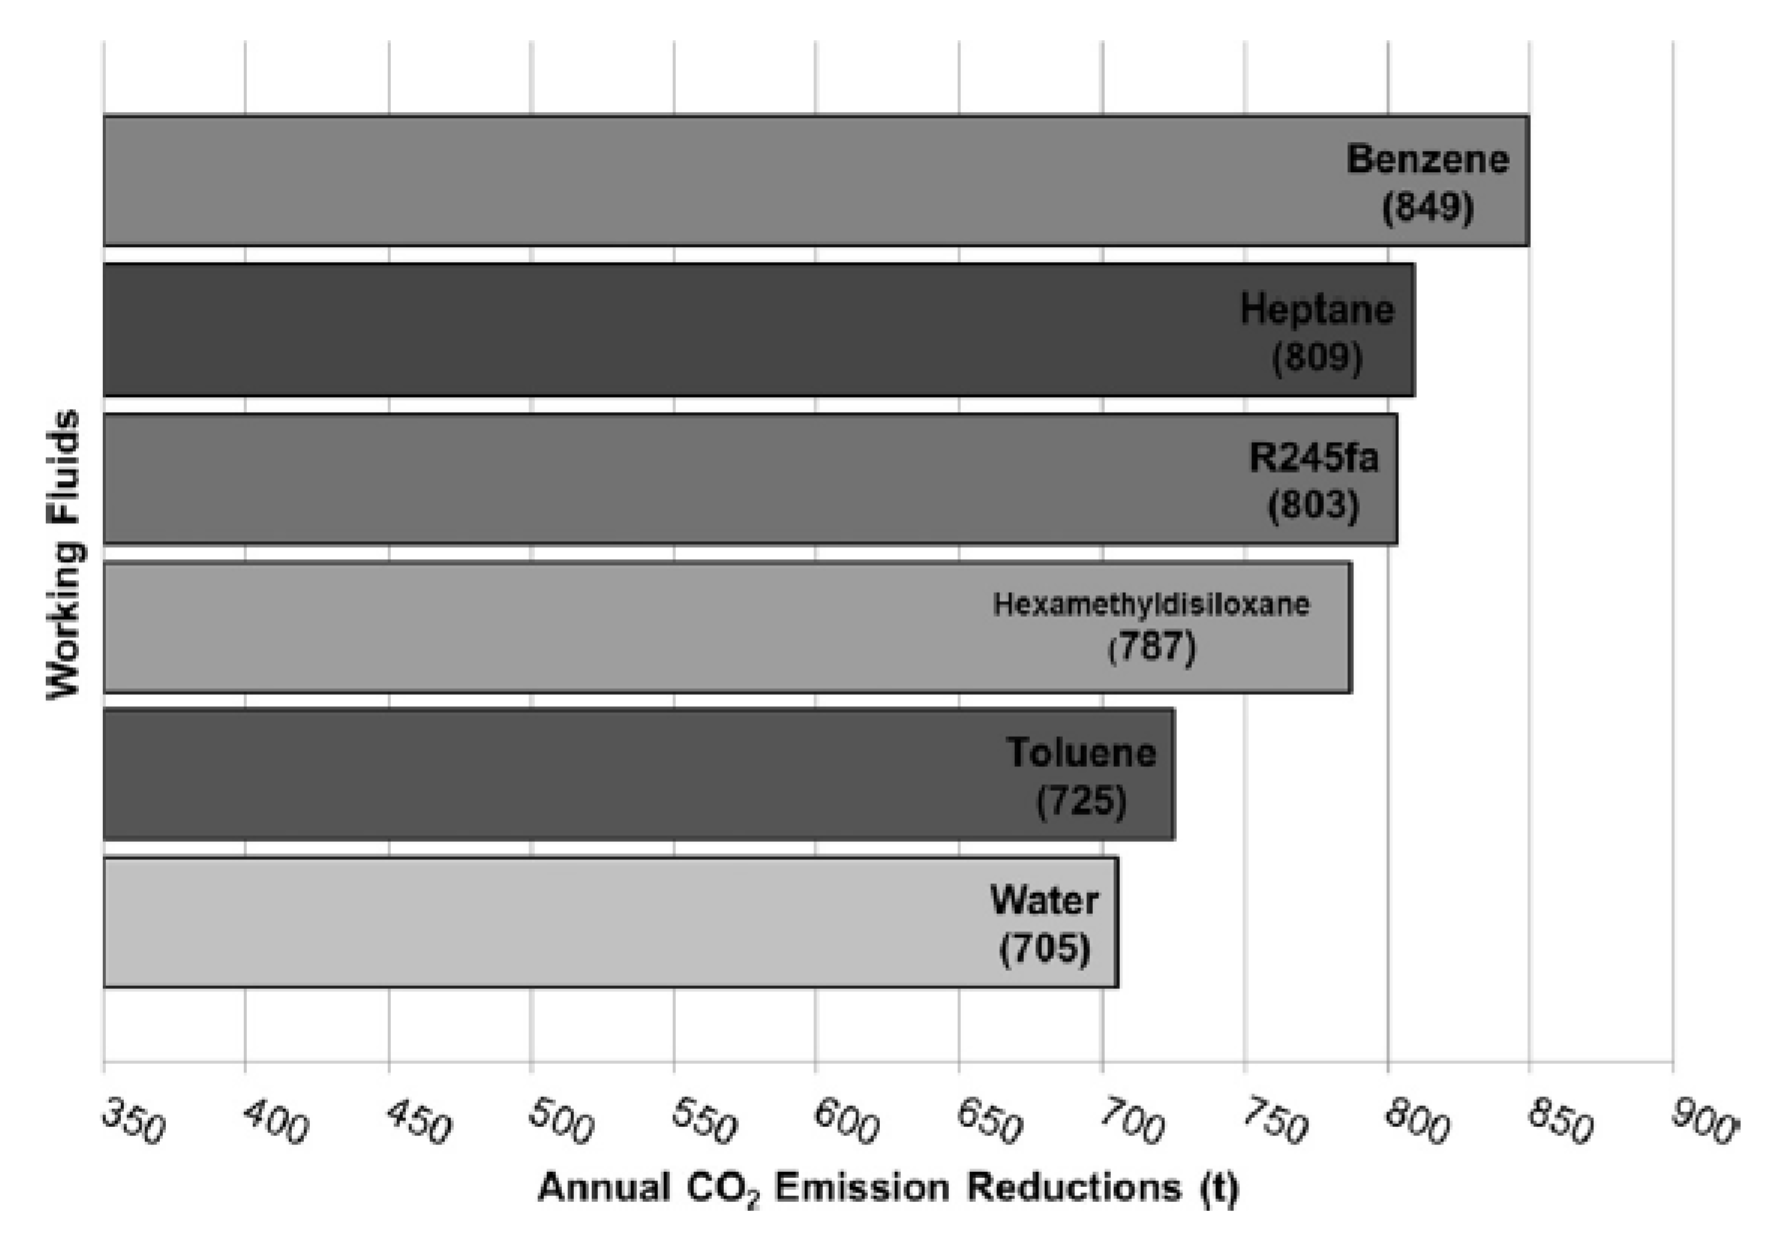
- Suarez de la Fuente, S.; Roberge, D.; Greig, A.R. Safety and CO2 emissions: Implications of using organic fluids in a ship’s waste heat recovery system. Mar. Policy 2017, 75, 191–203. [Google Scholar] [CrossRef]
- Yigit, K.; Acarkan, B. A New Ship Energy Management Algorithm to the Smart Electricity Grid System. Int. J. Energy Res. 2018, 42, 2741–2756. [Google Scholar] [CrossRef]
- Amjad, Z.; Shah, M.A.; Maple, C.; Khattak, H.A.; Ameer, Z.; Asghar, M.N.; Mussadiq, S. Towards Energy Efficient Smart Grids Using Bio-Inspired Scheduling Techniques. IEEE Access 2020, 8, 158947–158960. [Google Scholar] [CrossRef]
- Geerlings, H.; Heji, R.; Van Duin, R. Opportunities for Peak Shaving the Energy Demand of Ship-to-Shore Quay Cranes at Container Terminals. J. Shipp. Trd. 2018, 3, 3. [Google Scholar] [CrossRef]
- Prousalidis, J.; Lyridis, D.; Dallas, S.; Soghomonian, Z.; Georgiou, V.; Spathis, D.; Kourmpelis, T.; Mitrou, P. Ship to Shore Electric Interconnection: From Adolescence to Maturity. IEEE Electr. Ship Technol. Symp. 2017, 200–206. [Google Scholar] [CrossRef]
- Binti Ahamad, N.B.; Guerrero, J.M.; Su, C.L.; Vasquez, J.C.; Zhaoxia, X. Microgrids Technologies in Future Seaports. In Proceedings of the 2018 IEEE International Conference on Environment and Electrical Engineering and 2018 IEEE Industrial and Commercial Power Systems Europe (EEEIC/I&CPS Europe), Palermo, Italy, 12–15 June 2018; pp. 1–6. [Google Scholar] [CrossRef]
- Monacelli, N. Applying Cold-Ironing Regulation in Southeast Asian Ports to Reduce Emissions. Asia-Pac. J. Ocean. Law Policy 2017, 2, 296–316. [Google Scholar] [CrossRef]
- Lind, M.; Bjorn-Andersen, N.; Watson, R.; Ward, R.; Bergmann, M.; Rylander, R.; Andersen, T.; Hagg, M.; Karlsson, M.; Zerem, A.; et al. The Potential Role of PortCDM in Cold Ironing. Sea Traffic Management (STM). Report number: Concept Note #20, Affiliation: RISE Research Institutes of Sweden, October 2018. Sea Traffic Management (STM), Published in cooperation with Fathom.World; Co-financed by the European Union. Available online: https://www.researchgate.net/profile/Enrico-Mancinelli/publication/329119053_A_cogeneration_power_plant_to_integrate_cold_ironing_and_district_heating_and_cooling/links/5bfbced5458515a69e3beaf5/A-cogeneration-power-plant-to-integrate-cold-ironing-and-district-heating-and-cooling.pdf (accessed on 6 August 2021).
- Zis, T.P.V. Green Ports. In Sustainable Shipping: A Cross-Disciplinary View Chapter 12; Psaraftis, H.N., Ed.; Springer Nature: Cham, Switzerland, 2019; pp. 407–432. ISBN 978-3-030-04329-2. [Google Scholar]
- Esposito, F.; Mancinelli, E.; Morichetti, M.; Passerini, G.; Rizza, U. A Cogeneration Power Plant to Integrate Cold Ironing and District Heating and Cooling. Int. J. Energy Prod. Manag. 2018, 3, 214–225. [Google Scholar] [CrossRef]
- Zis, T.P.V. Prospects of Cold Ironing as an Emissions Reduction Option. Transp. Res. Part. A 2019, 119, 82–95. [Google Scholar] [CrossRef] [Green Version]
- Rolan, A.; Manteca, P.; Oktar, R.; Siano, P. Integration of Cold Ironing and Renewable Sources in the Barcelona Smart Port. IEEE Trans. Ind. Appl. 2019, 5, 7198–7206. [Google Scholar] [CrossRef]
- Kotrikla, A.M.; Lilas, T.; Nikitakos, N. Abatement of Air Pollution at an Aegean Island Port Utilizing Shore Side Electricity and Renewable Energy. Mar. Policy 2018, 75, 238–248. [Google Scholar] [CrossRef]
- Reusser, C.A.; Perez, J.R. Evaluation of the Emission Impact of Cold-Ironing Power Systems, Using a Bi-Directional Power Flow Control Strategy. Sustainability 2021, 13, 334. [Google Scholar] [CrossRef]
- Kilic, A.; Yolcu, M.; Kilic, F.; Bilgili, L. Assessment of Ship Emissions through Cold Ironing Method for Iskendrum Port of Turkey. Environ. Res. Technol. 2020, 3, 193–201. [Google Scholar]
- Martinez Lopez, A.; Romero-Filgueira, A.; Chica, M. Specific Environmental Charges to boost Cold Ironing use in the European Short Sea Shipping. Transp. Res. Part. D Transport. Environ. 2021, 94, 102775. [Google Scholar] [CrossRef]
- Chen, J.; Zheng, T.; Garg, A.; Xu, L.; Li, S.; Fei, Y. Alternative Maritime Power Application as a Green Port Strategy: Barriers in China. J. Clean. Prod. 2018, 213, 825–837. [Google Scholar] [CrossRef]
- Paulauskas, V.; Filina-Dawidowicz, L.; Paulaskas, D. The Method to Decrease Emissions from Ships in Port Areas. Sustainability 2020, 12, 4374. [Google Scholar] [CrossRef]
- Vojkovic, G.; Milenkovic, M. Autonomous Ships and Legal Authorities of the Ship Master. Case Stud. Transport. Policy 2020, 8, 333–340. [Google Scholar] [CrossRef]
- Ait Allal, A.; Mansouri, K.; Youssfi, M.; Qbadou, M. toward Energy Saving and Environmental Protection by Implementation of Autonomous Ship. In Proceedings of the 19th IEEE Mediterranean Electrotechnical Conference (MELECON), Marrakech, Morocco, 2–7 May 2018; pp. 177–180. [Google Scholar] [CrossRef]
- Rodseth, O.J.; Froystad, C.; Meland, P.H.; Bernsmed, K.; Nesheim, D.A. The Need for a Public Key Infrastructure for Automated and Autonomous Ships. IOP Conf. Ser. Mater. Sci. Eng. 2020, 929, 012017. [Google Scholar] [CrossRef]
- Mao, X.; Rutherford, D.; Osipova, L.; Comer, B. Refueling Assessment of a Zero-Emission Container Corridor between China and the United States: Could Hydrogen Replace Fossil Fuels? Working Paper; ICCT Online Publication: Berlin, Germany, 2020. [Google Scholar]
- Wood, G.; Baker, K. Ports. In The Palgrave Handbook of Managing Fossil Fuels and Energy Transitions; Palgrave Macmillan: Cham, Switzerland, 2020; pp. 149–151. [Google Scholar]
- Bosman, R.; Loorbach, D.; Rotmans, J.; Van Raak, R. Carbon Lock-Out: Leading the Fossil Port of Rotterdam into Transition. Sustainability 2018, 10, 2558. [Google Scholar] [CrossRef] [Green Version]


| Type | Main Pollutants |
|---|---|
| Common Air Contaminants (CAC) | Oxides of Nitrogen (NOx) Oxides of Sulphur (SOx) Particulate Matter (PM10 and PM2.5) Carbon Monoxide (CO) Volatile Organic Compounds (VOC) Ozone (O3) |
| Greenhouse Gases (GHG) | Carbon dioxide (CO2) Methane (CH4) Nitrous Oxide (N2O) |
| Other pollutants | Dust Odors (Noise) |
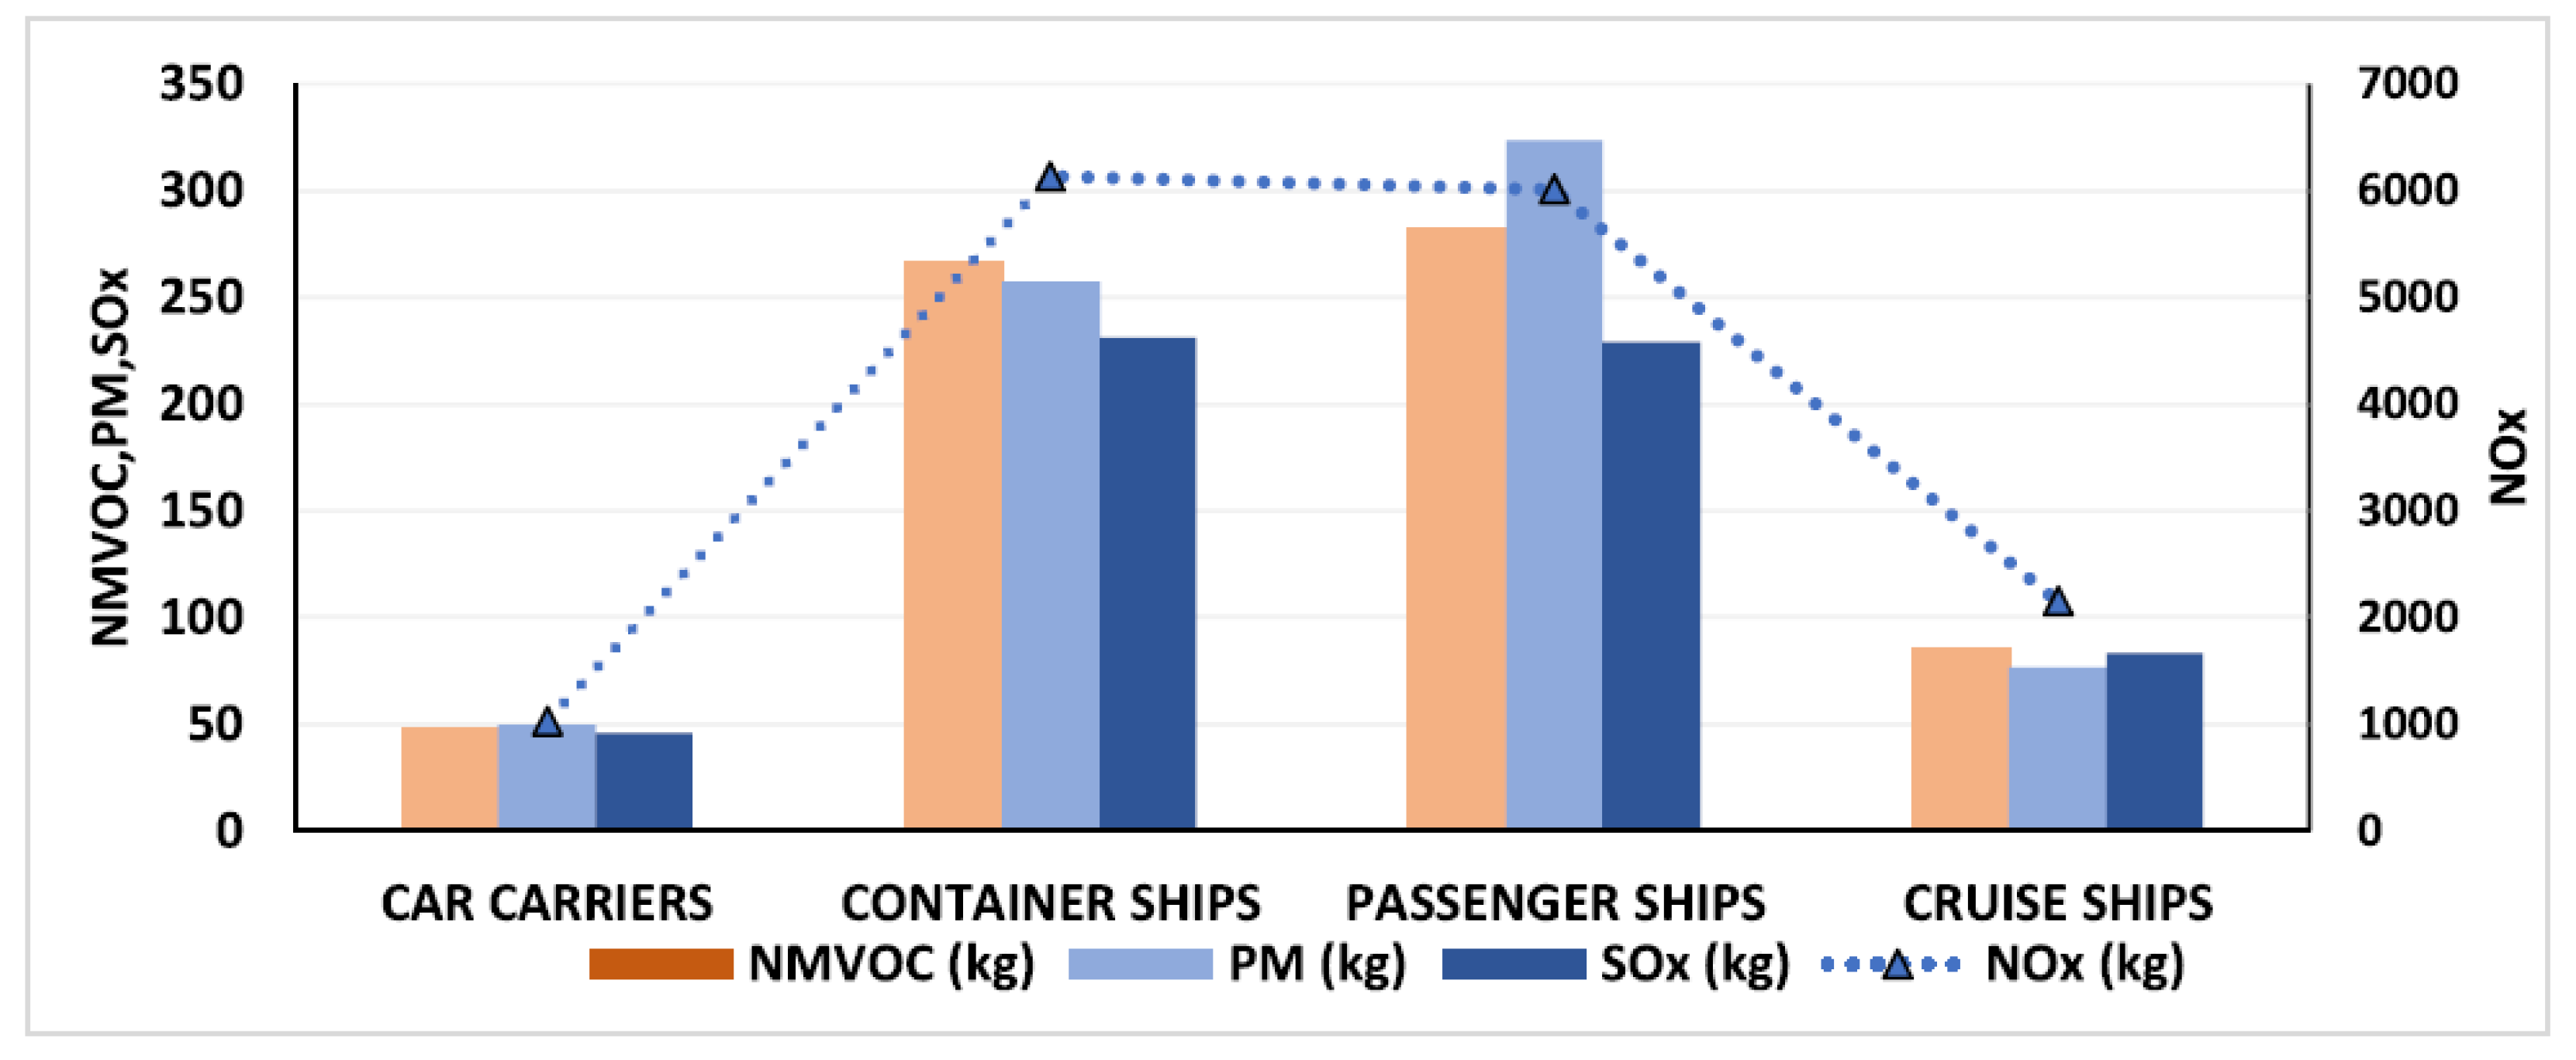
| Ship Category | Ship Calls | Maneuvering and Hoteling | |||
|---|---|---|---|---|---|
| NOx (t) | NMVOC (t) | PM (t) | SOx (t) | ||
| Passenger ships | 13,096 | 2333 | 107 | 101 | 50. |
| Cruise ships | 512 | 320 | 13 | 12 | 20 |
| Total | 13,608 | 2653 | 120 | 113 | 70 |
| Container ships | 3346 | 1447 | 64 | 63 | 81 |
| Car carriers | 634 | 237 | 10 | 10 | 39 |
| Ro-Ro | 347 | 29 | 1 | 1 | 2 |
| Total | 4372 | 1713 | 75 | 74 | 121 |
| Grand total | 17,935 | 4366 | 196 | 188 | 191 |
Publisher’s Note: MDPI stays neutral with regard to jurisdictional claims in published maps and institutional affiliations. |
© 2021 by the authors. Licensee MDPI, Basel, Switzerland. This article is an open access article distributed under the terms and conditions of the Creative Commons Attribution (CC BY) license (https://creativecommons.org/licenses/by/4.0/).
Share and Cite
Barberi, S.; Sambito, M.; Neduzha, L.; Severino, A. Pollutant Emissions in Ports: A Comprehensive Review. Infrastructures 2021, 6, 114. https://doi.org/10.3390/infrastructures6080114
Barberi S, Sambito M, Neduzha L, Severino A. Pollutant Emissions in Ports: A Comprehensive Review. Infrastructures. 2021; 6(8):114. https://doi.org/10.3390/infrastructures6080114
Chicago/Turabian StyleBarberi, Salvatore, Mariacrocetta Sambito, Larysa Neduzha, and Alessandro Severino. 2021. "Pollutant Emissions in Ports: A Comprehensive Review" Infrastructures 6, no. 8: 114. https://doi.org/10.3390/infrastructures6080114
APA StyleBarberi, S., Sambito, M., Neduzha, L., & Severino, A. (2021). Pollutant Emissions in Ports: A Comprehensive Review. Infrastructures, 6(8), 114. https://doi.org/10.3390/infrastructures6080114