1. Introduction
Preserving structurally sound and fully serviceable airfield pavements is crucial for the capacity of the air transportation network. Airfield pavements are a major component of the critical transportation infrastructure network serving daily flows of human beings and freights, promoting regional economic development and boosting tourist flows [
1]. However, budgetary constraints in terms of infrastructure management are becoming an increasing concern, implying that rehabilitation planning is usually a matter of concern for the related stakeholders. Maintenance interventions and rehabilitation actions are time-consuming, and most seriously, they adversely affect pavements’ serviceability (i.e., airport closures) with a profound impact on the airport economics. Furthermore, in the case of the concrete pavements usually seen in airfields, rehabilitation design is even more challenging, since concrete brittleness usually makes it necessary to select in-depth and, thus, costly interventions by fully replacing the distressed slabs.
Due to their significance, airfield pavements need to be designed as high-quality and low-risk structures [
2]. Once constructed, a robust airfield pavement management prerequisites systematic and accurate knowledge of its condition throughout its service life [
3]. The latter is done by evaluating the bearing capacity of airfield pavements, which indicates their ability to sustain aircraft loads. Integrating information about thickness sufficiency, material strength and pavement’s foundation efficiency shapes the pavement’s performance, or else the way a pavement behaves against loading. In addition, surface condition assessment in terms of distresses, crack presence, etc. is equally significant and probably to a bigger extent compared to highway pavements. For example, the presence of surface cracks in airfield pavements, apart from indicating potential loss of material strength, might be the reason for debris accumulation within cracks, known as Foreign Object Debris (FOD) [
4,
5]. This aspect can seriously affect the aircraft moving in the ground maneuvering areas and the passengers’ safety [
4].
Besides, with the focus put on runways that enable aircraft take-offs and landings, their structural integrity is usually the first and most important concern of all airport agencies [
3]. Evaluating a pavement’s structural capacity in the field involves the integration of multiple Non-Destructive Testing (NDT) systems. The Falling Weight Deflectometer (FWD) [
6] is the most indicative NDT system for pavement evaluation. Following its efficiency for highway pavement assessment [
6,
7], the use of FWD is a well-structured method and constitutes the standard practice approach in airfields too [
8,
9,
10,
11,
12,
13,
14]. Deflectometric tests are usually taken at various locations across a concrete slab, including its center, edges and corners. Assessing the deflection variations within a unique slab indicates pavement durability according to the related Federal Aviation Administration (FAA) recommendations [
15]. FWD is also a powerful tool for the assessment of the pavement’s ability to transfer load on either sides of a joint or a crack. This ability refers to the Load Transfer Efficiency (LTE) [
16]. While the FWD assesses the pavement’s behavior as an overview, individual material contribution is another critical performance indicator. In particular, the flexural strength of concrete is an indispensable parameter for both pavement design and analysis [
12,
17]. It is also a critical performance indicator, as increased cracking susceptibility is usually linked with poor flexural strength of concrete [
17].
With respect to concrete pavement distresses, corner cracks or faulting are the most common ones on existing pavements due to poor LTE and/or loss of foundation support [
10,
18]. Contrariwise, thermal cracking on concrete pavements usually occurs at new pavements shortly after their construction [
19]. These early-life cracks appear when the tensile strain formed from restrained thermal contraction or temperature differentiations exceeds the tensile strain capacity of concrete [
18,
20]. In addition, construction activities during summer months under high environmental temperatures cause quicker water evaporation leading to concrete shrinkage phenomena [
20]. In a related study for highway pavements, it has been reported that shrinkage cracks reduce tensile strength in the surface by around 50%, and although they do not initially produce visible cracks, they can intensify crack opening after the pavement is exposed to traffic loadings [
21]. Moreover, once a concrete pavement is cracked, this is progressively translated into full-depth crack propagation, resulting in a reduced bearing capacity and an overall poor pavement performance [
3,
17]. Therefore, apart from the visual inspection of airfield concrete pavements, a more in-depth structural evaluation process is needed to further investigate potential pavement performance issues.
3. Materials and Methods
3.1. Overview of the Experimental Process
Based on the methodology described in
Figure 1, an experimental process was developed, which included (i) NDT data collection in the field with a Dynatest FWD system (
Figure 2a) and a Dynamic Cone Penetrometer (DCP) (
Figure 2b), (ii) sample coring (
Figure 2c) for thickness assessment and concrete material characterization and (iii) combined performance analysis considering traffic data. Both FWD and DCP testing were performed in accordance with relevant specifications and standards [
22,
23].
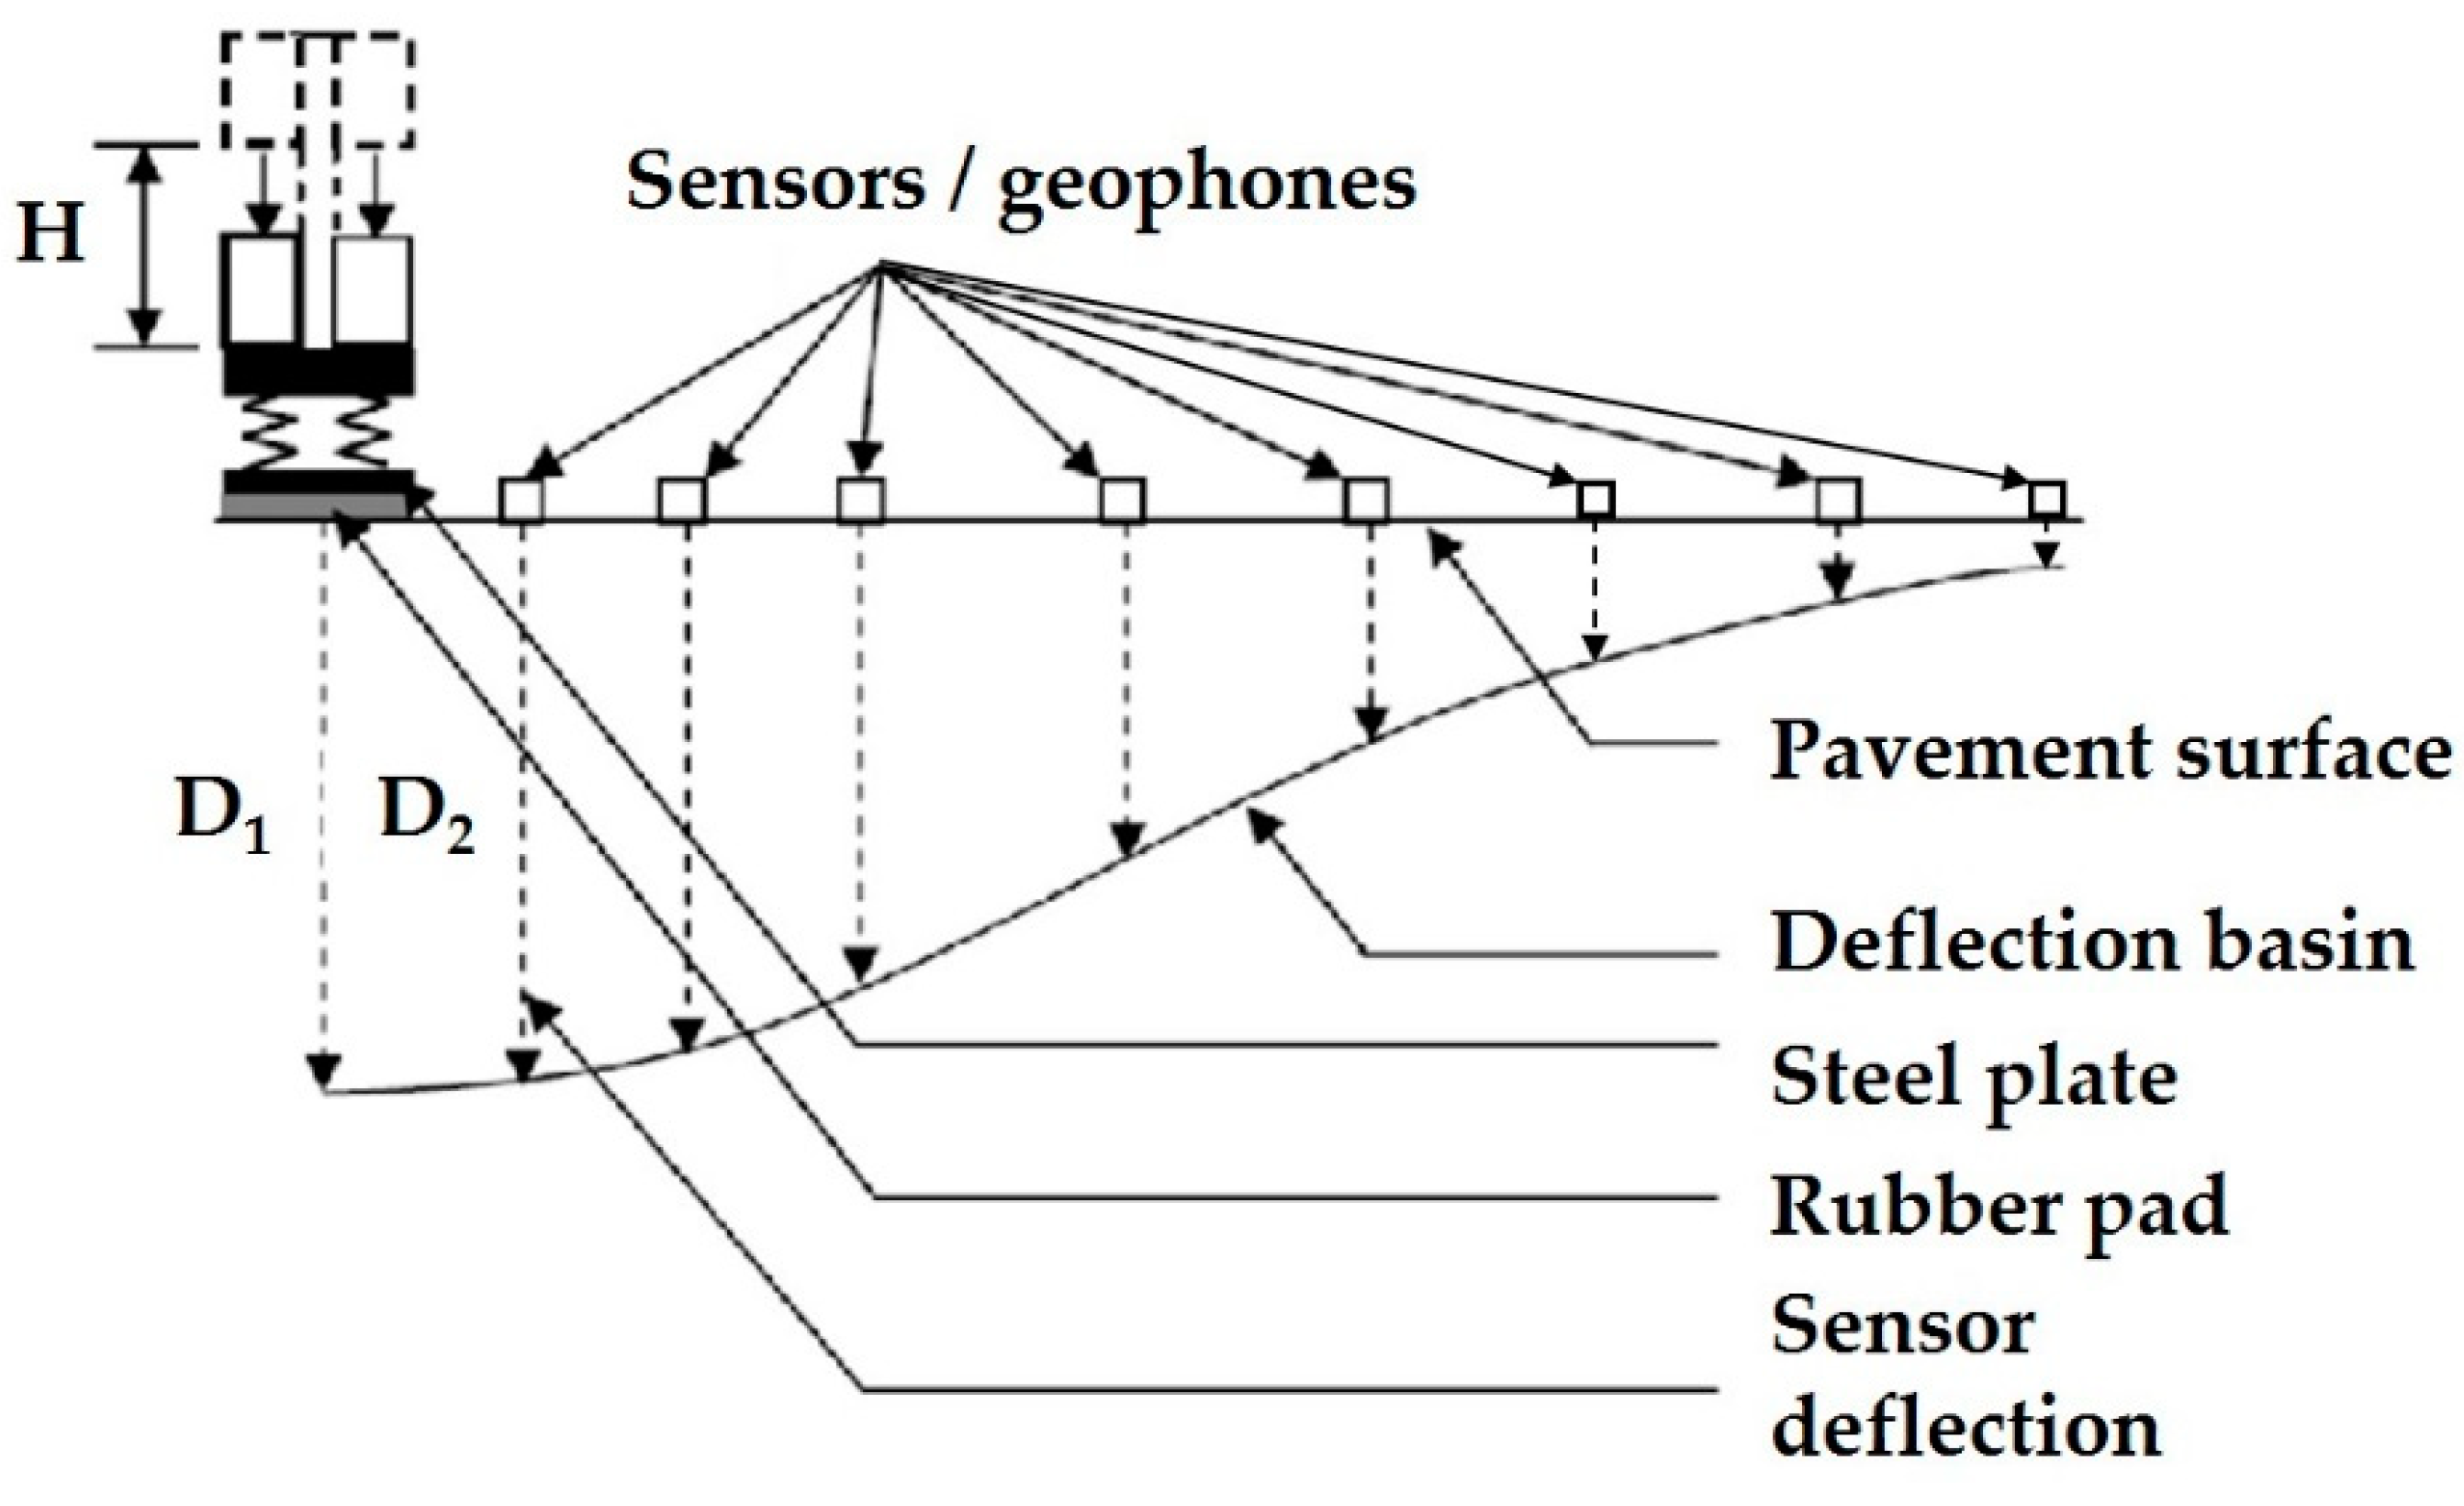
The FWD is a powerful method for evaluating the structural integrity of pavement layers and the subgrade [
6,
24,
25,
26]. The principle is to generate a load impulse by dropping a known mass from a given height onto a loading plate, through which the load is transmitted to the pavement structure. This results in a typical deflection response, such as the one shown in
Figure 3. Multiple load levels can be applied to the pavement by adjusting the drop height (load levels) according to the predefined load levels for the LTPP FWD test [
25]. The resulting vertical deflections of the pavement are recorded by a series of geophones spaced at predefined intervals along a radial axis from the loading plate.
With respect to the DCP system, empirical data are provided on the strength of the underlying unbound layers of the pavement structure. An 8-kg hammer penetrates the tested materials, which may be either undisturbed soils and/or compacted granular materials. The DCP penetration rate is recorded at each location and can be further correlated with a California-Bearing-Ratio (CBR) value providing estimations of the in-situ strength of the unbound materials.
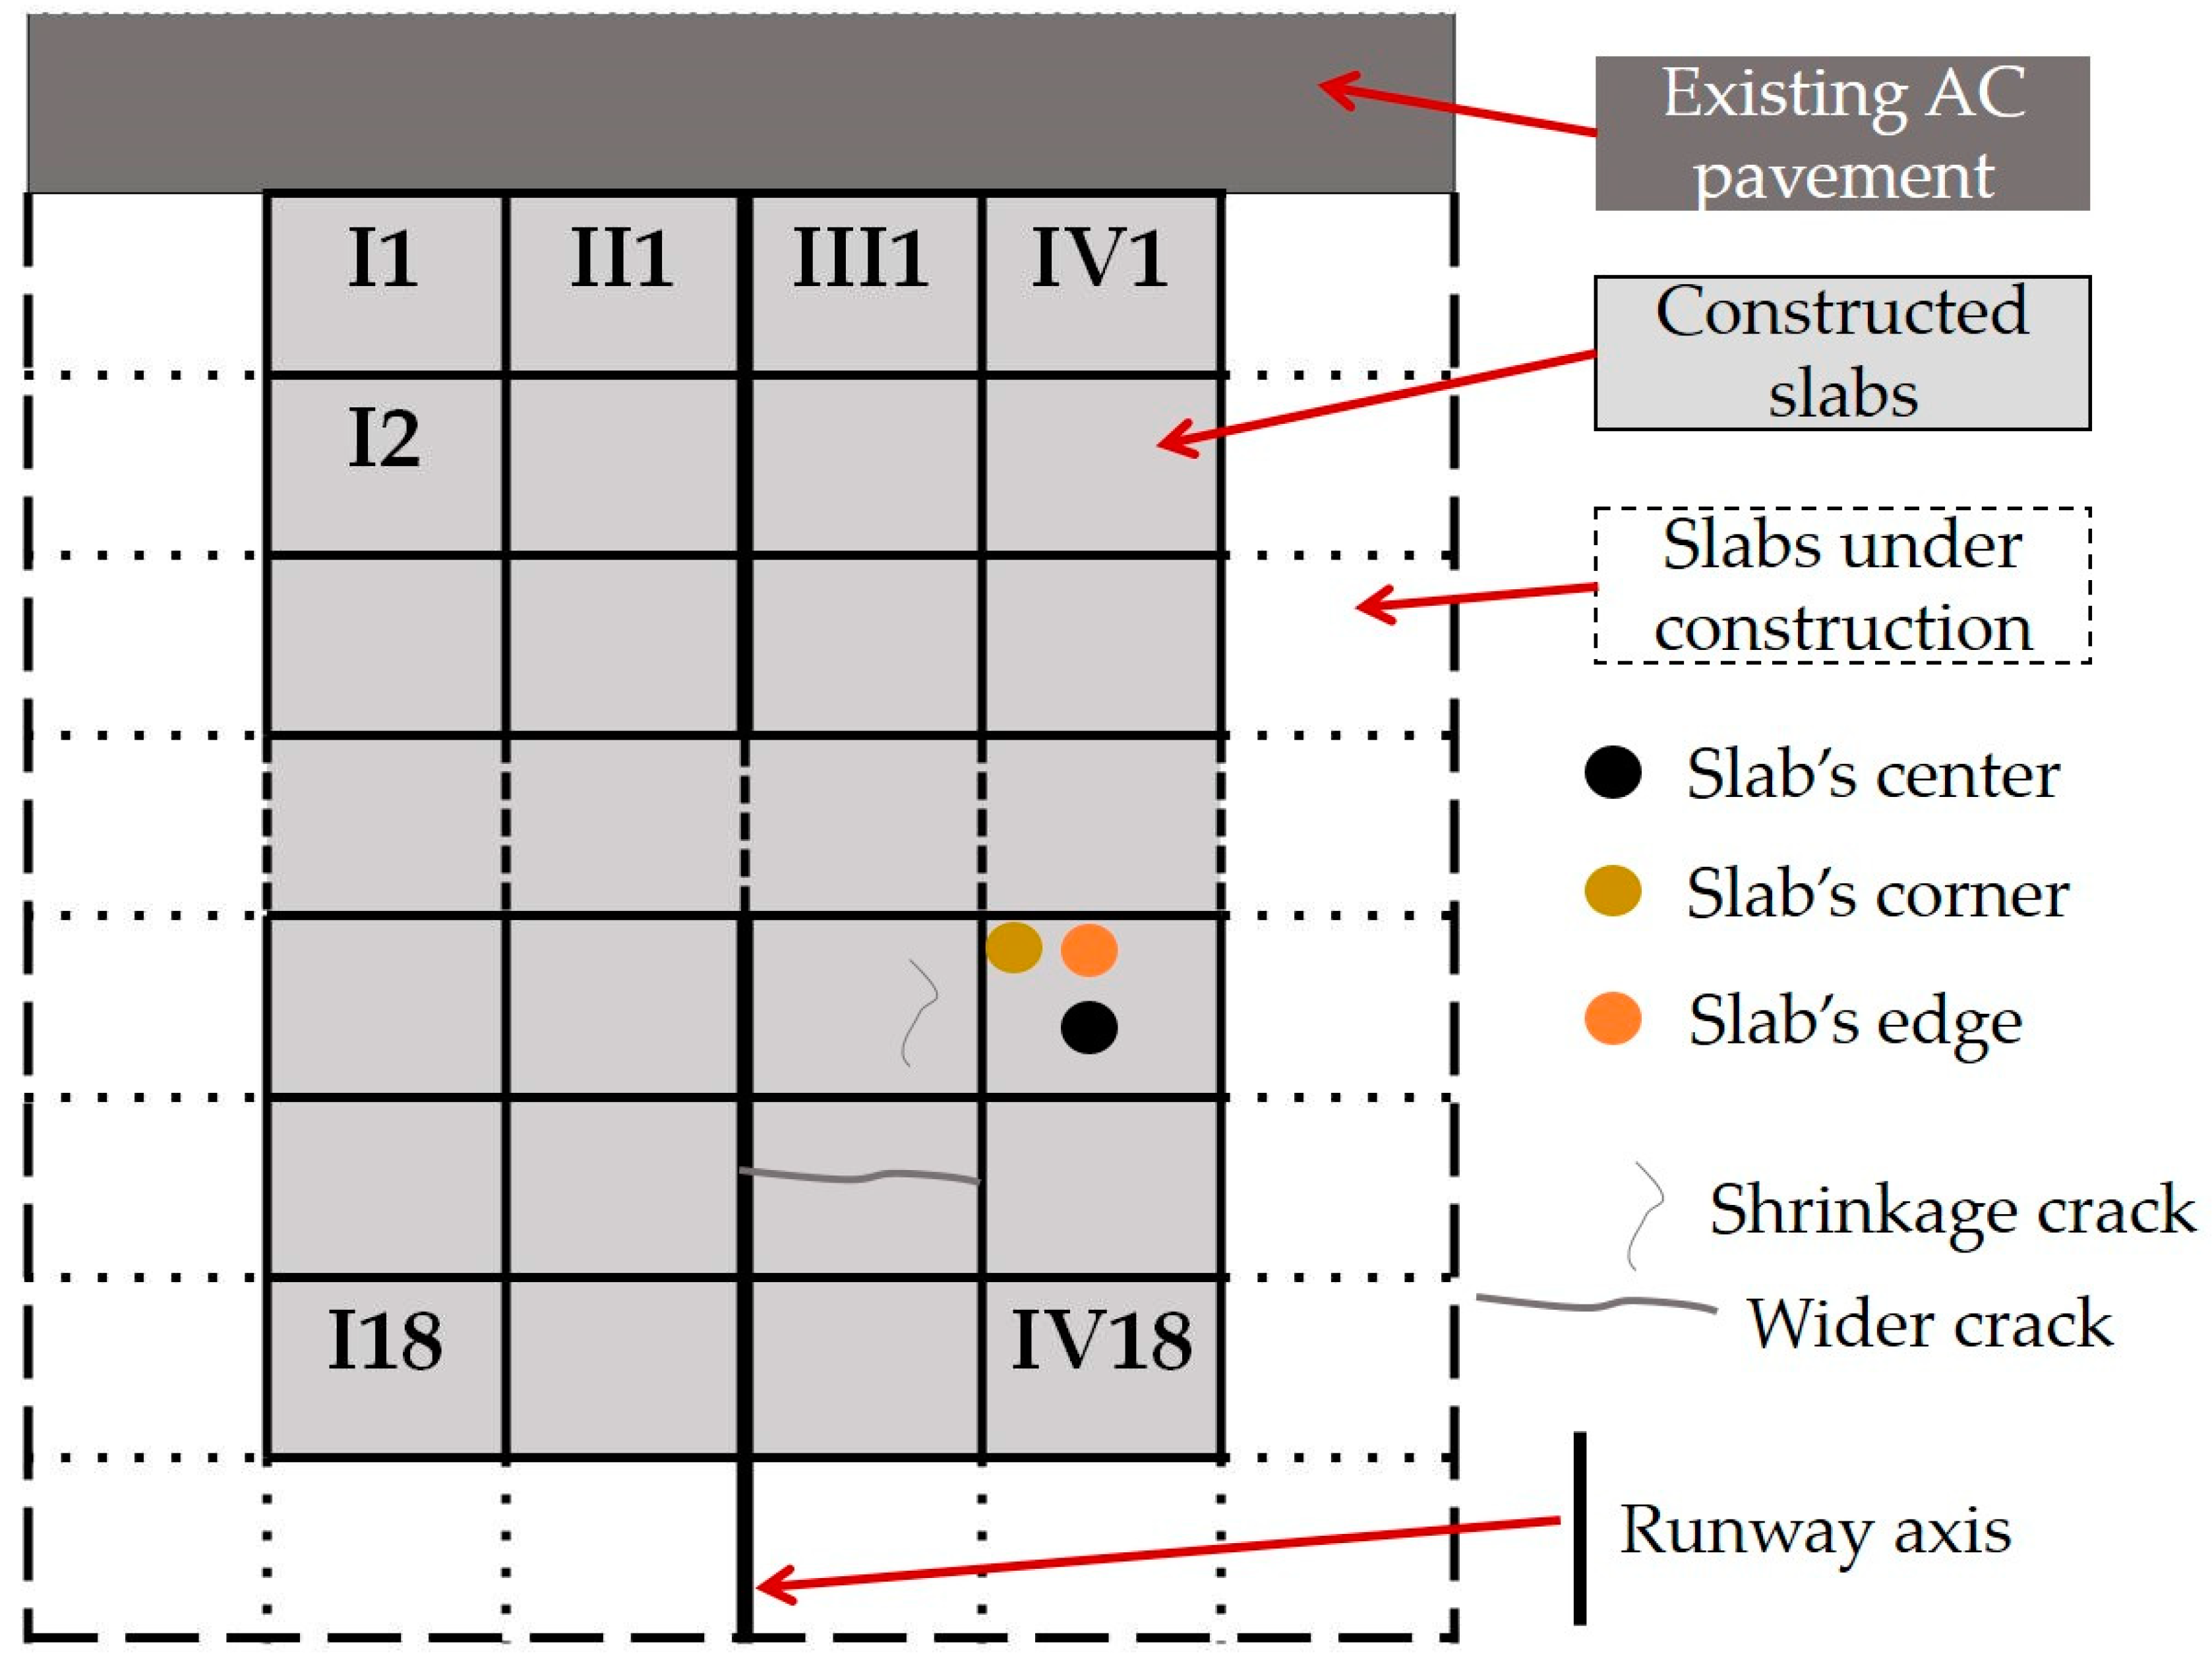
3.2. Test Site
The test site that was used for data collection (shown in
Figure 4) includes an Asphalt Concrete (AC) runway pavement of a regional airport with strategic importance for the southeast European area. Based on increased tourist flows that have raised the aircraft type demands the previous years, the airport authorities planned to expand the existing AC runway with new pavement construction. Part of the expansion corresponds to the JPCP section (as shown in
Figure 4), including slabs with concrete of type C30/37 laying on crushed-stone granular subbase. The pavement foundation consists of natural soil. The investigation focuses on the JPCP section.
A typical pavement cross-section is shown in
Figure 5. The illustrated thicknesses refer to the design values that were defined according to the FAA principles considering typical values for material characteristics. The expected traffic for a 20-year design period included 1900 annual departures of aircraft type Dash8-Q400 and 250 annual departures of aircraft type Airbus A318.
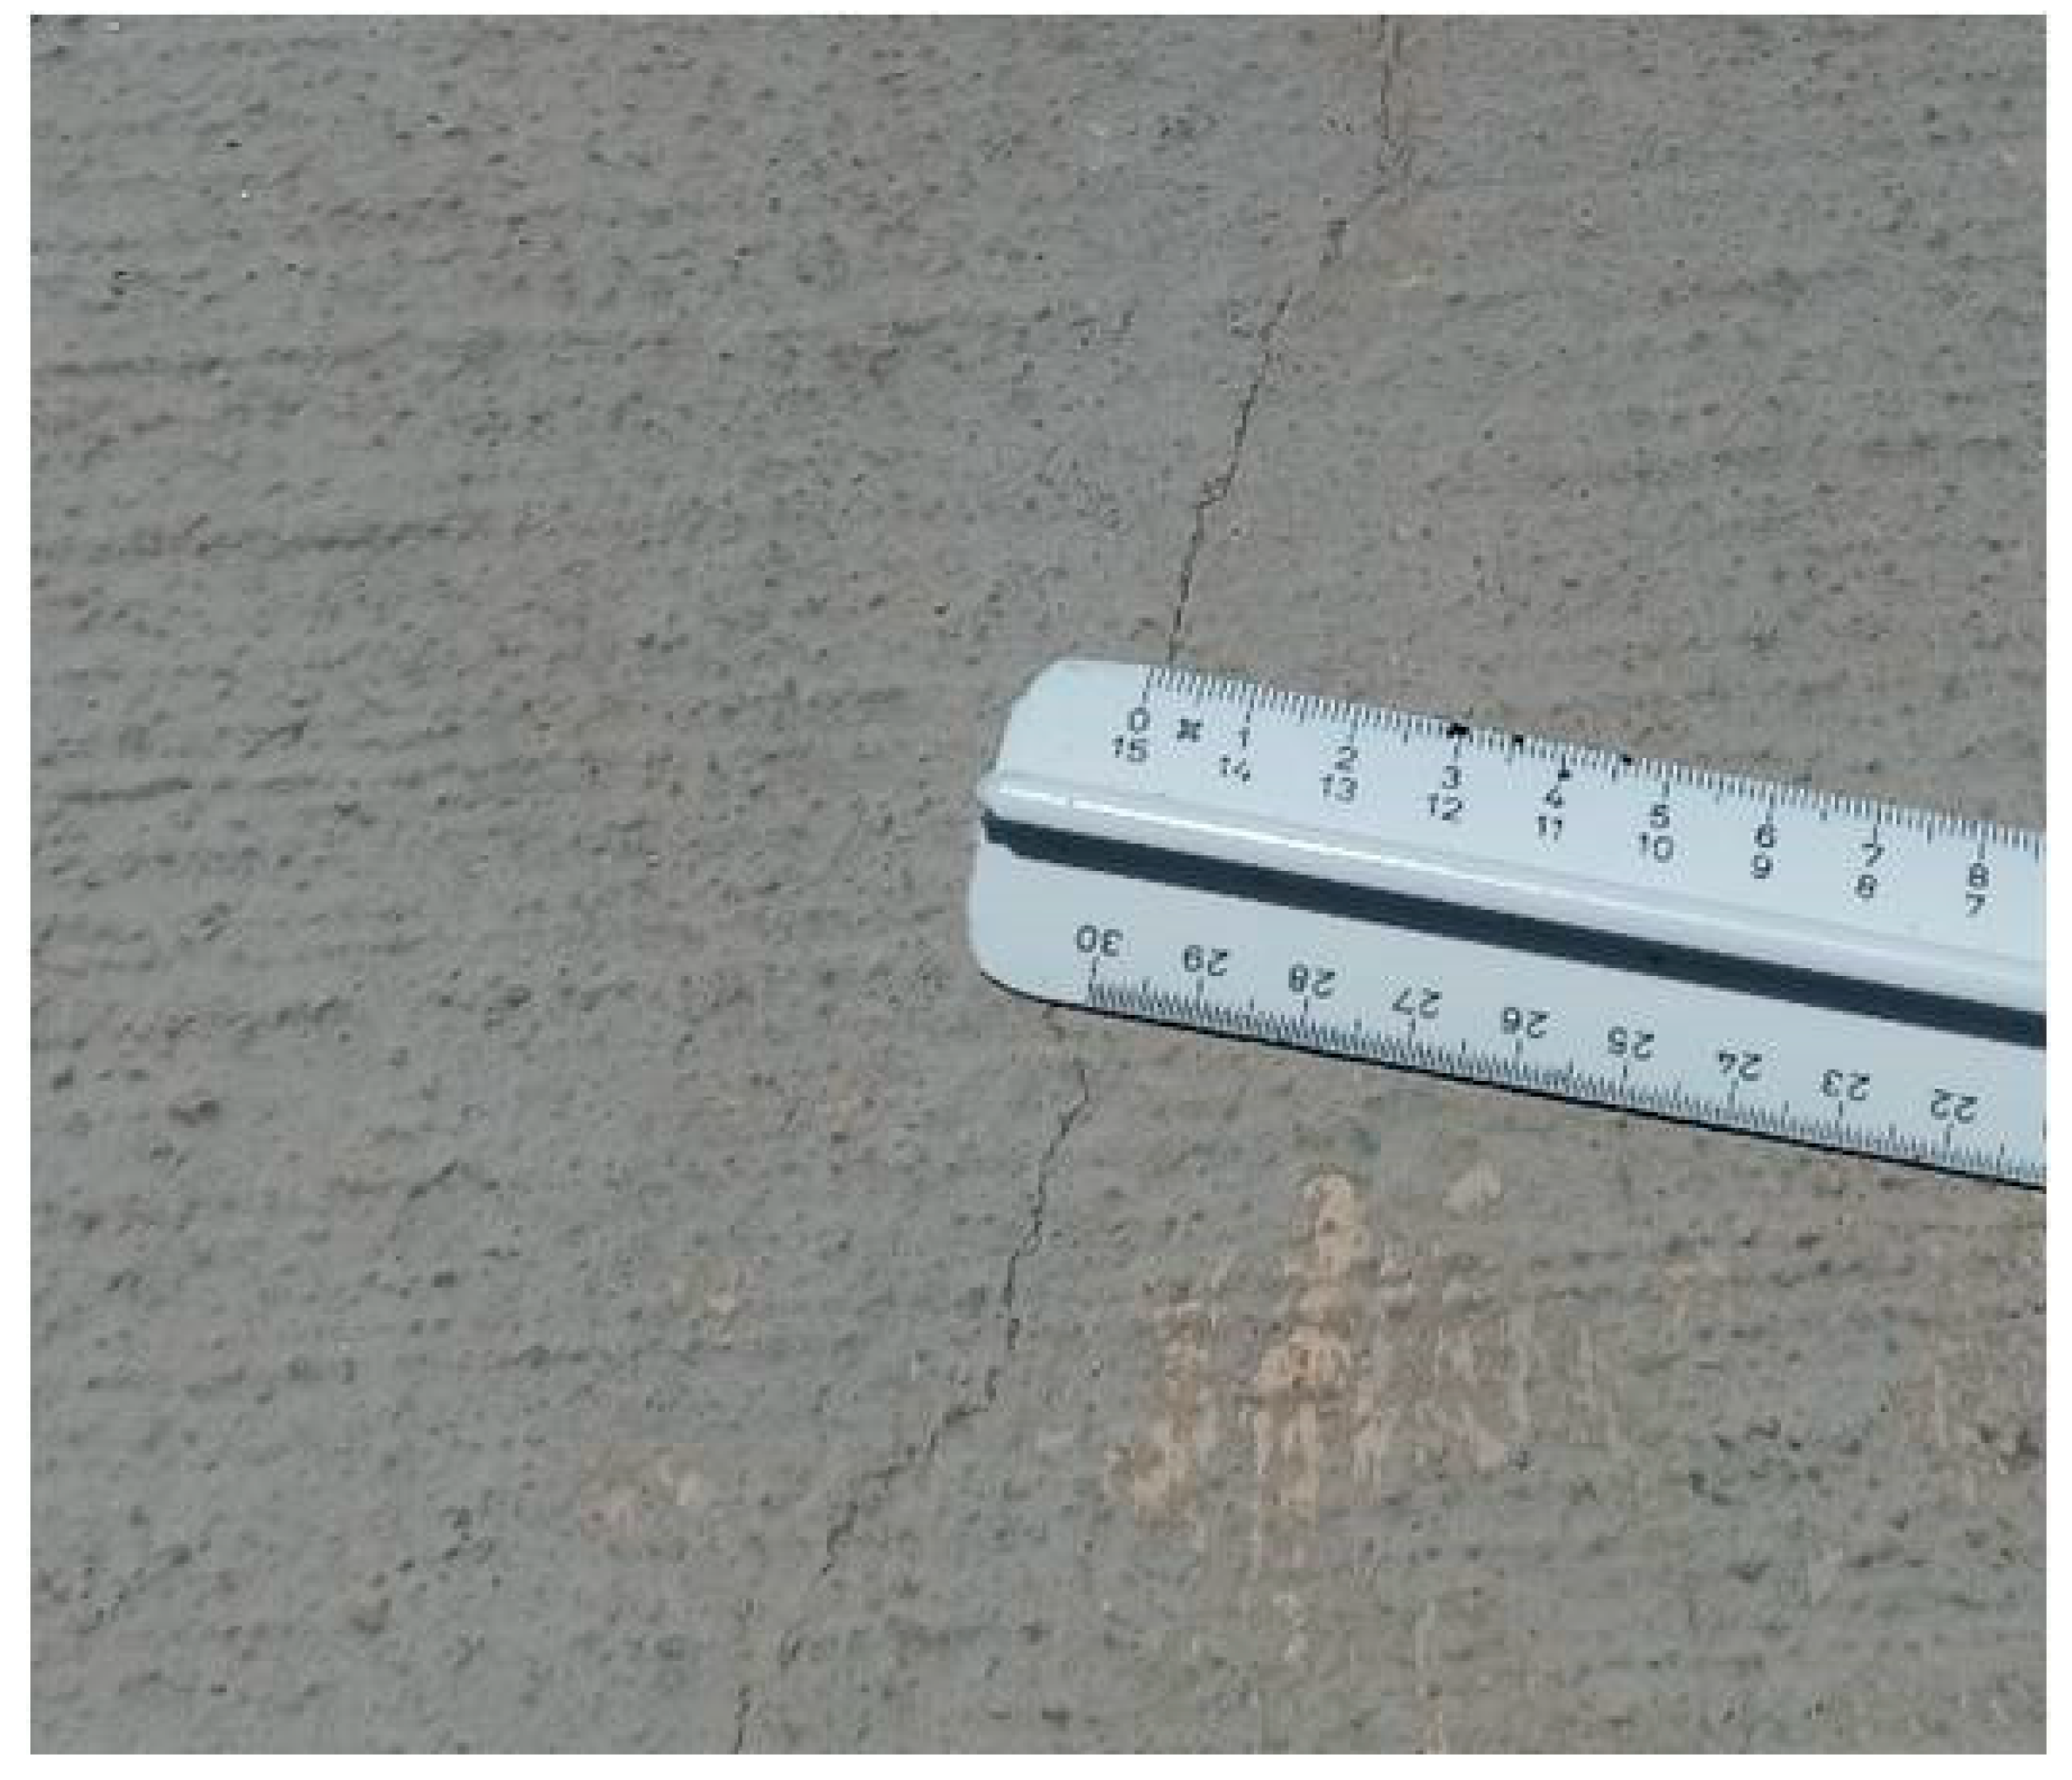
The pavement construction started from the runway axis and moved outwards. Based on the construction history, it is known that it took place during dry summer conditions and shrinkage cracks appeared at several locations along some concrete slabs a few weeks after (
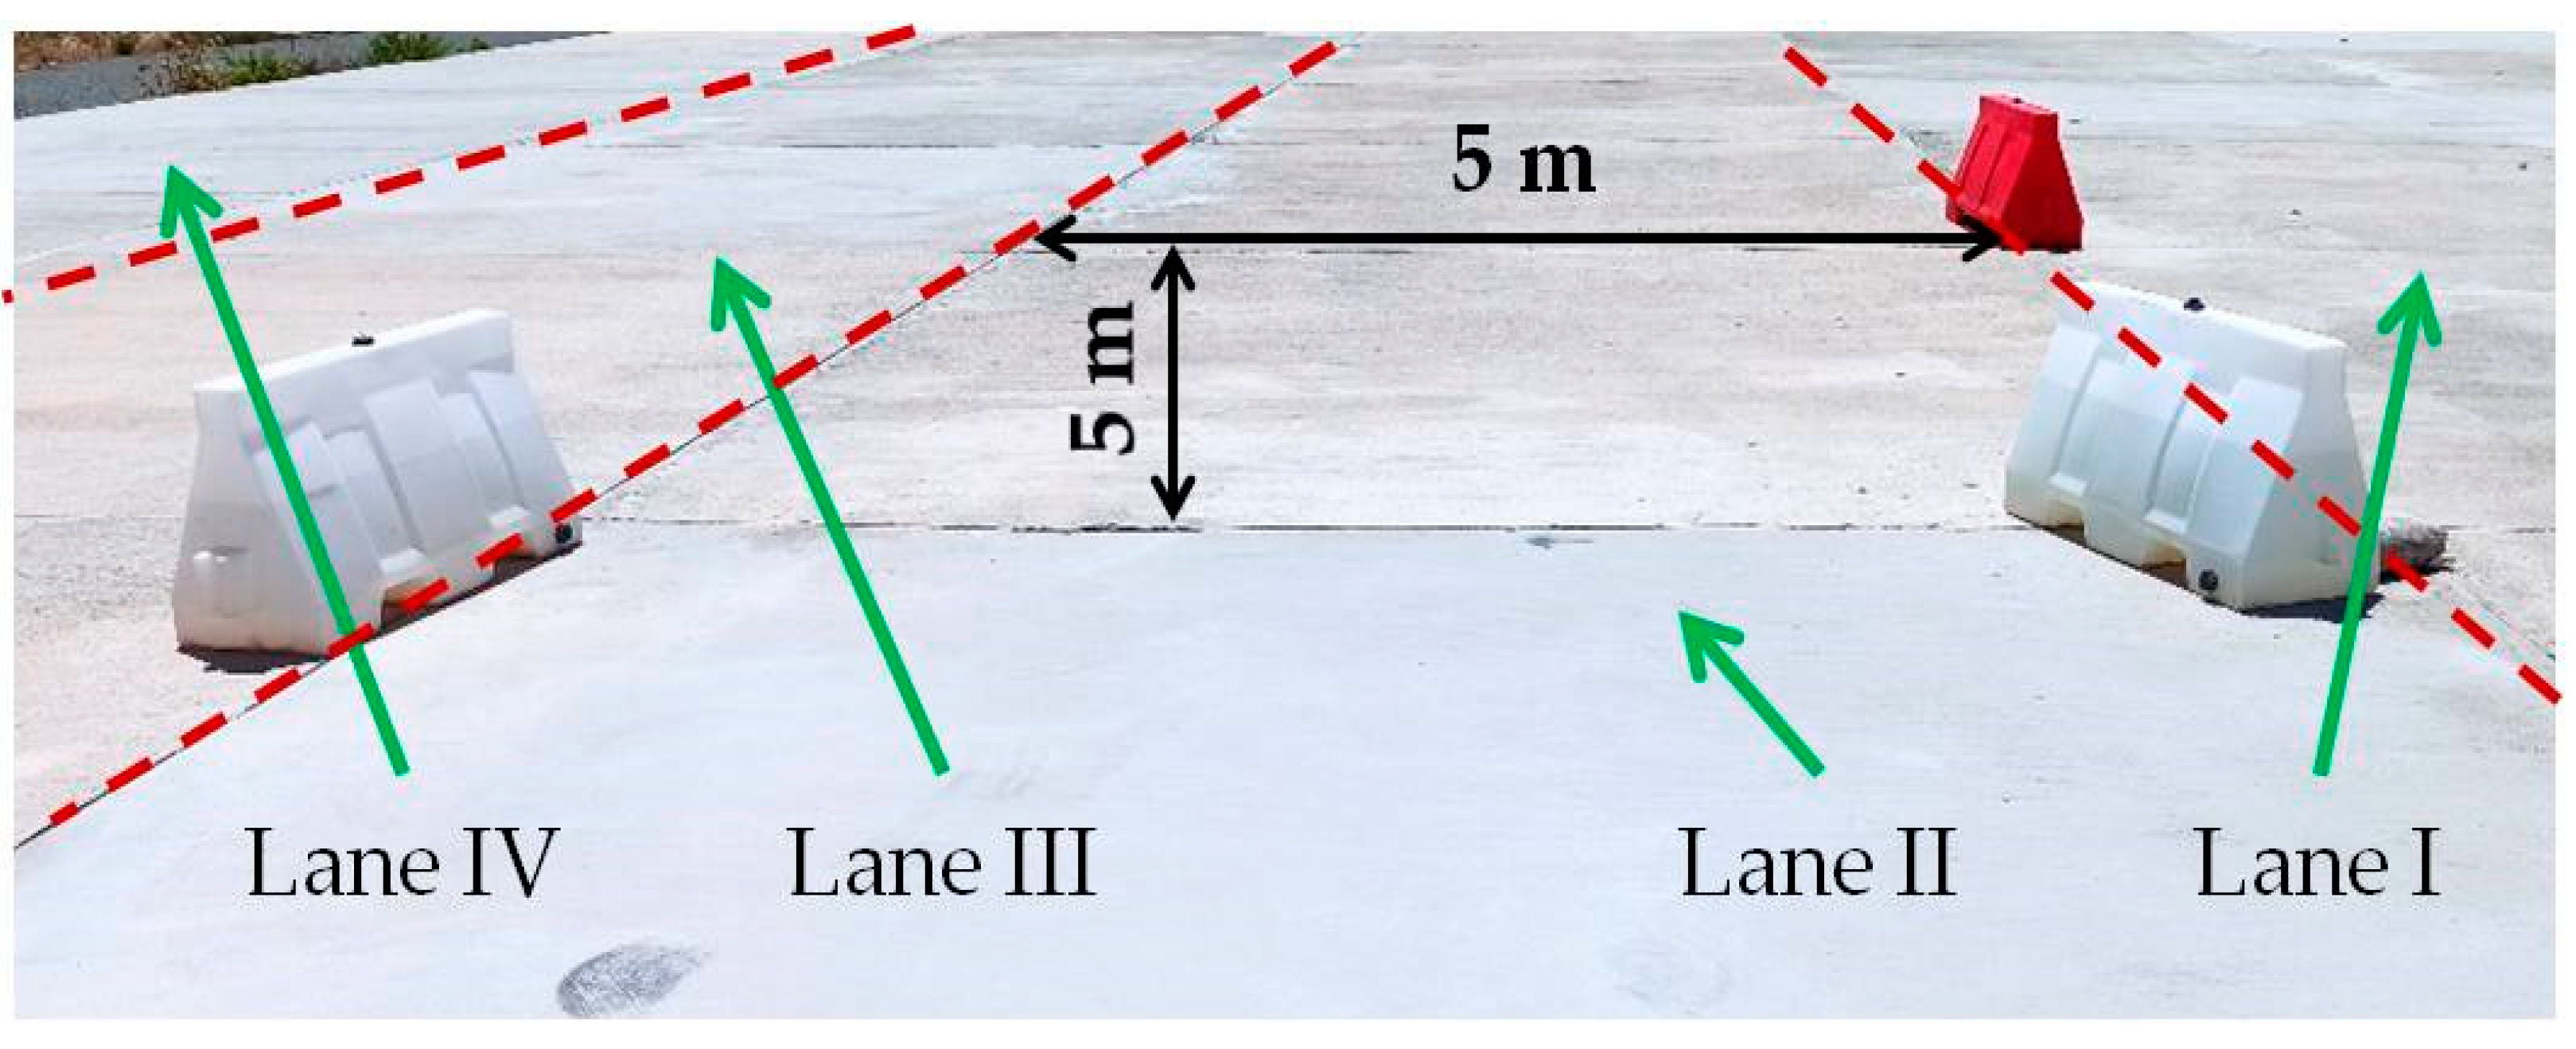
Figure 6). Moreover, several concrete thickness variations were observed. As such, parallel to the construction activities, the undertaken experiment planned to evaluate the condition of the so far constructed pavement consisting of four lanes (
Figure 7).
Each lane included square concrete slabs with dimensions of 5 × 5 m and the total investigation area was 1800 m2.
3.3. Nondestructive Data Collection
With respect to the field experiment, apart from a rigorous visual inspection across both distressed and non-distressed slabs, nondestructive testing was performed. Moreover, even if the surface condition itself is satisfactory, potentially hidden structural issues can be identified by analyzing NDT data.
An illustration of the survey scheme is given in
Figure 8. The FWD load was set to 100 kN, which was selected according to previous experience [
8,
14] in order to ensure that the concrete pavement will exhibit appropriate responses under the FWD loading. The utilized FWD sensor array is given in
Table 1. According to FAA [
27], the most common FWD test takes place at the central location of a concrete slab (i.e., in the middle of each 5 × 5 slab in this case). This center test aims primarily to collect deflection data that form a deflection basin that can be used to estimate the strength of the pavement and subgrade layers. In other words, testing at slab centers serves the need for roughly mapping/screening the whole investigation area. Based on the slab dimensions and the sensor array of
Table 1, it appears that testing at a slab’s center ensures that all sensors fall within the area of a single slab.
Furthermore, at each test location, an initial seating drop was performed in order to properly settle the loading plate, which was followed by three drops that were stored for later analysis. This choice is in accordance with relevant airfield pavement evaluation procedures [
28]. At each test location, averaged deflections were calculated to ensure the contribution of each individual drop. It is noted that variability among the three drops was less than 2% for the central deflection (index D
1) and less than 4% for the deflection recorded from the outermost sensor (index D
9) considering data from all slabs. Deflection profiles from each slab were used to assess the homogeneity and construction variability along the investigation area. This means that for each lane’s slabs, the homogeneity was assessed through the Coefficient of Variation (CV) defined as the ratio of standard deviation to mean deflection value.
Therefore, the assessment of the deflection variability of adjacent slabs led to the selection of some indicative slabs for denser measurements along each slab’s area. In particular, the measurements of whole slabs included deflection records at all slab edges and corners (an example is shown in
Figure 8). These deflections were further processed to estimate concrete durability according to FAA [
15]. In total, 72 slabs were measured at the slab center. Durability assessment was indicatively performed at eight slabs that constitute a percentage of more than 10% out of the total. The selection of these slabs was made randomly such that they could cover the full investigation area. According to FAA [
15], durability-related aspects can be assessed by obtaining the ratio of the Impulse Stiffness Modulus (ISM) at slab centers and slab edges or corners. The ISM ratio is defined as:
where:
: load and maximum deflection at the slab center;
: location that refers to either a slab’s edge or a slab’s corner;
: load and maximum deflection at the -location of a slab.
FAA [
15] provides an indicative ranking of the ISM values in order to quantitatively assess durability-related problems at airfield concrete pavements. Values greater than 3 may indicate a poor durability at the slab’s corner or joint (edge). Values between 3 and 1.5 indicate a questionable durability, whereas a good condition is guaranteed for ISM values less than 1.5.
With respect to joints, LTE assessment was performed based on FWD at joints between slabs (
Figure 9a) both longitudinally and transversely. The ability of adjacent slabs to distribute load is assessed through the LTE ratio, defined as:
where:
: deflection (μm) recorded in the loaded slab, normally under the FWD plate;
: deflection (μm) recorded in the adjacent unloaded slab, usually at a radial distance of 300 mm from the FWD plate center.
In addition, the presence of cracks at several locations (as indicatively shown in
Figure 8) stimulated the execution of additional FWD measurements. These were taken (i) around cracks (
Figure 9b) and (ii) directly on cracks (i.e., at a location where the crack was directly under the loading plate as per
Figure 9c), in order to evaluate the cracks’ LTE and how the pavement’s response differentiates because of cracking, respectively.
The second part of the NDT investigation included DCP measurements that were carried out at the coring locations.
3.4. Coring
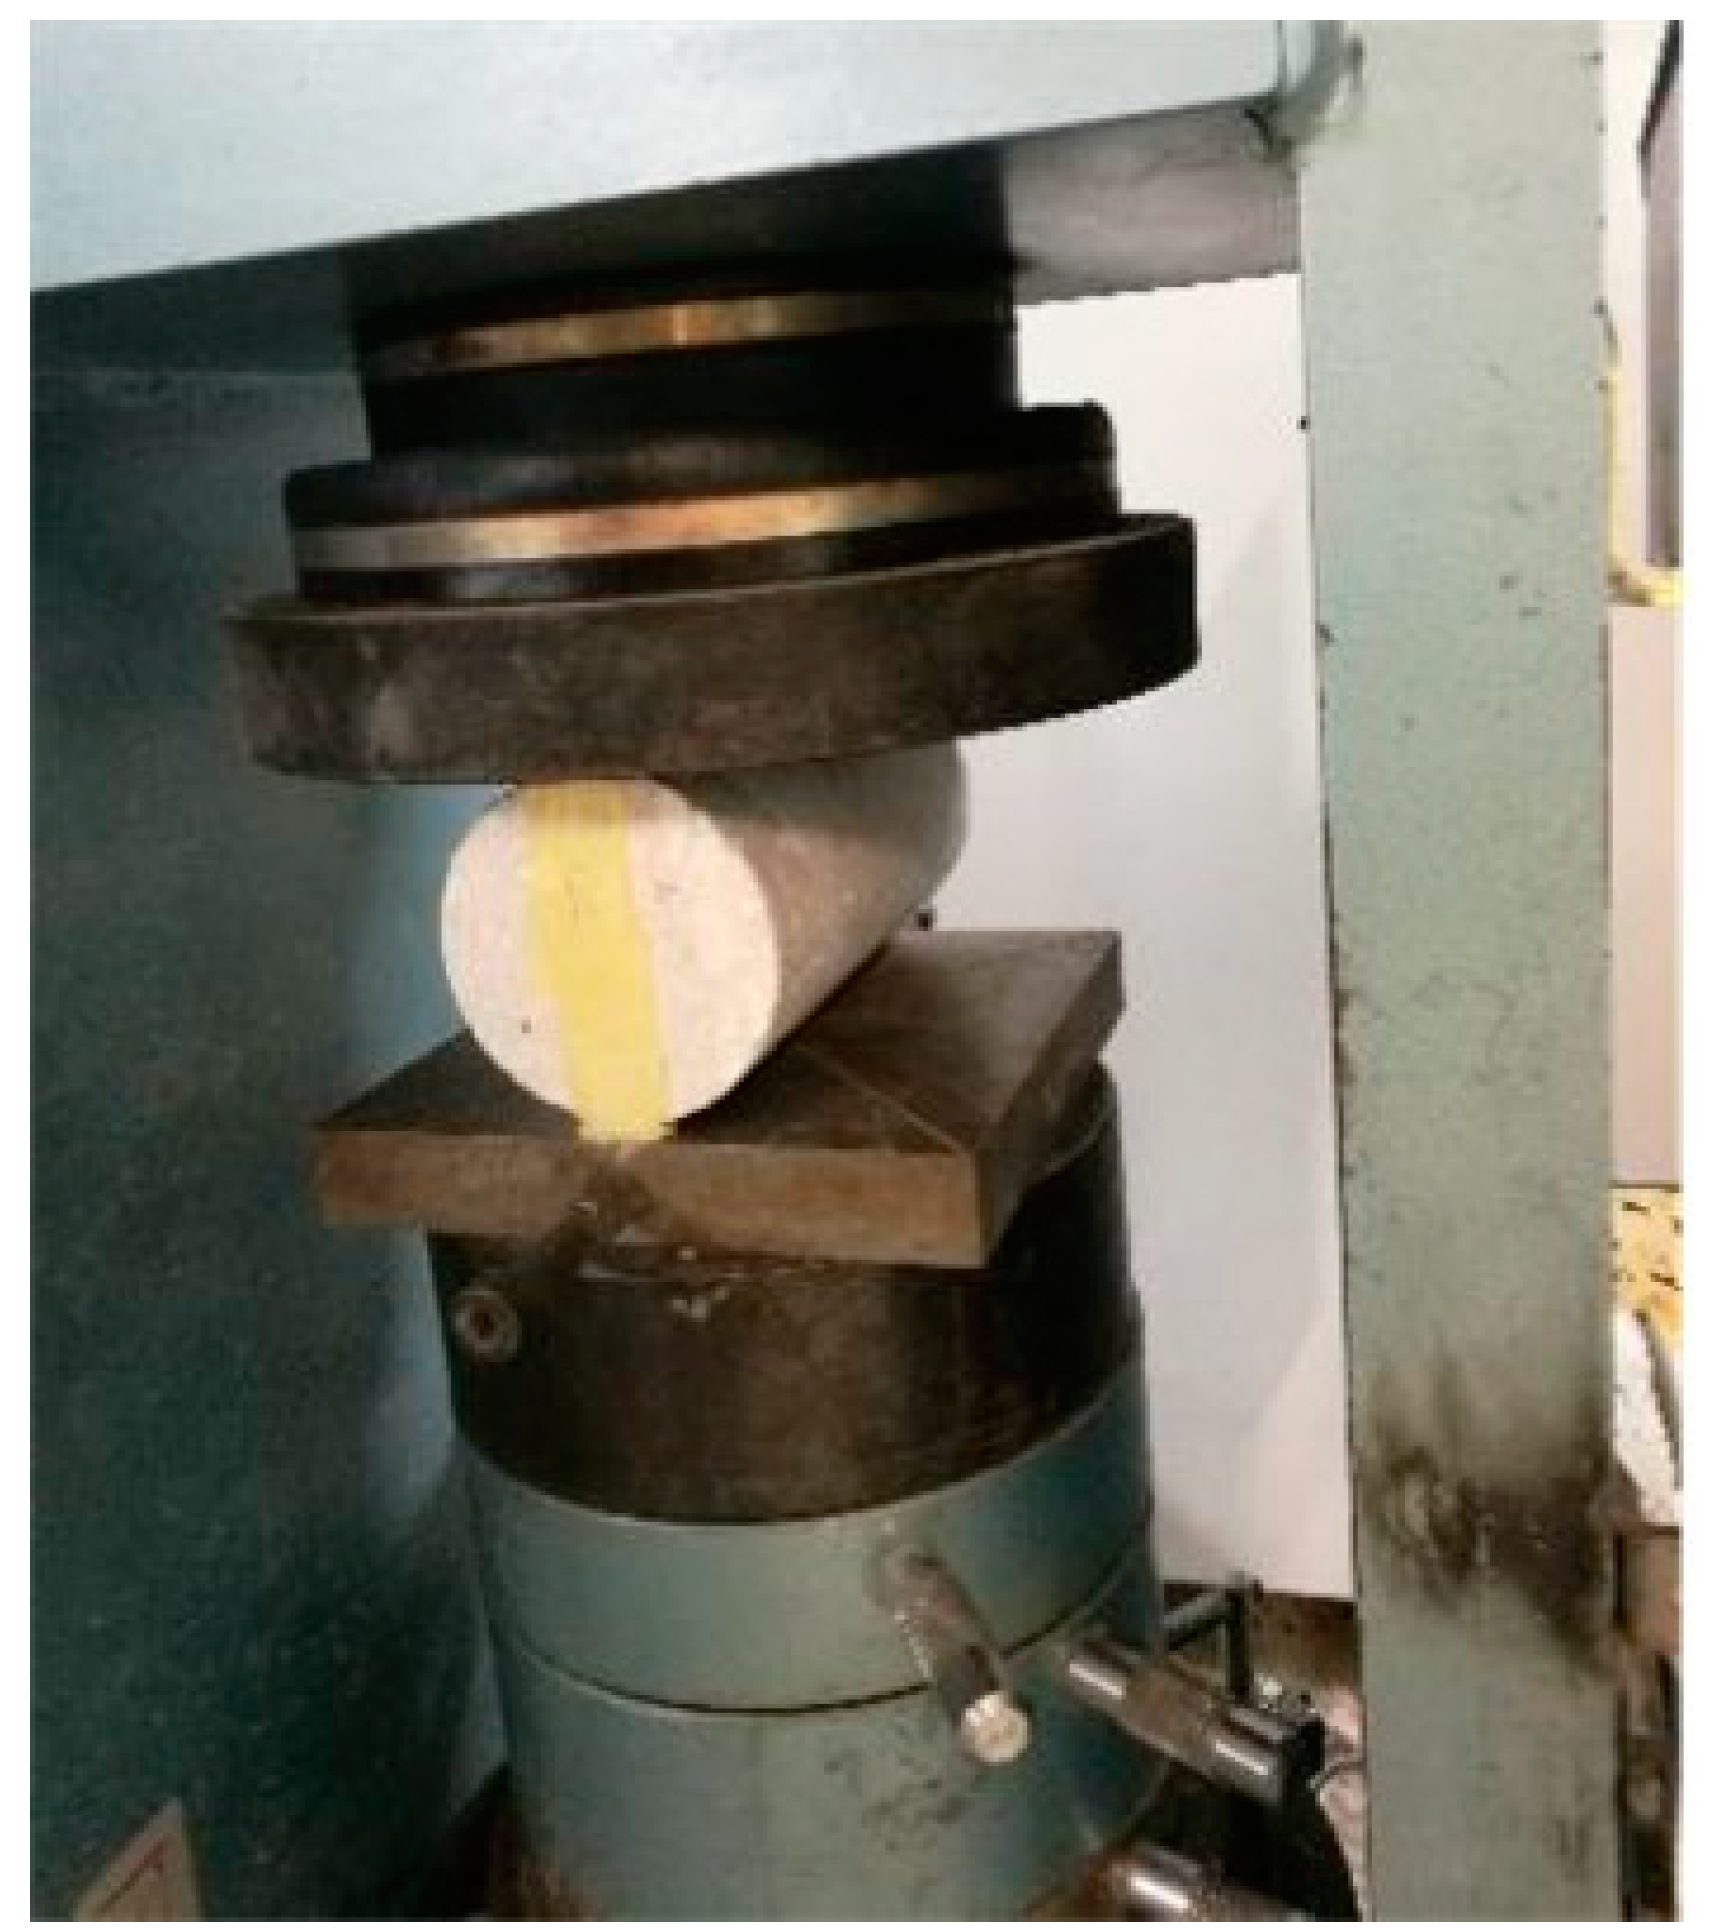
Besides data collection in the field, ten cores were extracted at several locations in order to cover the investigation area to the maximum possible extent. The purpose of coring was twofold. Firstly, pavement evaluation required the knowledge of the as-built material layer thicknesses in order to obtain a more complete understanding of a pavement’s behavior. Secondly, since pavement long-term performance strongly depends on concrete’s flexural strength, the extracted cores from intact locations (i.e., without cracks) were further tested in the laboratory to estimate concrete’s material characteristics. In particular, the cylindrical cores were subjected to a standardized test for the determination of the splitting strength [
29]. According to the Wykeham Farrance configuration shown in
Figure 10, a compressive loading rate of 0.7 kN/s was imposed on each tested core and the splitting tensile strength (
in MPa) was determined according to the following equation:
where:
Thereafter, based on correlation factors suggested from the international literature [
30,
31,
32,
33], both the tensile strength and the flexural strength can be estimated. The former provides indications for the concrete type utilized during the construction, whereas the latter can feed a more detailed performance analysis to evaluate the pavement damage potential.
3.5. Pavement Performance Analysis
As a final analysis step, pavement parameters defined from the individual parts of the investigation were used into a synthesized analysis approach aiming to evaluate the pavement performance because of the considered aircraft loads. Towards this, the most recent airfield pavement design and evaluation procedure developed by FAA [
15] was followed, which is implemented through the FAA Rigid and Flexible Iterative Elastic Layer Design (FAARFIELD 2.0) program [
34]. For this reason, a sensitivity analysis was performed based on the estimation of the Cumulative Damage Factor (CDF), which is expressed as the ratio of the applied load repetitions to the allowable load repetitions up to failure. For the estimation of the allowable load repetitions, the following failure model was used [
15]:
where:
SCI: Structural Condition Index;
DF: design factor defined as R/σ (R: concrete flexural strength and σ: computed concrete tensile stress);
FCAL: stress calibration factor;
F′s: stabilized base compensation factor;
C: coverages to failure;
a, b, c, d: parameters whose values depend on the subgrade modulus.
The analysis included different combinations of concrete layer thicknesses and concrete flexural strength in order to obtain a more holistic view on how damage could vary depending on the in-situ conditions.
4. Results
This section is divided into four subsections. The first one presents the concrete thickness data, the second one covers the analysis of field data and the third one presents the results from the laboratory investigation. Finally, the fourth one proceeds with data synthesis and analysis to assess the pavement’s performance in the expansion area.
4.1. Concrete Thickness
Based on the measured thicknesses from the extracted cores, an average thickness of 30.1 cm was found with a standard deviation of 3.2 cm. Although the average thickness was close to the design thickness, almost half of the cores had a lower thickness, and the lowest thickness was found to be 26 cm. Moreover, deficiencies in thickness have a negative effect on the performance of concrete pavements, something that was taken into consideration when assessing the NDT data.
4.2. Analysis of Nondestructive Data
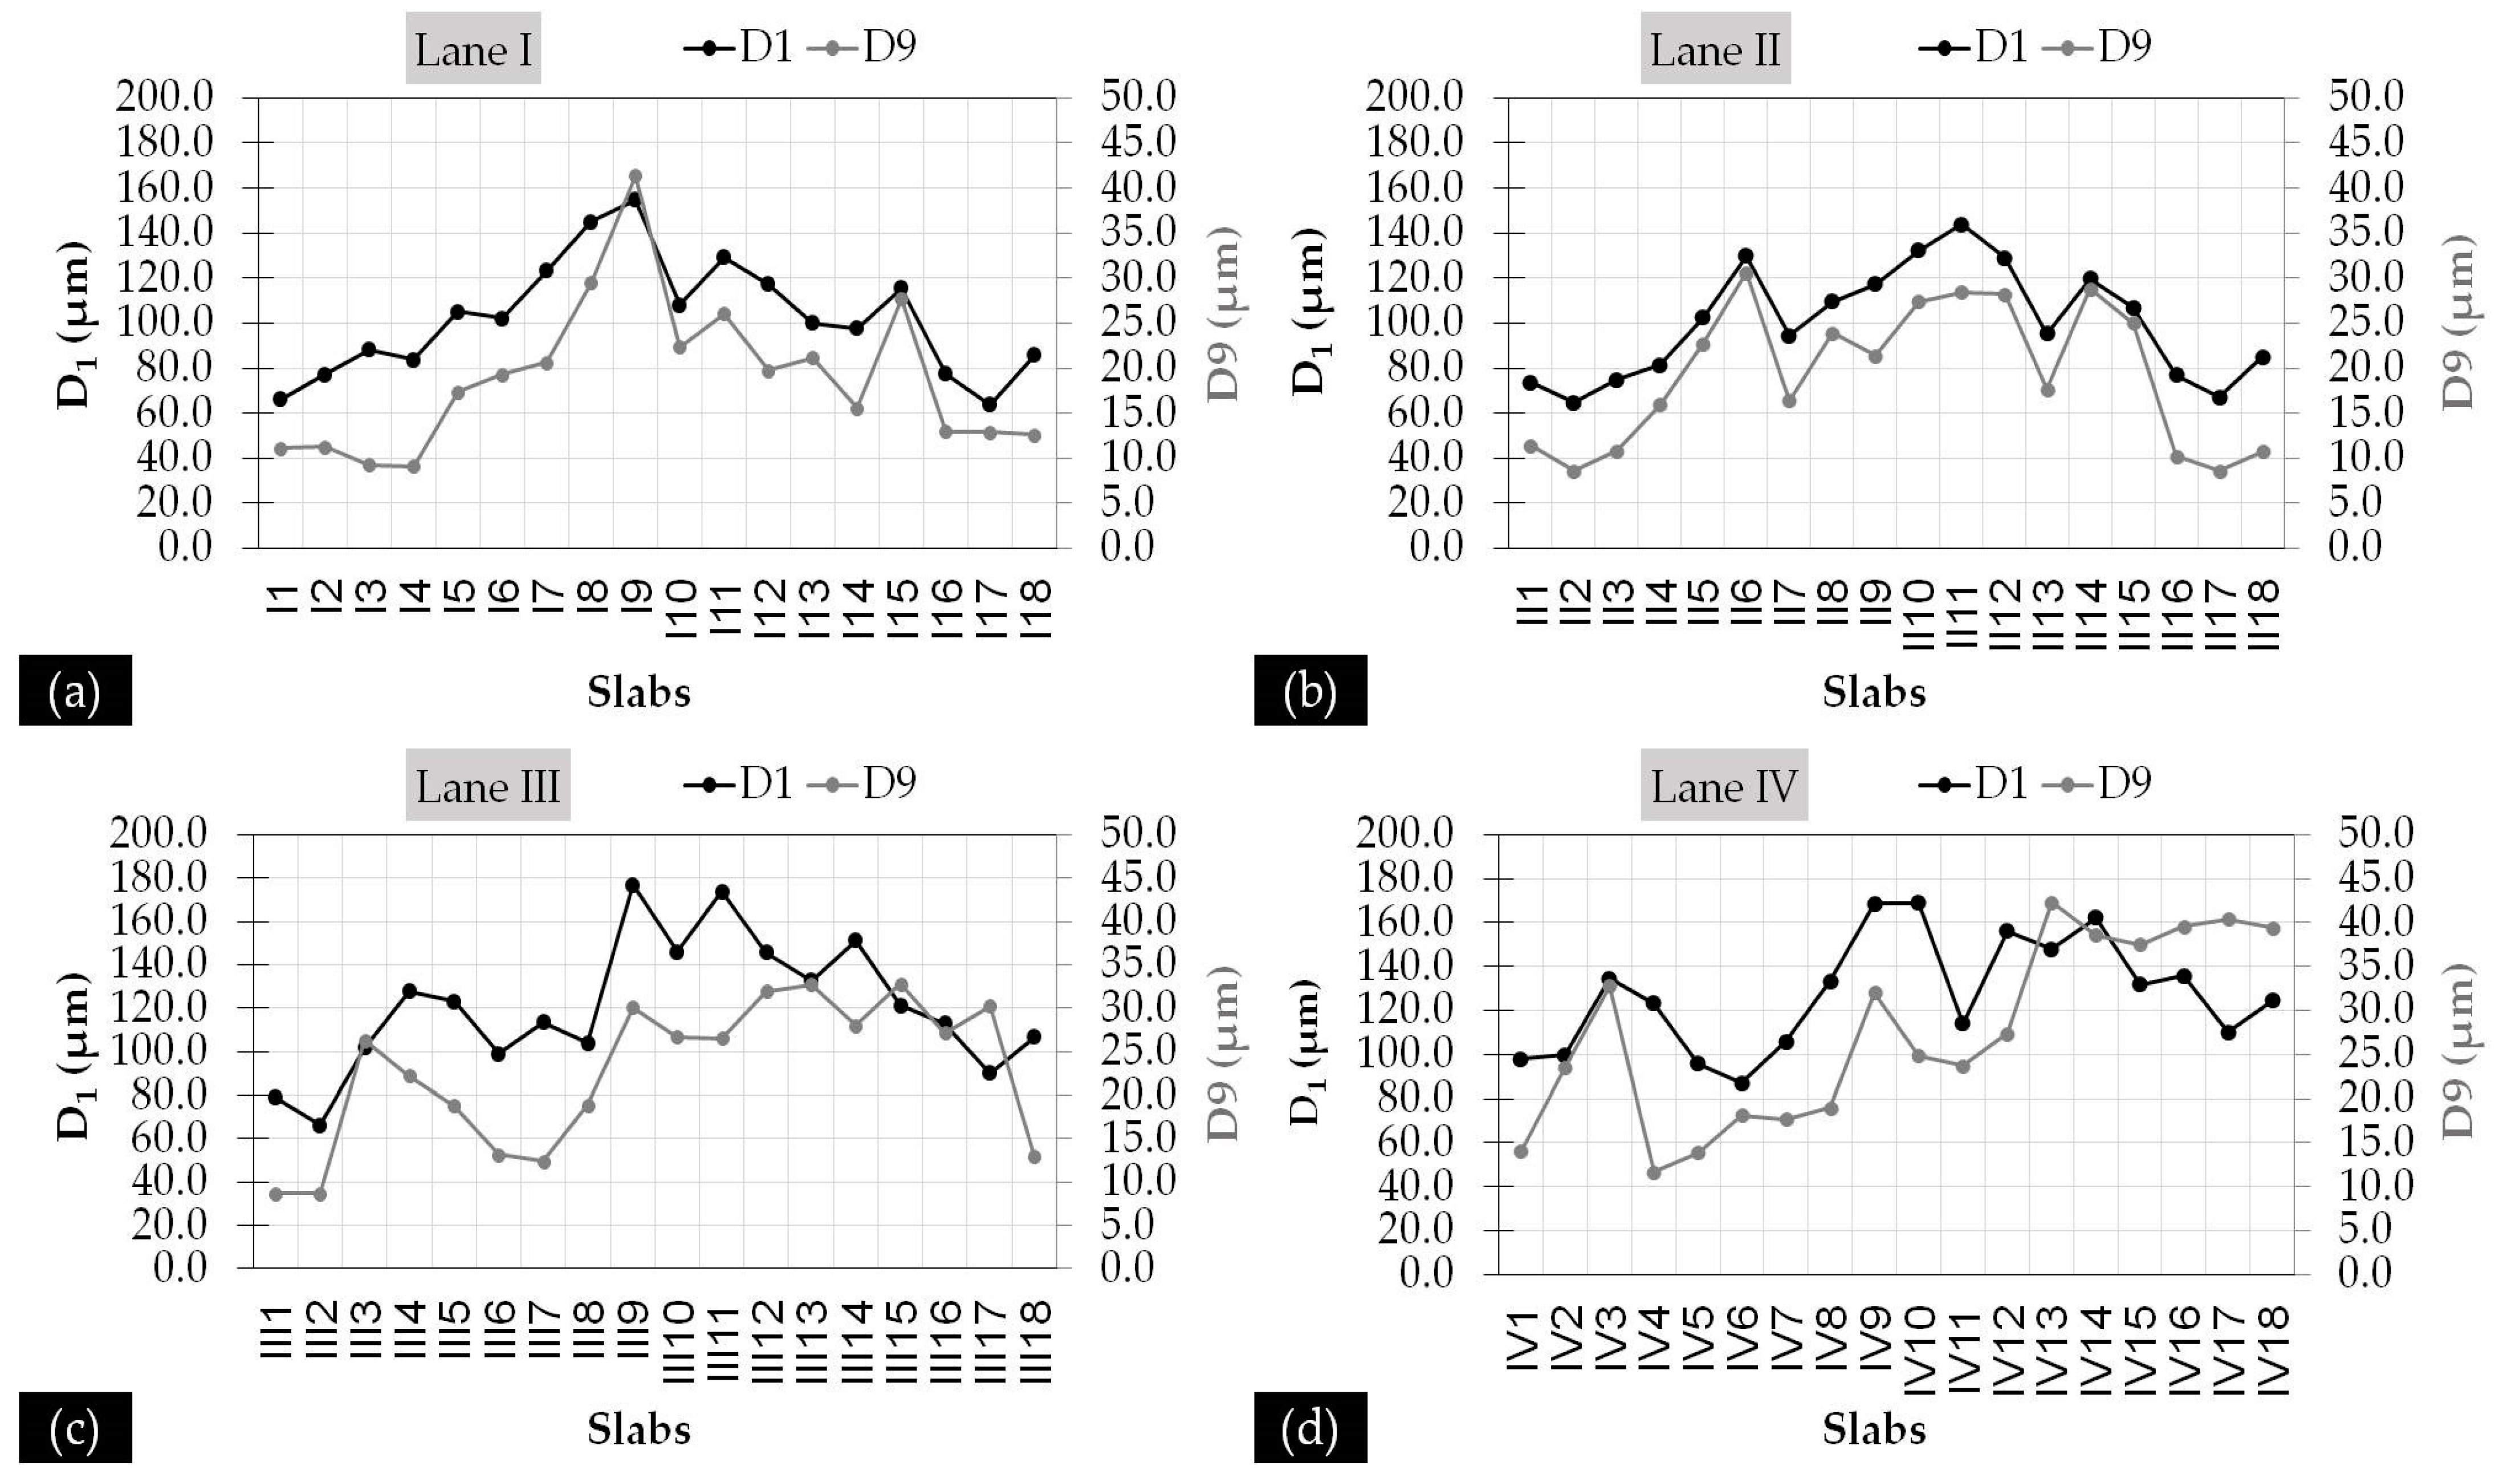
Defection records along the investigated slabs are given in
Figure 11, where the FWD deflection indexes D
1 and D
9 are given. D
1 is the deflection recorded at the center of the loading plate and reflects the overall pavement condition. D
9 is the deflection recorded from the outer geophone at a distance of 1800 mm from the center of the loading plate and reflects the pavement substructure condition.
Although the constructed pavement was not opened to aircraft loading at the time of the experiment, increased inhomogeneity was observed between the individual adjacent slabs. Based on
Table 2, CVs are unexpectedly high for both the deflection indexes of this new constructed pavement. High CVs might indicate either poor construction or thickness deficiencies that result in deflections with different orders of magnitude. This is something that highlights why pavement evaluation even at the early-life stages is indispensable. Besides, even if an airfield pavement is well-designed, the in-situ performance is detrimental for its real ability to sustain aircraft loads as well as for the deterioration rate over its lifespan. It is noted that cores intentionally taken at locations around slabs 8–12 (for all lanes), where both deflection indexes reach their maximum values, had indeed smaller concrete thicknesses with a profound negative impact on the pavement’s performance.
Moving forward with the evaluation of the FWD measurements at cracks, an increase in pavement response was observed for both cracks of small width (i.e., shrinkage cracks) and full-depth cracks of higher width. In particular, an increase of 16–44% and 86–123% was observed in the maximum deflection (index D1) for the previous crack categories, respectively. This comparison gives an estimation of the increase in pavement response because of cracks, and this makes sense by considering the response at the cracked slab’s center as reference. As such, the presence of cracks across the distressed slabs provided quantitative indications that the pavement could exhibit a poor pavement performance against aircraft loading.
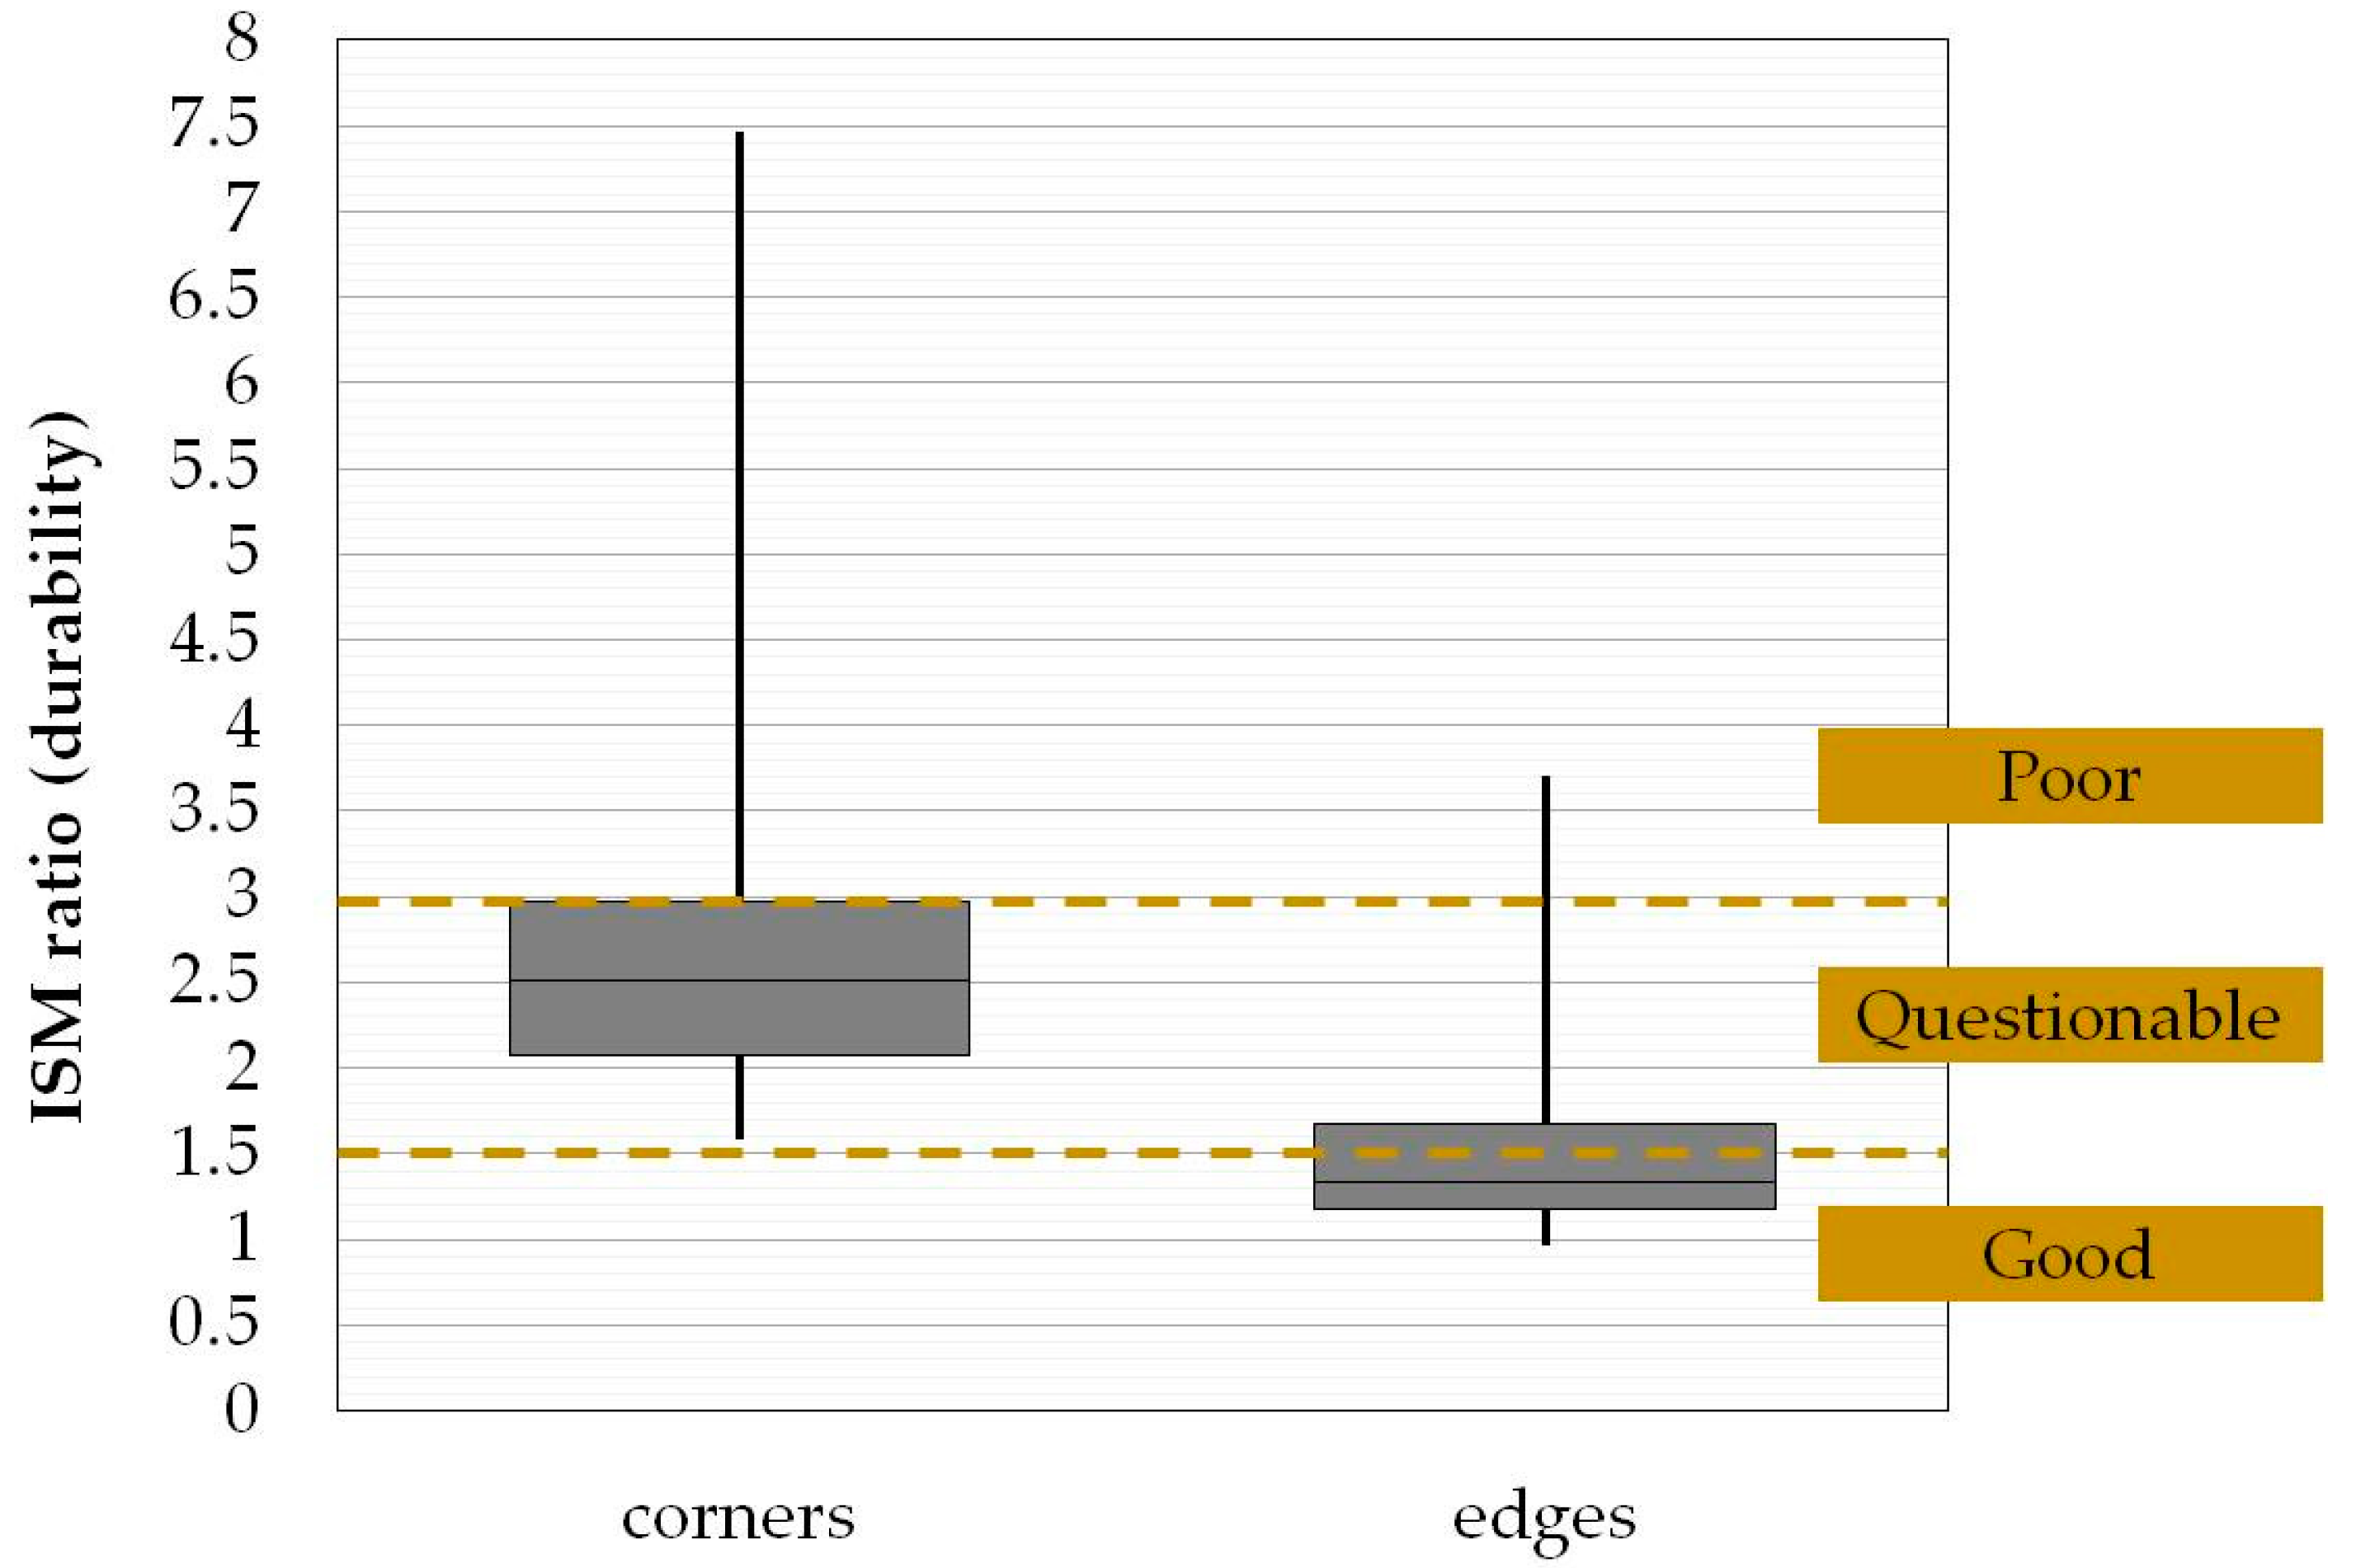
With respect to the durability assessment of the concrete pavement, ISM ratios are given in the form of boxplots in
Figure 12. The internal line in each boxplot corresponds to the median value of the tested sample. As can be seen, concrete durability at the corners is not satisfactory, while at the edges, the condition appears to be partially improved. In general, durability-related issues may be a result of improper mix composition, poor construction or presence of moisture beneath the slabs. Considering that the investigated pavement has not been given to traffic, the detection of durability-related aspects at this stage is an indication that such problems will be intensified in case of slabs’ exposure to aircraft loading in accordance with remarks from past studies [
21].
These remarks were strengthened considering the LTE assessment at joints and cracks. With respect to joints, sample measurements were made both longitudinally and transversely and the LTE results are given in
Figure 13. Longitudinal joints have a lower ability to transfer loading between adjacent slabs (transverse direction) compared to the transverse joints (longitudinal direction). Poor LTE in the transverse direction may be related to faulting issues [
35] that were also observed in the investigated pavement from the visual inspection process. However, low LTE at new pavements might not be a common issue. Moreover, further deterioration can be anticipated because of the aircraft movements, especially when the longitudinal axis of an aircraft becomes misaligned with the runway centerline. In such a case, the LTE transversely is expected to be critical.
LTE at cracks yielded a mean value of 81% around shrinkage cracks and a lowered value of 46% around wider cracks. The latter might indicate that cracked slabs tend to be divided into separate parts because of cracks and behave independently, something that could further deteriorate the pavement’s integrity in case of real aircraft loading.
Finally, with respect to the DCP investigation, some material inhomogeneity was detected that coincided with the variation in the D9 deflection index presented earlier. However, the minimum values observed for the estimated CBR index from DCP data indicated that the in-situ achieved mechanical characteristics of pavement substructure meet the design assumptions for both the pavement foundation layer and the subbase layer. Therefore, the rest of the investigation focused on the material of the surface layer (i.e., concrete).
4.3. Laboratory Findings
Based on the laboratory testing, an average splitting strength of 3.03MPa was found with a CV of 15% that indicated concrete material variability. In favor of safety, the minimum splitting strength of 2.83 MPa was considered as a characteristic value for the investigated pavement. Based on the characteristic splitting strength (
), the flexural strength (
) was estimated to be equal to 3.70 MPa (the average value was 3.90 MPa) according to the following equation, proposed by FAA [
15]:
It is noted that the flexural strength considered in the design was a bit higher and equal to 4.1 MPa. Finally, the tensile strength was estimated equal to 2.55 MPa, considering it as the 90% of the splitting strength [
30]. This value falls within the acceptable range of C30/37, although it approaches its lower level [
30].
4.4. Damage Analysis Results
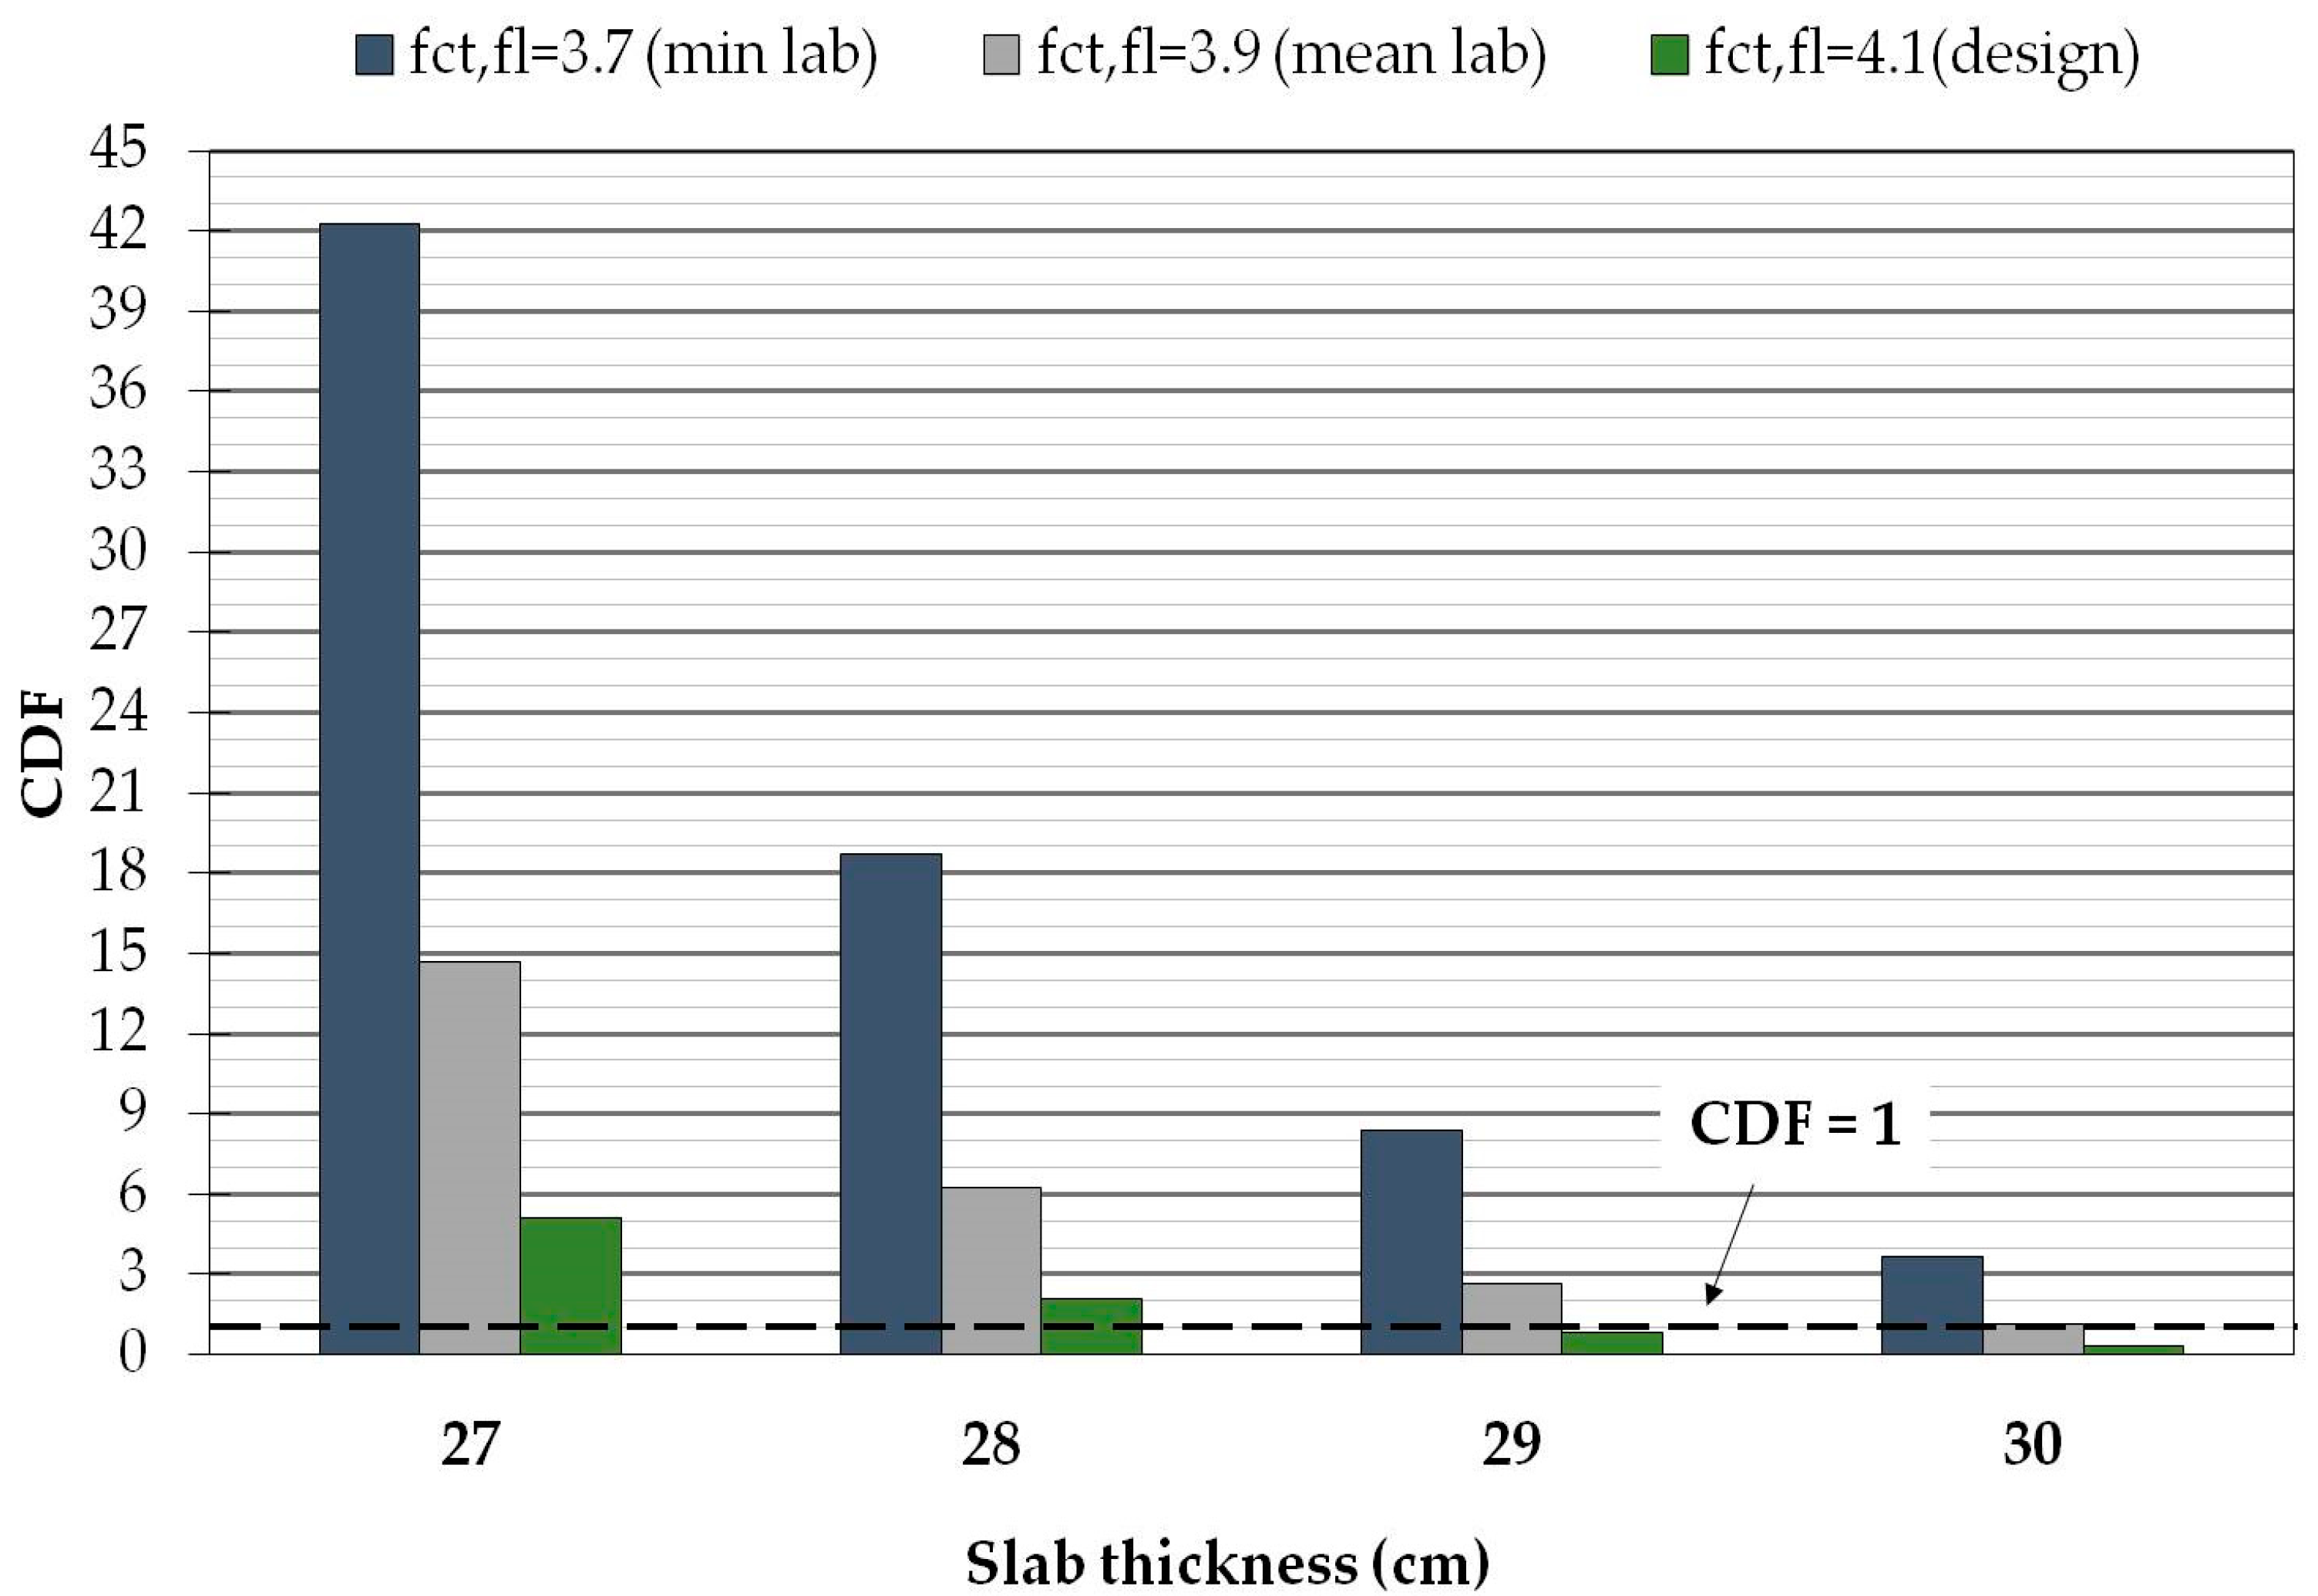
Until now, the analysis of the collected data yielded issues related to the surface layer’s performance in terms of both thickness and material variabilities, which were in turn reflected into inhomogeneous pavement responses to the FWD load. For the estimation of pavement damage, the sensitivity analysis was performed for concrete thicknesses ranging from 27 cm to 30 cm, since the mean value of the cores was 30 cm and the value corresponding to the mean minus one standard deviation was 27 cm. It is noted that according to the FAA, for a more conservative evaluation or design approach, it is recommended that the mean minus one standard deviation may be used for establishing design and evaluation inputs.
As far as the concrete flexural strength is concerned, three values were considered: the design value (4.1 MPa), the mean value based on laboratory testing on cores (3.9 MPa) and the minimum value (3.7 MPa). The rest of pavement parameters (i.e., subbase thickness, material strengths and aircraft loading) were considered with respect to pavement design. Therefore, the focus of the analysis was put on the impact of the concrete layer characteristics on the JPCP performance.
The analysis results are presented in
Figure 14 in terms of the predicted CDF. The analysis highlights the importance of appropriate selection of input values during the evaluation procedures. More specifically, the selection of mean values of concrete thickness (30 cm) and mean concrete strength (3.90) leads to adequate structural capacity of pavement, while the conservative selection of concrete thickness (mean minus one standard deviation) leads to extremely high CDF values.
Moreover, the combination of low concrete thickness (as observed indeed in some locations in the field) and low flexural strength exponentially increases the damage potential of the investigated airfield pavement, even at the stage where the pavement has faced no real aircraft loading. With this in mind, it appears that the combination of field and laboratory data may provide valuable information for concrete pavement condition assessment in the framework of appropriate airport maintenance prioritization.
5. Discussion Points
This section discusses the study’s significance, pinpoints related limitations and indicates some future prospects. In this study, the authors emphasized their research efforts at a new airfield concrete pavement assessment shortly after its construction. Although maintenance or rehabilitation actions normally become an issue for either highway or airport agencies after 5–6 years or so on [
36], the early-age pavement evaluation is of utmost importance for two dominant reasons. Firstly, pavement evaluation aims at a Quality Control (QC) assessment and secondly at the establishment of a reference status. This contributes to the development of a database that gets feedback from pavement monitoring processes, thereby enabling either a pavement performance prediction or rational decision-making for infrastructure management. The latter cannot be solely based on simple visual inspection processes, since either false interventions or even retarded interventions adversely affect an airport’s economics. Moreover, structural interventions in airfield pavement infrastructure are impractical and undesirable due to the constraints imposed to aircraft operations. As such, selecting the time and the type of intervention becomes critical for the long-term sustainability of the airfield infrastructures.
At the investigated test site, the increased deflection variability, even in this short investigation area, provided evidence of poor construction practices and/or poor material properties, considering that the pavement was non-trafficked at the time of evaluation. Variations were also noted within individual slabs, indicating problems with the durability of the JPCP section under investigation. Furthermore, low LTE values as well as low flexural strength of the concrete were consistent with the results of the advanced pavement failure analysis. As such, synthesis of the individual analysis results helped to provide a more holistic understanding of the in-situ pavement performance, which can vary significantly from what would be expected based on design specifications. It is noted that if the structural condition of this new pavement was satisfactory, supplementary investigation of the pavement’s surface condition (e.g., roughness or mean profile depth [
37]) should have taken place for the sake of completeness.
Furthermore, although at this stage a new pavement with some distresses was selected for the investigation, the developed approach is also applicable for in-service concrete pavements and acts as a guide for a continuous pavement structural monitoring that can ensure airfields’ efficiency in the long term. This is rather significant, since the structural integrity of airfield pavements guarantees their role as core parts of the critical transportation network. Structurally sound airfield pavements can increase interconnections between regional airports, boost tourist flows and even serve emergency societal needs at periods of crisis, including for example the management of migration flows [
8].
Of course, the procurement and transportation logistics of the NDT systems at multiple regional airports in a periodical basis as well as continuous coring might be critical limitations in the described evaluation processes [
36] that could limit the framework’s effectiveness for routine applications. In such cases, the use of the Synthetic Aperture Radar (SAR) technology can complement the overall process in terms of airfield infrastructure monitoring by indicating the need for ad-hoc and timely pavement monitoring with NDTs or coring in a more targeted and cost-effective way. SAR technology has become very popular during the last two decades and numerous applications exist in the domain of infrastructure engineering and monitoring [
38]. Recent advances of SAR applications in the domain of airfield engineering [
39] indicate a promising potential for a more systematic integration of SAR and other NDTs or destructive testing in the near future.
6. Conclusions
In the present study, a practical and methodological framework was developed for the assessment of airfield concrete pavements. Since pavement monitoring based solely on visual inspection findings can result, even at the early-life stages, in erroneous decision-making, the study highlighted the significant contribution of both field and laboratory data within pavement assessment procedures. In particular, the proposed framework includes:
NDT measurements to assess the in-situ pavement response characteristics;
Sample core extraction to assess thickness variability and feed FAA analysis procedures with the required material input retrieved in the laboratory;
Pavement performance analysis to evaluate the damage potential against predefined aircraft loading for variable combinations of concrete thickness and strength that can be encountered in the field.
To sum up, the integration of multiple data (e.g., deflections, LTE, thicknesses and flexural strength) can provide the related airport authorities the necessary information in order to make a rational asset management. Furthermore, the authorities can use this integration as a powerful engineering tool to draw their maintenance or rehabilitation strategies considering both the need for safe aircraft operations and the strong impact of the socioeconomic factor of airfield infrastructures.


