1. Introduction
To minimize the life cycle cost (LCC) of building and maintaining pavements, it is critical to determine the most appropriate pavement thickness for the given traffic level, subgrade condition and environmental factor. It is essential to evaluate the impacts of design on construction and maintenance, in order to obtain minimum pavement life-cycle costs. [
1]. Main objective of this research is to provide pavement managers with a tool which performs a pavement thickness design sensitivity analysis on the fly, which would result in the minimum LCC of pavements.
There exist a number of pavement design software packages that generate different thicknesses for the given conditions. Most of these pavement design software packages do not give the user an option to perform the design sensitivity analysis by automatically varying input values. Therefore, the impact of each design parameter on pavement design is not transparent to a user. Therefore, there is a critical need for comparing these existing pavement design software packages and identifying the critical design input parameters through the design sensitivity analysis process.
First, the following two pavement design software packages were evaluated with respect to how they are different in determining design input parameters and their influences on the pavement thicknesses: the StreetPave software, based on the American Concrete Pavement Association (ACPA) thickness design for concrete highway and street pavements, and the Portland Cement Association (PCA) method, and the WinPAS software based on the ASSHTO 1993 pavement design guide. Second, pavement designs were generated by running these pavement design software packages by varying input parameters, and they were stored in the database. Third, the pavement design and sensitivity analysis (PDSA) software was developed to retrieve the pavement design data from the database and perform a sensitivity analysis by varying design input parameters.
Recently, the pavement design system for new and existing asphalt pavements (PADAP) was developed aiming for designing new pavements and the rehabilitation of existing ones, considering axle loads, environmental conditions and seasonal nonlinear material properties of unbound granular layers and subgrade soils [
2]. The Federal Aviation Administration (FAA) developed the airfield pavement design software named FAARFIELD (FAA Rigid and Flexible Iterative Elastic Layered Design), which incorporated a three-dimensional finite element (3D-FE) stress computation for the design of new rigid pavements [
3]. The sensitivity analysis has been performed to compare this FAARFIELD design method against the previously developed design method, LEDFAA (Layered Elastic Design FAA) [
4].
Recently, new pavement design software was developed based on the 2002 Mechanistic-Empirical Pavement Design Guide (M-EPDG) [
5], and initial efforts have been made to perform a sensitivity analysis of pavement response to properties of the unbound layer [
6]. A sensitivity analysis of distress prediction models has been performed for jointed plain concrete pavement [
7]. When compared to the 1993 AASHTO guide, M-EPDG software underestimated the performance of pavements in warm geographic locations [
8]. Based on another sensitivity analysis, the base resilient modulus and thickness and subgrade resilient modulus exhibited a significant influence on longitudinal and alligator cracking [
9]. When the M-EPDG results were compared against the site-specific input data, the predicted rut depth was quite close to the measured rut depth [
10]. Based on the sensitivity and analysis, the StormPav composite pavement was more resistant to fatigue and rutting than typical asphalt and concrete pavements [
11].
Although numerous sensitivity analyses have been performed in the past, their sensitivity analysis results are not readily available for others. They ran the pavement design software a number of times to identify the sensitivity of each parameter, but none of them produced a sensitivity analysis tool where a pavement manager can instantaneously retrieve the sensitivity analysis result against each design parameter from the database. This paper presents the smart pavement design and sensitivity analysis (PDSA) software which would allow pavement designers to quickly evaluate different levels of influence of each design parameter on pavement thicknesses.
2. Survey of Adjoining Five States about Pavement Design Procedures for Low-Volume Roads
AASHTO 1993 pavement design guide lists a minimum asphalt pavement thickness as 1.0 inch and the minimum concrete pavement thickness as 5.0 inches for the lowest traffic level, ranging from 50,000 to 100,000 equivalent single axle loads (ESALs). However, for the similar traffic level, the asphalt institute recommends a minimum of 3.0 inches for asphalt pavement and the PCA recommends a minimum of 7.0 inches of concrete pavement. ACPA recommends a lower limit for concrete pavement thickness of 4.0 inches for automobiles and 5.0 inches for limited truck traffic. According to the ACPA design table, a minimum concrete pavement thickness for a light residential street is 4.0 inches.
To learn more about pavement design procedures for the low volume roads, five adjoining state departments of transportation (Minnesota, Wisconsin, Illinois, Missouri and South Dakota) were surveyed. As shown in
Table 1, a questionnaire was prepared to identify pavement thickness design methods and their common input parameters for local roads. The survey responses from five state Departments of Transportation (DOT) are summarized in
Table 2. As can be seen from
Table 2, five states differ in pavement design procedures, typical pavement design thicknesses, and reliability factors. However, they agreed on the important design factors as traffic loading and subgrade. These survey results have been used to identify the critical pavement design input parameters, and their ranges of typical values.
3. Sensitivity Analysis of Design Input Parameters for StreetPave and WinPAS
The following two pavement design software packages were evaluated on how they are different in inputting design input parameters and their influences on the pavement thickness: StreetPave and WinPAS software. The StreetPave is concrete pavement thickness design software developed by ACPA [
12]. ACPA later incorporated an asphalt pavement design process based on the Asphalt Institute method, to generate an equivalent asphalt design for the given load carrying capacity requirement. The WinPAS software performs pavement thickness design based on the AASHTO 1993 pavement design guide [
13]. As shown in
Figure 1, four critical design input parameters were identified, and the sensitivity analysis of each parameter was performed using each of two pavement design software packages. Typical design input parameters were input into both StreetPave and WinPAS software, and the sensitivity analyses of various pavement design parameters have been performed.
3.1. Design Input Parameters
The input design parameters that affect the pavement thickness the most were identified as a design life, a truck traffic volume, a reliability and a soil support. A design life is selected as either 20 or 40 years and a reliability is selected as 50%, 80%, or 90%, which are the typical minimum and maximum ranges for local streets. For a reliability, additional value of 80% was added to determine if the impacts of reliability values would be nonlinear. The WinPAS, which is based on the AASHTO 1993 pavement design guide, accepts a reliability directly into the design equation. A reliability is adopted for StreetPave by applying a reliability to the flexural fatigue equation for concrete pavements, and to the resilient modulus of the subgrade for asphalt pavements. A truck traffic volume was selected to represent various traffic loading levels, which were converted to the equivalent single axle load (ESAL) as a design input. Typical truck traffic volume is estimated for each functional classification of roads by multiplying typical average daily traffic (ADT) and a typical percentage of trucks.
Table 3 shows the typical average daily truck traffic (ADTT) values as a traffic input parameter.
Each software package uses different terms in determining the subgrade strength; resilient modulus (MR) for StreetPave software and k-value for WinPAS software. The k-value is determined based on the plate bearing test. Four typical CBR values of 3, 5, 7, and 11 were converted to MR values of 4118 psi, 5842 psi, 7355 psi and 10,022 psi for StreetPave, based on the equation of MR = 1941.488 *CBR0.6844709, and to k-values of 100 pci, 134 pci, 162 pci and 210 pci, for WinPAS, based on an equation of k-value = 53.438 CBR0.5719, respectively.
3.2. Pavement Design Sensitivity Analysis Results
As summarized in
Table 4, WinPAS software provided a slightly wider range of concrete pavement thickness than StreetPave software, whereas StreetPave provided a wider range of asphalt pavement thickness than WinPAS. The impact of subgrade strength on concrete thickness was similar for both StreetPave and WinPAS software. For both StreetPave and WinPAS software, the increased subgrade strength decreased the concrete pavement thickness by less than 1.0 inch and asphalt pavement thickness by 3.0 inches. As shown in
Table 4, when the design life was doubled from 20 to 40 years, StreetPave software increased the thickness by 0.25 inch, but WinPAS software increased the thickness by 1.25 inches. Moreover, in SreetPave, a traffic level exhibited a higher impact on asphalt pavement thickness; up to 2.0 inch more than in WinPAS.
Given 80% reliability and 20-year design life, using WinPAS and StreetPave,
Figure 2a,b show concrete pavement thicknesses under low vs. high traffic volumes, for low and high subgrade strengths, respectively. As shown in
Figure 2a, for the low subgrade strength level, both StreetPave and WinPAS recommended nearly identical concrete pavement thickness. However, for the higher subgrade strength, as shown in
Figure 2b, the WinPAS recommended a thicker concrete pavement by 0.5 inch. Overall, the impact of subgrade strength on concrete pavement thickness is greater with StreetPave than WinPAS.
Given the 80% reliability and 20-year design life, using WinPAS and StreetPave,
Figure 3a,b show asphalt pavement thicknesses under low vs. high traffic volumes for low and high subgrade strengths, respectively. As can be seen from
Figure 3, WinPAS recommended slightly higher asphalt pavement thicknesses than the StreetPave, except for a condition with a low subgrade strength and a high traffic volume.
4. Pavement Design Sensitivity Analysis Software
The proposed pavement design sensitivity analysis (PDSA) software is a computer program that combines pavement design function and sensitivity analysis capability. The PDSA software consists of four modules: input pavement design data, asphalt pavement design, concrete pavement design, and design sensitivity analysis. The design data input module provides a spreadsheet user interface to input design data. The asphalt and concrete pavement design modules provide the user with a tool to query the design database. The sensitivity analysis module provides a graphic user interface to run a design sensitivity analysis for various input parameters.
4.1. PDSA Database Structure
The PDSA software stores the pavement design data in a Microsoft Access format.
Figure 4 shows database entities, attributes, and their relationship, that consists of the main tbDesign table with associated tables, which include tbPavementProperty, tbSubbaseCondition, tbDesignLife, tbTraffic and tbReliability. The tbPavementProperty table stores the basic structural properties of a pavement, including a tbLayer subtable, where the pavement layer data associated with the pavement structure are stored. Similarly, the tbSubbaseCondition, tbTraffic, tbDesignLife, and tbReliability tables are designed to store information about subbase, traffic, design life, and reliability factors, respectively. With an integrated database, the stored pavement design data can easily be retrieved for various design parameters, such as subgrade strength and traffic level.
4.2. PDSA Software Flowchart
With an integrated database, the entered data can be reused for various pavement design conditions. Thus, a user is not required to input the same data repeatedly in contrast to other pavement design software packages, most of which do not utilize a database. The pavement design results generated from various pavement design software packages can be saved in the separate databases, and utilized later for pavement design and sensitivity analysis.
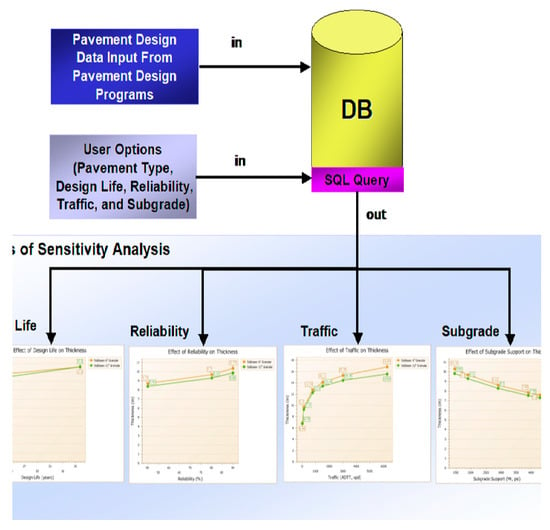
Figure 5 shows a flow chart for inputting the pavement design data and running a sensitivity analysis. First, the pavement design data obtained by running various pavement design software packages should be entered into the pavement design database. Once the pavement design data is saved in the database, the user can then select design input parameters, such as pavement type, design life, reliability, traffic, and subgrade conditions. The PDSA software runs the structured query language (SQL) query based on the user selections, and then displays sensitivity analysis results for the user to review the sensitivity of the input parameters.
4.3. Pavement Design Data Input Module
The pavement design result generated from other pavement design software packages can be stored in the PDSA database and retrieved later for pavement design and sensitivity analysis. The pavement design data obtained by running various pavement design software packages can be entered into the PDSA pavement design database from the pavement design data input module. As shown in
Figure 6, the input screen is designed for a user to enter pavement design data into the database. Once the pavement design data is saved in the database, the user can then retrieve the most appropriate design, given design input parameters such as pavement type, design life, reliability, traffic, and subgrade conditions.
4.4. Asphalt and Concrete Pavement Thickness Design Modules
After entering all the design data into the database, when a user enters the design input parameters such as traffic, subgrade strength, etc., the PDSA software retrieves the most appropriate pavement thickness from the database for the given condition. As shown in
Figure 7, both asphalt and concrete pavement thickness design modules include input screens, to allow a user to input project information and design parameters such as design life, reliability, traffic, and subgrade conditions. Once a user provides necessary input values and chooses the pavement design method, the pavement thickness is displayed by retrieving the most appropriate pavement design value from the database. The project information, design inputs and the design output can then be printed in a report format.
4.5. Pavement Design Input for Sensitivity Analysis Module
Since the pavement design data are already stored in the database, the user can perform the sensitivity analysis instantaneously against pavement design parameters such as design life, reliability, traffic level and subgrade condition. The PDSA software produces a plot of multiple design thicknesses for various input parameters that would allow a user to consider different thicknesses for varying input values. The PDSA software works as a design database and provides the user with an easy-to-use design and sensitivity analysis tool.
Figure 8,
Figure 9,
Figure 10 and
Figure 11 show a sensitivity analysis result, to illustrate the influence of the design life, reliability, traffic, and subgrade support on the asphalt pavement thickness, respectively. Default values for the design parameters are a design life of 20 years, an AATT of 100, a reliability of 80%, and a soil support value of 2900 psi. For all sensitivity analyses, granular subbase thicknesses are assumed as 6 or 12 inches. By clicking on the tab on the top of the main screen, the sensitivity analysis result based on other input parameters such as design life, traffic level and soil condition can be instantaneously displayed.
As shown in
Figure 8, for a 20-year design period, the asphalt pavement thicknesses are 8.3 and 8.62 inches when a granular subbase thicknesses are 12 inches and 6 inches, respectively. However, when the design life is increased from 20 to 40 years, both asphalt pavement thicknesses are 9.64 inches. Based on this sensitivity analysis, for a small increase in asphalt pavement thickness by 1.34 or 1.02 inches, the design life can be doubled from 20 to 40 years. It can be concluded that, for a 40-year design, there is no need to increase a subbase thickness from 6 to 12 inches.
As shown in
Figure 9, for 50% reliability, the asphalt pavement thicknesses are 7.31 and 7.6 inches when granular subbase thicknesses are 12 inches and 6 inches, respectively. However, when the reliability is increased from 50% to 90%, asphalt pavement thicknesses are 8.98 and 9.34 inches for 12- and 6-inch subbase thicknesses, respectively. Based on this sensitivity analysis, the effect of reliability is quite significant, by increasing the thickness by 1.7 inches when a reliability was increased from 50% to 90%.
As shown in
Figure 10, for a very low truck traffic volume, the asphalt pavement thicknesses are 5.26 and 5.34 inches when the granular subbase thicknesses are 12 inches and 6 inches, respectively. However, when the ADTT is increased to 800, asphalt pavement thicknesses are more than doubled to 11.77 and 12.11 inches, for 12- and 6-inch subbase thicknesses, respectively. When the ADTT is increased up to 6200, the asphalt pavement thicknesses gradually increased. Based on this sensitivity analysis, the effect of truck traffic volume is very significant, increasing the thickness by up to 11 inches.
As shown in
Figure 11, for a very week soil resilient modulus of 1450 psi, the asphalt pavement thicknesses are 9.84 and 10.32 inches when the granular subbase thicknesses are 12 inches and 6 inches, respectively. However, when the soil strength is tripled to 4350 psi, asphalt pavement thicknesses are decreased to 7.3 and 7.6 inches for 12 and 6-inch subbase thicknesses, respectively. Based on this sensitivity analysis, the effect of soil strength is significant, decreasing the thickness by up to 2.7 inches.
The above four design sensitivity scenarios are for illustration purposes only, and they may not represent all field conditions. For example, as shown in
Figure 11, the asphalt pavement thickness decreases linearly as the subgrade support value increases. It should be noted that this linear relationship is valid only for given traffic, reliability and design life. Among four design parameters, it can be concluded that the truck traffic volume has the highest impact on the asphalt pavement thickness.
5. Summary and Conclusions
This paper discusses how two existing pavement design software packages are different in accepting various design input parameters and their influences on the pavement thickness. StreetPave software designs the concrete pavement thickness based on the PCA method and the equivalent asphalt pavement thickness. The WinPAS software performs concrete and asphalt pavement designs, following the AASHTO 1993 design method. Both software packages were run for various input parameters, such as traffic, subgrade strength, reliability, and design life. The sensitivity analyses of various design input parameters have been performed by using these pavement design software packages to identify which input parameters are most influential on the pavement thickness. Overall, the traffic load has the highest impact on pavement thicknesses, followed by the subgrade strength, reliability and design life.
The design results from StreetPave and WinPAS software were compared with regards to how they are different in determining design input parameter values and their influences on the pavement thickness. For the same input parameters, StreetPave software recommended a thicker asphalt pavement than WinPAS. For the high subgrade strength and low traffic volume, however, WinPAS software recommended a thicker asphalt pavement than the StreetPave. A sensitivity analysis revealed that these pavement design software packages may recommend slightly different pavement thicknesses for a similar condition.
There are numerous pavement design software packages available, but none of them have the capability of storing the pavement design thicknesses for the future use of similar conditions or perform the design sensitivity analysis. Most pavement design software packages allow a user to design one pavement section at a time, and some software takes extensive time to run. To expedite the pavement design and sensitivity analysis, a smart pavement design sensitivity analysis (PDSA) software was developed.
The PDSA is a database system, where a user can retrieve previously run design data using various pavement design software packages. Since the pavement input data can be categorized in finite number, say up to five categories, there is a finite set of input data sets. Therefore, all input data sets can be run beforehand, and the pavement design results can be stored in the database for a quick retrieval of the most appropriate pavement thickness and an on-the-fly sensitivity analysis of various design parameters.
Based on the current pavement design procedures and sensitivity analysis results, the PDSA software package was developed to allow a user to immediately perform pavement design sensitivity analysis. The PDSA is designed for a user to input pavement design data from different pavement design software packages. The PDSA software is not a tool to help a user select pavement design software, but a computer program that stores pavement design results from various pavement design software packages in a database, so that a user can retrieve the most appropriate pavement thickness for a given condition. The PDSA is an effective tool for managing pavements, by performing a design sensitivity analysis of various design parameters. The PDSA software presented in this paper will revolutionize the way the pavement design and sensitivity analysis will be performed in the future. The outcome of the pavement design sensitivity analysis is to minimize the LCC of pavements by determining the impacts of critical design parameters on the pavement thicknesses.
6. Recommendations for Future Study
Based on the limited research, the following recommendations are made for future study:
Traffic mix, ESAL conversion factor, and the equivalency of subgrade strengths should be investigated, to ensure the design inputs for each software package would represent the equivalent traffic level and subgrade strength. Traffic mix and its conversion to ESAL should be clarified to determine their effects on the pavement thickness.
An additional sensitivity analysis using M-EPDG and Asphalt Institute software should be performed, to be compared against the sensitivity analysis results from the StreetPave and WinPAS software packages.
PDSA software should be modified to add more design input parameters, i.e., edge support and dowel bar, and update the sensitivity analysis results from the M-EPDG and Asphalt Institute software packages.
The PDSA software should be improved, to show the sensitivity analysis of different pavement design values generated by various pavement design software packages on the same screen.
The PDSA software should provide a user with an idea regarding which pavement design software to select.
Author Contributions
The authors confirm contribution to the paper as follows: study conception and design: H.L., J.K.; data collection: B.M., J.K.; analysis and interpretation of results: B.M., H.L.; draft manuscript preparation: B.M., J.K. and H.L. All authors reviewed the results and approved the final version of the manuscript.
Funding
This research received external funding support from the Iowa Highway Research Board.
Acknowledgments
The authors would like to thank the financial support provided by the Iowa Highway Research Board and the members of the Technical Advisory Committee for their guidance throughout the project.
Conflicts of Interest
The authors declare no conflict of interest.
Disclaimer Notice
The contents of this paper reflect the views of the authors, who are responsible for the facts and the accuracy of the information presented herein. The opinions, findings, and conclusions expressed in this paper are those of the authors and not necessarily those of the sponsors. The sponsors assume no liability for the contents or use of the information contained in this document.
References
- Babashamsi, P.; Yusoff, N.I.M.; Ceylan, H.; Nor, N.G.M.; Jenatabadi, H.S. Evaluation of pavement life cycle cost analysis: Review and analysis. Int. J. Pavement Res. Technol. 2016, 9, 241–254. [Google Scholar] [CrossRef]
- Uddin, W.; Ricalde, L. An Environmental and Load Simulation Software for Designing Longer Lasting Asphalt Highways. In Proceedings of the Infrastructure and Transportation, Memphis Area Engineering Societies Conference (MAESC), Memphis, TN, USA, 11 May 2000. [Google Scholar]
- Brill, D.R.; Kawa, I.; Hayhoe, G.F. Development of FAARFIELD Airport Pavement Design Software. In Transportation Systems 2004 Workshop; U.S. Army Corps of Engineers: Ft. Lauderdale, FL, USA, 2004. [Google Scholar]
- McQueen, R.D.; Guo, E.H. Sensitivity Analysis of Major Parameters in Rigid Pavement Design Procedures. In Transportation Systems 2004 Workshop; U.S. Army Corps of Engineers: Ft. Lauderdale, FL, USA, 2004. [Google Scholar]
- ARA, Inc.; ERES Consultants Division. NCHRP 1-37A: Guide for Mechanistic-Empirical Design of New and Rehabilitated Pavement Structures; National Cooperative Highway Research Program, TRB; National Research Council: Washington, DC, USA, 2004. [Google Scholar]
- Masad, S.; Little, D.N. Sensitivity Analysis of Flexible Pavement Response and AASHTO 2002 Design Guide to Properties of Unbound Layers; ICAR-504-1; International Center for Aggregates Research: Austin, TX, USA, 2004. [Google Scholar]
- Kannekanti, V.; Harvey, J. Sensitivity Analysis of 2002 Design Guide Distress Prediction Models for Jointed Plain Concrete Pavement; Transportation Research Record 1947, TRB; National Research Council: Washington, DC, USA, 2007; pp. 91–100. [Google Scholar]
- Schwartz, C.W. Implementation of the NCHRP 1-37A Design Guide Final Report Volume 1: Summary of Findings and Implementation Plan; MDSHA Project No. SP0077B41 UMD FRS No. 430572; The University of Maryland: Lutherville, MD, USA, 2007. [Google Scholar]
- Li, R. Sensitivity Evaluation of the Mechanistic-Empirical Pavement Design Guide (MEPDG) for Flexible Pavement Performance Prediction. Ph. D. Thesis, University of Maryland, College Park, MD, USA, 2013. [Google Scholar]
- Hossain, N.; Singh, D.; Zaman, M. Sensitivity of traffic input parameters on rutting performance of a flexible pavement using Mechanistic Empirical Pavement Design Guide. Int. J. Pavement Res. Technol. 2016, 9, 450–459. [Google Scholar] [CrossRef][Green Version]
- Putri, E.; Rewani, F.; Mannan, M.; Ibrahim, W.; Kabit, M.; Tirau, L.; Chan, R.; Buking, R. Sensitivity Analysis of StormPav Composite Pavement. In Proceedings of the Conference on Innovation in Technology and Engineering Science, Vienna, Austriac, 21–23 June 2019; IOP Publishing: Bristol, UK, 2019. [Google Scholar]
- ACPA. StreetPAVE 12 Manual, American Concrete Pavement Association; ACPA: Washington, DC, USA, 2014. [Google Scholar]
- ACPA. Windows Pavement Analysis Software (WinPAS) 12 Guide, American Concrete Pavement Association; ACPA: Washington, DC, USA, 2012. [Google Scholar]
© 2020 by the authors. Licensee MDPI, Basel, Switzerland. This article is an open access article distributed under the terms and conditions of the Creative Commons Attribution (CC BY) license (http://creativecommons.org/licenses/by/4.0/).


