Abstract
Thermal stresses are generated in concrete during the accelerated curing process in precast concrete. These stresses may cause concrete to crack, which would have a negative effect on the general concrete performance. This paper provides the results of the thermal stress analysis of concrete containing 25% replacement of ordinary Portland cement (OPC) by ground granulated blast-furnace slag cement (GGBFS) with 3000 cm2/g fineness. A total of 2.5% of limestone powder and 1.75% of fine gypsum by mass of OPC were incorporated in the other concrete mix proportion to check their effect on the cracking tendency of concrete. The concrete was subjected to heat curing. JCMAC, a 3D finite element analysis software developed in Japan, was used in this study for the thermal stress analysis. The heat curing period of one day, similar to generally used in the precast concrete industry for civil engineering products consisting of 3 h preheating period, heating to a peak temperature of 65 °C and this temperature was kept for 3 h, and lastly cooling was used in the study. A standard precast box culvert model member together with some experimental results obtained in the laboratory were used in the analysis. Lower cracking resistance at 1 day was observed in both mix proportions that would lead to cracking at demolding time. Curing sheets were then introduced in the analysis to cover the precast mold during accelerated curing and this showed improvement in cracking resistance of concrete containing limestone powder and fine gypsum.
1. Introduction
Cracks may develop in concrete structures at different ages due to several reasons, but the main principle is the fact that concrete is a quasi-brittle material with a low capacity for deformation under tensile stresses [,,]. Cracks that may occur either at early or later age are often attributed to concrete shrinkage and their extent has a negative effect on concrete durability. It has been recognized that control of concrete cracking caused both by temperature change and shrinkage can be achieved through the selection of proper materials, mix proportions, curing conditions, and construction practice []. These measures promote concrete produced with desirable strength and durability. Many factories in the precast concrete industry use accelerated curing methods and various concrete mix proportions to achieve desirable early strength and minimize crack development at early and later age []. The accelerated curing method such as steam curing is an economical and widely used method that utilizes high temperature and steam at the atmospheric condition to achieve early strength gain []. Various supplementary cementitious materials (SCMs) such as ground granulated blast furnace slag cement (GGBFS) are often used in precast concrete products [].
GGBFS cement is produced as a byproduct in the steel production plant and it has been utilized in concrete to improve concrete properties such as workability at an early age, durability, and water tightness at a later age. It also been used to increase concrete resistance to salt damage, restraining the alkali-silica reaction, etc. [,]. Recently, attention is being paid to the fact that GGBFS addition in concrete reduces the usage of Ordinary Portland Cement (OPC). OPC is the most used cement in concrete but emits a lot of CO2 to the environment during its production []. Different types of GGBFS cement are generally differentiated by their fineness or degree of activation []. Recently, a new type of GGBFS with a specific fineness of at least 2750 cm2/g to less than 3500 cm2/g has been developed in Japan. This cement has been used for mass concrete works but there is a need to also incorporate it in the precast concrete structures. Previously, it has been proven that accelerated curing such as steam curing significantly increases the early strength of concrete or mortar containing GGBFS []. Thus, the need to check the suitability of this new type of GGBFS cement. Limestone powder or gypsum has also been used as additives to improve concrete properties such as workability, strength development, and durability in accelerated cured concrete []. Since there are different sources of limestone powder or gypsum, it has been proven that incorporating such additives and their recycled forms in precast concrete can help to reduce environmental degradation due to disposal of their related manufactured or waste construction products. Thus, this has been identified as a sustainable way of recycling limestone powder or gypsum-based materials [,,,].
At the same time as the accelerated curing process occurs in precast concrete, concrete undergoes volume changes due to the external temperature, heat due to cement hydration, and autogenous shrinkage. Autogenous shrinkage is microscopic shrinkage that occurs in concrete due to cement hydration after the initial setting []. Drying shrinkage occurs in concrete due to the difference in moisture inside and surrounding the concrete []. This may cause concrete to crack. It has been published that Saito et al. had recommended that autogenous shrinkage in concrete can be reduced by adjusting the fineness of blast furnace slag and content of gypsum in the binder []. As such, using the recently introduced GGBFS cement, it is necessary to investigate the effect of this cement on shrinkage and cracking tendency in accelerated cured precast concrete.
However, little experimental data is available on the thermal cracking tendency whilst and after an accelerated curing process using this class of GGBFS cement. Given this, the focus of this study was on using experimental data to investigate the effect of adding limestone powder and fine gypsum on the cracking tendency of concrete at an early age using 3D FEM analysis. A standard precast concrete box culvert model was used in this 3D FEM analysis. The study also looked at the extent of autogenous shrinkage and drying shrinkage in accelerated cured concrete to provide experimental information on concrete crack resistance at different times.
2. Materials and Mix Proportions
Table 1 presents the physical and chemical properties of the binder materials which were under study in the laboratory experiments. Ordinary Portland cement (“N”, hereinafter) and ground granulated blast-furnace slag cement (“BFS”, hereinafter) was used as the main binders. Ordinary Portland cement is commercially produced and conformed to Japanese standard JIS R 5210: 2009—standard specification for Portland cement [] and ASTM C150/C150M-18: 2018—standard specification for Portland cement []. Whilst, BFS cement with 3000 cm2/g fineness conformed to JIS A 6206: 2013—ground granulated blast-furnace slag for concrete [] and ASTM C989-06: 2006—standard specification for ground granulated blast-furnace slag for use in concrete and mortars []. Fine gypsum (“F.GYP”, hereinafter); and limestone powder (“LSP”, hereinafter) were used as additives. Table 2 shows the percentages of N, BFS, and the additives F.GYP and LSP contents by mass of N cement for each concrete mix proportion. Air-entraining agent (AE) was used to make entrained air in concrete; air-entraining and water-reducing agent (AEWR) was added to adjust concrete workability. Fine and coarse aggregates used to prepare concrete specimens were river sand and crushed sandstone. The river sand used had 2.59 g/cm3 specific gravity, percentage of water absorption of 2.55%, and fineness modulus of 2.83. The maximum grain size of coarse aggregates was 20 mm and 2.64 g/cm3 specific gravity.

Table 1.
Physical and chemical properties of binders used.

Table 2.
Percent by mass of binder per cubic metre of concrete.
Two concrete mix proportions containing different mineral admixtures and additive contents were combined as shown in Table 3. The concrete mix proportions were formulated based on the JSCE recommendations and the existing laboratory experiment results []. The control mix proportion contained only N and BFS types of cement. The target slump values of 15 ± 2.5 cm and air content of 4.5 ± 1.0% were used for all mix proportions.

Table 3.
Concrete mix proportions.
3. Experimental Methods
A pan concrete mixer was utilized for the preparation of all concrete mix proportions following JIS A1119: 2014—method of test for variability of freshly mixed concrete by measuring mortar and coarse aggregate contents [] and ASTM C192/C192M: 2019—standard practice for making and curing concrete test specimens in the laboratory []. Both the air-entraining and water-reducing agent (AEWR) and air-entraining agent (AE) were added to the mixing water before casting concrete. Air-entraining and water-reducing agent (AEWR) dosage was kept constant. This was according to the application method as recommended by the manufacturer. The air-entraining agent (AE) was adjusted to attain target concrete air content. Coarse and fine aggregates were mixed with the binders for one and a half minutes. Thereafter, mixing water with chemical admixtures were added and all the concrete ingredients were mixed for a further one and a half minutes. Immediately after mixing, the concrete was batched in readiness for the testing of fresh concrete properties.
The main tests for the fresh concrete properties, which included slump, temperature, and air content, were measured as recommended by JIS or ASTM standards [,,,,,,,,]. Concrete specimens were prepared to measure concrete strain using transducer strain gauges installed in the central portion of 100 × 100 × 400 mm beam molds. The transducer strain gauges were then connected to the data logger as shown in Figure 1. Compressive strength tests were conducted using concrete specimens cast in the 100 mm diameter and 200 mm height cylinder molds in accordance with JIS A1108: 2006—method of test for compressive strength of concrete [] and ASTM C39/C39M-18: 2018—standard test method for compressive strength of cylindrical concrete specimens []. To measure the rise in concrete temperature due to cement hydration under the semi-adiabatic condition, cubic molds with internal dimensions of 200 mm consisting of foamed polystyrene of 200 mm thick, were used as shown in Figure 2, Figure 3 and Figure 4. Setting time of concrete was measured in accordance with JIS A 1147: 2007—method of test for setting time by penetration resistance [] and ASTM C403/C403M: 1999—standard test method for time of setting of concrete mixtures by penetration resistance []. The mold containing the concrete specimen for setting time was immediately covered and stored in the temperature-controlled room at 20 °C.

Figure 1.
Beam concrete mold for shrinkage measurement.
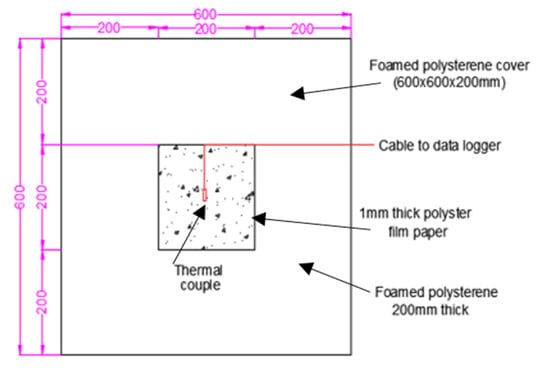
Figure 2.
Schematic diagram.
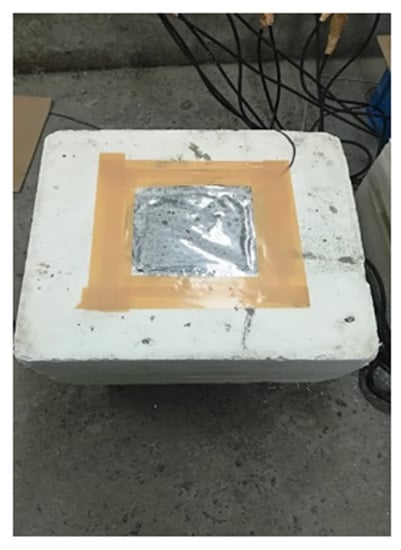
Figure 3.
Concrete during casting for temperature rise in concrete measurement in the semi adiabatic condition.
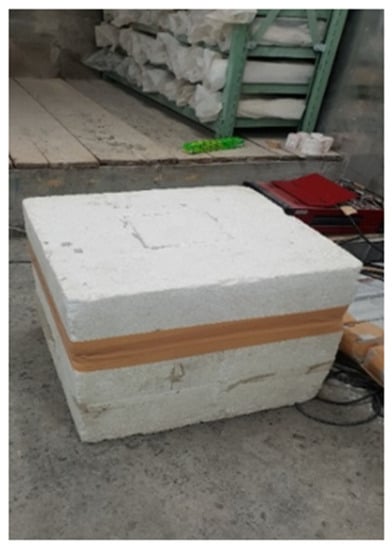
Figure 4.
Concrete after casting for temperature rise in concrete measurement in the semi adiabatic condition.
The specimens for compressive strength, shrinkage, and heat of cement hydration were immediately sealed and were also kept in a temperature-controlled room at 20 °C and 80% relative humidity (RH). Three hours after casting, some beam for shrinkage measurement and cylinder specimens for 1 day, 7 days, and 14 days compressive strength tests underwent high-temperature curing. The profile for the target ambient temperature utilized in the laboratory is shown in Figure 5, which was similar to the generally used steam curing cycle in precast concrete plants. In this study, steam was not applied. The other specimens in beam and cylinder molds were left in the temperature-controlled room at 20 °C and 80% RH, the strain of which temperature was measured in beam specimens as well.
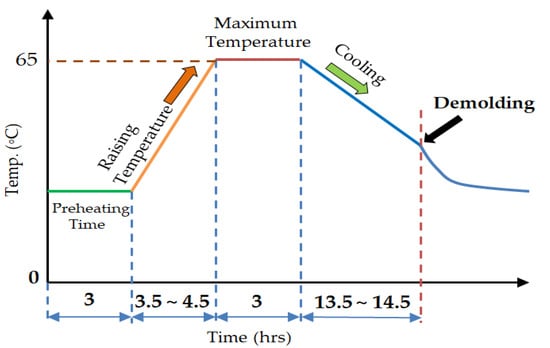
Figure 5.
Target temperature history for accelerated curing.
Concrete specimens were demolded at 1 day of which the accelerated cured specimens were then subjected to drying condition in the temperature-controlled room at 20 °C and RH 60%. Drying shrinkage was measured in beam specimens. Compressive strength tests in the cylinder specimens were conducted at 1 day, 7 days, and 14 days. Beam specimens for autogenous shrinkage measurement were sealed with aluminum adhesive tape and kept in the temperature control room at 20 °C. The 28 days’ compressive strength cylinder specimens were stored in water at 20 °C.
4. Results
4.1. Fresh and Hardened Properties of Concrete
Table 4 shows the results obtained from the tests on the concrete slump, temperature, and air content in all mix proportions. In both concrete proportions, similar results were obtained. The fresh concrete properties were measured to check their suitability for casting and finishing purposes. It was observed that the obtained results were within the suitable properties required in the precast concrete factory []. The concrete temperatures in this study were used as one of the input values in the 3D FEM thermal stress analysis.

Table 4.
Fresh concrete properties.
Setting time test results obtained are shown in Table 5. There was an increase in the setting time in both concrete mix proportions in relation to the general time concrete made with N cement. There is generally retardation in the setting time observed when mineral admixtures such as BFS cement are added to concrete []. In this study, initial setting time was used as a starting point for the measurement of autogenous shrinkage.

Table 5.
Setting time of concrete.
All compressive strength results obtained in the experiments are shown in Table 6 for both accelerated cured concrete at 1 day, 7 days, and 14 days; and 28 days compressive strength for water cured concrete specimens. It was observed that the addition of LSP and F.GYP improved strength from 1 to 14 days and at 28 days for the water cured concrete as well. Despite the addition of LSP and F.GYP to the concrete, it was observed that even the control mix containing only N and BFS cement attained the minimum demolding compressive strengths [].

Table 6.
Compressive strength of concrete.
4.2. Accelerated Temperature History
Accelerated temperature histories observed on all mix proportions are shown in Figure 6 in which a similar temperature rise of about 20 °C/h was used as recommended in AC1 51 7.2R-87 []. All the mix proportions were heated to about 65 °C, which was the target temperature. At the start of cooling, all the concrete specimens were kept inside the closed oven to avoid high-temperature difference in and surrounding concrete, which could have led to thermal shock and cracking. The heating did not have the automated cooling system installed but the cooling of concrete specimens was still achieved at an average temperature decreasing rate of 1.8 °C/h. This cooling rate was within the recommended range of about 2 °C/h as prescribed in AC1 51 7.2R-87 [].
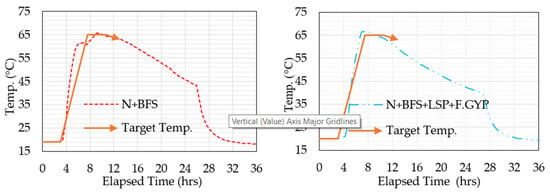
Figure 6.
Temperature history for accelerated curing. N—ordinary Portland cement; BFS—ground granulated blast-furnace slag cement; LSP—limestone powder; F.GYP—fine gypsum.
4.3. Autogenous and Drying Shrinkage in Accelerated Cured Concrete
Figure 7 shows the autogenous shrinkage during and after accelerated curing. To obtain autogenous shrinkage, the total strain, which is the sum of thermal strain and the autogenous strain, was observed in the experiments. The coefficient of heat expansion of concrete was taken to be 10 × 10−6/°C []. Thus, the difference between a total strain and thermal strain provided the observed autogenous strain. N + BFS + LSP + F.GYP showed higher expansion during accelerated curing and slightly lower shrinkage after accelerated curing. Figure 8 shows the observed drying shrinkage in which N + BFS + LSP + F.GYP showed slightly lower shrinkage value throughout the experiment period.
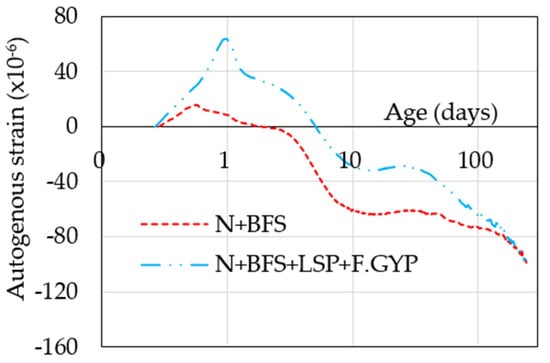
Figure 7.
Autogenous shrinkage.
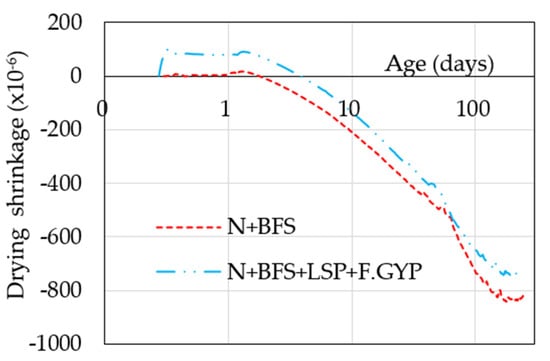
Figure 8.
Drying shrinkage.
4.4. Heat of Cement Hydration of the Concrete—Semi Adiabatic Condition
Thermal cracking may occur in concrete members due to a rise in concrete temperature as a result of cement hydration. The rise in concrete temperature can be determined by subjecting concrete to adiabatic or semi-adiabatic condition. In this study, temperature rise due to heat of cement hydration was determined in semi-adiabatic condition to check the effect of limestone powder and fine gypsum. The observed results are shown in Figure 9a,b. The predicted adiabatic temperature rise of concrete was determined using results obtained in semi-adiabatic condition and Equation (1). This equation is based on the relationship between semi-adiabatic temperature rise and adiabatic temperature rise as proposed from the past research work on a simple thermal insulation test []:
where : density of the sample specimen (kg/m3), C: specific heat capacity of concrete taken as (1.05 KJ/kg °C), V: volume of the sample specimen (m3), S: surface area of the sample specimen (m2), h: heat transfer coefficient (W/m2 °C), T: temperature gradient existing between the sample specimen and ambient room temperature, : adiabatic temperature state.

Figure 9.
Observed semi adiabatic and predicated adiabatic temperature rise.
Thereafter, the parameters obtained from Equation (1) were used to generate constants in the JCI model in Equation (2) and graphs which were obtained are also shown in Figure 9a,b []. The derived constants from Equation (2) are indicated in Table 7. The obtained results showed that the addition of limestone powder and fine gypsum enhanced the rate of the predicted adiabatic temperature rise and increased the ultimate temperature rise []:
where t: age in days, Q(t): adiabatic temperature rise at t (°C), : ultimate adiabatic temperature rise (°C), : parameters representing rate of adiabatic temperature rise, age at starting of temperature rise.

Table 7.
Adiabatic temperature rise properties of concrete.
4.5. Thermal Stress and Cracking Index Analysis by 3D FEM Method
Temperature change in concrete members due to external temperature change, cement hydration, and autogenous shrinkage may cause stress development within a structure. The extent of stress increase is due to internal restraint caused by non-uniform temperature across the section of a member and may lead to crack development (JCI, 2016) []. Using a 3D FEM analysis method, which is based on the truss network model, a region with a high cracking tendency can be identified [,]. The 3D FEM analysis method quantitatively computes thermal stress and thermal cracking index by considering various conditions of the cast concrete such as structural dimensions, construction procedures, temperature histories, mechanical properties, etc. []. In this analysis, the thermal cracking index is determined as the ratio of tensile strength to maximum principle stresses. When the thermal cracking index is low, the probability of cracking is high (low cracking resistance) and vice versa. Equation (3) was used to calculate the thermal cracking index []:
where ICR: thermal cracking index, : splitting tensile strength, : principal stress, and : temperature adjusted age (day).
Thermal cracking index at all the positions of a member is calculated throughout the valuated period. Then, thermal cracking tendency of the member can be estimated based on the minimum cracking index. The time and the position of cracking can be also estimated. For example, if the minimum thermal cracking index is 1.0, the probability of cracking is estimated as 50% according to JCI guidelines for crack control of mass concrete structures. Note that the target thermal cracking index depends on the purpose of the structure [].
In this study, the influence of adding LSP and F.GYP in concrete mix proportions on cracking tendency was investigated. Two concrete mix proportions used include N + BFS and N + BFS + LSP +F.GYP. A typical concrete precast box culvert model member was used for the analysis as shown in Figure 9 []. Note that haunches were not included in the 3D FEM model as shown in Figure 10.
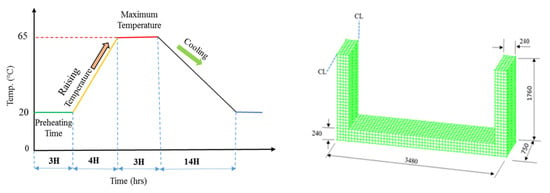
Figure 10.
Ambient temperature profile for 3D FEM analysis (Left) and the quarter section of the precast concrete model (right).
Concrete mechanical properties used as input parameters in the 3D FEM include compressive strength, splitting tensile strength, and modulus of elasticity. In this study, compressive strength was experimentally obtained whilst splitting tensile strength and modulus of elasticity in Equations (4) and (5) were derived using the obtained compressive strength and constants as provided for in the JCI guidelines []:
where : splitting tensile strength of concrete at (N/mm2), : compressive strength of concrete at (N/mm2), : temperature adjusted age (days), :
where : modulus of elasticity of concrete at (N/mm2), : compressive strength of concrete at (N/mm2), .
The influence of creep of concrete was evaluated by using effective Young’s modulus, which was obtained by multiplying Young’s modulus by a reduction coefficient using Equation (6). To take large creep in the hardening process of concrete into account, the reduction constant was taken to be 0.42 before the age when the concrete temperature reaches the maximum temperature and 0.65 at later ages, which are recommended by JCI guidelines []:
where : effective modulus of elasticity of concrete at , reduction coefficient for modulus of elasticity due to creep, : modulus of elasticity of concrete at .
Table 8 shows some of the other input values thermal and stress analysis. For the purpose of analysis, the casting temperature for both mix proportions was taken to be 18.5 °C.

Table 8.
Other input parameters for thermal and stress analysis using 3D FEM.
Thermal analysis and stress analysis were conducted in 3D FEM analysis. In the thermal analysis, heat transfer analysis was carried out using the adiabatic temperature rise of each mixture. In stress analysis, the coefficient of thermal expansion of concrete was taken to be 10 × 10−6/°C and autogenous shrinkage under accelerated condition also taken into account. Figure 10, Figure 11 and Figure 12 further provide location and temperature profile at the region with a low thermal cracking index observed in the center of the precast model member. It can be seen that the difference in concrete temperatures between the surface and internal concrete as shown in Figure 13 generated tensile stresses. Similar high thermal stresses were observed at 1 day in both concrete mixtures that showed thermal cracking index values of 0.69 in N + BFS and 0.76 in N + BFS + LSP + F.GYP. The observed values may lead to surface cracking of the precast concrete model specimen at demolding time.
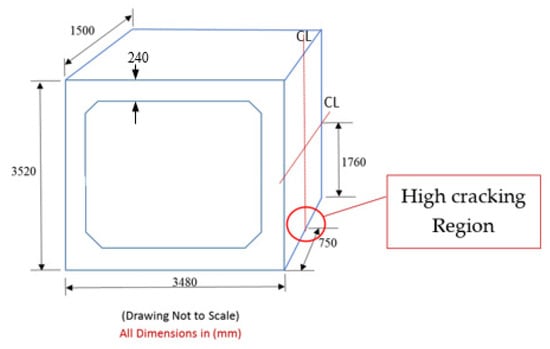
Figure 11.
Precast model indicating the cracking region.
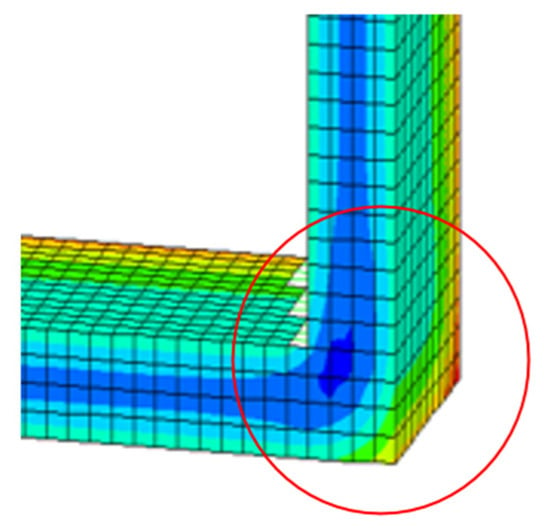
Figure 12.
Simulated temperature profile at the cracking region at 25 h.
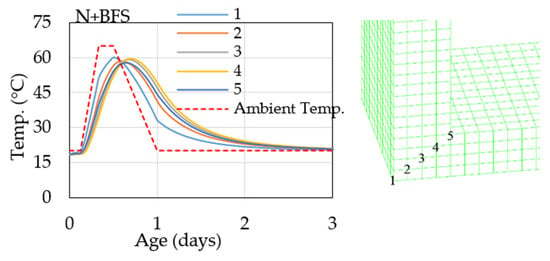
Figure 13.
Temperature distribution at the cracking region.
An input option to check the effect of covering precast concrete molds during accelerated curing was then introduced in 3D FEM analysis. All the outside surfaces were covered using curing sheets with 6 W/m2 °C heat transfer coefficient []. This type of curing sheet provides more resistance to heat transfer that may reduce the temperature difference between the surface and internal concrete. Then, the optimum time for covering the molds was investigated. There was a reduction in thermal stresses in both concrete mixtures covered 6 h before demolding as shown in Figure 14. This resulted in a reduced temperature gradient in concrete that improved the thermal cracking index. The change in the thermal cracking index before and after the introduction of curing sheets is provided in Figure 15 and Table 9.
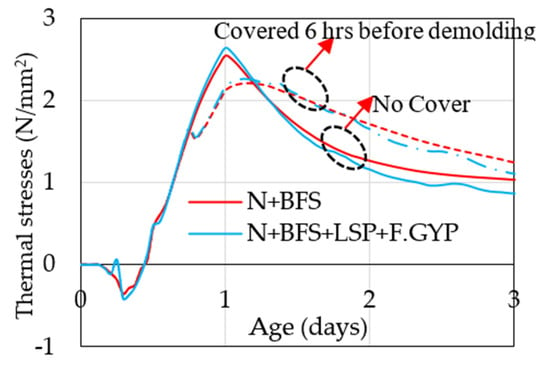
Figure 14.
Thermal stresses at the high cracking region.
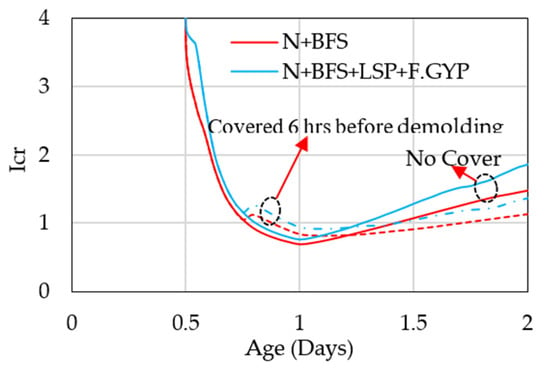
Figure 15.
Thermal cracking index at the high cracking region for the covered and uncovered precast concrete model.

Table 9.
Effect of covering precast molds on the minimum cracking index.
5. Discussions
In 3D FEM analysis, fresh concrete properties such as concrete temperature are used as one of the input parameters. In this study, slump values obtained were used only to check the workability of concrete, which is key when making precast concrete units for easy of placement, consolidation, and finishing. Setting time of concrete was used to determine the start time for both autogenous shrinkage measurement and accelerated curing. A 3 h delay period was adopted even though longer setting times were observed in mix proportions but were within the generally used delay period of 2 to 5 h in many precast factories. In this paper, setting time was used as the starting point for measuring autogenous shrinkage. A curing process of one day, which is generally used in civil engineering precast concrete products, was adopted in both accelerated curing and 3D FEM analysis [].
From the results obtained in compressive strength tests, both mix proportions provided higher and satisfactory concrete strength at demolding time as recommended by AC1 51 7.2R-87 []. Additionally, additives such as limestone powder and fine gypsum improved strength gain at all ages, which may also help when dispatching the precast concrete units from the precast yard to site within a generally used period of 14 days after demolding [,,,].
During accelerated curing, more expansion was observed in the mix proportions containing limestone powder and fine gypsum than in the control mix containing N+BFS. This pattern may help act as expansive agents for such mix proportions as this effect showed a slight reduction in the drying shrinkage at later age.
Adiabatic temperature rise in concrete is used to establish the rate of cement hydration for some purpose related to cracking as the addition of supplementary cementitious materials such as blast furnace slag cement has shown reduction rise in temperature in concrete. In this study, limestone powder and fine gypsum were used to check the effect on the rate of cement hydration as well. There was little difference in the temperature rise in both mix proportions.
There was a rise in temperature in the precast concrete model when conducting 3D finite element analysis. This generated the temperature gradient between the inner and outer concrete surfaces during the accelerated curing process. Higher tensile forces were generated as the result and the highest tensile forces where observed in the central portion of the model. Thus, to reduce the temperature gradient, which is related to the cracking in the precast concrete model, a covering sheet was introduced. This improved the cracking of resistance in both mix proportions of about 19% in both mix proportions. Thus, it is recommended that the covering of concrete molds should be done during the process of accelerated curing [].
6. Conclusions
The results from the fresh, mechanical, shrinkage properties of concrete made with BFS cement as main mineral admixture and subjected to accelerated curing by heating provided some input parameters for 3D FEM analysis. Considering the results obtained from the laboratory tests and 3D FEM analysis, the following conclusions have been drawn:
- The addition of limestone powder and fine gypsum provided higher expansion at demolding time and lower shrinkage in drying conditions. This shrinkage compensation effect may help to improve cracking resistance.
- Both N + BFS and N + BFS+LSP + F.GYP provided desirable compressive strength at 1 day and later age, which may help in achieving target strengths at the demolding time in precast concrete factories.
- 3D FEM analysis showed high thermal stresses at the center of the precast model at 1 day in both mix proportions that may lead to cracking at the demolding time in both mix proportions. Thus, this portion could show cracking after the demolding. Covering of the precast molds with curing sheets can help improve the thermal cracking resistance.
- Limestone powder and fine gypsum did not show a significant effect on cracking resistance in precast concrete.
Author Contributions
S.M. and N.N. conceived and designed the experiments; B.A.Z. and S.M. performed the experiments; B.A.Z. and S.M. analyzed the data; B.A.Z. and S.M. contributed in manuscript preparation and participated in revising the article critically for important intellectual content. All authors have read and agreed to the published version of the manuscript.
Funding
This research was funded by Japan International Cooperation Agency (JICA), grant number G17702. The APC was funded by Ashikaga University (Japan).
Acknowledgments
The study was made possible by the financial support of Japan International Cooperation Agency (JICA) through the ABE initiative programme. The author is also grateful for all the support from the Ashikaga University in collaboration with DC Co. Ltd. (Japan) and the Road Development Agency (Zambia).
Conflicts of Interest
The authors declare no conflict of interest.
References
- Klemczak, B.; Jędrzejewska, A. Early age thermal and shrinkage cracks in concrete structures—Description of the problem. Chemistry 2011, 4, 35–47. [Google Scholar]
- Bamforth, P.B. Early-Age Thermal Crack Control in Concrete; CIRIA C660: London, UK, 2007; p. 112. [Google Scholar]
- Mihashi, H.; de Barros Leite, J.P. State-of-the-art report on control of cracking in early age concrete. J. Adv. Concr. Technol. 2004, 2, 141–154. [Google Scholar] [CrossRef]
- Klemczak, B.; Maciej, B.; Maciej, P.; Aneta, ĩ. Analysis of cracking risk in early age mass concrete with different aggregate. Procedia Eng. 2017, 193, 234–241. [Google Scholar] [CrossRef]
- Habeeb, G.; Zainab, H.; Sattar Ghali, A. Effect of Accelerated Curing on Compressive Strength of High Strength Concrete with Nano-Silica. 2015. Available online: http//www.researchgate.net/publication/309734552 (accessed on 17 October 2019).
- Vollenweider, B. Various methods of accelerated curing for precast concrete applications, and their impact on short and long term compressive strength. Concr. Technol. 2004, 241, 1–22. [Google Scholar]
- Nagao, Y.; Suzuki, K. Basic Properties and Utilization of Steam-Cured Concrete Using Ground Granulated Blast-Furnace Slag; Nippon Steel & Sumitomo Metal Technical Report No. 109; Nippon Steel & Sumikin Esment Kanto Co., Ltd.: Chuo-ku, Tokyo, 2015. [Google Scholar]
- Jeon, J.K.; Moon, H.Y.; Ann, K.Y.; Kim, H.S.; Kim, Y.B. Effect of ground granulated blast furnace slag, pulverized fuel ash, silica fume on sulfuric acid corrosion resistance of cement matrix. Mater. Sci. 2006. [Google Scholar] [CrossRef]
- Suresh, D.; Nagaraju, K. Ground Granulated Blast Slag (GGBS) In Concrete—A review. IOSR J. Mech. Civ. Eng. (IOSR-JMCE) 2015, 12, 76–82. [Google Scholar]
- Sheikibrahim, K.; Sathish, S.; Mohammed Fahad, A.S.; Sathish Sharma, A.; Karthika, H.; Shanmuganathan, N. Ground Granulated Blast Furnace Slag (GGBS or GGBFS) and flyash in concrete. Int. Res. J. Eng. Technol. (IRJET) 2018, 5, 266–270. [Google Scholar]
- Japanese Standards Association. JIS A6206: Ground Granulated Blast-Furnace Slag for Concrete; Japanese Standards Association: Tokyo, Japan, 2013. [Google Scholar]
- Bhanumathidas, N.; Kalidas, N. Dual role of gypsum: Set retarder and strength accelerator. Indian Concr. J. 2004, 78, 170–173. [Google Scholar]
- Esping, O. Effect of limestone filler BET (H2O)-area on the fresh and hardened properties of self-compacting concrete. Cem. Concr. Res. 2008, 38, 938–944. [Google Scholar] [CrossRef]
- Markssuel, T.M.; Jonas, A.; Afonso, R.G.A.; Euzébio, B.Z. Evaluation of the use of marble waste in hydrated lime cement mortar based. J. Mater. Cycles Waste Manag. 2019. [Google Scholar] [CrossRef]
- Carvalho, A.; de Castro Xavier, G.; Alexandre, J.; Pedroti, L.G.; de Azevedo, A.R.G.; Vieira, C.M.F.; Monteiro, S.N. Environmental durability of soil-cement block incorporated with ornamental stone waste. Mater. Sci. Forum 2014, 798–799, 548–553. [Google Scholar] [CrossRef]
- De Azevedo, A.R.G. Technological and environmental comparative of the processing of primary sludge waste from paper industry for mortar. J. Clean. Prod. 2020, 249, 119336. [Google Scholar] [CrossRef]
- Alexandre, J.; de Azevedo, A.R.G.; Xavier G de, C.; Pedroti, L.G.; Vieira, C.M.F.; Monteiro, S.N. Characterization of a limestone powder residue for recycling as a concrete block incorporation. Mater. Sci. Forum 2014, 798–799, 3–8. [Google Scholar] [CrossRef]
- Japan Society of Civil Engineers. Recommendation for Construction of Self-Compacting Concrete; Technical Session: Recommendations and Materials: Tokyo, Japan, 1998; pp. 417–437. [Google Scholar]
- Cement concrete and Aggregates Australia. Drying Shrinkage of Cement and concrete; Cement concrete and Aggregates Australia: Sydney, Australia, 2002. [Google Scholar]
- Saito, S.; Ozawa, M.; Sakaguchi, Y.; Morimoto, H. Study on initial stress of precast concrete members using steam curing. In Proceedings of the Japan Concrete Institute, Osaka, Japan, 12–14 July 2011; Volume 33. [Google Scholar]
- Japanese Standards Association. JIS R 5210: Portland Cement; Japanese Standards Association: Tokyo, Japan, 2009. [Google Scholar]
- ASTM C150/C150M-18: Standard Specification for Portland Cement; ASTM International: West Conshohocken, PA, USA, 2018.
- ASTM International. ASTM C989-06: Standard Specification for Ground Granulated Blast-Furnace Slag for Use in Concrete and Mortars; ASTM International: West Conshohocken, PA, USA, 2006. [Google Scholar]
- Japan Society of Civil Engineers. Standard Specification for Concrete Structures—Materials and Construction; Japan Society of Civil Engineers: Tokyo, Japan, 2010. [Google Scholar]
- Japanese Standards Association. JIS A1119: Method of Test for Variability of Freshly Mixed Concrete by Measuring Mortar and Coarse Aggregate Contents; Japanese Standards Association: Tokyo, Japan, 2014. [Google Scholar]
- ASTM International. ASTM C192/C192M-18: Standard Practice for Making and Curing Concrete Test Specimens in the Laboratory; ASTM International: West Conshohocken, PA, USA, 2019. [Google Scholar]
- Japanese Standards Association. JIS A1138: Method of Making Test Sample of Concrete in the Laboratory; Japanese Standards Association: Tokyo, Japan, 2005. [Google Scholar]
- Japanese Standards Association. JIS A 1101: Method of Test for Slump of Concrete; Japanese Standards Association: Tokyo, Japan, 1975. [Google Scholar]
- ASTM International. ASTM C143/C143M-15a: Standard Test Method for Slump of Hydraulic-Cement Concrete; ASTM International: West Conshohocken, PA, USA, 2015. [Google Scholar]
- Japanese Standards Association. JIS A1115: Method of Sampling Fresh Concrete; Japanese Standards Association: Tokyo, Japan, 2014. [Google Scholar]
- ASTM International. ASTM C172/C172M-17: Standard Practice for Sampling Freshly Mixed Concrete; ASTM International: West Conshohocken, PA, USA, 2017. [Google Scholar]
- Japanese Standards Association. JIS A1118: Method of Test for Air Content of Fresh Concrete by Volumetric Method; Japanese Standards Association: Tokyo, Japan, 2011. [Google Scholar]
- ASTM International. ASTM C231/C231M-17a: Standard Test Method for Air Content of Freshly Mixed Concrete by the Pressure Method; ASTM International: West Conshohocken, PA, USA, 2017. [Google Scholar]
- Japanese Standards Association. JIS A1156: Method of measurement for temperature of fresh concrete; Japanese Standards Association: Tokyo, Japan, 2014. [Google Scholar]
- ASTM International. ASTM C1064 / C1064M-17: Standard Test Method for Temperature of Freshly Mixed Hydraulic-Cement Concrete; ASTM International: West Conshohocken, PA, USA, 2017. [Google Scholar]
- Japanese Standards Association. JIS A1108: Method of Test for Compressive Strength of Concrete; Japanese Standards Association: Tokyo, Japan, 2006. [Google Scholar]
- ASTM International. ASTM C39/C39M-18: Standard Test Method for Compressive Strength of Cylindrical Concrete Specimens; ASTM International: West Conshohocken, PA, USA, 2018. [Google Scholar]
- Japanese Standards Association. JIS A1147: Method of Test for Setting Time by Penetration Resistance; Japanese Standards Association: Tokyo, Japan, 2007. [Google Scholar]
- ASTM International. ASTM C403/C403M-16: Standard Test Method for Time of Setting of Concrete Mixtures by Penetration Resistance; ASTM International: West Conshohocken, PA, USA, 2016. [Google Scholar]
- Brooks, J.J.; Megat, J.; Megat, A.; Mazloom, M. Effect of admixtures on the setting times of high-strength concrete. Cem. Concr. Compos. 2000, 22, 293–301. [Google Scholar] [CrossRef]
- America Concrete Institute. ACI 517.2R. Accelerated Curing of Concrete at Atmospheric Pressure, State of the Art. In ACI Manual of Concrete Practice; ACI 517.2R-87; America Concrete Institute: Farmington Hills, MI, USA, 1992. [Google Scholar]
- Japan Concrete Institute. Guidelines for Control of Cracking of Mass Concrete; Japan Concrete Institute: Tokyo, Japan, 2016. [Google Scholar]
- Yasuyuki, K.; Hirotaka, K.; Hiroshi, W. A study on estimation of adiabatic temperature rise characteristics of high-strength concrete by simple adiabatic test. In Proceedings of the 57th Annual Conference of the Japan Society of Civil Engineers, Sapporo, Japan, 25–27 September 2002. [Google Scholar]
- Moon, G.; Oh, S.; Jung, S.; Choi, Y. Effects of the fineness of limestone powder and cement on the hydration and strength development of PLC concrete. Constr. Build. Mater. 2017, 135, 129–136. [Google Scholar] [CrossRef]
- Nakamura, H.; Srisoros, W.; Yashiro, R.; Kunieda, M. Time-dependent structural analysis considering mass transfer to evaluate deterioration process of RC structures. J. Adv. Concr. Technol. 2006, 4, 147–158. [Google Scholar] [CrossRef]
- Japan Industrial Standards. JIS A 5372: Precast Reinforced Concrete Products; Japan Industrial Standards: Tokyo, Japan, 2004. [Google Scholar]
- Hara, Y.; Toriumi, A.; Uji, K. The influence of drying by steam curing and its control. In Proceedings of the 43rd Our World in Concrete and Structures of Premier Conference, Singapore, 30–31 August 2018; pp. 275–284. [Google Scholar]
- Bonavetti, V.L.; Rahhal, V.F.; Irrassar, E.F. Studies on the carbolauminate formation in limestone filler blended cements. Cem. Concr. Res. 2001, 31, 853–859. [Google Scholar] [CrossRef]
- Bernard, A.Z.; Miyazawa, S.; Nobukazu, N. Properties of blast-furnace cement concrete subjected to accelerated curing. In Proceedings of the 43rd Our World in Concrete and Structures of Premier Conference, Singapore, 30–31 August 2018; pp. 395–402. [Google Scholar]
- Zulu, B.A.; Miyazawa, S.; Nito, N. Properties of blast-furnace slag cement concrete subjected to accelerated curing. Infrastructures 2019, 4, 69. [Google Scholar] [CrossRef]
- Safiuddin, M.; Kaish, A.B.M.; Chin Ong, W.; Raman, S.N. Early-age cracking in concrete: Causes, consequences, remedial measures, and recommendations. Appl. Sci. 2018, 8, 25. [Google Scholar] [CrossRef]
© 2020 by the authors. Licensee MDPI, Basel, Switzerland. This article is an open access article distributed under the terms and conditions of the Creative Commons Attribution (CC BY) license (http://creativecommons.org/licenses/by/4.0/).