Seismic Assessment of Six Typologies of Existing RC Bridges


Abstract
1. Introduction
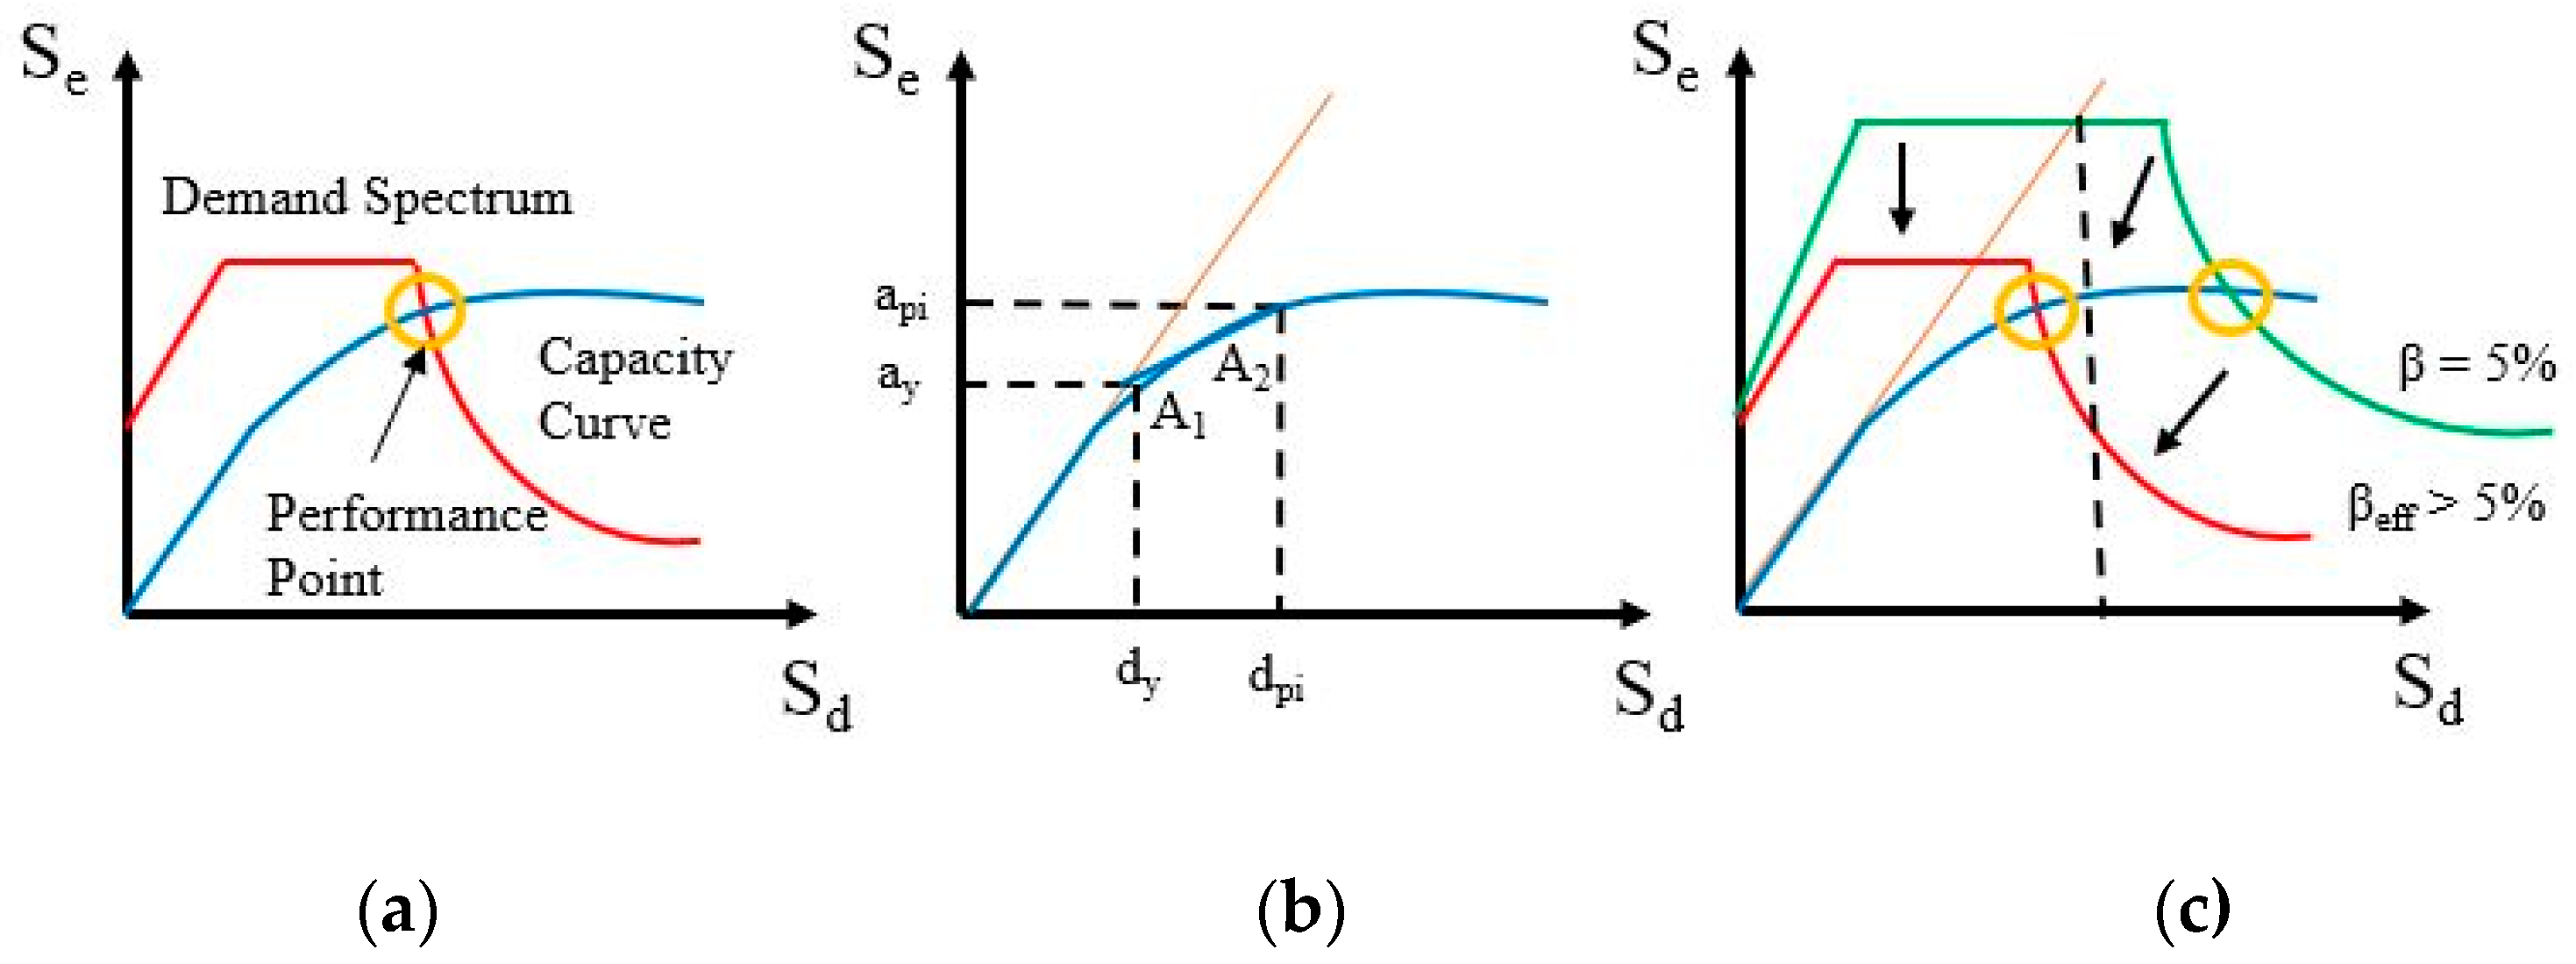
2. Multi-Modal Pushover Approach
- Definition of the seismic demand in the ADRS form;
- Selection of the first iteration point api, dpi on the capacity;
- Bilinearization of the capacity curve with KI as elastic stiffness followed by a hardening branch. The hardening branch is defined by applying the equal energy rule between the capacity curve and its bilinear idealization (Figure 1b);
- Scaling of the ADRS according to the effective damping coefficient. This takes into consideration both the hysteretic damping (referred to the cyclic plastic deformations) and the inherent damping (equal to 5% in the case of concrete structures), Figure 1c;
- Evaluation of the performance point by intersecting the capacity curve and the scaled demand spectrum through an iterative process.
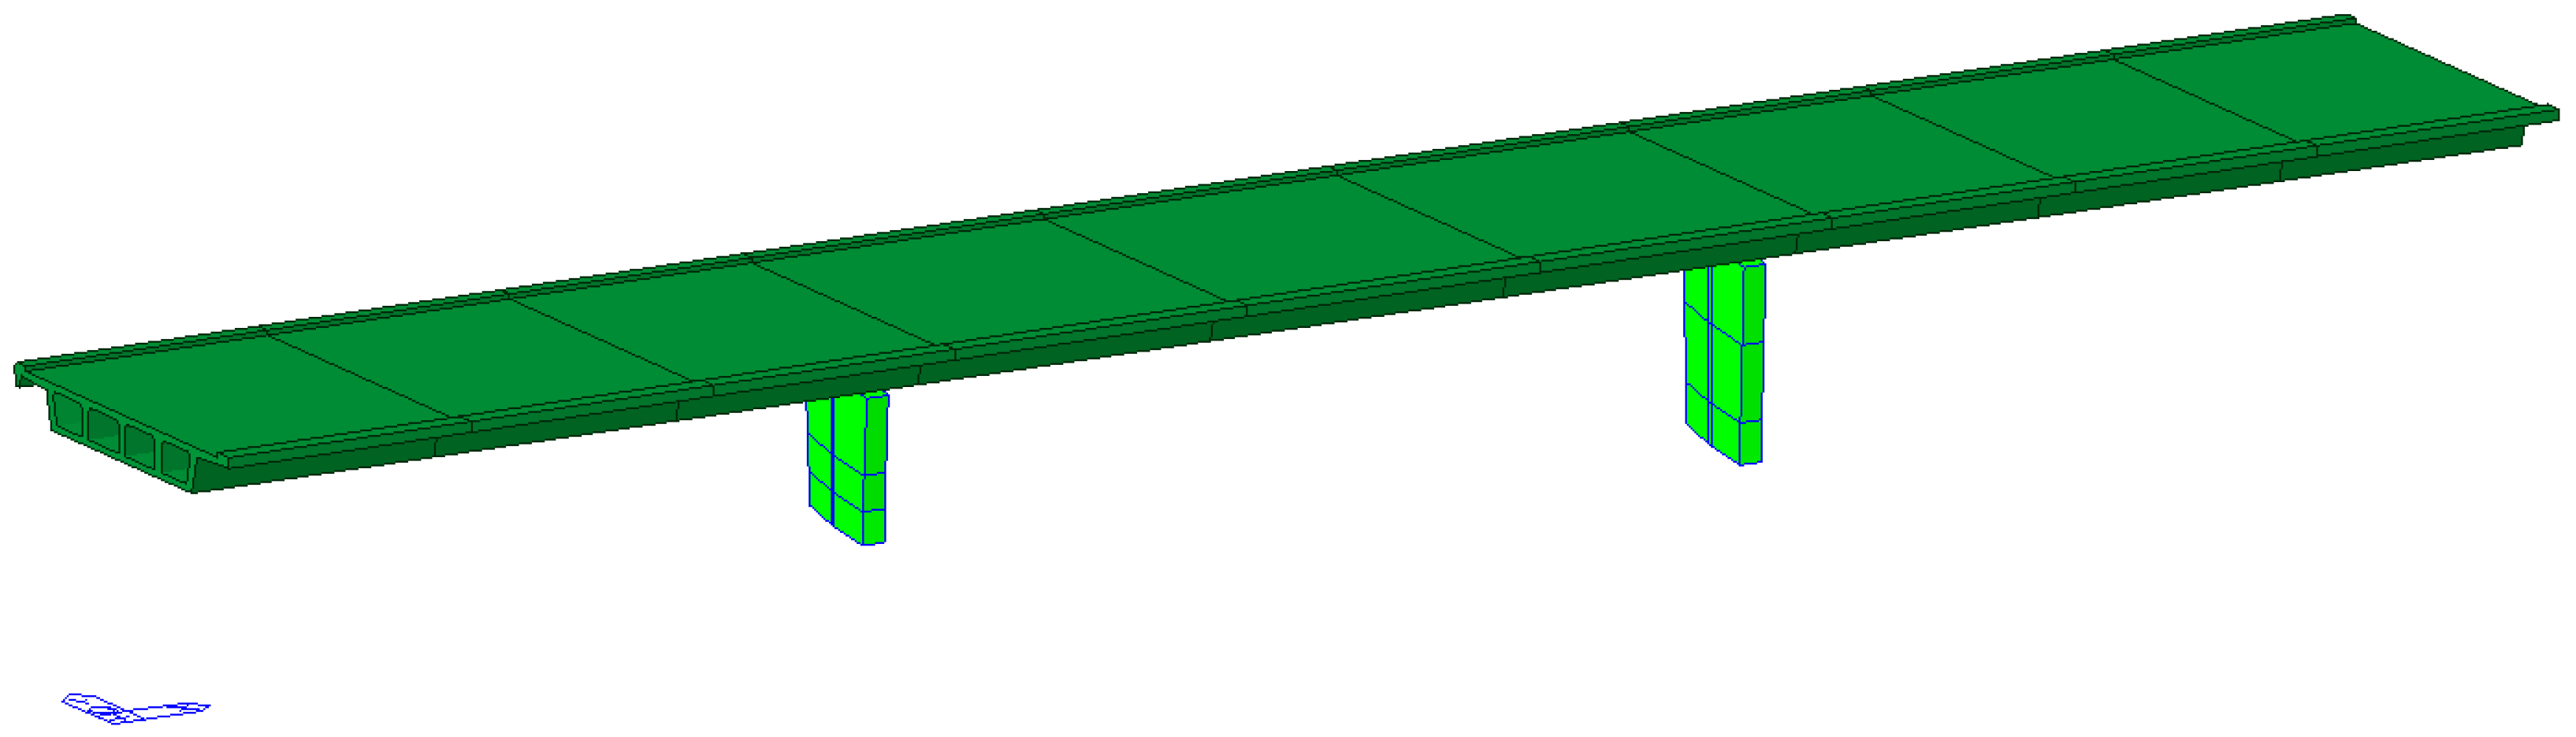
3. Structural Modelling
- Risk index in acceleration (RIPGA): is the ratio between capacity (PGAC) and demand (PGAD) in terms of peak ground acceleration;
4. Case Studies
5. Discussion
6. Conclusions
Author Contributions
Funding
Conflicts of Interest
References
- Simon, J.; Bracci, J.M.; Gardoni, P. Seismic response and fragility of deteriorated reinforced concrete bridges. J. Struct. Eng. 2010, 136, 1273–1281. [Google Scholar] [CrossRef]
- De Risi, R.; Di Sarno, L.; Paolacci, F. Probabilistic seismic performance assessment of an existing RC bridge with portal-frame piers designed for gravity loads only. Eng. Struct. 2017, 145, 348–367. [Google Scholar] [CrossRef]
- Savor Novak, M.; Lazarevic, D.; Atalic, J.; Uros, M. Influence of Multiple-Support Excitation on Seismic Response of Reinforced Concrete Arch Bridges. Appl. Sci. 2020, 10, 17. [Google Scholar] [CrossRef]
- Berto, L.; Vitaliani, R.; Saetta, A.; Simioni, P. Seismic assessment of existing RC structures affected by degradation phenomena. Struct. Saf. 2009, 31, 284–297. [Google Scholar] [CrossRef]
- Zucca, M.; Crespi, P.; Longarini, N. Seismic vulnerability assessment of an Italian historical masonry dry dock. Case Stud. Struct. Eng. 2017, 7, 1–23. [Google Scholar] [CrossRef]
- He, G.L.; Hu, H.H.; Chuang, C.Y.; Huang, C.W. Seismic performance of tall pier bridges retrofitted with lead rubber bearings and rocking foundation. Eng. Struct. 2020, 211, 110454. [Google Scholar] [CrossRef]
- Wang, Y.; Ibarra, L.; Pantelides, C. Effect of incidence angle on the seismic performance of skewed bridges retrofitted with buckling-restrained braces. Eng. Struct. 2020, 211, 110411. [Google Scholar] [CrossRef]
- Zucca, M.; Valente, M. On the limitations of decoupled approach for seismic behaviour evaluation of shallow multi-propped underground structures embedded in granular soils. Eng. Struct. 2020, 211, 110497. [Google Scholar] [CrossRef]
- Zucca, M.; Tropeano, G.; Crespi, P.; Erbì, E. Evaluation of the seismic behavior of multi-propped underground structures embedded in granular soils: A comparison between coupled and decoupled approaches. In Proceedings of the 7th International Conference on Earthquake Geotechnical Engineering, Rome, Italy, 17–20 June 2019. [Google Scholar]
- Stochino, F.; Fadda, M.L.; Mistretta, F. Assessment of RC Bridges integrity by means of low-cost investigations. Frattura ed Integrità Strutturale 2018, 46, 216–225. [Google Scholar] [CrossRef]
- Ministerial Decree (NTC2018). Updating of Technical Codes for Constructions (in Italian); Official Gazette n. 42 of 20/02/18, Ordinary Supplement n. 8; Official Gazette: Rome, Italy, 2018. [Google Scholar]
- Kim, S.; D’Amore, E. Push-over Analysis Procedure in Earthquake Engineering. Earthq. Spectra 1999, 15, 417–434. [Google Scholar] [CrossRef]
- Adhikari, G.; Pinho, R. Development and Application of Nonlinear Static Procedures for Plan-Asymmetric Buildings; Research Report No. ROSE-2010/01; ROSE School, IUSS Pavia: Pavia, Italy, 2010. [Google Scholar]
- Chopra, A.K.; Goel, R.K. A modal pushover procedure to estimate seismic demands of buildings. Earthq. Eng. Struct. Dyn. 2002, 31, 561–582. [Google Scholar] [CrossRef]
- Chopra, A.K.; Goel, R.K. A modal pushover analysis procedure to estimate seismic demands for unsymmetric-plan buildings. Earthq. Eng. Struct. Dyn. 2004, 33, 903–927. [Google Scholar] [CrossRef]
- Paraskeva, T.S.; Kappos, A.J.; Sextos, A.G. Extension of modal pushover analysis to seismic assessment of bridges. Earthq. Eng. Struct. Dyn. 2006, 35, 1269–1293. [Google Scholar] [CrossRef]
- Paraskeva, T.S.; Kappos, A.J. Further development of a multimodal pushover analysis procedure for seismic assessment of bridges. Earthq. Eng. Struct. Dyn. 2009, 39, 211–222. [Google Scholar] [CrossRef]
- ATC-40:1996. Seismic Evaluation and Retrofitting of Concrete Buildings; 8.1-8.66; Applied Technology Council: Redwood City, CA, USA, 1996. [Google Scholar]
- Causevic, M.; Mitrovic, S. Comparison between non-linear dynamic and static seismic analysis of structures according to European and US provisions. Bull. Earthq. Eng. 2011, 9, 467–489. [Google Scholar] [CrossRef]
- FEMA 356. Prestandard and Commentary for the Seismic Rehabilitation of Buildings; Federal Emergency Management Agency: Washington, DC, USA, 2000.
- FEMA 440. Improvement of Nonlinear Static Seismic Analysis Procedure; Applied Technology (ATC-55 Project); Department of Homeland Security, Federal Emergency Management Agency: Washington, DC, USA, 2005.
- Ministerial Circular (MC2009). Instruction for the Application of the New Technical Standards for Buildings; Referred to in the Ministerial Decree of 14 January 2008 (in Italian); Official Gazette n. 47 of 26/02/2009, Ordinary Supplement n. 27. Official Gazette: Rome, Italy, 2009. [Google Scholar]
- Verderame, G.M.; Stella, A.; Cosenza, E. Le proprietà meccaniche degli acciai impiegati nelle strutture in cemento armato realizzate negli anni ’60. In Proceedings of the X Convegno Nazionale “L’Ingegneria Simica in Italia”, Potenza and Matera, Italy, 9–13 September 2001. [Google Scholar]
- Longarini, N.; Crespi, P.; Zucca, M.; Giordano, N.; Silvestro, G. The advantages of fly ash use in concrete structures. Inz. Miner. 2014, 15, 141–145. [Google Scholar]
- Kent, D.C.; Park, R. Flexural members with confined concrete. J. Struct. Div. 1971, 97, 1969–1990. [Google Scholar]
- Park, R.; Paulay, T. Reinforced Concrete Structures; John Wiley and Sons: New York, NY, USA, 1973. [Google Scholar]
- MIDAS Civil Analysis Reference. 2020.
- EN 1337-3:2005. Structural Bearings–Part 3: Elastomeric Bearings; CEN (European Committee for Standardization), Management Centre: Brussels, Belgium, 2005. [Google Scholar]
- EN 1998-2:2005. Eurocode 8: Design of structures for earthquake resistance–Part 2: Bridges; CEN (European Committee for Standardization), Management Centre: Brussels, Belgium, 2005. [Google Scholar]
- EN 1998-3:2005. Eurocode 8: Design of Structures for Earthquake Resistance–Part 3: Assessment and Retrofitting of Buildings; CEN (European Committee for Standardization), Management Centre: Brussels, Belgium, 2005. [Google Scholar]
- Italian Civil Protection Ordinanza n. 3274/2003—Articolo 2, commi 3 e 4, D.M.14/1/2008—Scheda di sintesi della verifica sismica di “livello 1” o di “livello 2” per i ponti strategici ai fini della protezione civile o rilevanti in caso di collasso a seguito di evento sismico (In Italian). 2008.
- Valente, M.; Milani, G. Alternative retrofitting strategies to prevent the failure of an under-designed RC frame. Eng. Fail. Anal. 2018, 89, 271–285. [Google Scholar] [CrossRef]


| Bridge 1 Pier 1 | Bridge 2 Pier 1 | Bridge 3 Pier 1 | Bridge 4 Pier 1 | Bridge 5 Pier 1 | Bridge 6 Pier 1 | |||||||
|---|---|---|---|---|---|---|---|---|---|---|---|---|
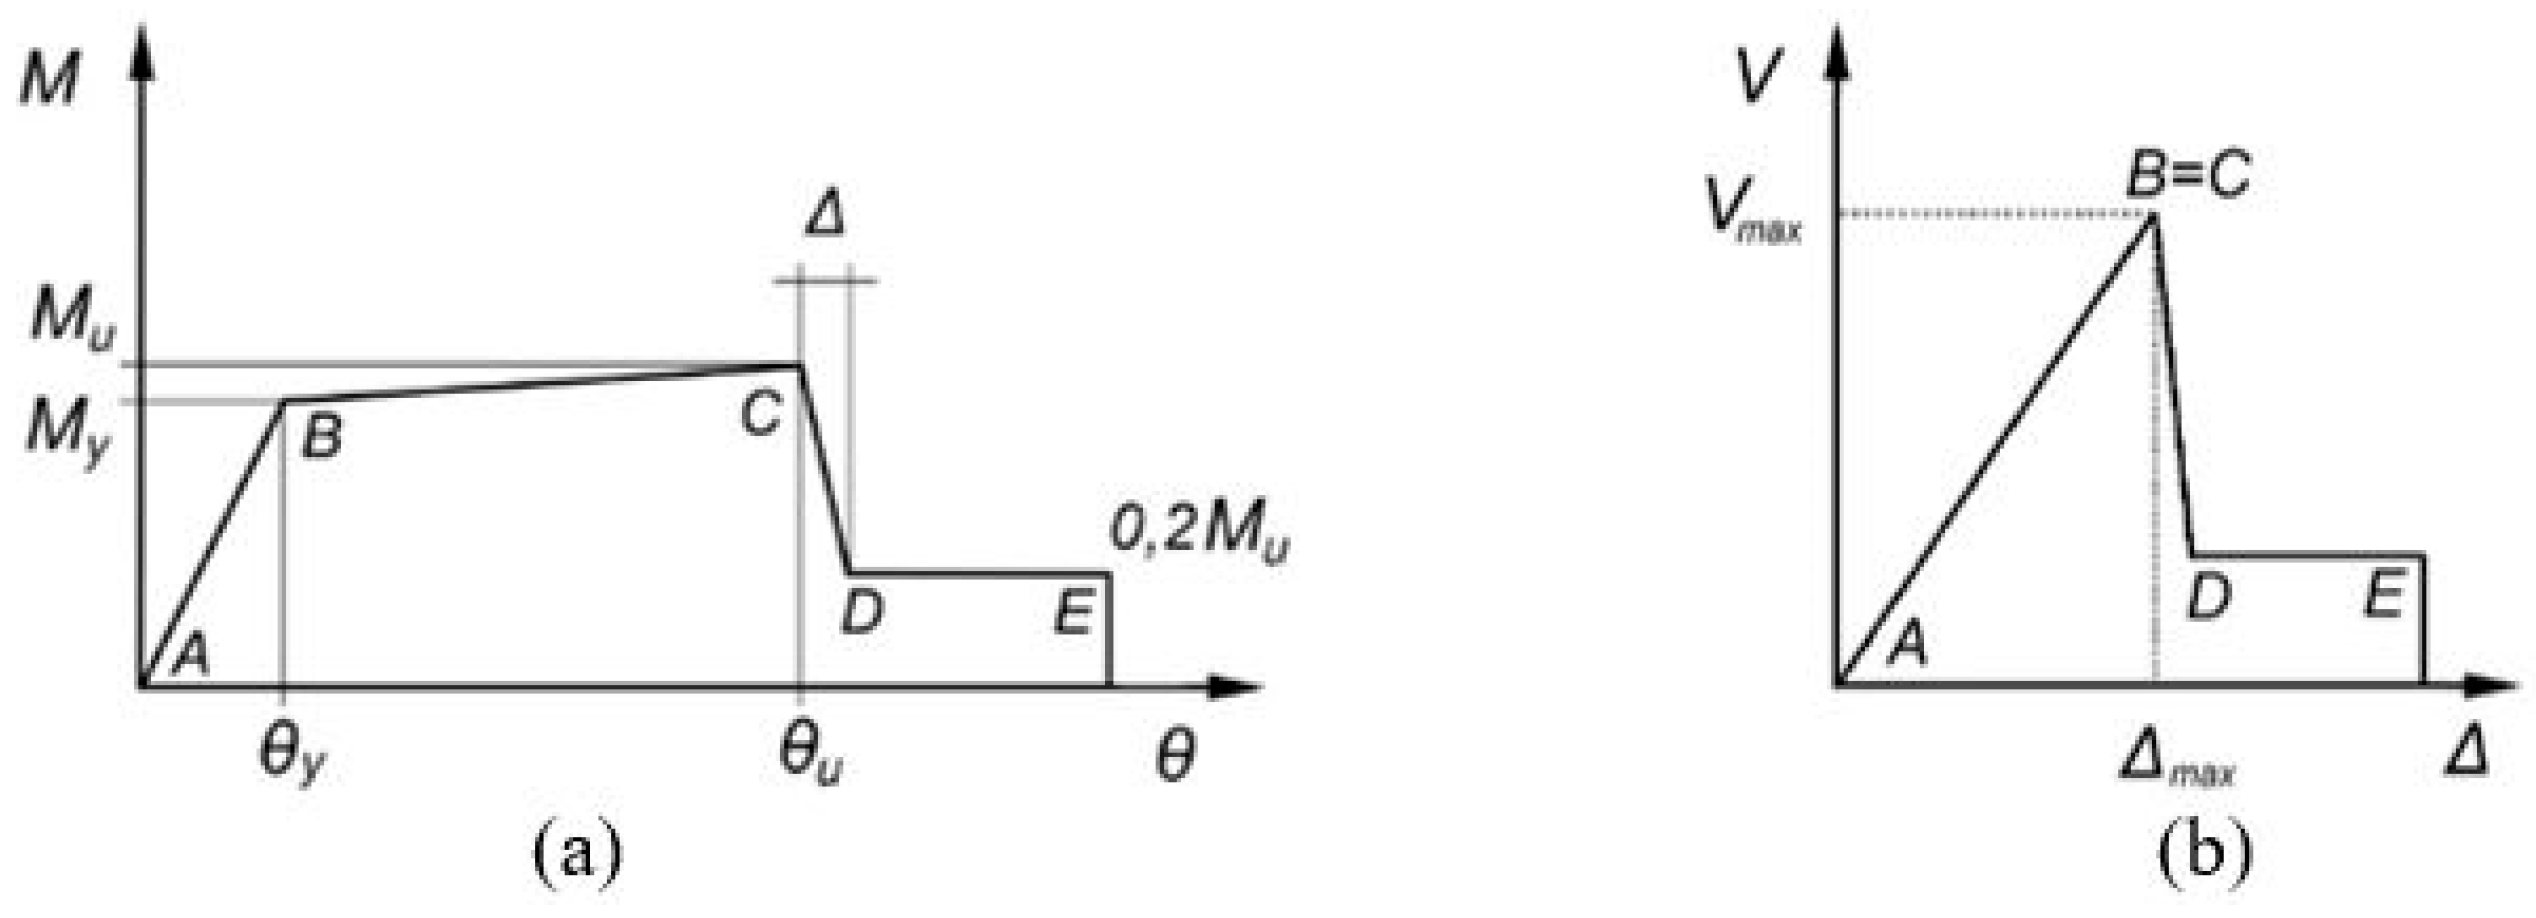
| Diagram Point (Figure 4a) | ϑ [rad] | M [kNm] | ϑ [rad] | M [kNm] | ϑ [rad] | M [kNm] | ϑ [rad] | M [kNm] | ϑ [rad] | M [kNm] | ϑ [rad] | M [kNm] |
| A | 0 | 0 | 0 | 0 | 0 | 0 | 0 | 0 | 0 | 0 | 0 | 0 |
| B | 0.0005 | 62310 | 0.0029 | 956 | 0.0007 | 16611 | 0.0045 | 2288 | 0.0027 | 4953 | 0.0014 | 8796 |
| C | 0.0045 | 73349 | 0.0186 | 1223 | 0.0078 | 20929 | 0.0290 | 2791 | 0.0174 | 6339 | 0.0094 | 12138 |
| D | 0.0045 | 12462 | 0.0186 | 191 | 0.0078 | 3322 | 0.0290 | 458 | 0.0174 | 990 | 0.0094 | 1752 |
| E | 0.0079 | 12462 | 0.0235 | 191 | 0.0079 | 3322 | 0.0315 | 450 | 0.0189 | 990 | 0.0098 | 1752 |
| Bridge 1 Pier 1 | Bridge 2 Pier 1 | Bridge 3 Pier 1 | Bridge 4 Pier 1 | Bridge 5 Pier 1 | Bridge 6 Pier 1 | |||||||
|---|---|---|---|---|---|---|---|---|---|---|---|---|
| Diagram Point (Figure 4b) | Δ [mm] | V [kNm] | Δ [mm] | V [kNm] | Δ [mm] | V [kNm] | Δ [mm] | V [kNm] | Δ [mm] | V [kNm] | Δ [mm] | V [kNm] |
| A | 0 | 0 | 0 | 0 | 0 | 0 | 0 | 0 | 0 | 0 | 0 | 0 |
| B | 0.3371 | 2707 | 0.2430 | 190 | 0.1901 | 738 | 0.7696 | 818 | 0.4853 | 768 | 0.4341 | 424 |
| C | 0.3371 | 2707 | 0.2430 | 190 | 0.1901 | 738 | 0.7696 | 818 | 0.4853 | 768 | 0.4341 | 424 |
| D | 0.3640 | 541 | 0.2624 | 38 | 0.2053 | 148 | 0.8311 | 164 | 0.5241 | 154 | 0.4688 | 85 |
| E | 1.3485 | 541 | 0.9720 | 38 | 0.3802 | 148 | 1.5392 | 164 | 0.9706 | 154 | 0.8682 | 85 |
| Bridge 1 | Bridge 2 | Bridge 3 | Bridge 4 | Bridge 5 | Bridge 6 | ||||||||||||
|---|---|---|---|---|---|---|---|---|---|---|---|---|---|---|---|---|---|
| n° | Tj [s] | mj [%] | n° | Tj [s] | mj [%] | n° | Tj [s] | mj [%] | n° | Tj [s] | mj [%] | n° | Tj [s] | mj [%] | n ° | Tj [s] | mj [%] |
| 1 | 0.932 | 23.6 | 2 | 0.624 | 73.9 | 1 | 0.970 | 92.4 | 3 | 1.293 | 36.0 | 1 | 0.993 | 84.0 | 3 | 1.272 | 92.3 |
| 4 | 0.881 | 17.1 | 6 | 0.572 | 10.0 | 2 | 0.803 | 5.8 | 5 | 1.085 | 31.7 | 6 | 0.376 | 10.8 | 9 | 0.410 | 5.6 |
| 11 | 0.791 | 5.2 | 25 | 0.148 | 9.5 | - | - | - | 8 | 0.827 | 12.4 | - | - | - | - | - | - |
| 86 | 0.205 | 10.3 | - | - | - | - | - | - | - | - | - | - | - | - | - | - | - |
| Bridge 1 | Bridge 2 | Bridge 3 | Bridge 4 | Bridge 5 | Bridge 6 | ||||||||||||
|---|---|---|---|---|---|---|---|---|---|---|---|---|---|---|---|---|---|
| n° | Tj [s] | mj [%] | n° | Tj [s] | mj [%] | n° | Tj [s] | mj [%] | n° | Tj [s] | mj [%] | n° | Tj [s] | mj [%] | n° | Tj [s] | mj [%] |
| 1 | 0.932 | 6.0 | 1 | 0.632 | 70.5 | 1 | 0.970 | 5.8 | 1 | 2.051 | 42.4 | 3 | 0.630 | 6.9 | 1 | 1.678 | 60.5 |
| 11 | 0.791 | 19.9 | 5 | 0.591 | 10.3 | 2 | 0.803 | 90.5 | 2 | 1.621 | 5.0 | 5 | 0.529 | 76.9 | 5 | 0.816 | 14.4 |
| 17 | 0.776 | 13.7 | 23 | 0.148 | 9.3 | - | - | - | 4 | 1.185 | 8.1 | 11 | 0.255 | 11.0 | 6 | 0.718 | 10.9 |
| 33 | 0.724 | 5.6 | - | - | - | - | - | - | 6 | 1.046 | 13.8 | - | - | - | 15 | 0.276 | 5.9 |
| 86 | 0.205 | 5.7 | - | - | - | - | - | - | - | - | - | - | - | - | - | - | - |
| Bridge 1 | Bridge 2 | Bridge 3 | Bridge 4 | Bridge 5 | Bridge 6 | |||||||
|---|---|---|---|---|---|---|---|---|---|---|---|---|
| Long. | Tran. | Long. | Tran. | Long. | Tran. | Long. | Tran. | Long. | Tran. | Long. | Tran. | |
| PGAC [g] | 0.266 | 0.266 | 0.326 | 0.278 | 0.509 | 0.509 | 0.187 | 0.201 | 0.449 | 0.495 | 0.232 | 0.585 |
| TR [years] | 6188 | 6188 | 9965 | 6226 | 47,968 | 47,968 | 480,730 | 678,299 | 470,783 | 655,387 | 37,983 | 680,065 |
| RIPGA [-] | 1.785 | 1.785 | 2.188 | 1.866 | 3.416 | 3.416 | 3.696 | 3.973 | 6.210 | 6.844 | 3.256 | 8.195 |
| RITR [-] | 2.157 | 2.157 | 2.622 | 2.162 | 4.995 | 4.995 | 12.849 | 14.797 | 12.740 | 14.590 | 4.539 | 14.813 |
| Bridge 1 | Bridge 2 | Bridge 3 | Bridge 4 | Bridge 5 | Bridge 6 | |||||||
|---|---|---|---|---|---|---|---|---|---|---|---|---|
| Long. | Tran. | Long. | Tran. | Long. | Tran. | Long. | Tran. | Long. | Tran. | Long. | Tran. | |
| PGAC [g] | 0.090 | 0.460 | 0.043 | 0.034 | 0.077 | 0.077 | 0.052 | 0.058 | 0.094 | 0.064 | 0.152 | 0.573 |
| TR [years] | 14 | 35,858 | 43 | 26 | 189 | 189 | 1063 | 1746 | 2316 | 664 | 9985 | 638,303 |
| RIPGA [-] | 0.604 | 3.087 | 0.289 | 0.228 | 0.517 | 0.517 | 1.026 | 1.138 | 1.302 | 0.855 | 2.123 | 8.031 |
| RITR [-] | 0.178 | 4.433 | 0.281 | 0.229 | 0.516 | 0.516 | 1.048 | 1.284 | 1.442 | 0.864 | 2.624 | 14.433 |
© 2020 by the authors. Licensee MDPI, Basel, Switzerland. This article is an open access article distributed under the terms and conditions of the Creative Commons Attribution (CC BY) license (http://creativecommons.org/licenses/by/4.0/).
Share and Cite
Crespi, P.; Zucca, M.; Longarini, N.; Giordano, N. Seismic Assessment of Six Typologies of Existing RC Bridges. Infrastructures 2020, 5, 52. https://doi.org/10.3390/infrastructures5060052
Crespi P, Zucca M, Longarini N, Giordano N. Seismic Assessment of Six Typologies of Existing RC Bridges. Infrastructures. 2020; 5(6):52. https://doi.org/10.3390/infrastructures5060052
Chicago/Turabian StyleCrespi, Pietro, Marco Zucca, Nicola Longarini, and Nicola Giordano. 2020. "Seismic Assessment of Six Typologies of Existing RC Bridges" Infrastructures 5, no. 6: 52. https://doi.org/10.3390/infrastructures5060052
APA StyleCrespi, P., Zucca, M., Longarini, N., & Giordano, N. (2020). Seismic Assessment of Six Typologies of Existing RC Bridges. Infrastructures, 5(6), 52. https://doi.org/10.3390/infrastructures5060052