Article

Lessons Learned Regarding Cracking of a Concrete Arch Dam Due to Seasonal Temperature Variations

KTH Royal Institute of Technology, SE 100 44 Stockholm, Sweden
*
Author to whom correspondence should be addressed.
Infrastructures 2020, 5(2), 19; https://doi.org/10.3390/infrastructures5020019
Submission received: 30 January 2020 / Revised: 17 February 2020 / Accepted: 17 February 2020 / Published: 19 February 2020
(This article belongs to the Special Issue Advances in Dam Engineering)

Abstract

:
Dams located in cold areas are subjected to large seasonal temperature variations and many concrete dams have cracked as a result. In the 14th International Commission on Large Dams (ICOLD) Benchmark Workshop, a case study was presented where contributors should predict the cracking and displacements due to seasonal variations. In this paper, the conclusions from this case study are presented. Overall, the results from the contributors are well in line with the observations that can be made on the dam and the measurements performed. This shows that using non-linear numerical models is a suitable tool to accurately predict cracking and estimate the displacements of cracked dams. This case study also highlighted important aspects that need special consideration in order to obtain realistic results that can be used to predict the crack pattern, these being: (1) the importance of performing transient thermal analyses based on robin boundary conditions; (2) the influence of contact formulation between the concrete dam and the foundation; and (3) the use of realistic non-linear material properties. The results and conclusions presented in this paper constitute one important step in achieving best practices to estimate dam safety and better understand the potential failure modes and ageing of concrete dams.

Graphical Abstract

1. Introduction

For many large concrete structures, the load effects that occur from variations in ambient conditions may be the dominating loads that introduce significant stresses in the structure. Due to its size and massive cross-section, significant thermal or moisture gradients may occur. This is especially the case for concrete dams where parts of the structure are subjected to water while other parts are in contact with the ambient air. Structures located in cold climates are subjected to harsh environmental conditions with large seasonal variations in temperature. The ambient temperature difference between summer and winter can be about 70 °C during a year in Northern Hemisphere countries such as Sweden [1].
Temperature variations have been shown to cause cracking in several concrete dams, [2,3]. Temperatures that deviate from the zero strain temperature in the concrete will induce either tensile or compressive strains. The zero strain temperature (or reference temperature) corresponds to the temperature that the concrete is considered stress free and hence had when first subjected to restraint. This temperature is often also denoted as the closing temperature (i.e., the temperature when the final segment is cast that causes the structure to be subjected to restraint). The induced cracks caused by cyclic seasonal temperature variations often occur close to restraints or in large, massive areas without contraction joints [4]. During winter, when the ambient air is colder than the reservoir, the downstream part of the concrete dam will shrink in relation to the concrete at the upstream part. This will induce tensile stresses in the downstream part of the dam that may result in cracking. The thermal shrinkage of the downstream part causes the dam to deform in the downstream direction. In contrast, during summer when the ambient temperature is higher than the reservoir, the dam will deform in the upstream direction and this deformation causes a risk of cracking in the upstream part of the dam.
The influence of seasonal temperature variations and its imposed deformations on concrete dams have been studied based on several different types of models in the literature. Most of the references have focused on statistical (data-based) prediction models using regression analysis. These models are based on the assumption that the dam behaviour can be described by the following effects: Hydrostatic–Seasonal-Time (HST) or Hydrostatic–Temperature–Time (HTT) (see for instance [5,6,7], among others). In recent years, data-based models based on machine learning techniques such as artificial neural networks (ANN), support vector machines (SVM), and boosted regression trees (BRT) are becoming more and more widely used (see [8]). All these methods have great possibilities of giving highly accurate predictions of the normal behaviour of a dam. These methods, however, need a sufficient amount of data, typically a few years of recordings, in order to train and evaluate the models. In addition, this type of model can have difficulties in detecting progressive damage evolution, as shown by [9].
Numerical models based on the finite element method have been used to assess the deformations or induced stresses from seasonal temperature variations (see [10,11,12,13], among others). In these types of studies, the predicted behaviour is also commonly calibrated or compared with measurements. This was, for instance, the case in [14,15], who performed the calibration of the thermal behaviour of the Karun III Dam with measurements, but also estimated the structural safety. There are, however, few references that have performed simulations that account for crack initiation and propagation that have aimed to predict the crack pattern and analyse how these cracks influence the dam behaviour. In the study by Malm and Ansell [3], the cracking in a concrete buttress dam due to seasonal variations was simulated and shown that the cracking that occurred on many of the concrete buttress dams in Sweden was directly caused by the seasonal thermal variation, and that the cracks found in situ could be accurately captured with the use of non-linear finite element analyses based on constitutive material models to describe cracking.
The assessment and maintenance of existing dams represent a challenge for the whole dam engineering community. The ICOLD (International Commission on Large Dams) Committee on Computational Aspects of Dam Analysis and Design has since 1991 organised 15 benchmark workshops with the aim of offering dam engineers and researchers the opportunity to share knowledge focused on modelling strategies and best praxis regarding the numerical analyses of dams. In theme A of the 14th benchmark workshop, the contributors were asked to analyse the cracking of a concrete arch dam in northern Sweden subjected to seasonal temperature variations using numerical analyses. The formulators of the theme defined and delivered the geometry, material properties, and loads, while some other aspects of the numerical modelling were intentionally undefined to allow the contributors to make their assumptions and choices [1]. The aim of this benchmark workshop was to make blind predictions of the extent of cracking and to assess its influence on the response (e.g., displacements) of the dam. In this paper, the benchmark workshop is presented along with the conclusions and lessons learned regarding the numerical analyses of the seasonal temperature variations of concrete dams.

2. Case Study

In theme A of the 14th benchmark workshop, a Swedish concrete arch dam was used as a case study to analyse the influence of cracks on the structural response of the dam. The input data can be obtained from [16].

2.1. The Reinforced Concrete Arch Dam

The dam used as a case study is located in the northern part of Sweden and is thereby subjected to significant seasonal variations in temperature between summer and winter.
The dam was taken into operation in the 1960s. The concrete arch dam is a single curvature dam with a radius of 110 m, a crest length of 170 m, and a maximum height of about 40 m and is shown in Figure 1. The dam is slender, with a crest thickness of 2.5 m and a thickness at the base of 5.7 m. The relatively low and wide geometrical properties of the dam results in a quite high length-to-height ratio of 4.25. One explanation for the slender geometry can be that it was built in a low seismicity zone and seismic loads were not considered in the design. Another unique feature is that it is built of reinforced concrete, with one reinforcement layer on the upstream surface and two layers on the downstream surface. Each reinforcement layer consisted of bars with a diameter of 25 mm and a spacing of 300 mm in both the hoop (horizontal) and vertical directions. The reinforcement bars are spliced and transmits forces over the vertical contraction joints to ensure that the dam acts as a monolithic structure.
This dam, as most other dams in Sweden, was built with an insulating wall on the downstream surface to reduce the temperature gradient through the dam. However, only a few years after operation, cracks caused by the seasonal temperature variations were detected on the downstream part of the dam. These cracks continued to grow under the following years and the dam behaviour was continuously being kept under supervision with a monitoring system. The monitoring consists of measurements of the deflections of the arch dam, using a total station at the points shown in Figure 2. Initially, the measurements were made on a monthly basis, but when it was shown that no significant change in behaviour occurred, the recordings were reduced to twice a year. Eight monitoring points were placed along the crest (section 100). About 18 m below the crest, the next measuring section is located (section 200) and measuring section 300 is located about 26 m below the crest. In both of these latter sections, three measuring points are installed. This means that it is possible to evaluate the displacements along the elevation of the dam at Section 03, Section 06, and Section 09, as shown in Figure 2.
In Figure 3, typical recordings from the displacement measurements are presented for the summer and winter conditions, respectively. The difference between the retention water level and the minimum water level was only 2 m for this dam, implying that the variation in water level has a small effect on its seasonal deformations. Hence, the measured displacement is primarily governed by the variations in temperature. The measured displacements are presented along the crest (see Figure 3a) where the origin of the x-axis is located at the spillway and along the elevation in the centre (see Figure 3b). The curves were created based on the recordings of the measuring points illustrated in Figure 2, and for the representation of the results along the crest, a spline curve was developed. The recorded values are illustrated in Figure 3a with squared symbols while the smooth continuous curve is a result from the spline function. Positive displacement shown in the figure corresponds to displacement in the downstream direction (x-direction) of the dam while negative displacement corresponds to upstream movement. Results are presented for two representative cases, a few years after construction (1960s) and after about 50 years of service (2010s).
As seen in Figure 3a, the maximum displacement along the crest was in general larger in the years following the construction, and over the years, the displacement along the crest has reduced. This is valid for both summer and winter conditions, where the peak to peak value between summer and winter has decreased. The same phenomenon can be seen in Figure 3b, which shows the measured displacement in the centre of the dam as a function of the elevation. As can be seen in the figure, the shape of the displacement curve during winter was almost linear a few years after completion of the dam. Over the years, the displacement curve has become more curved with a maximum approximately 20 m above the ground.
There are naturally some differences in temperature from one year to another, which partly could explain some of the deviation of the measured displacement along the crest shown in Figure 3a. However, this could not explain the curved shape that has been measured in recent winters, as shown in Figure 3b [17]. This changed behaviour is caused by cracking, where several horizontal cracks have initiated on the downstream surface of the dam. These cracks are arching on the downstream side toward the left- and right-hand side of the dam (see Figure 3). As a result of cracking, the restraint has reduced, which resulted in a lower global temperature, inducing displacements of the dam. In Figure 3, an illustration of the observed crack pattern on the downstream surface of the dam is also illustrated. As can be seen in the figure, the cracks have mainly been initiated in the bottom two thirds of the dam height. To the right in Figure 3, the cross-section of the dam is also illustrated.

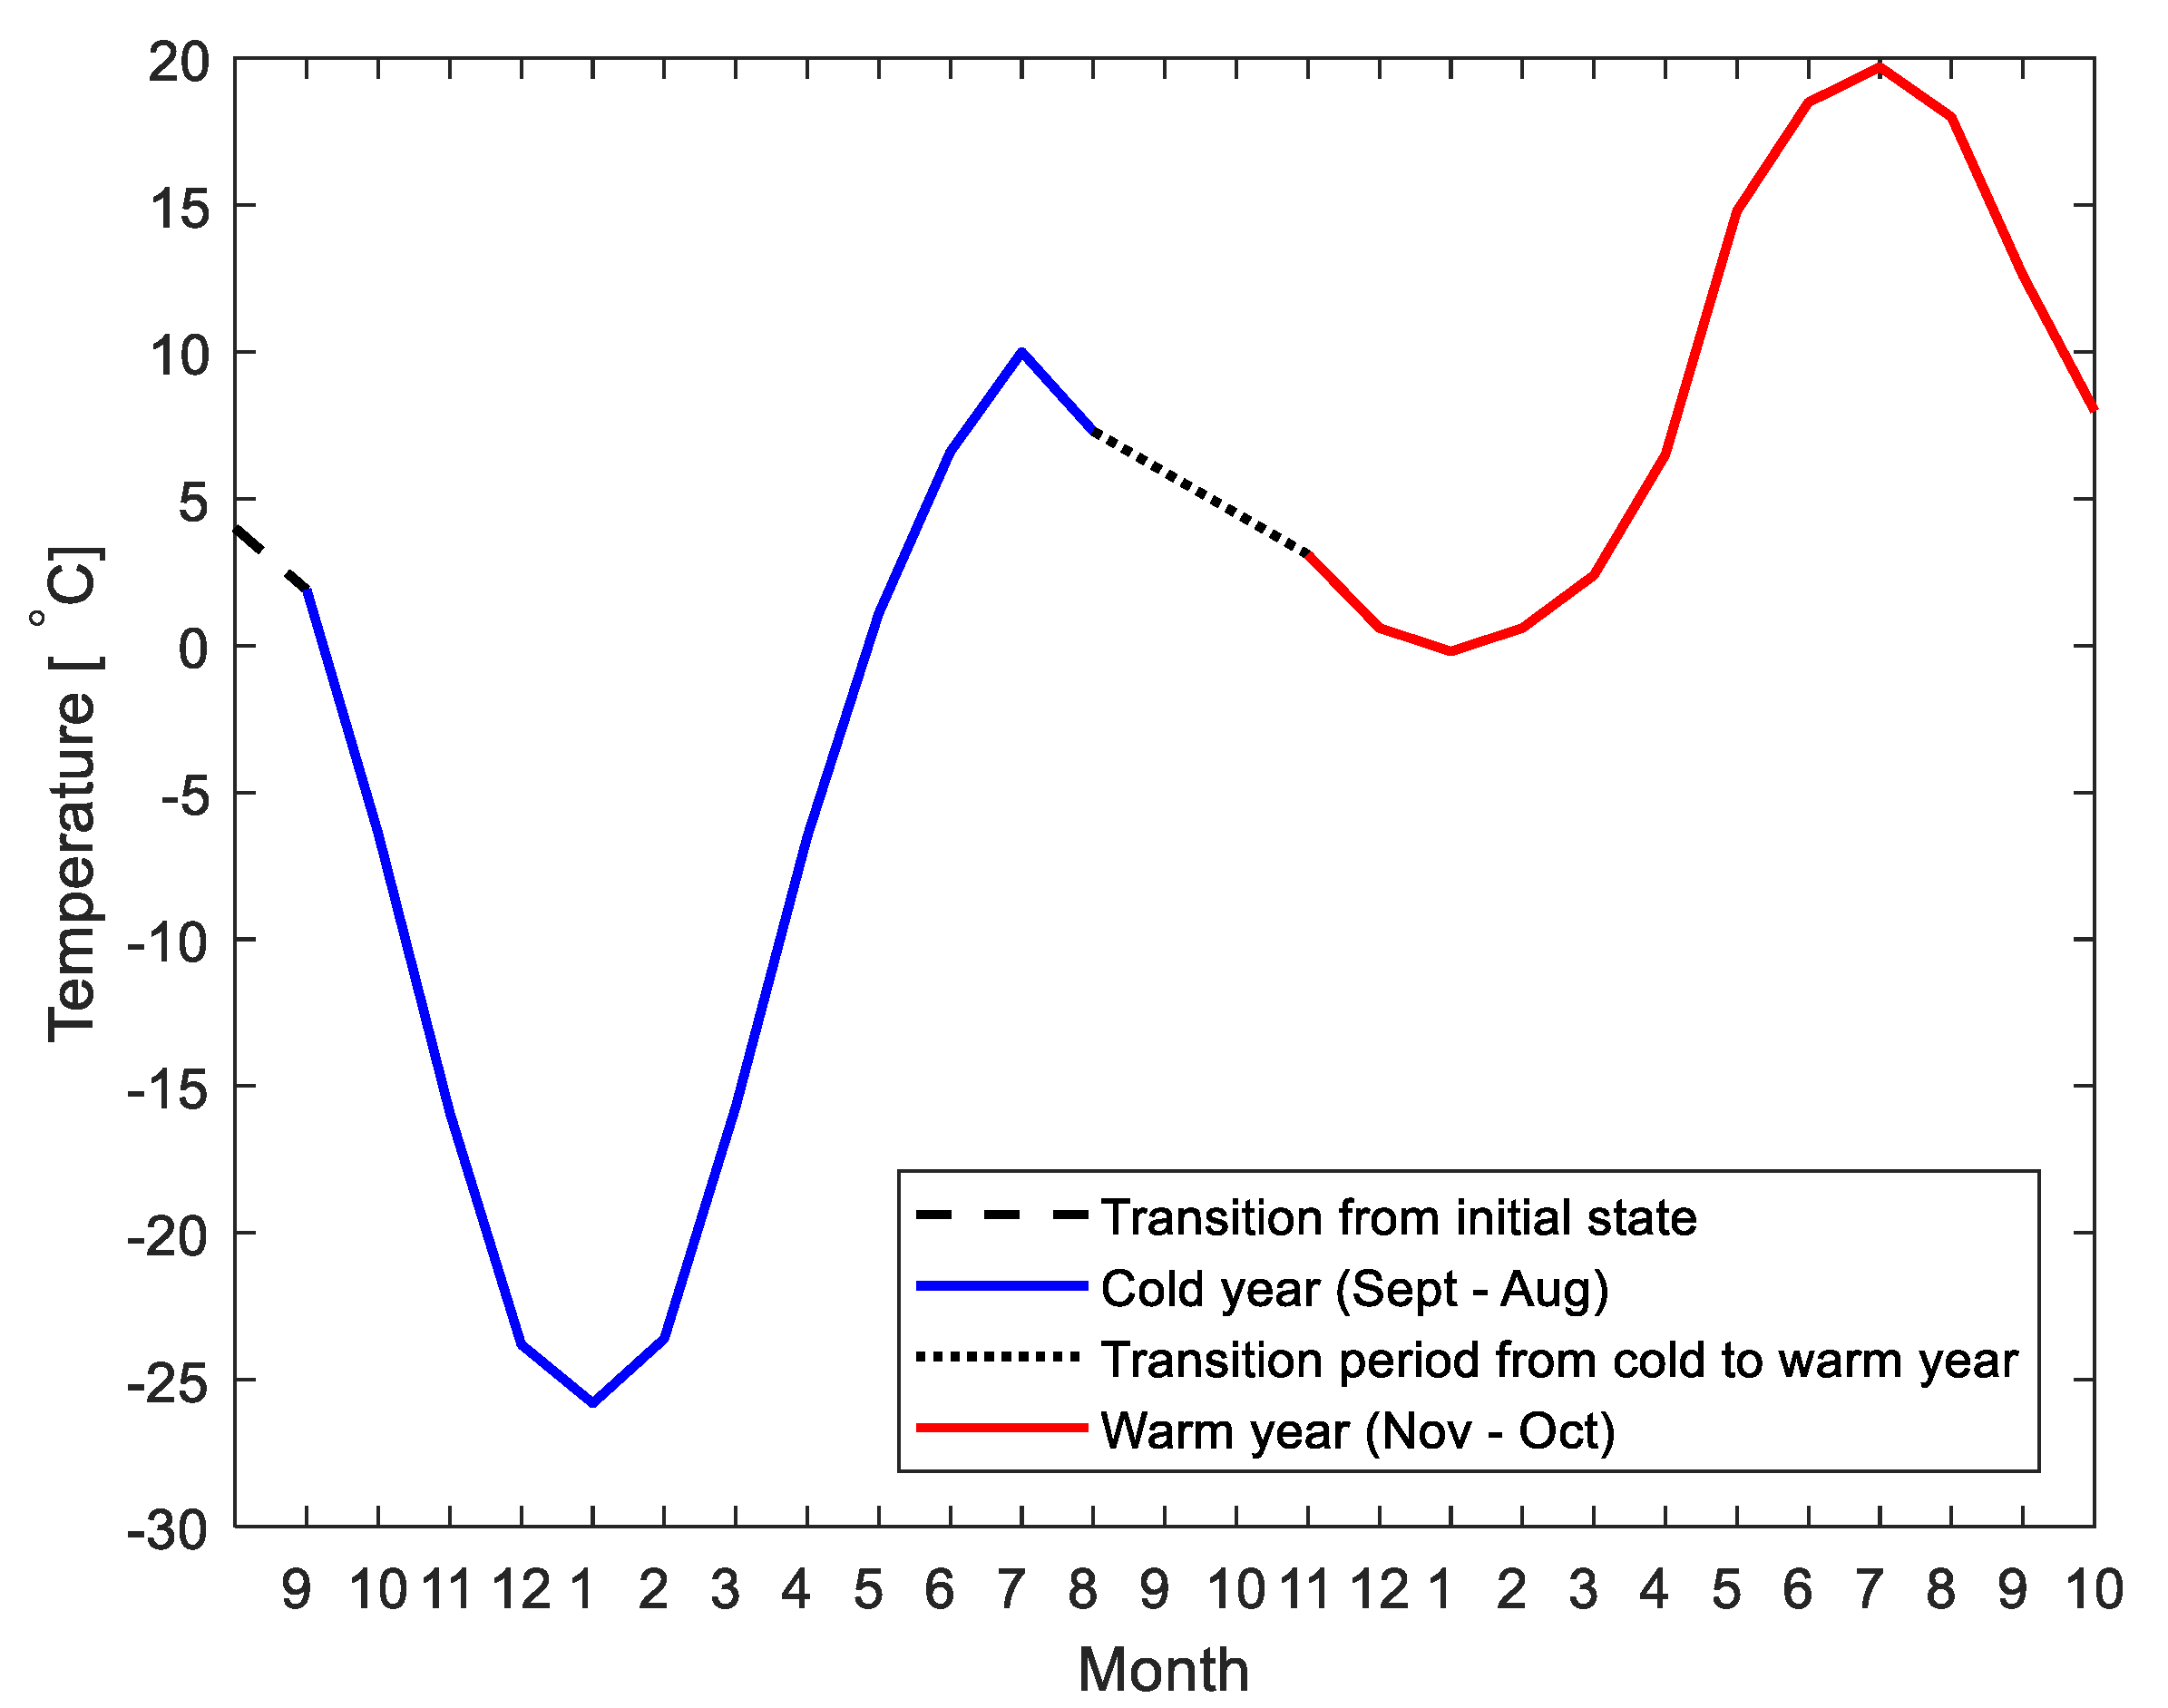
2.2. Temperature Variations

Temperature data were gathered from a weather station located about 20 km from the dam. From this weather station, measurements of the average daily temperature have been available since 1973. However, temperatures with a short duration have little effect on the structural behaviour. According to [18], daily temperature variations have minor effects since these cannot propagate in the concrete structure to a great extent. Therefore, [18] recommended that the temperature variation from one week to another is suitable to consider in numerical analyses. Therefore, the measured temperatures were averaged to give the maximum and minimum temperatures over a seven day period (i.e., weekly variations). Two extreme temperature profiles were developed based on these values, one for a warm year with the maximum temperatures and one cold year based on the minimum temperatures. These two extreme years were then combined as shown in Figure 4. The minimum weekly average temperature occurred in January and was −25.8 °C and the maximum temperature occurred in July and was 19.7 °C. This corresponds to a difference of ΔT 45.5 °C between winter and summer based on weekly average temperatures. A similar curve was also produced that started with the warm year, and the contributors were free to choose which to use (see [1]).
The influence from solar radiation can be significant on high, thin arch dams, as shown by [14]. However, it was not considered in this case. The reason for this is that the effect from solar radiation is quite small in the Nordic countries (see [18]) and this dam has an insulation wall installed on the downstream side and thereby, the downstream part of the dam is not exposed to solar radiation.
Recordings of the water temperature were not available, but according to [18], it was defined as 70% of the ambient air temperature if the temperature was above freezing, otherwise assumed equal to zero. This assumption was based on previous measurements of water temperatures in the reservoir on other dams, which showed that the water temperature is more or less constant over the depth and just above freezing temperature (i.e., 0 °C) during the winter (see for instance [19]).
In order to include the effect of the insulation wall in the numerical models, a convective heat transfer coefficient for the downstream part of the dam was derived, which considered the thermal properties of the insulation wall and the air gap between the insulation wall and the concrete. The provided values for the convective heat coefficients are presented in Table 1.

2.3. Material Properties

Both thermal and mechanical material properties are required to perform non-linear analyses regarding thermal induced cracking from seasonal variations. The material properties defined for the benchmark workshop are presented in Table 2.
In the benchmark workshop, the fracture energy of concrete was intentionally omitted and thereby had to be defined by the contributors.
In a large concrete structure that has been built for a considerable time, the reference (stress/strain free) temperature may vary in different parts of the structure and may change over time due to ageing, creep, and cracking. This is, however, normally not considered, instead a constant reference temperature is derived for the whole structure. In this case study, the reference temperature was defined as the annual average temperature at the dam site in accordance with the recommendation of the Federal Energy Regulatory Commission (FERC) [20].

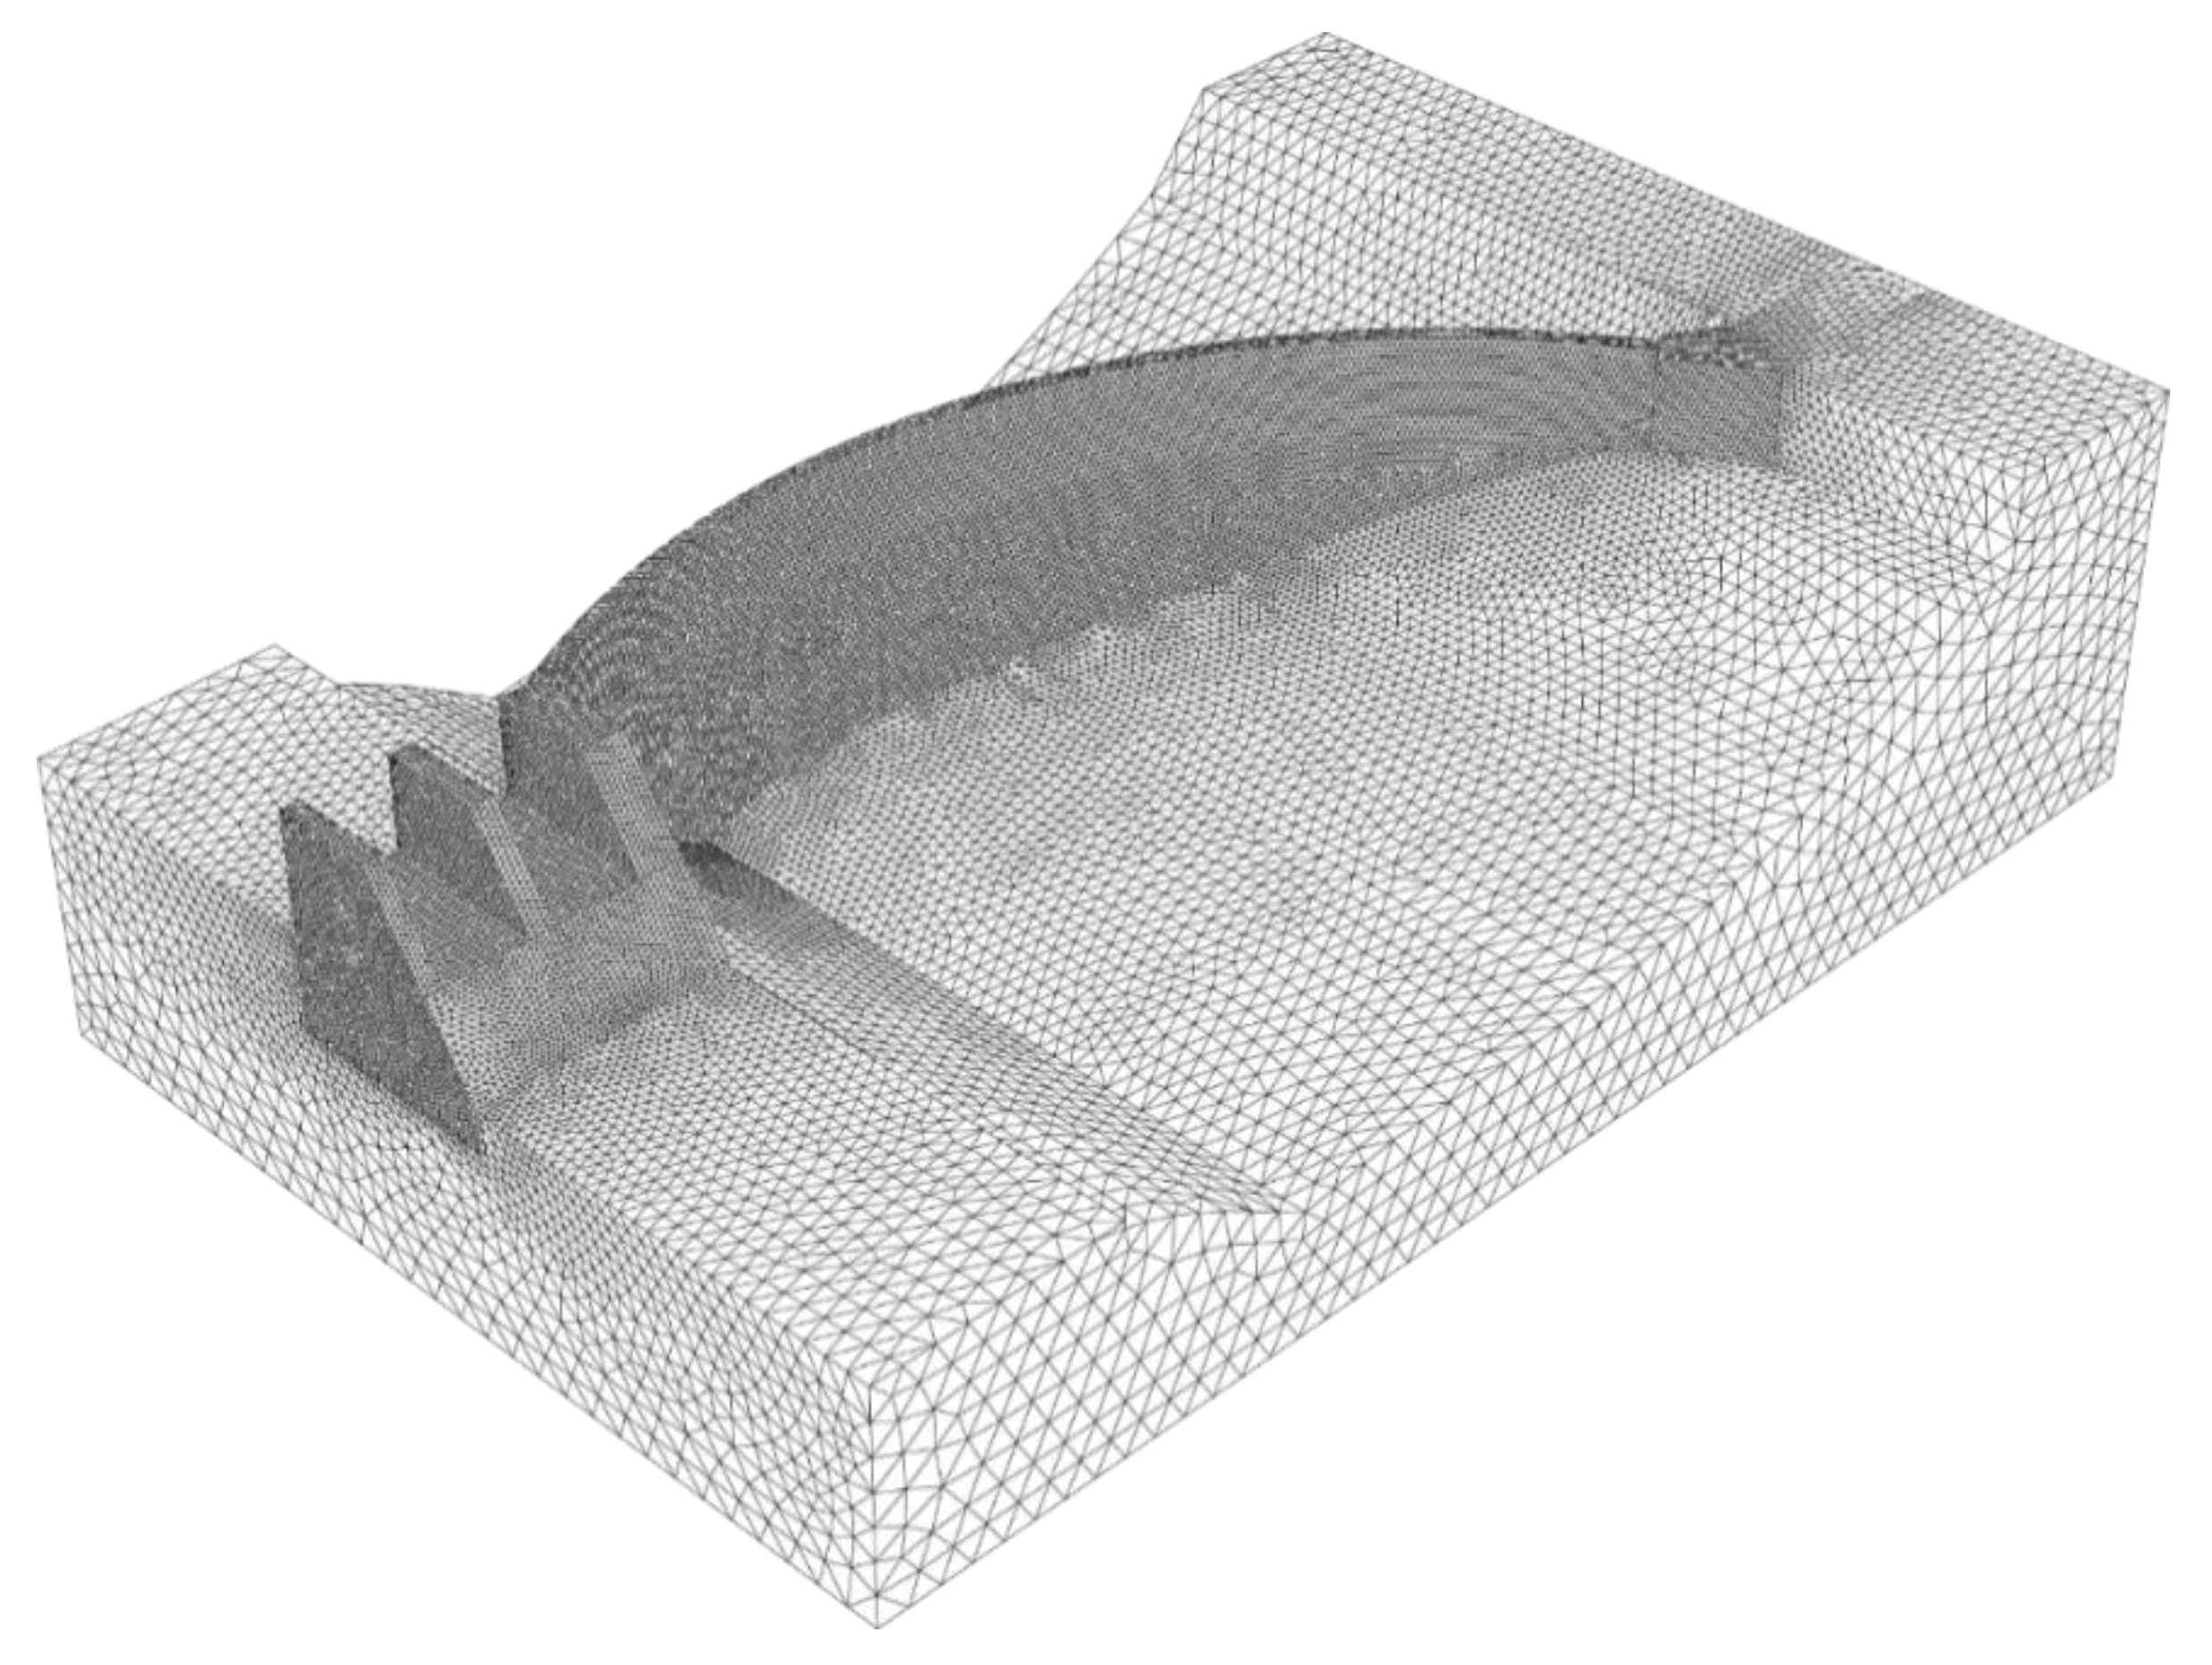
2.4. Geometrical Model and Mesh

A geometrical model had been developed by the formulators for the arch dam, its abutments, the spillway, and the rock foundation. The model was supplied to the contributors in different CAD formats and also with a suggested mesh (see Figure 5). The numerical mesh was developed in HyperMesh and the finite element program Abaqus ver. 2017. The provided mesh was based on 4-node linear tetrahedron elements (denoted C3D4), where the mesh size of the dam was defined as small enough to ensure that the element length was less than the characteristic length of the concrete material. This ensures that the elastically stored energy that is released during cracking can be captured by the surrounding elements. The characteristic length ( l c h ) is a material property that describes the ductility of the material and is defined as
l c h = E · G f f t 2
where   E is the elastic modulus [Pa] ;   G f is the fracture energy [Nm/m2] ;   and   f t is the tensile strength [Pa].
Based on the material properties given in Table 2, the characteristic length of the concrete used in the dam was 1.1 m, and hence a smaller element length than this is required to capture the energy release during cracking. In the dam and spillway, a typical element length of about 0.75 m was used in the provided mesh. The concrete parts in the provided mesh consisted of 65,874 nodes and 292,536 elements. The provided mesh of the rock varied in element length between 0.75 and 3.0 m and the rock consisted of 43,942 nodes and 208,399 elements.
The provided mesh was highly detailed to ensure accurate results for the non-linear analyses performed to capture the crack pattern. A coarser mesh could be used, especially for the linear analyses and still obtain numerically converging results. Some contributors created their own mesh. which was slightly coarser than the one provided, but was generally smaller than the characteristic length of the concrete material.

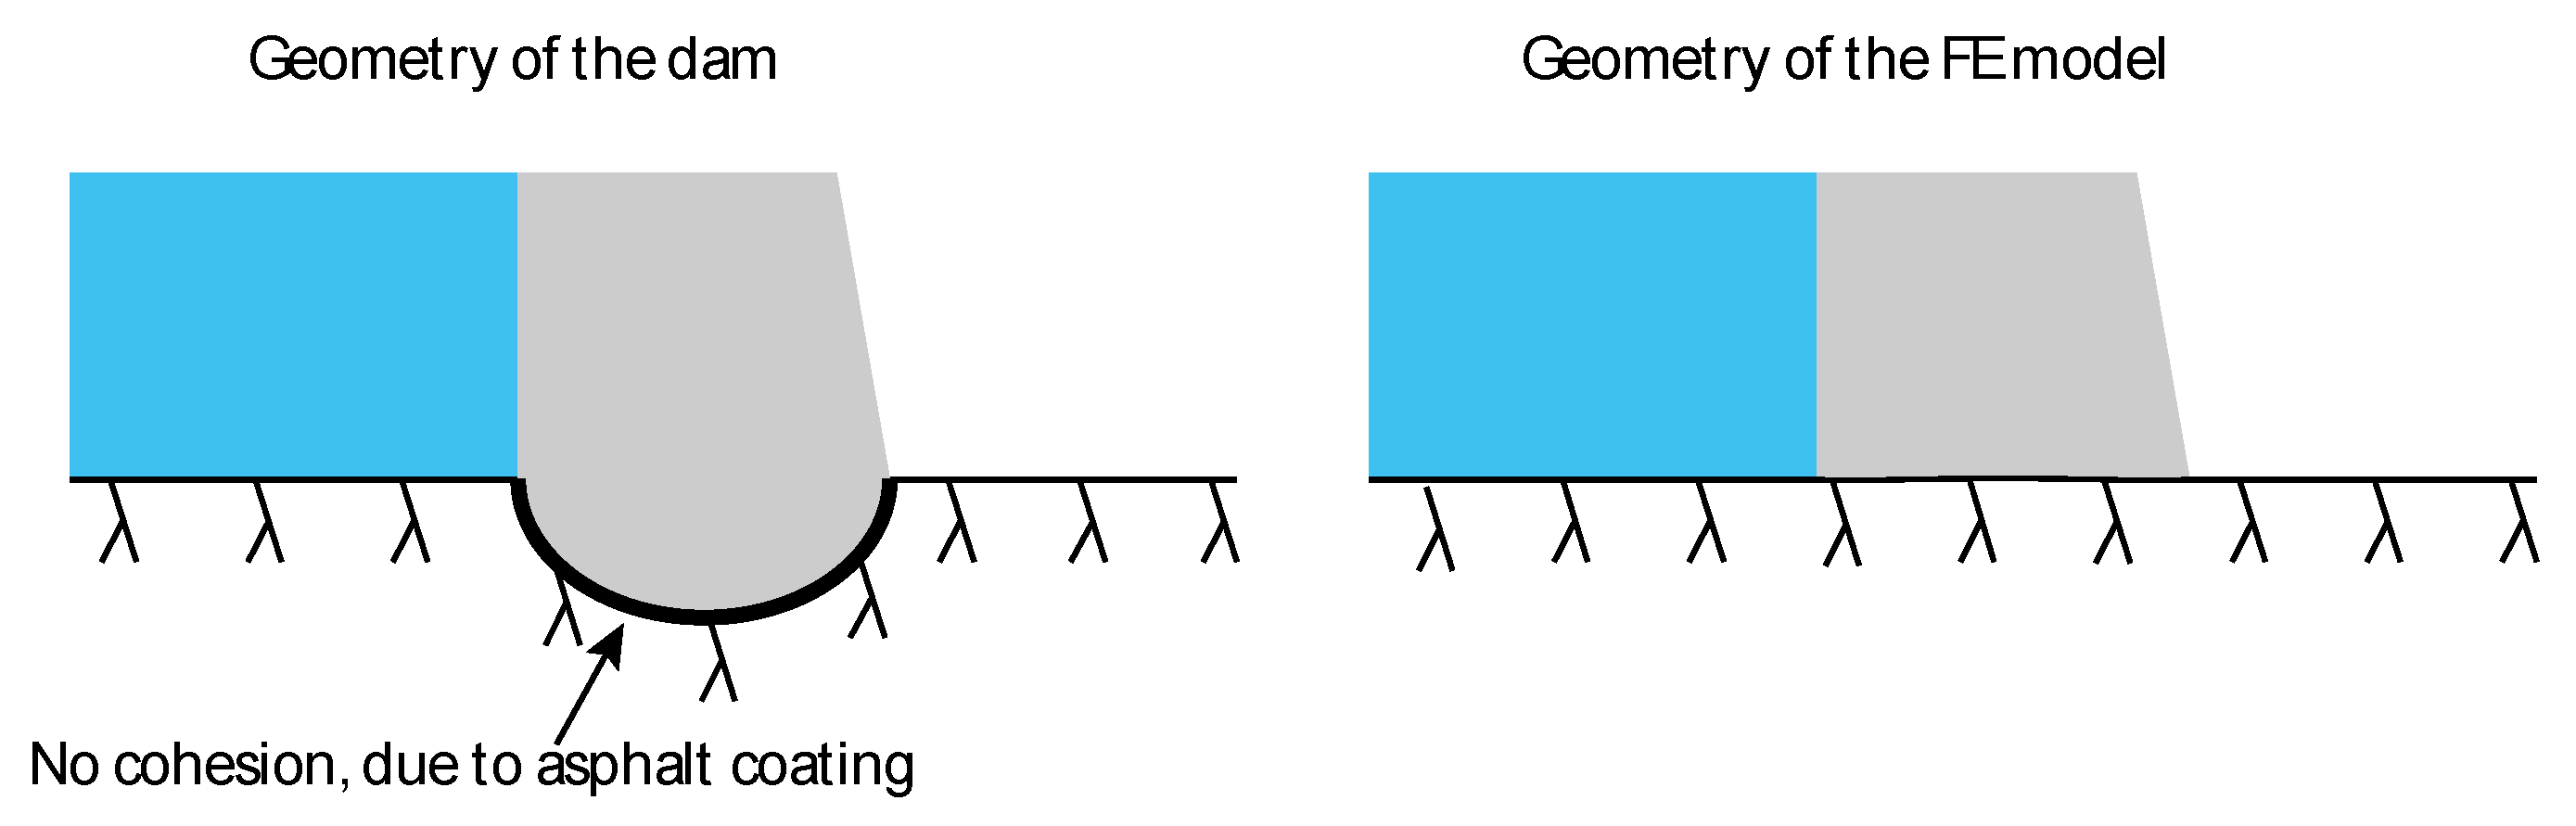
2.4.1. Interactions and Boundary Conditions

The dam is excavated into the rock where the support is made to act like a hinge (i.e., preventing displacements but not rotation). In addition, an asphalt coating was applied at the rock surface to prevent cohesion between the dam and the rock. In the geometry of the Finite Element (FE) model, this was simplified where the excavation was neglected. Instead, a plane foundation between the rock and the concrete was defined, see Figure 6. It is crucial that the interaction between the concrete and foundation in the numerical model is defined so that it describes the real behaviour of the dam.
The contributors were free to define the boundary conditions on the rock foundation as they found suitable. All contributors defined that the bottom surface of the rock foundation was restrained in the vertical direction. In the upstream–downstream direction, the contributors either defined boundary conditions on one or both of the two parallel rock surfaces. The contributors used the same principle in the lateral direction.
Constraining two parallel rock surfaces in the upstream–downstream (or lateral) direction enforces a global restraint of the rock, which would result in a larger relative movement between the concrete and rock due to the thermal strains.

2.4.2. Loads

The main load of interest in this study was the thermal load caused by temperature gradients from the extreme temperatures described in Section 2.2. In addition to the thermal load, gravity, and water pressure were also considered in the analyses. Gravity loads were included in the analysis for the concrete based on the density given in Table 2 and the structure’s volume. The water pressure was included as a hydrostatic pressure where the water level was assumed to be at the crest of the dam.
The influence from the construction sequence of the dam was neglected. In addition, other loads such as uplift pressure and ice loads were also neglected in this study. Considering the thin thickness of the arch and that the dam is relatively high, both loads are expected to have a fairly small influence on the dam behaviour, especially regarding its influence on cracking.

2.4.3. Type of Analyses and Required Results

It was mandatory for the contributors to perform two different types of analyses: thermal and mechanical. The aim was to predict both the cracking that had occurred since the dam was built in the 1960s and to assess its influence of the displacements. The contributors were asked to report the results from three steps:
  • Thermal analysis;
  • Linear mechanical analysis; and
  • Non-linear mechanical analysis.
These analyses should be described in the paper and in addition, submit results to the formulators via an Excel template file. The required results were:
  • Thermal analysis
    Temperature distribution for the centre section of the dam for the months of January (minimum temperature) and July (maximum temperature).
  • Linear mechanical analysis
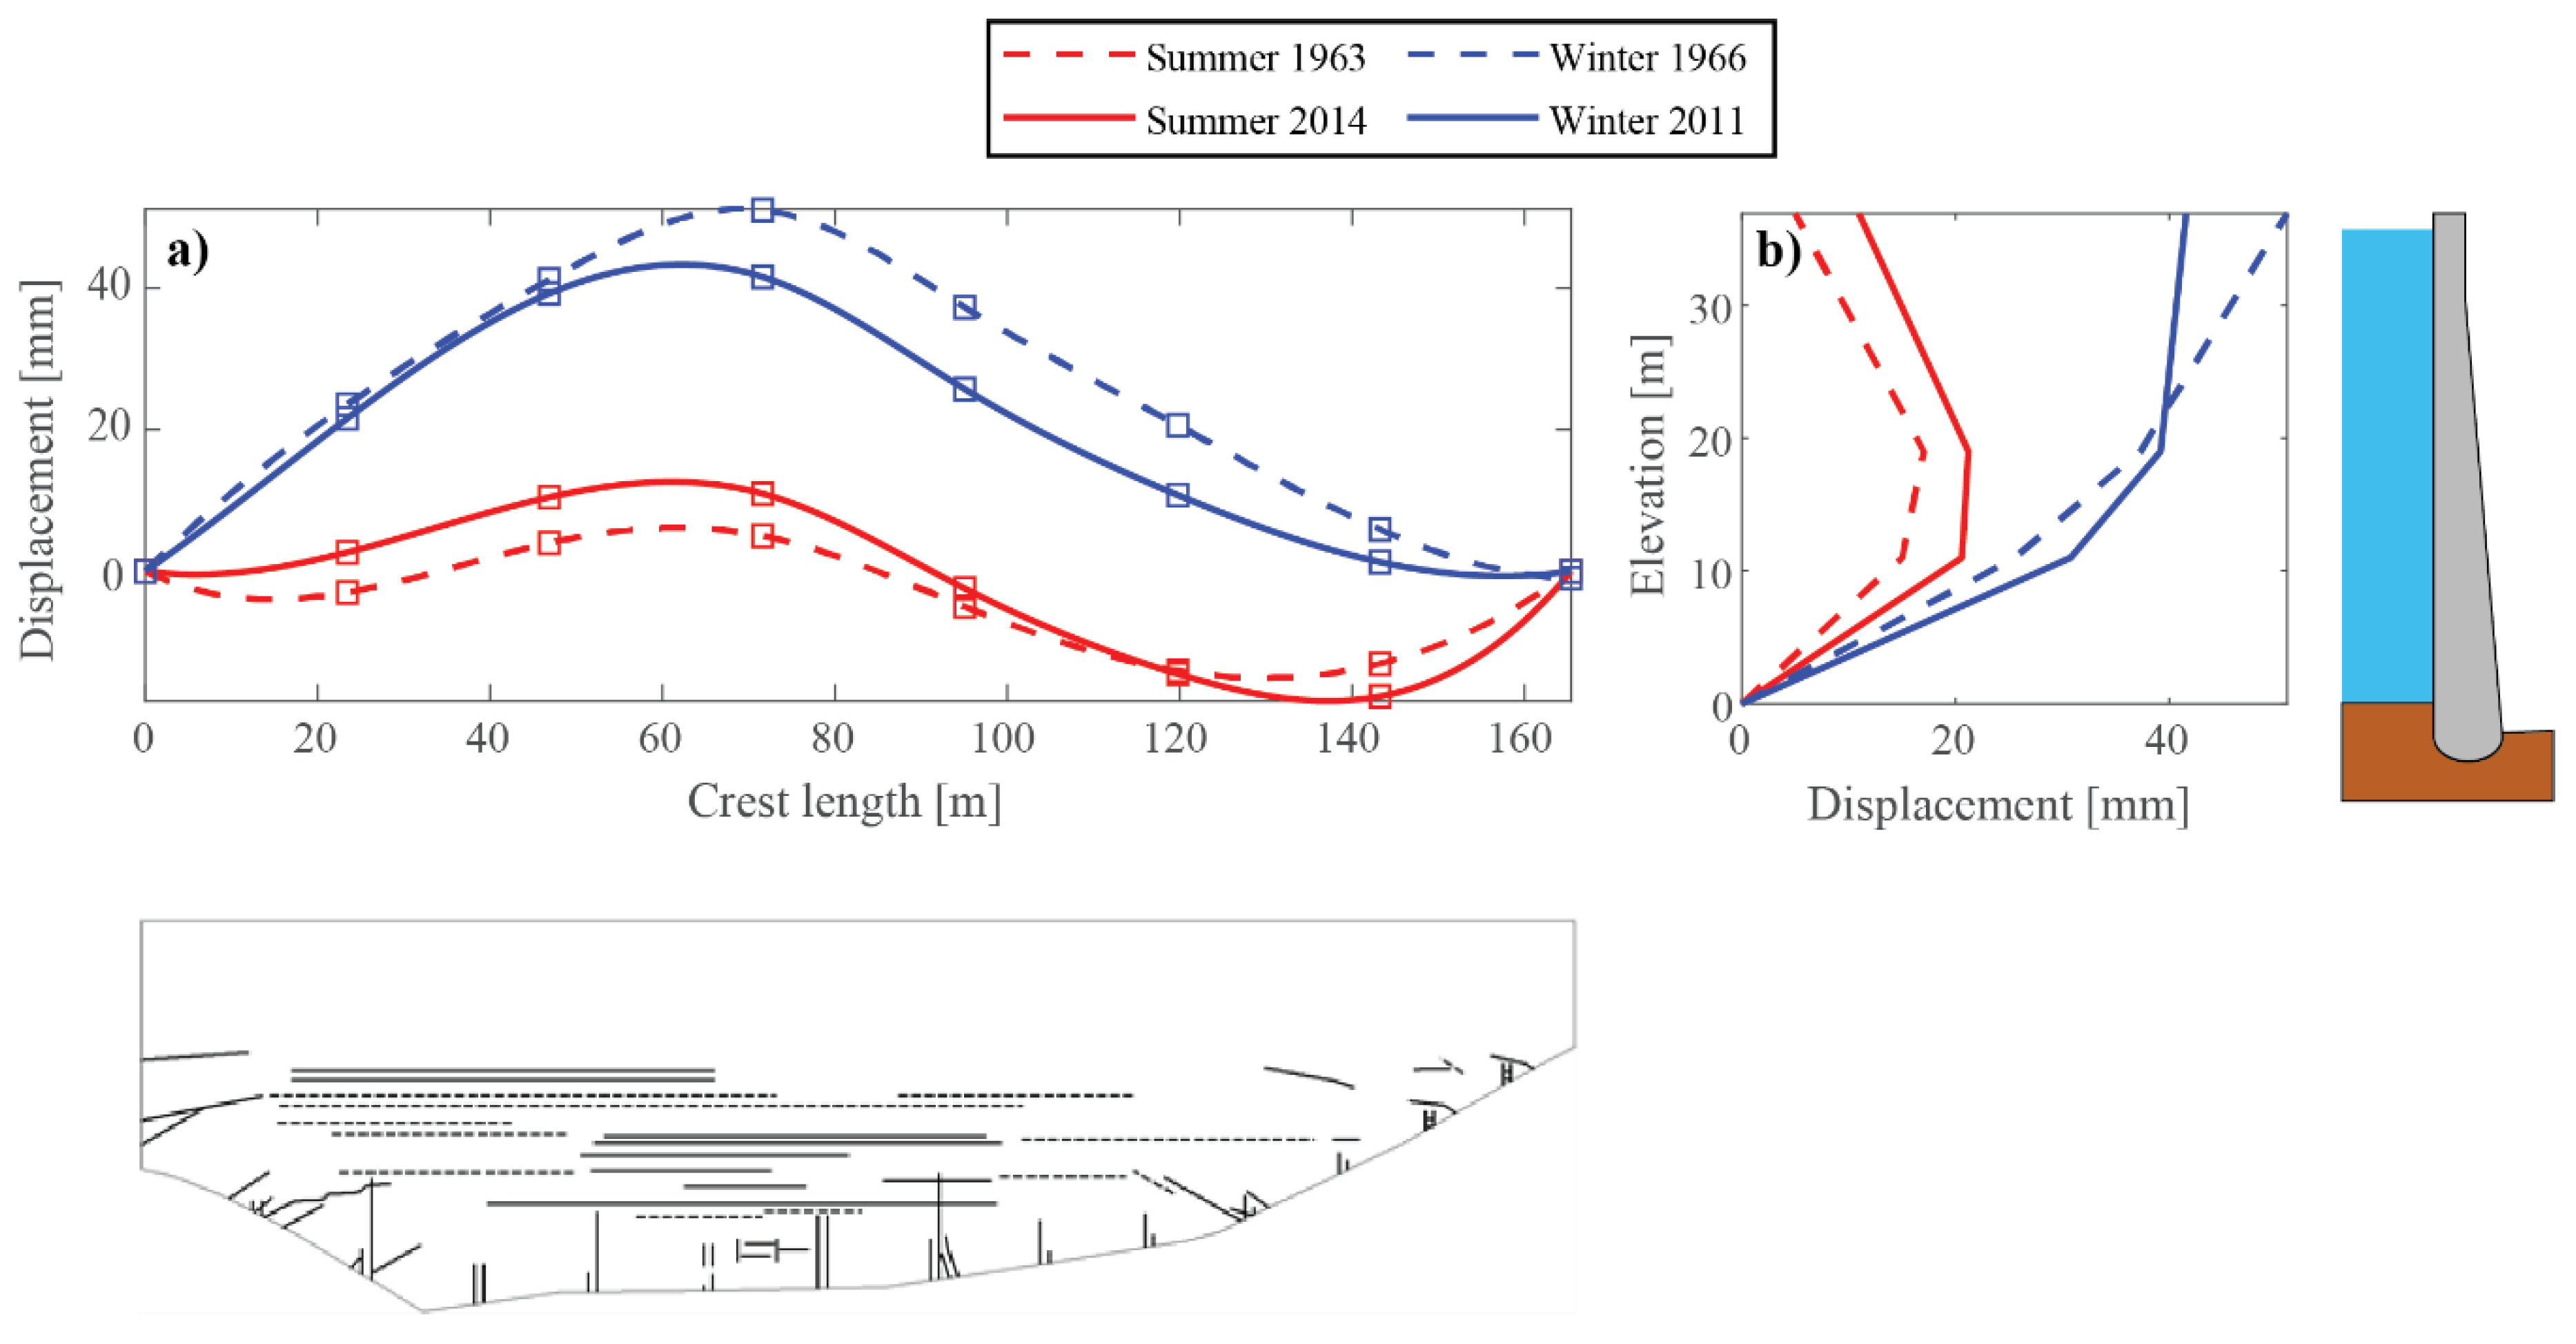
    Calculated displacement on the downstream surface of the dam in the centre section as a function of the dam height, for the initial conditions (gravity load and hydrostatic water pressure) in addition to the minimum and maximum displacements due to temperature variations, respectively.
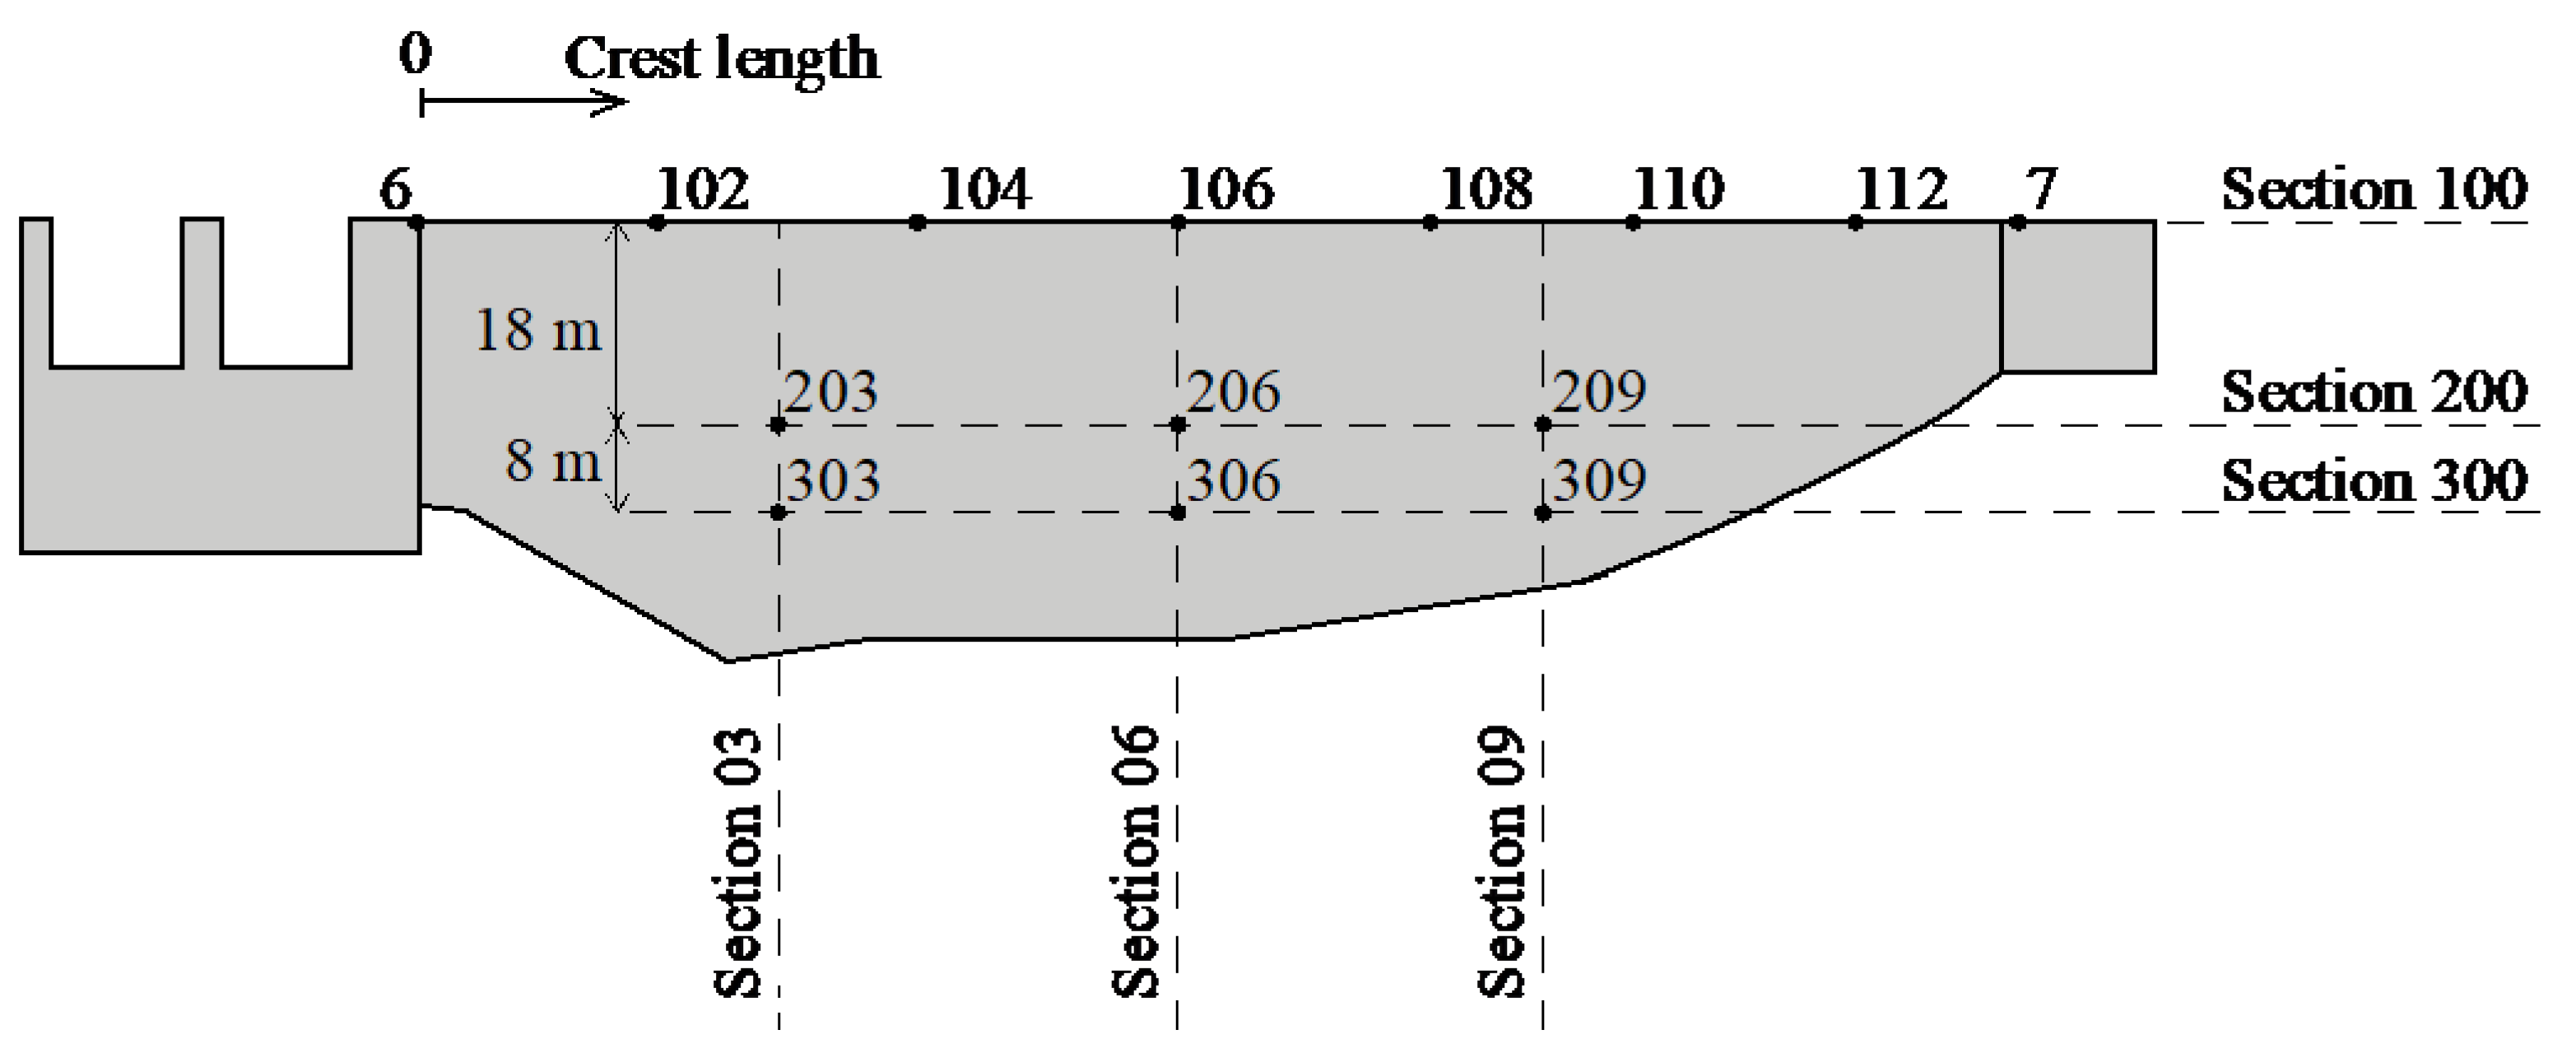
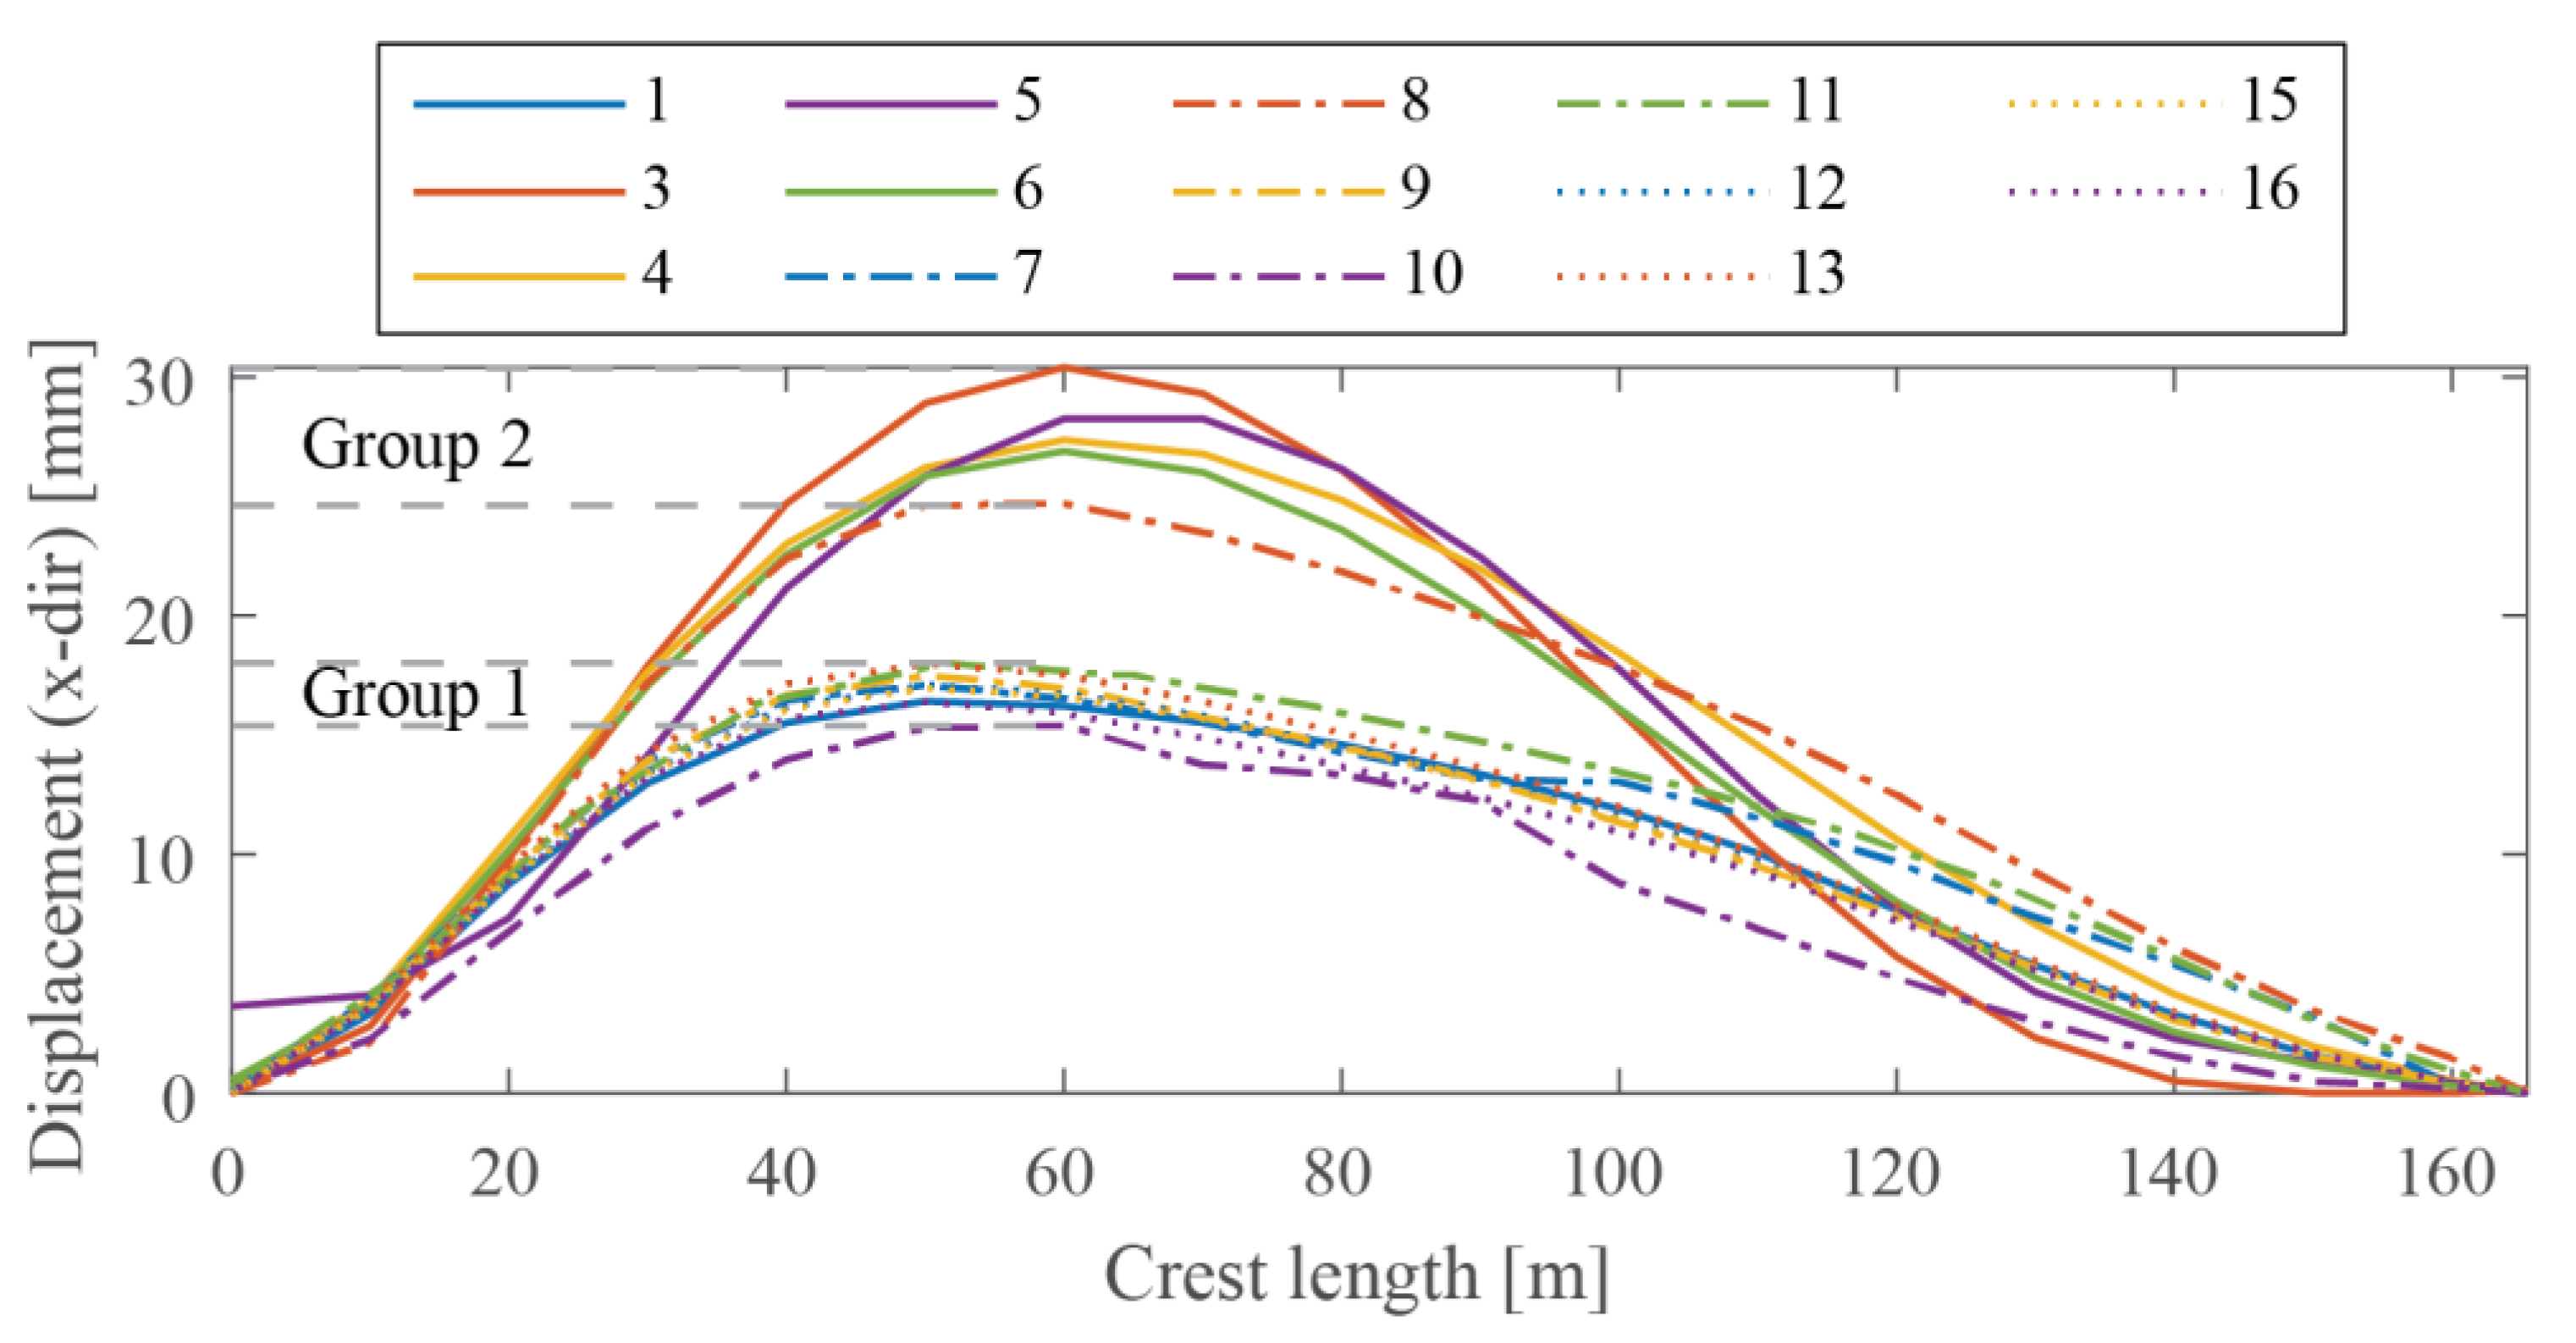
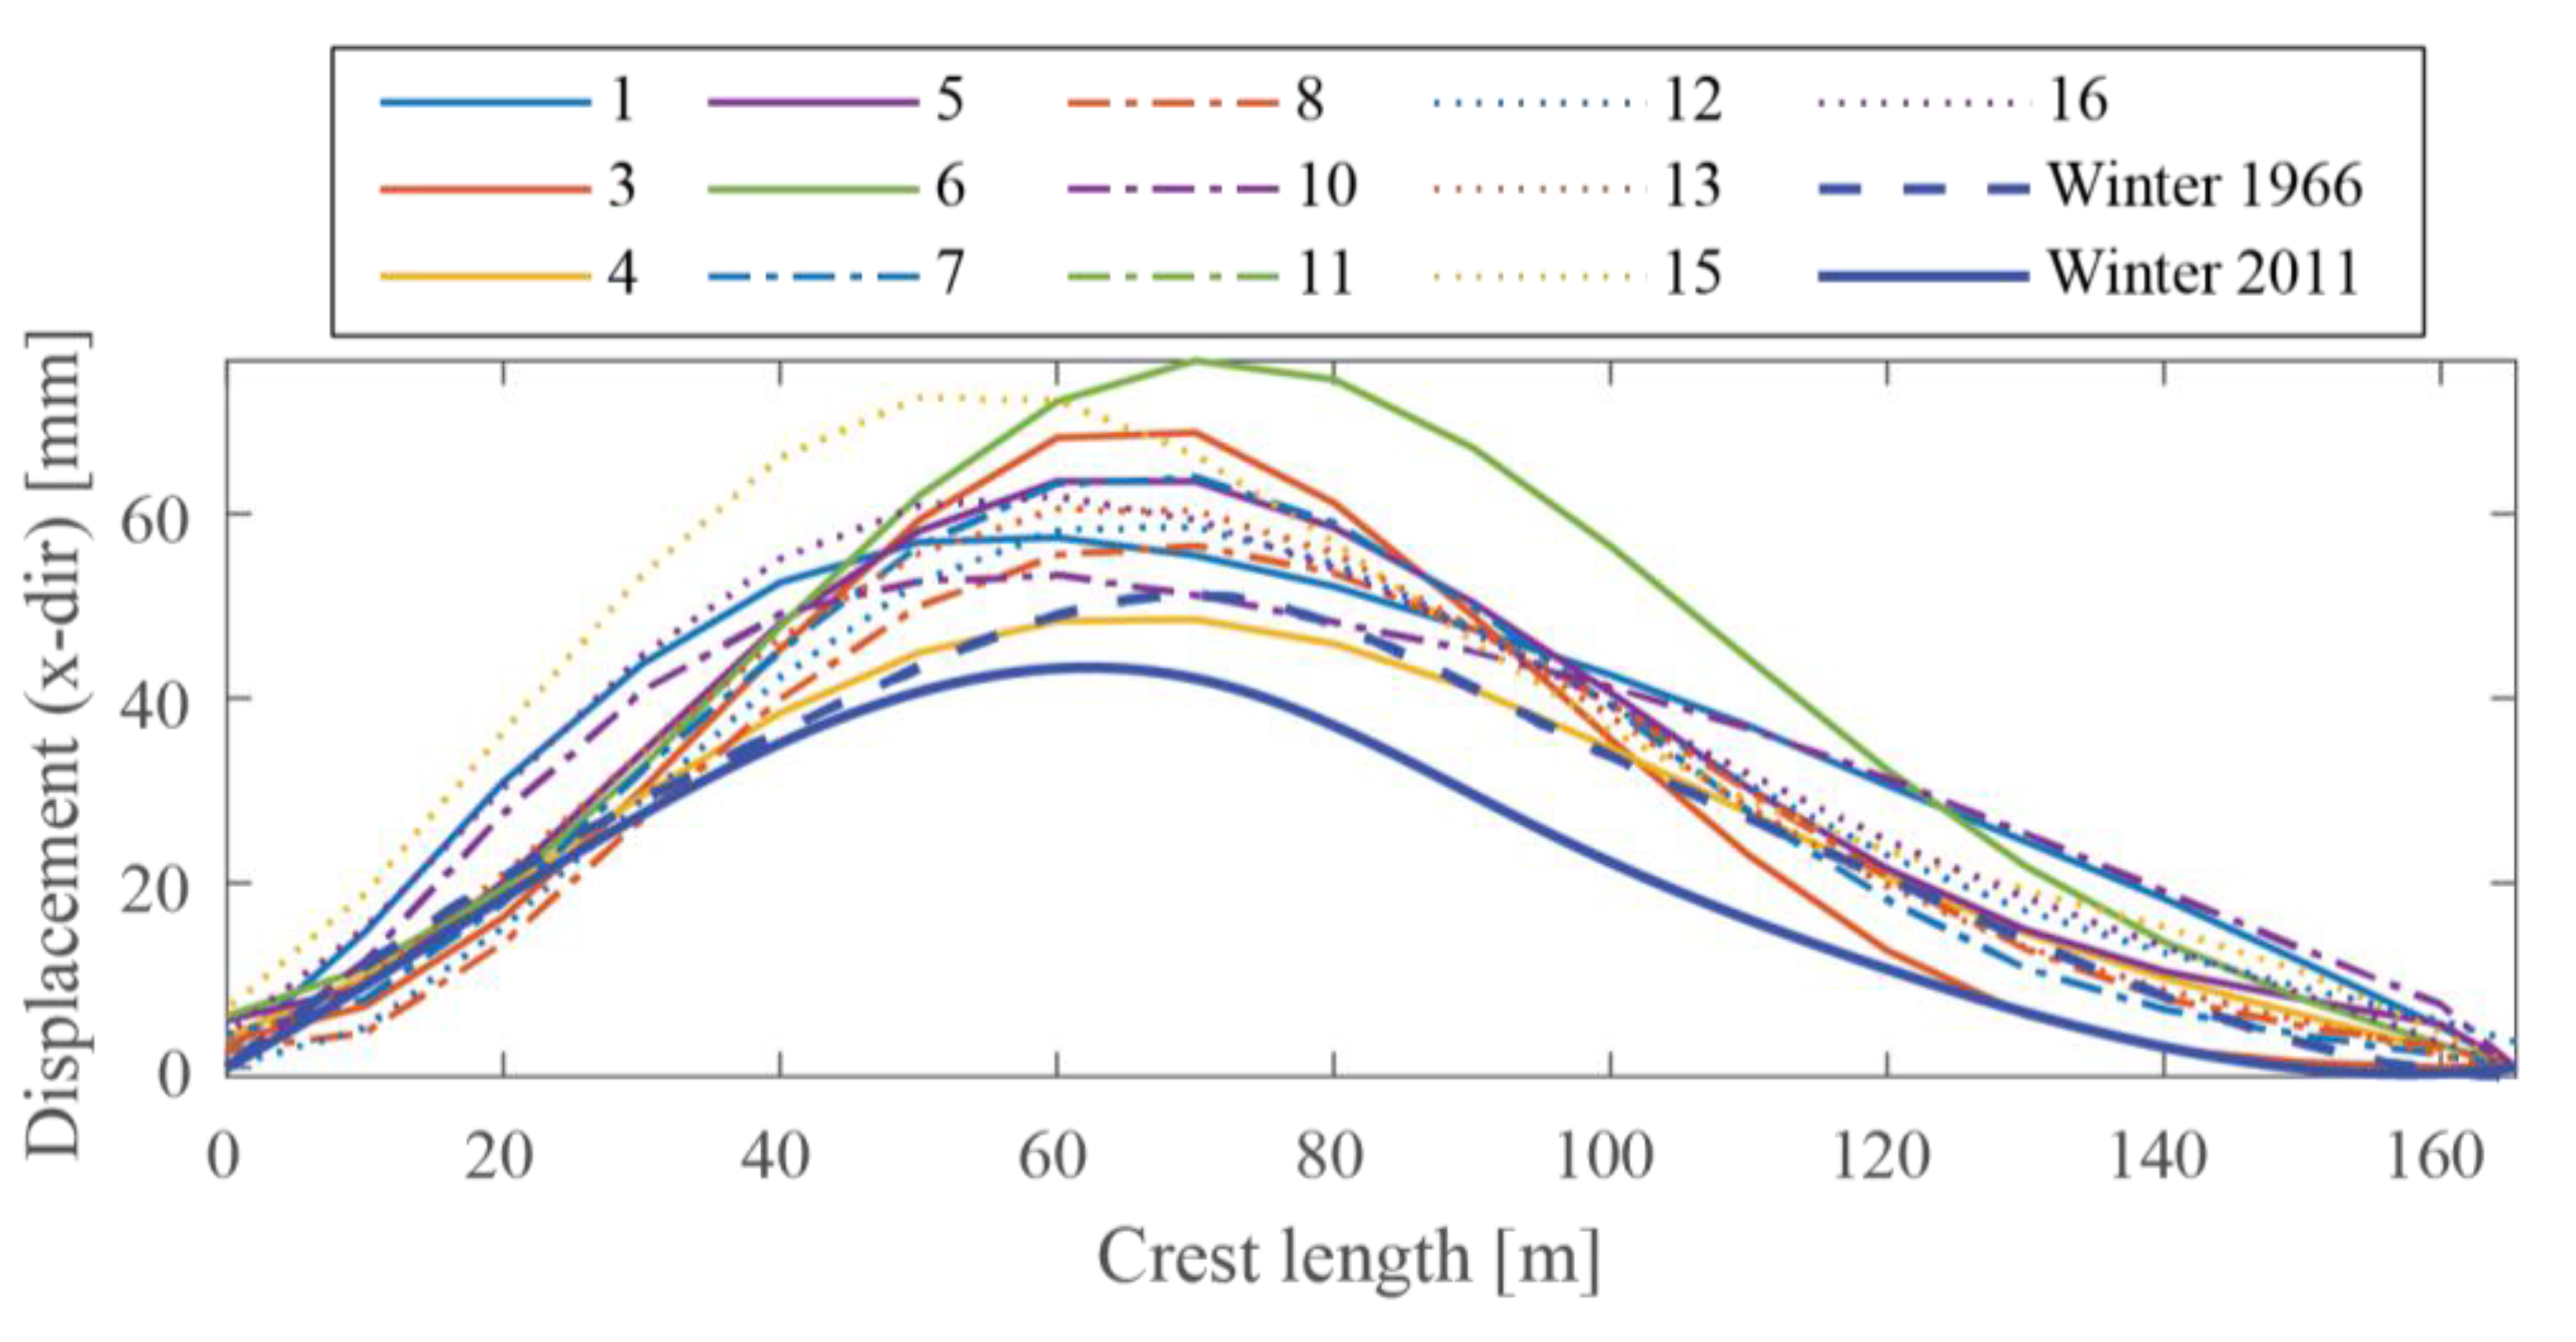
    Calculated displacement of the downstream surface along the two lines illustrated in the figures below. In both cases, the zero on the x-axis (representing the crest length) should be defined at the side of the spillway section:
    along the crest
    a line ~14 m below the crest on the downstream surface
    Contour plots illustrating the displacement of the dam;
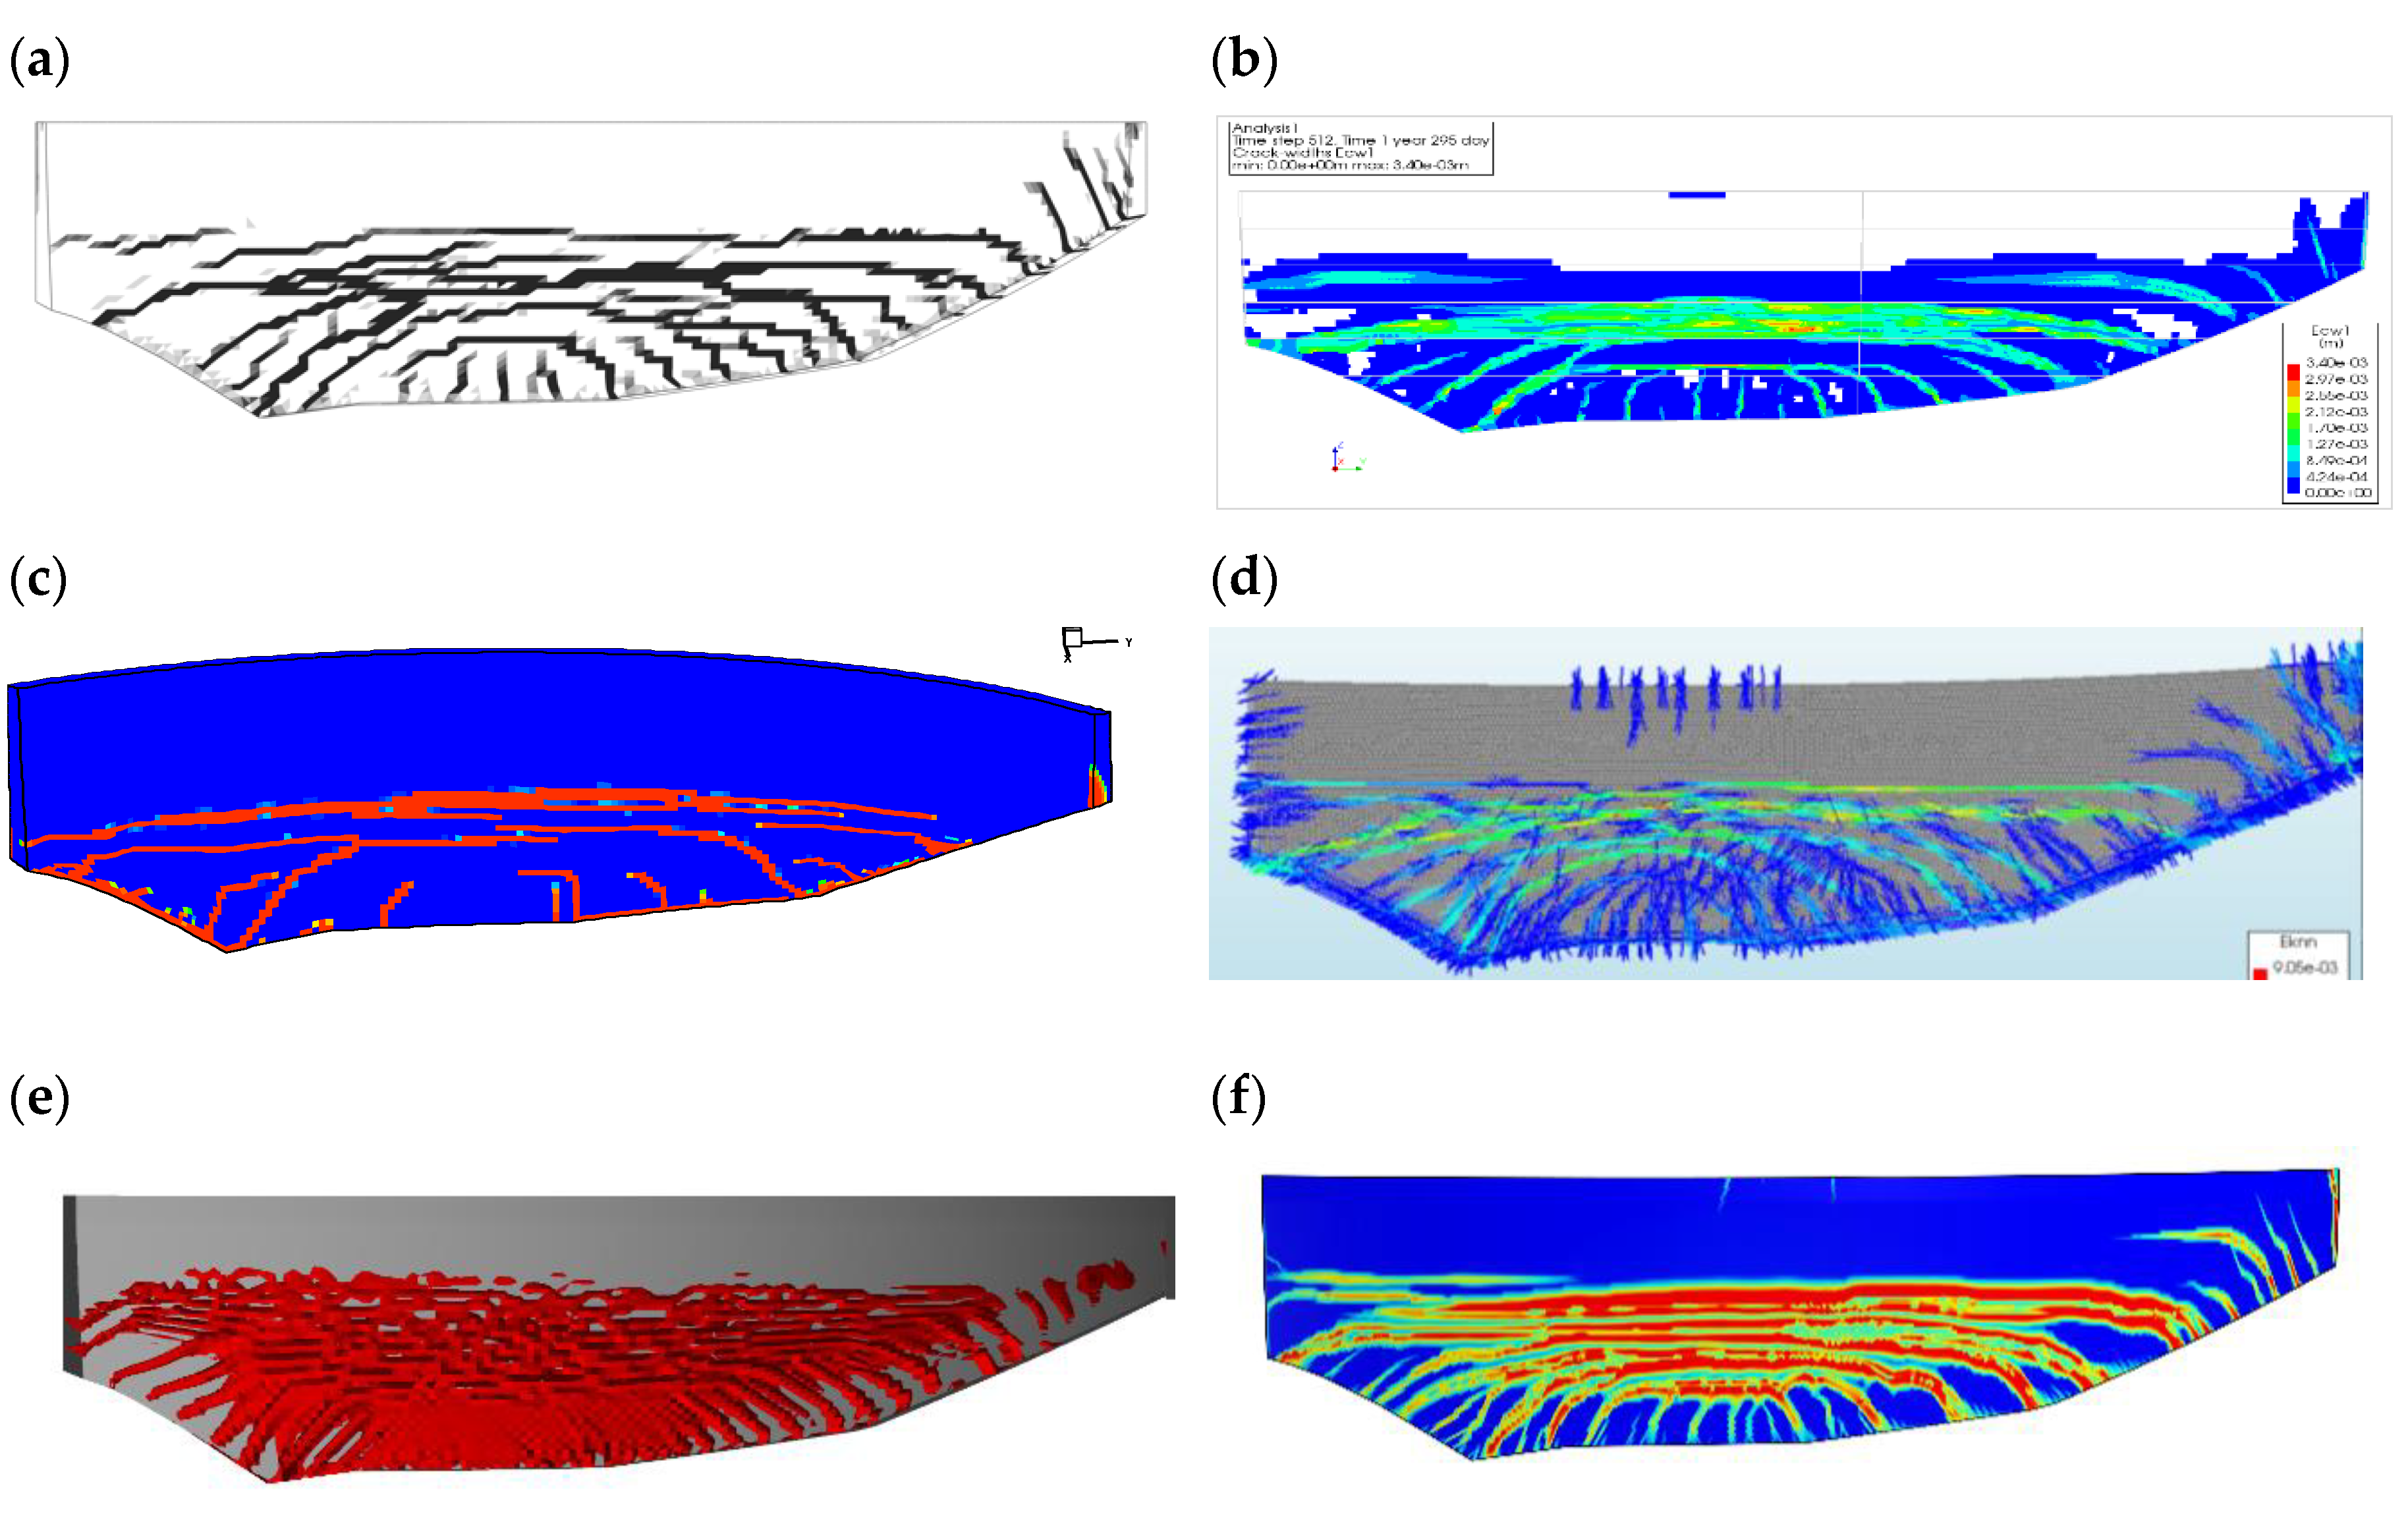
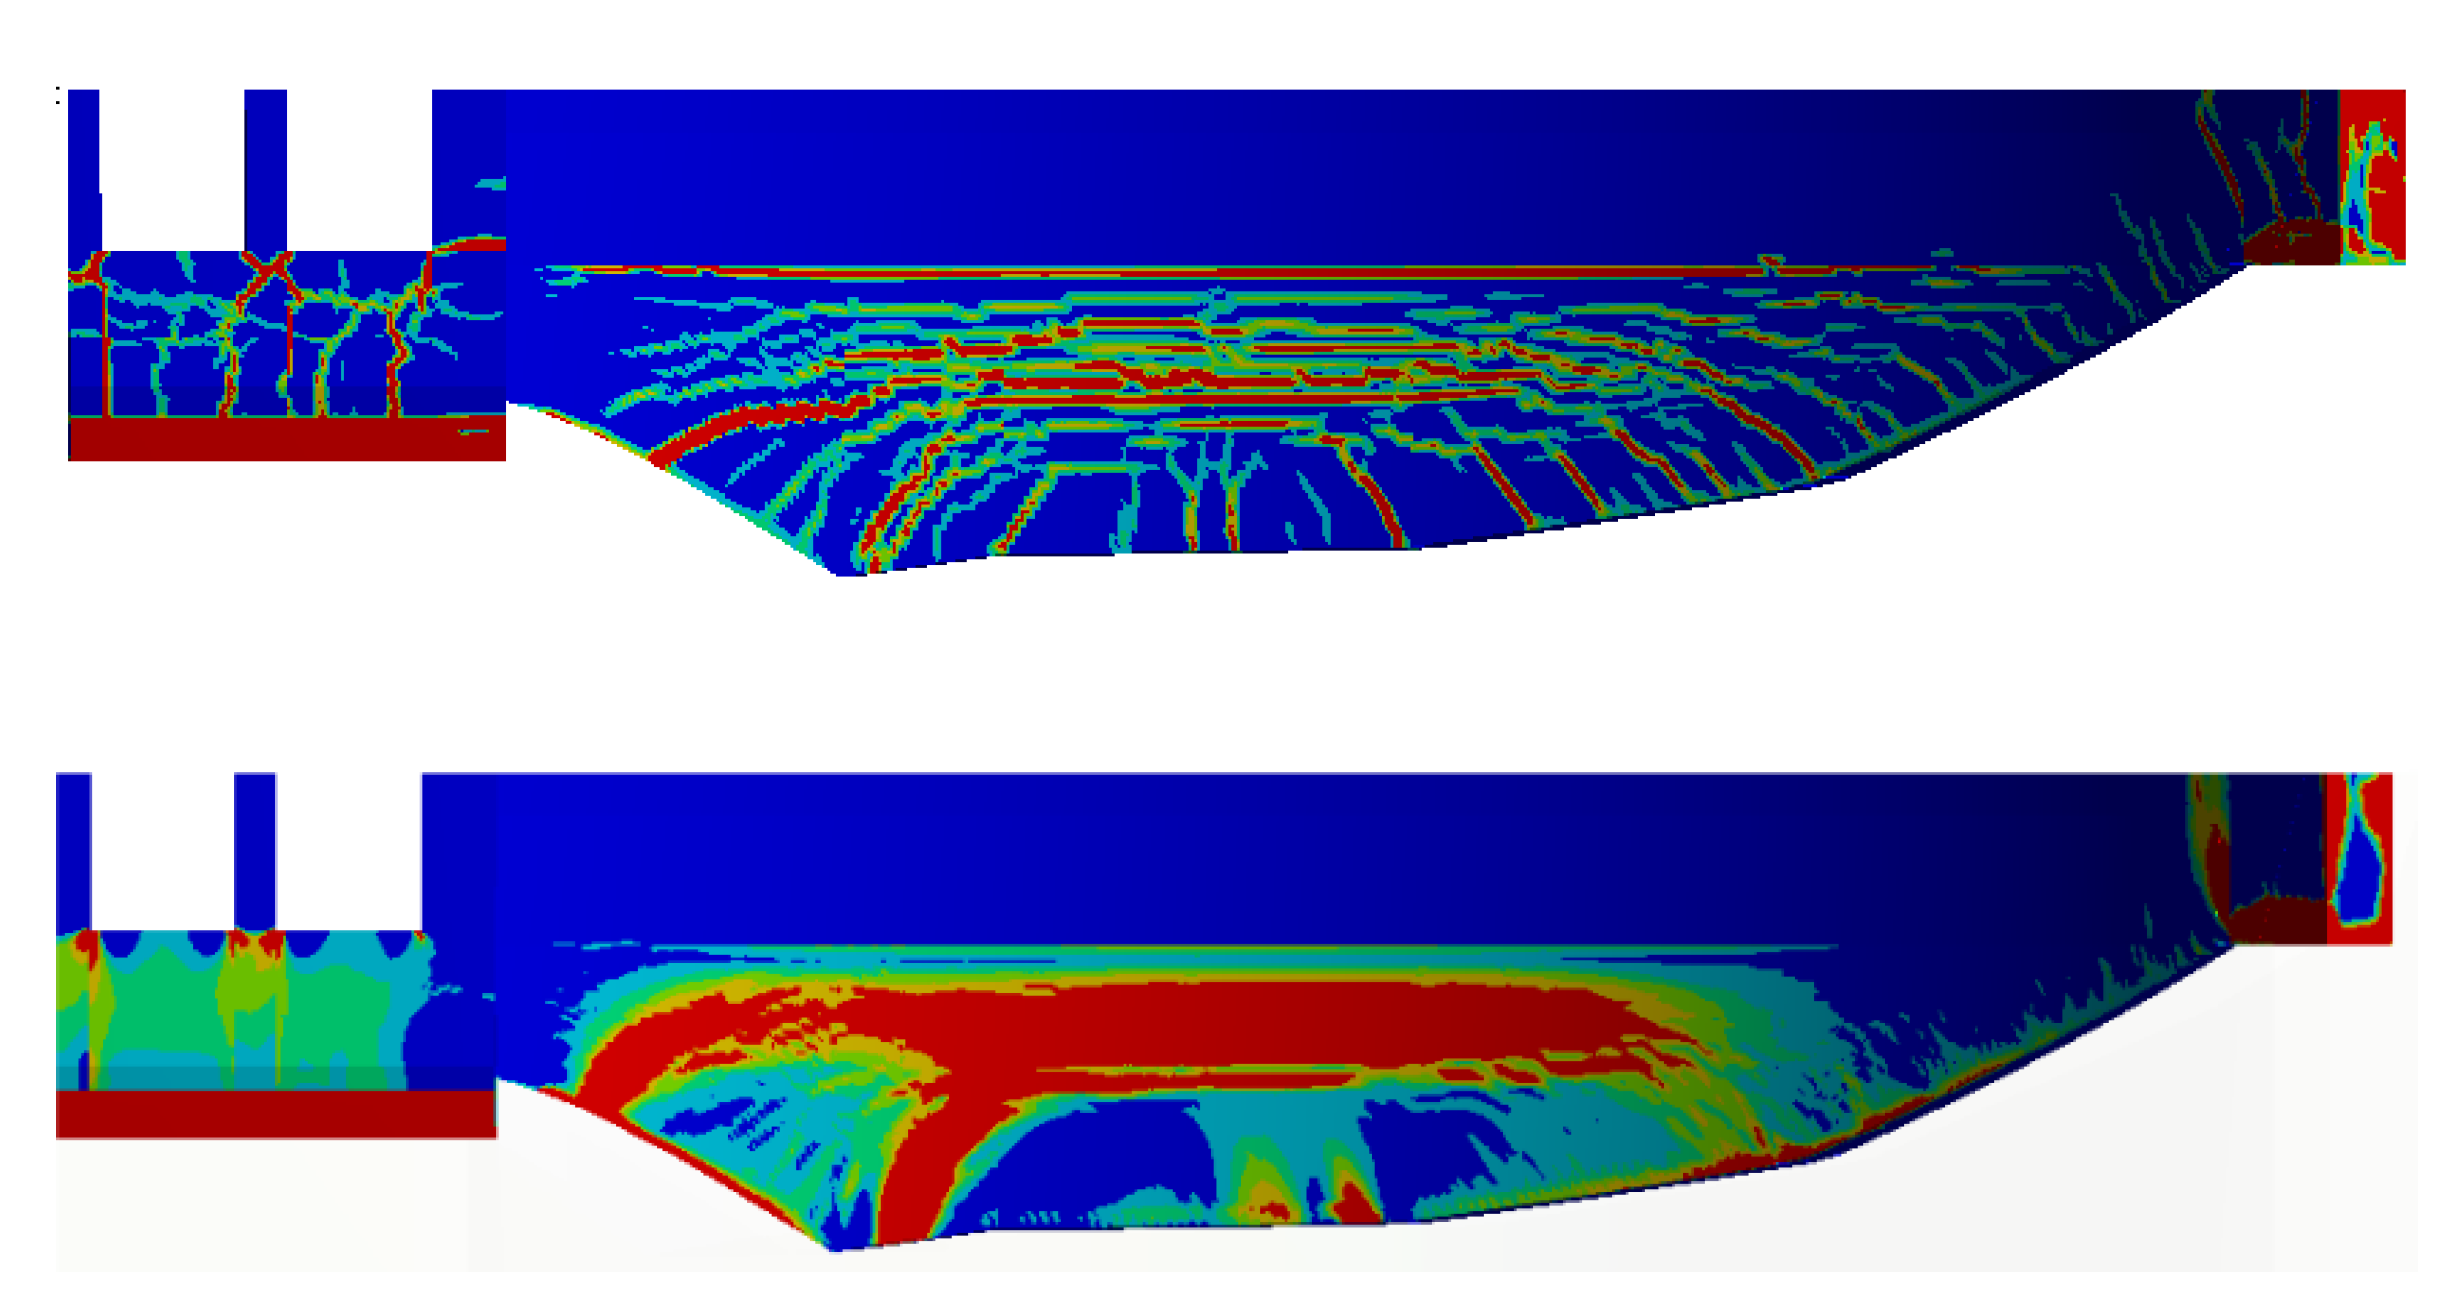
    Contour plots illustrating the areas which are exceeding the tensile strength (i.e., the areas that may be subjected to cracking); and
    Vector direction plot showing the maximum and minimum principal stress directions of the downstream view of the arch dam.
  • Non-linear mechanical analysis
    The results requested in the first three bullets of linear analyses should also be presented for the non-linear analyses.
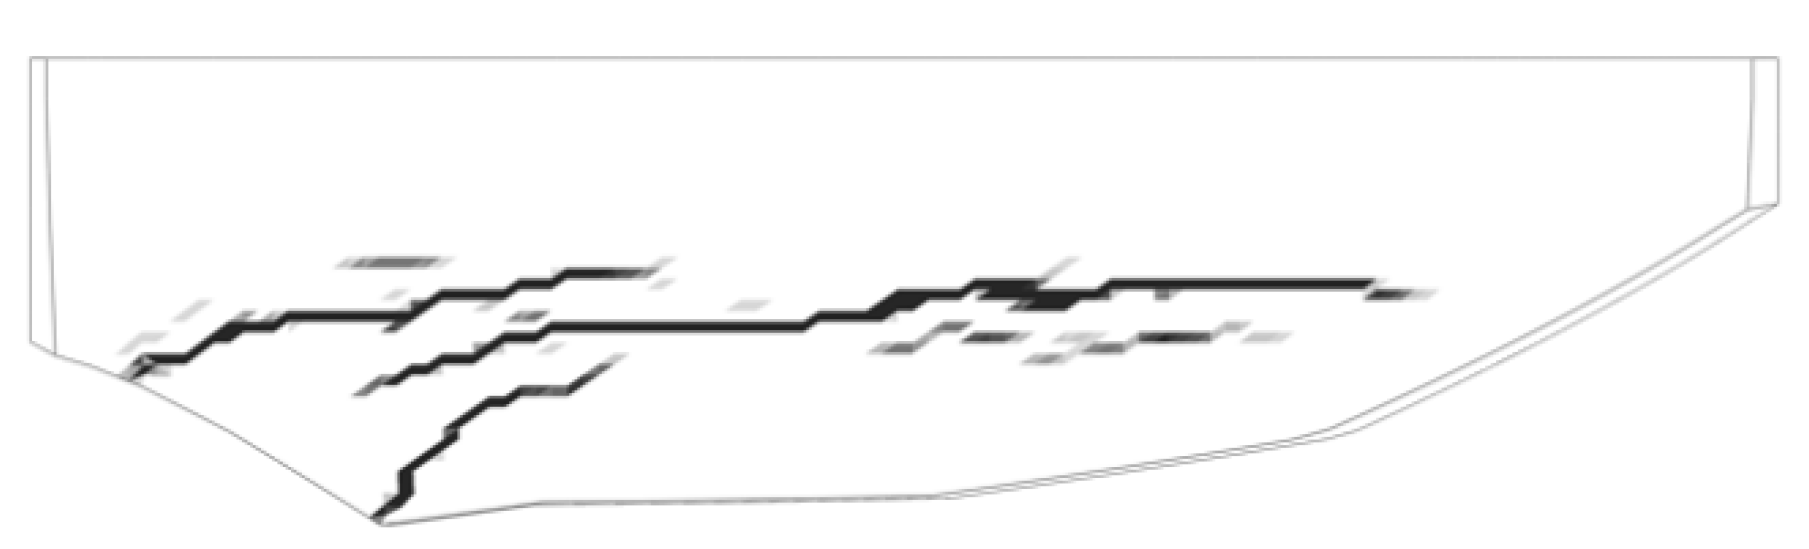
    Contour plots illustrating the calculated extent of cracking (i.e., showing non-linear strains, damage, crack planes, etc.).
The mechanical analyses were defined to be performed in the following sequence:
  • Gravity loads;
  • Hydrostatic pressure; and
  • Extreme temperature variations.

3. Results

In this section, the main results from the benchmark workshop are presented, where each contributor is presented with a unique number between 1 and 16. In some cases, the results from a few of the contributors were removed since they were considered as outliers, most likely caused by errors in the models. To find the results from all contributors, see [21,22,23,24,25,26,27,28,29,30,31,32,33,34,35,36].

3.1. Temperature Analyses

All contributors performed these with a one-way coupling, where the results from the thermal analysis were used as input in the mechanical analysis to impose thermal strains. First, the temperature analysis was performed by cycling the extreme thermal variations as presented in Section 2.2. These temperature distributions were then used in the mechanical to estimate the risk of cracking based on a linear elastic simulation and to simulate the extent of cracking based on non-linear analyses.
The contributors also showed that there was no significant difference between simulating the extreme temperature curves (Figure 4) based on starting with winter or summer conditions. Thereby, the calculated extent of cracking had a minor effect on which order the extreme temperatures occurred. One conclusion from the contributors was that at least two cycles of the extreme temperature curve had to be applied for the crack pattern to stabilise.
Most of the contributors performed transient thermal analyses where the temperature variations in the air and in the water was applied using Robin boundary conditions (i.e., based on convective heat transfer boundaries). No direct differences could be found between the contributors that performed analyses based on this approach. It was only possible to detect differences in temperature distribution between these contributors and the few contributors who had performed steady state analyses with Dirichlet boundary conditions (i.e., with prescribed nodal temperatures). One clear effect of using the Dirichlet boundary conditions was that the water temperature had a smaller influence on the internal temperatures in the dam compared with analyses using Robin boundary conditions. The reason for this is that water was defined with a significantly higher convective heat transfer coefficient than air (500 W/(m2 K) between water and concrete compared to 4 W/(m2 K) between air and concrete). It was also possible to see a clear difference between the contributors using steady state compared to transient analyses, where the latter did not reach a linear temperature gradient through the thickness.

3.2. Static Behaviour and Linear Elastic Seasonal Variations

As a first step, the contributors provided their calculated results from just the static loads (i.e., the gravity load and the hydrostatic pressure). This was introduced as a first step in the benchmark workshop to allow for easier comparison between the contributors’ modelling strategies. It also provided an opportunity for the contributors to successively increase the complexity in their simulations and to be able to cross-check a simpler version of their models with the more advanced non-linear models.
In order to describe the real behaviour of the dam, it is important to prevent horizontal displacement between the concrete and rock. This can, however, be considered in several different ways, as shown by the contributors. The majority of the contributors considered some sort of interface element or springs between the concrete and rock. In the stream direction, the stiffness of the interface or the springs was defined with a high value to prevent relative movement and sliding between the concrete and rock. Some contributors defined a friction based contact formulation using a high coefficient of friction (typically higher than 20), which thereby prevented horizontal displacement at the base. Others, instead, used a built-in function where no horizontal slip could occur. The latter method is, of course, more correct and prevents horizontal movement but may result in problems finding a converging solution. The horizontal movement in the first method will be infinitely small if the coefficient of friction is high enough.
In the normal direction, most contributors defined a non-linear contact formulation, interface elements, or springs that transmits compressive forces (typically, no penetration of the master nodes into the slave nodes) but with zero stiffness for opening displacements. One of the participating teams defined a softer contact for the transition between compressive and tensile forces where a continuous function was used that also allows for some penetration of the master node into the slave nodes. This means that the axis of rotation is moved slightly in the upstream direction compared to the others that had the dam toe (downstream edge) as the axis of rotation. A softer contact is, in this aspect, more realistic in this case considering the hinge design. Other contributors used methods to prevent horizontal movement by constraining the toe (downstream edge of base) of the dam in all directions and one contributor updated the geometry of the base of the dam so that it was more similar to the real foundation.
Comparing the deformations due to static loads showed that the results were quite consistent, see Figure 7. It could be seen that the contributors obtained static displacement that could be categorised into two groups. In the first group, the maximum crest displacement varied between 16 and 18 mm, and in the second group it varied between 25 and 31 mm. The reason for this discrepancy between the two groups is that the first group used a fixed (rigid) constraint between the concrete and rock in the linear elastic analyses.
There was a very small difference between the contributions in the first group as there should be and this minor difference is believed to originate from the differences in the boundary conditions and especially in the mesh. The reason why the discrepancies were larger between the contributors that modelled non-linear contact between the concrete and rock is due to the different approaches used to model the contact formulation and likely also tolerances of the FE analyses, in addition to the reasons mentioned for the other group.
In the analysis using linear elastic material properties, the contributors were asked to provide an estimation of the areas that had a risk of cracking after application of static loads and when considering the seasonal temperature variations. The risk of cracking was in this case estimated based on the areas that were subjected to tensile stresses that exceeded the tensile strength. Most of the contributors showed a risk of cracking in the centre of the downstream surface due to static loads. When the seasonal temperatures were considered, all contributors showed significant risk of cracking on almost the entire downstream surface of the arch dam. In addition, the contributors that had modelled a fixed connection between the concrete and rock also showed a significant risk of cracking in the concrete upstream surface just above the foundation level. This is considered reasonable since the others that modelled the contact with a non-linear contact formulation showed a fairly large difference in crest displacement due to the joint opening.

3.3. Extent of Cracking

The linear elastic numerical analyses showed that the dam is already subjected to high tensile stresses on the downstream part of the dam from normal loads caused by gravity and the hydrostatic water pressure. This was later confirmed by the non-linear analyses where cracking occurred as illustrated in Figure 8. Normally, this should not be the case. However, considering that the studied dam has a high length-to-height ratio and is slender, these effects resulted in a significant risk of cracking. As mentioned previously, cracks were detected on the downstream side of the dam shortly after it was finalised. It is important to remember that this dam is reinforced, and thereby cracking does not necessarily influence the dam safety.
In the following step, the extremely warm year and cold year were cycled to predict the cracking that had occurred. As it can be seen in Figure 9f), the contributors predicted significant cracking with several large horizontal cracks in the centre of the downstream surface of the dam and inclined cracks towards the two abutments. The crack pattern is illustrated a bit differently in the figures depending on the choice of constitutive material model, and some showed both micro and macro cracks while others only showed macro-cracks. Many of the cracks shown are micro-cracks, while a few of the horizontal cracks corresponded to macro-cracks with a significant crack opening displacement. The colour codes also varied between the contributors depending on the type of constitutive material model used, where they may present crack widths (Figure 9b,d), inelastic strains (Figure 9f), fracture planes (Figure 9e), or induced damage between 0 and 1 (Figure 9a,c). The aim of this comparison was, however, to compare the crack pattern and hence it does not matter if the colour codes differ, since the aim is to compare where the cracks occurred, number of cracks and if individual cracks were captured.
The crack pattern obtained in the numerical analysis corresponded well with the observed crack pattern, as shown previously in Figure 3. The obtained crack pattern also corresponded well with the description given by U.S. Army Corps of Engineers (USACE) [4], who described that horizontal cracks typically occur on the downstream surface of the cantilever elements of arch dams at half the dam height.
In the benchmark workshop, the used fracture energy varied significantly, from contributors using a brittle material model to others using an elasto-plastic behaviour corresponding to infinite fracture energy between 140 Nm/m2 to 600 Nm/m2. The mean of their fracture energies was 250 Nm/m2. The choice of unloading curve also varied between the contributors where some assumed a linear decaying function while others used an exponential curve. For instance, the curve defined by [37] was used to define the crack propagation in concrete.
The choice of fracture energy had a significant influence on the possibility of obtaining detailed results regarding the predicted cracking. In cases where lower fracture energy was defined, it was possible to visualize individual macro cracks. In the analyses defined with high fracture energy, it was only possible to identify larger areas that were more or less damaged/cracked. This is illustrated in Figure 10, where the top figure shows the crack pattern from one of the contributors using a fracture energy of 200 Nm/m2 compared to a solution by the same contributor where a fracture energy of 500 Nm/m2 was used. It should be remembered that this dam is reinforced, and the difference between using higher or lower fracture energy is expected to be significantly higher for unreinforced concrete dams. The reason for this is that the reinforcement carries the load after crack initiation and therefore, in a simplified sense, can be considered as increased fracture energy.
Overall, the contributors achieved accurate predictions of the crack pattern, regardless of whether the constitutive material model used was based on damage theory, plasticity theory, fracture mechanics, or a combination of these.

3.4. Deformation of the Arch Dam

The calculated deflection of the dam varied (as expected) significantly more than the displacements from the seasonal temperature variations based on a linear elastic material model. The maximum displacements from the contributors based on linear elastic material models varied typically between 40 mm and 65 mm, with an average of 55 mm.
In Figure 11, a comparison of the calculated displacement along the crest is presented together with the measured displacements previously shown in Figure 3. The maximum crest displacement obtained with non-linear material models varied between approximately 50 to 80 mm, with an average of 65 mm. The main reason for the discrepancy is believed to be due to the differences in fracture energy. The contributors with low fracture energy may have obtained yielding of some of the reinforcement bars, which would greatly increase the deformations compared to contributors with a higher fracture energy where the reinforcement was in the elastic regime.
The shape of the calculated displacement curves corresponded well with the measured deformed shape. The maximum crest displacement from the measurements was slightly over 50 mm for the dam after a few years (uncracked) and about 40 mm for the dam in recent years (cracked).
It should be noted, however, that the calculated displacements are performed with larger temperature variations and hence some overestimation of the displacement is expected. The difference in temperature variation is not so large, however, which means that the calculated displacement should be only slightly above the measured displacement, as shown by [17].

4. Discussion

As shown previously, if a concrete dam is subjected to significant thermal stresses, there is a risk that cracking will occur, which may significantly alter the behaviour of the dam. When the cracks develop, the structural stiffness is reduced, and hence also the thermal forces of restraint. This results in a new equilibrium state where continued thermal variation primarily causes the opening and closing of these cracks, and lower induced stresses in the concrete as a result.
To be able to analyse this effect, detailed models are required that can capture the crack initiation and propagation in concrete such as non-linear finite element analyses based on constitutive material models. Other types of methods such as data-based (statistical) models or simplified models may capture the behaviour of an undamaged or an already damaged case, but can typically not capture the transition from undamaged to damaged or answer questions regarding the current state of a cracked dam [9]. However, the different methods have their benefits and the use of one type of model does not exclude the possibility of also using others. In the condition assessment of dams, it would be preferable if both detailed non-linear FE analyses and data-based models are used when applicable.
One simplification of the FE analyses presented in this paper is the use of a constant reference temperature. However, using a too low reference temperature typically means that the extent of cracking during a cold winter may be underestimated and vice versa. The obtained degree of cracking is typically more or less similar, even though the obtained crack width or crack length may vary to some extent [38]. Another important factor is that extreme temperature was developed to simplify the seasonal variations for over 50 years into a cold and a warm year. The approach used in this paper has, however, been shown by [39] to provide accurate results where the main types of cracks found in situ could be captured.
Overall, the results from the contributors are well in line with the observations and measurements made on the dam. All contributors indicated a significant risk of cracking due to the seasonal temperature variations based on the linear elastic analyses. In general, the contributors also achieved good agreement between the predicted crack patterns and the crack pattern observed in situ. As expected, the non-linear analyses predicted larger discrepancies regarding displacements compared to the simpler analyses with a linear elastic material model. However, for a large majority of the contributors, good agreement was obtained regarding displacements of the dam.
There are several factors that contribute to the differences between different predictions. The main identified factors that influenced the results were:
  • Temperature distributions;
  • Boundary conditions;
  • Interaction between concrete and rock; and
  • Choice of fracture energy and non-linear constitutive model.
The methodology of performing the seasonal temperature distribution analyses may have a significant influence on the results. In the benchmark workshop, most of the contributors performed transient thermal analyses with Robin boundary conditions. This is the most suitable for this application, and no direct difference in results could be found between the contributors that used this approach. A larger difference was found for the contributors that performed steady state analyses with Dirichlet boundary conditions. These analyses showed a larger influence from the ambient air temperature and obtained linear thermal gradients through the thickness of the dam.
The definition of boundary conditions had a large influence primarily regarding the possibility of obtaining converging solutions. The imposed boundary conditions on the rock could result in significant restraint of the rock mass, if all exterior surfaces were restrained in their normal direction. This prevented the rock mass from deforming and hence forced the temperature variation to primarily cause relative deformation between the arch dam and the foundation. To only restrain one of the two parallel surfaces in the stream and lateral direction, respectively, reduces the relative restraint between the dam and the rock. This is thereby considered to be more suitable in cases where thermal variations are considered. The only downside of this approach is that the rigid body motion of the rock foundation must be removed before the results are compared with the measurements or the other contributors.
One of the most influential factors is how the interaction between the concrete and rock foundation was modelled. The reason for this is that significant joint opening occurred if a suitable interaction was modelled. Preventing joint opening at the foundation level would initiate a horizontal crack along the upstream surface.
As mentioned previously, the estimated amount of fracture energy varied from very low in the brittle models up to very high in the most ductile models. Concrete used in dams differs to some extent from conventional concrete, and limited information exists about suitable concrete fracture energy for dam applications. The following characteristics are typical for concrete used for hydropower applications, according to Brühwiler [40]:
  • Use of a larger maximum size of the aggregates (100 mm in this specific case);
  • Slightly lower tensile strength; and
  • Slightly lower elastic modulus.
The fracture energy for concrete used in dams is, due to these reasons higher, than for conventional concrete. For conventional concrete, the fracture energy can, for instance, be determined according to Model Code 2010 [41]. With the properties given in Table 2, this would result in a fracture energy of 140 Nm/m2. This is thereby considered to be conservative in this case.
Ghaemmaghami and Ghaemian [42] showed that increasing the maximum aggregates from 30 mm to 60 mm almost doubled the fracture energy. Brühwiler [40] presented the results from the measured material properties of three arch dams, where the fracture energy (mean values) varied between 230 Nm/m2 to 310 Nm/m2. The mean value of the fracture energy used by the contributors is thereby within the range given by [40]. The use of too low a fracture energy often has a large influence on the possibility of achieving a converging solution, where brittle analyses are difficult to perform due to the rapid unloading that is required as a crack is initiated. The results clearly showed the importance of using realistic fracture energy for the type of concrete used in the dam. Using a too low value will result in the risk of reinforcement yielding and potentially the overestimation of the deformations. Individual cracks could not be captured by the contributors who used high value results of the fracture energy. These contributors only captured that cracking occurred in larger areas.
Overall, the contributors achieved accurate predictions of the crack pattern, regardless of whether the constitutive material model used was based on damage theory, plasticity theory, fracture mechanics, or a combination of these. Using linear unloading curves generally results in an overestimation of the structural stiffness (see [18]). However, it was not possible to draw any conclusions from the benchmark workshop regarding the choice of the unloading curve.
It is necessary to be able to estimate the root causes for cracking and to obtain accurate predictions of the extent of cracking since this is the first step of assessing the current structural safety of an existing dam or the need and type of strengthening. Therefore, the results and conclusions presented in this paper are one important step in achieving increased knowledge of the dam safety of existing structures with a better understanding of potential failure modes and ageing of concrete dams.

5. Conclusions

In this paper, the case study of a concrete arch dam subjected to cracking caused by seasonal temperature variations has been presented. This case was part of the 14th ICOLD Benchmark Workshop, where 16 teams of contributors provided their predictions of the dam’s behaviour. From this, it has been possible to see the influence of different assumptions regarding modelling the crack propagation, contact formulation between the rock and the dam, and approaches to simulate the temperature variation. Some of the important findings from this benchmark were:
  • Non-linear numerical models can be successfully used to predict cracking and estimate the displacements of the studied dam.
  • It is important to perform transient temperature analyses with Robin boundary conditions for these applications to obtain a suitable temperature distribution.
  • The interaction between concrete and rock has a large influence on the predicted displacements, especially for analyses based on linear material properties.
  • The magnitude of the fracture energy of concrete influenced the accuracy of the predicted displacements of the reinforced concrete dam, but had a significantly larger influence on the possibility of capturing realistic crack patterns.

Author Contributions

Conceptualization, R.M. and R.H.; Methodology, R.M. and R.H.; Software, R.H. and R.M.; Validation, R.M., R.H., and J.E.; Formal analysis, R.M. and J.E.; Investigation, R.M.; Resources, R.M. and R.H.; Data curation, R.M.; Writing—original draft preparation, R.M.; Writing—review and editing, R.M., R.H., and J.E.; Visualization, R.M. and J.E.; Supervision, R.M.; Project administration, R.M.; Funding acquisition, R.M. All authors have read and agree to the published version of the manuscript.

Funding

This research was partially funded by the Swedish Hydropower Centre (SVC), grant number VK11621.

Acknowledgments

The research presented was carried out as a part of the Swedish Hydropower Centre, SVC. SVC has been established by the Swedish Energy Agency, Energiforsk, and Svenska Kraftnät together with Luleå University of Technology, KTH Royal Institute of Technology, Chalmers University of Technology and Uppsala University (http://www.svc.nu).

Conflicts of Interest

The authors declare no conflicts of interest. The funders had no role in the design of the study; in the collection, analyses, or interpretation of data; in the writing of the manuscript, or in the decision to publish the results.

References

  1. Malm, R.; Hellgren, R.; Ekström, T.; Fu, C. Cracking of a concrete arch dam due to seasonal temperature variations—Theme A. In Proceedings of the 14th ICOLD International Benchmark Workshop on Numerical Analysis of Dams, Stockholm, Sweden, 6–8 September 2017; pp. 18–75. [Google Scholar]
  2. Tarbox, G.; Charlwood, R. Investigating the Structural Safety of Cracked Dams; CEATI Report No. T122700-0226; Dam Safety Interest Group (DSIG): Bellevue, DC, USA, 2014; 91p. [Google Scholar]
  3. Malm, R.; Ansell, A. Cracking of Concrete Buttress Dam Due to Seasonal Temperature Variation. ACI Struct. J. 2011, 108, 13–22. [Google Scholar]
  4. USACE. Arch Dam Design; EM 1110-2-2201; US Army Corps of Engineers (USACE): Washington, DC, USA, 1994; 240p. [Google Scholar]
  5. Willm, G.; Beaujoint, N. Les méthodes de surveillance des barrages au service de la production hydraulique d’Electricité de France, problèmes anciens et solutions nouvelles (The methods of surveillance of dams to serve hydraulic Production at Électricité de France: Old problems and new solutions), Q34/R30. In Proceedings of the 9th International Congress on Large Dams (ICOLD), Istanbul, Turkey, 4–8 September 1967. [Google Scholar]
  6. Chouinard, L.E.; Bennett, D.W.; Feknous, N. Statistical Analysis of Monitoring Data for Concrete Arch Dams. J. Perform. Constr. Facil. 1995, 9, 286–301. [Google Scholar] [CrossRef]
  7. Léger, P.; Leclerc, M. Hydrostatic, Temperature, Time-Displacement Model for Concrete Dams. J. Eng. Mech. 2007, 133, 267–277. [Google Scholar] [CrossRef]
  8. Salazar, F.; Morán, R.; Toledo, M.Á.; Oñate, E. Data-Based Models of the Prediction of Dam Behaviour: A Review and Some Methodological Considerations. Arch. Comput. Methods Eng. 2017, 24, 1–21. [Google Scholar] [CrossRef] [Green Version]
  9. Hellgren, R.; Malm, R.; Ansell, A. Performance of data-based models for early detection of damage in concrete dams. Struct. Infrastruct. E 2020, in press. [Google Scholar]
  10. Léger, P.; Venturelli, J.; Bhattacharejee, S.S. Seasonal temperature and stress distributions in concrete gravity dams. Part 1 Modeling. Can. J. Civ. Eng. 1993, 20, 999–1017. [Google Scholar]
  11. Léger, P.; Venturelli, J.; Bhattacharejee, S.S. Seasonal temperature and stress distributions in concrete gravity dams. Part 2 Behavior. Can. J. Civ. Eng. 1993, 20, 1018–1029. [Google Scholar] [CrossRef]
  12. Léger, P.; Seydou, S. Seasonal Thermal Displacements of Gravity Dams Located in Northern Regions. J. Perform. Constr. Facil. 2009, 23, 166–174. [Google Scholar] [CrossRef]
  13. Maken, D.; Léger, P.; Roth, S. Seasonal thermal cracking of concrete dams in northern regions. J. Perform. Constr. Facil. 2014, 28. [Google Scholar] [CrossRef]
  14. Mizabozorg, H.; Hariri-Ardebili, M.A.; Shirkhan, M.; Seyed-Kolbadi, S.M. Mathematical modeling and numerical analysis of thermal distribution in arch dams considering solar radiation effect. Sci. World J. 2014, 2014, 597393. [Google Scholar] [CrossRef] [Green Version]
  15. Mizabozorg, H.; Hariri-Ardebili, M.A.; Seyed-Kolbadi, S.M. Structural safety evaluation of Karun III Dam and calibration of its finite element model using instrumentation and site observation. Case Stud. Struct. Eng. 2014, 1, 6–12. [Google Scholar] [CrossRef] [Green Version]
  16. ICOLD Benchmark Workshop 2017. Available online: https://www.icold-bw2017.conf.kth.se/workshop/ (accessed on 30 January 2020).
  17. Enzell, J.; Tollsten, M. Thermal Cracking of a Concrete Arch Dam due to Seasonal Temperature Variations. Master’s Thesis, KTH Royal Institute of Technology, Stockholm, Sweden, 2017. [Google Scholar]
  18. Malm, R. Guideline for FE Analyses of Concrete Dams; Energiforsk Report 2016:270; Energiforsk AB: Stockholm, Sweden, 2016. [Google Scholar]
  19. Andersson, O.; Seppälä, M. Verification of the Response of a Concrete Arch Dam Subjected to Seasonal Temperature Variations. Master’s Thesis, KTH Royal Institute of Technology, Stockholm, Sweden, 2015. [Google Scholar]
  20. FERC. Engineering Guidelines for the Evaluation of Hydro Power Projects; Federal Energy Regulatory Commission Division of Dam Safety and Inspections: Washington, DC, USA, 1999. [Google Scholar]
  21. Enzell, J.; Tollsten, M. Cracking of a concrete arch dam due to seasonal temperature variations. In Proceedings of the 14th ICOLD International Benchmark Workshop on Numerical Analysis of Dams, Stockholm, Sweden, 6–8 September 2017; pp. 77–86. [Google Scholar]
  22. Roth, S.N.; Dolice, D.M. Thermal cracking of a concrete arch dam. In Proceedings of the 14th ICOLD International Benchmark Workshop on Numerical Analysis of Dams, Stockholm, Sweden, 6–8 September 2017; pp. 87–96. [Google Scholar]
  23. Hassanzadeh, M.; Ferreira, D. Thermo-mechanical analysis of a concrete arch dam Influence of temperature and fracture energy. In Proceedings of the 14th ICOLD International Benchmark Workshop on Numerical Analysis of Dams, Stockholm, Sweden, 6–8 September 2017; pp. 97–106. [Google Scholar]
  24. Schclar Leitão, N.; Monteiro Azevedo, N.; Castilho, E.; Braga Farinha, L.; Câmara, R. Thermal Cracking Computational Analysis of a Concrete Arch Dam—Theme A: Thermal Cracking of a concrete arch dam. In Proceedings of the 14th ICOLD International Benchmark Workshop on Numerical Analysis of Dams, Stockholm, Sweden, 6–8 September 2017; pp. 107–117. [Google Scholar]
  25. Lie, R.; Aasheim, E.E.; Engen, M. Thermal Cracking of a Concrete Arch Dam—FE analyses with a 3D non-linear material model for concrete. In Proceedings of the 14th ICOLD International Benchmark Workshop on Numerical Analysis of Dams, Stockholm, Sweden, 6–8 September 2017; pp. 118–127. [Google Scholar]
  26. Popovici, A.; Sârghiuță, R.; Ilinca, C.; Anghel, C. Cracking of a concrete arch dam due to seasonal temperature variations. In Proceedings of the 14th ICOLD International Benchmark Workshop on Numerical Analysis of Dams, Stockholm, Sweden, 6–8 September 2017; pp. 128–136. [Google Scholar]
  27. Tzenkov, A.; Frissen, C.; Santurjian, O. Cracking of a Concrete Arch Dam Subjected to Harsh Environmental Conditions—Analysis of Unusual Conditions due to Temperature Variations. In Proceedings of the 14th ICOLD International Benchmark Workshop on Numerical Analysis of Dams, Stockholm, Sweden, 6–8 September 2017; pp. 137–146. [Google Scholar]
  28. de-Pouplana, I.; Gracia, L.; Salazar, F.; Oñate, E. Cracking of a concrete arch dam due to seasonal temperature variations—Theme A. In Proceedings of the 14th International Benchmark Workshop on the Numerical Analysis of Dams, Stockholm, Sweden, 6–8 September 2017; pp. 147–156. [Google Scholar]
  29. Mouy, V.; Molin, X.; Fray, S.; Oukid, Y.; Noret, C. Behaviour of a thin arch dam under thermal load, with brittle behaviour—Analysis of the influence of some computation parameters. In Proceedings of the 14th ICOLD International Benchmark Workshop on Numerical Analysis of Dams, Stockholm, Sweden, 6–8 September 2017; pp. 157–166. [Google Scholar]
  30. Gasch, T.; Ericsson, D. Thermally-induced cracking of a concrete arch dam using COMSOL Multiphysics. In Proceedings of the 14th ICOLD International Benchmark Workshop on Numerical Analysis of Dams, Stockholm, Sweden, 6–8 September 2017; pp. 167–176. [Google Scholar]
  31. Goldgruber, M.; Lampert, R. Thermal Cracking of a Concrete Arch Dam. In Proceedings of the 14th ICOLD International Benchmark Workshop on Numerical Analysis of Dams, Stockholm, Sweden, 6–8 September 2017; pp. 177–186. [Google Scholar]
  32. Shao, C.; Manso, P.A.; Gunn, R.; Pimentel, M.; Schleiss, A.J. Thermal cracking of a thin arch dam in a wide valley with skin reinforcement. In Proceedings of the 14th ICOLD International Benchmark Workshop on Numerical Analysis of Dams, Stockholm, Sweden, 6–8 September 2017; pp. 187–197. [Google Scholar]
  33. Shahriari, S.; Lora, F.; Zenz, G. Thermal cracking of a concrete arch dam—Microplane approach. In Proceedings of the 14th ICOLD International Benchmark Workshop on Numerical Analysis of Dams, Stockholm, Sweden, 6–8 September 2017; pp. 198–207. [Google Scholar]
  34. Hjalmarsson, F.; Pettersson, F. Finite element analysis of cracking of a concrete arch dam due to seasonal temperature variations. In Proceedings of the 14th ICOLD International Benchmark Workshop on Numerical Analysis of Dams, Stockholm, Sweden, 6–8 September 2017; pp. 208–217. [Google Scholar]
  35. Frigerio, A.; Mazzà, G. Thermal cracking of a thin concrete arch dam. In Proceedings of the 14th ICOLD International Benchmark Workshop on Numerical Analysis of Dams, Stockholm, Sweden, 6–8 September 2017; pp. 218–227. [Google Scholar]
  36. Varpasuo, P. Thermal cracking of a concrete dam, PVA Engineering Services contribution to the ICOLD2017 Benchmark Exercise Theme, A. In Proceedings of the 14th ICOLD International Benchmark Workshop on Numerical Analysis of Dams, Stockholm, Sweden, 6–8 September 2017; pp. 228–237. [Google Scholar]
  37. Cornelissen, H.; Hordijk, D.; Reinhardt, H. Experimental determination of crack softening characteristics of normal weight and lightweight concrete. Heron 1986, 31, 45–56. [Google Scholar]
  38. Malm, R.; Könönen, M.; Bernstone, C.; Persson, M. Assessing the structural safety of cracked concrete dams subjected to harsh environment. In Proceedings of the ICOLD 2019 Annual Meeting/Symposium, Ottawa, ON, Canada, 9–14 June 2019; pp. 383–397. [Google Scholar]
  39. Malm, R. Predicting Shear Type Crack Initiation and Growth in Concrete with Non-Linear Finite Element Method. Ph.D. Thesis, KTH Royal Institute of Technology, Stockholm, Sweden, 2009. [Google Scholar]
  40. Brühwiler, E. Fracture of mass concrete under simulated seismic action. Dam Eng. 1990, 1, 153–176. [Google Scholar]
  41. Fib Model Code 2010, Bulletins 55 and 56; International Federation for Structural Concrete: Lausanne, Switzerland, 2012.
  42. Ghaemmaghami, A.; Ghaemian, M. Large-scale testing on specific fracture energy determination of dam concrete. Int. J. Fract. 2006, 141, 247–254. [Google Scholar] [CrossRef]
Figure 1. (a) Photo of the concrete arch dam used as the reference for the benchmark workshop, (b) illustration of the dam geometry. From [1].
Infrastructures 05 00019 g001
Figure 2. Downstream view of the arch dam with the spillway shown to the left and the abutment block to the right. The monitoring points are also shown where section 100 is at the crest and Section 06 is in the central part of the dam. Reproduced from [17].
Infrastructures 05 00019 g002
Figure 3. Measured displacement of the dam, shortly after finalisation (dashed lines) and after about 50 years of service (solid lines) for summer (red) and winter (blue) conditions, respectively, (a) crest displacement, (b) displacement along the dam height. The figure also shows the observed crack pattern on the downstream side (bottom) and the cross-section of the dam (right).
Infrastructures 05 00019 g003
Figure 4. Illustration of the combined temperature profile for an extreme cold year followed by an extreme warm year. From [1].
Infrastructures 05 00019 g004
Figure 5. Illustration of the mesh provided to the contributors in the benchmark workshop.
Infrastructures 05 00019 g005
Figure 6. Illustration of the real foundation (left) were the dam is excavated into the rock and where cohesion is prevented by an asphalt coating. The idealised geometry in the FE model (right).
Infrastructures 05 00019 g006
Figure 7. The calculated displacement along the dam crest for static loads based on linear elastic models, according to the contributors.
Infrastructures 05 00019 g007
Figure 8. Example of an illustration of the predicted extent of cracking due to static loads from contributor No. 4.
Infrastructures 05 00019 g008
Figure 9. Example of an illustration of the predicted extent of cracking due to extreme temperatures from the following contributors: (a) No. 4, (b) No. 13, (c) No. 8, (d) No. 12, (e) No. 16, (f) No. 6.
Infrastructures 05 00019 g009
Figure 10. Example of an illustration of the predicted extent of cracking from contributor No. 5 using a lower fracture energy (200 Nm/m2 in the top) and a higher fracture energy (500 Nm/m2 bottom).
Infrastructures 05 00019 g010
Figure 11. The calculated displacement along the dam crest during winter conditions based on non-linear analyses, according to the contributors.
Infrastructures 05 00019 g011
Table 1. Conductive heat coefficients as given by [1].
ParameterConvective Heat Coefficient
(W/(m2 K))
Comment
Downstream surface of the arch dam–air4The downstream surface should be considered to have lower conductive heat coefficient compared to other concrete surfaces. (the reason is that there is usually some heat insulating material installed on the downstream surface on dams in Sweden).
Concrete–air13For all surfaces exposed to air, except the downstream surface of the arch dam.
Concrete–water500
Concrete–rock1000
Rock–air13
Rock–water500
Table 2. Material properties as given by [1].
PropertyConcreteRockReinforcement
MechanicalElastic modulus33 GPa40 GPa200 GPa
Poisson’s ratio0.20.150.3
Density2300 kg/m32700 kg/m37800 kg/m3
Compressive strength38 MPa--
Tensile strength2.9 MPa--
Yield stress--360 MPa
Ultimate strength--600 MPa
Ultimate strain--0.15
ThermalThermal expansion1 × 10−5 K−11 × 10−5 K−11 × 10−5 K−1
Thermal conductivity2 W/(m K)3 W/(m K)39 W/(m K)
Stress/strain free temperature4 °C4 °C4 °C
Specific heat capacity900 J/(kg K)850 J/(kg K)450 J/(kg K)

