A New Method to Evaluate the Post-Earthquake Performance and Safety of Reinforced Concrete Structural Frame Systems

 ,
, 

Abstract
: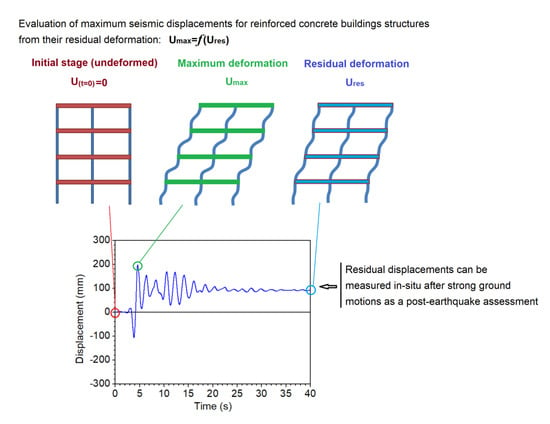
1. Introduction
2. Reinforced Concrete Frames under Consideration
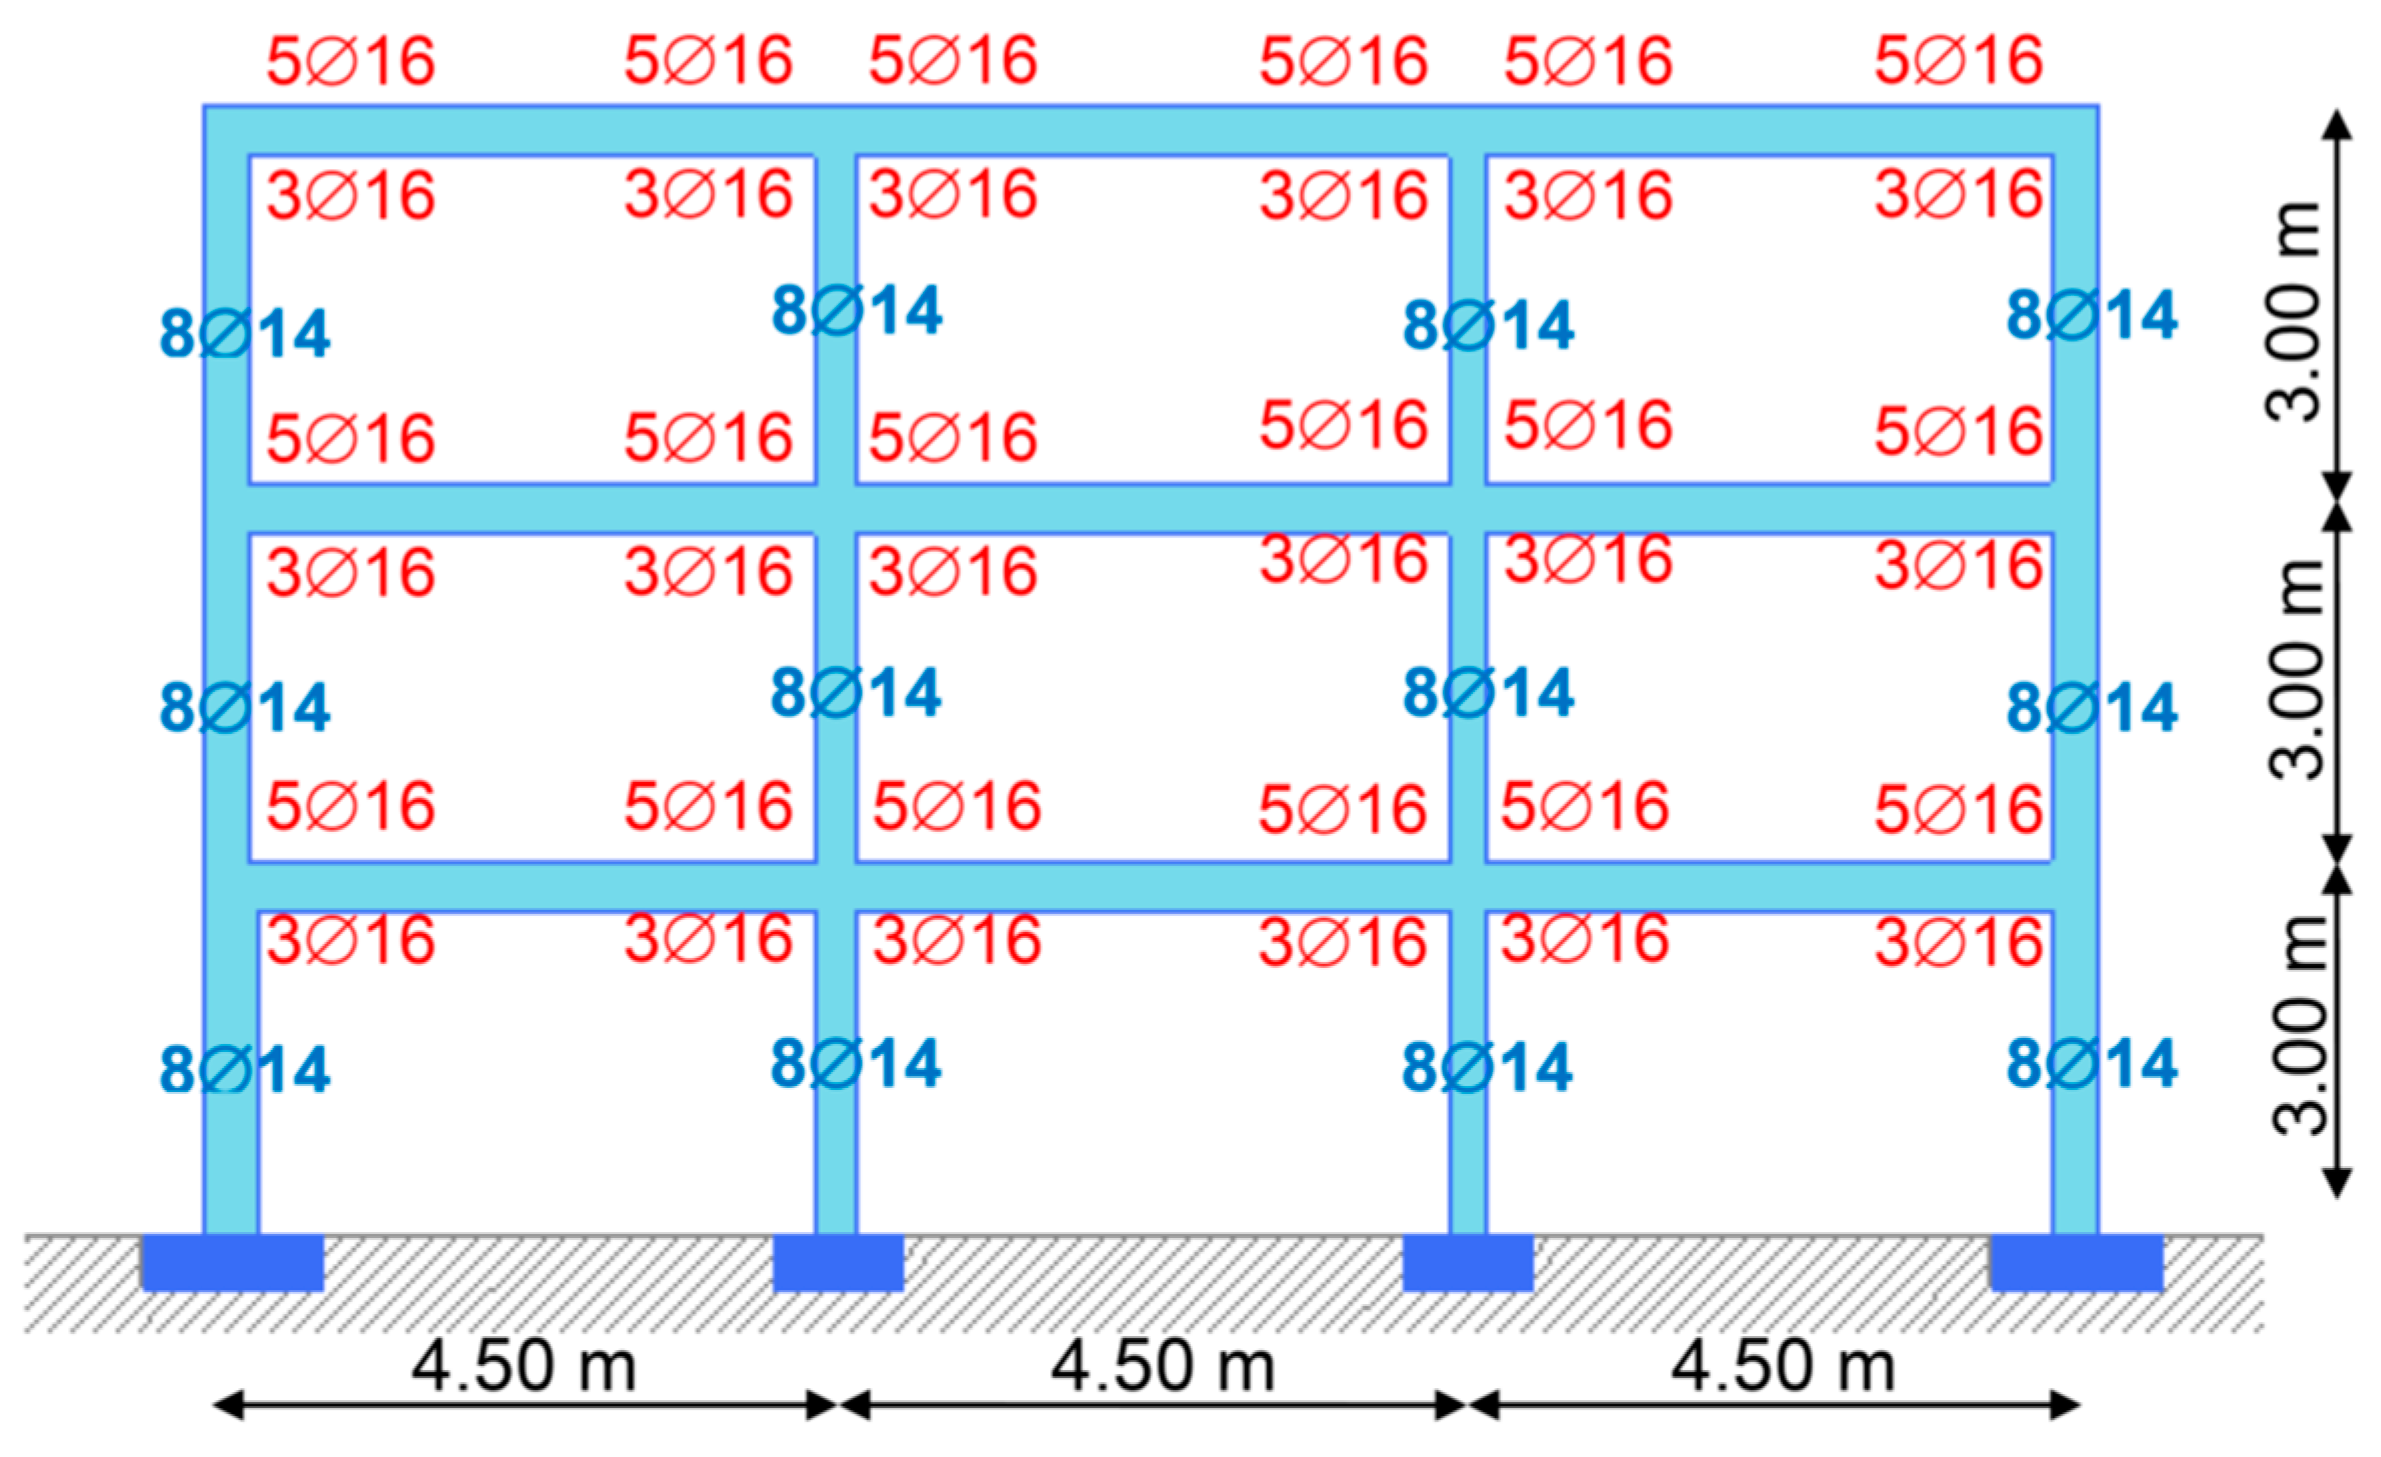
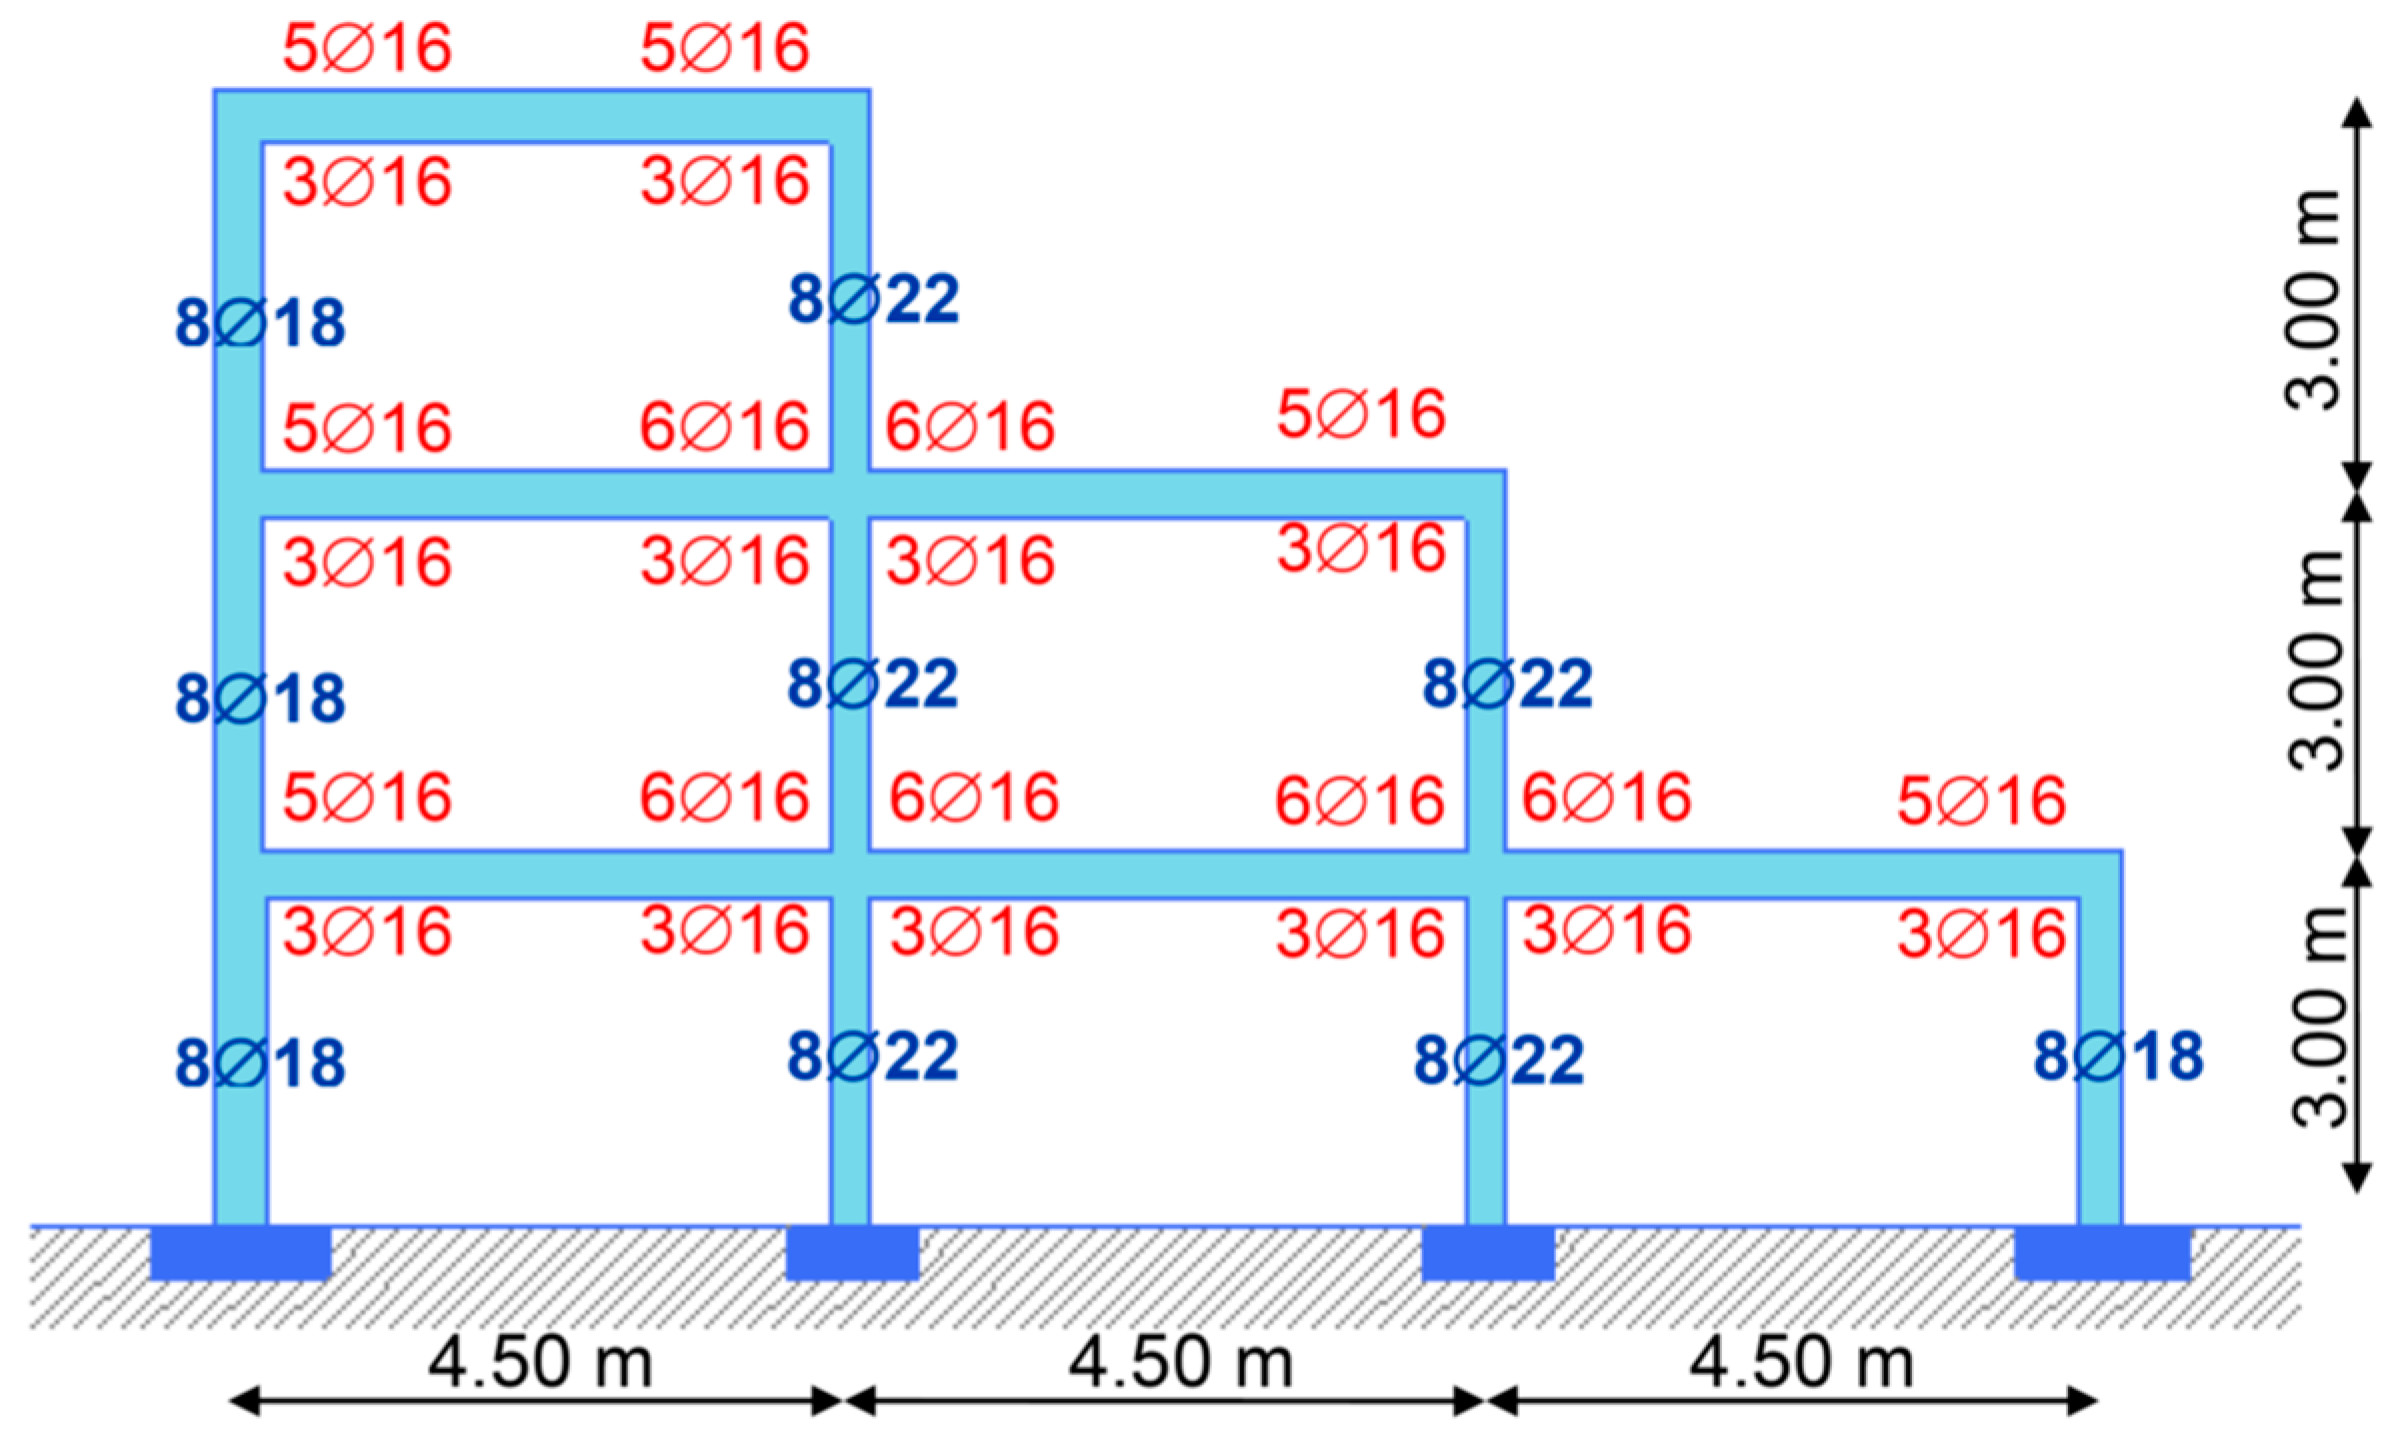
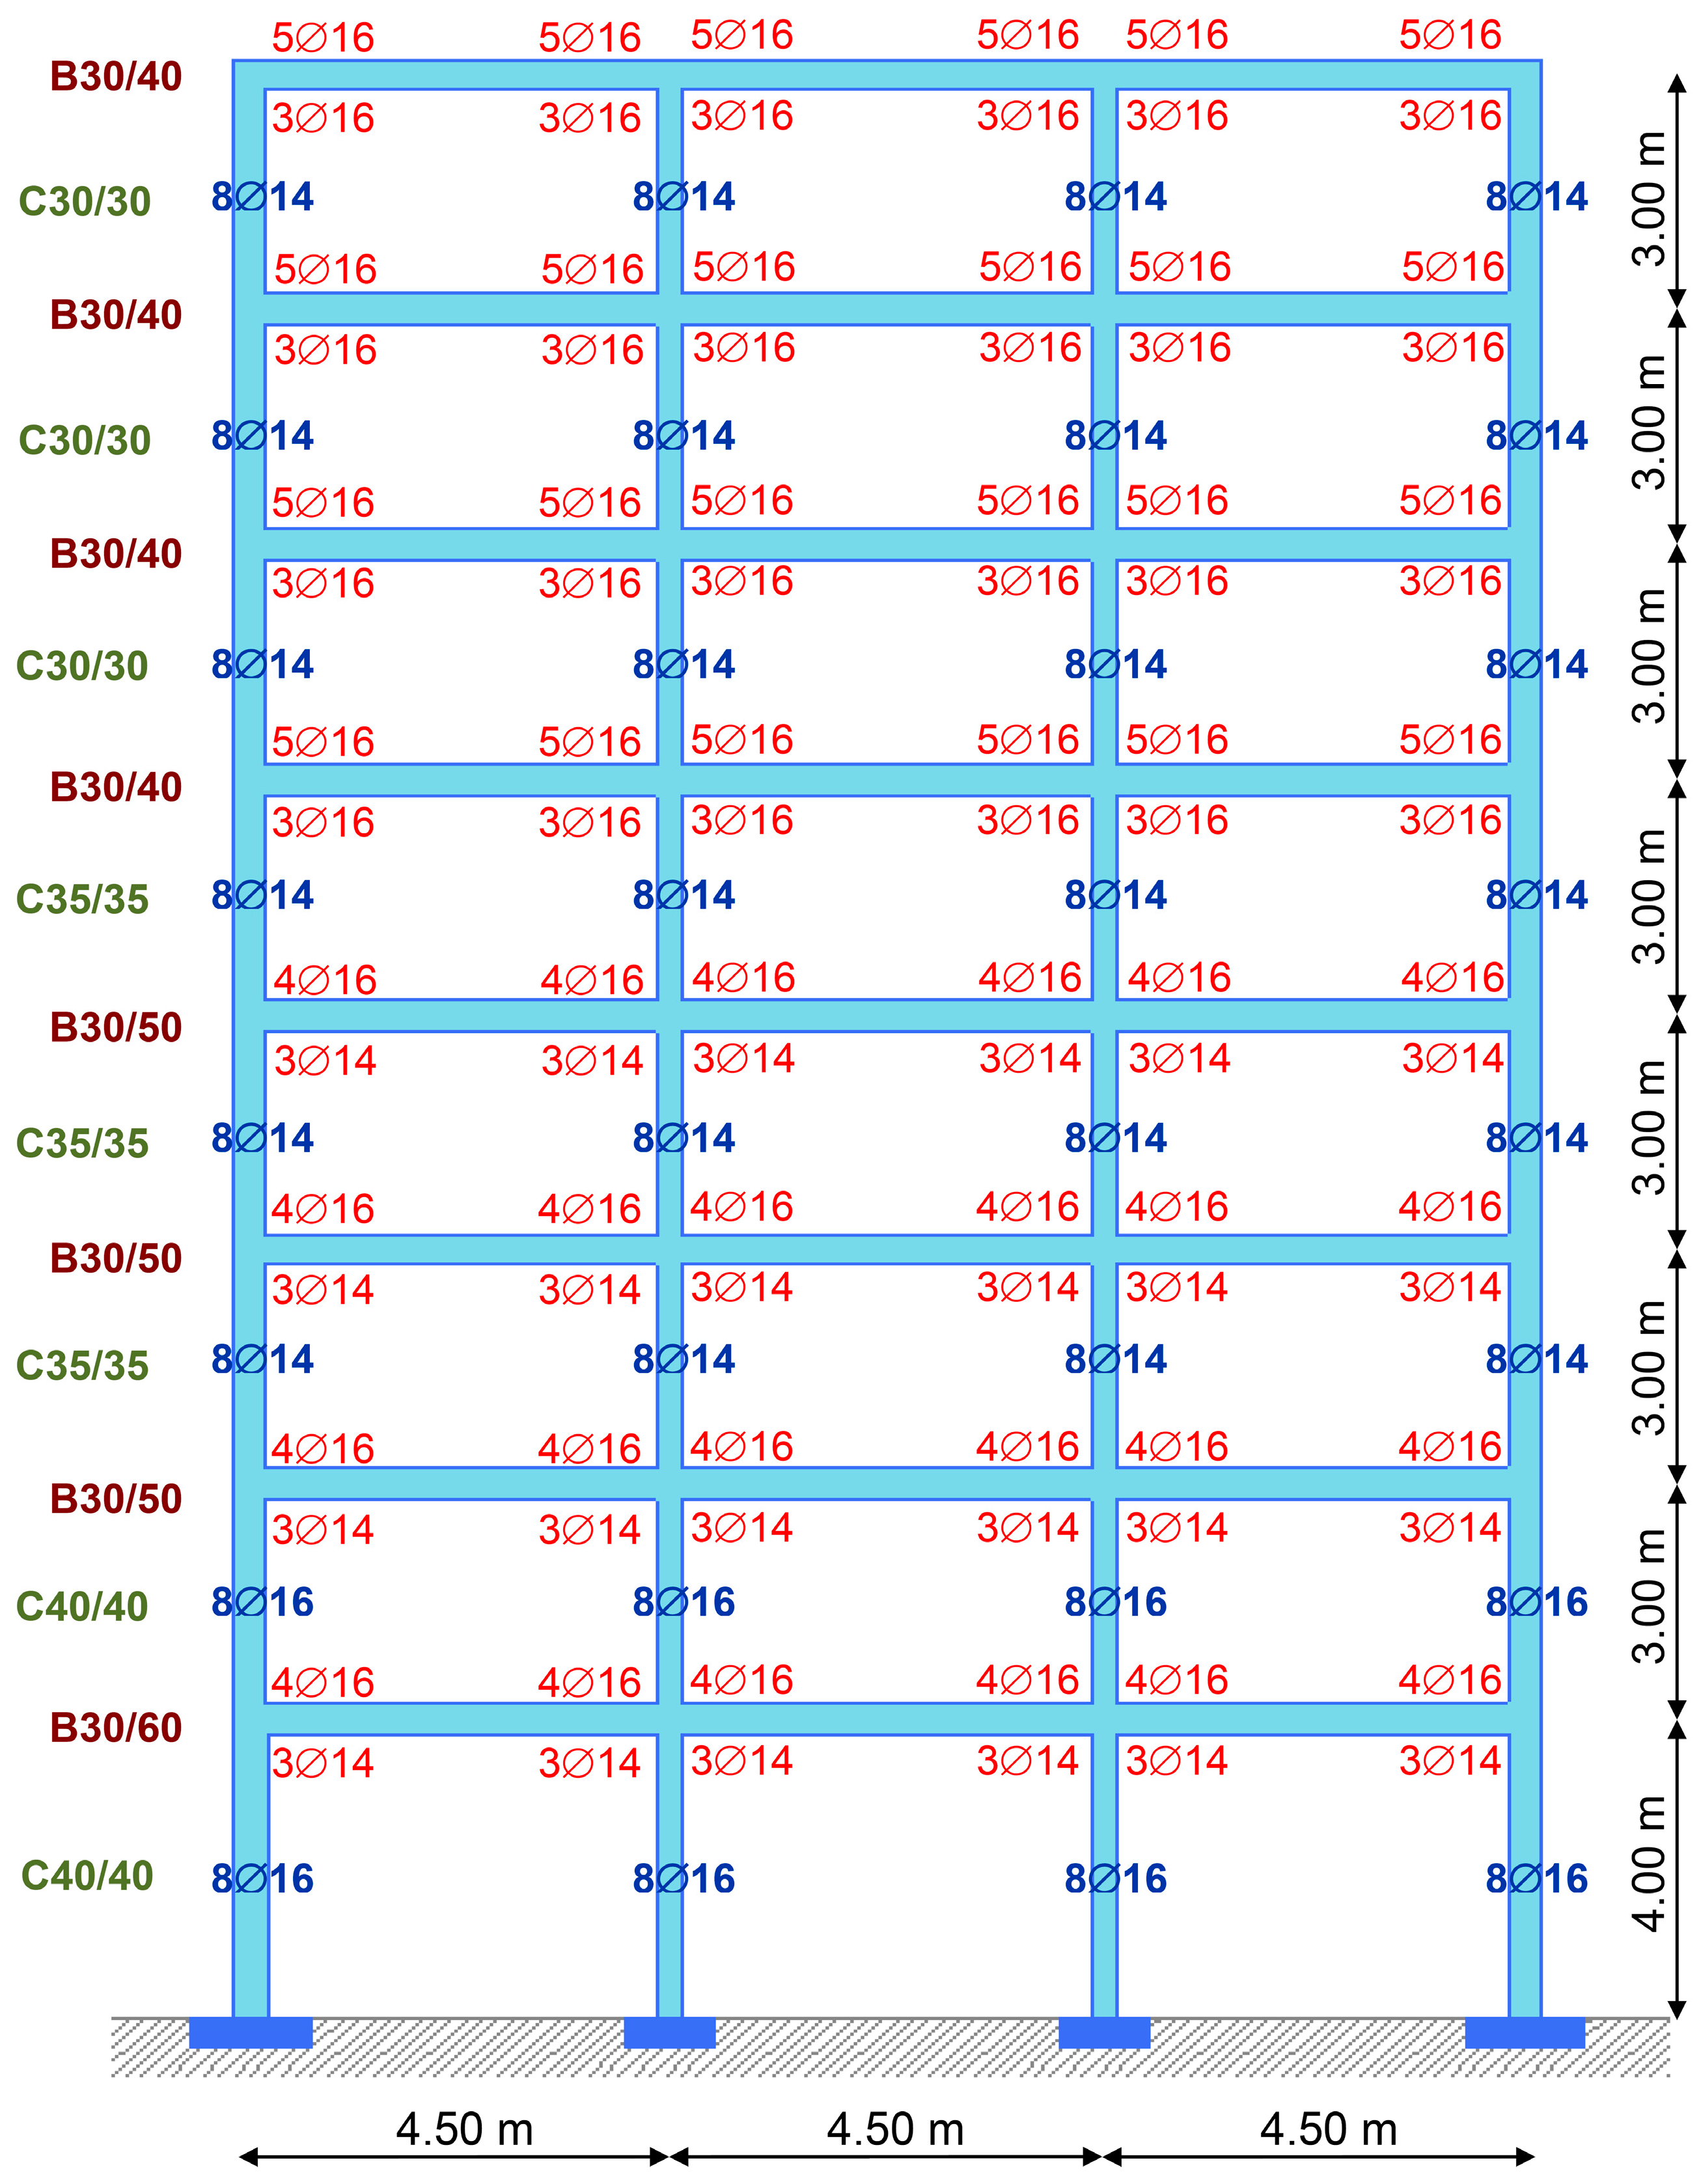
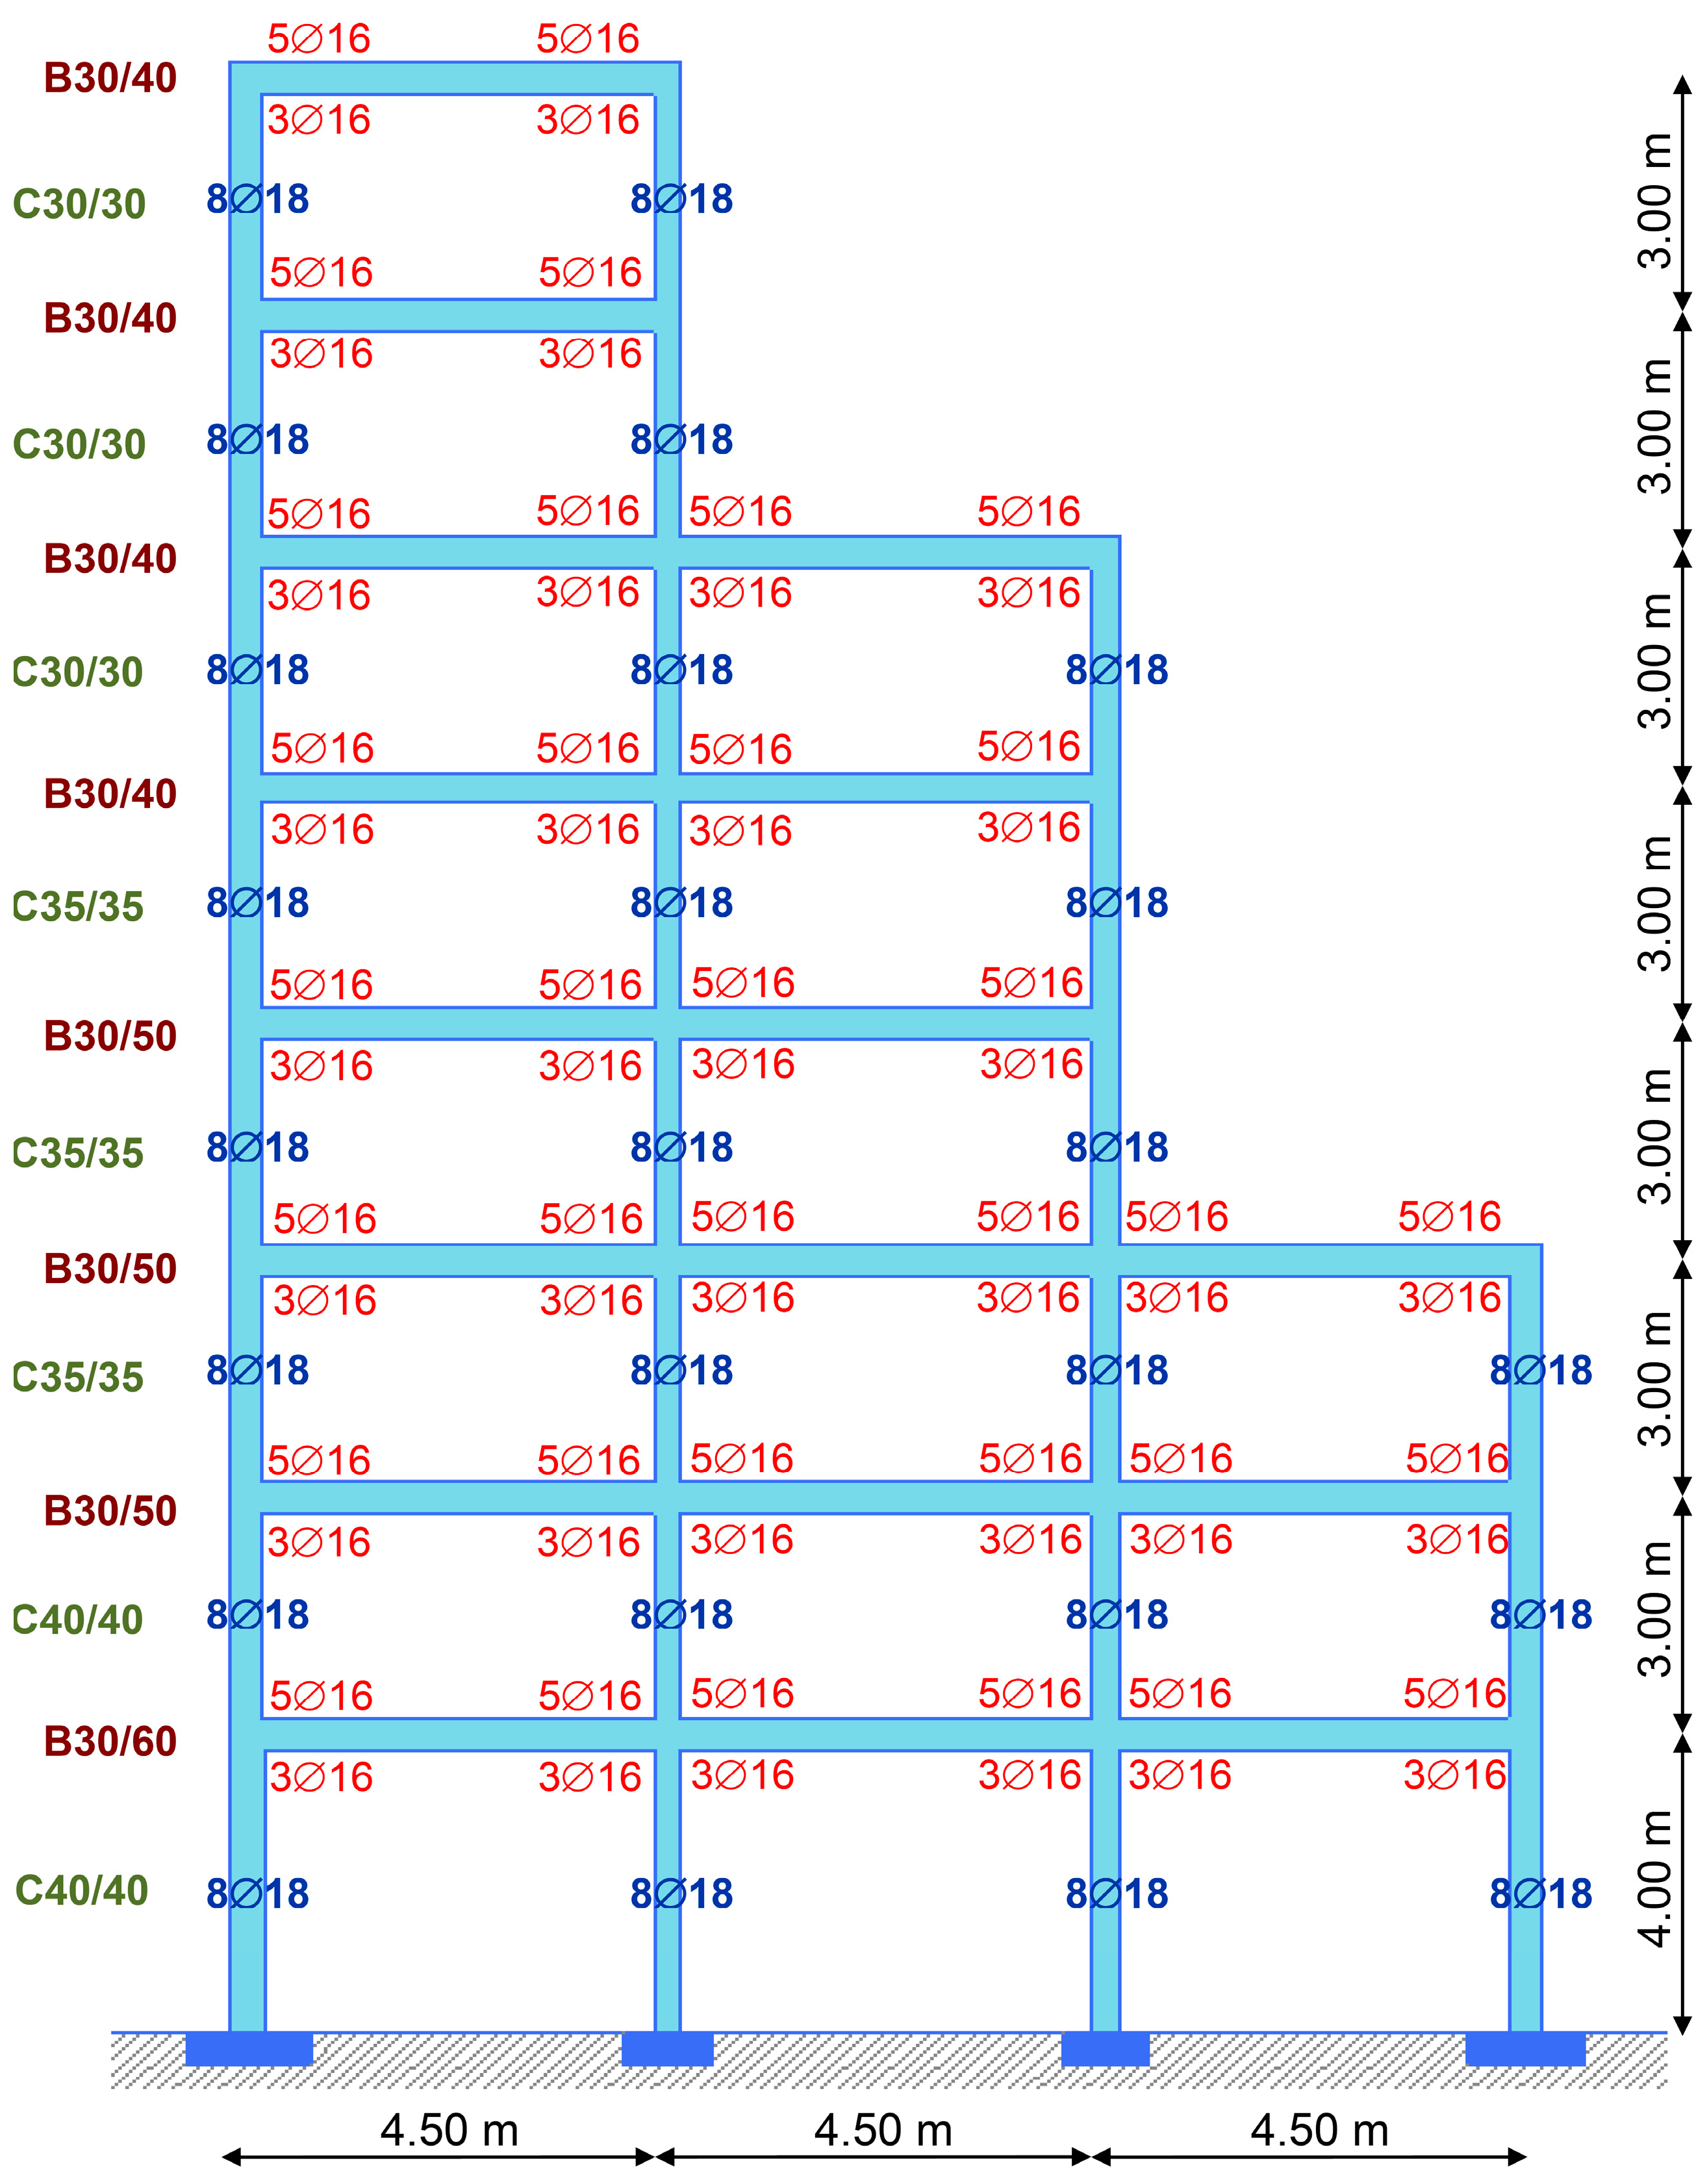
2.1. General Description
- (a)
- 1.35G + 1.50Q
- (b)
- 1.00G + ψQ + 1.00E
- (c)
- 1.00G + ψQ – 1.00E
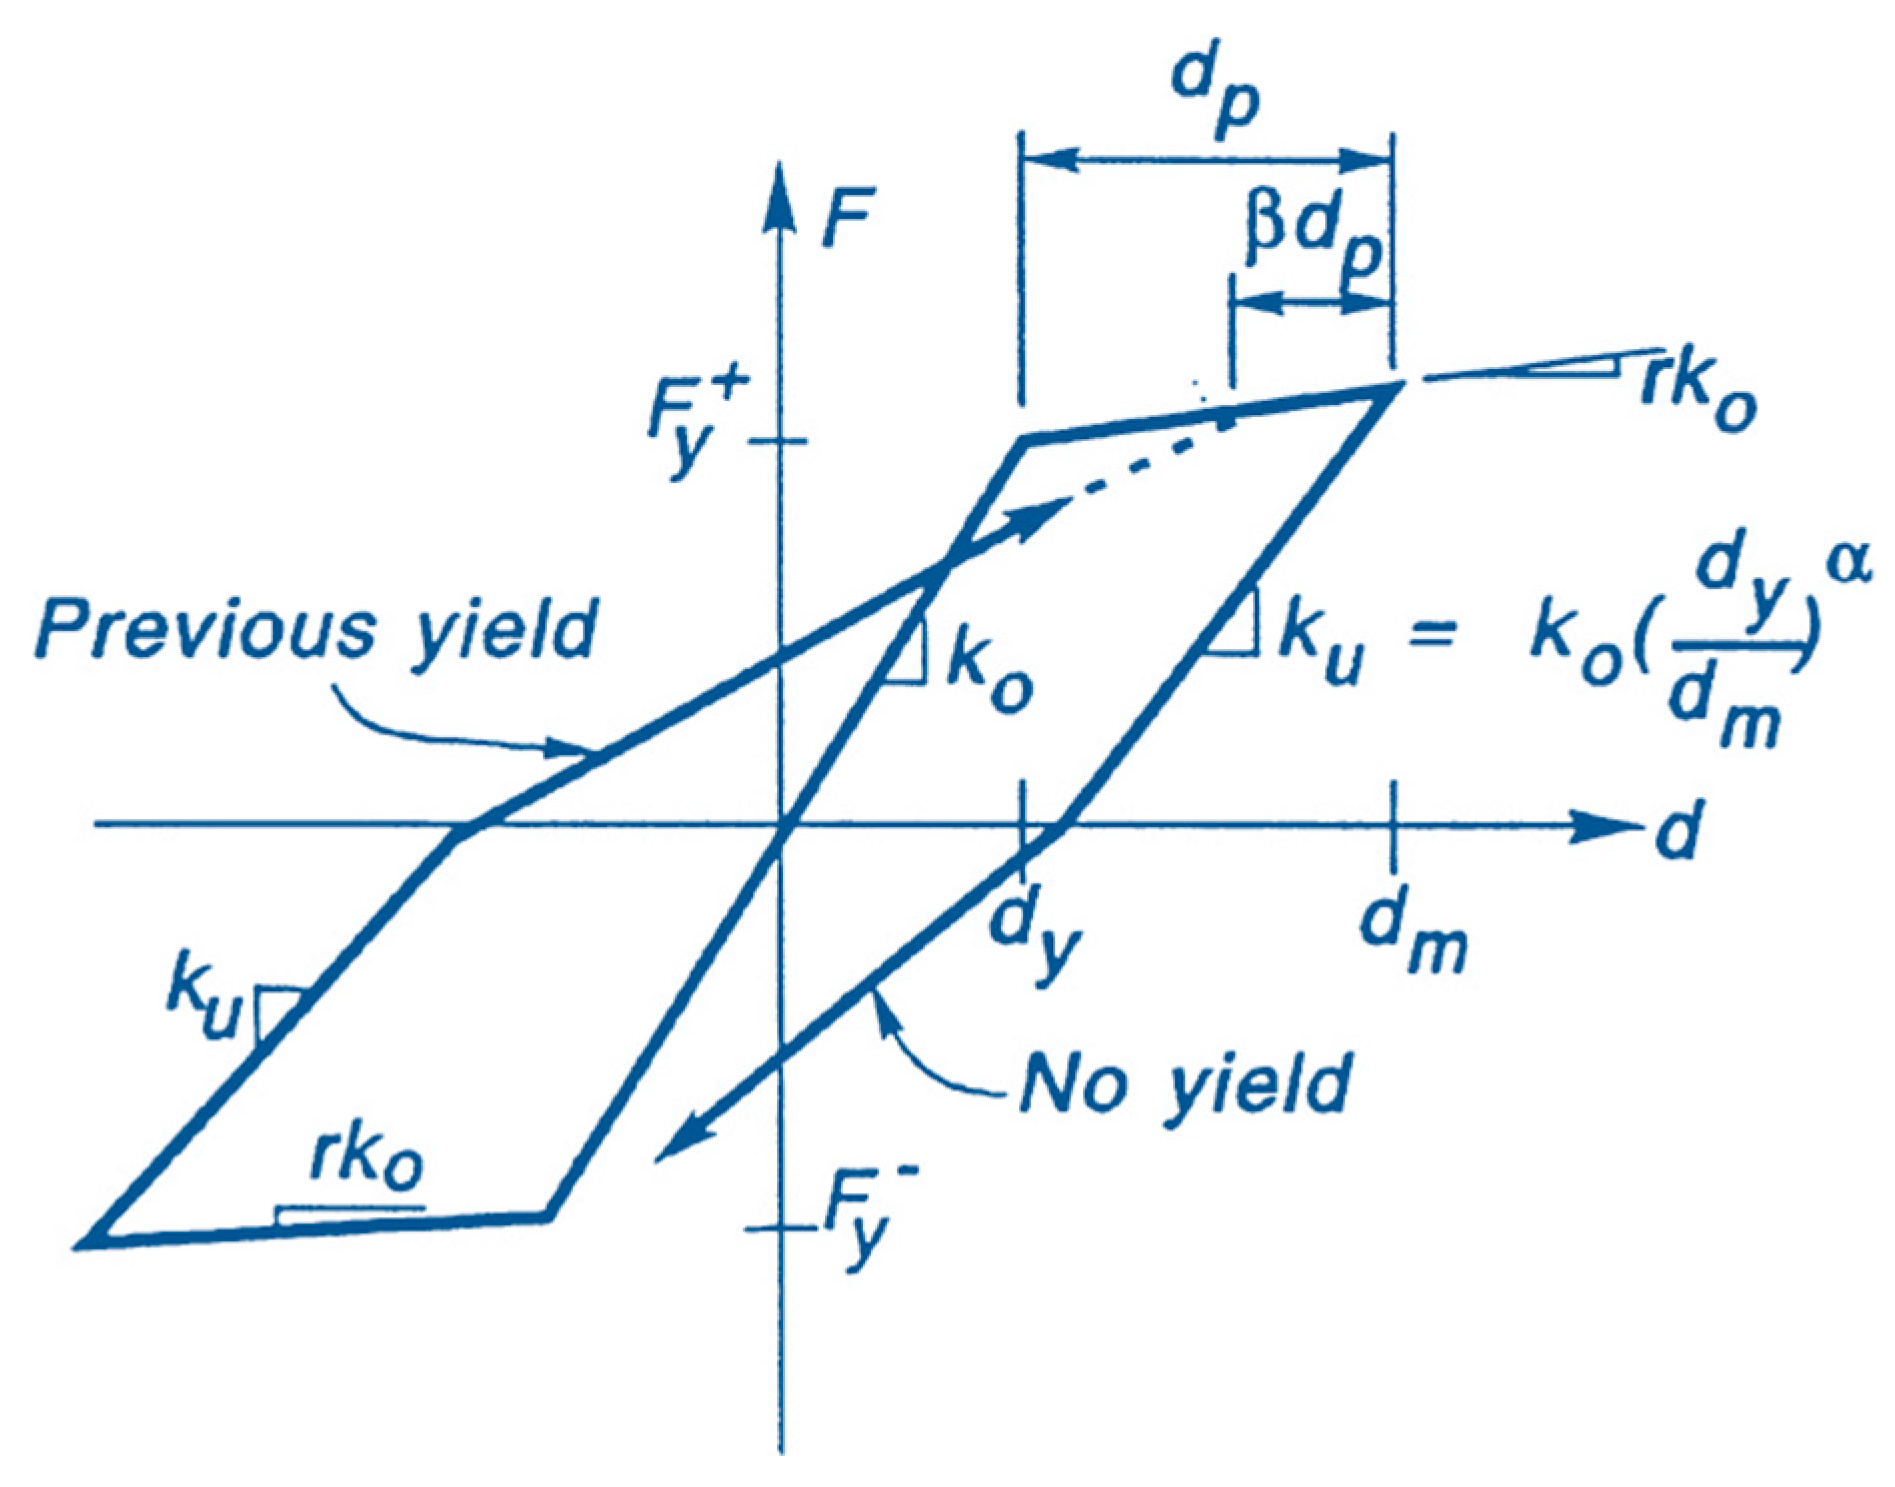
2.2. Nonlinear Modeling
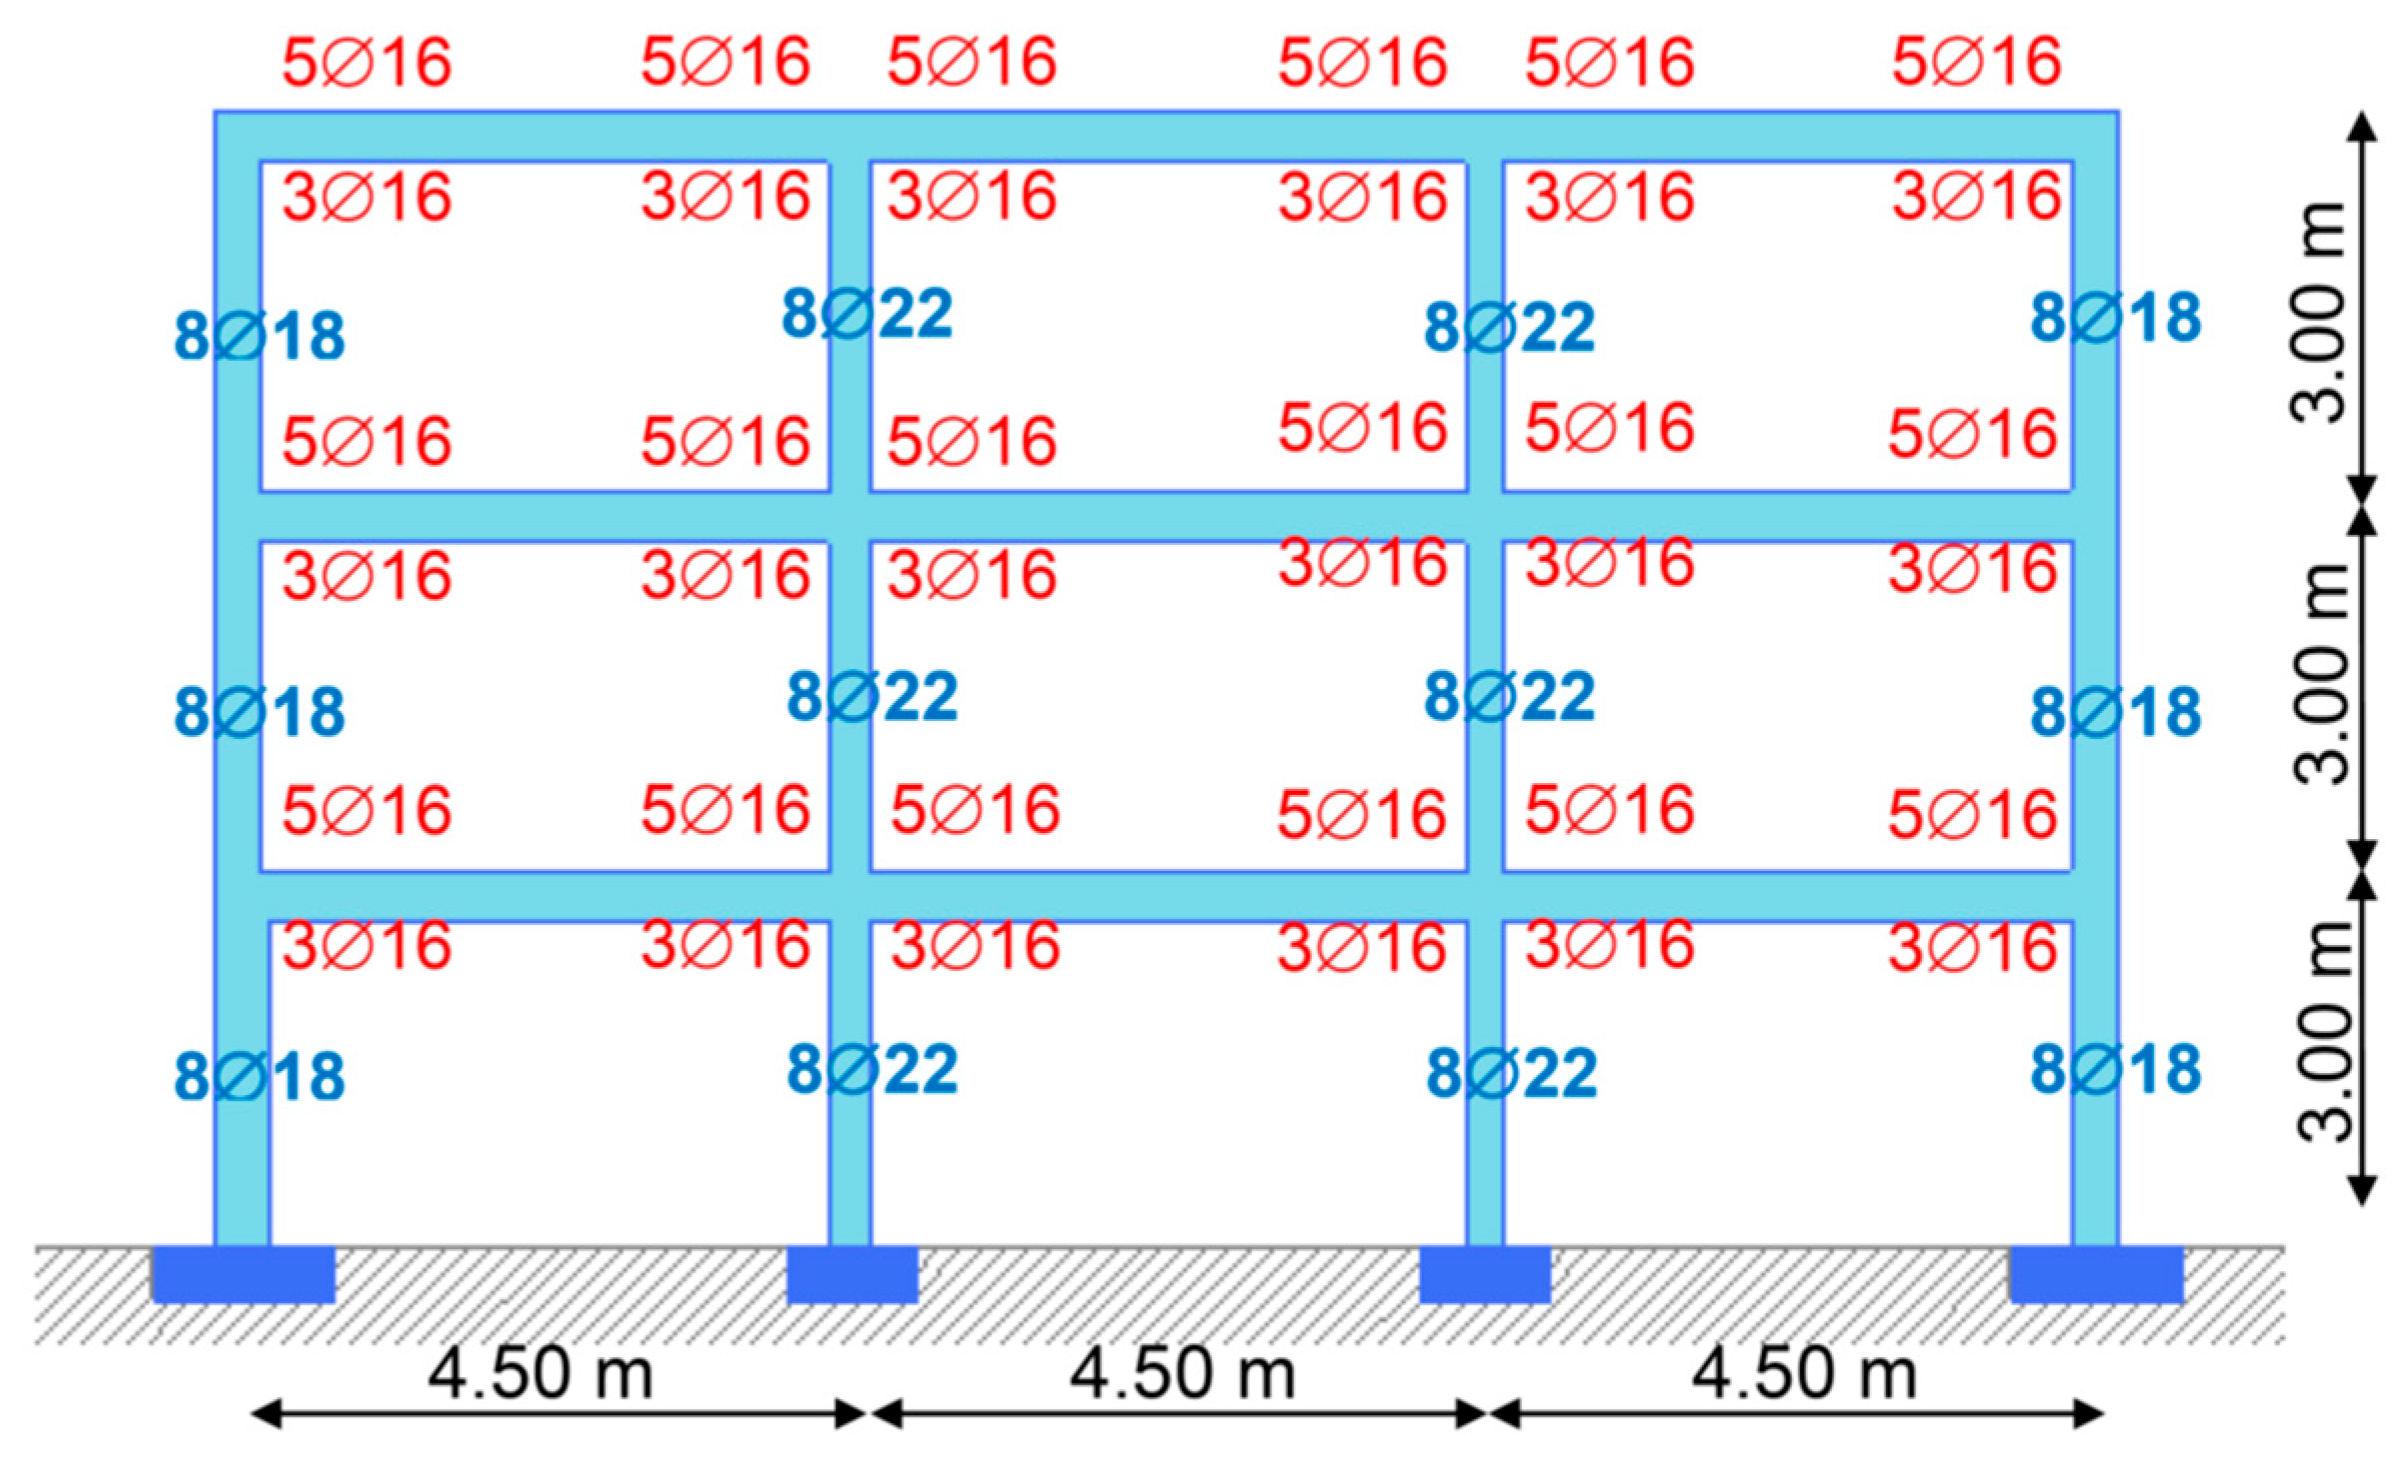
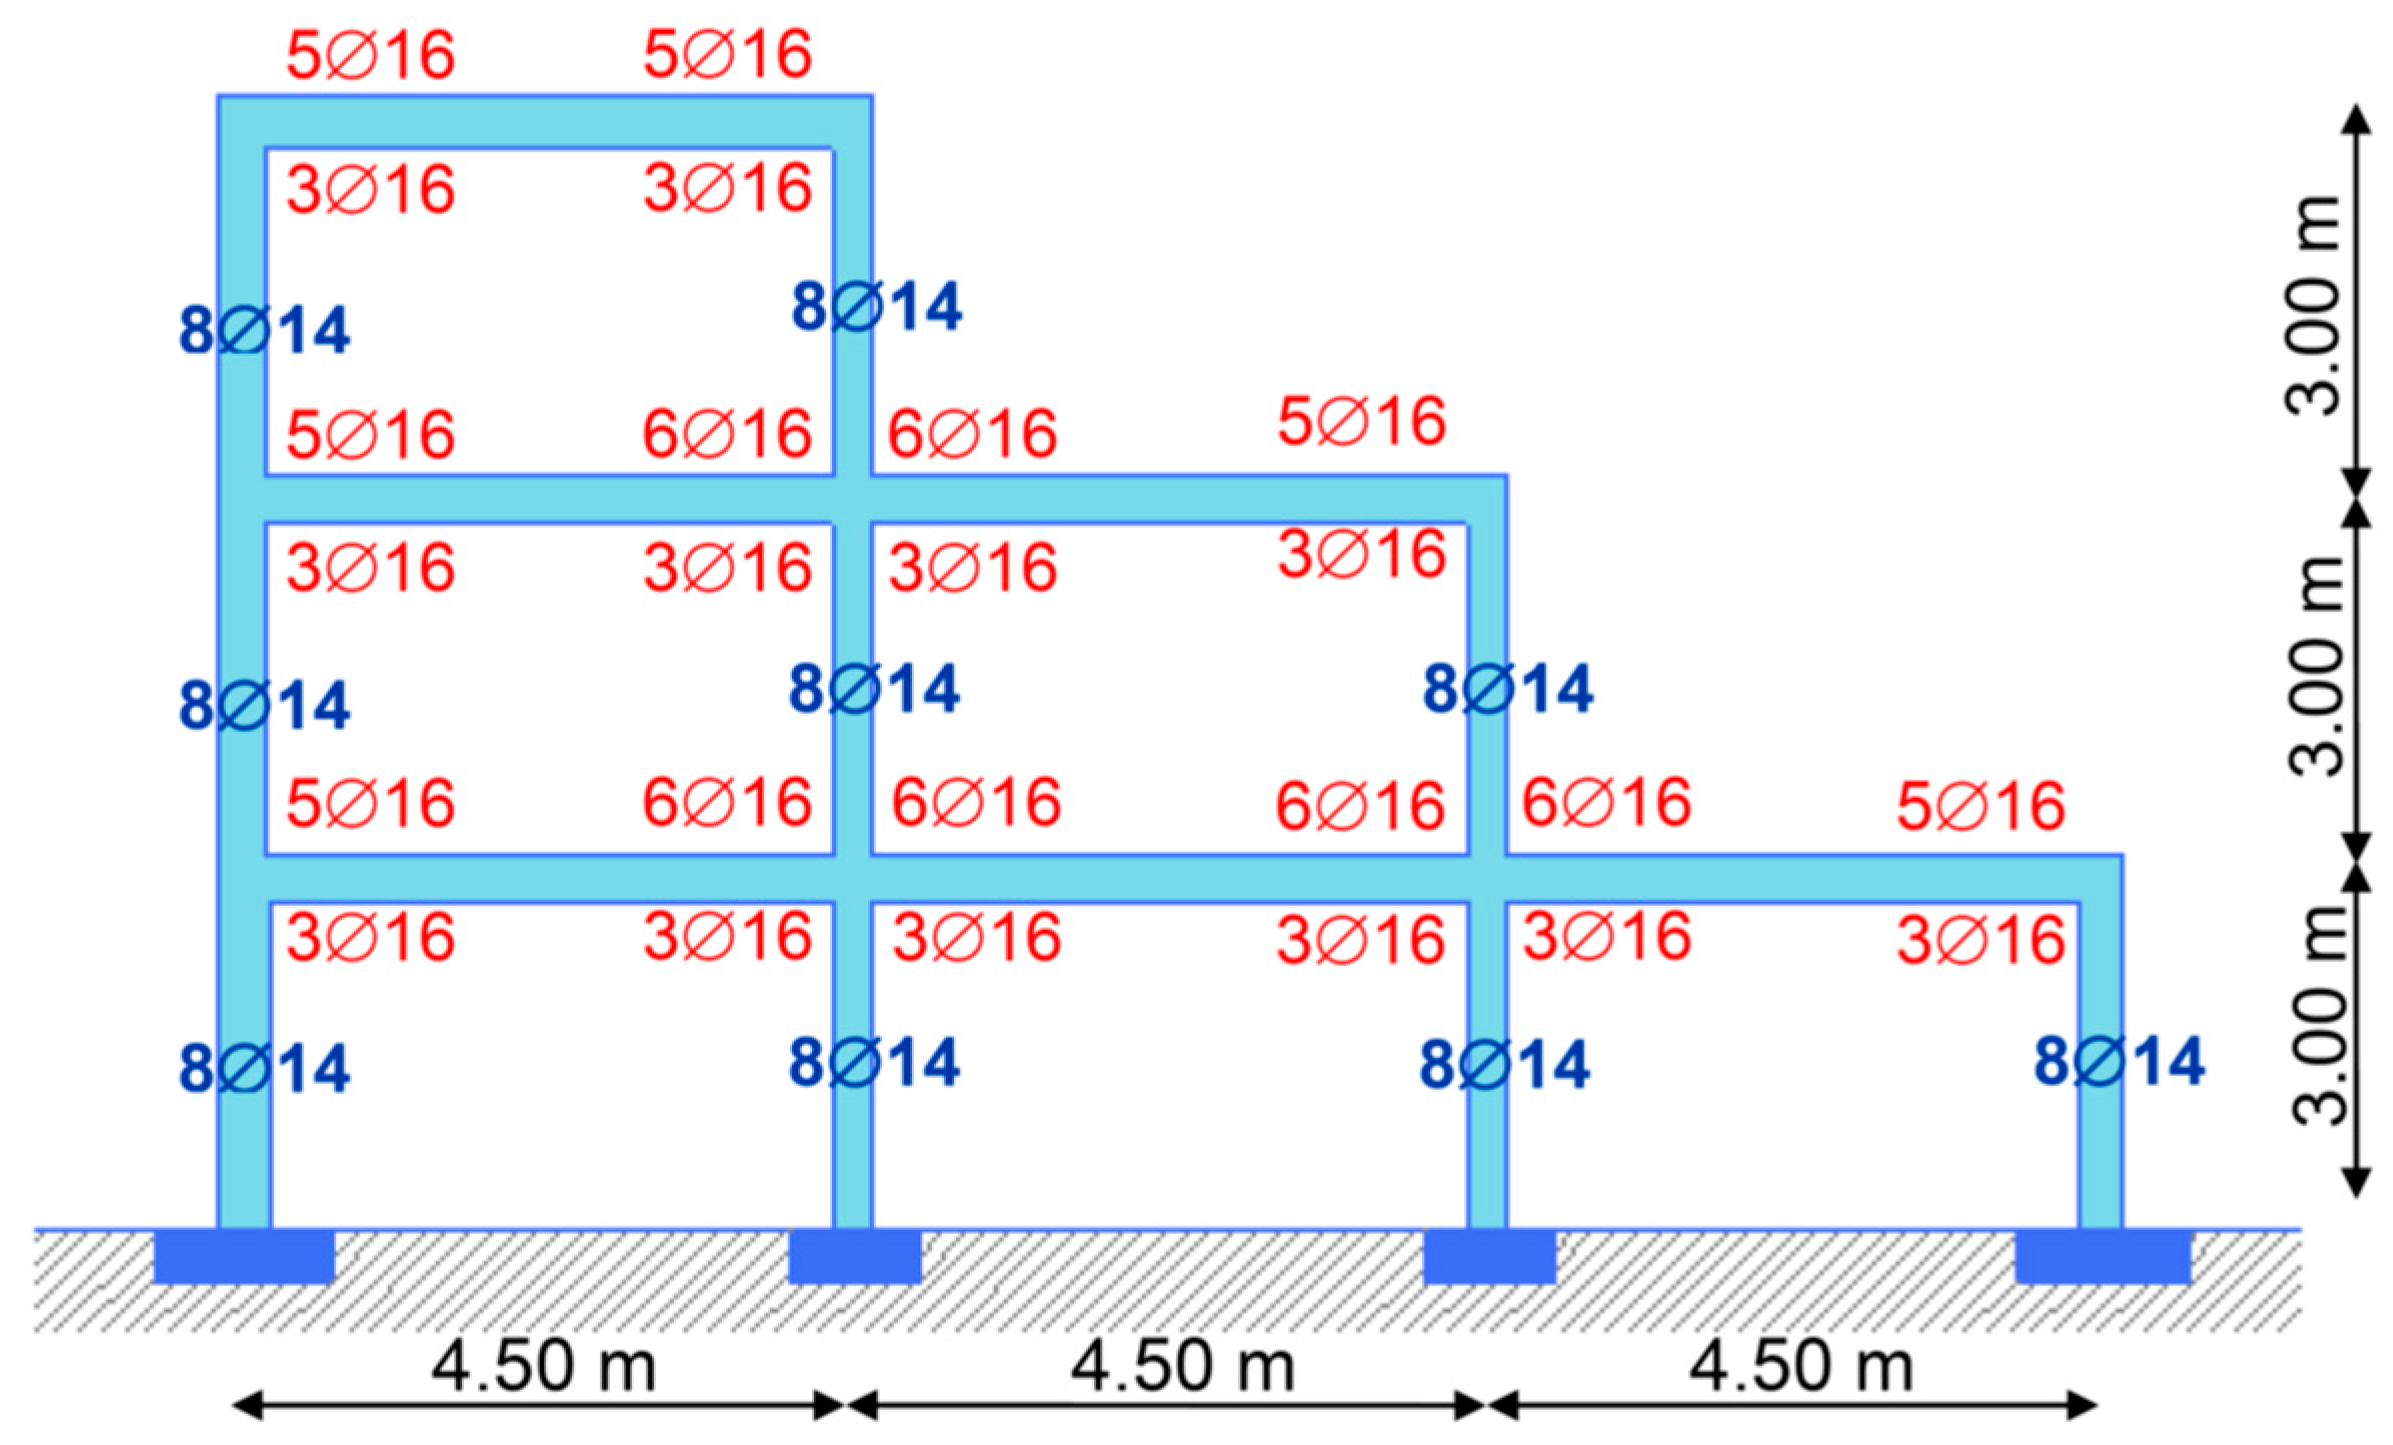
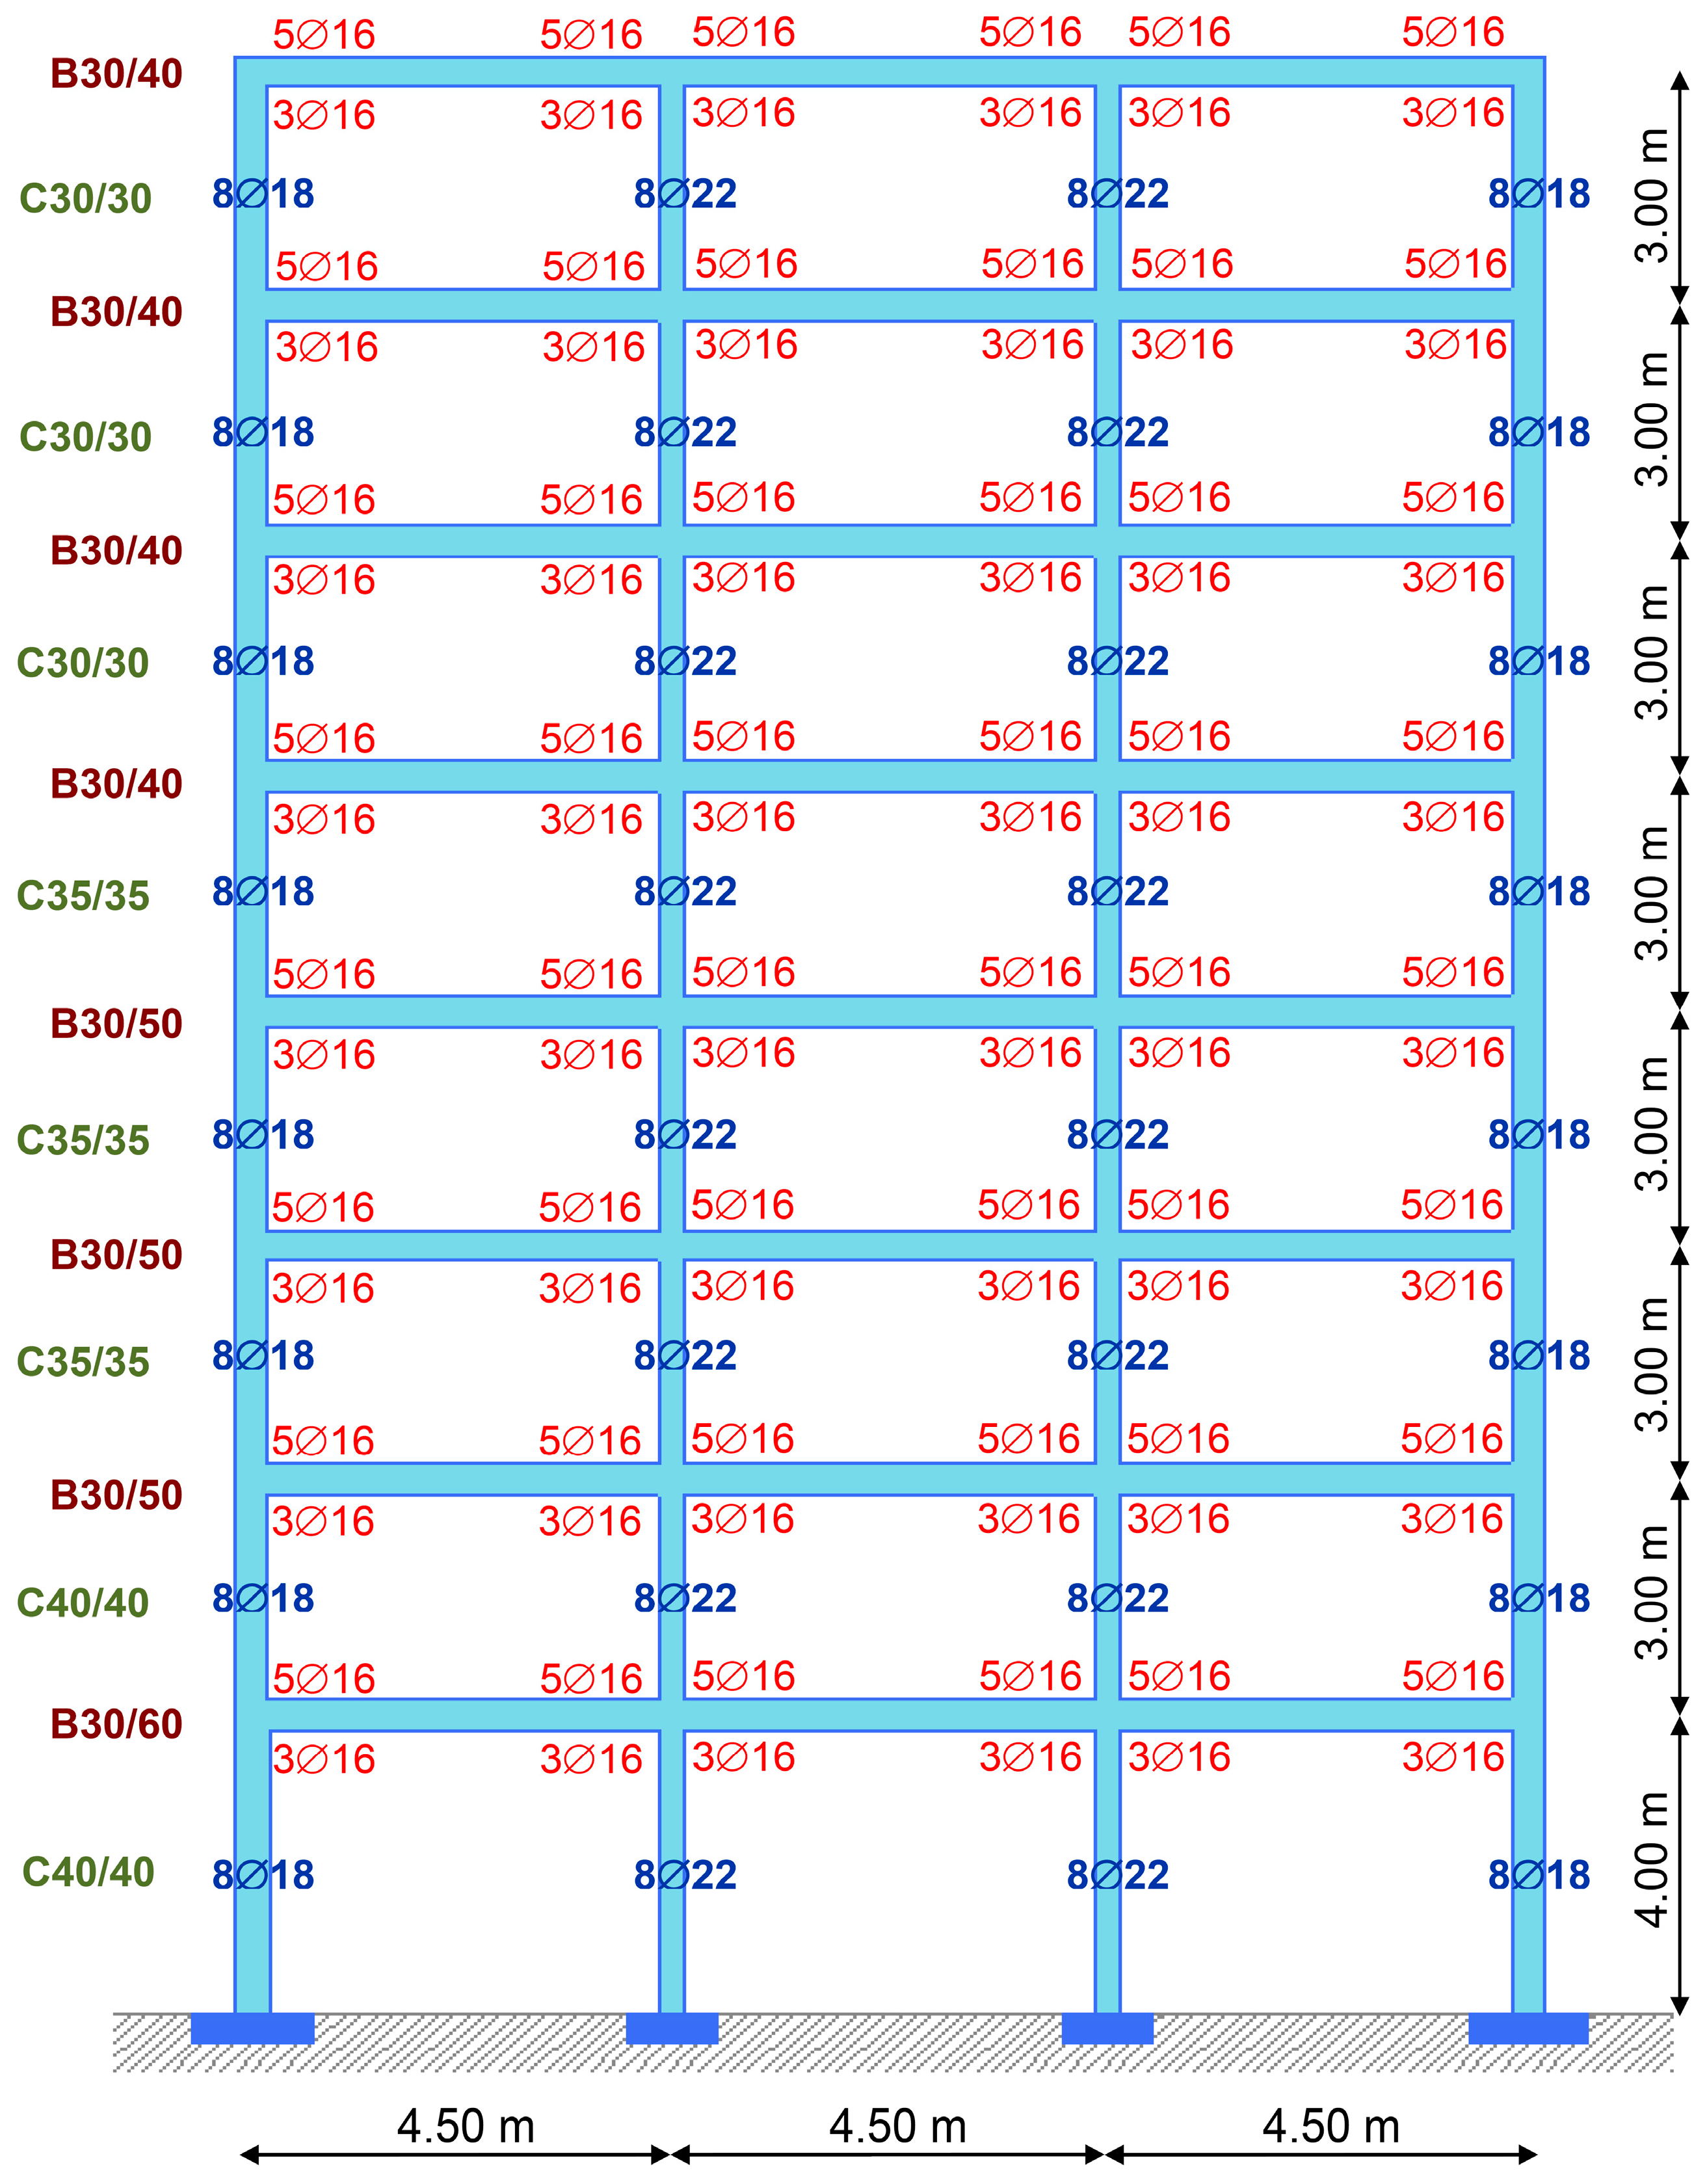
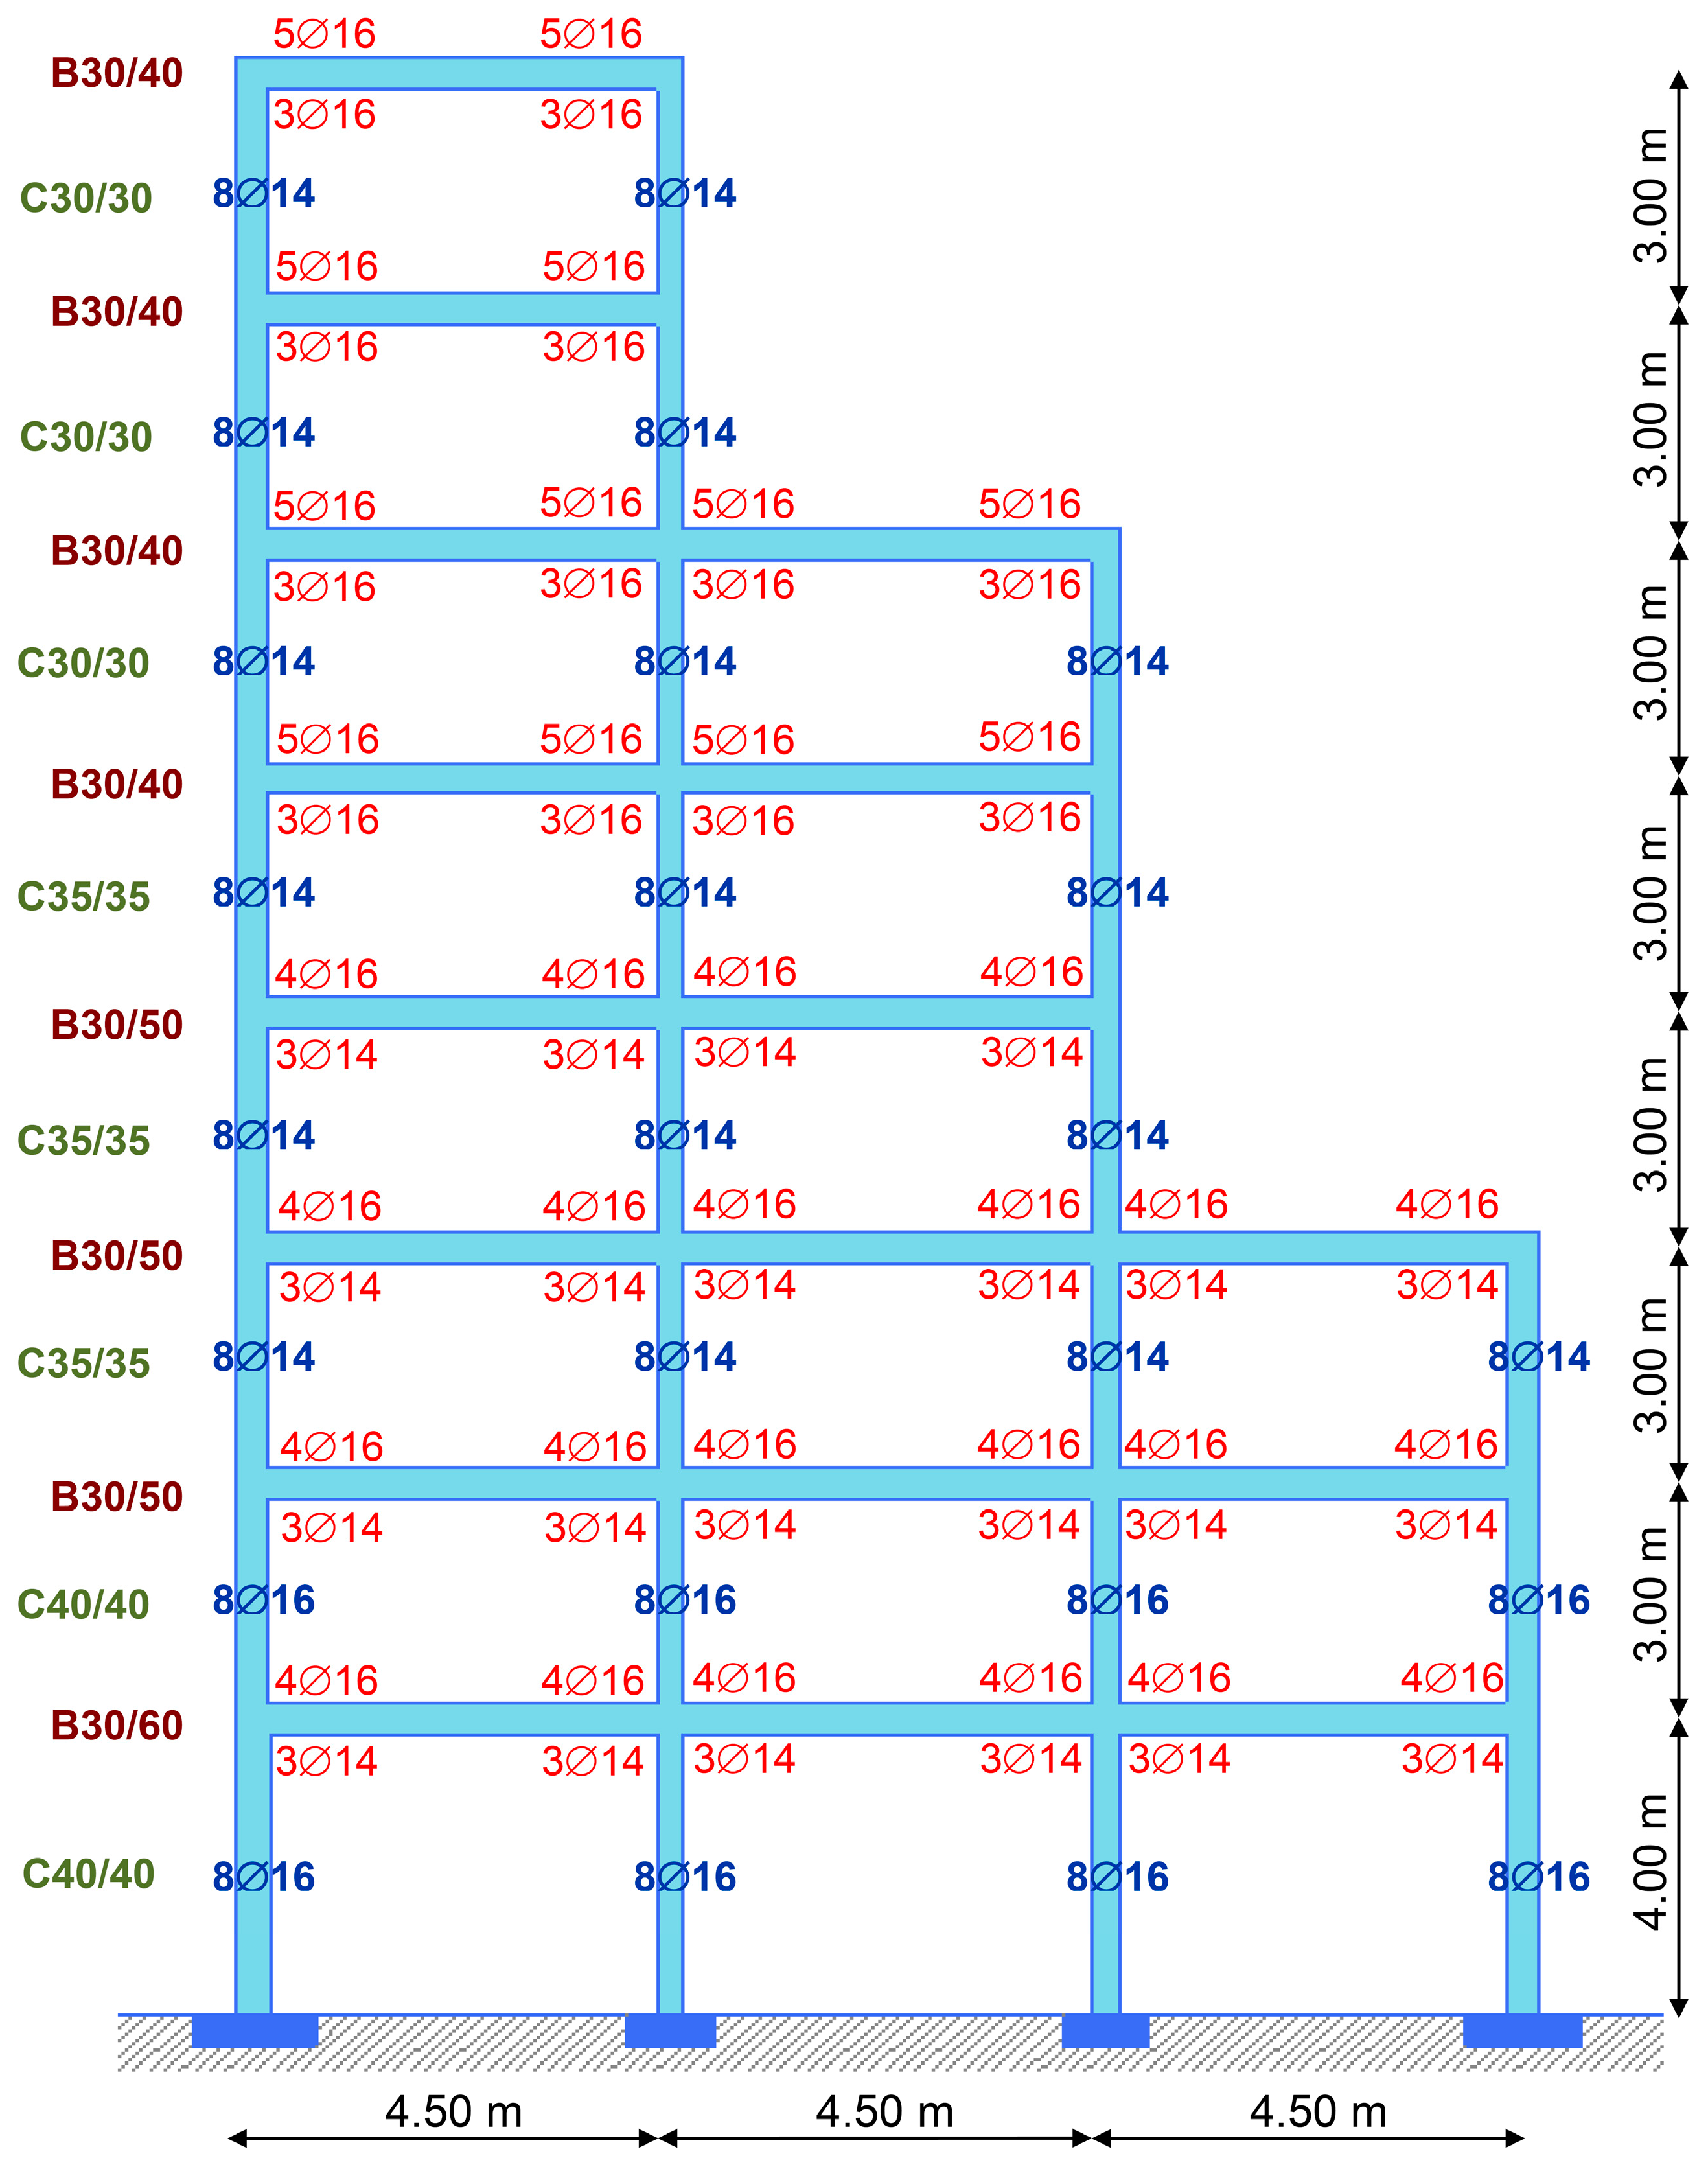
2.3. Description of Structures and their Reinforcement Amount and Arrangement
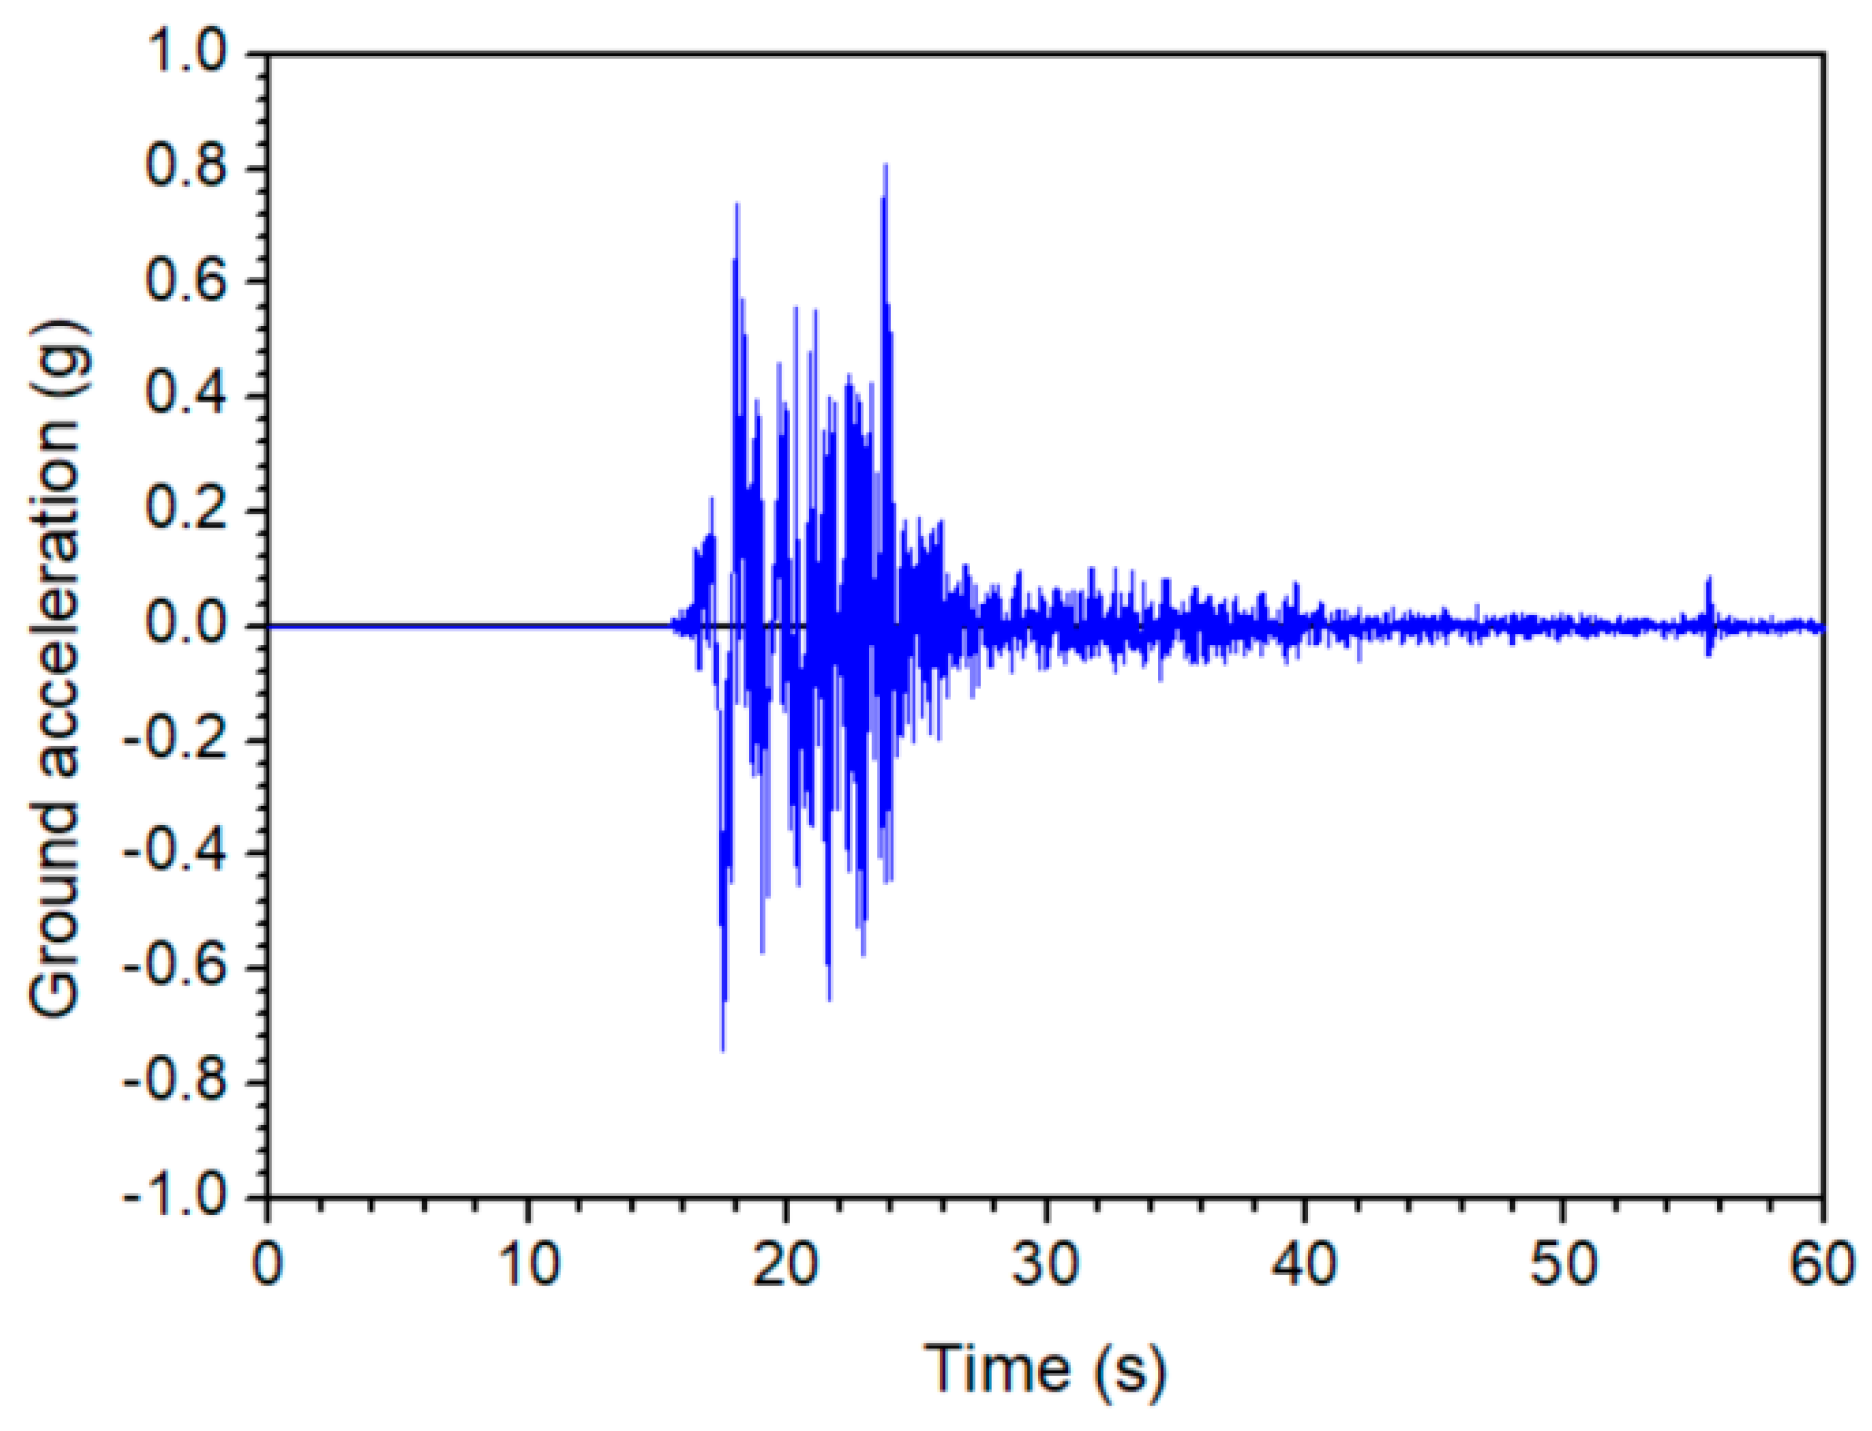
3. Seismic Input
4. Results and Discussion
5. Conclusions
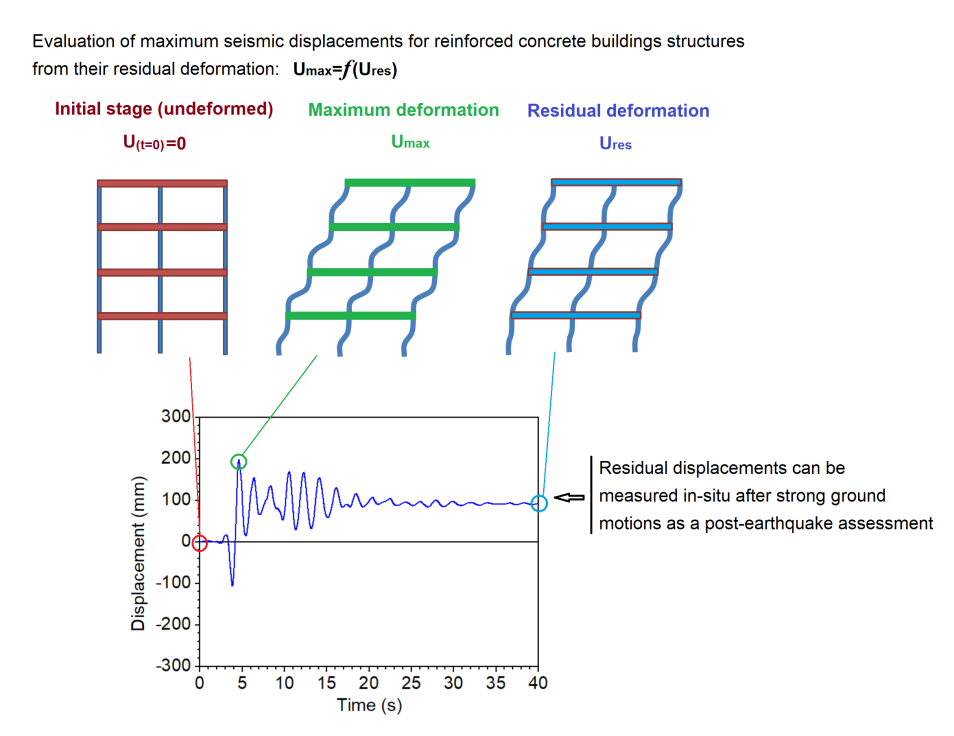
- The maximum seismic deformation of reinforced concrete structures can be successfully assessed using the pertinent residual deformation. The new method proposed herein can be applied for both regular and irregular (with setbacks) reinforced concrete buildings. Additionally, this new approach can be used for both well-designed and under-designed structures.
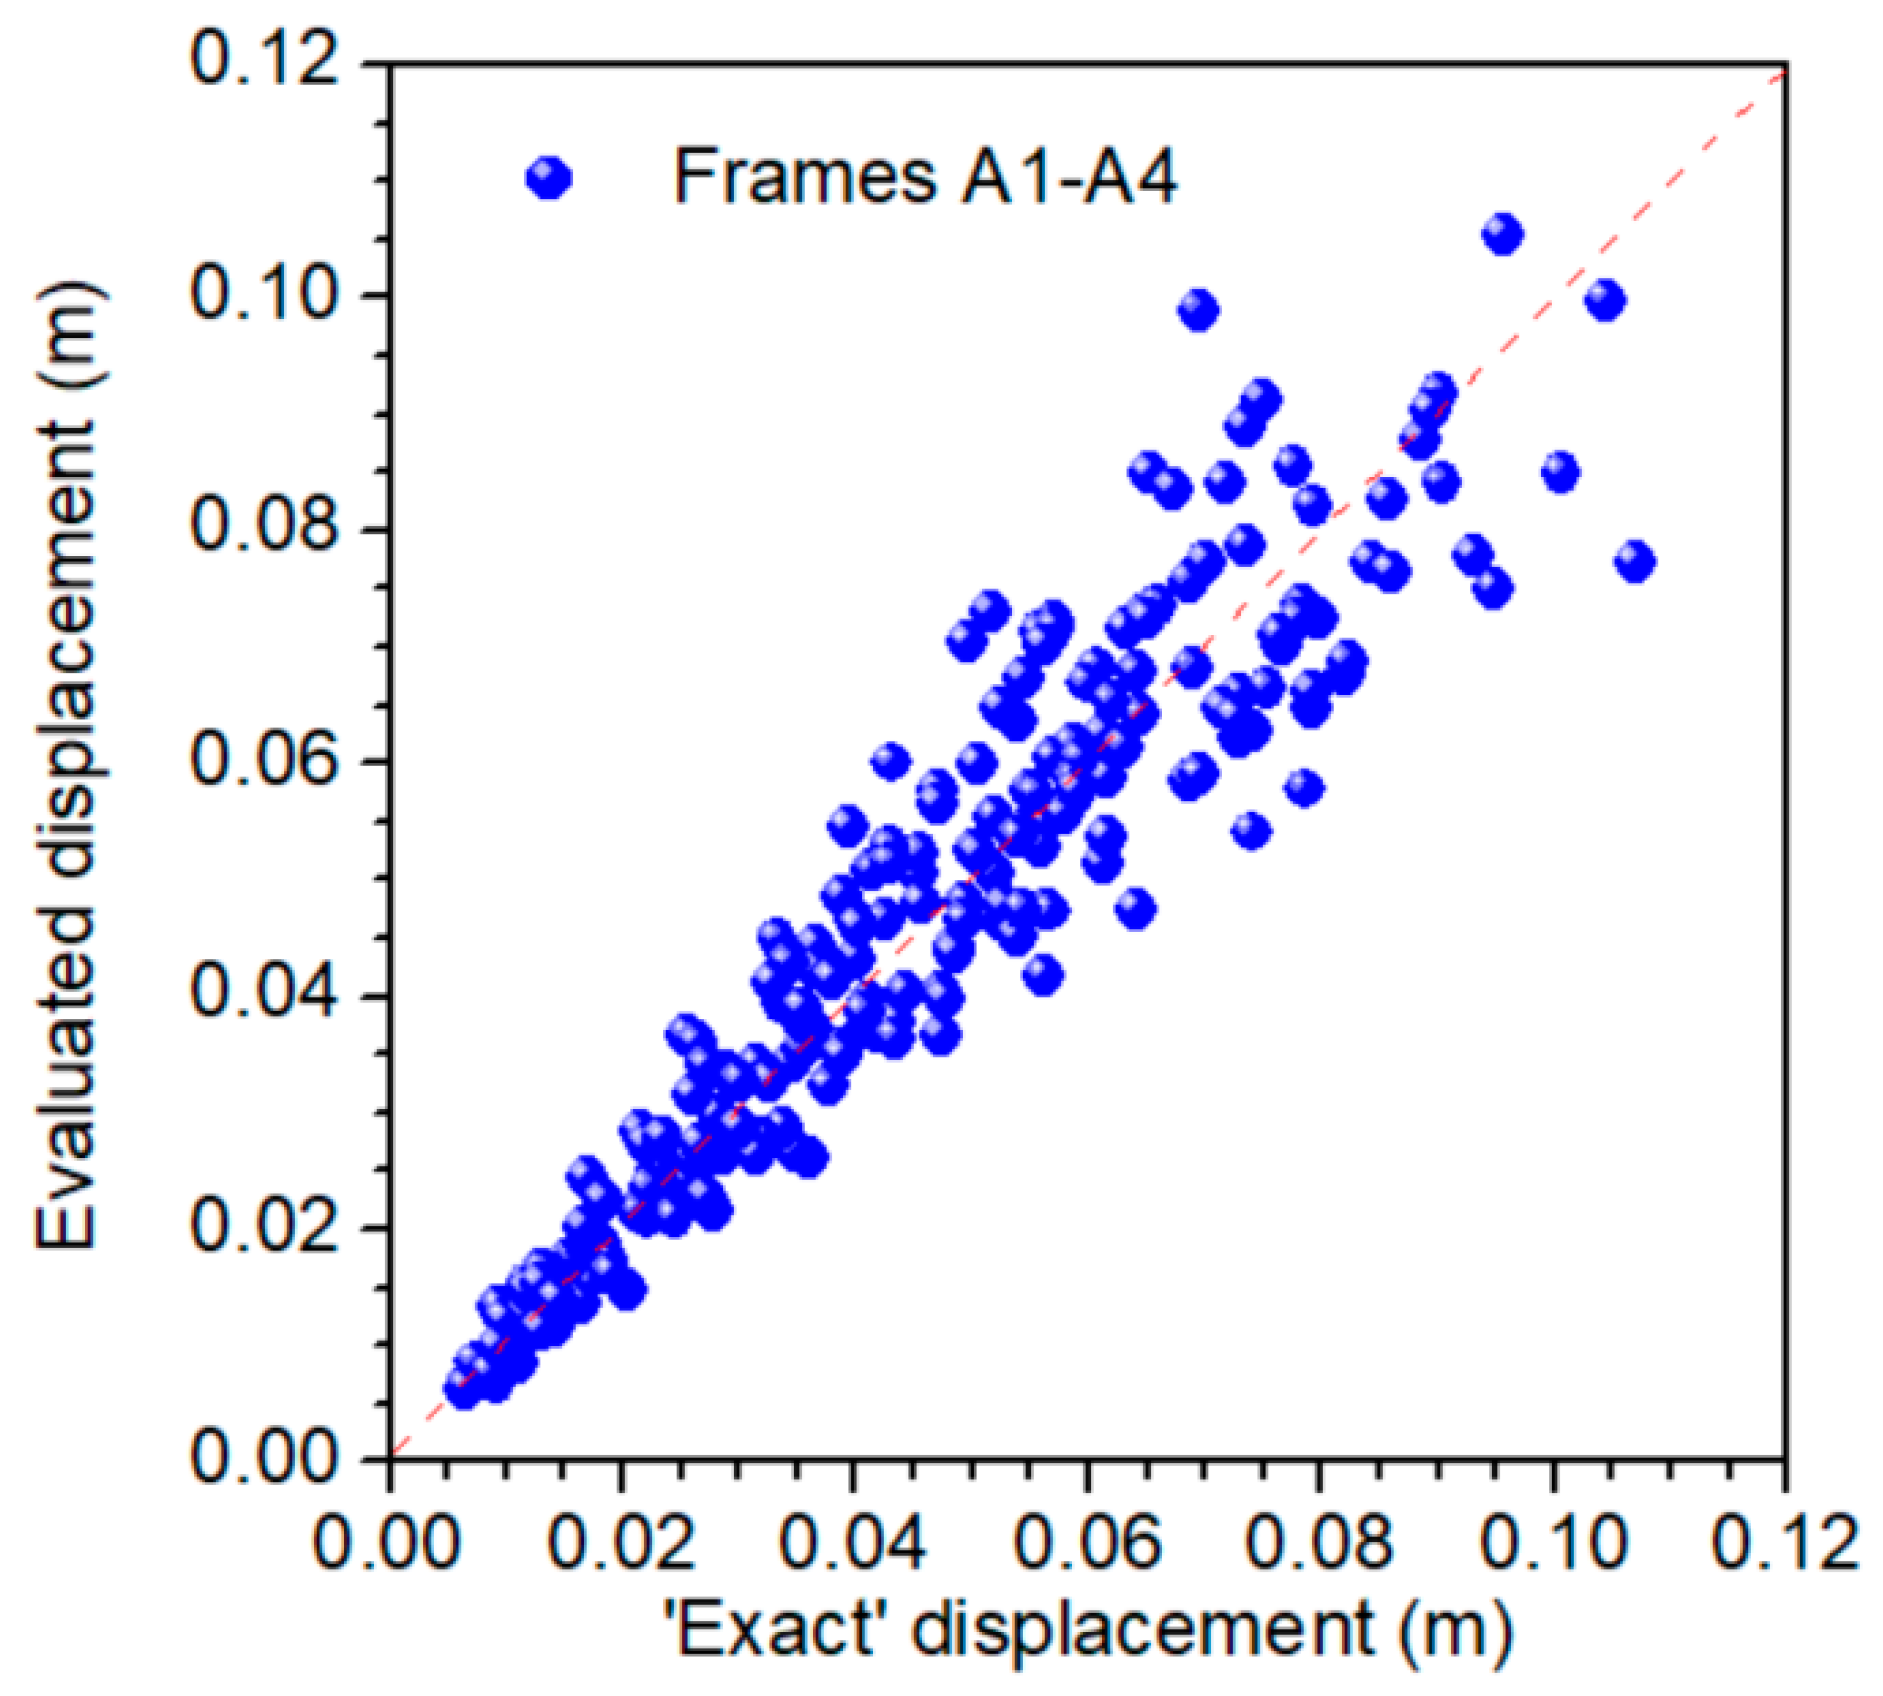
- The correlation coefficient between the ‘exact’ results from dynamic inelastic analyses and those produced by the proposed empirical relation is equal to 95.9% for the case of well-design reinforced concrete structures, and 95.1% for the set of under-designed structures. Therefore, the proposed empirical relation appears to be reliable for a direct and rapid evaluation of the maximum response.
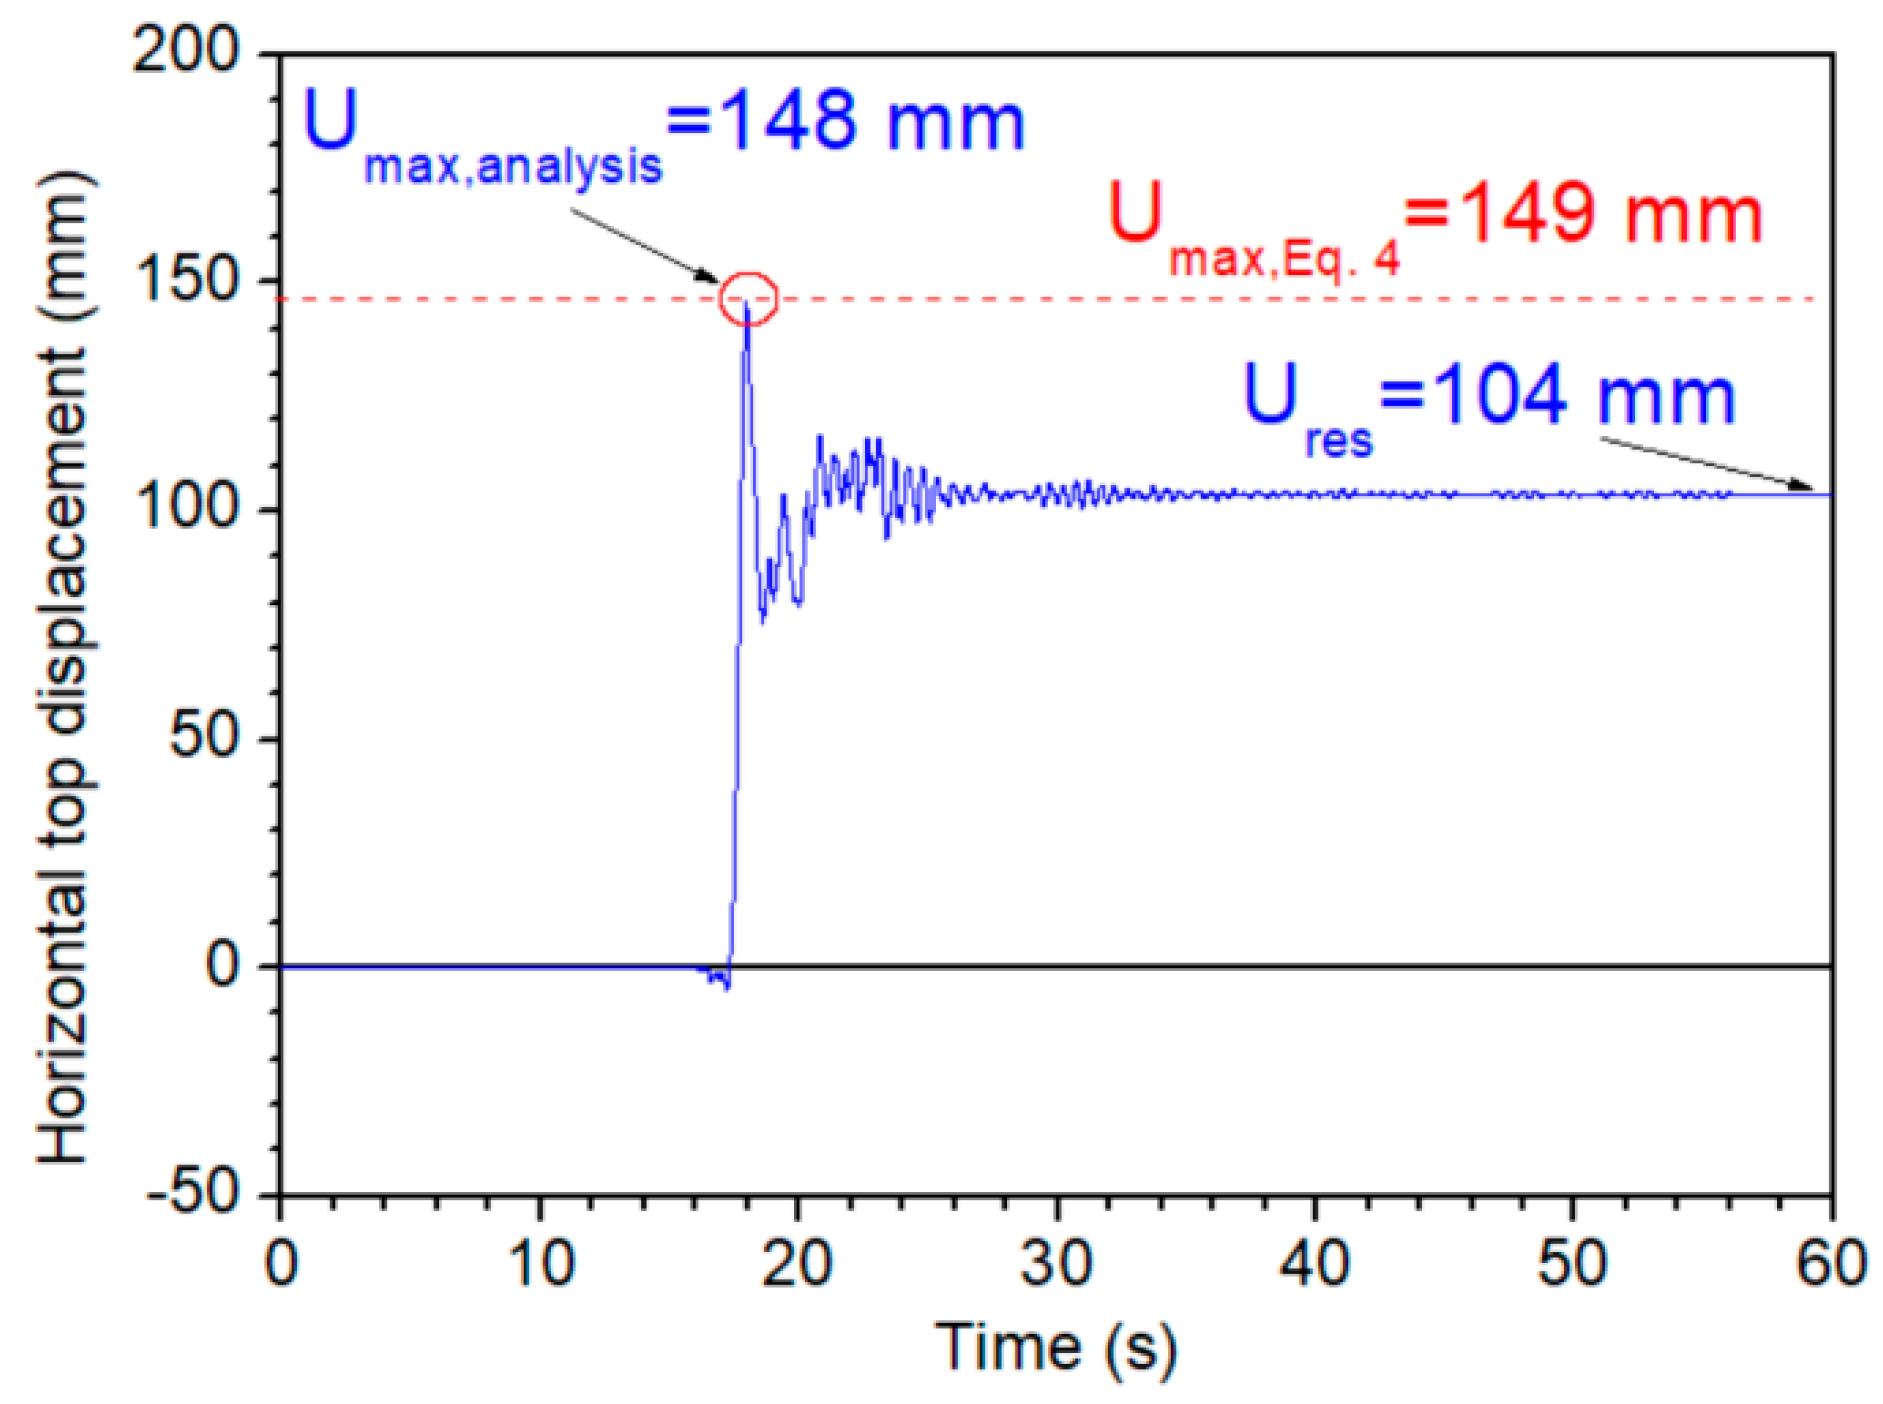
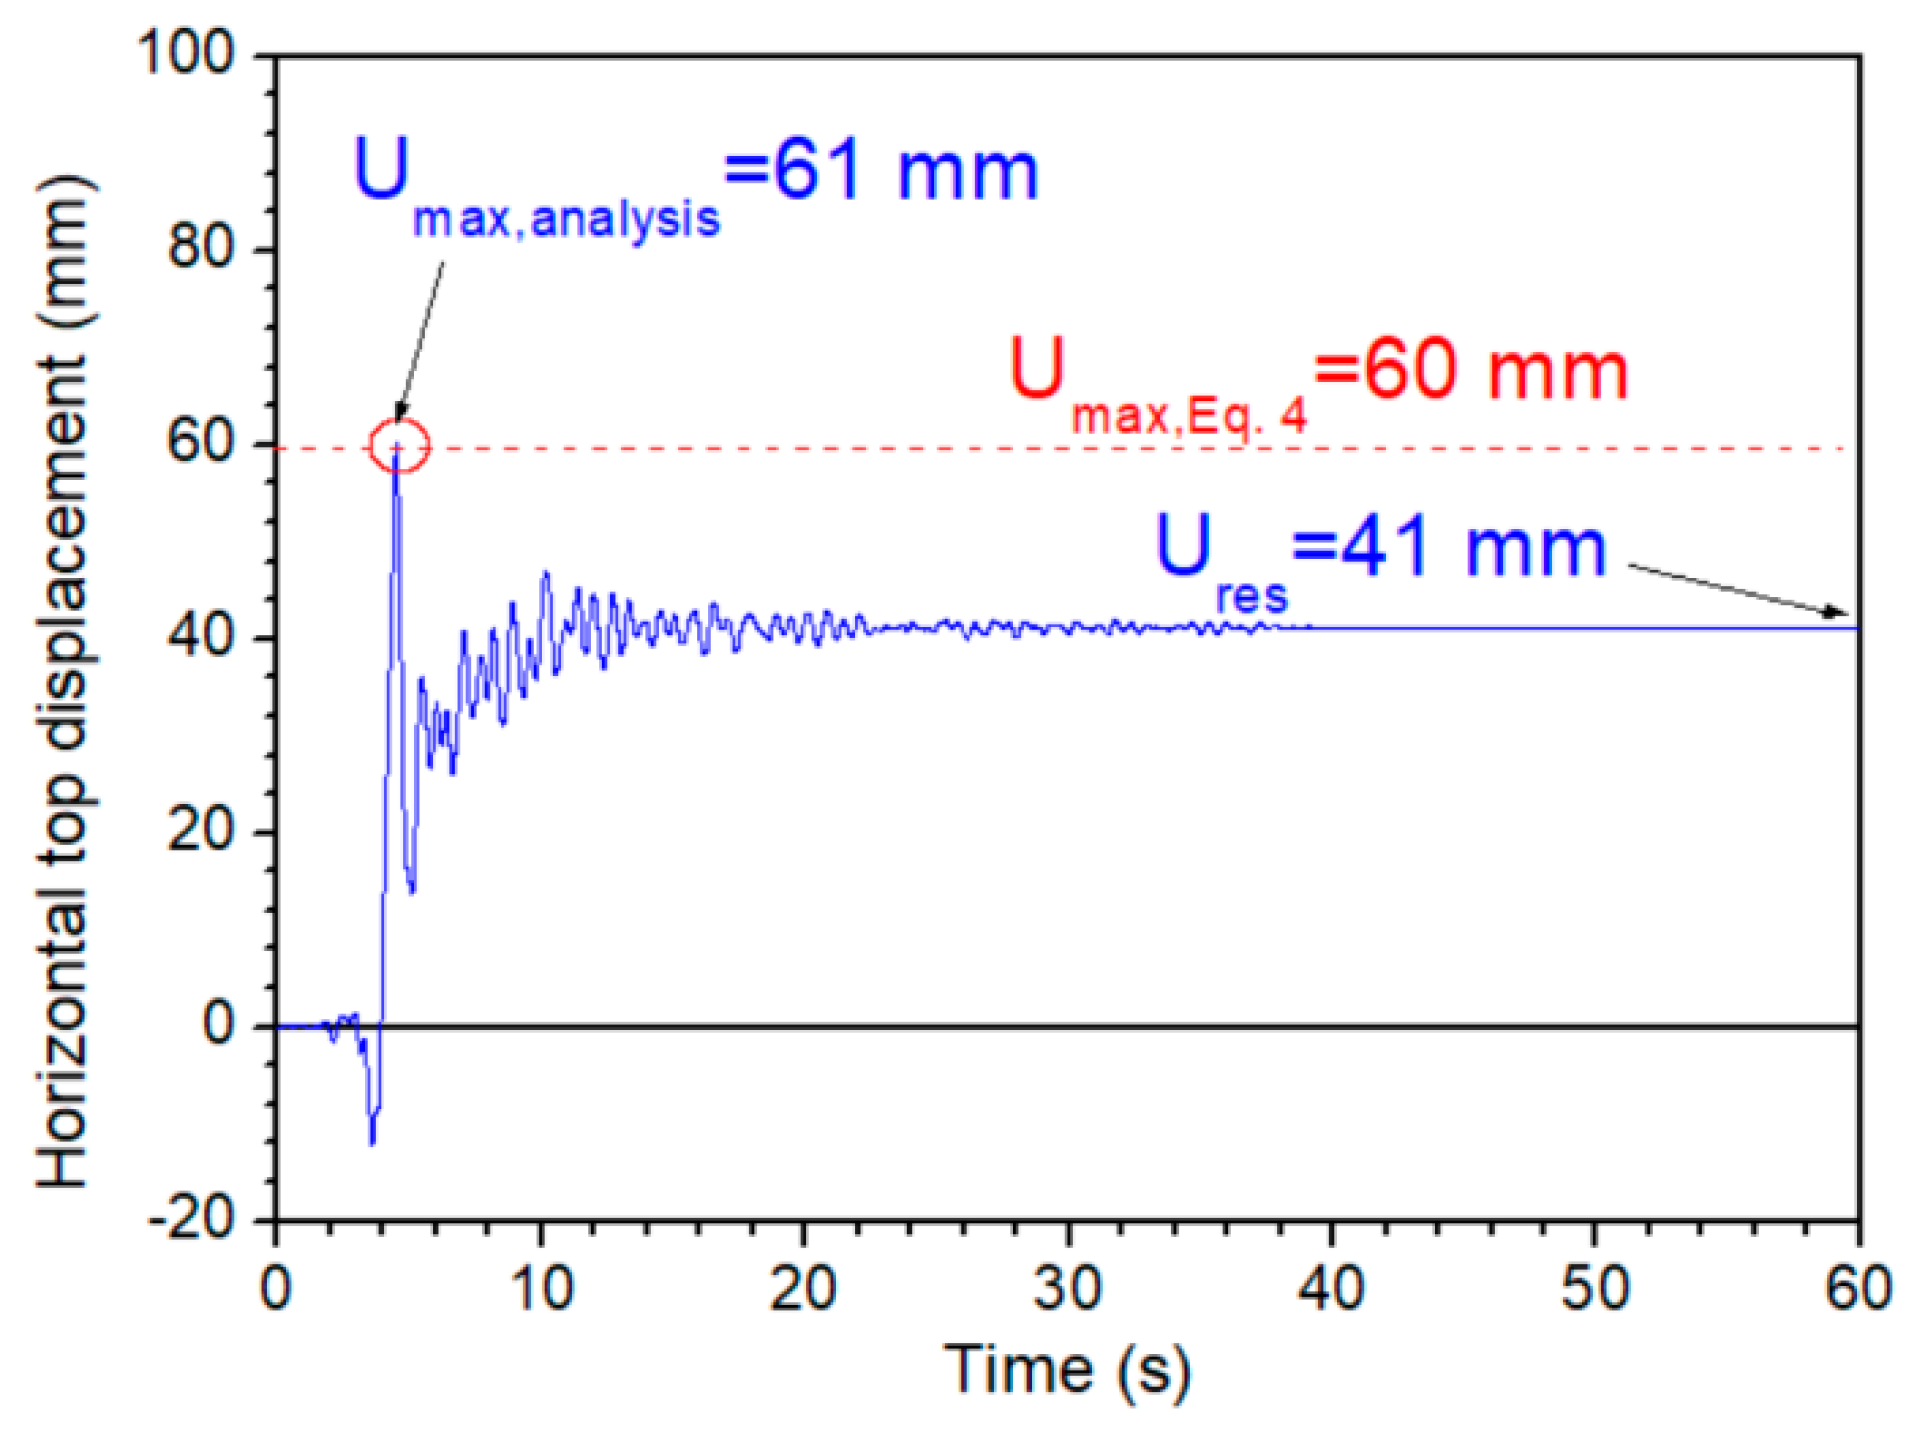
- The effectiveness and the accuracy of the proposed method are additionally confirmed using two verification examples. It is found that the maximum displacements evaluated by the proposed approach are very close to those computed by dynamic inelastic analysis. Thus, the relative error between these methods for the first verification example is 0.68%, and for the second example is equal to 1.64%.
- In order to apply this method in 3-D structures, an extension of the proposed methodology is required in order to also consider deformation due to vertically (torsional) rotations. Furthermore, more analyses are required for reinforced concrete systems with shear walls.
Author Contributions
Funding
Conflicts of Interest
References
- Muho, E.V.; Papagiannopoulos, G.A.; Beskos, D.E. A seismic design method for reinforced concrete moment resisting frames using modal strength reduction factors. Bull. Earthq. Eng. 2019, 17, 337–390. [Google Scholar] [CrossRef]
- Skalomenos, K.A.; Hatzigeorgiou, G.D.; Beskos, D.E. Seismic behavior of composite steel/concrete MRFs: Deformation assessment and behavior factors. Bull. Earthq. Eng. 2015, 13, 3871–3896. [Google Scholar] [CrossRef]
- Faisal, A.; Majid, T.A.; Hatzigeorgiou, G.D. Investigation of story ductility demands of inelastic concrete frames subjected to repeated earthquakes. Soil Dyn. Earthq. Eng. 2013, 44, 42–53. [Google Scholar] [CrossRef]
- Hatzigeorgiou, G.D. Ductility demands control under repeated earthquakes using appropriate force reduction factors. J. Earthq. Tsunami 2010, 4, 231–250. [Google Scholar] [CrossRef]
- Hatzivassiliou, M.; Hatzigeorgiou, G.D. Seismic sequence effects on three-dimensional reinforced concrete buildings. Soil Dyn. Earthq. Eng. 2015, 72, 77–88. [Google Scholar] [CrossRef]
- Yue, J.; Qian, J.; Beskos, D.E. A generalized multi-level seismic damage model for RC framed structures. Soil Dyn. Earthq. Eng. 2016, 80, 25–39. [Google Scholar] [CrossRef]
- Diaz, S.A.; Pujades, L.G.; Barbat, A.H.; Vargas, Y.F.; Hidalgo-Leiva, D.A. Energy damage index based on capacity and response spectra. Eng. Struct. 2017, 152, 424–436. [Google Scholar] [CrossRef]
- Dos Santos, R.C.; Larocca, A.P.; de Araújo Neto, J.O.; Barbosa, A.C.; Oliveira, J.V. Detection of a curved bridge deck vibration using robotic total stations for structural health monitoring. J. Civ. Struct. Health Monitor. 2019, 9, 63–76. [Google Scholar] [CrossRef]
- Li, X.; Huang, G.; Zhang, Q.; Zhao, Q. A new GPS/BDS tropospheric delay resolution approach for monitoring deformation in super high-rise buildings. GPS Solut. 2018, 22, 90. [Google Scholar] [CrossRef]
- Sun, C.; Zhang, X. Real-time subtraction-based calibration methods for deformation measurement using structured light techniques. Appl. Opt. 2019, 58, 7727–7732. [Google Scholar] [CrossRef] [PubMed]
- Bravo-Haro, M.A.; Elghazouli, A.Y. Permanent seismic drifts in steel moment frames. J. Constr. Steel Res. 2018, 148, 589–610. [Google Scholar] [CrossRef]
- Dai, K.; Wang, J.; Li, B.; Hong, H.P. Use of residual drift for post-earthquake damage assessment of RC Buildings. Eng. Struct. 2017, 147, 242–255. [Google Scholar] [CrossRef]
- Gou, H.; Leng, D.; Yang, L.; Jia, H. Modeling the cumulative residual deformation of high-speed railway bridge pier subjected to multiple earthquakes. Earthq. Struct. 2019, 17, 317–327. [Google Scholar]
- Pampanin, S.; Christopoulos, C.; Priestley, M.J. Performance-based seismic response of frame structures including residual deformations part II: Multi-degree of freedom systems. J. Earthq. Eng. 2003, 7, 119–147. [Google Scholar] [CrossRef]
- Mohsenian, V.; Mortezaei, A. New proposed drift limit states for box-type structural systems considering local and global damage indices. Adv. Struct. Eng. 2019, 22, 3352–3366. [Google Scholar] [CrossRef]
- Moehle, J.P. Displacement-based design of RC structures subjected to earthquakes. Earth. Spectra 1992, 8, 403–428. [Google Scholar] [CrossRef]
- Calvi, G.M.; Priestley, M.J.; Kowalsky, M.J. Displacement Based Seismic Design of Structures; IUSS Press: Pavia, Italy, 2007. [Google Scholar]
- Hatzigeorgiou, G.D.; Papagiannopoulos, G.A.; Beskos, D.E. Evaluation of maximum seismic displacements of SDOF systems from their residual deformation. Eng. Struct. 2011, 33, 3422–3431. [Google Scholar] [CrossRef]
- Christidis, A.A.; Dimitroudi, E.G.; Hatzigeorgiou, G.D.; Beskos, D.E. Maximum seismic displacements evaluation of steel frames from their post-earthquake residual deformation. Bull. Earthq. Eng. 2013, 11, 2233–2248. [Google Scholar] [CrossRef]
- Carr, A.J. RUAUMOKO—Inelastic Dynamic Analysis Program; Department of Civil Engineering, University of Canterbury: Christchurch, New Zealand, 2008. [Google Scholar]
- EN 1998 Eurocode 8. Design of Structures for Earthquake Resistance. Part 1: General Rules, Seismic Actions and Rules for Buildings; European Committee for Standardization: Brussels, Belgium, 2005. [Google Scholar]
- EN 1991 Eurocode 1. Actions on Structures, Part 1-1: General Actions- Densities, Self-Weight, Imposed Loads for Buildings; European Committee for Standardization: Brussels, Belgium, 2002. [Google Scholar]
- Hatzigeorgiou, G.D.; Liolios, A.A. Nonlinear behaviour of RC frames under repeated strong ground motions. Soil Dyn. Earthq. Eng. 2010, 30, 1010–1025. [Google Scholar] [CrossRef]
- Chopra, A. Dynamics of Structures: Theory and Applications to Earthquake Engineering, 3rd ed.; Prentice Hall Inc.: New York, NJ, USA, 2006. [Google Scholar]
- Pacific Earthquake Engineering Research Center. PEER Strong Motion Database. Available online: https://ngawest2.berkeley.edu/ (accessed on 13 December 2019).
- ATC - Applied Technology Council. FEMA P-58 Next-Generation Seismic Performance Assessment for Buildings, Volume 1 – Methodology; Federal Emergency Management Agency: Washington, DC, USA, 2012. [Google Scholar]
- Ghobarah, A.; Abou-Elfath, H.; Biddah, A. Response-based damage assessment of structures. Earthq. Eng. Struct. Dyn. 1999, 28, 79–104. [Google Scholar] [CrossRef]


| Date. | Event | Direction | Station | PGA (g) |
|---|---|---|---|---|
| 20/9/1999 | Chi-Chi, Taiwan | N034 | TCU046 | 0.133 |
| 8/7/1986 | N. Palm Springs | NS | 12206 Silent Valley | 0.139 |
| 28/6/1992 | Landers | EW | 21081 Amboy | 0.146 |
| 2/5/1983 | Coalinga | EW | 36227 Parkfield | 0.147 |
| 25/4/1992 | Cape Mendocino | NS | 89509 Eureka | 0.154 |
| 9/2/1971 | San Fernando | N069 | 127 Lake Hughes #9 | 0.157 |
| 4/10/1987 | Whittier Narrows | NS | 24399 Mt Wilson - CIT Station | 0.158 |
| 17/8/1999 | Kocaeli, Turkey | EW | Atakoy | 0.164 |
| 17/1/1994 | Northridge | N005 | 90017 LA - Wonderland Ave | 0.172 |
| 20/9/1999 | Chi-Chi, Taiwan | NS | TAP103 | 0.177 |
| 7/6/1975 | Northern Calif | N150 | 1249 Cape Mendocino, Petrolia | 0.179 |
| 1/10/1987 | Whittier Narrows | NS | 24399 Mt Wilson - CIT Station | 0.186 |
| 15/10/1979 | Imperial Valley | N015 | 6622 Compuertas | 0.186 |
| 9/2/1971 | San Fernando | EW | 135 LA – Hollywood | 0.210 |
| 24/4/1984 | Morgan Hill | NS | 57382 Gilroy Array #4 | 0.224 |
| 17/8/1999 | Kocaeli, Turkey | EW | Gebze | 0.244 |
| 18/10/1989 | Loma Prieta | NS | 1028 Hollister City Hall | 0.247 |
| 17/1/1994 | Northridge | NS | 90019 San Gabriel - E. Gr. Ave. | 0.256 |
| 24/11/1987 | Superstition Hills(B) | NS | 01335 El Centro Imp. Co. Cent | 0.258 |
| 15/10/1979 | Imperial Valley | N012 | 6621 Chihuahua | 0.270 |
| 27/1/1980 | Livermore | EW | 57187 San Ramon | 0.301 |
| 20/9/1999 | Chi-Chi, Taiwan | EW | NST | 0.309 |
| 24/4/1984 | Morgan Hill | EW | 57382 Gilroy Array #4 | 0.348 |
| 26/4/1981 | Westmorland | NS | 5169 Westmorland Fire Sta | 0.368 |
| 17/1/1994 | Northridge | EW | 90057 Canyon Country | 0.410 |
| 18/10/1989 | Loma Prieta | NS | 47379 Gilroy Array #1 | 0.473 |
| 17/1/1994 | Northridge | NS | 90057 Canyon Country | 0.482 |
| 12/11/1999 | Duzce, Turkey | NS | Bolu | 0.728 |
| a1 | a2 | a3 | R2 | |
|---|---|---|---|---|
| Well-designed frames A1–A4 | 0.002124 | −0.000322 | 1.1623 | 0.959 |
| Poor-designed frames B1–B4 | 0.001982 | −0.000283 | 1.1498 | 0.951 |
© 2020 by the authors. Licensee MDPI, Basel, Switzerland. This article is an open access article distributed under the terms and conditions of the Creative Commons Attribution (CC BY) license (http://creativecommons.org/licenses/by/4.0/).
Share and Cite
Konstandakopoulou, F.; Hatzigeorgiou, G.; Evangelinos, K.; Tsalis, T.; Nikolaou, I. A New Method to Evaluate the Post-Earthquake Performance and Safety of Reinforced Concrete Structural Frame Systems. Infrastructures 2020, 5, 16. https://doi.org/10.3390/infrastructures5020016
Konstandakopoulou F, Hatzigeorgiou G, Evangelinos K, Tsalis T, Nikolaou I. A New Method to Evaluate the Post-Earthquake Performance and Safety of Reinforced Concrete Structural Frame Systems. Infrastructures. 2020; 5(2):16. https://doi.org/10.3390/infrastructures5020016
Chicago/Turabian StyleKonstandakopoulou, Foteini, George Hatzigeorgiou, Konstantinos Evangelinos, Thomas Tsalis, and Ioannis Nikolaou. 2020. "A New Method to Evaluate the Post-Earthquake Performance and Safety of Reinforced Concrete Structural Frame Systems" Infrastructures 5, no. 2: 16. https://doi.org/10.3390/infrastructures5020016
APA StyleKonstandakopoulou, F., Hatzigeorgiou, G., Evangelinos, K., Tsalis, T., & Nikolaou, I. (2020). A New Method to Evaluate the Post-Earthquake Performance and Safety of Reinforced Concrete Structural Frame Systems. Infrastructures, 5(2), 16. https://doi.org/10.3390/infrastructures5020016