Abstract
Emergency management services, such as firefighting, rescue teams and ambulances, are all heavily reliant on road networks. However, even for highly industrialised countries such as Germany, and even for large cities, spatial planning tools are lacking for road network interruptions of emergency services. Moreover, dependencies of emergency management expand not only on roads but on many other systemic interrelations, such as blockages of bridges. The first challenge this paper addresses is the development of a novel assessment that captures systemic interrelations of critical services and their dependencies explicitly designed to the needs of the emergency services. This aligns with a second challenge: capturing system nodes and areas around road networks and their geographical interrelation. System nodes, road links and city areas are integrated into a spatial grid of tessellated hexagons (also referred to as tiles) with geographical information systems. The hexagonal grid is designed to provide a simple map visualisation for emergency planners and fire brigades. Travel time planning is then optimised for accessing city areas in need by weighing impaired areas of past events based on operational incidents. The model is developed and tested with official incident data for the city of Cologne, Germany, and will help emergency managers to better device planning of resources based on this novel identification method of critical areas.
1. Introduction
Emergency response services such as rescue services and fire brigades are classified as critical infrastructure (CI) by the German federal ministry of the interior [1].Between the years 2016 and 2017, it is estimated that the rescue services in Germany alone reacted to about 13.9 million incidents [2]. However, the estimation does not include operations solely carried out by the fire brigades or other emergency services than the rescue services. For the recorded incidents, around 16.4 million times a rescue vehicle was deployed. In about 99% of instances, the dispatched vehicle was ground based, while only less than 1% were deployments of helicopters [2]. For the fire brigades, the ratio between the usage of ground- and air-based vehicles might even be higher in Germany, since even the fire brigades of North Rhine-Westphalia (NRW), the largest state in Germany, do not have any airborne vehicles of their own [3].
Ground-based emergency vehicles depend on a functioning road network to reach their destination fast and safely. The operations of emergency services are often time critical, which means it is often of high importance that the emergency units reach their destinations quickly and reliably. Therefore, a reliable road network is a CI of high importance for the functioning of emergency services. However, disruptions of critical network areas may cause major delays, which may reduce the ability of the emergency services to respond timely. This work aims to create a model for the identification of the criticality of the urban road network for the emergency response coverage of cities in a simple, operable way. End-user needs, such as reasonable calculation time, availability of data and applicability to a broad range of hazards and geographical areas, were identified in cooperation with local emergency managers, from the city of Cologne, the cities of Kerpen and Mühlheim and the district of Rhein-Erft-Kreis in a joint research project, KIRMin [4]. The project KIRMin (kirmin.web.th-koeln.de) is a project funded by the German Federal Ministry of Education and Research (BMBF). Its goal was to identify the interdependencies of CI in Germany and develop crisis management guidelines for ensuring the minimum supply of the population during a power failure [5].
This article shows the development and application of such information by providing emergency managers numeric values and hot spot areas displaying the criticality of a tile for the operations. The criticality assessment is conducted by the calculation of the delays in the overall response times of emergency vehicles caused by the blockage of road network areas in the form of tiles. Therefore, the proposed criticality value measures the impact the disruption of a tile has on the accessibility of other tiles. This definition is similar to the definition of criticality used, e.g., by Taylor and Susilawati [6], who state “a network link is critical if loss (or substantial degradation) of that link significantly diminishes the accessibility of the region or particular locations in it, as measured by a standard index of remoteness (or accessibility)” but uses tiles instead of links. For the quantification of network performance parameters such as the robustness, vulnerability or criticality of network elements against small-scale disruptions, one common method is to compare the impact of the disruption of single nodes or links to the undisrupted network [7]. In this article, we propose an adaption of this approach by not only blocking single nodes but entire network areas. Through the blockage of areas instead of single links, the method is expected to be more useful for analysing the criticality of a network with regards to larger disruptions.
Furthermore, the calculation time can be reduced in comparison to a link-based approach since, when larger areas are blocked simultaneously, the calculation time is reduced. In addition, these network areas are weighted with incident data from emergency services. By weighting estimated travel routes with official data from the fire brigades, not the overall robustness but a numeric value of the likely criticality of each for the specific purpose of emergency vehicles is calculated since the weighting estimates the importance of the route for emergency purposes.
To visualise the operating principle and estimate the validity of the results, the method is implemented in a geographic information system (GIS) as an automated model, using the ArcGIS ModelBuilder. The model developed, calculates the impact that the blockage of specific road network areas has on the usual response times of rescue services to the rest of the urban study area. The automated GIS model is further tested in a case study utilising OpenStreetMap road network data [8] and official incident response data of the fire brigades of the city of Cologne. The incident data were provided by the Cologne fire department in the course of the work package III of the KIRMin project.
Within the KIRMin project, Cologne was chosen as a study area for various hazard scenarios, such as floods and earthquakes, and the identification of their impacts on several CI, including the road network. Cologne is Europe’s most flood-prone city with increasing frequent flood events, while also being the fourth most populated city in Germany, as well as the largest city in North Rhine-Westphalia (NRW), with over one million inhabitants. Additionally, Cologne expands to both sides of the river Rhine, and this is utilised as a case study area in this article due to the high annual demand in emergency rescue provision, the high population density on both sides of the Rhine, and the high probability of hazard occurrence, such as floods and earthquakes. Specifically to riverine floods and for Cologne, the impacts and cascading risks to different CI, such as the emergency rescue services, the road network and hospitals are already demonstrated with GIS-based approaches [9,10,11]. In regard to this cascading impacts of floods, in Dierich et al. [4], traffic for the city of Cologne, was identified as a critical impact factor that should be taken into consideration in repairing management for operative emergency management and flood control. Therefore, the identification of hazardous impacts on the road network with its cascading risks associated with delayed or impaired emergency response play a vital role in emergency management and should be of focus in the preparedness phase.
Besides the river flood scenario and its impacts to the emergency response provision, the partnering emergency managers of the project KIRMin also expressed the need for expansion to other scenarios as well and, therefore, earthquakes were chosen as a potentially hazardous event. Cologne is also at risk of earthquakes that will result in direct damages to the road network as well as [12] that can have a snowball effect to the emergency response provision. For all the reasons mentioned above, first-responder organisations, as well as utility operators within the KIRMin project, have underlined the relevance of a method to measure the criticality of urban road network areas for emergency services. Following the identified needs of emergency managers through the KIRMin project, the earthquake is also a relevant hazardous scenario for criticality assessments of the road network for emergency services and timely emergency response provision.
2. Short State of the Art
Respons times (German: Hilfsfrist) of emergency units, such as ambulances or firefighter trucks, is an important criterion for emergency response planning [13,14,15] since, e.g., the probability of successful medical treatment for some critical conditions decreases with the time passed until the start of professional treatment [16] or, in the case of an apartment fire, a successful rescue attempt is only possible within a certain time frame [15]. For fire brigades and ambulances are therefore laws in many of the German states (German: Bundesländer) in place that dictate in which timeframe, starting with receiving the message of the incident, first emergency response units of sufficient qualifications and numbers must arrive at the place of the incident [15,17]. The response time also has an impact on the time these units are unavailable for other emergencies. According to Behrendt and Schmiedel [18] one deciding factor in planning the number of ambulances needed is the ability to adequately react to incidents which occur simultaneously or within a short time frame. This partly depends on the average time an emergency unit is bound with a single incident, which means a higher number of emergency units might have to be held in reserve if the response times decline.
An important part of the response time is the time that takes an emergency vehicle to drive from its current location to the location of the incident [15,19]. This time, which in the following will be referred to as drive time, depends on several factors such as travel distance, road type and traffic [20]. Therefore, the drive times from the nearest fire station to different incidents can differ greatly depending on such factors. Destinations which are easy to reach, measured by some sort of impedance such as, in this case, having a small drive time to the closest fire stations, are referred to as being accessible or having high accessibility, according to the definition of Niemeier [21]. This means the faster an area can theoretically be reached by an emergency unit the higher its accessibility regarding emergency planning. Since response times are very critical, accessibility also plays an important role in emergency planning and research, which can be seen in Borghetti and Malavasi [22] or Novak and Sullivan [23]. Furthermore the calculation of drive times and accessibility is an important part in planning locations of stations for fire brigades [19] and ambulances [24]. An overview of older publications and methods for location planning can be found in Brandeau and Chiu [25] with a more current review of methods for simulating emergency services available in Aboueljinane et al. [13].
Since the accessibility of an area depends on several factors such as the road condition, road type or travel distance, the accessibility of areas can change due to major events such as flooding, earthquakes or construction works. The reason for this is that important roads can become impassable, and the travel speed on other less impacted ones can be severely reduced due to physical damage, blockage, flooding or water streams hindering the travel [26,27]. Research regarding accessibility during a flood event identifying the importance of emergency units still able to access affected areas during disasters is conducted in Coles et al. [28] and Albano et al. [27]. Coles et al. used a flood model for the city of York, England, to determine which water height would likely be on each road in the case of a flood and combined this with calculations for the accessibility. The accessibility is thereby calculated with two different methods, the first one being eight- and ten-minute isochrones, starting at emergency facilities and the other one is driving time calculations for routes to vulnerable locations such as care homes and sheltered accommodation [28]. In Albano et al., damage estimations are combined with the calculation of the flood depth and accessibility [27]. The accessibility is thereby measured by the length of routes from emergency facilities to buildings and structures at risk [27]. Furthermore, the importance of single road segments for the accessibility of buildings at risk is estimated depending on the number of times it is part of the shortest path from an emergency facility to a building at risk [27]. In both articles, the impact of the disaster on the accessibility is measured by comparing the accessibility with and without the influence of the disaster on the road network.
Route calculation is used in the wide field of disaster risk and humanitarian response in applications ranging from disaster risk management activation [29], logistics [30] to accessing people in need [31]. Besides flooding, emergency response accessibility calculations are also conducted for other disasters such as earthquakes, e.g., by Ertugay et al. [26] and Toma-Danila [32]. In Ertugay et al., calculations of road closure probability in the event of an earthquake are combined with accessibility estimations [26]. The accessibility is thereby calculated through two different methods, one being isochrones around health service providers (e.g., hospitals) and shelter sides, and the other being through calculating the travel times to the centroids of the administrative districts of the case study area [26]. In Toma-Danila [32], the probability of road obstruction due to earthquakes was calculated by mapping buildings with a seismic risk class and high probability, and laying buffers around them to determine the areas most likely being affected. Furthermore, the road width was taken into consideration, and bridges were evaluated separately. The accessibility for emergency response units was calculated by laying isochrones around hospitals and fire stations [32].
These approaches have the disadvantage that they do not necessarily allow for an estimation of the overall criticality, robustness or vulnerability of road networks, but focus on specific scenarios, resulting in hazard scenario-based assessments. However, there are several different reasons besides hazard events (e.g., floods and earthquakes) that can lead to the obstruction of network segments such as, major accidents, the collapse of a bridge or a chemical spillage [7], but also less harmful ones, such as street festivals, construction works or demonstrations that can occur at varying parts of the road network.
Additionally, another common practice in network disruption analysis, which does not look at a specific incident, are calculations based on iterative disruption or elimination of single nodes or links. Thereby, critical elements (those which disruption or elimination) which have a severe impact on the network can be identified [33]. These calculations are mostly conducted at a rather small scale, working with single nodes or edges, and are mostly useful for modelling smaller disruptions such as traction hazards due to weather, pavement deterioration or debris on the road [7]. One such method that calculates the robustness of a street network against smaller disruptions by isolating nodes is the Network Robustness Index (NRI) developed by Scott et al. [34]. Thereby, an index value for every node is calculated by comparing the overall travel time within the network in the undisrupted state to the travel time occurring if a single network element is blocked after a disruptive event. As a basis for the calculation of overall travel times, starting and destination points are defined. The traffic flow multiplied by the travel time of the link then determines the cost of the link. The sum of the costs of all network links is the overall cost of the network. For the estimation of the influence of the disruption of one single node, the node is blocked. All traffic is rerouted using a user equilibrium assignment model and with the new traffic flow distribution and, therefore, changed travel times at each link the overall cost of the network, is recalculated. For the consideration of larger disruptions, iterative blockage of spatial areas or tiles is conducted, in contradiction to the single links’ blockage utilised so far. In Jenelius and Mattsson [35] such an approach is shown. As a result of this, a homogenous raster is laid above the street network then single raster cells are iteratively used as blockages, thereby blocking all elements inside.
3. Spatial Assessment and Tessellation Method
For the quantification of the time-based criticality of urban road networks for emergency response purposes, an automated GIS model for ArcMap is created. GIS enable the user to process data with geographic information and visualise the results in interactive maps. They are often used in emergency planning and research, for example by [10,36,37,38,39]. In ArcGIS, as well as some other GIS, automated models can be created via a graphic interface or by directly scripting them in a programming language. A combination of both methods is also possible. Automated GIS models allow users to automate tasks and processes that enable the handling of large quantities of data and complex processes more easily by sequencing GIS tools and using loops to queue input data and iterations. Through such models, a method can furthermore be applied to different regions quickly and easily, given the necessary information available in a matter that can be utilised as input data. For the creation of the model for this method, the Esri ArcMap 10.5 ModelBuilder is used as a programming environment.
The basic principle of the method developed in this article is the iterative blockage of network areas, represented as hexagonal tiles, and the calculation of the estimated effects on the response times of the emergency services throughout the entire road network of the region It is therefore similar to the category of isolating link approaches as described in Sullivan et al. [33] but uses tiles instead of nodes or links, to simulate wider areal effects. The model is furthermore made very specific for emergency services, by only calculating routes from fire stations, using emergency vehicle specific speed information and weighting the response times with cohesive numbers of the yearly rescue operations data. Hereinafter, the components and calculation steps of the model are explained. At the end of the section, an overview of the model structure is provided. The entire model can be seen as a flow chart in Section 3.2 as well as a display in Figure A1, Figure A2, Figure A3, Figure A4, Figure A5, Figure A6, Figure A7 and Figure A8 in the Appendix A.
3.1. Tessellation and Route Calculation
Tiles and tessellation: Since the method is area based instead of link, node, edge or segment based, the study region is divided into equally sized tiles that represent geographic areas. For this division of the urban area, the ArcMap “Tessellation” tool is applied.
The tile size should be determined according to the scenario. For this case study, a tile size of 0.25 km2 was chosen since it seems to keep a reasonable balance between calculation time and the grade of detail necessary for an adequate criticality assessment. This was evaluated by conducting test runs on a smaller scale with different tile sizes, and then comparing the results and calculation times. However, it would be far more useful to be able to define the optimal size of the tiles by some sort of metric depending on the characteristics of the study region, like the density of the road network and the size of the area. Overall, it can be said that smaller tiles lead to a large increase in the calculation time since more routes and iterations have to be calculated, while bigger ones provide less detailed results.
The tiles are the basis of the model since a criticality value, calculated with this method, is always specific for one single tile. The number of tiles in a region determines the number of model iterations that must be done to get the criticality values for the regional areas. A hexagonal grid was chosen because the average Euclidean distance between the geometric centre of the hexagon to any point within the hexagon is slightly smaller than that of a square of the same size [40]. The advantages of this are, in this case, that the inaccuracy that is caused by weighting the centre of the tile with the number of the incident instead of calculating the routes to every incident is most likely smaller when using hexagons instead of squares because the points are closer to each other. An in-depth comparison of the advantages and disadvantages that hexagonal grids have over square based ones can be found e.g., in Birch et al. [40].
Road blockages are used to simulate disruptions of the road network due to disasters or other reasons. To model these, in each iteration one tile is made inaccessible, meaning it is ignored for the calculation of routes for emergency vehicles.
Facilities and destination points: The criticality of the road network in this article depends on the ability of the fire and rescue services to respond to incidents/operations distributed across the entire area of study. Therefore, the emergency facilities, such as the fire stations, are used as starting points for the route calculations. One advantage of the presented model is the combination of network links based on the already introduced hexagonal tiles. Therefore, these geographical areas also represent the destinations for the routing algorithm. To determine the exact destination point of one tile, its geometric centre is firstly calculated, then the closest point located on the surrounding road network is subsequently calculated. In this way, the most central point of a tile, which at the same time lies on the road network and can therefore be reached by emergency vehicles, is defined as the destination point. In 6% of the cases, this leads to inaccessibility of tiles because the chosen segment is not connected to the rest of the network. Since this problem in over 80% occurs in marginal areas of the network this is deemed acceptable. The problem is further discussed in Section 6 of this paper.
Route calculation: A route represents the fastest way from a facility to a destination point alongside a road network. The network itself consists of edges that represent the road segments. In these edges, the information, such as “how long it can potentially take to get from one end of the segment to another and which other segments are accessible from a certain one”, is stored. The routes and corresponding response times are calculated in the model, using the Closest Facility method of the Network Analyst tool of ArcMap. The Closest Facility method allows for an estimation of the travel times from a chosen number of fire stations to the destination point in each tile. In this article, only the next two nearest fire stations are taken into account for the calculations, since it was deemed implausible that in a significant number of incidents, an emergency response unit from further away would have to necessarily be at the incident within a short timeframe. Nevertheless, it was regarded as plausible, that for some incidents it might be necessary, that a higher number of vehicles is needed in a timely manner.
If the conditions of the road network change, in the suggested model this happens each iteration because a different tile is blocked, the routes must be recalculated. Therefore, all route calculations are redone each iteration of the model. Additionally, the number of route calculations that have to be conducted during each iteration is also proportional to the number of reachable tiles times the number of possible starting facilities. The impact is demonstrated in Table 1.

Table 1.
Impact of the number of tiles and facilities on the number of iterations and route calculations.
Detour calculation: In order to determine the time it would probably take for an emergency unit to reach a specific tile, the route between a fire station (facility of emergency response) and the centre of the tile (destination) is calculated. This travel time increases if an area blockage occurs in the road network in such a way that the fastest route between the two points (facility and destination) is no longer passable and a detour must therefore be taken to reach the destination (see Figure 1). However, not every blockage leads to the same increase in travel time. Based on the location and affected roads, it has a specific impact on the travel time of the vehicles. The blockage of some tiles may therefore lead to a higher increase in travel time than the blockage of others; that means every area has its specific delay value for a specific route (see Figure 2). This also means that the blocked road networks grouped in these city tiles are of greater importance for the emergency rescue provision.
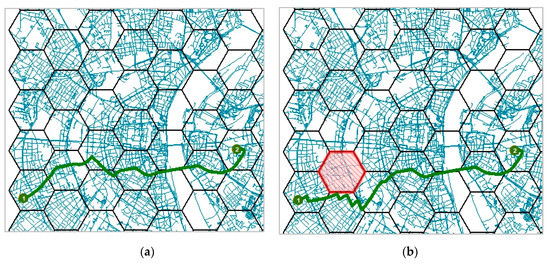
Figure 1.
Route without blockage: Response time 8.6 min (a) and Route blocked with lower impact: Response time 9.3 min (b) (Legend: green = route; grey = road network, red = blocked tile).
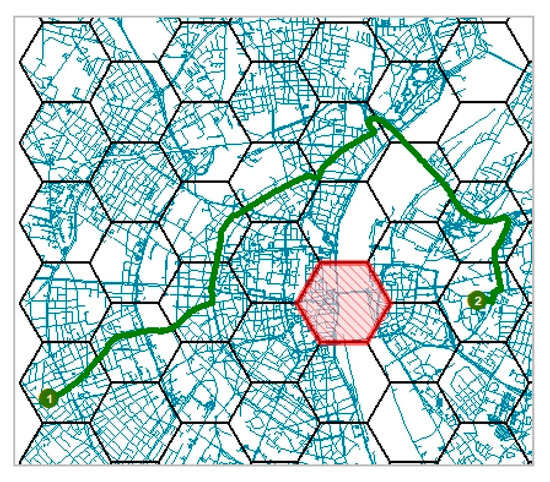
Figure 2.
Route blocked with higher impact: Response time 11.8 min (Legend: green = route; grey = road network, red = blocked tile).
To determine the increase in travel time that is caused by the blockage of a certain tile, the fastest routes from a determined number of emergency facilities (in the case study 2 fire stations) for the centre of each tile are calculated (see Figure 3). The centre is a compromise due to the duration of the calculation process of the computer, however, calculations of minimum and maximum distances within a hexagon would improve the overall accuracy.
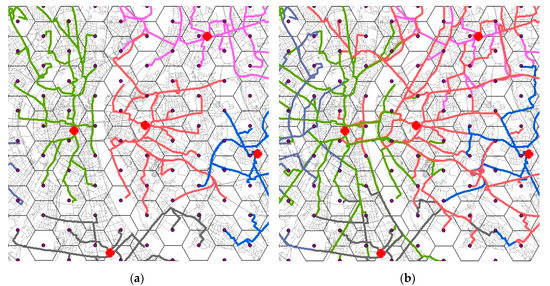
Figure 3.
(a): Closest Facility calculation with one facility per tile. (b): Same setting with two facilities per tile. (Legend: Red = Facilities; Grey = Road network; Colour = Calculated routes).
Since some routes might be influenced by the blockage of a certain tile, the calculation of the fastest route must be conducted in an iterative way. Each iteration step includes the blockage of a single tile and the calculation of all routes under the condition that this tile is blocked. The overall impact on all routes can be calculated by adding up the travel times of all routes, thereby calculating the unweighted overall travel time (UOTn). The UOT is always specific to a condition, like the blockage of a single tile or no blockages at all.
where = Unweighted overall travel time under the condition tile B is blocked = Calculated travel time for the routes to centroid a under the condition that tile B is blocked.
If the blockage of a tile causes a large increase in the overall travel time, compared to the overall travel time if no tile is blocked, this means either a large number of routes must be rerouted, or some routes now take significantly longer. However, since not every route is of equal importance, the unweighted overall travel time is not enough to describe the specific criticality of a tile. The UOT value is, therefore, not used in the model. Instead, a weighted overall travel time is calculated.
3.2. Route Weighting
While the blockage of a specific tile might impact the accessibility of certain areas, that does not automatically mean that this tile is highly critical for the emergency services. If this tile is located in a place that seldom has to be crossed by emergency services, the overall effect of its blockage can be quite small. On the other hand, the blockage of a tile with its grouped roads that are probably used often to reach lots of destinations might be more problematic, even if their blockage only causes a minor delay for every single route. To take this into account, the frequency of road use is taken into consideration by weighting every route followed with the number (sum) of incidents that happened in the destination tile. This information is added into the calculation by adding the incidents as point features to the map and doing a spatial join with the point features onto the tiles. Thereby, the tiles get the information of how many incidents happened within that tile and give this information over to the route calculation. The criticality of a tile is, therefore, based on the frequency with which it would likely be crossed by emergency vehicles to reach their destination and the specific delay its blockage would cause to each route. To incorporate the frequency of use and the potential delays into the calculations, the routes are weighted with official incident data (in the form of deployments) from recent years, particularly from the years 2017 and 2018, provided from the fire department of Cologne (see Figure 4). This is done by summarising the number of vehicle deployments for the incidents which happened within a tile separately for each tile. This number is then used as a weighting factor, which means if, for example, an emergency vehicle was deployed for incidents 200 times in tile x, the response time for routes that lead to tile x would be multiplied by 200.
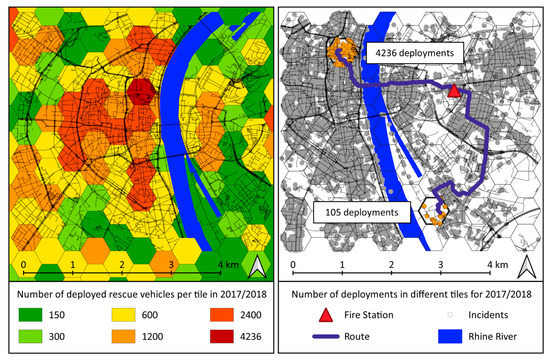
Figure 4.
On the left: Number of deployed rescue vehicles; On the right: Presentation of deployment data.
With the weighting factors and the route calculations under the conditions of the blockage of different tiles, the weighted overall travel time can be calculated. The value of the weighted overall travel time under the condition of the blockage of a certain tile is used as a measurement for the specific criticality of this tile.
where CB = Specific criticality value of tile B.; R(a,B) = Calculated travel time for the routes to centroid a under the condition that tile B is blocked; Wa = Weighting Factor for the destination of the route a.
One problem of the tile blockage is that the blocked tile is not accessible. This would lead to the CB value being calculated without a response time for the blocked tile itself. Therefore, the value of CB could become smaller as the unblocked overall response time, if tile B is a tile with a high weight. To compensate for this error, the response time (likewise from two fire stations) to the blocked tile itself (without blockage) is added to CB.
It sometimes occurs that tiles that are in the surrounding of the blocking tile are cut off from the rest of the road network by the blockage and are, therefore, no longer accessible. This also leads to the fact that the routes that are no longer reachable would be missing in the calculation. To compensate for this, the travel time to the isolated tiles is calculated as if there would be no blockage and added to CB. Therefore, the isolated tiles and the blocked tile itself do not influence the criticality value.
Both model adaptations lead to the extended formula with the addition of the compensation calculation. Additionally, the overall travel time without any blockages is subtracted, so that the criticality value only shows the difference the blockage makes.
where CB = Specific criticality value of tile B.; = Calculated travel time for the routes to centroid a under the condition that tile B is blocked; WB = Weighting Factor for the destination of route B; = Calculated travel time for the routes to centroid a without blockage; Tnr = Tiles not reachable n = all Tiles. = Calculated travel time for the routes to centroid a under the condition that no tile is blocked.
However, the finding that the blockage of certain tiles leads to other tiles becoming inaccessible might be important for emergency planners. That is why we introduced a second value that consists of the number of tiles that are no longer accessible, if a certain tile is blocked (see the results in Section 4).
3.3. Model Structure
In this section, and after the earlier outlined presentation of the model’s calculation methodology, the overall structure of the model in the GIS environment is explained. A graphical display of the model, built with the ArcGIS ModelBuilder, is further presented in Figure 5. Detailed Information of the arrangement in the ArcGIS ModelBuilder can be found in the Figure A2, Figure A3, Figure A4, Figure A5, Figure A6, Figure A7 and Figure A8 in the Appendix A.
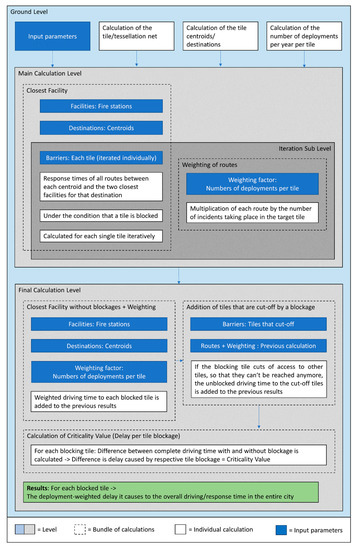
Figure 5.
Model Conception of calculation steps.
The Ground Level (light blue) represents the basic platform for further model construction. Here, the input parameters are added to the model and further parameters are calculated from the resulting data. In the Main Calculation Level (light grey) [ most of the calculation effort takes place. At this level, the network dataset layer is built, and the fire brigade locations are set as facilities serving as origins for further network analysis. As incidents, the centroids of each tile are assigned. For the improvement of the processing capacity, the iteration of blockages is shifted to its sub level, the Iteration Sub Level (dark grey). This prevents the network dataset layer from being rebuilt for each blockage iteration. The previous processes of the two levels are processed in combination with the Closest Facility Algorithm. During the blockage iteration, the weighting of the tiles takes place by assigning the number of deployments per year and tile. Thus, the number of routes that are followed between the fire brigade locations and the destination centroids is determined. In the Final Calculation Level (light grey) [)] the travel times of the compensation calculation, i.e., without blockages, are calculated and the number of routes is calculated analogously to the number of deployments. For the result, the response times of routes that took place under the condition of the blockage of the same tile, as well as the missing response to that blocked tile compensation calculation, are summed up. Afterwards the number of tiles, that are completely cut off by each blockage is determined, and the unblocked drive time to these tiles is added to compensate for this problem. At last, the overall travel time without any blockades is subtracted from the calculated travel times with blocked tiles [.
4. Road Network Criticality Assessment for Cologne, Germany; Data Used and Model Adaptation
Since the fire department of Cologne was one of the project partners in the KIRMin project, incident data of the fire brigades and rescue services were available for the city of Cologne. Mainly, for this reason, the urban district (German: kreisfreie Stadt) of Cologne was chosen as a case study region. Cologne is the 4th largest German city with over 1 million inhabitants [41], a total area of 404.89 km2 [41,42], as well as a road network with a length of 2865 km [41]. The fire and ambulance services were responding to over 250,000 calls in 2018 [43]. For the usage of the model, some input data are required this includes a digital road network, the location of the facilities, driving speeds for the emergency vehicles on different road classes and the locations of the incidents (see Table 2).

Table 2.
Input data for model construction and calculation.
For the purpose of the case study, freely available OSM (Open Street Map) road data is used [8]. The quality of OSM data differs depending on the region [44], but for developed regions, such as western Germany, it is comparable to many commercial providers [45]. However, the network still had to be improved so to be routable for the implementation of the model suggested in this article. In OSM road networks, some of the intersections between roads are missing, that leads to two links crossing each other without being connected in the intersection point. To create these missing intersections, the road network was firstly separated according to height layers, to distinguish underpasses and bridges from roads. Afterwards, each layer was planarized and, subsequently, all layers were set back together whereby the missing intersections were created when links still crossed each other on the same level. Another common problem occurring within OSM data are roundabouts that display the wrong direction of travel. Since emergency vehicles underlay the special rights of way privileges and because of the low impact of this inaccuracy to the network analyses conducted, no further steps were taken towards correcting roundabout directions. For the same reason, all driving direction restrictions were ignored.
Furthermore, for travel time calculations a speed parameter is needed for the different road types. For this, the driving speeds for specific road types, used by the fire department of Cologne, were adopted for the classification of the road types in the OSM road network layer and inserted in its database (see Table 3). These driving speeds have been statistically calculated from time measurements of emergency vehicles under real operation conditions.

Table 3.
Driving speeds for planning purposes of the fire department of Cologne 2017.
The road-type dependent speeds are fundamental for the calculations of the travel time of every road segment, which is calculated with the following formula:
where = Specific travel time of segment n, = length of the segment n, = average travel speed for the road class of segment n.
After improving the road network database with additional driving speeds, a crossing time is calculated for each link inside the dataset, with the division of the length of the link by the attributed driving speed. It is then transformed into a Network dataset for the usage in the ArcGIS Network Analyst tool for route calculations. The network dataset was configured so to utilise the crossing times as an impedance (i.e., travel costs) into the travel configuration of the network analyses and to allow global turns. The Closest Facility method further utilised for route calculations, in minutes, allowed for further travel configurations for emergency response purposes. For example, in the suggested model the direction of travel from the origin (i.e., facility—fire station) to the destination (i.e., incident-tile), it is specified for each tile is set to be accessed from two fire stations for reasons explained in Section 3.1 in the passage route calculation.
Furthermore, it is stated that one-way driving restrictions do not apply in this scenario, since the blockage of a 0.25 km2 tile indicates a major scenario and also the emergency vehicles underlay the special rights of way privileges. Step-by-step explanations on how to do routing calculation and how to work with network dataset in ArcGIS can be found on the homepage of ArcMap or under the link https://desktop.arcgis.com/en/arcmap/latest/extensions/network-analyst/a-quick-tour-of-network-analyst.htm.
Only facilities (origin points of the network analyses) used by the full-time professional firefighters were taken into consideration. The fire stations that are solely used by voluntary firefighters were excluded because the responses of the voluntary fire departments only make up about 1% (one percent) of all deployments conducted over the whole year. Since it would require a much higher computing effort to calculate the response time of all deployed vehicles to each individual operation, the centroids of the hexagon tiles are used as incidents, thus, destinations for the routing and response time calculations. To compensate this aggregation of data, a weighting of the incident/destination points is conducted. The data for weighting the destination points were provided by the Fire Department of Cologne and contained the coordinates of every single rescue operation (i.e., incident) that the fire and ambulance services responded to. With this input data, the model was run for the case study region of Cologne. The calculation took around 92 h on a PC with an Intel Xeon E5 processor with 32GB RAM. However, it should be possible to further reduce the calculation time, e.g., by optimising the method for multithreading and multiprocessing.
5. Result for the Case Study of Cologne
The result of the criticality analysis is presented in the form of a table. The table contains the incident weighted total driving time required to reach all other tiles from two fire stations under the condition that the respective tile is blocked. For the case study of Cologne this results in overall driving times between 30,643.5 (blockage has no effect) and 32,495 h (blockage has strong effects) if the fire station tiles are excluded. The actual criticality values are indicated by the difference between the two values and therefore lie between 0 and 1851.5 h. This represents a maximum delay of 6.04% based on the no-blockage value. The mean delay value with 22.3 h is significantly smaller and equals a share of 0.07%. In addition to these results, it is also shown how in many cases, the blocking tile completely cuts access to another tile, so that this can no longer be reached by emergency responders. This problem occurs in 19% of the blockages, whereby in 60% of this case only one and in 18% only two tiles are blocked. In the above-mentioned results, however, this is inaccuracy is already compensated (see Section 3.2). This information enables a detailed, individual statement about the effect that the blockage of an individual tile will have on the response time within the entire city.
The result can be illustrated in different ways. One possibility is the combination of the tile, facility and road network data, which leads to a map represented in Figure 6. The total driving time result is displayed on a tile basis with green to red colour values (green = low, red = high). If a tile is preventing access to other tiles, this is shown through white to black dots in the respective tile (white = impact on few tiles, black = impact on many tiles, see Figure 6). This map allows distinguishes the relationship between the results of the analysis and the road network. It is an example of the visualised information that could be handed to city planners, disaster management and authorities of the respective city. It also displays the tiles on which the fire and rescue stations are located. Understandably, a blockage of these tiles results in the highest impact because the surrounding areas would have to be covered by more distant stations, so these tiles are declared the most critical. Besides these, the tiles with the highest criticality are mostly located near fire and rescue stations or include important highways and highly used intersections (Figure 7). Tiles with low criticality are more often located in the peripheral areas and less heavily built-up suburban areas. The same applies to the number of tiles to which access is prevented by a blockage. Tiles which block access to a higher number of other tiles mostly lie at the outer area of the study area.
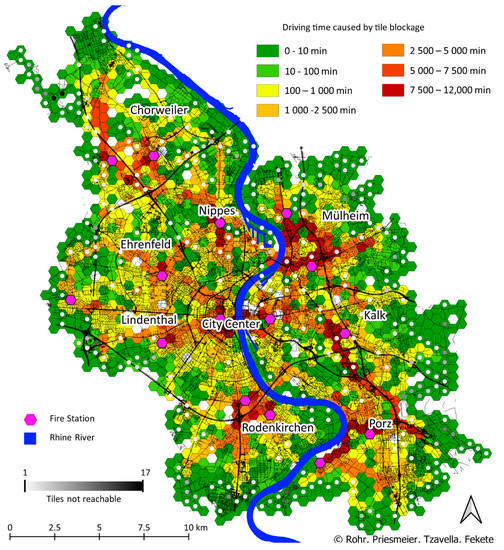
Figure 6.
Result of the road network criticality assessment of Cologne (Legend: Green to red = Rising criticality value; violet = fire stations; white to black dots = Rising number of generated “non-reachable” tiles (1–17); black = road network).
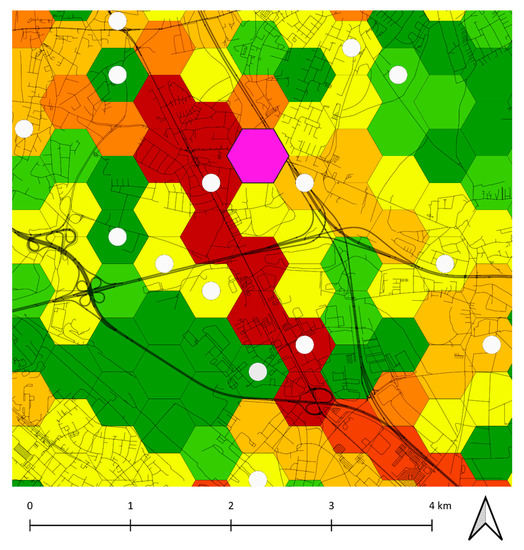
Figure 7.
Part of the criticality analysis of Colognes district Kalk.
6. Discussion
While routing algorithms are known to be improved by hexagonal mesh networks in theory [46], few papers on tessellation-based routing seem to relate to the field of disaster risk or emergency management [47]. Moreover, almost all of them are very technical and and seldom applied a geographic case study that fitted to the needs of emergency managers. Nevertheless, it is highly important, we found in collaboration with emergency managers, to take up their needs and also, to keep a sharp eye on the final results making common sense and being plausible to the users. The areas estimated by the model to be more critical are plausible as they often include one or more likely critical segments such as bridges or motorway links, or they are located in ways which are probably used most often to get from the nearest fire station to highly populated areas. However, instead of assuming the importance of these areas because of such characteristics, the method suggested in this article provides numeric values that indicate the level of criticality of a tile by comparing the time it would take to reach every tile from its two nearest fire stations without blockage to the time it would take if the tile was completely blocked, multiplied by the number of incidences taking place at the respective hexagonal area (weighting factor). This makes the criticality of the tiles quantitatively comparable and results in some surprises. The resulting map (Figure 6) shows, for example that some crossroads are by this measurement more critical than, many of the bridges, while some motorways seem to be highly uncritical. By taking a closer look, those results are easily explained since these motorways can be bypassed easily and, in many cases, it is not necessary for the rescue services to cross the river since there are other fire stations on the other side nearby. Since official data of the fire brigades is used, the criticality values are very specific for the emergency services. Another explanation is that the model does not include traffic density. It is expected that further inclusion of traffic density values could increase the criticality of bridges because the blockage of one bridge leads to a steep increase in traffic on the other bridges, which then is probably more difficult to bypass.
A known problem of the method of removing links completely, however, is that it can create isolated subnetworks (see Figure 8) which are not reachable by positions from within other (sub-)networks or the main network [7]. This makes the interpretation of the results for areas which incorporate the single access way to other areas more difficult because the criticality cannot be simply quantified by the same criteria, being the overall weighted drivetime delay, since the drive time cannot be calculated if an area is unreachable. Unfortunately, this is the case for many tiles in the test area (318 out of 1662 (fire stations excluded), with 60% preventing accessibility to one other tile, 18% to two other tiles and only 12% preventing access to more than two other tiles), especially for those at the edge of the maps. So, to minimise the error in the overall driving time calculation resulting from this problem, for every tile which is not reachable and therefore not implemented in the driving time calculation, the incident weighted driving time to the tile without a blockade is added to the driving time summary. In the results map (Figure 6) our own metric is used for those areas. It displays the number of tiles which become unreachable by the blocking tile. Another approach could be to display the number of non-reachable incidents instead of non-reachable tiles per blocking tile. Nevertheless, this would further complicate the calculation and would hide the number of unreachable tiles.
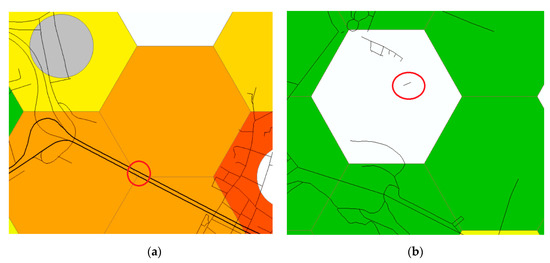
Figure 8.
(a): A nearly empty tile gets a rather high criticality value, because it cuts an important segment. (b): A tile is considered unreachable, because the segment closest to the centre of the tile belongs to an isolated subnet.
It is suggested in Sullivan et al. [7] that a common way to deal with the problem of creating subnetworks by completely blocking links, or in this case areas, is to instead give them a capacity reduction of 99%. In this case a similar approach could be taken by reducing the travel speed by 99% percent. But that approach would have the disadvantages, that the information, that a specific tile is the only access point to one or several areas is not obvious in the results anymore. It might, however, be an interesting approach for a modification of the method shown in this paper, to not fully block tiles but rather give them a delay factor, depending on the scenario. It is thereby simulating a partial blockage in contrast to a total blockage. This would be a minor change to the model, which could be easily implemented, but it might be difficult to determine a realistic delay factor.
Most disruption models in the disruption analysis of networks are using approaches which focus on the disruption of single links or nodes [33]. The usage of areas or tiles instead of single segments has some advantages as well as some disadvantages. Depending on the size of the tiles, one advantage is a faster calculation time, since there are fewer iterations needed because one tile can include several segments. On the other hand, this has the disadvantage that the information from the results becomes less detailed and it might often be the case that only a few segments within the tile are critical, while others are barely used by the emergency services and therefore of little importance (Figure 8). For a relatively dense road network, however, it might be questionable to use a segment approach, since most segments are rather short and there are often many possibilities to bypass them quickly and easily. In a disaster scenario, it is furthermore unlikely that only a small segment is blocked. Therefore, the blockage of a larger tile might be more useful to simulating an aerial effect, since it is closer to simulate a simultaneous disruption of segments lying close to each other.
However, this approach, as it is currently used in the model, has some restrictions as well. For example, the borders of the hexagonal areas are defined by strict lines and hence, a hard cut between passable and impassable terrain is set. Currently, these borders are placed so that the entire area is divided into hexagonal areas of identical size. Therefore, the borders of the tiles are placed semi-randomly, which leads to some questionable borders. For example, a tile can be assigned a high criticality value, because it incorporates a rather small part of a very critical segment, while most of its grouped roads are mainly uncritical. It is also questionable if, in the case of an accident, the exact grouped road segments within a tile would be affected.
Furthermore, the destination point to which the accessibility of a tile is measured is determined in the suggested model, by searching a point that lies on a segment and is closest to the centre of the tile. This can cause issues if this specific segment is difficult, or, in some rare cases, even impossible to reach, while the rest of the segments in the tile would be easily accessible. One way of addressing this issue in a future model version could be to not consider the geometrical centre of a tile as its access point, but for instance, the point which can be reached fastest from every other point within the tile.
For the planning of the distribution of incident locations, it is common to use an approach which takes demand points into account [48]. These demand points can, e.g., be positions of recorded incidents, populated areas or others. Since there can be a lot of incidents, depending on the size and population density of an area, in this model the incidents itself are used as a weighting factor for the demand points but not as demand points themselves. Thereby, the number of required calculations is greatly reduced. The usage of real live data from the fire brigades allows it to make the criticality value relatively specific for the emergency services. To make the model more realistic and to further specify it for emergency services, the driving speeds utilised are values used by the fire department of Cologne for the planning of the response distributions. Those driving speeds, however, are static for specific street categories. As previously mentioned, it would be more realistic to reroute all traffic after a disruption [33]. Therefore, this model could be improved by taking changing traffic density into account. Nevertheless, such improvements would require much more data, such as, e.g., traffic data, and would also make the calculations much more complex.
As previously mentioned, the proposed method is based on the common approach of measuring the impact which the removal of links or nodes has on the performance of the network [7], but utilises whole tiles instead of single links or nodes that are blocked, to simulate larger scaled disruptions of geographically interrelated network elements similar to the grid based approach followed by, e.g., in Jenelius et al. [35]. However, it is different to this approach in that it specifically calculates the presumable impact that the disruption of a single tile has on the ability of the fire brigades to react to incidents in a timely way by weighing the routes to the centre of each tile by the number of incidents that happened in that area in the years 2017 and 2018 and thereby including a data-based estimation on how frequent those tiles must be accessed by emergency units. Furthermore, the problem of how to deal with the effects of the creation of isolated networks is not addressed in Jenelius et al. [35]. It is mentioned in Sullivan et al. [7] that one popular approach to cope with the resulting error that occurs when calculating network performance parameters while having isolated links, is not to block those links but to reduce their capacity by a large proportion. The problem of this approach is, however, that the amount of capacity reduction can at time be quite arbitrary, which may lead to the results being somewhat questionable [7]. Because of this, in the proposed method, the effect of detouring routes is measured separately to the isolation of other tiles. Thereby, in this method there is one distinct value that describes the criticality of a tile in regards to the amount of detouring that has to be done if this certain tile is blocked and one that shows the number of tiles that become completely inaccessible via roads, if the tile becomes blocked.
7. Conclusions
In the course of this work, a model that enables end-users to estimate the criticality of urban road networks, based on the impact that blocked areas can potentially have on the emergency response, is created. Impact identification of blockages to the travel times is achieved by quantifying the change of the emergency response times in a study area under specific blockage conditions. The visualised results of the model with GIS enable the users to promptly identify areas in the respective region which should be prevented from being blocked because this would impair the emergency response coverage of the surrounding area. For the application of the model, the road network, locations of emergency responders (e.g., fire stations) and weighting data (e.g., annual incident numbers and locations) must be available for a GIS environment for further analyses. The accuracy of the received results strongly depends on the quality of the input data. Thereby, the completeness and consistency of the road network dataset set are of particular importance.
For the study area of Cologne, the model provides interesting results. It is identified that the bridges crossing the main river Rhine are not always, as might have been assumed at first glance, the most critical parts in the road network. Some bridges are surpassed in their criticality by several other crossing and highway areas. In particular, the noticeable criticality difference within the crossing, highway and bridge classes should be mentioned. This distribution of criticality values shows that it is hardly possible to make intuitive statements about the criticality of urban road networks. The enormous number of interfering factors (e.g., number of incidents or road segments) underline the importance of a mathematical modelled approach.
The model was primarily designed for being used in the context of emergency response and bigger disasters like earthquakes, floods, etc., but could be easily implemented in other fields of work for example, it could be carried out for the identification of the optimal routing for winter road maintenance vehicles that have to clear important roads first but could be blocked in some areas by road construction works. Another profiting field could be the planning of road and bridge construction works within the respective city. With the suggested model, it is also enabled the travel impact estimation of emergency response that a bigger construction, lasting many days or months, could have. Such estimations allow preventive planning for the minimisation of negative effects on the emergency response coverage of an urban area. With some further adjustments, the model could be utilised in calculations of different network types such as urban water supply or electricity grids.
While taking into account every single road segment, every emergency deployment of the respective period, the position of the fire stations and different driving speeds in a vast and complicated road network of cities with no size restriction, the thereby generated complexity stays inside the model. With the small number of relatively easily accessible input parameters, the model is easily applicable from end-users so to calculate the road network criticality on a high and complex level. Therefore, important information about the road network criticality, which is difficult to obtain without complicated mathematical calculations, is easily retrievable with GIS-based methods that allow for further easy applicability from end-users with little to no prior knowledge in this research field. This advantage makes the model particularly interesting for target groups such as emergency response planners, public road departments or fire and rescue departments itself, which for which it is not automatically necessary to have a high level of experience in mathematical GIS analysis.
With this model, emergency managers should be able to easily identify which areas might be critical for the timely arrival of emergency units and plan safety measures to make those routes or the emergency services more resilient against the possibility of disruptions to road networks in those areas.
In the end, the aim of this project—to create a model which allows us to automatically calculate the emergency response depending on the road network criticality for urban environments—could be achieved sufficiently. The case study of Cologne demonstrates the feasibility and plausibility of the calculations and displays the value of the received information. The simple operability enables and supports the application by the target group of firefighters and various end-users, while also enabling direct applicability to various case studies and for emergency rescue services.
Author Contributions
Conceptualization, A.R., P.P., K.T. and A.F.; Data curation, P.P.; Formal analysis, A.R. and P.P.; Methodology, A.R. and P.P.; Software, A.R. and P.P.; Supervision, A.R., K.T. and A.F.; Visualization, P.P. Writing—original draft, A.R., P.P., K.T. and A.F. Writing—review & editing, A.R., P.P., K.T. and A.F. All authors have read and agreed to the published version of the manuscript.
Funding
This research received no external funding.
Conflicts of Interest
The authors declare no conflict of interest.
Appendix A
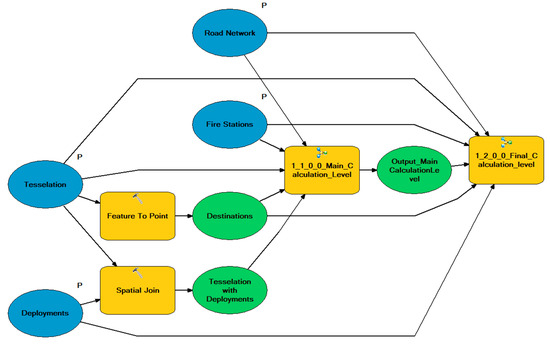
Figure A1.
Ground Level (CF_Top) in ArcMap ModelBuilder.

Figure A2.
Main Calculation Level (CF_Hauptteil) in ArcMap ModelBuilder.
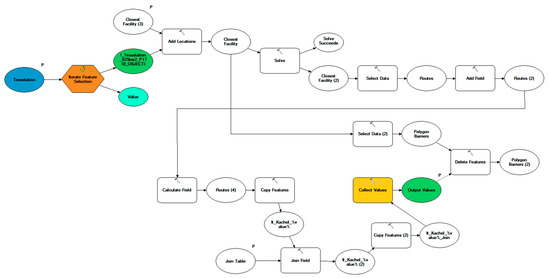
Figure A3.
Iteration Sub-Level (CF_Iteration) in ArcMap ModelBuilder.
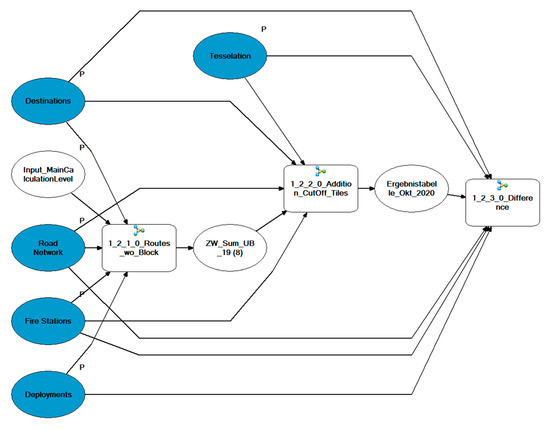
Figure A4.
Final Calculation Level (CF_Endberechung) in ArcMap ModelBuilder.

Figure A5.
Routes without blockades calculation Level in ArcMap ModelBuilder.

Figure A6.
Addition of isolated/cut off tiles level in ArcMap ModelBuilder.
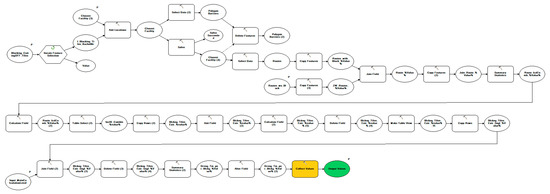
Figure A7.
Iterations in the Addition of isolated/cut off tiles level in ArcMap ModelBuilder.
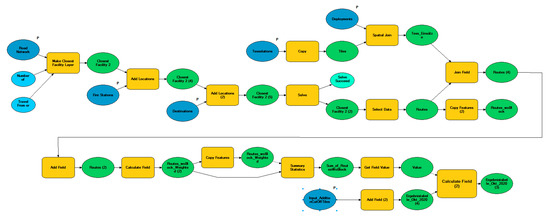
Figure A8.
Difference calculation level in ArcMap ModelBuild.
References
- Nationale Strategie zum Schutz Kritischer Infrastrukturen (KRITIS-Strategie). Available online: https://www.bmi.bund.de/SharedDocs/downloads/DE/publikationen/themen/bevoelkerungsschutz/kritis.html (accessed on 21 January 2020).
- Schmiedel, R.; Behrendt, H. Analyse des Leistungsniveaus im Rettungsdienst für die Jahre 2016 und 2017, 1st ed.; Fachverlag NW: Bremen, Germany, 2019; ISBN 978-3-95606-471-5. [Google Scholar]
- Gefahrenabwehr in Nordrhein-Westfalen Jahresbericht. 2019. Available online: https://www.im.nrw/system/files/media/document/file/gab2019.pdf (accessed on 11 October 2020).
- Dierich, A.; Tzavella, K.; Setiadi, N.J.; Fekete, A.; Neisser, F.M. Enhanced Crisis-Preparation of Critical Infrastructures through a Participatory Qualitative-Quantitative Interdependency Analysis Approach. In Proceedings of the 16th ISCRAM Conference, Valencia, Spain, 19–22 May 2019; pp. 1226–1244. [Google Scholar]
- Fekete, A.; Neisser, F.; Tzavella, K.; Hetkämper, C. Wege zu Einem Mindestversorgungskonzept. Kritische Infrastrukturen und Resilienz, 1st ed.; TH Köln, Technology Arts Sciences: Köln, Germany, 2019. [Google Scholar]
- Taylor, M.A. Susilawati Remoteness and accessibility in the vulnerability analysis of regional road networks. Transp. Res. Part A Policy Pract. 2012, 46, 761–771. [Google Scholar] [CrossRef]
- Sullivan, J.; Novak, D.; Aultman-Hall, L.; Scott, D. Identifying critical road segments and measuring system-wide robustness in transportation networks with isolating links: A link-based capacity-reduction approach. Transp. Res. Part A Policy Pract. 2010, 44, 323–336. [Google Scholar] [CrossRef]
- OpenStreetMap Data Extracts. Available online: http://download.geofabrik.de/ (accessed on 21 January 2020).
- Tzavella, K.; Fekete, A.; Fiedrich, F. Opportunities provided by geographic information systems and volunteered geographic information for a timely emergency response during flood events in Cologne, Germany. Nat. Hazards 2017. [Google Scholar] [CrossRef]
- Fekete, A.; Tzavella, K.; Baumhauer, R. Spatial exposure aspects contributing to vulnerability and resilience assessments of urban critical infrastructure in a flood and blackout context. Nat. Hazards 2016, 86, 151–176. [Google Scholar] [CrossRef]
- Fekete, A. Critical infrastructure cascading effects. Disaster resilience assessment for floods affecting city of Cologne and Rhein-Erft-Kreis. J. Flood Risk Manag. 2020, 13. [Google Scholar] [CrossRef]
- Welle, T.; Depietri, Y.; Angignard, M.; Birkmann, J.; Renaud, F.; Greiving, S. Vulnerability Assessment to Heat Waves, Floods, and Earthquakes Using the MOVE Framework. In Assessment of Vulnerability to Natural Hazards. A European Perspective; Birkmann, J., Kienberger, S., Alexander, D., Eds.; Elsevier Science: Burlington, NJ, USA, 2014; pp. 91–124. [Google Scholar]
- Aboueljinane, L.; Sahin, E.; Jemai, Z. A review on simulation models applied to emergency medical service operations. Comput. Ind. Eng. 2013, 66, 734–750. [Google Scholar] [CrossRef]
- Schmiedel, R.; Behrendt, H.; Betzler, E. Regelwerk zur Bedarfsplanung Rettungsdienst; Mendel: Witten, Germany, 2012. [Google Scholar]
- Qualitätskriterien für die Bedarfsplanung von Feuerwehren in Städten. In Empfehlungen der Arbeitsgemeinschaft der Leiter der Berufsfeuerwehren; Arbeitsgemeinschaft der Leiter der Berufsfeuerwehren: Bonn, Germany, 2015; Available online: https://www.staedtetag.de/files/dst/docs/Publikationen/Weitere-Publikationen/Archiv/qualitaetskriterien-brandschutzbedarfsplanung-handreichung-2017-agbf-bund.pdf (accessed on 11 November 2020).
- Fischer, M.; Der Eckpunktepapier-Konsensus-Gruppe, F.; Kehrberger, E.; Marung, H.; Moecke, H.; Prückner, S.; Trentzsch, H.; Urban, B. Eckpunktepapier 2016 zur notfallmedizinischen Versorgung der Bevölkerung in der Prähospitalphase und in der Klinik. Notf. Rettungsmedizin 2016, 19, 387–395. [Google Scholar] [CrossRef]
- Schehadat, M.S.; Groneberg, D.A.; Bauer, J.; Bendels, M.H.K. Hilfsfristen des Rettungsdienstes in den deutschen Bundesländern Help deadlines for emergency services in the German federal states. Zentralblatt Arbeitsmedizin Arbeitsschutz Ergon. 2017, 67, 255–260. [Google Scholar] [CrossRef]
- Behrendt, H.; Schmiedel, R. Ermittlung der bedarfsgerechten Fahrzeugvorhaltung im Rettungsdienst. Notf. Rettungsmedizin 2002, 5, 190–203. [Google Scholar] [CrossRef]
- Yao, J.; Zhang, X.; Murray, A.T. Location optimization of urban fire stations: Access and service coverage. Comput. Environ. Urban Syst. 2019, 73, 184–190. [Google Scholar] [CrossRef]
- Claridge, E.; Spearpoint, M. New Zealand fire Service Response Times to Structure Fires. Procedia Eng. 2013, 62, 1063–1072. [Google Scholar] [CrossRef]
- Niemeier, D.A. Accessibility: An evaluation using consumer welfare. Transportation 1997, 24, 377–396. [Google Scholar] [CrossRef]
- Borghetti, F.; Malavasi, G. Road accessibility model to the rail network in emergency conditions. J. Rail Transp. Plan. Manag. 2016, 6, 237–254. [Google Scholar] [CrossRef]
- Novak, D.C.; Sullivan, J.L. A link-focused methodology for evaluating accessibility to emergency services. Decis. Support Syst. 2014, 57, 309–319. [Google Scholar] [CrossRef]
- Schmid, V.; Doerner, K.F. Ambulance location and relocation problems with time-dependent travel times. Eur. J. Oper. Res. 2010, 207, 1293–1303. [Google Scholar] [CrossRef]
- Brandeau, M.L.; Chiu, S.S. An Overview of Representative Problems in Location Research. Manag. Sci. 1989, 35, 645–674. [Google Scholar] [CrossRef]
- Ertugay, K.; Argyroudis, S.; Düzgün, H.B.S. Accessibility modeling in earthquake case considering road closure probabilities: A case study of health and shelter service accessibility in Thessaloniki, Greece. Int. J. Disaster Risk Reduct. 2016, 17, 49–66. [Google Scholar] [CrossRef]
- Albano, R.; Sole, A.; Adamowski, J.; Mancusi, L. A GIS-based model to estimate flood consequences and the degree of accessibility and operability of strategic emergency response structures in urban areas. Nat. Hazards Earth Syst. Sci. 2014, 14, 2847–2865. [Google Scholar] [CrossRef]
- Coles, D.; Yu, D.; Wilby, R.L.; Green, D.; Herring, Z. Beyond ‘flood hotspots’: Modelling emergency service accessibility during flooding in York, UK. J. Hydrol. 2017, 546, 419–436. [Google Scholar] [CrossRef]
- Auer, M.; Eckle, M.; Fendrich, S.; Griesbaum, L.; Kowatsch, F.; Marx, S.; Raifer, M.; Schott, M.; Troilo, R.; Zipf, A. Towards Using the Potential of OpenStreetMap History for Disaster Activation Monitoring. In Proceedings of the 15th ISCRAM Conference, Rochester, NY, USA, 20–23 May 2018. [Google Scholar]
- Özdamar, L.; Ekinci, E.; Küçükyazici, B. Emergency Logistics Planning in Natural Disasters. Ann. Oper. Res. 2004, 129, 217–245. [Google Scholar] [CrossRef]
- Zipf, A.; Mobasheri, A.; Rousell, A.; Hahmann, S. Crowdsourcing for individual needs—The case of routing and navigation for mobility-impaired persons. In European Handbook of Crowdsourced Geographic Information; Ubiquity Press: London, UK, 2016. [Google Scholar] [CrossRef]
- Toma-Danila, D. A GIS framework for evaluating the implications of urban road network failure due to earthquakes: Bucharest (Romania) case study. Nat. Hazards 2017, 93, 97–111. [Google Scholar] [CrossRef]
- Sullivan, J.; Aultman-Hall, L.; Novak, D. A review of current practice in network disruption analysis and an assessment of the ability to account for isolating links in transportation networks. Transp. Lett. 2009, 1, 271–280. [Google Scholar] [CrossRef]
- Scott, D.M.; Novak, D.C.; Aultman-Hall, L.; Guo, F. Network Robustness Index: A new method for identifying critical links and evaluating the performance of transportation networks. J. Transp. Geogr. 2006, 14, 215–227. [Google Scholar] [CrossRef]
- Jenelius, E.; Mattsson, L.-G. Road network vulnerability analysis: Conceptualization, implementation and application. Comput. Environ. Urban Syst. 2015, 49, 136–147. [Google Scholar] [CrossRef]
- Li, X.; Zhao, Z.; Zhu, X.; Wyatt, T. Covering models and optimization techniques for emergency response facility location and planning: A review. Math. Methods Oper. Res. 2011, 74, 281–310. [Google Scholar] [CrossRef]
- Akay, A.E.; Erdoğan, A. Gis-Based Multi-Criteria Decision Analysis for Forest Fire Risk Mapping. ISPRS Ann. Photogramm. Remote Sens. Spat. Inf. Sci. 2017, 25–30. [Google Scholar] [CrossRef]
- Islam, A.; Murshed, S.; Kabir, S.M.M.; Farazi, A.H.; Gazi, Y.; Jahan, I.; Akhter, S.H. Utilization of Open Source Spatial Data for Landslide Susceptibility Mapping at Chittagong District of Bangladesh—An Appraisal for Disaster Risk Reduction and Mitigation Approach. Int. J. Geosci. 2017, 8, 577–598. [Google Scholar] [CrossRef]
- Tang, Z.; Zhou, S.; Geng, B.; Sun, J. Research on Railway Emergency Rescue Path Selection Based on GIS. IOP Conf. Ser. Earth Environ. Sci. 2019, 384, 012105. [Google Scholar] [CrossRef]
- Birch, C.P.; Oom, S.P.; Beecham, J.A. Rectangular and hexagonal grids used for observation, experiment and simulation in ecology. Ecol. Model. 2007, 206, 347–359. [Google Scholar] [CrossRef]
- Amt für Stadtentwicklung und Statistik, Amt für Presse-und Öffentlichkeitsarbeit: Köln, Germany. 2018. Available online: https://www.stadt-koeln.de/politik-und-verwaltung/statistik/statistische-jahr-buecher (accessed on 21 January 2020).
- Stadtfläche, Einwohnerdichte und Einwohner, Offene Daten Köln. Available online: https://www.offenedaten-koeln.de/dataset/stadtfl%C3%A4che-einwohnerdichte-und-einwohner (accessed on 21 January 2020).
- Feuerwehr. Jahresbericht der Feuerwehr Köln. 2018. Available online: https://www.stadt-koeln.de/politik-und-verwaltung/feuerwehr/jahresbericht-der-feuerwehr?schriftgroesse=normal (accessed on 21 January 2020).
- Barron, C.; Neis, P.; Zipf, A. A Comprehensive Framework for Intrinsic OpenStreetMap Quality Analysis. Trans. GIS 2013, 18, 877–895. [Google Scholar] [CrossRef]
- Neis, P.; Zielstra, D.; Zipf, A. The Street Network Evolution of Crowdsourced Maps: OpenStreetMap in Germany 2007–2011. Futur. Internet 2011, 4, 1–21. [Google Scholar] [CrossRef]
- Zerovnik, J.; Sau, I. An Optimal Permutation Routing Algorithm on Full-Duplex Hexagonal Networks. In Discrete Mathematics & Theoretical Computer Science; DMTCS: Strasbourg, France, 2008; Available online: https://hal.inria.fr/hal-00972334 (accessed on 17 April 2020).
- Lee, I.; Torpelund-Bruin, C. Multiplicatively-weighted order-k Minkowski-metric Voronoi models for disaster decision support systems. In Proceedings of the IEEE International Conference on Intelligence and Security Informatics, Taipei, Taiwan, 17–20 June 2008; IEEE: Piscataway, NJ, USA, 2008; pp. S236–S238. [Google Scholar]
- Lahijanian, B.; Zarandi, M.F.; Farahani, F.V. Double coverage ambulance location modeling using fuzzy traveling time. In Proceedings of the 2016 Annual Meeting of the North American Fuzzy Information Processing Society, NAFIPS 2016, El Paso, TX, USA, 31 October–4 November 2016; IEEE: Piscataway, NJ, USA, 2016. Available online: http://ieeexplore.ieee.org/servlet/opac?punumber=7819724 (accessed on 1 July 2020).
Publisher’s Note: MDPI stays neutral with regard to jurisdictional claims in published maps and institutional affiliations. |
© 2020 by the authors. Licensee MDPI, Basel, Switzerland. This article is an open access article distributed under the terms and conditions of the Creative Commons Attribution (CC BY) license (http://creativecommons.org/licenses/by/4.0/).
