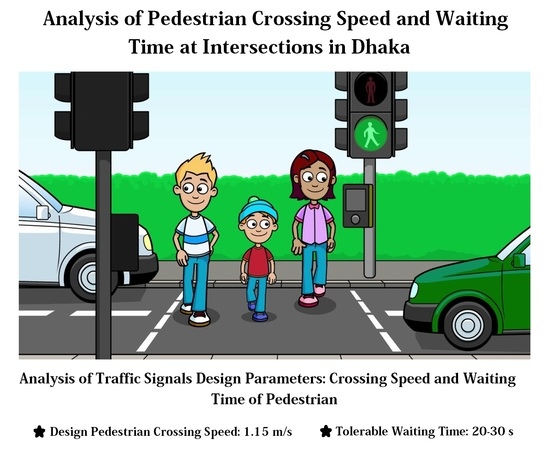
Analysis of Pedestrian Crossing Speed and Waiting Time at Intersections in Dhaka


Abstract
1. Introduction
2. Literature Review
3. Materials and Methods
3.1. Data Collection
3.2. Data Analysis
4. Results and Discussion
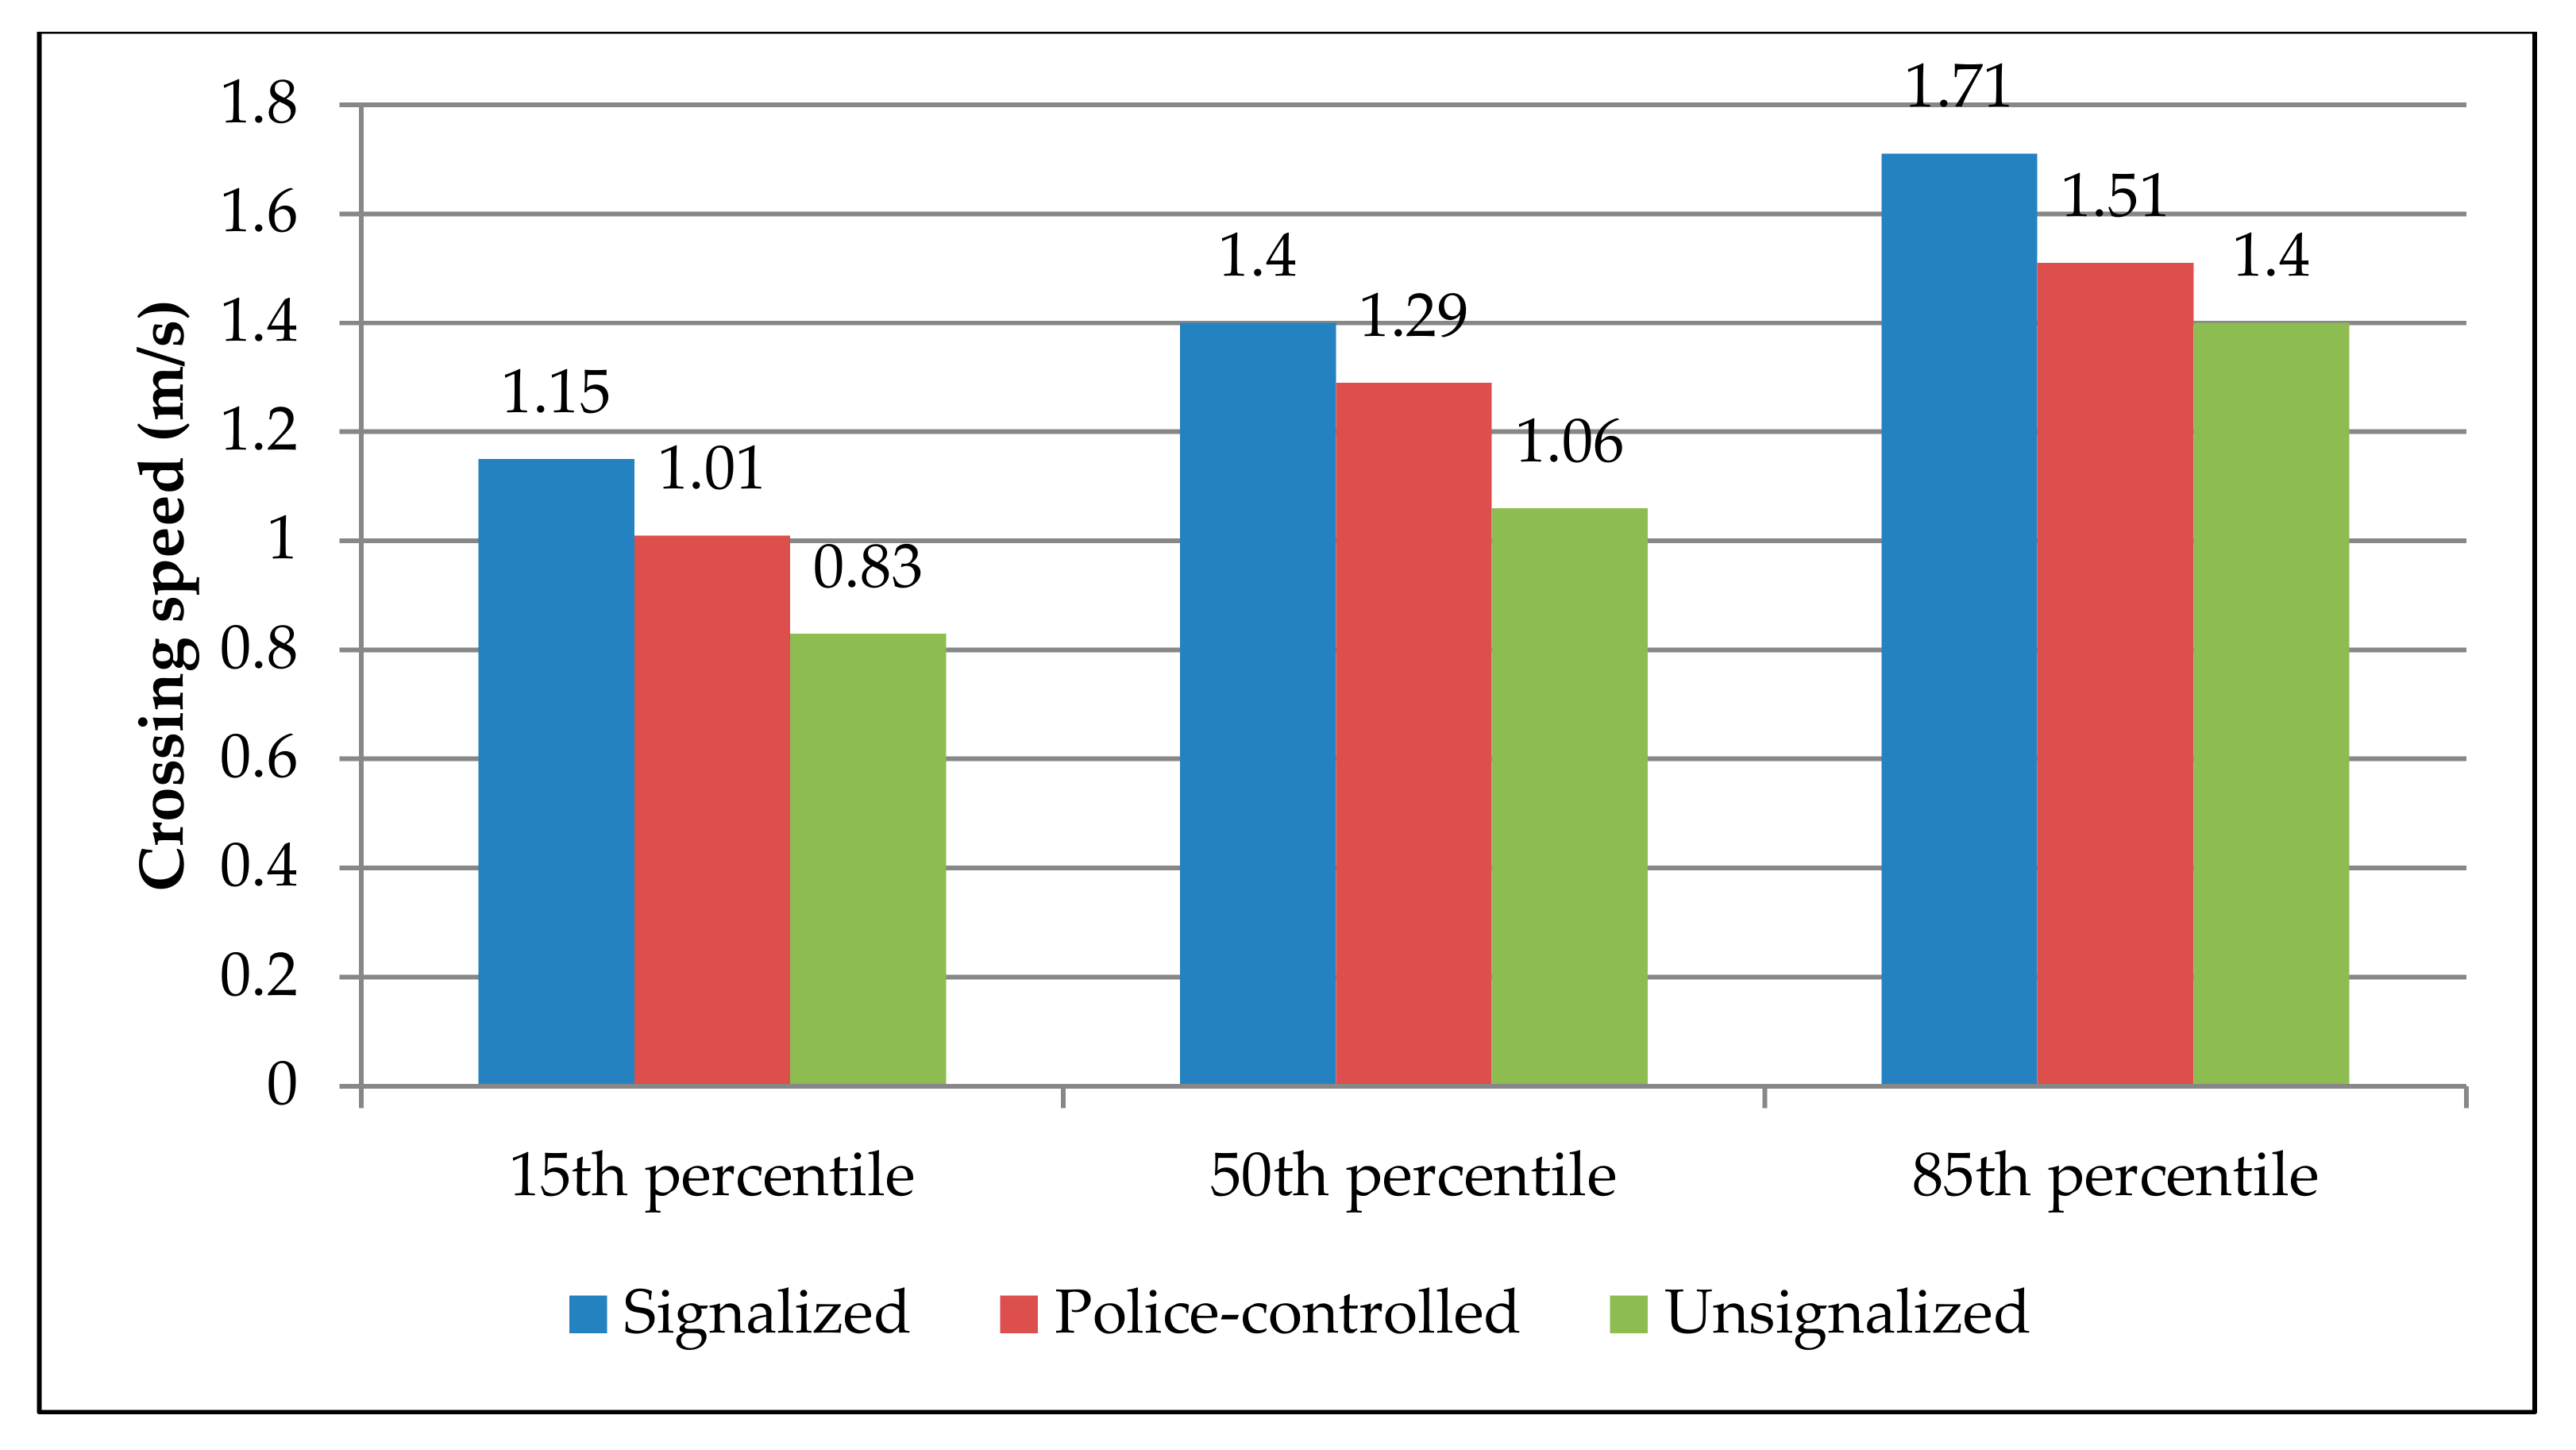
4.1. Crosing Speed
4.1.1. Descriptive Analysis
4.1.2. Factors Affecting Pedestrian Crossing Speed
4.1.3. Model Development
Model Variables
Multiple Linear Regression (MLR) Model Estimation and Discussion
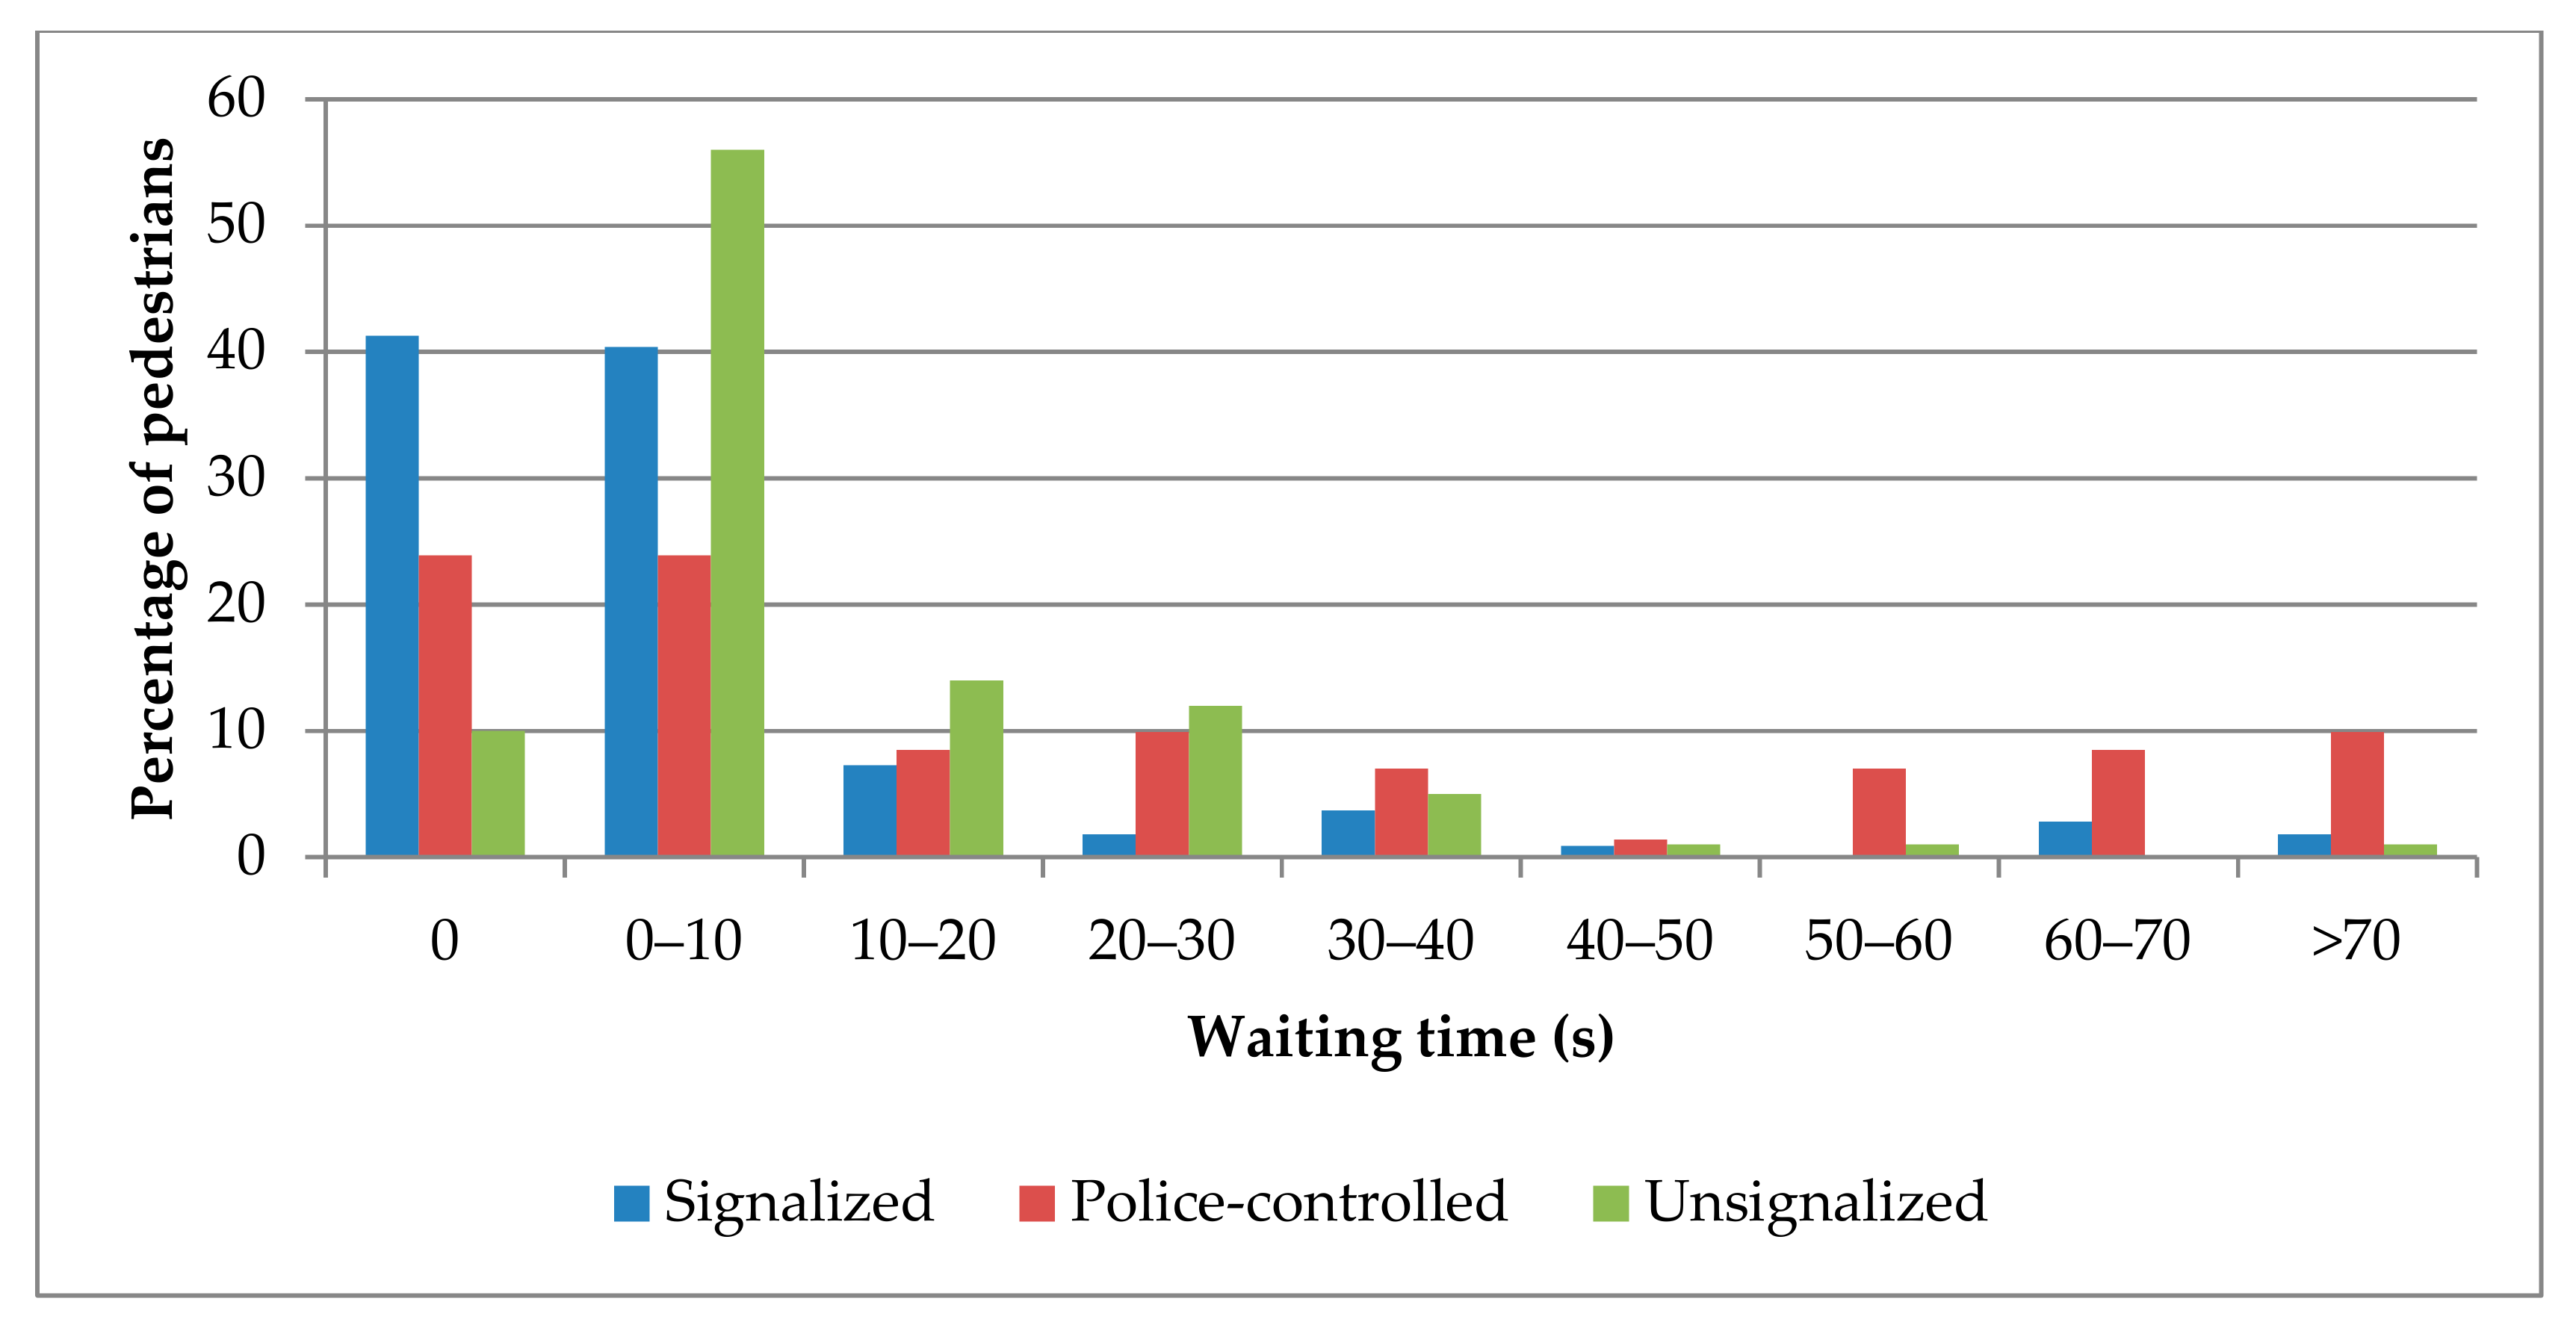
4.2. Waiting Time of Pedestrians
4.2.1. Descriptive Analysis
4.2.2. Factors Affecting Pedestrian Waiting Time
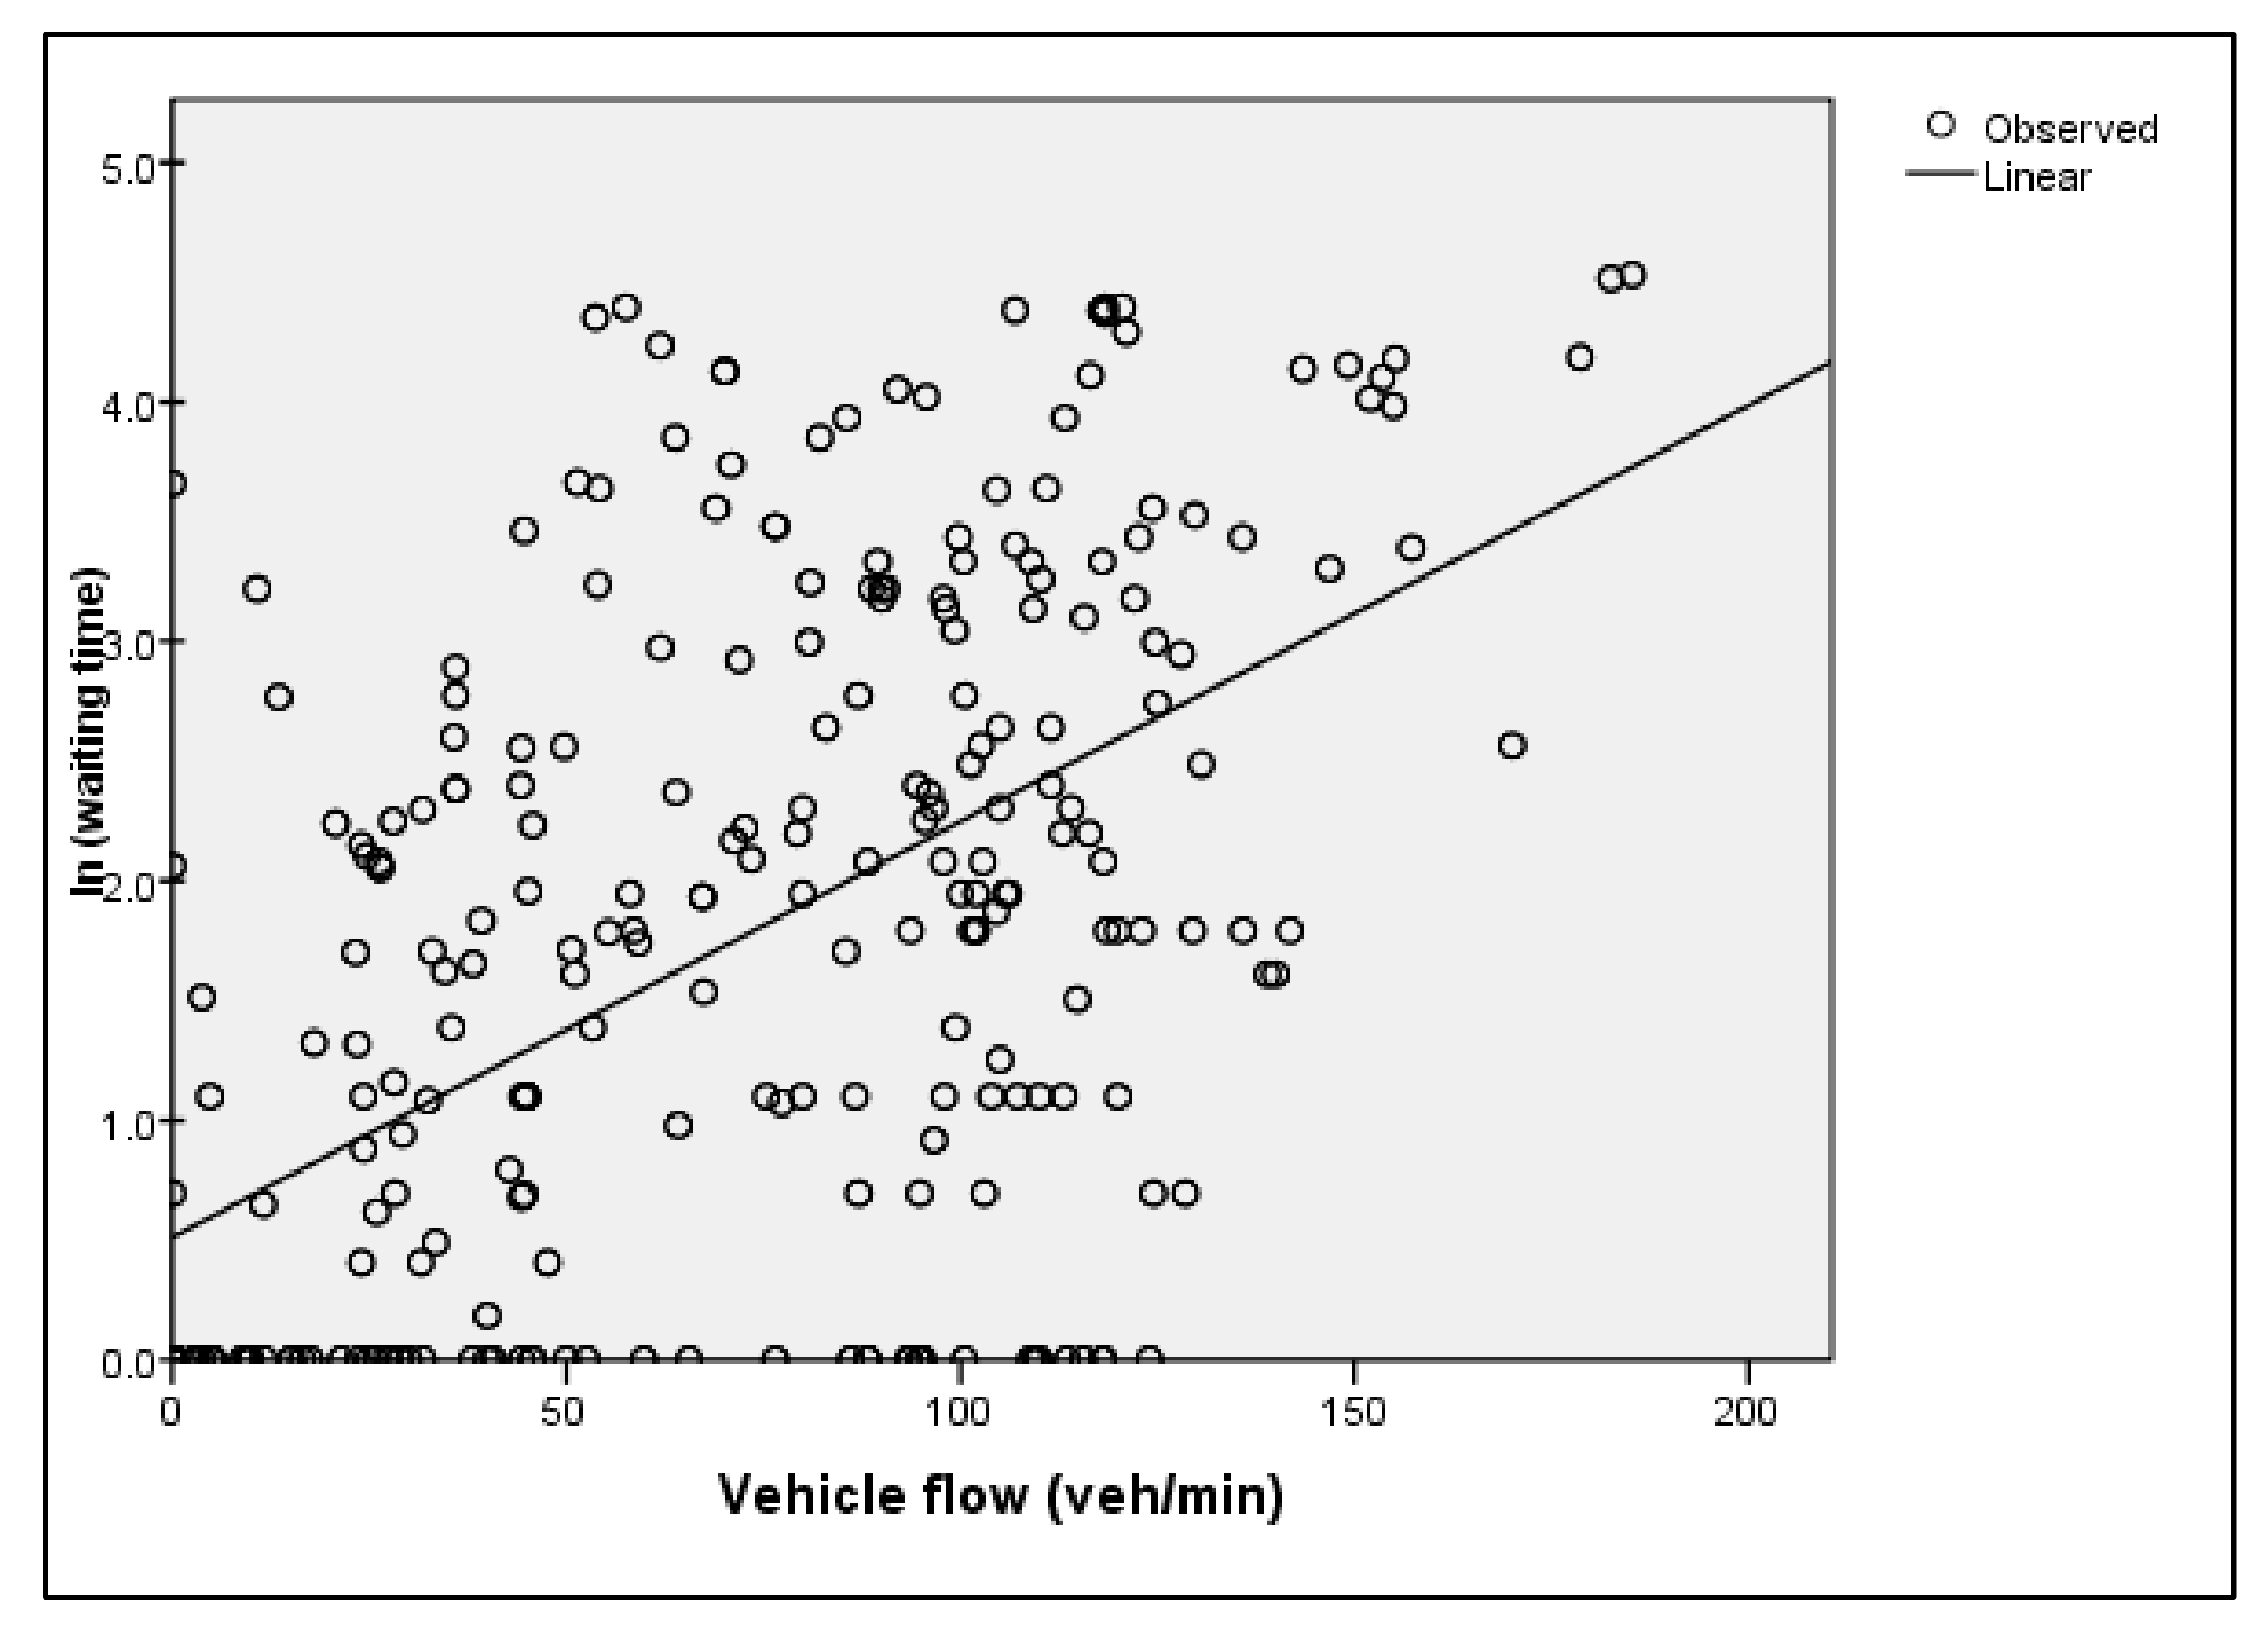
4.2.3. Model Development
Model Variables
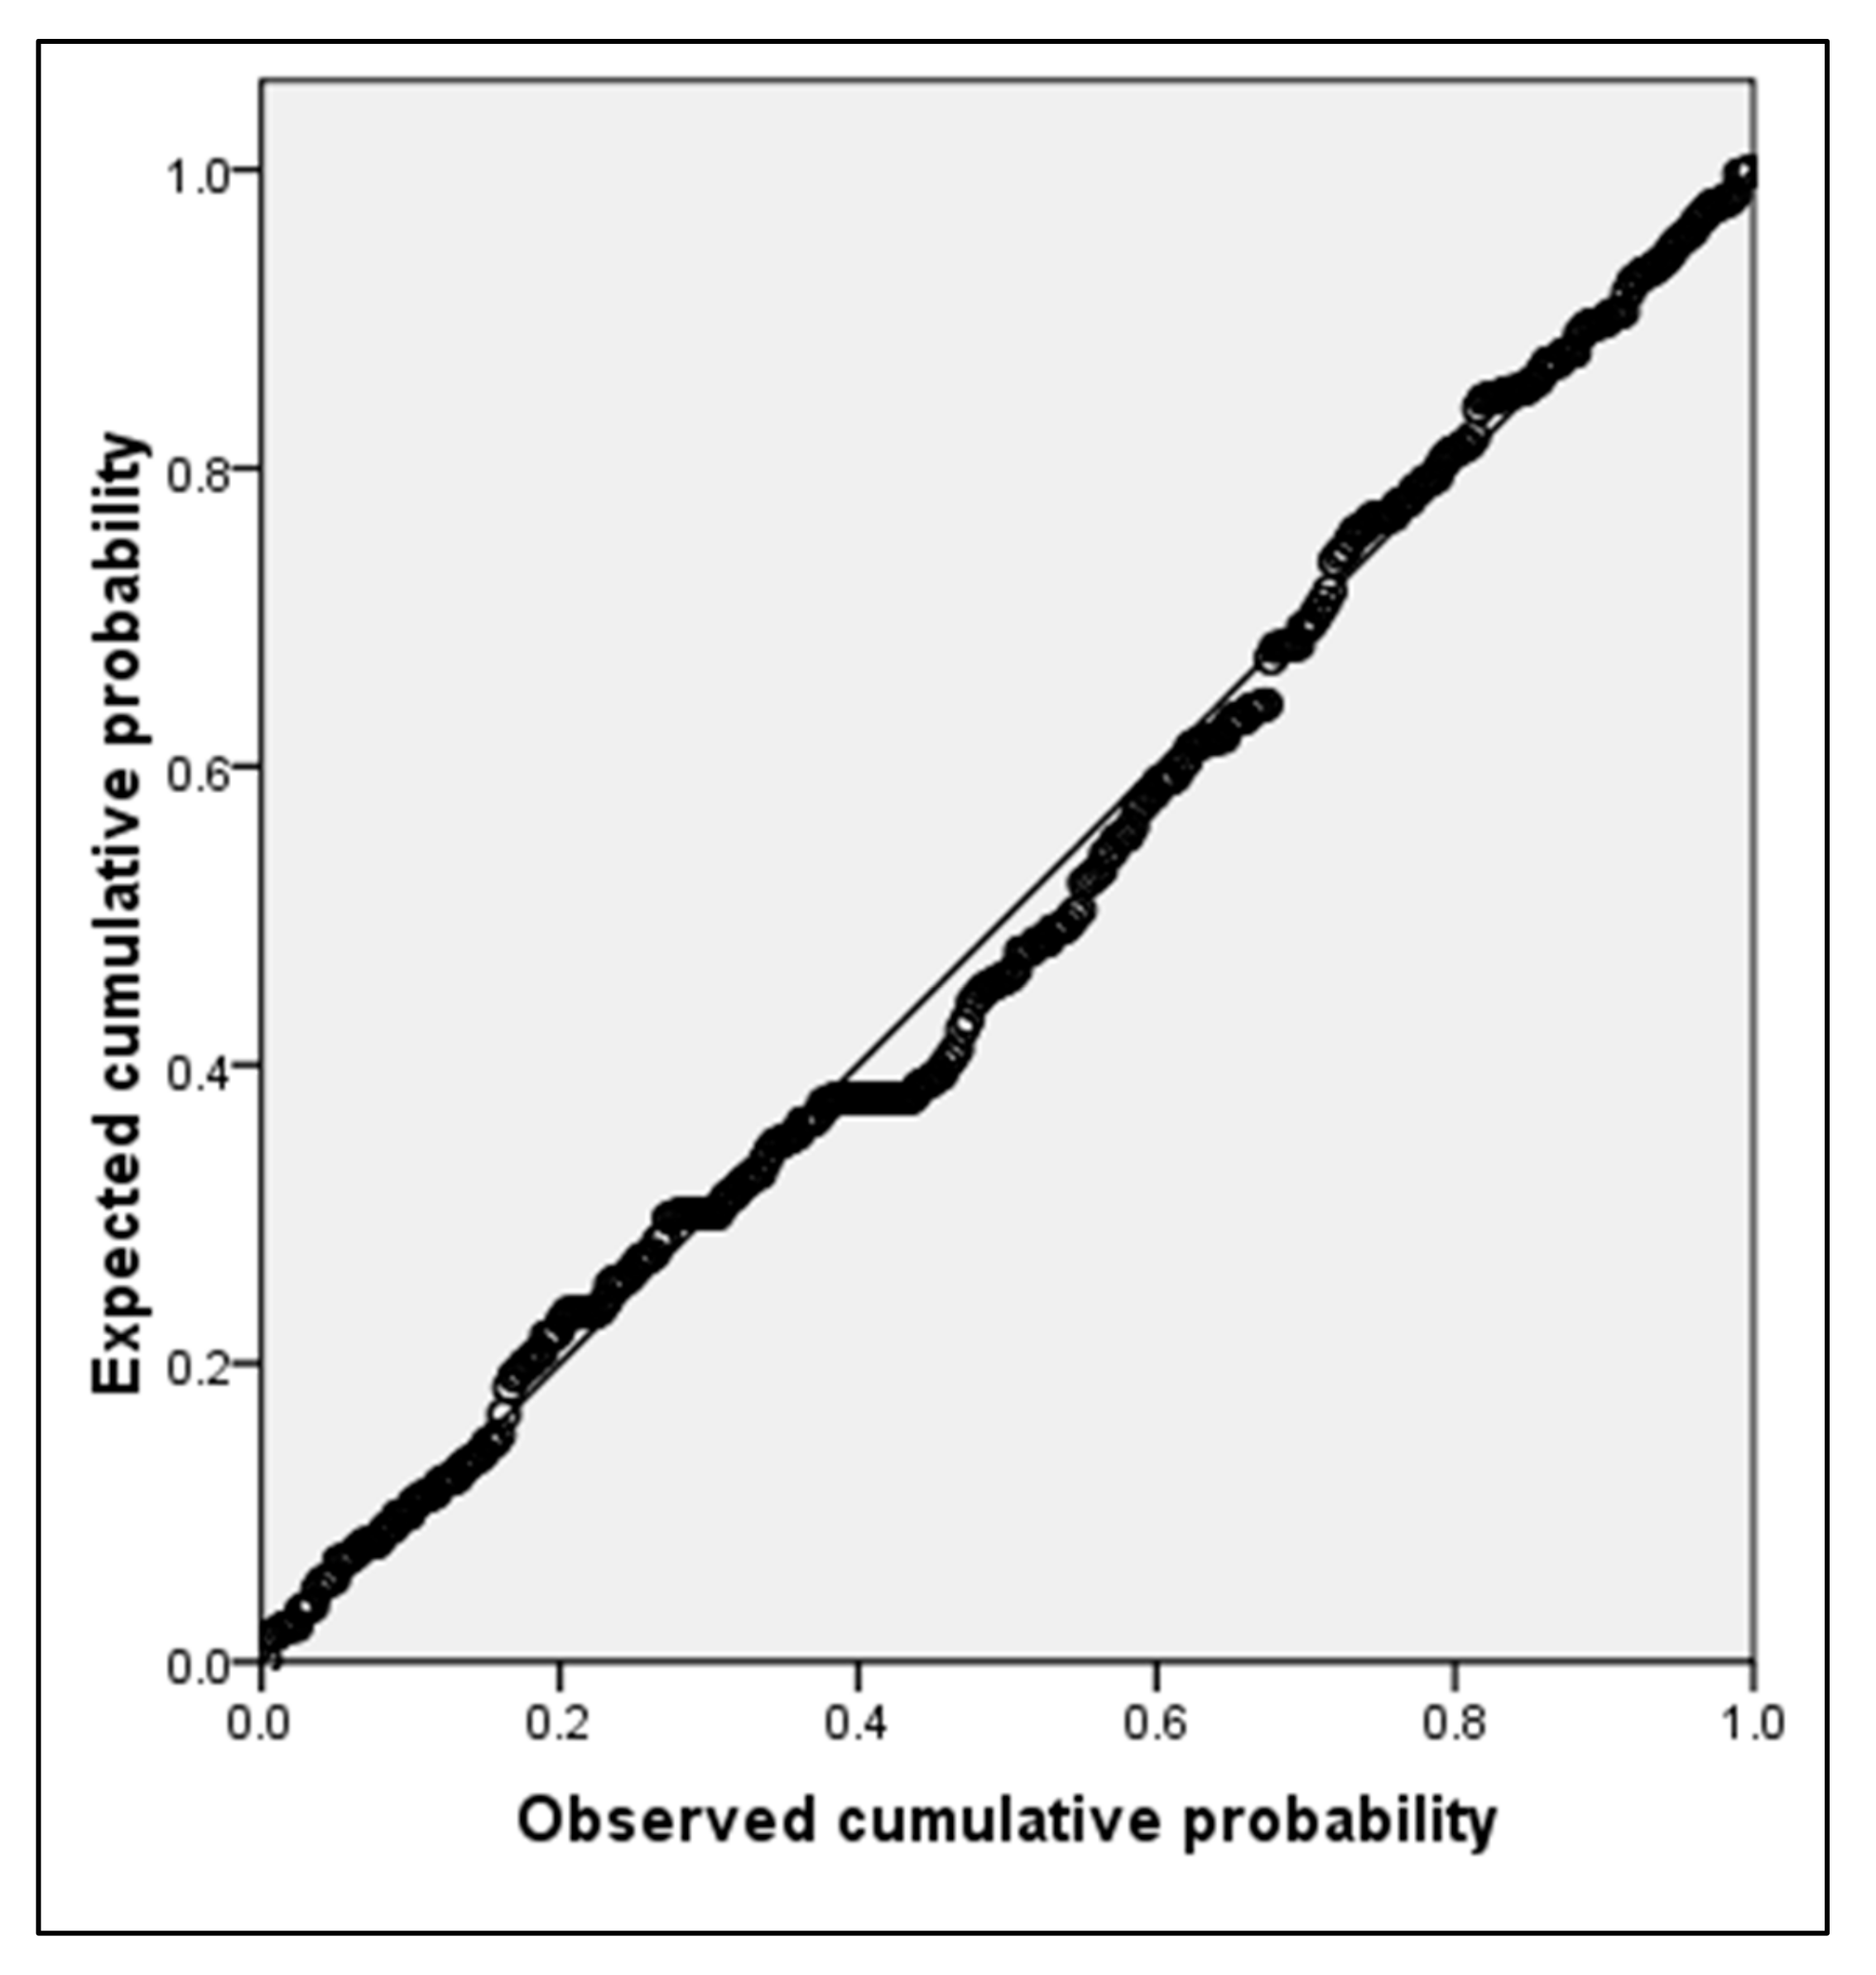
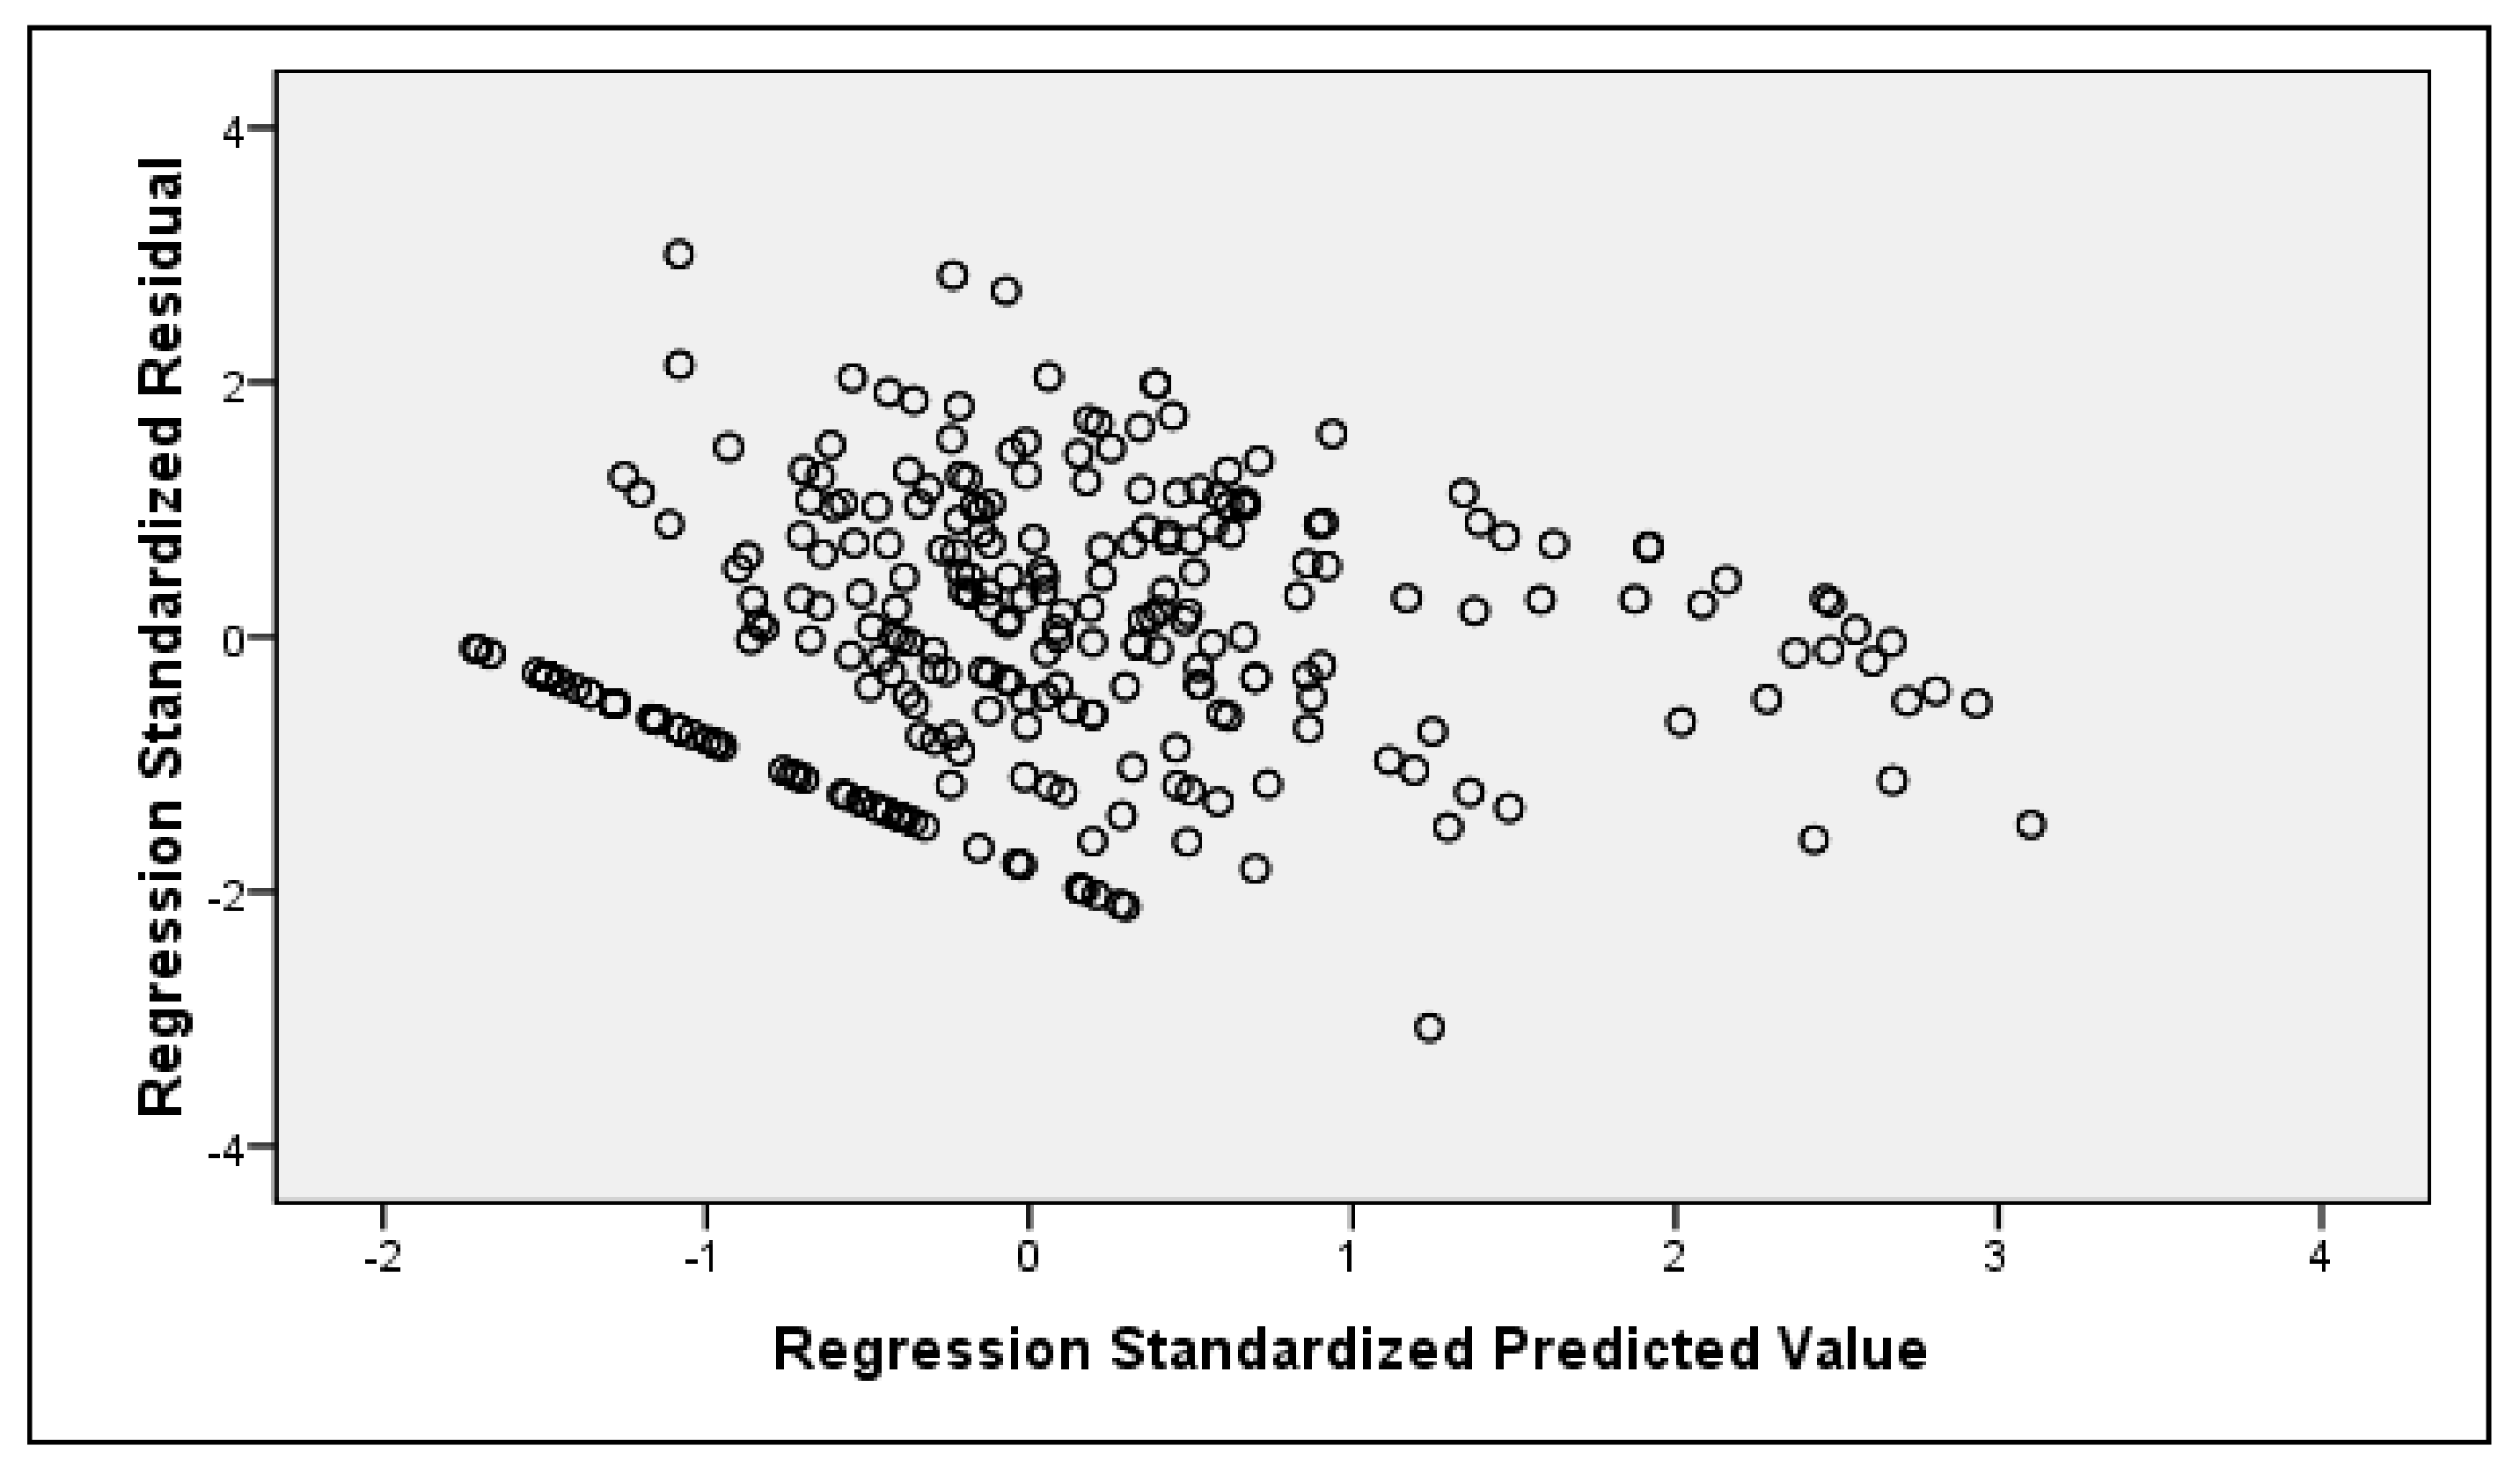
Multiple Linear Regression (MLR) Model Estimation and Discussion
5. Conclusions
Author Contributions
Funding
Conflicts of Interest
Appendix A

| Variable | VIF |
|---|---|
| Signalized | 4.857 |
| Traffic-police-controlled | 2.356 |
| Gender | 1.130 |
| Adult | 1.151 |
| Old | 1.102 |
| Single-stage | 5.097 |
| Two-stage | 3.074 |
| Crossing pattern | 1.386 |
| Crossing group | 1.282 |
| Full compliance | 5.525 |
| Partial compliance | 4.889 |
| Crossing location | 1.348 |
| Baggage handling | 1.075 |


| Variable | VIF |
|---|---|
| Signalized | 3.219 |
| Traffic-police-controlled | 2.117 |
| Gender | 1.053 |
| Adult | 1.083 |
| Old | 1.101 |
| Small | 2.905 |
| Medium | 2.086 |
| Waiting location | 1.157 |
| Vehicle flow | 2.756 |


References
- Rahaman, K.R.; Dhar, T.K.; Hossain, M.S.F.; Khan, S. A Comprehensive approach to model pedestrians safety in Dhaka City, Bangladesh. Eur. J. Soc. Sci. 2009, 12, 197–204. [Google Scholar]
- Road Safety Facts 2013. Available online: http://ari.buet.ac.bd/downloads/Facts 2013.pdf (accessed on 12 October 2018).
- Hasan, T.; Siddique, A.; Hadiuzzaman, M.; Musabbir, S.R. Determining the most suitable pedestrian level of service method for Dhaka City, Bangladesh, through a synthesis of measurements. Transp. Res. Rec. 2015, 2519, 104–115. [Google Scholar] [CrossRef]
- Rahman, M.M.; Khadem, R. Deficiencies of traffic signal system in Dhaka City. J. Soc. Transp. Traffic Stud. 2012, 3, 63–73. [Google Scholar]
- Hasan, M. Traffic Signal Design of Isolated Intersections for Mixed Traffic Operation. Master’s Thesis, Bangladesh University of Engineering and Technology (BUET), Dhaka, Bangladesh, 1996. Unpublished Work. [Google Scholar]
- Dündar, S. Analysis of pedestrian crossing speed–the case of Istanbul. Proc. Inst. Civil Eng. Municipal Eng. 2016, 170, 29–37. [Google Scholar] [CrossRef]
- Li, B. A model of pedestrians’ intended waiting times for street crossings at signalized intersections. Transp. Res. Part B Method. 2013, 51, 17–28. [Google Scholar] [CrossRef]
- Koh, P.P.; Wong, Y.D.; Chandrasekar, P. Safety evaluation of pedestrian behaviour and violations at signalised pedestrian crossings. Saf. Sci. 2014, 70, 143–152. [Google Scholar] [CrossRef]
- Guo, H.; Gao, Z.; Yang, X.; Jiang, X. Modeling pedestrian violation behavior at signalized crosswalks in China: A hazards-based duration approach. Traffic Inj. Prev. 2011, 12, 96–103. [Google Scholar] [CrossRef]
- Brosseau, M.; Zangenehpour, S.; Saunier, N.; Miranda-Moreno, L. The impact of waiting time and other factors on dangerous pedestrian crossings and violations at signalized intersections: A case study in Montreal. Transp. Res. Part F Traffic Psychol. Behav. 2013, 21, 159–172. [Google Scholar] [CrossRef]
- Van Houten, R.; Ellis, R.; Kim, J.L. The effects of varying minimum green on the percentage of pedestrians waiting to cross with the WALK signal at midblock crosswalks. Transp. Res. Rec. 2007, 2002–2010, 78–83. [Google Scholar] [CrossRef]
- Wang, W.; Guo, H.; Gao, Z.; Bubb, H. Individual differences of pedestrian behaviour in midblock crosswalk and intersection. Int. J. Crashworth. 2011, 16, 1–9. [Google Scholar] [CrossRef]
- Onelcin, P.; Alver, Y. The crossing speed and safety margin of pedestrians at signalized intersections. Transp. Res. Procedia 2017, 22, 3–12. [Google Scholar] [CrossRef]
- Behbahani, H.; Gilani, V.N.M.; Samet, M.J.; Salehfard, R. Analysis of Crossing Speed of the Pedestrians in Marked and Unmarked Crosswalks in The Signalized and Un-Signalized Intersections (Case Study: Rasht City). In Proceedings of the IOP Conference Series: Materials Science and Engineering, Melbourne, Australia, 15–17 November 2017; IOP Publishing: Bristol, UK, 2019; Volume 245, p. 042014. [Google Scholar]
- DMP to Take Responsibility Once Traffic Signal System Repaired. Available online: https://www.dhakatribune.com/bangladesh/dhaka/2018/11/27/dmp-to-take-responsibility-once-traffic-signal-system-repaired (accessed on 12 October 2018).
- PM: Govt to Introduce Digital Traffic System in Dhaka. Available online: https://www.dhakatribune.com/bangladesh/government-affairs/2019/02/27/pm-govt-to-introduce-digital-traffic-system-in-dhaka (accessed on 14 April 2019).
- Bangladesh Road Transport Authority (BRTA). Bangladesh Road Sign Manual; Bangladesh Road Transport Authority (BRTA): Dhaka, Bangladesh, 2010; Volume 1.
- Tanaboriboon, Y.; Guyano, J.A. Analysis of pedestrian movements in Bangkok. Transp. Res. Rec. 1991, 1294, 52–56. [Google Scholar]
- Goh, B.H.; Subramaniam, K.; Wai, Y.T.; Mohamed, A.A.; Ali, A. Pedestrian crossing speed: The case of Malaysia. Int. J. Traffic Transp. Eng. 2012, 2, 323–332. [Google Scholar] [CrossRef]
- Transportation Research Board (TRB). Highway Capacity Manual; National Research Council: Washington, DC, USA, 2000. [Google Scholar]
- Federal Highway Administration (FHWA). Manual of Uniform Traffic Control. Devices for Streets and Highways; US Department of Transportation: Washington, DC, USA, 2009.
- Turkish Standards Institute (TSI). Urban Roads-Design Criteria on Sidewalks and Pedestrian Areas (TS12174). Turkey, 2012; Turkish Standards Institute (TSI): Ankara, Turkey, 2012. [Google Scholar]
- Tarawneh, M.S. Evaluation of pedestrian speed in Jordan with investigation of some contributing factors. J. Saf. Res. 2001, 32, 229–236. [Google Scholar] [CrossRef]
- Institute of Transportation Engineers (ITE). Committee 4A-6 Pedestrians. In Traffic Control Devices for Elderly and Handicapped Pedestrians; Institute of Transportation Engineers: Washington, DC, USA, 1983. [Google Scholar]
- Wu, J.L.; Zhang, S.R.; Singh, A.K.; Wang, Q.P. Pedestrian walking speed characteristics at signalized intersections in new urban district communities. In Proceedings of the First International Conference on Transportation Infrastructure and Materials (ICTIM 2016), Xi’an, China, 16–18 July 2016; DEStech Trans. Eng. Technol. Res.: Toronto, ON, Canada, 2016; pp. 453–461. [Google Scholar]
- Jain, A.; Gupta, A.; Rastogi, R. Pedestrian crossing behaviour analysis at intersections. Int. J. Traffic Transp. Eng. 2014, 4, 103–116. [Google Scholar] [CrossRef]
- Jabatan Kerja Raya (JKR). Arahan Teknik (Jalan) 13/87. A Guide to the Design of Traffic Signal; Jabatan Kerja Raya (JKR): Kuala Lumpur, Malaysia, 1987; p. 107.
- Bennett, S.; Felton, A.; Akçelik, R. Pedestrian movement characteristics at signalised intersections. In Proceedings of the 23rd Conference of Australian Institutes of Transport Research (CAITR 2001), Melbourne, Australia, 10–12 December 2001. [Google Scholar]
- Marisamynathan, S.; Vedagiri, P. Modeling pedestrian level of service at signalized intersection under mixed traffic conditions. Transp. Res. Rec. J. Transp. Res. Board 2017, 2634, 86–94. [Google Scholar] [CrossRef]
- Marisamynathan; Perumal, V. Study on pedestrian crossing behavior at signalized intersections. J. Traffic Transp. Eng. (Eng. Ed.) 2014, 1, 103–110. [Google Scholar] [CrossRef]
- Peters, D.; Kim, L.; Zaman, R.; Haas, G.; Cheng, J.; Ahmed, S. Pedestrian crossing behavior at signalized intersections in New York City. Transp. Res. Rec. J. Transp. Res. Board 2015, 2519, 179–188. [Google Scholar] [CrossRef]
- Jiang, X.; Wang, W.; Bengler, K.; Guo, W. Analyses of pedestrian behavior on mid-block unsignalized crosswalk comparing Chinese and German cases. Adv. Mech. Eng. 2015, 7, 1–7. [Google Scholar] [CrossRef]
- Zhao, Y.; Chen, Q.; Qin, J.; Xue, X. Survey of pedestrians’ crossing time at non-signalized mid-block street crossing. J. Adv. Transp. 2016, 50, 2193–2208. [Google Scholar] [CrossRef]
- Laxman, K.K.; Rastogi, R.; Chandra, S. Pedestrian flow characteristics in mixed traffic conditions. J. Urban Plan. Dev. 2010, 136, 23–33. [Google Scholar] [CrossRef]
- Montufar, J.; Arango, J.; Porter, M.; Nakagawa, S. Pedestrians’ normal walking speed and speed when crossing a street. Transp. Res. Rec. 2007, 2002, 90–97. [Google Scholar] [CrossRef]
- Gates, T.J.; Noyce, D.A.; Bill, A.R.; Van Ee, N. Recommended walking speeds for timing of pedestrian clearance intervals based on characteristics of the pedestrian population. Transp. Res. Rec. 2006, 1982, 38–47. [Google Scholar] [CrossRef]
- Rastogi, R.; Thaniarasu, I.; Chandra, S. Design implications of walking speed for pedestrian facilities. J. Transp. Eng. 2010, 137, 687–696. [Google Scholar] [CrossRef]
- Nasar, J.; Hecht, P.; Wener, R. Mobile telephones, distracted attention, and pedestrian safety. Accid. Anal. Prev. 2008, 40, 69–75. [Google Scholar] [CrossRef] [PubMed]
- Schwebel, D.C.; Stavrinos, D.; Byington, K.W.; Davis, T.; O’Neal, E.E.; De Jong, D. Distraction and pedestrian safety: How talking on the phone, texting, and listening to music impact crossing the street. Accid. Anal. Prev. 2012, 45, 266–271. [Google Scholar] [CrossRef] [PubMed]
- Sharifi, M.S.; Stuart, D.; Christensen, K.; Chen, A.; Kim, Y.S.; Chen, Y. Analysis of walking speeds involving individuals with disabilities in different indoor walking environments. J. Urban Plan. Dev. 2015, 142, 04015010. [Google Scholar] [CrossRef]
- Pecchini, D.; Giuliani, F. Street-crossing behavior of people with disabilities. J. Transp. Eng. 2015, 141, 04015022. [Google Scholar] [CrossRef]
- Song, L.; Chang, Y.L.; Zhang, P.; Zhang, R. Analysis of pedestrian crossing speed in unsignalized controlled sections. J. Highway Transp. Res. Dev. (Eng. Ed.) 2016, 10, 83–88. [Google Scholar] [CrossRef]
- Mako, E. Evaluation of human behaviour at pedestrian crossings. In Proceedings of the 2015 6th IEEE International Conference on Cognitive Infocommunications (CogInfoCom), Gyor, Hungary, 19–21 October 2015. [Google Scholar]
- Hamed, M.M. Analysis of pedestrians’ behavior at pedestrian crossings. Saf. Sci. 2001, 38, 63–82. [Google Scholar] [CrossRef]
- Mustapha, A.; Abdu, A. Application of principal component analysis & multiple regression models in surface water quality assessment. J. Environ. Earth Sci. 2012, 2, 16–23. [Google Scholar]
- Pathak, H. Evaluation of ground water quality using multiple linear regression and mathematical equation modeling. Ann. Univ. Oradea Geogr. Ser. 2012, 2, 304–307. [Google Scholar]
- Osborne, J.; Waters, E. Four assumptions of multiple regression that researchers should always test. Pract. Assess. Res. Eval. 2002, 8, 1–9. [Google Scholar]
- Uyanık, G.K.; Güler, N. A study on multiple linear regression analysis. Procedia Soc. Behav. Sci. 2013, 106, 234–240. [Google Scholar] [CrossRef]
- Tranmer, M.; Elliot, M. Multiple linear regression. Cathie Marsh Cent. Census Surv. Res. (CCSR) 2008, 5, 30–35. [Google Scholar]


| Country | Mean Walking Speed (m/s) |
|---|---|
| Asia | |
| Riyadh, Saudi Arabia | 1.08 |
| Madras, India | 1.20 |
| Hong Kong | 1.20 |
| Thailand | 1.22 |
| Singapore | 1.23 |
| Colombo, Sri Lanka | 1.25 |
| Israel | 1.39 |
| Malaysia | 1.31 |
| Jordan | 1.34 |
| United States | |
| Columbia | 1.32 |
| New York | 1.35 |
| Pittsburgh | 1.47 |
| Others | |
| England | 1.32 |
| Calgary, Canada | 1.40 |
| Speed (m/s) | ||
|---|---|---|
| Mean | 1.265 | |
| Median | 1.259 | |
| Mode | 1.000 | |
| Std. Deviation | 0.337 | |
| Minimum | 0.357 | |
| Maximum | 2.566 | |
| Percentiles | 15 | 0.939 |
| 50 | 1.259 | |
| 85 | 1.574 | |
| Variable | N | Mean | Std. Dev. | Statistical Test Details |
|---|---|---|---|---|
| Intersection Control Type | ||||
| Signalized | 208 | 1.39 | 0.27 | F = 40.138 p = 0.000 |
| Police-controlled | 142 | 1.27 | 0.27 | |
| Unsignalized | 198 | 1.08 | 0.26 | |
| Tukey Post Hoc Test (Levence Statistic: p-value = 0.731) | ||||
| Signalized vs. Police-controlled: p = 0.000, Signalized vs. Unsignalized: p = 0.000, and Unsignalized vs. Police-controlled: p = 0.000 | ||||
| Gender | ||||
| Male | 444 | 1.28 | 0.30 | t = −6.363 p = 0.000 |
| Female | 104 | 1.10 | 0.24 | |
| Age | ||||
| Children | 14 | 1.11 | 0.33 | F = 15.961 p = 0.000 |
| Young | 330 | 1.30 | 0.29 | |
| Adult | 178 | 1.19 | 0.29 | |
| Old | 26 | 0.95 | 0.21 | |
| Tukey post hoc test (Levence statistic: p-value = 0.084) | ||||
| Young vs. children: p = 0.073, young vs. adult: p = 0.000, young vs. old: p = 0.000, adult vs. children: p = 0.724, adult vs. old: p = 0.000, and children vs. old: p = 0.359 | ||||
| Crossing Stage | ||||
| Single stage | 198 | 1.38 | 0.24 | F = 44.480 p = 0.000 |
| Two stage | 86 | 1.27 | 0.24 | |
| Rolling gap | 264 | 1.13 | 0.31 | |
| Games–Howell post hoc test (Levence statistic: p-value = 0.001) | ||||
| Single stage vs. two stage: p = 0.003, single stage vs. rolling gap: p = 0.000, and two stage vs. rolling gap: p = 0.000 | ||||
| Crossing Pattern | ||||
| Walking | 422 | 1.21 | 0.27 | t = 4.124 p = 0.000 |
| Running | 126 | 1.35 | 0.35 | |
| Crossing Direction | ||||
| Perpendicular | 300 | 1.28 | 0.27 | F = 4.245 p = 0.017 |
| Oblique | 42 | 1.21 | 0.37 | |
| Mixed | 206 | 1.20 | 0.32 | |
| Games–Howell post hoc test (Levence statistic: p-value = 0.000) | ||||
| Perpendicular vs. oblique: p = 0.496, perpendicular vs. mixed: p = 0.013, and oblique vs. mixed: p = 0.987 | ||||
| Crossing Group Size | ||||
| Alone | 380 | 1.29 | 0.30 | t = 4.928, p = 0.000 |
| Group | 168 | 1.15 | 0.28 | |
| Baggage Handling | ||||
| No | 362 | 1.27 | 0.29 | F = 5.964, p = 0.003 |
| Light | 164 | 1.20 | 0.29 | |
| Medium | 22 | 1.10 | 0.36 | |
| Tukey post hoc test (Levence statistic: p-value = 0.365) | ||||
| No vs. light: p = 0.034, no vs. medium: p = 0.020, and light vs. medium: p = 0.261 | ||||
| Mobile Usage | ||||
| Yes | 14 | 1.34 | 0.36 | t = −1.210 p = 0.227 |
| No | 534 | 1.24 | 0.30 | |
| Compliance with Control Direction | ||||
| Full | 136 | 1.34 | 0.21 | F = 31.554 p = 0.000 |
| Partial | 140 | 1.35 | 0.29 | |
| No | 272 | 1.15 | 0.31 | |
| Games–Howell post hoc test (Levence statistic: p-value = 0.000) | ||||
| No vs. partial: p = 0.000, No vs. full: p = 0.000, and full vs. partial: p = 0.928 | ||||
| Crossing Location | ||||
| Crosswalk | 124 | 1.27 | 0.22 | F = 28.778 p = 0.000 |
| Near crosswalk | 104 | 1.42 | 0.28 | |
| Conflict zone | 318 | 1.18 | 0.31 | |
| Games–Howell post hoc test (Levence statistic: p-value = 0.000) | ||||
| Crosswalk vs. near crosswalk: p = 0.000, crosswalk vs. conflict zone: p = 0.009, and near crosswalk vs. conflict zone: p = 0.000 | ||||
| Vehicle Flow | ||||
| Vehicle flow | 548 | τb = −0.240 p = 0.000 | ||
| R | R Square | Adjusted R Square | Std. Error of the Estimate |
|---|---|---|---|
| 0.625 | 0.391 | 0.376 | 0.240 |
| Sum of Squares | df | Mean Square | F | Sig. | |
|---|---|---|---|---|---|
| Regression | 19.757 | 013 | 1.520 | 26.385 | 0.000 |
| Residual | 30.759 | 534 | 0.058 | ||
| Total | 50.516 | 547 |
| Variables | Coef. | Std. Error | t | p-Value |
|---|---|---|---|---|
| Constant | 0.862 | 0.121 | 7.112 | 0.000 |
| Intersection Control Type | ||||
| Signalized (if signalized = 1, otherwise = 0) | 0.325 | 0.047 | 6.978 | 0.000 |
| Traffic-police-controlled (TPC) (if TPC = 1, otherwise = 0) | 0.254 | 0.036 | 7.068 | 0.000 |
| Gender | ||||
| Gender (if male = 1, otherwise = 0) | 0.116 | 0.028 | 4.158 | 0.000 |
| Age | ||||
| Adult (if adult = 1, otherwise = 0) | −0.032 | 0.023 | −1.382 | 0.167 |
| Old (if old = 1, otherwise = 0) | −0.166 | 0.051 | −3.280 | 0.001 |
| Crossing Type | ||||
| Single-stage (if single-stage = 1, otherwise = 0) | 0.186 | 0.048 | 3.864 | 0.000 |
| Two-stage (if two-stage = 1, otherwise = 0) | 0.098 | 0.049 | 1.977 | 0.049 |
| Crossing pattern (if walk = 1, otherwise = 0) | −0.075 | 0.014 | −5.247 | 0.000 |
| Crossing Group Size | ||||
| Crossing group (if group = 1, otherwise = 0) | −0.106 | 0.025 | −4.216 | 0.000 |
| Compliance Behavior | ||||
| Full compliance (if full compliance = 1, otherwise = 0) | 0.188 | 0.056 | 3.364 | 0.001 |
| Partial compliance (if partial compliance = 1, otherwise = 0) | 0.166 | 0.052 | 3.198 | 0.001 |
| Others | ||||
| Crossing location (if near crosswalk = 1, otherwise = 0) | 0.063 | 0.030 | 2.080 | 0.038 |
| Baggage handling (if handle = 1, otherwise = 0) | −0.030 | 0.022 | −1.344 | 0.180 |
| Variable | N | Mean | Std. Dev. | Statistical Test Details |
|---|---|---|---|---|
| Intersection Control Type | ||||
| Signalized | 218 | 8.33 | 16.43 | χ2 = 57.504 p = 0.000 |
| Police controlled | 142 | 25.32 | 28.31 | |
| Unsignalized | 200 | 11.30 | 12.62 | |
| Signalized vs. police-controlled: p = 0.000, signalized vs. unsignalized: p = 0.000, and unsignalized vs. police-controlled: p = 0.011 | ||||
| Gender | ||||
| Male | 456 | 13.21 | 20.82 | U = 19,764 p = 0.007 |
| Female | 104 | 15.83 | 17.65 | |
| Age | ||||
| Children | 014 | 16.14 | 10.56 | χ2 = 43.847 p = 0.000 |
| Young | 342 | 10.15 | 16.69 | |
| Adult | 178 | 18.00 | 23.65 | |
| Old | 026 | 29.53 | 28.46 | |
| Young vs. children: p = 0.005, young vs. adult: p = 0.000, young vs. old: p = 0.000, adult vs. children: p = 0.254, adult vs. old: p = 0.014, and children vs. old: p = 0.460 | ||||
| Crossing Group Size | ||||
| Alone | 392 | 10.17 | 16.03 | U = 24814, p = 0.000 |
| Group | 168 | 21.92 | 26.03 | |
| Minimum Gap | ||||
| Small (0- 3 s) | 276 | 11.48 | 16.20 | χ2 = 92.720 p = 0.000 |
| Medium (3-6 s) | 148 | 22.82 | 25.34 | |
| Large (>6 s) | 136 | 8.27 | 18.41 | |
| Small vs. medium: p = 0.000, medium vs. large: p = 0.000, and small vs. large: p = 0.000 | ||||
| Waiting Location | ||||
| Sidewalk | 90 | 32.81 | 27.01 | U = 3266.00 p = 0.014 |
| On road | 94 | 21.81 | 23.09 | |
| Compliance with Control Direction | ||||
| Full | 138 | 7.69 | 17.91 | χ2 = 100.280 p = 0.000 |
| Partial | 148 | 13.20 | 21.51 | |
| No | 274 | 16.99 | 20.07 | |
| No vs. partial: p = 0.000, no vs. full: p = 0.000, and full vs. partial: p = 0.000 | ||||
| Vehicle Flow | ||||
| Vehicle flow | 560 | τb = 0.408 p = 0.000 | ||
| R | R Square | Adjusted R Square | Std. Error of the Estimate |
|---|---|---|---|
| 0.713 | 0.508 | 0.500 | 0.986 |
| Sum of Squares | df | Mean Square | F | Sig. | |
|---|---|---|---|---|---|
| Regression | 553.32 | 9 | 61.48 | 63.13 | 0.000 |
| Residual | 535.56 | 550 | 0.97 | ||
| Total | 1088.88 | 559 |
| Variables | Coef. | Std. Error | t | p-Value |
|---|---|---|---|---|
| Constant | −3.000 | 0.510 | −5.87 | 0.000 |
| Intersection Control Type | ||||
| Signalized (if signalized = 1, otherwise = 0) | 0.958 | 0.153 | 6.24 | 0.000 |
| Traffic-police-controlled (TPC) (if TPC = 1, otherwise = 0) | 0.682 | 0.139 | 4.89 | 0.000 |
| Gender | ||||
| Gender (if male = 1, otherwise = 0) | −0.408 | 0.110 | −3.71 | 0.000 |
| Age | ||||
| Adult (if adult = 1, otherwise = 0) | 0.208 | 0.093 | 2.23 | 0.026 |
| Old (if old = 1, otherwise = 0) | 0.715 | 0.208 | 3.44 | 0.001 |
| Minimum Gap | ||||
| Small (if small = 1, otherwise = 0) | 0.126 | 0.142 | 0.88 | 0.376 |
| Medium (if medium = 1, otherwise = 0) | 0.410 | 0.137 | 3.00 | 0.003 |
| Others | ||||
| Waiting location (if sidewalk = 1, otherwise = 0) | 0.812 | 0.122 | 6.64 | 0.000 |
| Vehicle flow | 0.021 | 0.001 | 13.9 | 0.000 |
© 2019 by the authors. Licensee MDPI, Basel, Switzerland. This article is an open access article distributed under the terms and conditions of the Creative Commons Attribution (CC BY) license (http://creativecommons.org/licenses/by/4.0/).
Share and Cite
Zafri, N.M.; Rony, A.I.; Adri, N. Analysis of Pedestrian Crossing Speed and Waiting Time at Intersections in Dhaka. Infrastructures 2019, 4, 39. https://doi.org/10.3390/infrastructures4030039
Zafri NM, Rony AI, Adri N. Analysis of Pedestrian Crossing Speed and Waiting Time at Intersections in Dhaka. Infrastructures. 2019; 4(3):39. https://doi.org/10.3390/infrastructures4030039
Chicago/Turabian StyleZafri, Niaz Mahmud, Atikul Islam Rony, and Neelopal Adri. 2019. "Analysis of Pedestrian Crossing Speed and Waiting Time at Intersections in Dhaka" Infrastructures 4, no. 3: 39. https://doi.org/10.3390/infrastructures4030039
APA StyleZafri, N. M., Rony, A. I., & Adri, N. (2019). Analysis of Pedestrian Crossing Speed and Waiting Time at Intersections in Dhaka. Infrastructures, 4(3), 39. https://doi.org/10.3390/infrastructures4030039