1. Introduction
The subsurface infrastructure is fundamental and essential to the functioning of modern cities and urban areas. The subsurface infrastructure comprises many types of chambers and related components and piping broadly classifiable as open or isolated systems. Open systems contain structures interconnected by piping. The sanitary and storm water collection systems are examples of open systems in which flow of water occurs through piping between manholes and other structures. These systems can share the same atmosphere because of migration through the airspace above the liquid. Some subsurface structures are isolated from each other by design. Isolated subsurface structures lack contact with other structures. The potable water supply system contains many examples of isolated subsurface structures. Isolation also can involve sections of interconnected structures. Isolation of sections of interconnected structures is usually a temporary measure.
Many, if not all, of the structures described in the previous discussion meet generally accepted criteria for classification as confined spaces [
1]. Confined spaces are typically structures in which people do not or cannot routinely work and are not designed for entry and work. However, because of the need to perform activity in these structures, they become workspaces. Opening these structures to gain access introduces the potential for contact with unrecognized and unanticipated hazardous conditions and elevated risk of death through overexposure to hazardous atmospheric contaminants and fire and explosion.
Exchange of the atmosphere in the airspace of an isolated subsurface structure with the external atmosphere can occur unhindered only through the opening(s) in access manhole covers and hatches. Little, if any, investigation occurs about ventilation induced by natural forces in isolated subsurface structures. Casual inquiry of individuals and groups trained in occupational health and safety and confined spaces yields the collective opinion that natural ventilation of the airspaces in these structures does not occur. However, investigators at the Bureau of Mines showed, in 1936, the occurrence of air exchange induced by natural forces between the external atmosphere and the atmosphere in the airspace of isolated subsurface structures [
2]. This critically important work was lost for decades and became accessible only recently, following digitization of library catalogs and the documents, and listing on Internet search engines. The published literature is silent on follow-up work on this subject.
This article is one of a series that report on a study of air exchange between the airspace of an isolated subsurface structure and the external atmosphere induced by natural forces through opening(s) in the manhole cover. The first article [
3] provided considerable additional information concerning recent fatal accidents in similar structures and the absolute necessity for defined path(s) for air exchange. The second article [
4] reviewed the existing literature on ventilation of isolated subsurface structures induced by natural forces. The literature is very sparse and widely distributed in time and contains considerable unrecognized critically important information previously lost in obscurity about the basics of the subject. The third article [
5] reported on unusual observable characteristics of near-surface air flow and their possible influence on ventilation of isolated subsurface structures through defined paths connecting the airspace to the external atmosphere. Additional articles in the series (manuscripts submitted for review, not yet cited) discuss considerations involved in obtaining a real-world atmosphere suitable for studying this type of air exchange; video recording showing air movement outside and inside the structure that illustrates exactly how ventilation induced by natural forces occurs; development of methodology incorporating risk minimization to study evaporation of an ignitable volatile liquid; and characteristics of the contaminated atmosphere produced during evaporation of an ignitable volatile liquid.
Processes occurring outside and inside isolated subsurface structures with the ability to create contaminated atmospheres include consumption of oxygen through chemical and biochemical processes; entry of gases and vapors from the exterior and from the surrounding soil along subsurface pathways; production of vapors and gases through evaporation of volatile liquids and solids; and chemical and biochemical processes [
1]. Ventilation of these structures involves several processes; namely, production of contaminant at a source; dispersion of the contaminant within the airspace; transfer to the point of exchange; and exchange of contaminated air in the airspace with uncontaminated air in the exterior atmosphere. Study of evaporation from introduction of volatile liquid or solid into the space to vapor or gas production, to dispersion into the airspace, to transfer to the point of exchange, and exchange with the external atmosphere, is complex. Several processes can occur simultaneously with overlapping start and stop times.
This article reports on an investigation of several parts of the process mentioned above through behavior of an initially thoroughly well-mixed contaminated atmosphere and exchange at defined paths through opening(s) in the manhole cover. The concept examined in this article, while relatively straightforward and fundamental to the safety of many people worldwide, has received little, if any, attention in the literature. Based on work performed by investigators at the Bureau of Mines [
2], the concentration of contaminant, initially a thoroughly and well-mixed mixture but not replenished, would decrease with time from a maximum level to zero. The process of air exchange reflected through concentration of contaminant at different locations throughout the airspace is not known.
Following is a summary of information available in the literature on considerations involved in the conception and preparation of a test system for study of this phenomenon. Investigators at the Bureau of Mines utilized a slightly pressurized distribution system to deliver fuel gas or CO
2 as a detectable tracer into the airspace to create a uniform mixture with constant concentration [
2,
6,
7,
8]. The mixture emitted from the opening(s) in the manhole cover. Wiegand and Dunne [
9] prepared a thoroughly well-mixed mixture of N
2O in the airspace of a subsurface telecommunications vault. In some tests, they removed the manhole cover and monitored the decrease in concentration in the airspace. In other tests, they positioned a vertical baffle into the center of manhole. The baffle projected above the plane of the ground and above the floor of the structure. The former situation is equivalent to what occurs on removal of the manhole cover during real-world preparation for entry. Wiegand and Dunne [
9] showed that the concentrated atmosphere in the airspace emits rapidly on opening the manhole cover. Sudden contact with atmospheres contained in isolated subsurface structures has caused incidents resulting from fatal overexposure and explosion and fire [
10,
11,
12,
13,
14]. Hence, optimizing ventilation induced by natural forces offers the potential to reduce imposed risk by reducing the concentration of contamination in the atmosphere trapped in the airspace of the structure during the period between entry and work. This article reports on tests performed to study the factors involved in ventilation in isolated subsurface structures not reported in other discussions in the literature.
Ventilation is a kinetic process involving the movement of air from one location to another. Laidler [
15] provided a concise description of the concepts of kinetic processes. Kinetic processes generally follow rate laws or equations. McManus [
16] examined the data of Wiegand and Dunne [
9] using the curve-fitting function in Microsoft Excel (Microsoft Corporation, Redmond, WA) and showed that the decrease in concentration of the mixture from the open manhole without the baffle strongly followed a first-order (time-dependent) kinetic process [
16]. The rate of a kinetic process derives from differentiation of the concentration versus time curve [
15]. A zero-order process is independent of time and a first order process contains a first power, time-dependent term. Data for ventilation involving use of the baffle [
9] showed strongly zero-order behavior (very steep linear slope) and some first-order behavior. These mathematical behaviors are also detectable from visual examination of the curves.
An important consideration to be determined by experimentation is the type of mixing that occurs in the airspace of the structure during ventilation. Reactors in chemical engineering primarily function through continuous stirring or plug flow. The continuously stirred-tank reactor contains an impeller to ensure rapid and thorough mixing during introduction and removal of substances [
17]. The concentration of the substance of interest changes uniformly throughout the structure. This indicates rapid and thorough mixing of contents. A rapidly and thoroughly well-mixed airspace is equivalent to a continuously stirred-tank reactor [
18,
19]. The plug flow reactor, by contrast, is a continuous, flowing system of cylindrical geometry containing an inlet and an outlet. An ideal plug flow reactor experiences perfect mixing radially from the center line (uniform mixing in the cross-section and absence of mixing in the axial direction (gradient of concentration occurs along the flow path)). The reaction rate decreases with distance from the inlet as the concentration of reagents decreases and the concentration of the product(s) increases [
20].
2. Materials and Methods
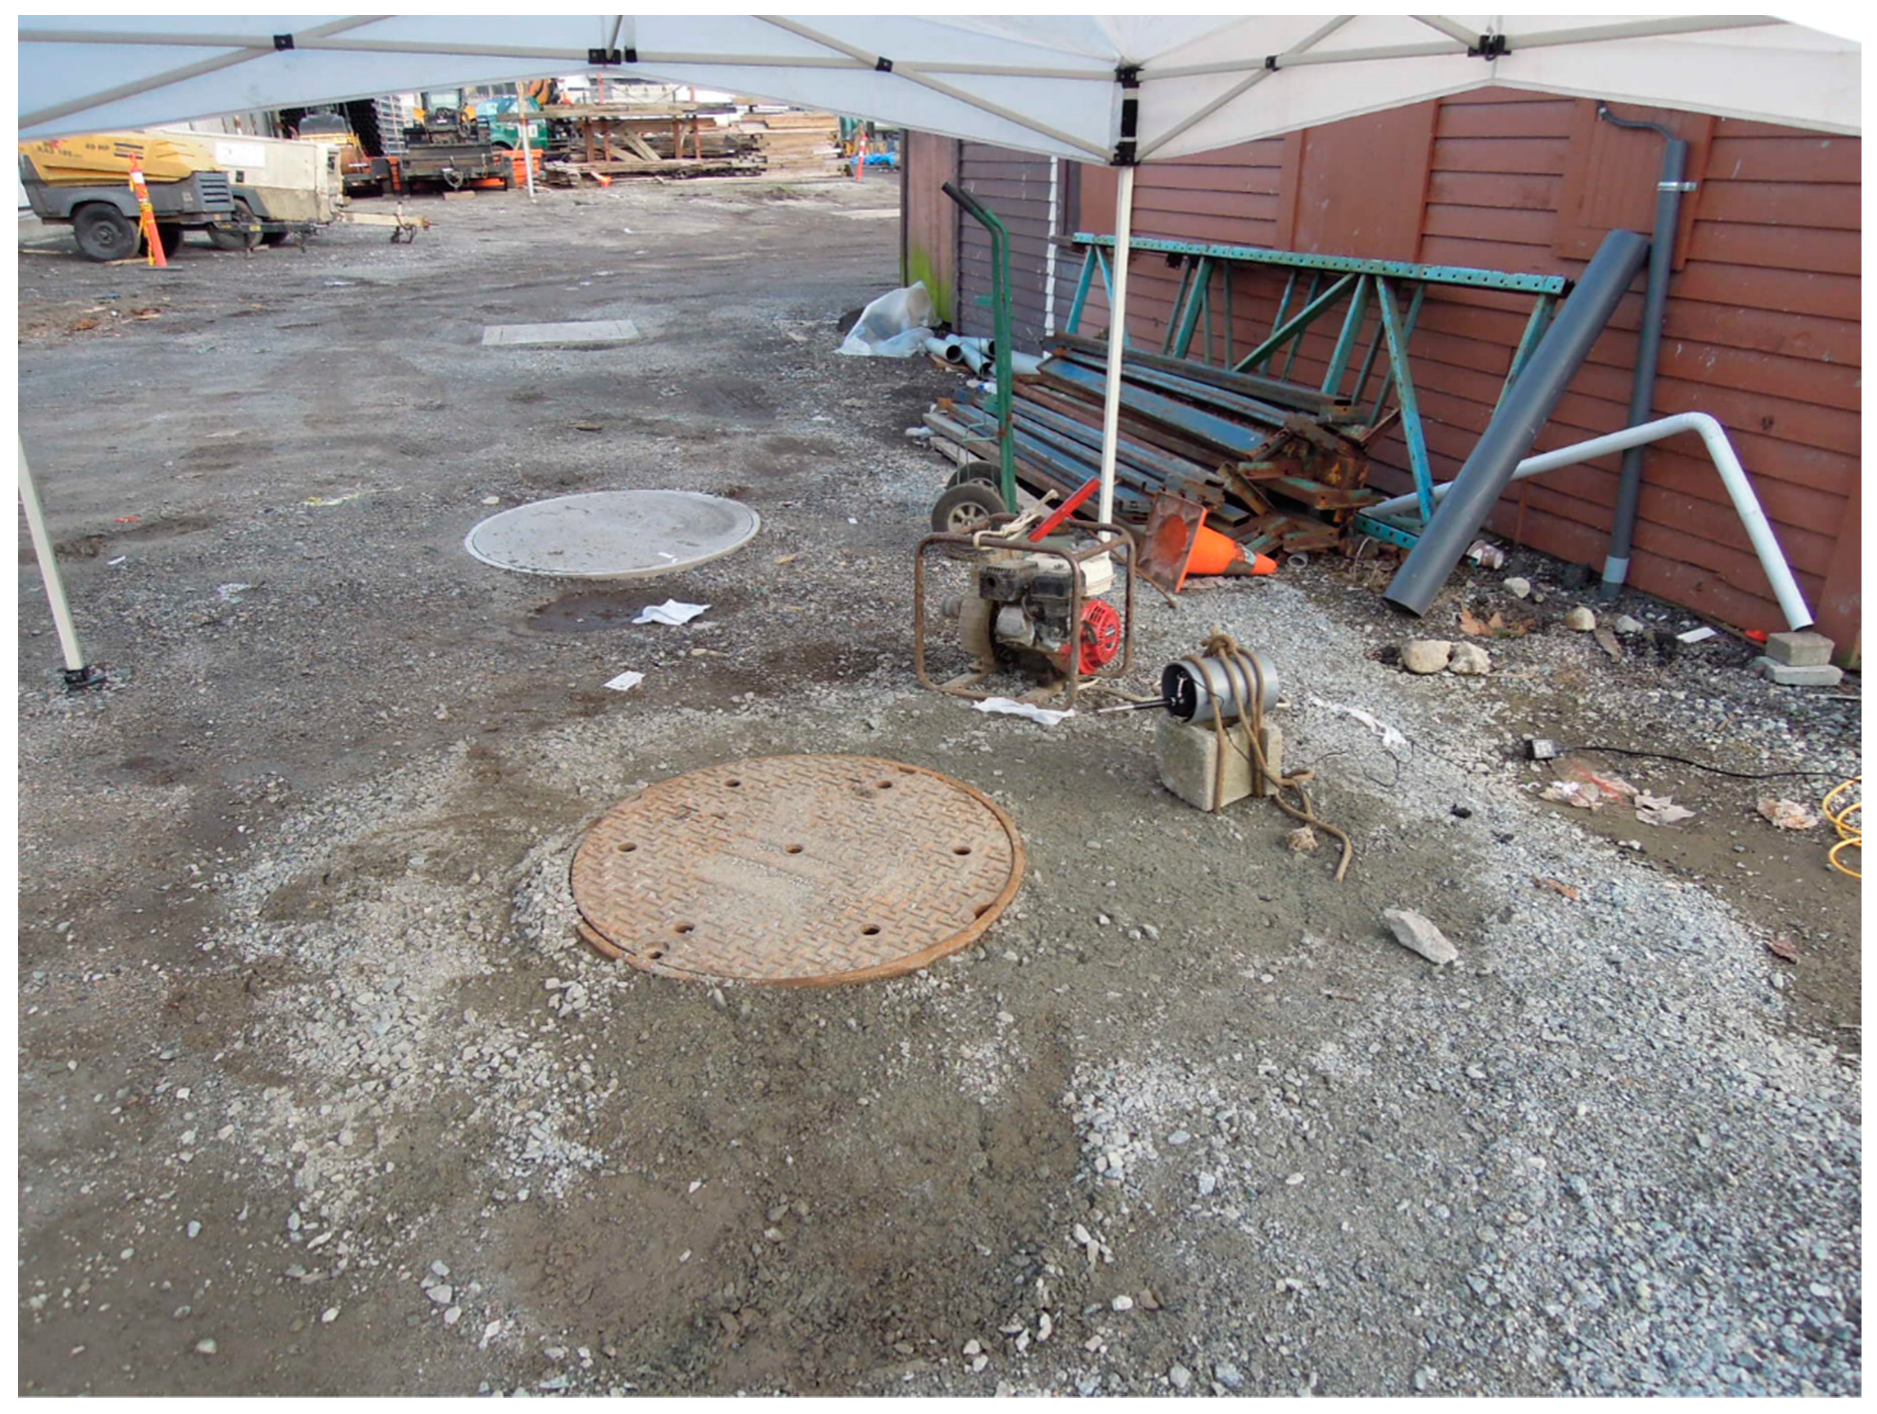
This study occurred in the yard of a construction company located in Vancouver, British Columbia (
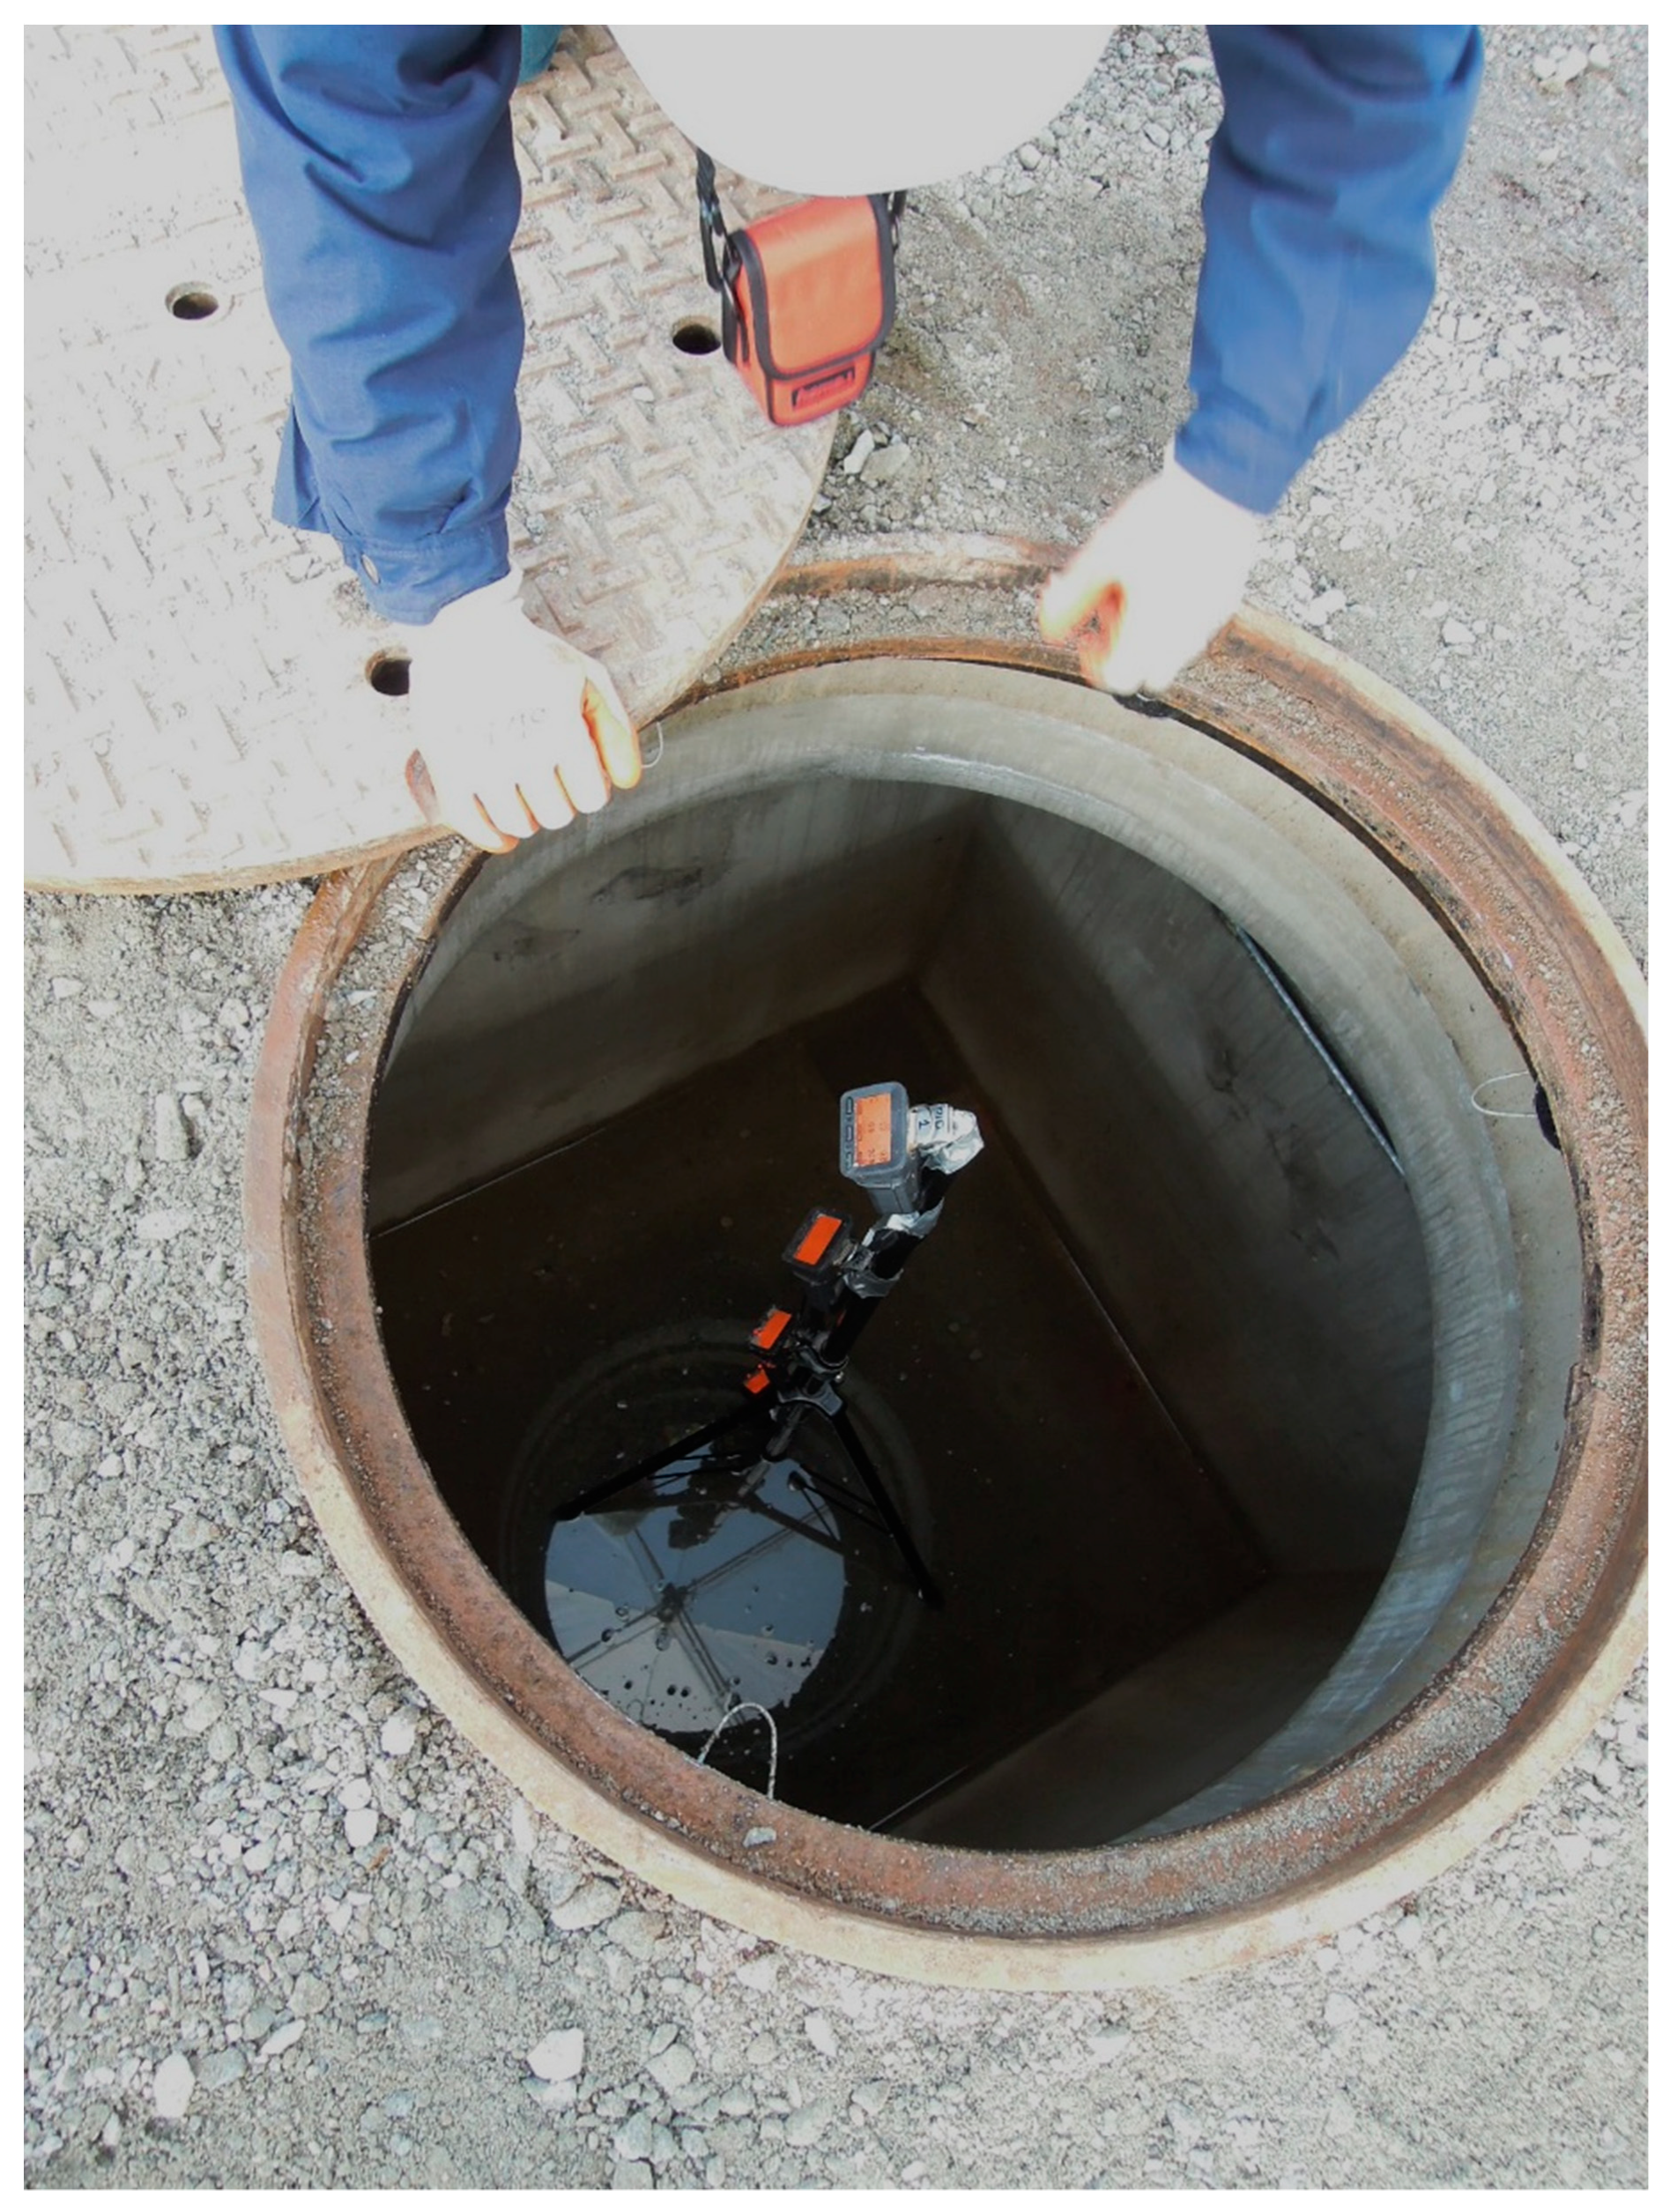
Figure 1) and involved an isolated, subsurface, precast concrete structure measuring about 1.5 m in height with a volume about 2.5 m
3 (
Figure 2). The yard also contained equipment and vehicles used by work crews. Work crews left the yard in the vehicles and equipment early in the morning and returned late in the afternoon.
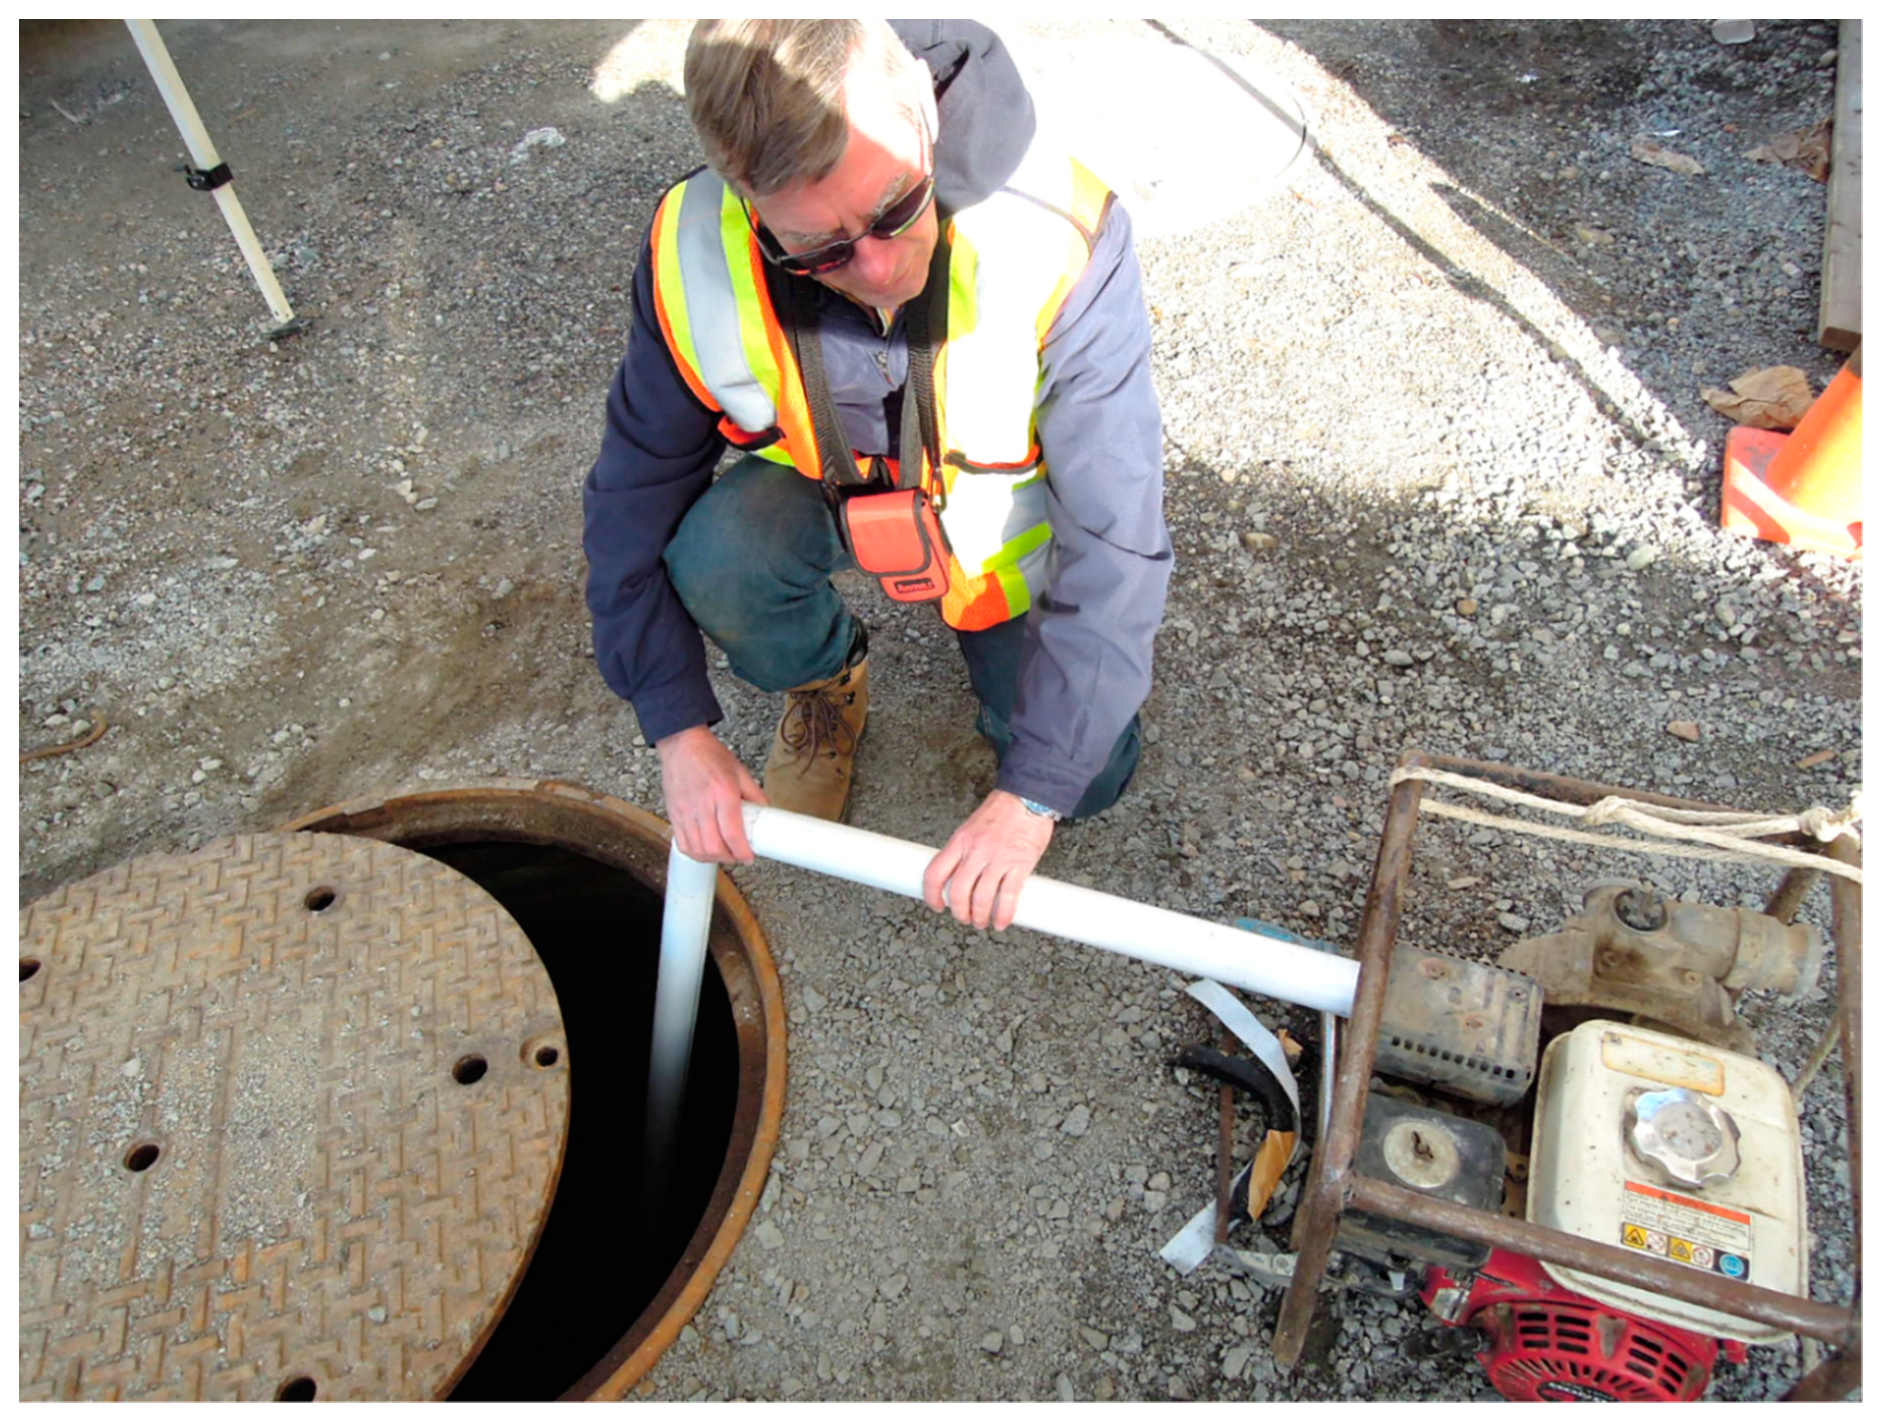
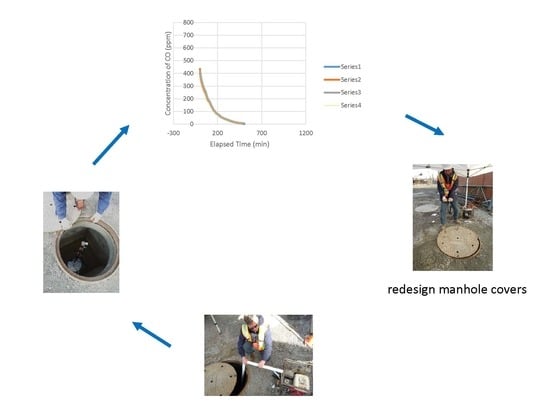
Exhaust gases from a newly started (choke closed immediately), small, single-cylinder Honda gasoline engine (GX120, Honda Engines Group, Alpharetta, GA, USA) operated for periods ranging from 30 s to 3 min were ducted into the space through the partially opened manhole cover to create the contaminated atmosphere (
Figure 3). The system of delivery reflected real-world situations that can occur on worksites during construction and maintenance of these structures. Following introduction of the exhaust gases, the manhole cover was closed and the atmosphere was allowed to stabilize for 15 min. At that time, the manhole cover was removed, and the stand containing four already-operating atmospheric testing instruments and two temperature and relative humidity monitors was positioned inside the space. The manhole cover was replaced immediately afterward, and the space was left undisturbed during the period of testing.
Air monitoring occurred using readily available instruments (GfG 460, GfG Instrumentation Inc., Ann Arbor, MI, USA) containing sensors for oxygen, ignitable substances, carbon monoxide (CO) and hydrogen sulfide (H
2S), and a datalogger. Two of the instruments had sensors for carbon dioxide and two had PID (photo ionization device) sensors for hydrocarbon vapors. This investigation reports only on measurement of CO. Measurement occurred at different heights in the airspace (
Figure 2) over the period of the test. The instruments were calibrated according to recommendations of the manufacturer. The datalogger stored measurements once per minute.
This study commenced in mid-January 2015 and terminated late in February 2016. Testing occurred during the period except from mid-March to mid-May and mid-August to mid-October. These dates provide points of reference within which discussion will occur. The tests started around 07:00 and progressed until the contamination had decreased to ambient level or until the batteries were exhausted, whichever was less. The instruments operated up to 16 h, depending on the number of sensors in use. The tests determined the impact of engine operating time, number/area of openings in the manhole cover, and ambient temperature (not reported here) on the decrease in the concentration of contaminant. Despite measures taken using a canopy to prevent entry of rain and exposure of the work area to the sun, the interior of the structure was typically wet and often contained a thin layer of water during the tests.
The manhole access cover has seven openings, six around the circumference and one in the center (
Figure 1). Openings opposite each other in the circumference were selectively plugged to investigate the role of the area of the openings on exchange of air. For two openings, the center opening and one circumferential opening were also used. The center opening was used for the single opening. The area of the openings were 4579 mm
2, 3528 mm
2, 1937 mm
2, 1276 mm
2, 1321 mm
2, and 616 mm
2 for seven, five, three, two (center and circumference), two (circumference opposite each other), and one opening(s), respectively.
Statistical analysis occurred using IHSTAT, an application for Microsoft Excel (Microsoft Corporation, Redmond, WA, USA) developed and published by the American Industrial Hygiene Association [
21]. IHSTAT determines whether samples are normally or log-normally distributed through goodness of fit tests for determining compliance with regulatory standards and guidance values. AIHA (American Industrial Hygiene Association) [
22] recommends use of the lognormal distribution for data that appear to be lognormally distributed and for data that are better represented statistically as lognormally distributed or represented by both the normal and lognormal distributions. Data presentation in this document reflected this recommendation.
SOFA (Statistics Open For All, Paton-Simpson & Associates, Ltd., Auckland, New Zealand), Version 1.4.6, an open-source program containing various analytical capabilities, was used for statistical comparison of groups of data [
23].
3. Results
Operation of the engine for 30 s raised the concentration of CO in the airspace to 794 ppm, the upper limit of detection, during most months of the year, especially the cooler months in which the engine started cold. The start-up sequence as described in the Method was repeatable from day to day. Engine operating time was carefully timed. The quality of engine exhaust at the beginning of the sample period reflected the ambient temperature at the time of start-up. The engine sat outdoors and started without incident on the first pull of the starter cord except when the temperature decreased below freezing, in which case water residual in the attached pump froze. In circumstances where the engine operated for longer than 30 s, the initial concentration of CO exceeded 794 ppm to an unknown level. Curve-fitting and other activities involving the data occurred only when the concentration of CO began to decrease from 794 ppm. The engine produced less CO in summer than in winter for the same conditions of operation.
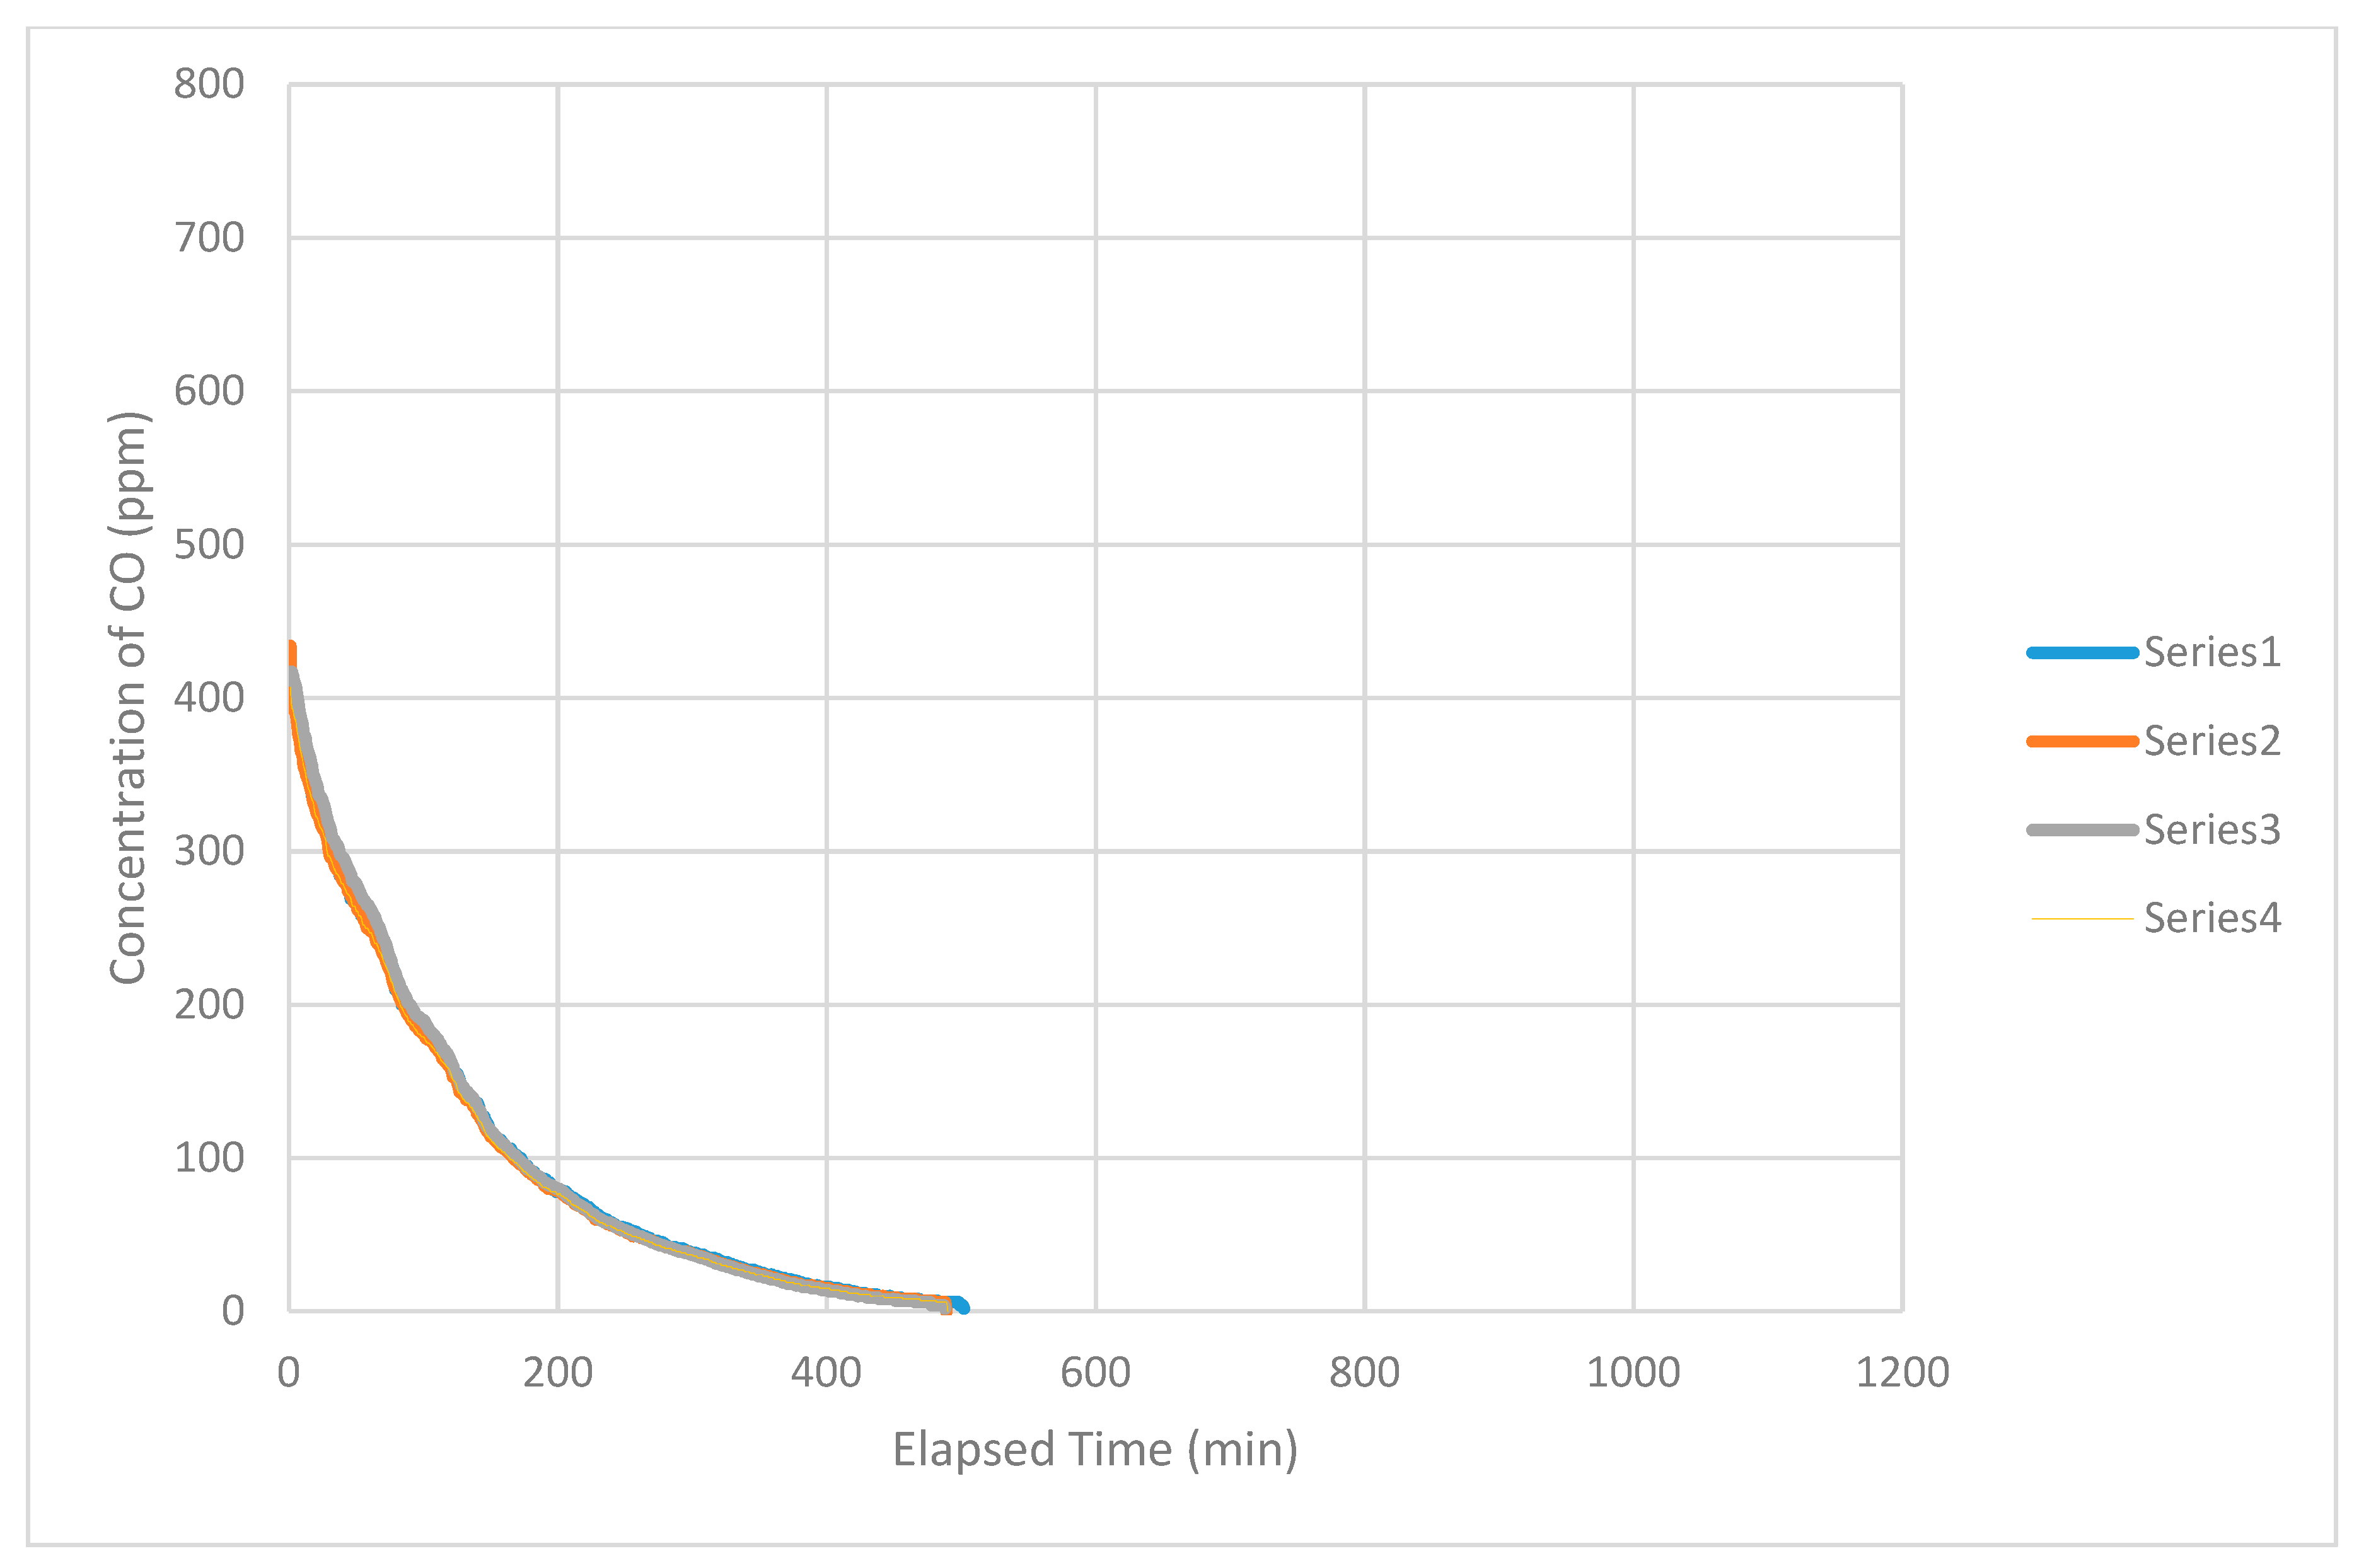
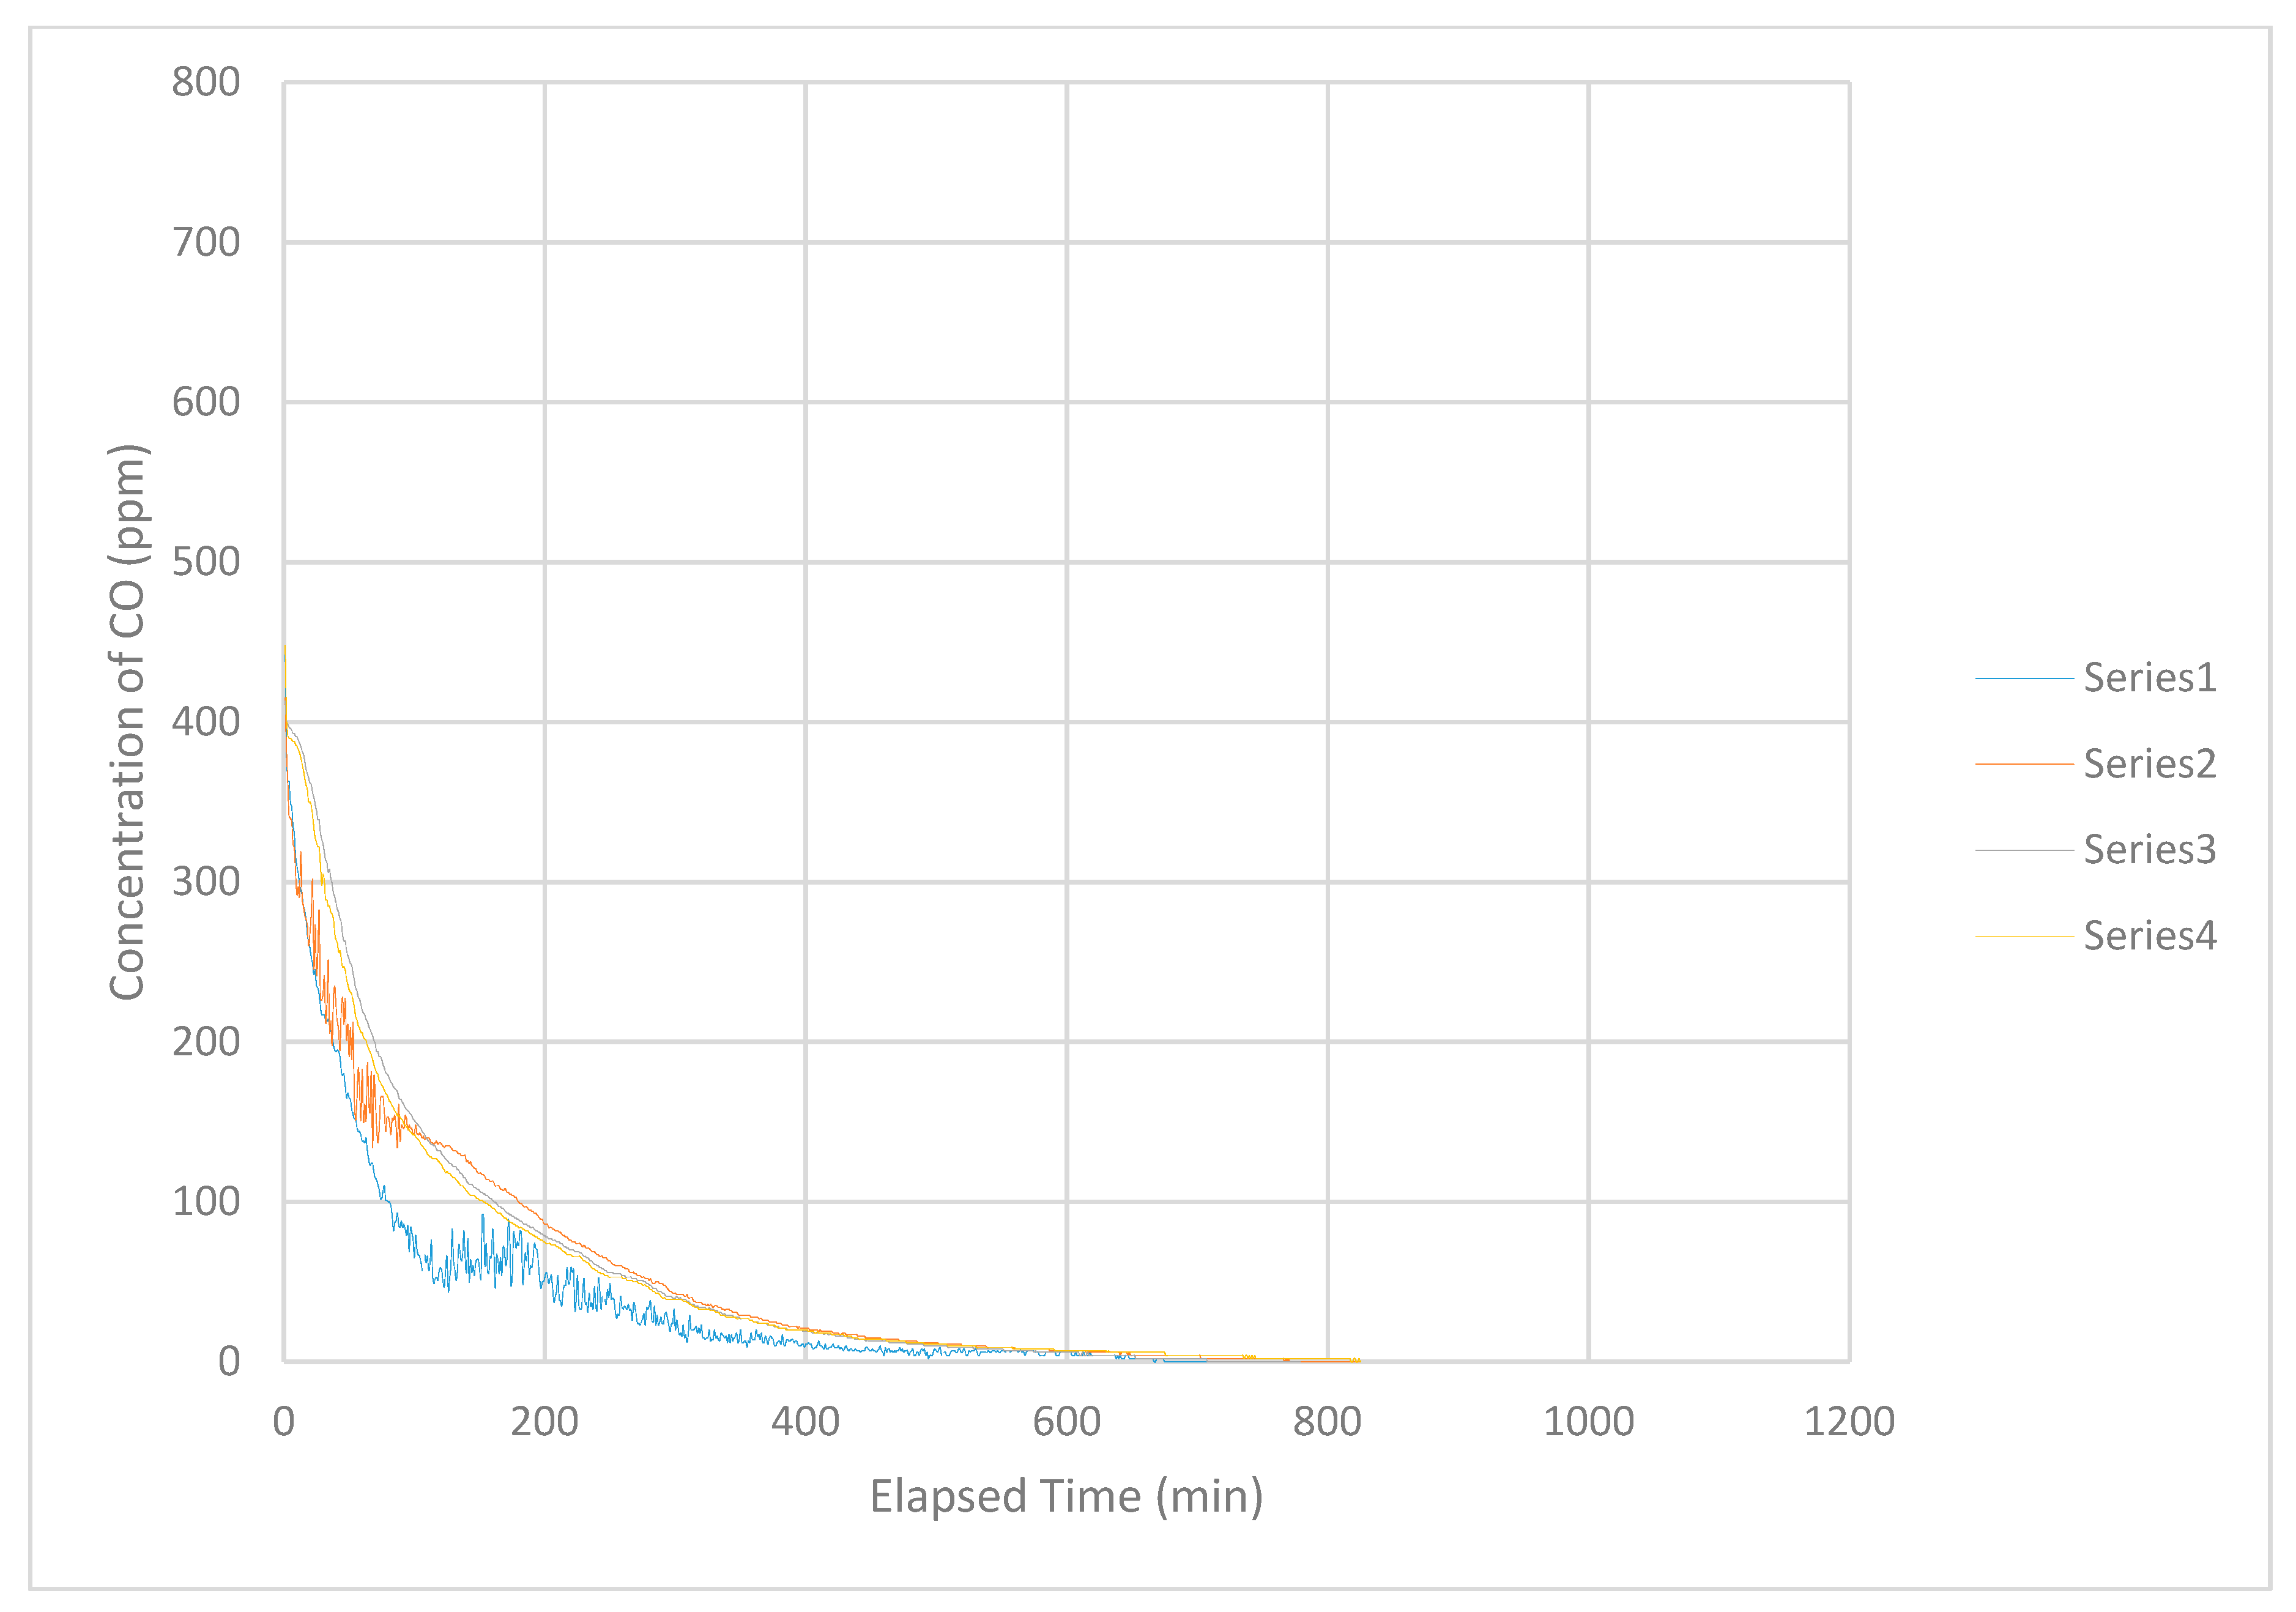
Generally, the concentration of CO obtained from an individual instrument decreased in a smooth curve with increasing time. The readings from the group of instruments decreased in a narrow band during the duration of an individual test (
Figure 4). The curves obtained from individual instruments remained inside the band in the same position relative to each other. Readings from individual instruments generally coalesced with time within the band to form a single line. The concentrations measured by individual instruments rapidly became indistinguishable from each other. That is, concentrations provided by individual instruments rapidly became almost identical numerically at every level in the vertical profile of the airspace at every moment during the period of measurement. Said another way, the concentration provided by one instrument for a particular moment was almost indistinguishable from the concentration provided by the other instruments for the same moment. This is a characteristic of a rapidly well-mixed airspace.
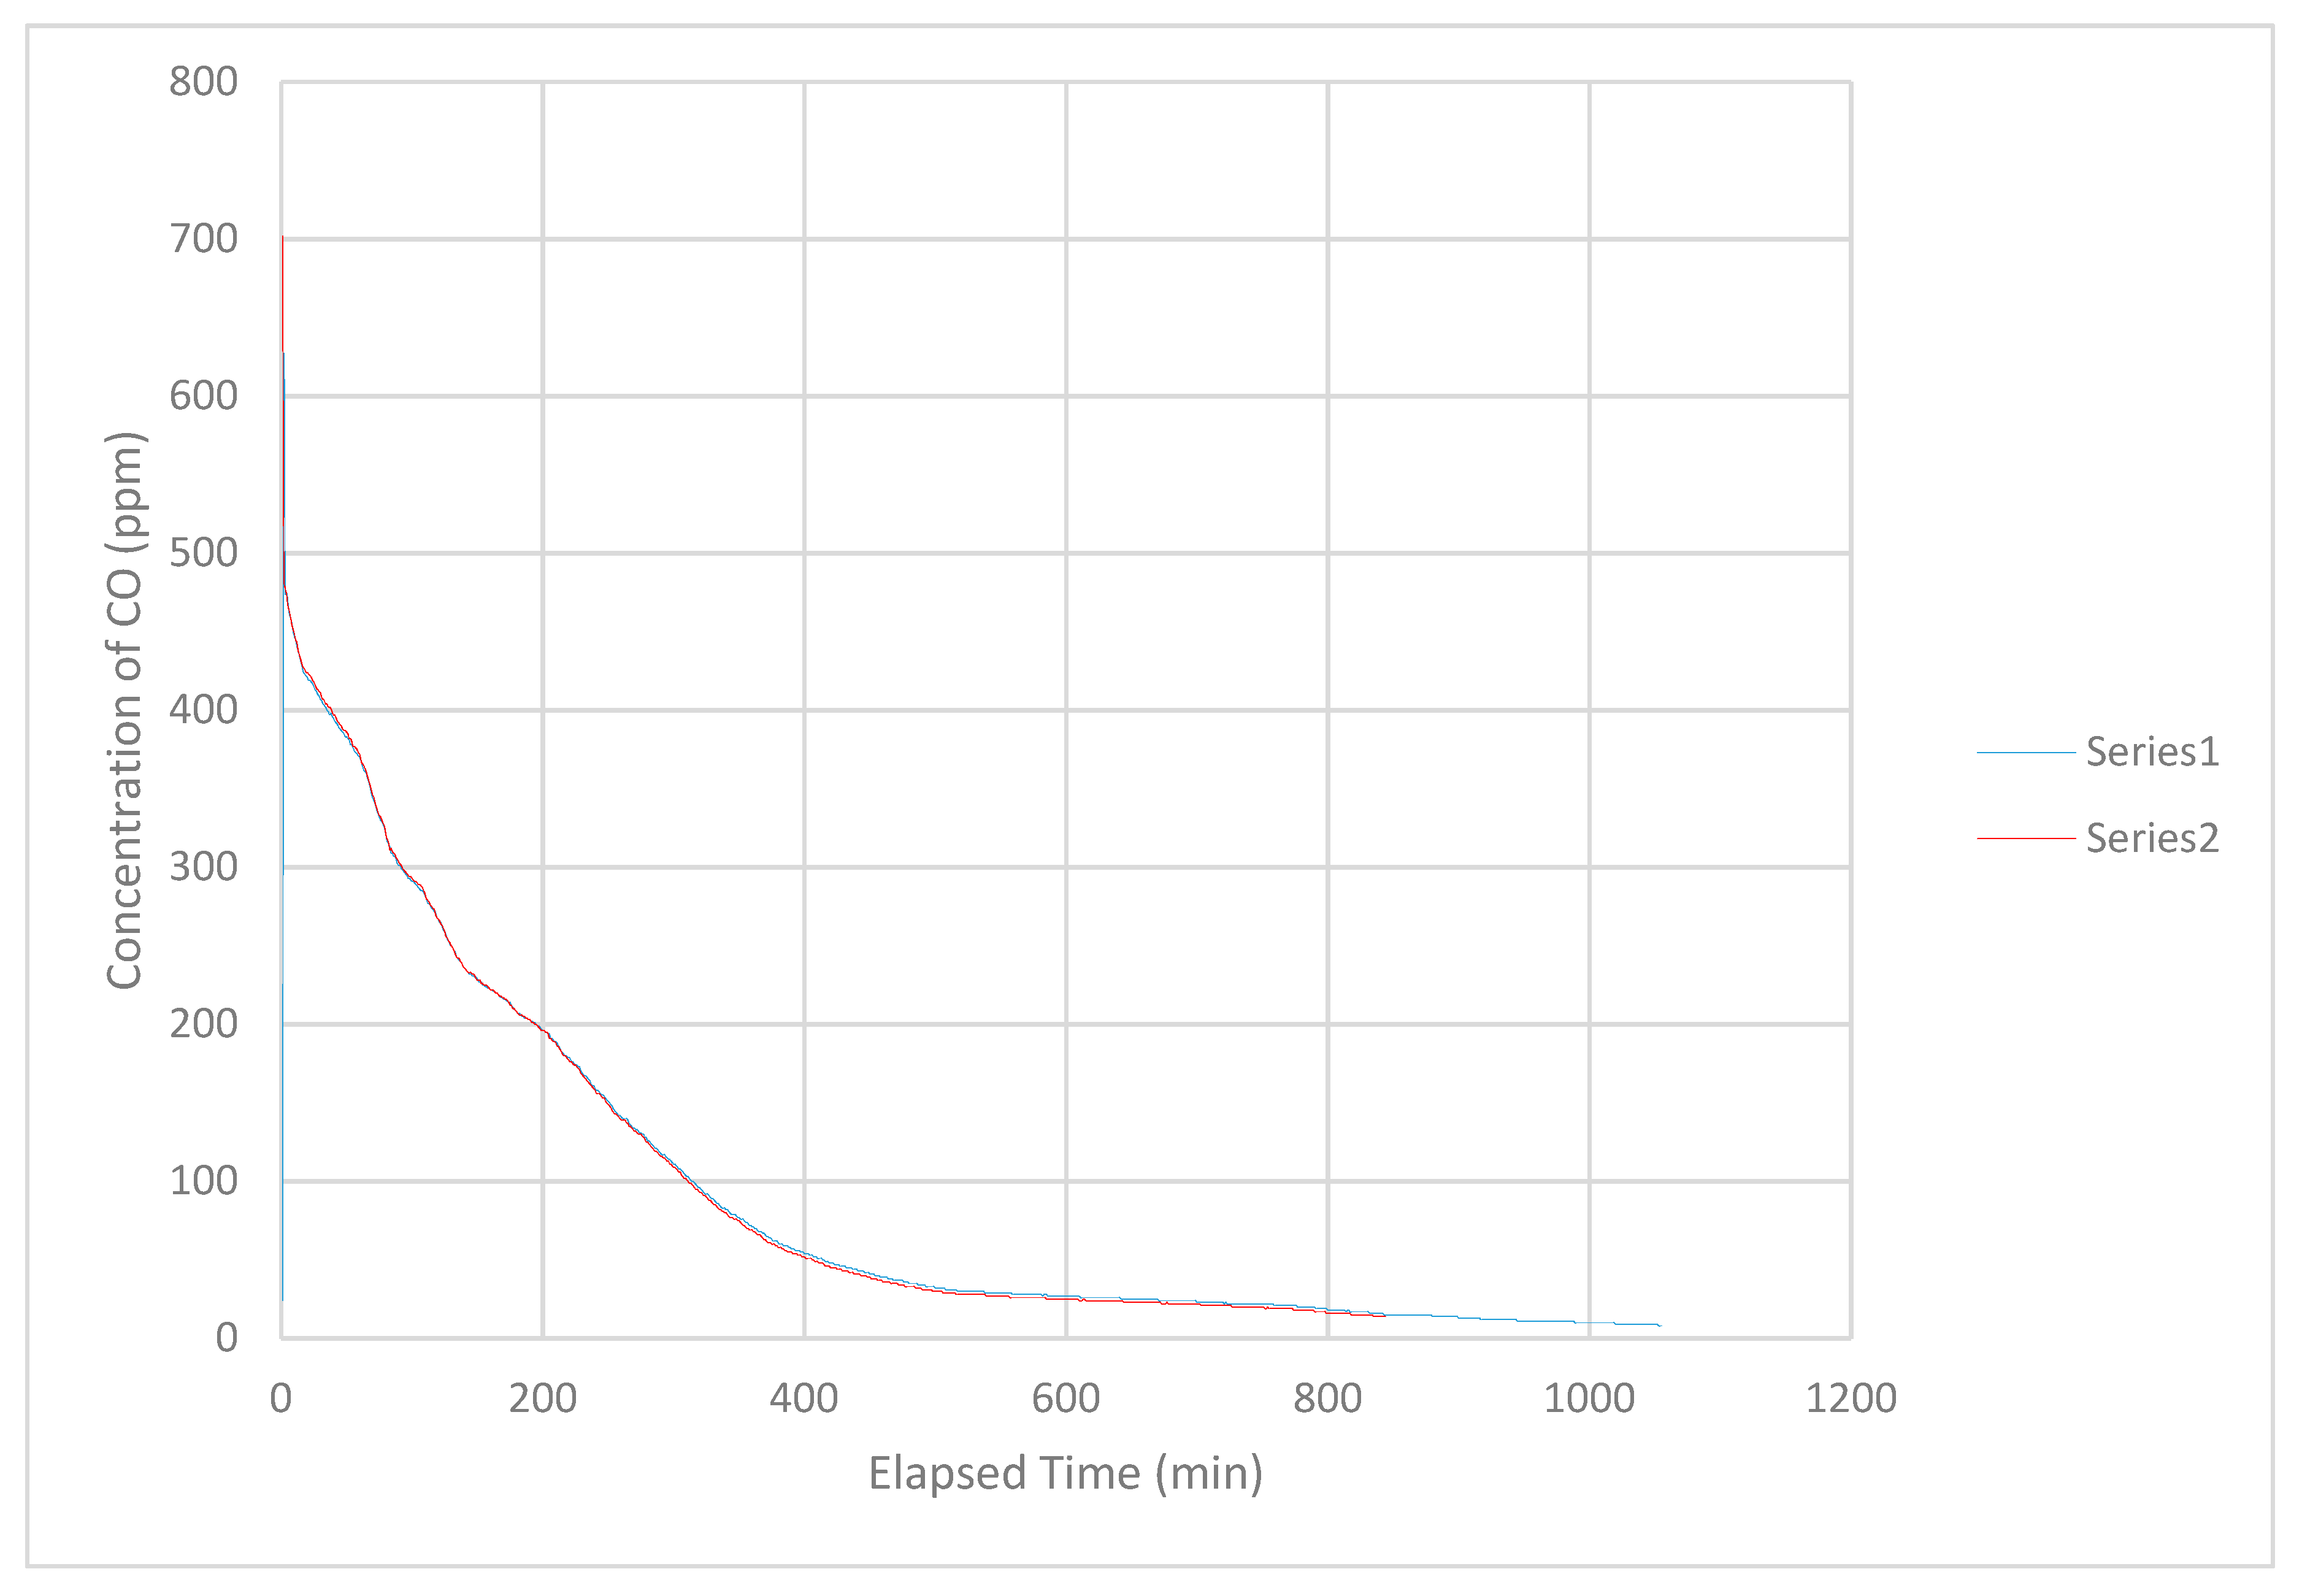
Several exceptions to the general pattern reported above also occurred. During one of the tests in February 2015, the curve produced by the uppermost instrument separated from the band and decreased in concentration. That is, the concentration of CO decreased rapidly at the uppermost level of the airspace even though the curve retained the general shape of the band. In addition, this curve contained jagged sections in which the concentration decreased and increased rapidly, irregularly and unpredictably. This behavior occurred consistently during tests performed in June and July 2015 (
Figure 5). In these cases, the curves produced by the uppermost instrument, sometimes the second-level instrument and occasionally the third-level instrument (third from the top), separated from the usual pattern of a smooth band containing all of the curves. In the cases described here, the curve(s) separated from, and were lower in concentration than, the band and often contained jagged sections throughout. Generally, the overall shape of these curves was similar to that described for ‘normal’ (most frequently observed) behavior. These situations appeared to be related to the occurrence of wind that caused movement of leaves observable at the time. Normally, the area in which this work occurred received little sensible air movement. Air movement becomes sensible at velocity exceeding 0.25 to 0.4 m s
−1 (50 to 80 ft min
−1) [
24].
In some tests, the initial concentration decreased abruptly within the first 2 to 3 min of measurement (
Figure 6). On occasion, the initial concentration decreased more than 200 ppm. There was no obvious explanation for this occurrence.
McManus [
16] analyzed the data from individual tests in several ways in order to obtain as much information as possible from the numerical values. Microsoft Excel provides tools to perform mathematical operations including curve-fitting based on various mathematical models, equations of trendlines, and calculation of goodness of fit (
R2 value). The correlation coefficient of the equation (
R2) is a measure of the fit of the line to the individual points. The closer the value of
R2 approaches to 1.00, the less the deviation from adherence to the mathematical model.
The first analysis used a transformation recommended by the American Industrial Hygiene Association [
18]. This converted the measured concentrations (C) to a fraction of the initial concentration (C
0) and calculated the natural logarithm of this value, ln(C/C
0). The ratio C/C
0 normalizes all concentrations measured in the tests. This approach provides the benefit of examining the process rather than biasing the result based on the initial concentration. In addition, a plot of ln(C/C
0) versus elapsed time (min) that produces a straight line fits the well-mixed box model, the slope of which has units of (1 min
−1) (note that in Excel, the y-value is ln(C/C
0) and the x-value is elapsed time, t). The slope of the line multiplied by the volume of the space, 2.5 m
3 (90 ft
3), provides an estimate of the rate of ventilation (m
3 min
−1 or ft
3 min
−1) of the airspace of the structure induced by natural forces based on the entire curve.
Table 1 provides results from this analysis. Generally, the rate of ventilation depended on the number/area of the openings. Geometric mean
R2 values for curves fitted to data subjected to this transformation ranged from 0.973 to 0.994 for different engine operating time and number and configuration of openings (
Table 1). Geometric standard deviations ranged from 1.00 to 1.02. This finding suggests that the well-mixed box model is representative of the manner in which ventilation occurred in the test structure.
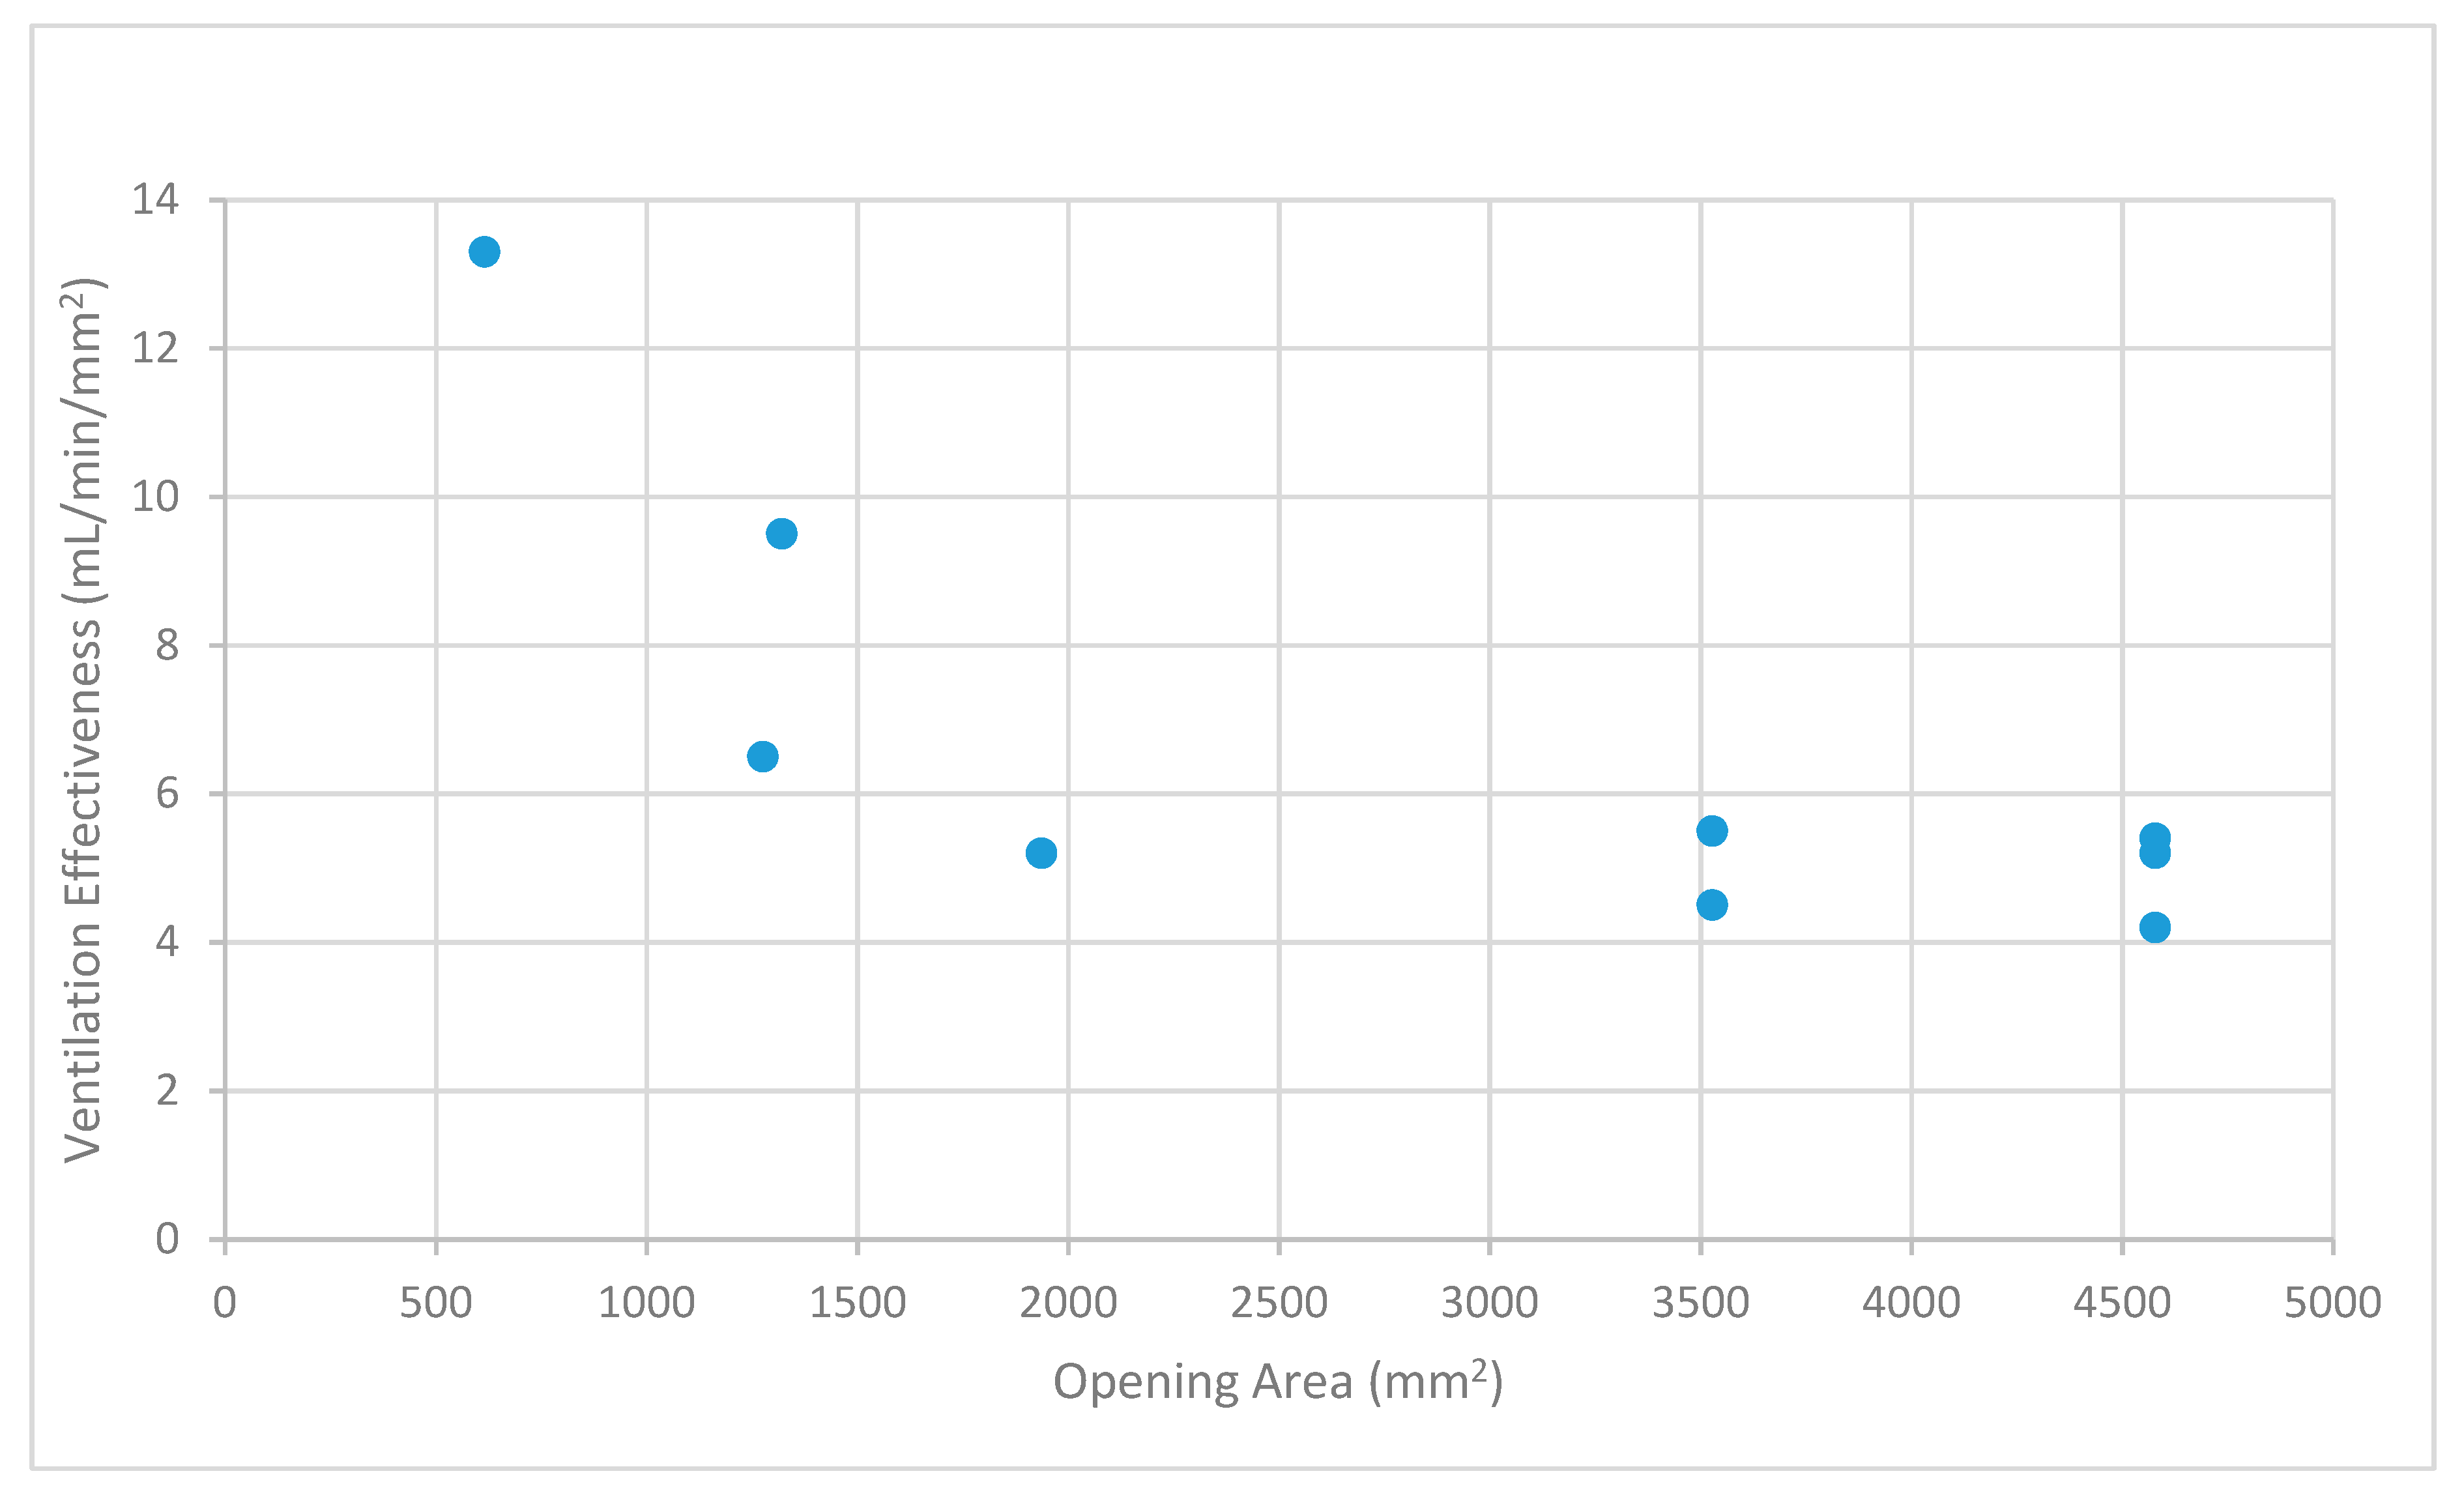
Table 1 and
Figure 7 indicate that ventilation effectiveness (efficiency) decreased from the values for one and two openings and became almost constant at the lower level for three or more openings.
Table 2 provides results obtained by investigators at the Bureau of Mines [
2] recalculated to derive information regarding ventilation effectiveness. Results obtained by investigators at the Bureau of Mines recalculated to derive ventilation effectiveness showed a trend similar to that obtained in
Table 1. This suggests that effectiveness (efficiency) of ventilation through opening(s) in manholes is consistent regardless of the approach used to measure ventilation airflow. This finding also indicates the fundamental importance of one and two openings in the efficiency of the process. Beyond two openings, ventilation effectiveness (efficiency) is approximately the same regardless of the number of openings or area of openings. Differentiation between the number versus area of openings is not directly possible from this analysis. Data contained in
Table 2 compared to data provided in
Table 1 suggest that the rate of ventilation and ventilation effectiveness (efficiency) obtained by investigators at the Bureau of Mines were in the same range. Direct comparison is difficult because of differences in area of the openings in the manholes and the interplay between area and number.
Another way to examine the data was to subject the ratio of the concentration values (C/C
0) directly to analysis using tools available in Microsoft Excel to obtain concentration versus time curves (
Table 3).
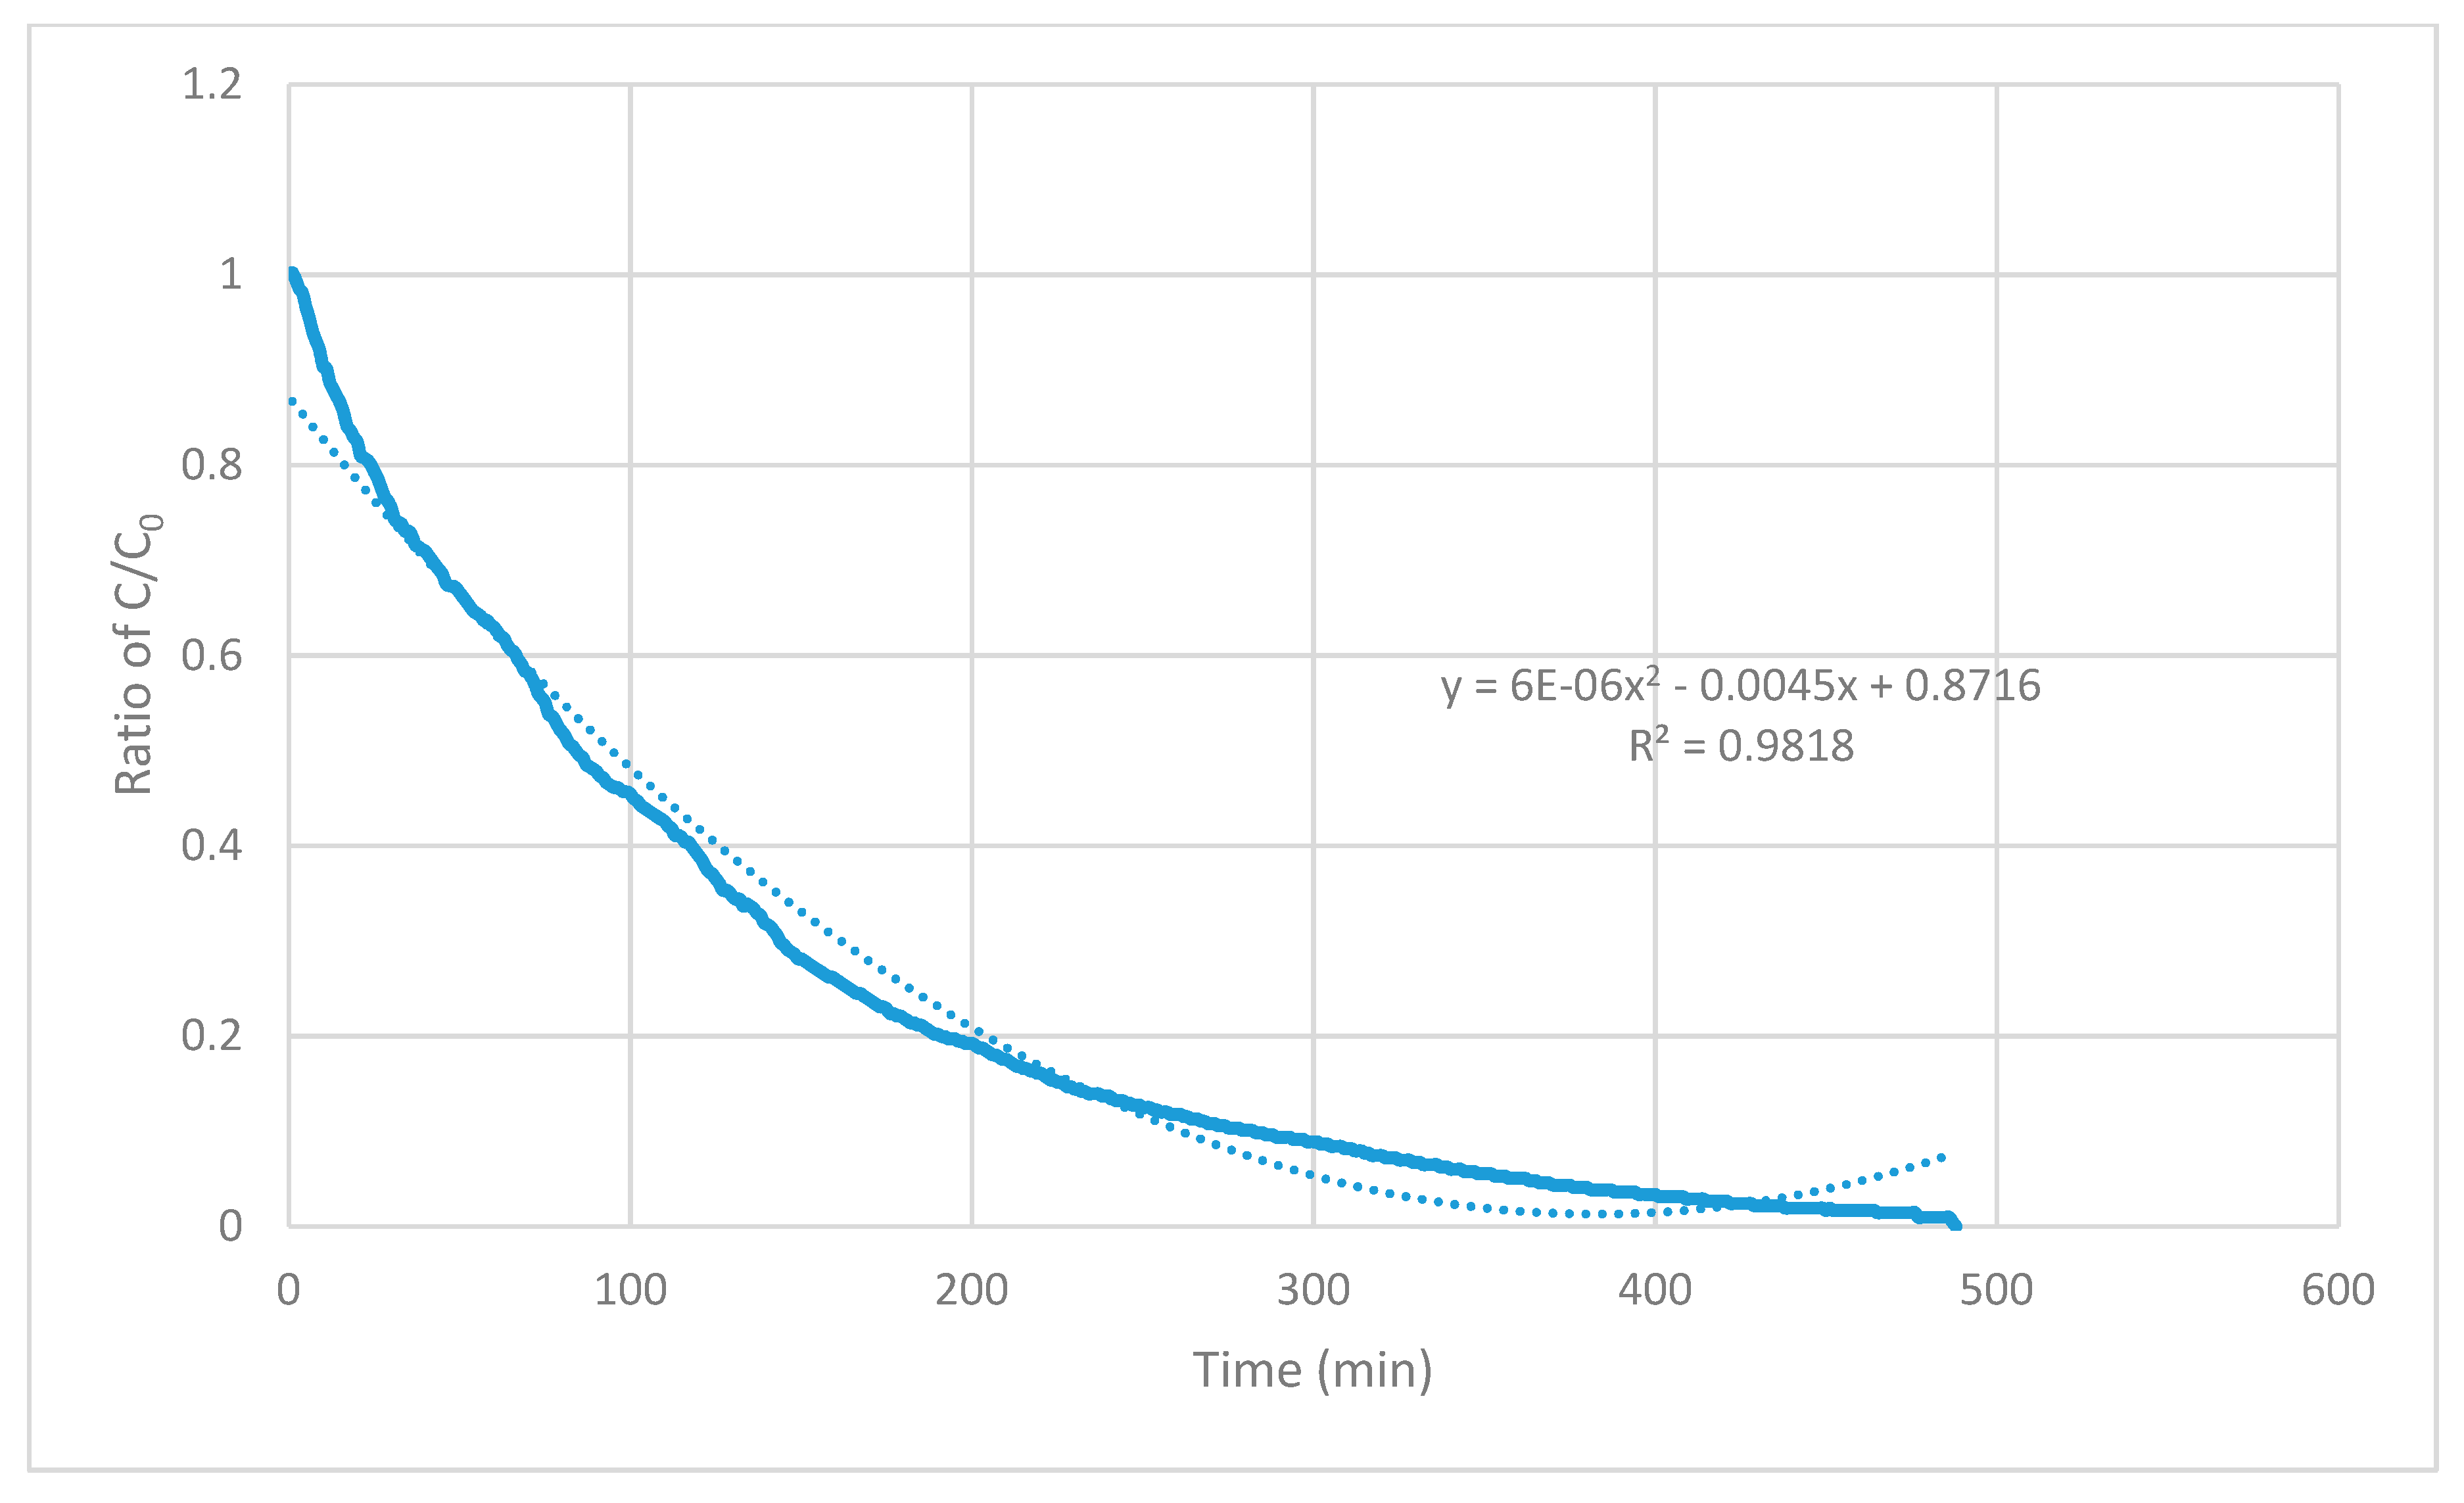
Figure 8 shows the application of the Excel-fitted curve and equation to data for 2 February, 2015. In this analysis,
R2 values for trendlines fitted by the linear model were consistently the lowest and
R2 fitted by the second-order polynomial model was the closest to 1.000. Second-order polynomial equations contain x
2, x
1, and x
0 terms (note that x corresponds to elapsed time (t)). The contribution of the t
2 term in the equation fitted by the second-order polynomial model was vanishingly small. That is, the equation assigned by the polynomial model received a contribution only from the term, t. Differentiation of the polynomial equation for concentration versus time and substitution of t for x and C for y indicates that the rate of ventilation is strongly zero order [
15]. That is, the rate of change of concentration is independent of time.
Results provided by the analysis summarized in
Table 3 showed trends observed in
Table 1; namely, that the rate of ventilation depended on the number/area of the openings and that ventilation effectiveness (efficiency) (
Table 3) decreased from one to two openings and became almost constant at a lower level for three or more openings. Values for
R2 were slightly lower compared with those shown in
Table 1. Hence, the second-order polynomial is slightly less descriptive of the observed values than the method of analysis recommended by AIHA [
18]. Ventilation rate and, consequently, ventilation effectiveness (efficiency) were also less when the data were subjected to this treatment.
Figure 8 shows similarity to
Figure 3 in Wiegand and Dunne [
9].
Figure 3 in Wiegand and Dunne shows the decrease in concentration of N
2O in the airspace of a subsurface telephone vault when manhole cover was removed. The equation derived by Excel for the data shows similarities, even though the curve in
Figure 3 in Wiegand and Dunne is for a considerably larger opening [
4]. The equation for the manhole opening in Wiegand and Dunne derived by Excel is also dominated by the x term (meaning a zero-order process) but does contain a contribution from the x
2 term (meaning a partly first-order process) [
15].
Independent t-tests on groups of values calculated by the different means indicated possible significance at the 5% level for five openings (March) versus five openings (June); three openings versus two openings (center and circumference); two openings (center and circumference) versus two openings (opposite each other on the circumference); and one opening versus two openings (center and circumference), all for 30 s of engine operation. These significances suggest the existence of opportunities for optimization through design.
4. Discussion
Results obtained during the tests discussed here indicated that ventilation of subsurface structures containing a defined path of one or more openings in the manhole cover occurs continuously regardless of the concentration of the contaminant. The process in the space under investigation occurred in a consistent and predictable manner through most of the year, the exception occurring in June and July when the data showed considerable irregularities. The cause of the irregularities is not known but is possibly due to increased and irregular wind flow that increased the exchange rate. Other articles in this series will report on air movement and mechanisms involved in air exchange (McManus and Haddad, manuscript submitted for review, not yet cited).
The typical concentration versus time curves obtainable from the data showed almost identical concentrations reported by each of the four instruments for any chosen moment throughout the process. Data of this type strongly suggest a rapidly well-mixed composition indicative of a well-mixed box or the continuously stirred tank reactor [
17,
18].
The results presented here are consistent with those obtained during investigations performed by the Bureau of Mines [
2,
6,
7,
8] concerning ventilation in isolated subsurface structures induced by natural forces and extend considerably them. These results also show consistency with work published by Wiegand and Dunne [
9] indicating the rapid expulsion of the atmosphere confined in the airspace of a subsurface vault following removal of the manhole cover. Exchange through the manhole opening appears to reflect the same processes that occur through the small opening(s) in the manhole cover.
Results from this study and the one performed by investigators at the Bureau of Mines [
2,
4] indicated that ventilation effectiveness (efficiency) decreases from a maximum for one opening to a point starting with three openings, where the numerical value is relatively the same regardless of the number. The reason for this finding is not known at this time. This observation does suggest the possibility of a means to optimize the rate of air exchange through the openings in access structures such as manhole covers. Given a manhole cover containing a predetermined number of openings of almost equal area in fixed geometry, there was no way, at this point, to examine the relationship between area and number, and position and shape of openings on the effectiveness and efficiency of ventilation induced by natural forces. The question remains whether a smaller number of larger openings is more effective in the process of ventilation induced by natural forces than a larger number of smaller openings with the same total area.
As shown in numerical analysis, equations derived from the data points indicate the occurrence of atmospheric exchange through the small opening(s) in the manhole cover in a manner consistent with requirements of the well-mixed box model. Whether this finding has practical relevance is not clear but is highly suggestive of a lack of concern about ‘dead spots’ in, at the least, the structure under study and the structures used by investigators at the Bureau of Mines. Investigators at the Bureau of Mines indicated, in their reports, expending considerable effort to obtain evenly distributed concentrations of indicator gas during their investigations and being satisfied that this condition (uniform concentration) was achievable [
2,
6,
7,
8]. Said another way, this was an attempt to eliminate dead spots in the interior of the structure in order to protect the integrity of the mathematics involved in the calculations.
This information has immense importance for reducing the risk of work involving entry into isolated subsurface structures and deserves widespread dissemination. This was the basis for the advocacy expressed in McManus and Haddad [
3]. McManus and Haddad advocated for inclusion of ventilation of isolated subsurface structures induced by natural forces within the purview of the Prevention through Design initiative of the National Institute for Occupational Safety and Health [
25]. The intent of the Prevention through Design initiative is to reduce the risk of work through coordinated application of research, design principles, and best practices in execution of design through manufacturing, construction, operation, maintenance, and modification. The information obtained in this study and that obtained by investigators at the Bureau of Mines [
2,
6,
7,
8] and McManus and Haddad [
3,
4,
5] provides the starting point for further enquiry to determine the means to optimize the process of air exchange. Optimizing the rate of ventilation through designs that optimize geometry will minimize exposure to passersby, and to workers engaged in opening the access cover to test the atmosphere and install ventilation during preparation for entry. Optimized exchange of the atmosphere in the airspace with the external atmosphere during the period between entry and work minimizes the concentration that can escape following opening the access cover because of dispersal over the long period during the period preceding the opening.
Results obtained during this study support the contention that ventilation induced by natural forces can be an effective means to reduce risk related to work involving isolated subsurface structures. The data indicated that the small engine used during these tests can create an atmosphere containing around 800 ppm of CO in 30 s of operation from a cold start. The IDLH (Immediately Dangerous to Life or Health in 30 minutes) for CO is 1200 ppm [
26]. These results indicated that purging from 800 ppm to 25 ppm averaged over 8 h (the regulatory exposure limit in many jurisdictions) through the opening(s) in the manhole cover is highly variable within groups of tests receiving identical treatment (length of operation of the engine, number of openings in the manhole cover, season of the year, and spacing between openings (center versus circumference)). Considerable overlap occurred between groups receiving different treatment. Visual inspection of the data indicated a common range of 300 to 600 min to reduce the concentration of CO inside the airspace from 800 ppm to 25 ppm. Individual tests lie outside this range. This range provides a benchmark for discussion about the value to be gained from applying Prevention through Design to the problem with the intention of reducing risk to passersby while walking along sidewalks and across streets and to workers when preparing isolated subsurface structures for entry and work.
Knowledge about the concentration reduction time for CO from 800 ppm to 25 ppm provides considerable incentive to operators of isolated subsurface structures to ensure that openings in manhole covers and access hatches remain unobstructed during the undisturbed/operational period between openings for entry and work. Similarly, exchange between the external surroundings and the airspace of the isolated structure is a two-way street with benefits and consequences in both directions. Entry of a contaminated atmosphere from the street into an isolated structure from an engine emitting untreated exhaust is highly plausible, as suggested by the pattern of air exchange described by investigators at the Bureau of Mines [
2], Wiegand and Dunne [
9], and McManus [
16], on which this report is based. This inference suggests that the location of exhaust-producing portable and mobile equipment relative to openings in manhole covers of isolated subsurface structures is a critical concern. This especially applies to small engine-powered equipment such as portable ventilation fans and generator sets, and mobile equipment such as compressors, generators, and light towers lacking catalytic exhaust treatment where the discharge from the engine is positioned close to the ground.
Investigators at the US Bureau of Mines [
2,
6,
7] repeatedly commented about the importance of air movement (wind) in the results that they obtained. Wiegand and Dunne [
9] also made similar comments. Results obtained during tests performed by McManus [
5,
16] also suggested involvement by the wind. Despite this involvement, air exchange occurred in an orderly and predictable manner, strongly suggesting adherence to the requirements of the well-mixed box model. The manner of involvement of wind in the process is not apparent in the results reported here. Involvement of surface wind in creating a major contribution to ventilation of subsurface structures is considered in another forum [
5].
