1. Introduction
Road condition is an important aspect for the development of a country, it indicates the economic level and it has been adopted as rating criteria by the World Bank [
1]: “the density of paved roads in good condition varies from 40 km/million inhabitants in low-income economies to 470 middle-income and 8,550 in high-income economies”. Maintaining an acceptable level of service for the whole road network, and, in particular, assessing an effective pavement maintenance and rehabilitation program is challenging for the road public authorities.
Pavement Management System (PMS) is a planning tool assisting road agencies in decision-making process to efficiently maintain the road network in a timely and cost-effective manner as well as to assure comfort and safety of the users. [
2,
3].
A traditional reactive approach for pavement maintenance prescribes road replacement once significant structural damage has occurred: this approach leads to more severe and expensive rehabilitation, which can cause unsafe conditions for road users prior to the interventions, as described in [
2,
4,
5].
A proactive approach is pavement preservation oriented: it seeks to create a system of implementing relatively less invasive and small-scale repairs on roads prior to structural degradations occurring, limiting the necessity of full depth road reconstruction. When compared to the reactive approach, it will result in long-term savings, reduced traffic congestion, without leading to a massive safety condition reduction [
2,
6]. Data collection and analysis phases are crucial to perform a proactive approach, fundamental or a successful PMS implementation, as reported by other authors [
7,
8].
Monitoring the pavement condition after construction, and comparing the actual with the desired performance level, allow for evaluating the level of damage and identifying the cause of the problem and finally designing the treatments and deciding the prioritization of intervention [
9,
10].
The pavement condition can be determined both manually and automatically: while the first method is labor-intensive, time-consuming, and prone to the subjectivity of inspectors, the second one offers an automated detection solution, which minimizes the subjectivity, improves the productivity, but it entails the higher cost of realization [
2,
8,
11].
From this consideration arise that the benefits coming from a proactive approach have to face with some initial disadvantages, which have led to an overall delay in PMS adoption worldwide. Implementation costs of the system and operation costs for data acquisition and processing, time-consuming operations, such as survey and data process, have represented a limitation, even more when considering the large extension of the road network.
In this regard, repeatability, accuracy, and objectivity of distress acquisition and the detection of pavement are a very important improvement in this kind of process [
2,
11].
At the same time, agencies were conscious that the delay in PMS application would lead to a more rapid deterioration of global road networks and an economical lost [
8]: this consideration has fed the interest of several road authorities and researchers in developing automated and semi-automated procedures for pavement assessment and evaluation. Several systems and procedures have been implemented during the last ten years, focused on improving the survey technique, especially in order to overcome the limits of manual survey [
6,
9], increasing operating safety, and improving the cost-benefit ratio [
10].
It must be mentioned that almost all commercial solutions are high performance oriented, designed for high-speed roads, and are capable of acquiring a huge amount of georeferenced data, often requiring a considerable economical resource for surveys and post-processing activities. For these reasons, a high-level PMS is often not achievable by many local agencies.
Moreover, many studies in the literature are focused on the relation between PMS and particular pavement performances (such as roughness or adherence), but very few provide a global approach that is safety and comfort based [
4,
5,
7].
This paper aims to provide an overview of current practices and emerging technologies in order to build a solid information base for pavement management that is based on safety and comfort criteria.
2. State of Practice in Pavement Distress Classification and Related Indices
The pavement distress labeling and quantification in term of type, severity, and extension are the first steps for a road maintenance assessment. This phase is often crucial because of a lack of standardization in the distress definition that could lead to the inconsistency of the classification.
In literature, there are several distress identification catalogues by different researchers and organizations [
12,
13], which almost adopt the same identification and evaluation criteria. One of the most well-known and diffused references is the ASTM D6433-16 [
14], which provides distress criteria identification and classification for both flexible and rigid pavement. Another American reference that is commonly used is the manual for the Long-Term Pavement Performance Program by the US Department of Transportation [
12], which aims to collect pavement performance data in the United States and Canada. This classification is relevant because widely experienced and for its international orientation and integrity of classification, but it does not provide any numerical threshold for distress severity classification [
8]. The European background in distress identification and management is limited to some isolated cases. In fact, only the French Institute of Science and Technology for Transport [
15] and the Swiss Association of Road and Transport Professionals [
16] have developed a systematical approach in pavement distress identification in their guidelines, while only recently Ireland has included the assessment of road pavement that is based only on the surface condition evaluation [
17]. In Italy, the diffusion of standard procedures for distress identification is few and limited to guidelines of the National Research Council and isolated case of application of any road officers [
18].
The common aim of all the above-mentioned Distress Catalogues, is to provide an “as objective as possible” common set of criteria to evaluate the pavement condition and define management strategies. In fact, almost of the methods to perform a Pavement Management System are based on the development of pavement condition indices to express the structural and operational performance, by combining different distress type expressed in terms of severity and extension, such as Pavement Condition Index (PCI) [
12,
13,
14]. To perform a preventive maintenance approach for a whole road network, the availability of detailed information about actual road conditions is required. This can be obtained only through an accurate distress identification and classification. On the other side to reach high level information, high investments in technologies and qualified staff are necessary.
In recent years, boosted by the challenging goal of the EU in Road Safety [
19], many researchers and public agencies have spent their energies and resources in investigating the role of road condition in the incidental phenomena [
7,
11,
20,
21]. Moreover, due to the lack of economic resources, many countries have to face with the impossibility of investing in sophisticated PMS and expensive extensive surveys. From these considerations, the effectiveness of a pavement classification tool emerges. A defined set of information acquired by focused surveys [
7,
22,
23] can provide a safety and comfort-oriented tool.
2.1. Distress
This review paper deals only with distresses detected on the flexible pavement. This choice reflects the authors’ aim to provide a state of the art useful to almost all organizations involved in road management because of the huge worldwide diffusion of this kind of pavement.
As a reference guide for the distress classification, the most well-known and appreciated Distress Catalogues have been considered [
10,
14] in order to identify the most frequent distresses in flexible road pavement tightly coupled with the comfort and safety of the vehicles. As a result of this first step of the review, the contribution in terms of comfort or safety reduction has been considered for each type of distress, according to its severity and extension.
According to the [
10,
13,
14], the distresses types have been grouped into four families, as described below:
In the following paragraphs, the characteristics of each group of distresses are summarized, in order to facilitate their identification and to evaluate their own contribution to comfort and safety level for road users.
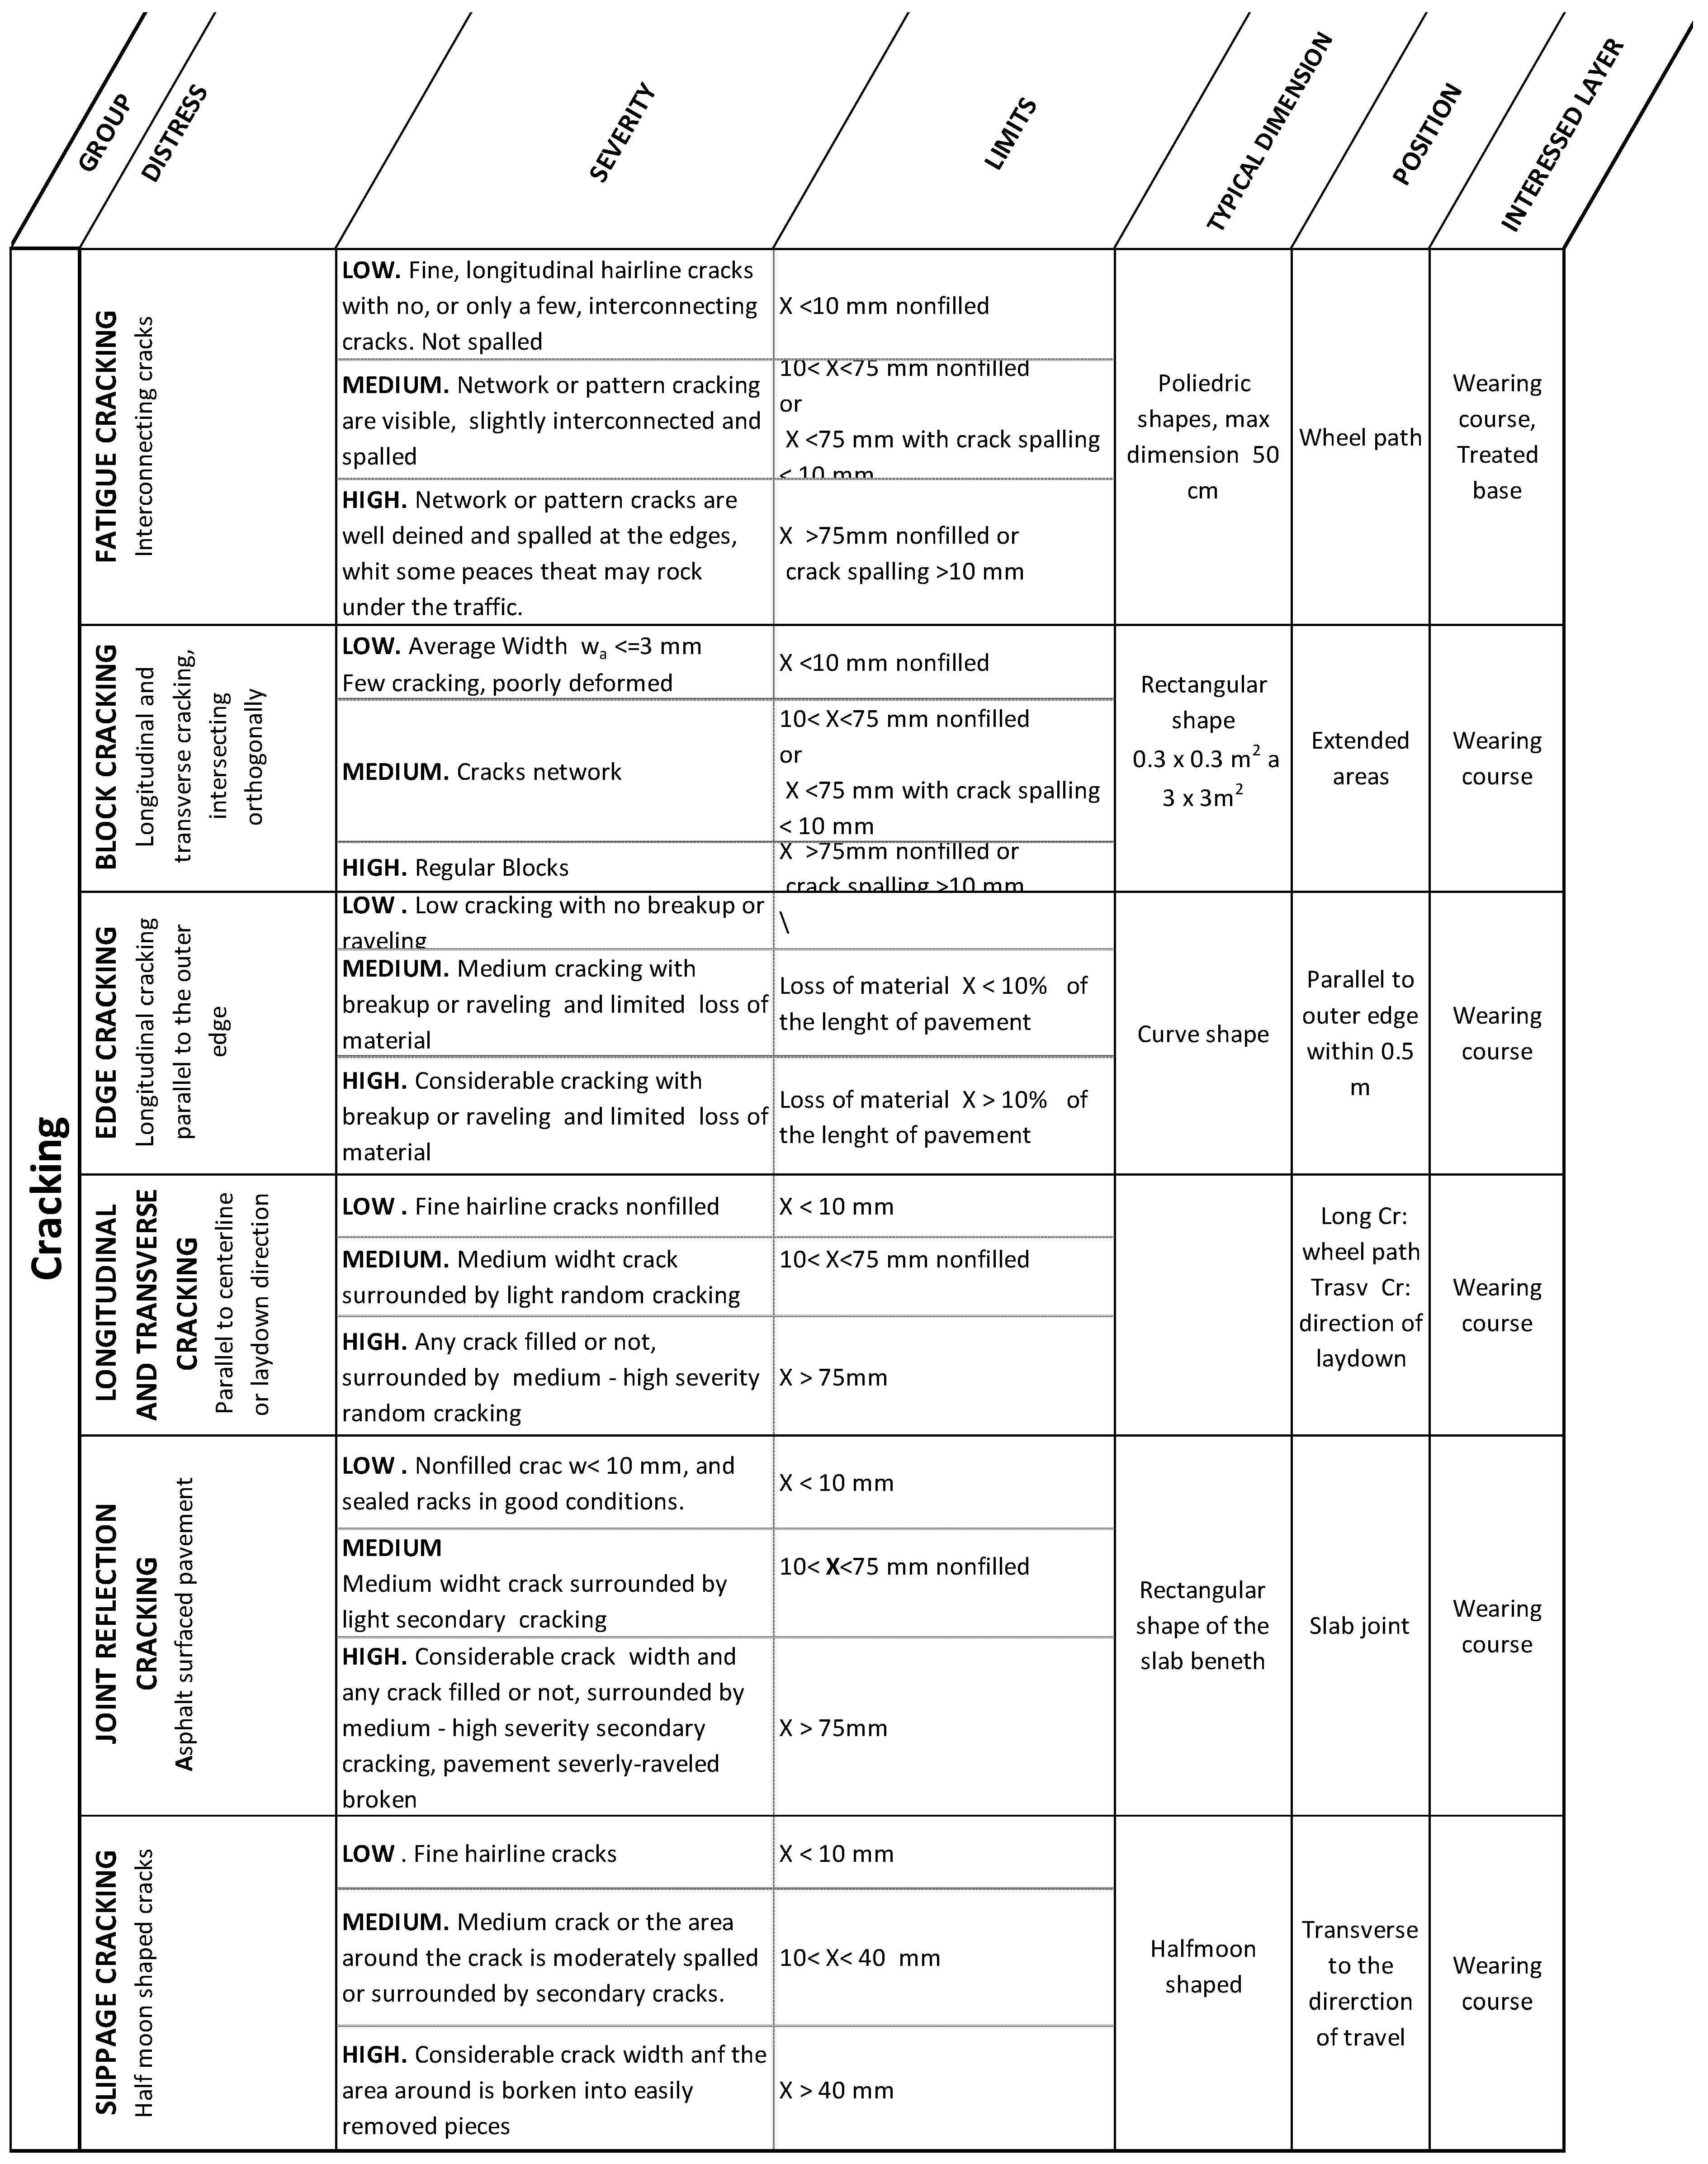
2.1.1. Cracking Group
Pavement cracking group includes several kinds of distresses, such as fatigue cracking, block cracking, edge cracking, longitudinal and transverse cracking, and reflection cracking. Most of them are related to climatic causes, except for the alligator cracking type, related to load, and slippage cracking that is caused by traffic. Their position, dimension, and orientation allow for identifying the specific type of cracking and the related causes, as reported in detail in
Figure A1 in
Appendix A. Moreover, they have different effects on the global safety and comfort level of the road: for example, the presence of fatigue cracking advises the end of lifecycle for the pavement, far from the recommended standard.
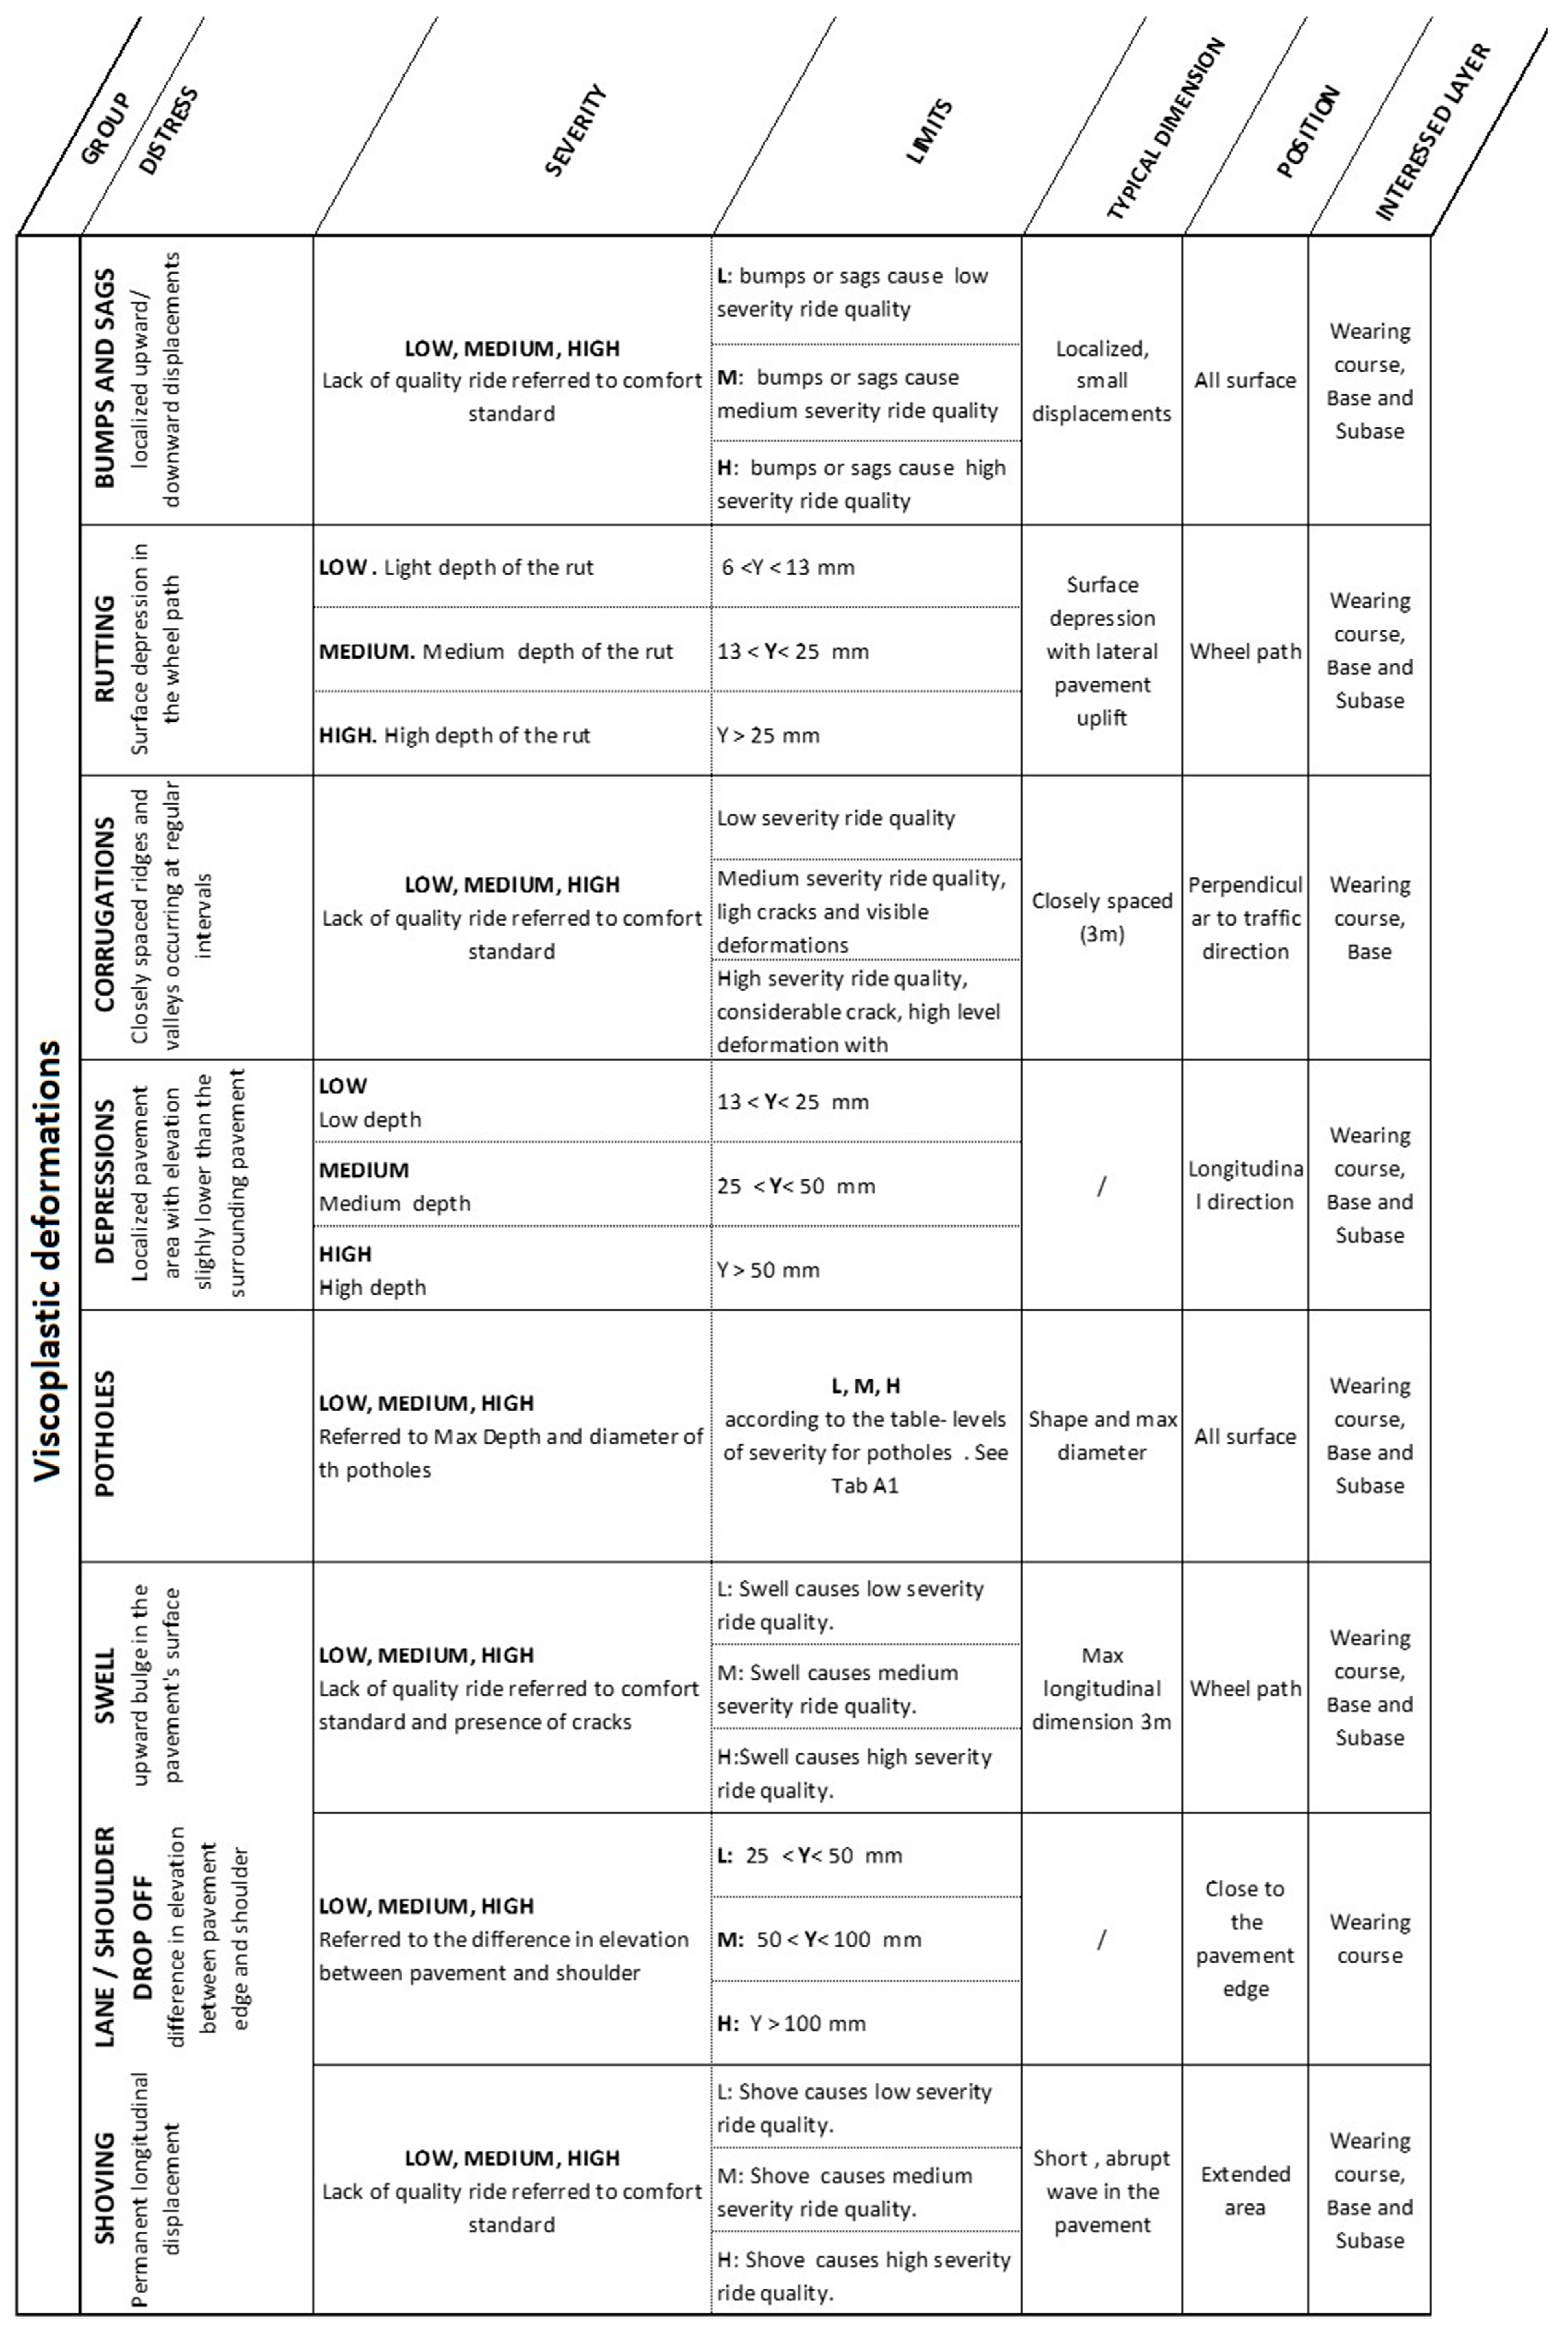
2.1.2. Viscoplastic Deformation Group
The viscoplastic deformation group consists of all the deformations involving both superficial and bottom layers. Showing, corrugation, and lane/shoulder drop off generally involve horizontal and vertical displacement of the top layer of the pavement structure, while bumps and sags, rutting, depression, potholes, and swell may affect the whole structure. The first cause of viscoplastic distresses is the load, followed by traffic and climatic effects. Their position, dimension, and orientation allow for identifying the specific type of distress and the related causes, as reported in detail in
Appendix A,
Figure A2.
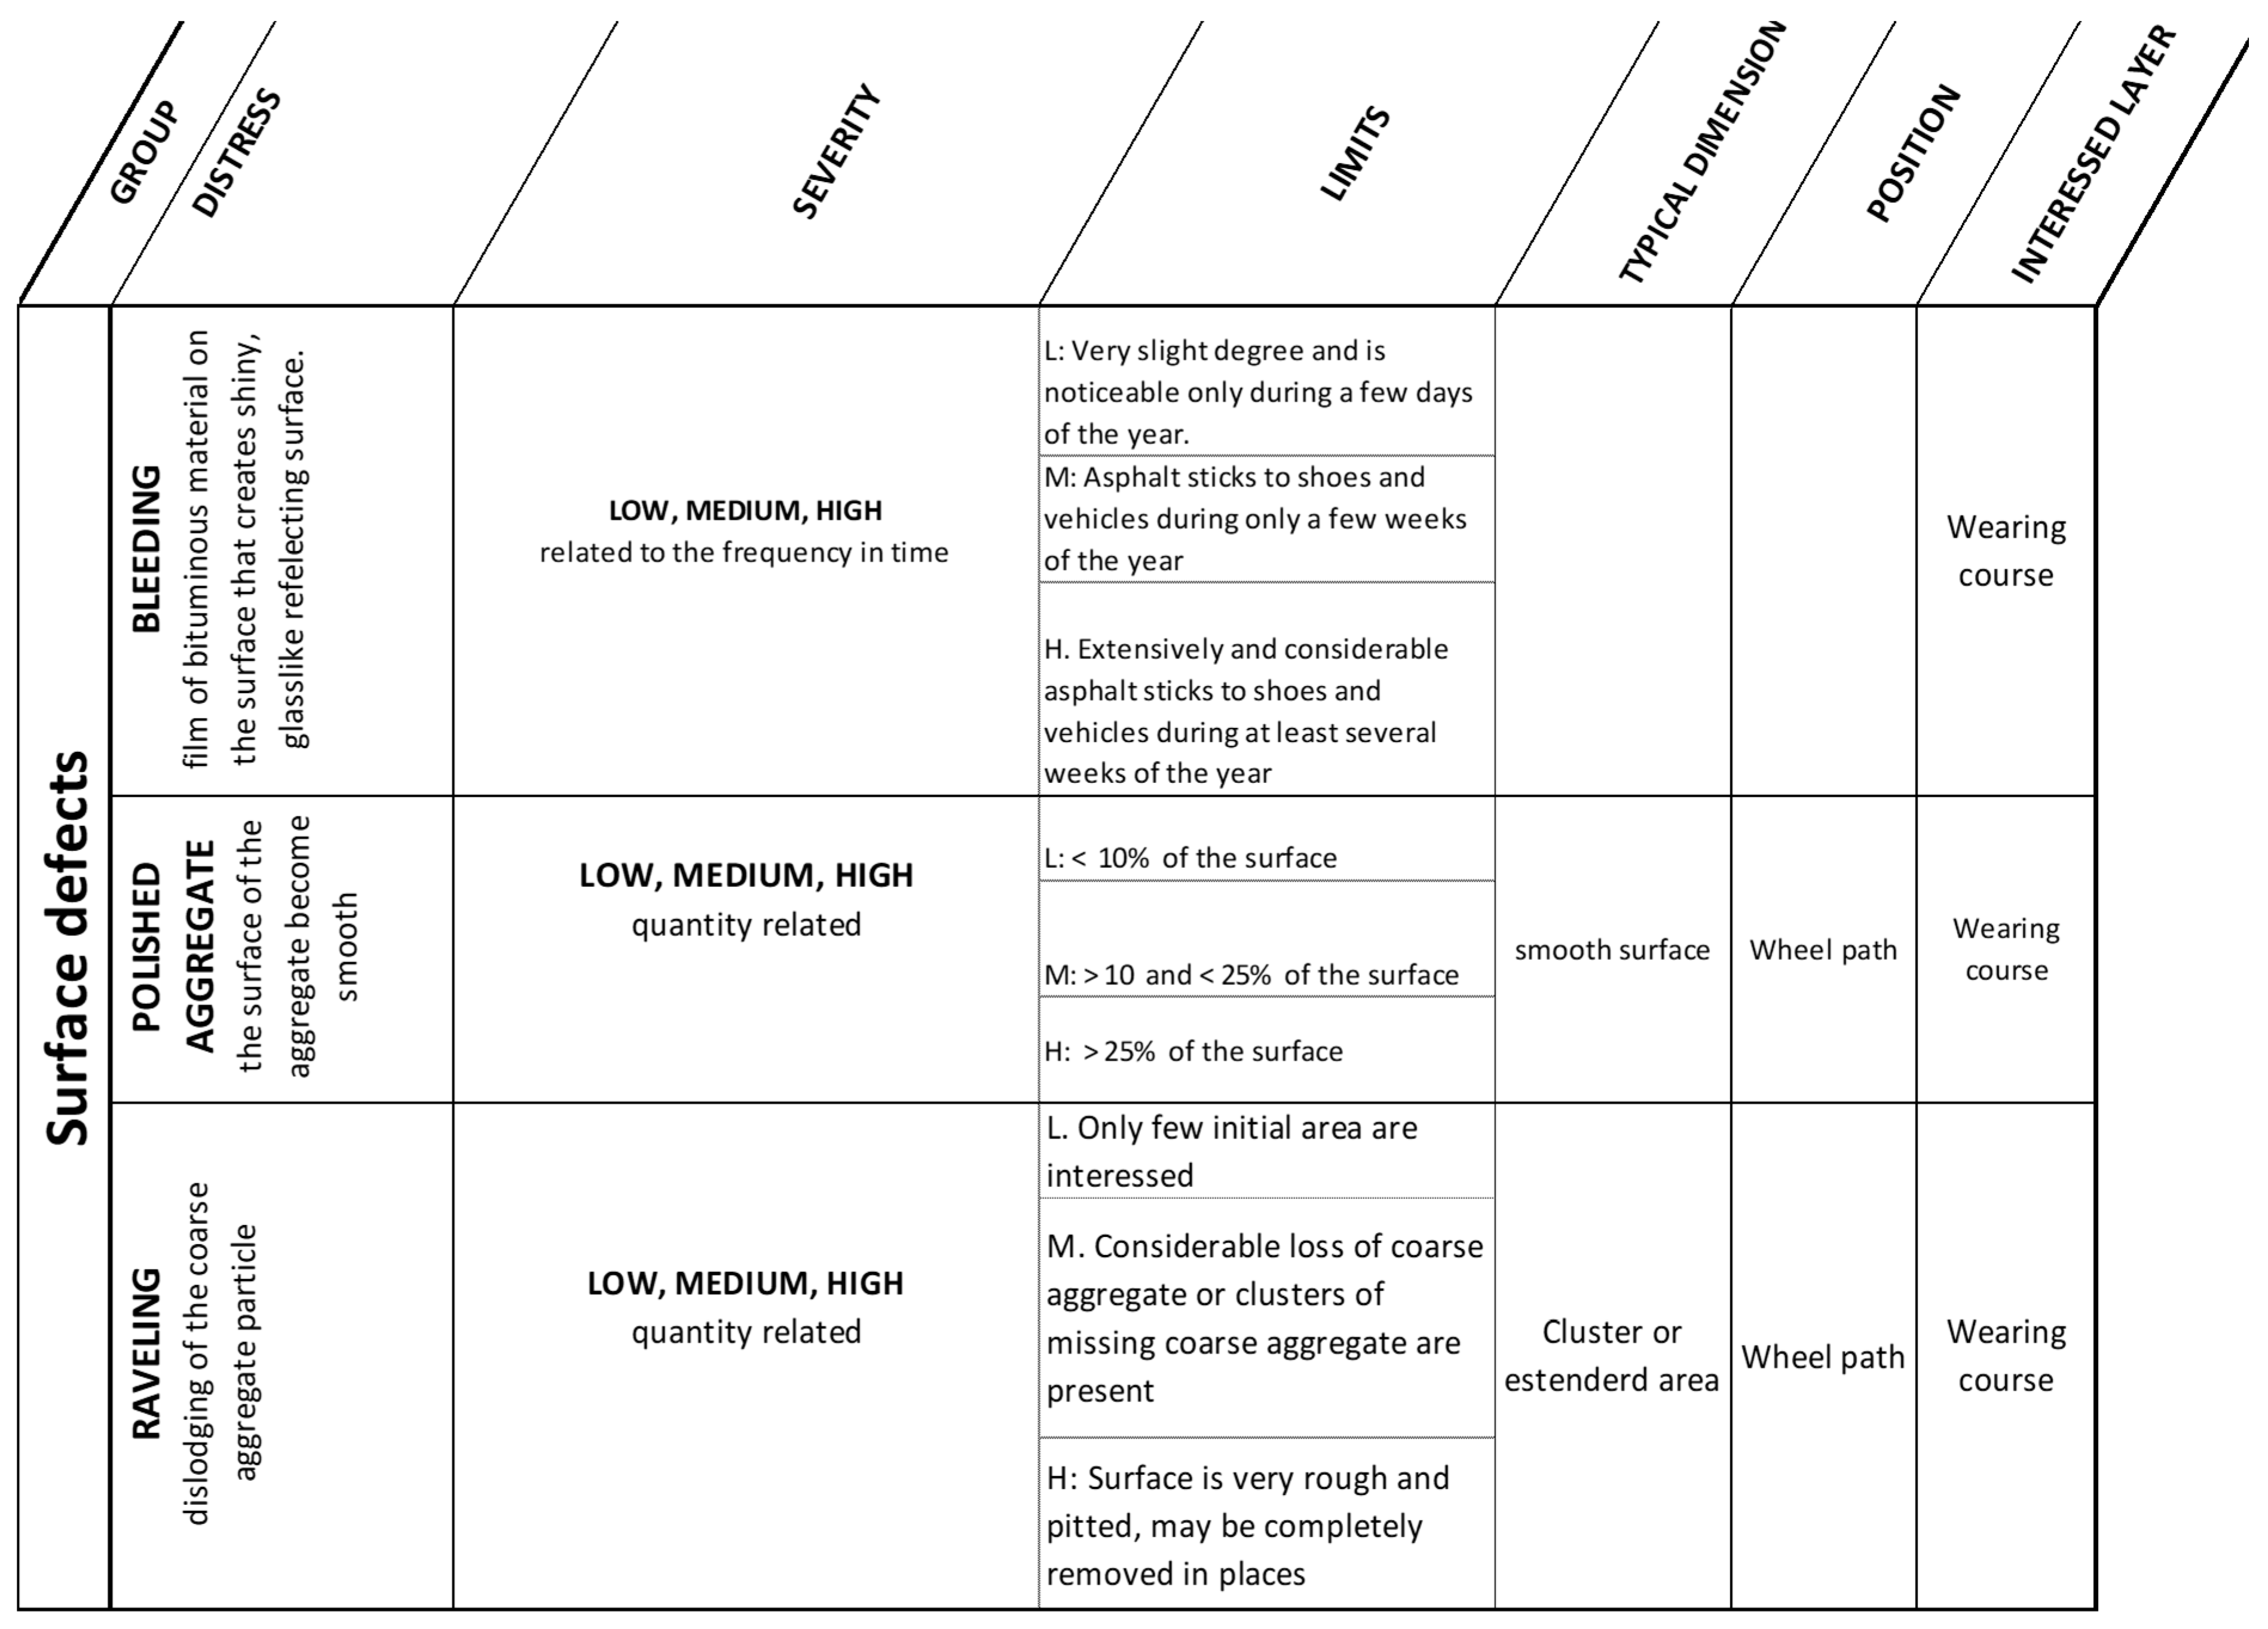
2.1.3. Surface Defect Group
The surface defect group encompasses bleeding, polish aggregate, and raveling. When bleeding occurs, an excess of bituminous binder is present in the top layer surface, while in case of raveling an inadequate asphalt binder can cause the dislodging of aggregate. In the case of Polish aggregate, the top layer surface becomes smooth because of the aggregates exposition to the traffic, producing a reduction in adhesion. Causes of surface defects are related to bituminous materials characteristics and to the traffic effect. Their position, dimension, and orientation help in identifying the specific type of distress, as reported in detail in
Appendix A,
Figure A3.
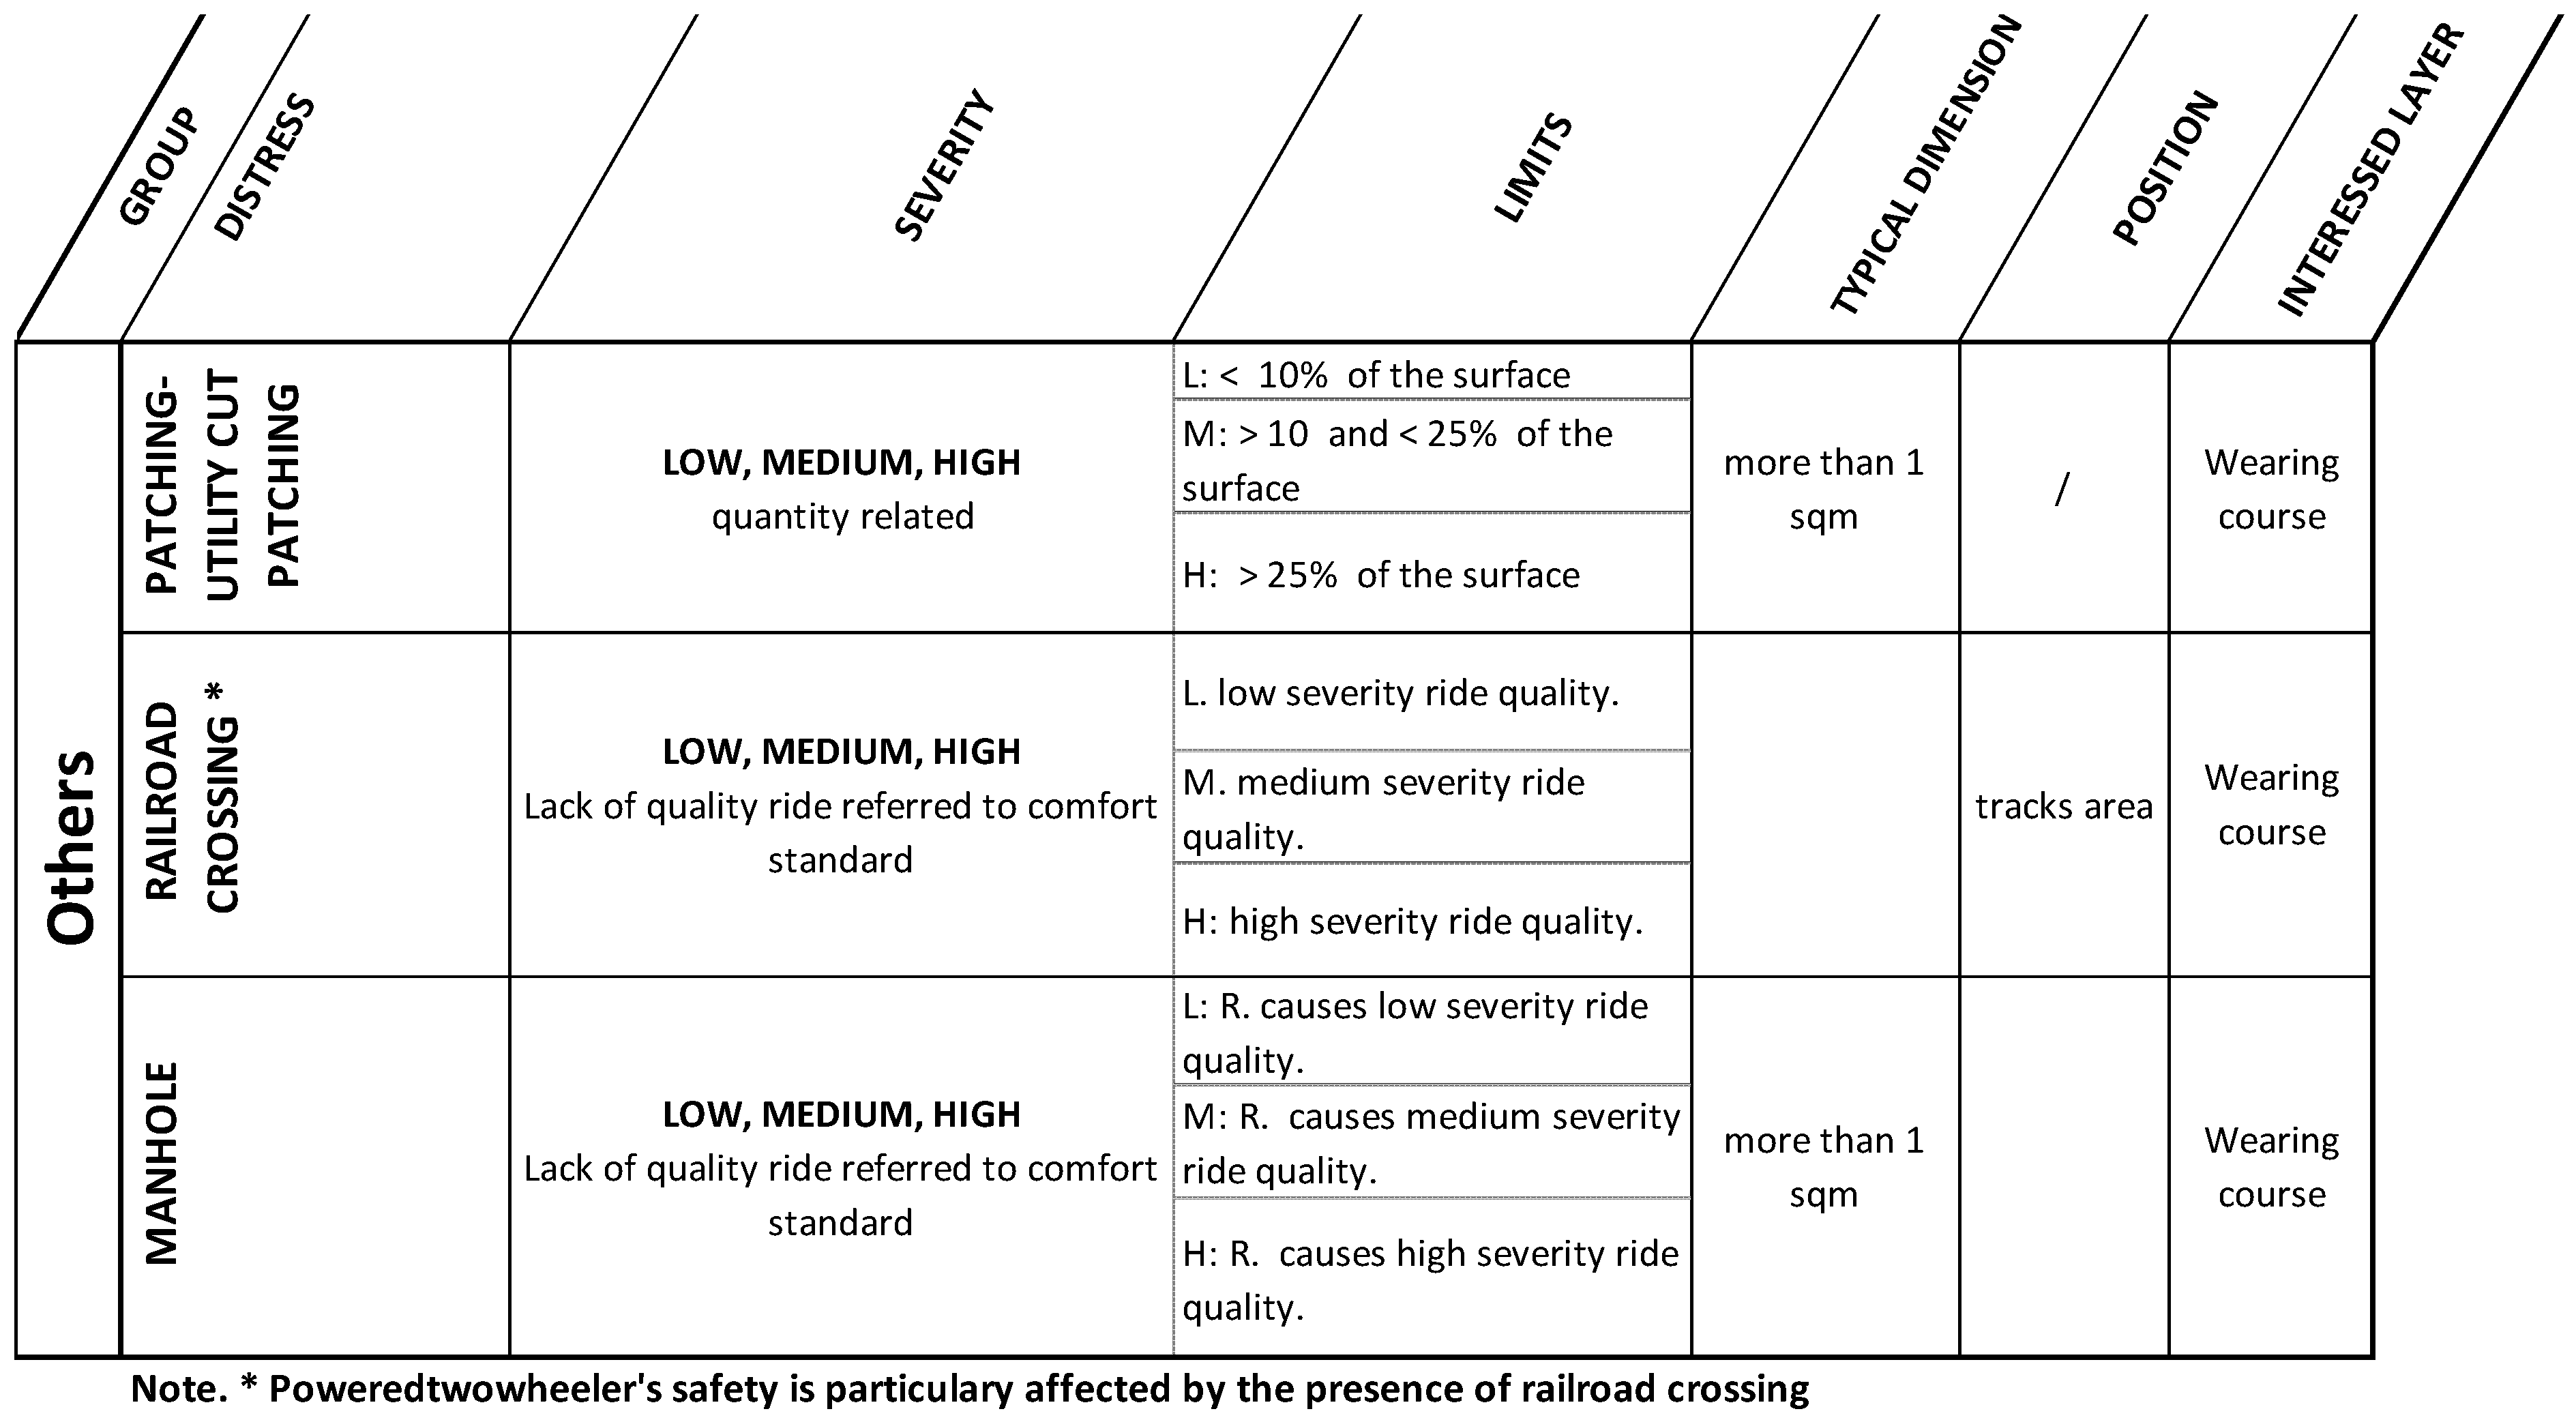
2.1.4. Miscellaneous Distress
The last three distress are patching and utility, cut patching, railroad crossing, catch basins, and manholes cover. They are frequent in the urban area and are easily recognizable by their peculiar shape, as summarized in
Appendix A,
Figure A4.
2.2. Indices Review
Distresses Catalogues provide a common language to identify, describe, and evaluate the severity of distresses, in order to minimize the subjective component of the visual process, to guarantee the repeatability of the method and to facilitate the communication within the authorities.
These aspects, in fact, are essential for a Road Agency motivated in realizing an efficient Road Network Management system: standardized data collection procedures, robust pavement condition indices, and experts in pavement data collection procedures are essential requirements for the system.
Primary aspects, which guide the PMS definition, are the comfort, the safety, and economic issues [
7,
8,
23]: a proper maintenance strategy can be defined trough balancing them, using specific tools that are supported by the current pavement condition information and considering the Agency’s priority.
In literature [
9,
23,
24,
25], there are several tools that enable synthesizing the current pavement condition, to define the priority intervention order, including prediction of performance and economic analysis. On the basis of the tool adopted, specific input data are necessary, which are characterised by different accuracy and precision levels, and are acquired by different techniques, which contributes to determining the global performance and cost of a PMS. Several authors [
21,
26,
27] focused their researches on the analysis of the relation between accidents and pavement conditions, expressed in term of common indices: according to the literature review Pavement Condition Index (PCI), International Roughness Index (IRI), Ruth Depth (RD), and Pavement Serviceability Index (PSI) are the most used ones in representing a global or peculiar aspect of the road pavement.
Table 1 summarises the above-mentioned indices.
2.2.1. Pavement Condition Index (PCI)
The Pavement Condition Index (PCI) was developed to provide a measure of pavement integrity and surface operational condition based on a numerical scale, where 100 represents the perfect conditions and 0 the failed one. The method is based on visual survey: the degree of deterioration is a function of distress type, distress severity, and the amount or density on the considered sample unit. The method, developed by the U.S. Army Corps of Engineers [
13], has been adopted as standard procedure by many agencies worldwide, and published as ASTMS standard, for both roads and airports, [
14] and [
28], respectively, and adopted as a basis for PMS commercial software [
28]. It guarantees consistent and accurate results, but it needs high-level accuracy for the input data, moreover, it is prone to the human capacity for distress detection and it is time-consuming.
2.2.2. International Roughness Index (IRI)
The International Roughness Index (IRI) is a standardized roughness measurement, developed by the World Bank in 1980 [
28], which provides a ride quality classification in term of longitudinal profile, traveled by a wheel path. The IRI is defined as the filtered ratio of the accumulated deviation of the vehicle’s suspension divided by the traveled distance. The profile necessary for the calculation of the index can be obtained by any valid measurement instrument, starting from static rod level to high-speed inertial profilers, as reported in [
29]. Pavement roughness is directly linked to ride quality, comfort, and safety, because is one of the causes of load loss accident [
30].
2.2.3. Rut Depth (RD)
The Rut Depth (RD) measures the longitudinal pavement deflection along the wheel path as a consequence of the accumulation of viscoplastic deformations of layers and subgrade. The main causes of rutting distress are heavy traffic load repetition or lateral movement of the material of the layers. It is an important indicator that is linked to road safety, because, during wet weather conditions, a high rutting level can facilitate the hydroplaning phenomena and loss of control of the vehicles [
31]. RD measurement is simple but it needs high accuracy in data acquisition: it can be calculated from profiles that are obtained with any valid measurement method, ranging from static rod and level surveying equipment to high-speed inertial profiling systems.
2.2.4. Present Serviceability Index (PSI)
The Present Serviceability Index (PSI) is a parameter that is used to describe the functional condition of pavement with respect to ride quality: it provides a valuation of the ability of the road to serve traffic: it takes into account several road characteristics, such as slope variance, rut depth, cracking, and patching surface, as reported in [
27]. The PSI is used to provide a comprehensive evaluation of pavement conditions, for both safety and comfort aspects: the complexity makes several input data necessary to the calculation.
3. Method of Distress Classification Based on Comfort and Safety
The above-mentioned indices are based on the analysis of various type of data, acquired by many technologies, characterized by different level of performance and costs.
IRI and RD are focused only on specific characteristics (roughness and viscoplastic deformation), far from exhaustively describing the current pavement condition; moreover, when considering the requested accuracy standard [
14,
29], the survey and post-process activities result expensive and time-consuming. PCI is based only on a visual approach, and, especially for the evaluation part, it is performed manually by the operator: this can lead to high costs and longtime execution. PSI has an intermediate function but it needs different information for its calculation. From this analysis emerges that those indices are high performance oriented, defined for primary roads or high-speed road, and often require massive economic resources for survey and post-processing activities. Consequently, often they do not fit the emerging information need of many local agencies that cannot implement a high-level PMS, but they only need a way to better manage their road network. Furthermore, from the literature review emerges that many studies focus on the relation between road accident occurrence and pavement conditions, but little has been done to incorporate pavement safety management within a PMS [
8,
24,
32].
Among the wide literature review about the effect of pavement condition on driving conditions, an interesting attempt is made by S. Tighe et al. [
21] who proposed to consider the safety in a PMS design. In particular in their study they integrated the road safety with PMS considering eight criteria: among them the first three deal with pavement condition, such as Skid resistance and surface texture, Roughness (e.g., IRI), Surface condition (ruts, faults, potholes, cracks, spalls, etc.), while the others deal with road geometric and functional road characteristics, as summarised in
Table 2:
Distress Classification Criteria
The general aim of this work is to provide a simple and effectiveness framework that is dedicated to road management activities: integrating the classical approach of the pavement condition analysis with the high performance of the new technologies allows for choosing the best pavement distress detection method.
As a first goal, the present work tries to suggest a simple set of criteria to perform a pavement condition analysis that is comfort and safety oriented: the distresses included in the catalogues, (fully described in
Appendix A), are classified when considering their influence on safety and comfort for the road user. The criteria have been defined through the trend that arose from the literature review and through a panel interview with flexible pavement experts. This step allows for defining, for each distress, geometrical thresholds or pavement state, which affect the driving condition for the users in terms of safety and comfort, as reported in
Figure 1.
To encourage the technological penetration in the Road Administrations procedures, it is necessary to associate each distress with the type of information that is able to fully describe the pavement status and then to suggest the appropriate technological solution.
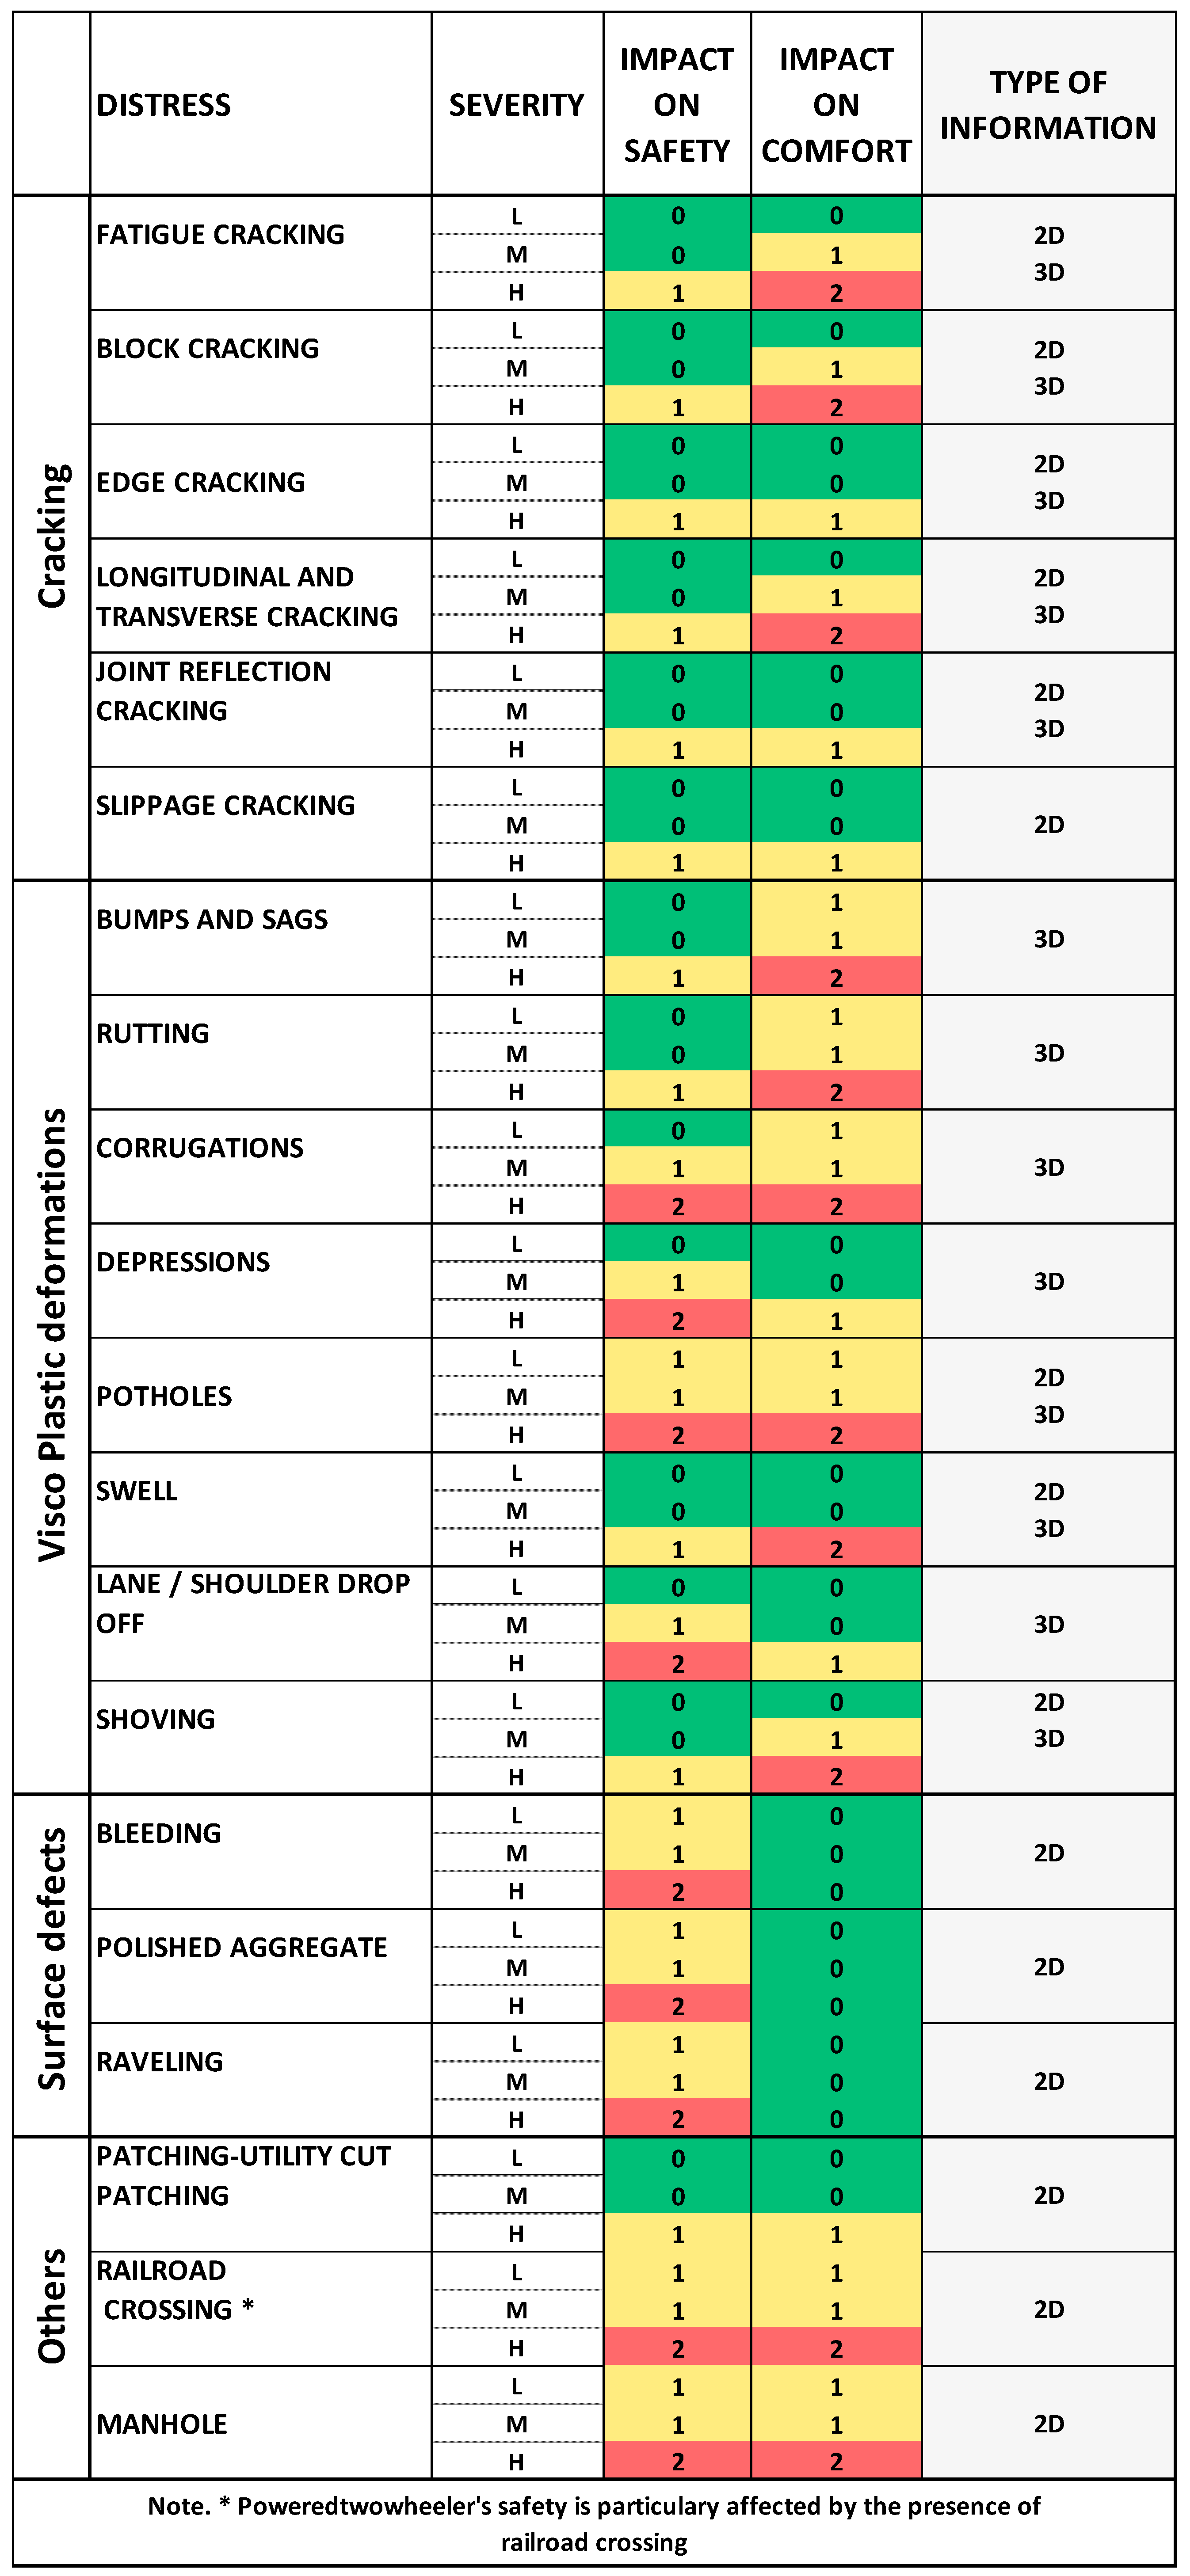
Figure 1 summarises the process: in the left part, each distress is classified in term of impact on comfort and on safety, using a scale from 0 to 2 (where 0 is low impact and 2 is the maximum impact). In the right part of
Figure 1, the type of information required (two-dimensional (2D) or three-dimensional (3D) information) related to each distress, and spatial criteria for identification are illustrated.
The first thing standing out from the analysis is that the low level of all distress is negligible in terms of safety, excluding the ones that affect the adherence characteristics (surface defect group), potholes, and manholes, while the railroad crossing is particularly dangerous for powered two-wheelers. Comfort is poorly affected by the surface defect group, while viscoplastic deformation, manholes, and railroad crossing have an evident effect on users driving condition.
Moreover, the right side of the figure clarifies which technology is appropriate for the survey: 3D is the most complete information but it is limited to only a few kinds of distress for economic aspects. These considerations are helpful in one hand because they allow for excluding the low distress level from the analysis purpose, and on the other hand, they are a guide to choosing the best technology for information acquisition.
4. State of Art in Distress Detection
Quantification of pavement crack data is one of the most important criteria in determining optimum pavement maintenance strategies. The simplest survey method is to visually inspect the pavements and evaluate them by subjective human experts. This is a traditional approach, which involves high survey costs; it is time-consuming and often produces unreliable and inconsistent results. Furthermore, it exposes the inspectors to dangerous working conditions on highways [
2,
3]. To overcome to the limitations of the subjective visual evaluation process, several attempts have been made to develop automated devices in pavement distress acquisition and detection. These innovative methods, in fact, provide a non-subjective, highly productive, and accurate data set, which enables the production of quantitative analysis of the pavement condition.
The most recent systems are composed by one or more acquisition devices and post-processing applications for semiautomatic or automated data extraction procedures, based on computer vision and image processing algorithms [
33,
34,
35,
36].
However, due to the irregularities of pavement surface and to the miscellaneous presence of distresses on the pavement surface, there has been some limited success in accurately automated cracks detection and classification, which have limited the massive adoption of this kind of system [
37,
38,
39].
While the use of automated pavement condition surveys is becoming more and more common, many agencies still rely on manual methods to provide their pavement condition data. There is no doubt that automated pavement condition surveys are more efficient and safer than manual pavement condition surveys; however, the quality of automated survey data has been under heavy scepticism since its conception. Several studies [
2,
37,
39] have shown that, in most cases, the results of the two procedures are statistically similar: the massive presence of irregularities might produce incorrect detection classification and quantification, especially when the irregularities are in the same portion of the surface [
2].
Type, severity, and extent of pavement distresses are the keys to assessing the pavement conditions, and even to determine the most suitable survey technical solutions.
In this section, an attempt is made to present the current practices, and the emerging technologies for data acquisition, while considering them in connection to the information requests for a PMS that is safety and comfort oriented. To correspond to the emerging information needs of the Road Agencies that are involved in PMS realization, the vehicles used for surveys are on a multisensors platform: generally, they provide georeferenced information using a positioning system based on GPS, integrated with the data from camera, laser, and other sensors, in order to describe the road environment. In order to provide a classification of the available detection technologies for a PMS data set acquisition, the following criteria have been considered, as reported in
Table 3:
precision, indicating the statistical variability;
accuracy, indicating the systematic error as cause of difference from the true value;
spatial resolution, indicating the smallest change it can detect;
productivity, indicating the rate of production in time;
cost of implementation; and,
automation, implementability in automated process.
Each device has been classified from “Low” to “Very High” in terms of above-mentioned criteria.
4.1. Digital Camera
Digital camera is a mature technique in distress detecting: commercially available devices acquire 2D images in the visible spectrum of light. The image is captured through a digital photosensitive sensor CCDs (Charge-Coupled Devices) or CMOS (Complementary Metal-Oxide Semiconductor). Currently, the two sensors are comparable as performance and use [
40], but the CCDs are the most used sensors for the identification of distresses because they are cheaper and have a greater chromatic accuracy.
After the acquisition, a digital image processing is used to extract the distresses features using image analysis algorithms: the different distresses are separated and classified according to some parameters, such as the width, the direction of propagation [
35,
38,
39,
41], and the pixel colour variation [
2,
34,
36,
42].
Among the first application on features detection using 2D images, several authors tested the method on potholes, getting good results. Images were first segmented into the defect and non-defect regions, using histogram shape-based thresholding; subsequently, the regions having characteristics, such as to be classified as potential potholes, were analyzed by morphological operators. The particular shape and dimension of potholes make their identification easier by image detection algorithms, even when using low camera resolution. In improving the resolution of the camera, even crack identification and measurement become a reliable procedure.
In fact, most studies on 2D images show that the identification and classification of cracks have led to a high success ratio: studies show that the accuracy of cracks measurement may be higher than 95%, with a lower limit of 70% [
2,
38,
43,
44].
A non-treasurable aspect of the camera in data acquisition process is the possibility of being easily implemented on a traveling vehicle, equipped with several sensors and a positioning system in order to improve the survey productivity and integrate the georeferenced information component [
34,
45]. As the vehicle moves along the road, some factors, such as the vehicle speed, camera position, settings, and environmental factors, might affect the final resolution of images and compromise the distress detection. In order to properly detect the distresses, the images must undergo ortho-correction processes in order to correct the deformations and exclude unwanted shadows and other light noise that occurred during the acquisition [
46,
47].
As an example of final image resolution, a camera with an angle of view of 45 degrees approximately and placed at 1.2 m height provides a ground sample area of 1 m2 and while considering 20 mpx sensor resolution we can expect a ground sample distance (GSD) that is equal to 0.2 mm.
Most commercial vehicles that are used for inspections are equipped with cameras that are not used directly to measure and identify the distresses, but are used to assist other measurement devices, such as linear cameras, triangulation, or LiDAR devices.
Most recent applications in pavement inspections employ remote sensing procedure using UAVs (Unmanned Aerial Vehicles) and the image processing and pattern recognition techniques as for the terrestrial application [
48]. However, at a certain height of flight, the spatial resolutions of these images limit the ability to detect the pavement distress, such as individual cracks, because most of their width is less than 0.01 m. A CMOS with sensor resolution 12 mpx integrated on a UAV platform flying at a height of about five meters produces a spatial resolution of about 3 mm, with a maximum accuracy of about 7 mm [
49]. Under these conditions, rutting, alligator cracking, and transverse cracking distresses can be identified.
4.2. Line Scan Camera
The line-scan camera is ideal for applications requiring both high acquisition rates and high resolution. A line scan camera produces a sequence of single lines pixels (generally 2000x1 pixel until 8192 pixels per line in higher resolution devices): in order to build up a two-dimensional image of the pavement the camera is moved perpendicular to the line of pixels, generally by a terrestrial vehicle [
50]. Line scan camera can assure a high daily productivity in the survey phase, in fact, a high frame rate of the camera (such as 28 kHz) allows the vehicle to drive up to 90 km/h, but it can result in a time consuming and expensive post-processing and distress detection phase [
8,
51].
Line-Scan cameras were mainly used for crack detection from 2D images: the distress visibility is inversely proportional to spatial resolution. In fact, for a camera that is characterized by a resolution equal to 2048 pixel per line mounted at the height of 1.80 m, the visible crack width is equal to 2 mm. Increasing the resolution to 4096, the visible crack width comes down to 1 mm [
41,
52].An important improvement in high resolution distress detection has been the adoption of Laser- Illumination based technology in 2005, which overcame to the sunlight and shadows disturbs [
3,
8,
51,
52]. The commercial solutions based on this technology are the so-called Laser Road Imaging Systems [
53]: they can work nighttime or daytime, as long as the pavement is dry. LRIS system uses two cameras which produce synchronized and partially overlapped pair images to form a single image.
4.3. 3D Laser Imaging
Several pavement surfaces distress is tridimensional: 2D dimension (surface) and the height differences (depth). 3D sensors include a variety of technological solutions, and most of them are based on laser profilers in combination with imaging. This technology has been widely applied for quality controls in manufactory, and only in recent years, it has been applied in pavement surface analysis [
3,
8,
52].
One of the most used 3D reconstruction technique is based on the triangulation, in which a laser line, or a LED linear light as an auxiliary light, projects a ray on the road surface. One or more CCD cameras realize the triangulation system, by means detecting the shape of the laser line projection on the near flat pavement.
3D Laser Imaging has the potential to measure different pavement surface distresses at high speed and in full automation: cracking, rutting, pothole, patching, faulting can be easily detected by the system [
42]. According to several authors [
2,
3,
8,
53], the system can effectively detect cracks that are equal to and greater than 2 mm wide under controlled laboratory environment and consistent results under different lighting conditions were obtained [
47]. This technology is mature and commercially available as Laser Crack Measurements System (LCMS) and adopted in several systems, such as ARAN, Dynatest, ROMDAS, PaveTesting, and Pavision [
3,
8]. The system consists of two units, which are composed by a spread line laser and a 3D camera each, mounted off axis. The laser scans a 4m line width, with 1 mm transversal resolution on the road surface, while the cameras capture an image of the projected laser line. The captured data consists of two types: height of the pavement surface and intensity on the pavement surface.
The longitudinal resolution is a function of the vehicle speed and the laser scanner rate: for example, while considering a 60 km/h driving speed and a scan rate equal to 5 kHz, the scan line interval is equal to 3 mm [
54]. Moreover, according to [
8,
35,
36], the crack detection process may be improved using 2D high resolution camera.
This system has as a disadvantage in the high cost of the equipment, and the advantage of detecting the entire transversal road profile by using a sufficiently high projection frequency laser and adequate cameras.
4.4. Terrestrial Laser Scanner
Among the technological solutions that are commercially available for pavement distress detection, the laser scanner is one of the most recent, high performing, and accurate.
Laser scanner technique is based on LiDAR (Light Detection and Ranging) technology; it allows for obtaining very accurate and high-resolution 3D information of the object scanned by dense point cloud. It is based on two principles: time of flight and phase shift. The time-of-flight sensors estimate the distance between the target and the center of the instrument by the measure of the time that elapsed between the emitted and the reflected laser signal, while the phase shift sensors are based on the measurement of the angular offset between the emitted and the reflected signal. Phase shift sensors have a more limited range than those at time of flight (<150 m), on the other hand, they have a higher acquisition frequency (more than a million points per second). The accuracy obtainable with time-of-flight instruments is between 3 and 6 mm @ 100 m, values that increase with increasing distance [
55].
The Terrestrial Mobile Laser Scanners, also commonly called Mobile Laser Scanner (MLS), are particularly interesting; they allow for the acquisition of 3D data by means of one or more scanners that are mounted on a mobile platform (vehicles, boats, trains); this technique considerably reduces acquisition times and costs when compared to traditional techniques [
56]. Typical ranges of 3D accuracies for the MLS system in the case of pavement surface is 1cm and the point density is greater than one thousand points on a square meter. The density of the point cloud depends on the traveling speed of the mobile platform [
57], the angular resolution of the sensor, and the rotation velocity of the laser mirror: balancing these parameters the accuracy of the resulting 3D point cloud can be improved.
Applications of distress detection by the laser scanner point cloud deal with the automated approach for detecting road roughness and potholes, using multi-level thresholding [
58]. Moreover, excellent results [
59] have been reached in comparing IRI values determined on profiles obtained by TLS with those that are obtained through standardized techniques (about 90% of correlation). Measurements performed with precision levels and laser profilometers have a correlation of 99% with TLS data; comparisons were made with data from three test areas, each with different roughness condition [
60].
Moreover, due to the huge amount of information acquired, the 3D point cloud can be used for general road asset management. Authors propose several applications on low areas that are susceptible to drainage problems [
61], or a semi-automatic procedure to reconstruct longitudinal grade and the cross-slopes of a taxiway starting from a DEM [
61] and a method in order to identify and quantify the fault size at each joint of apron slabs from terrestrial laser scanner data [
62].
5. Results
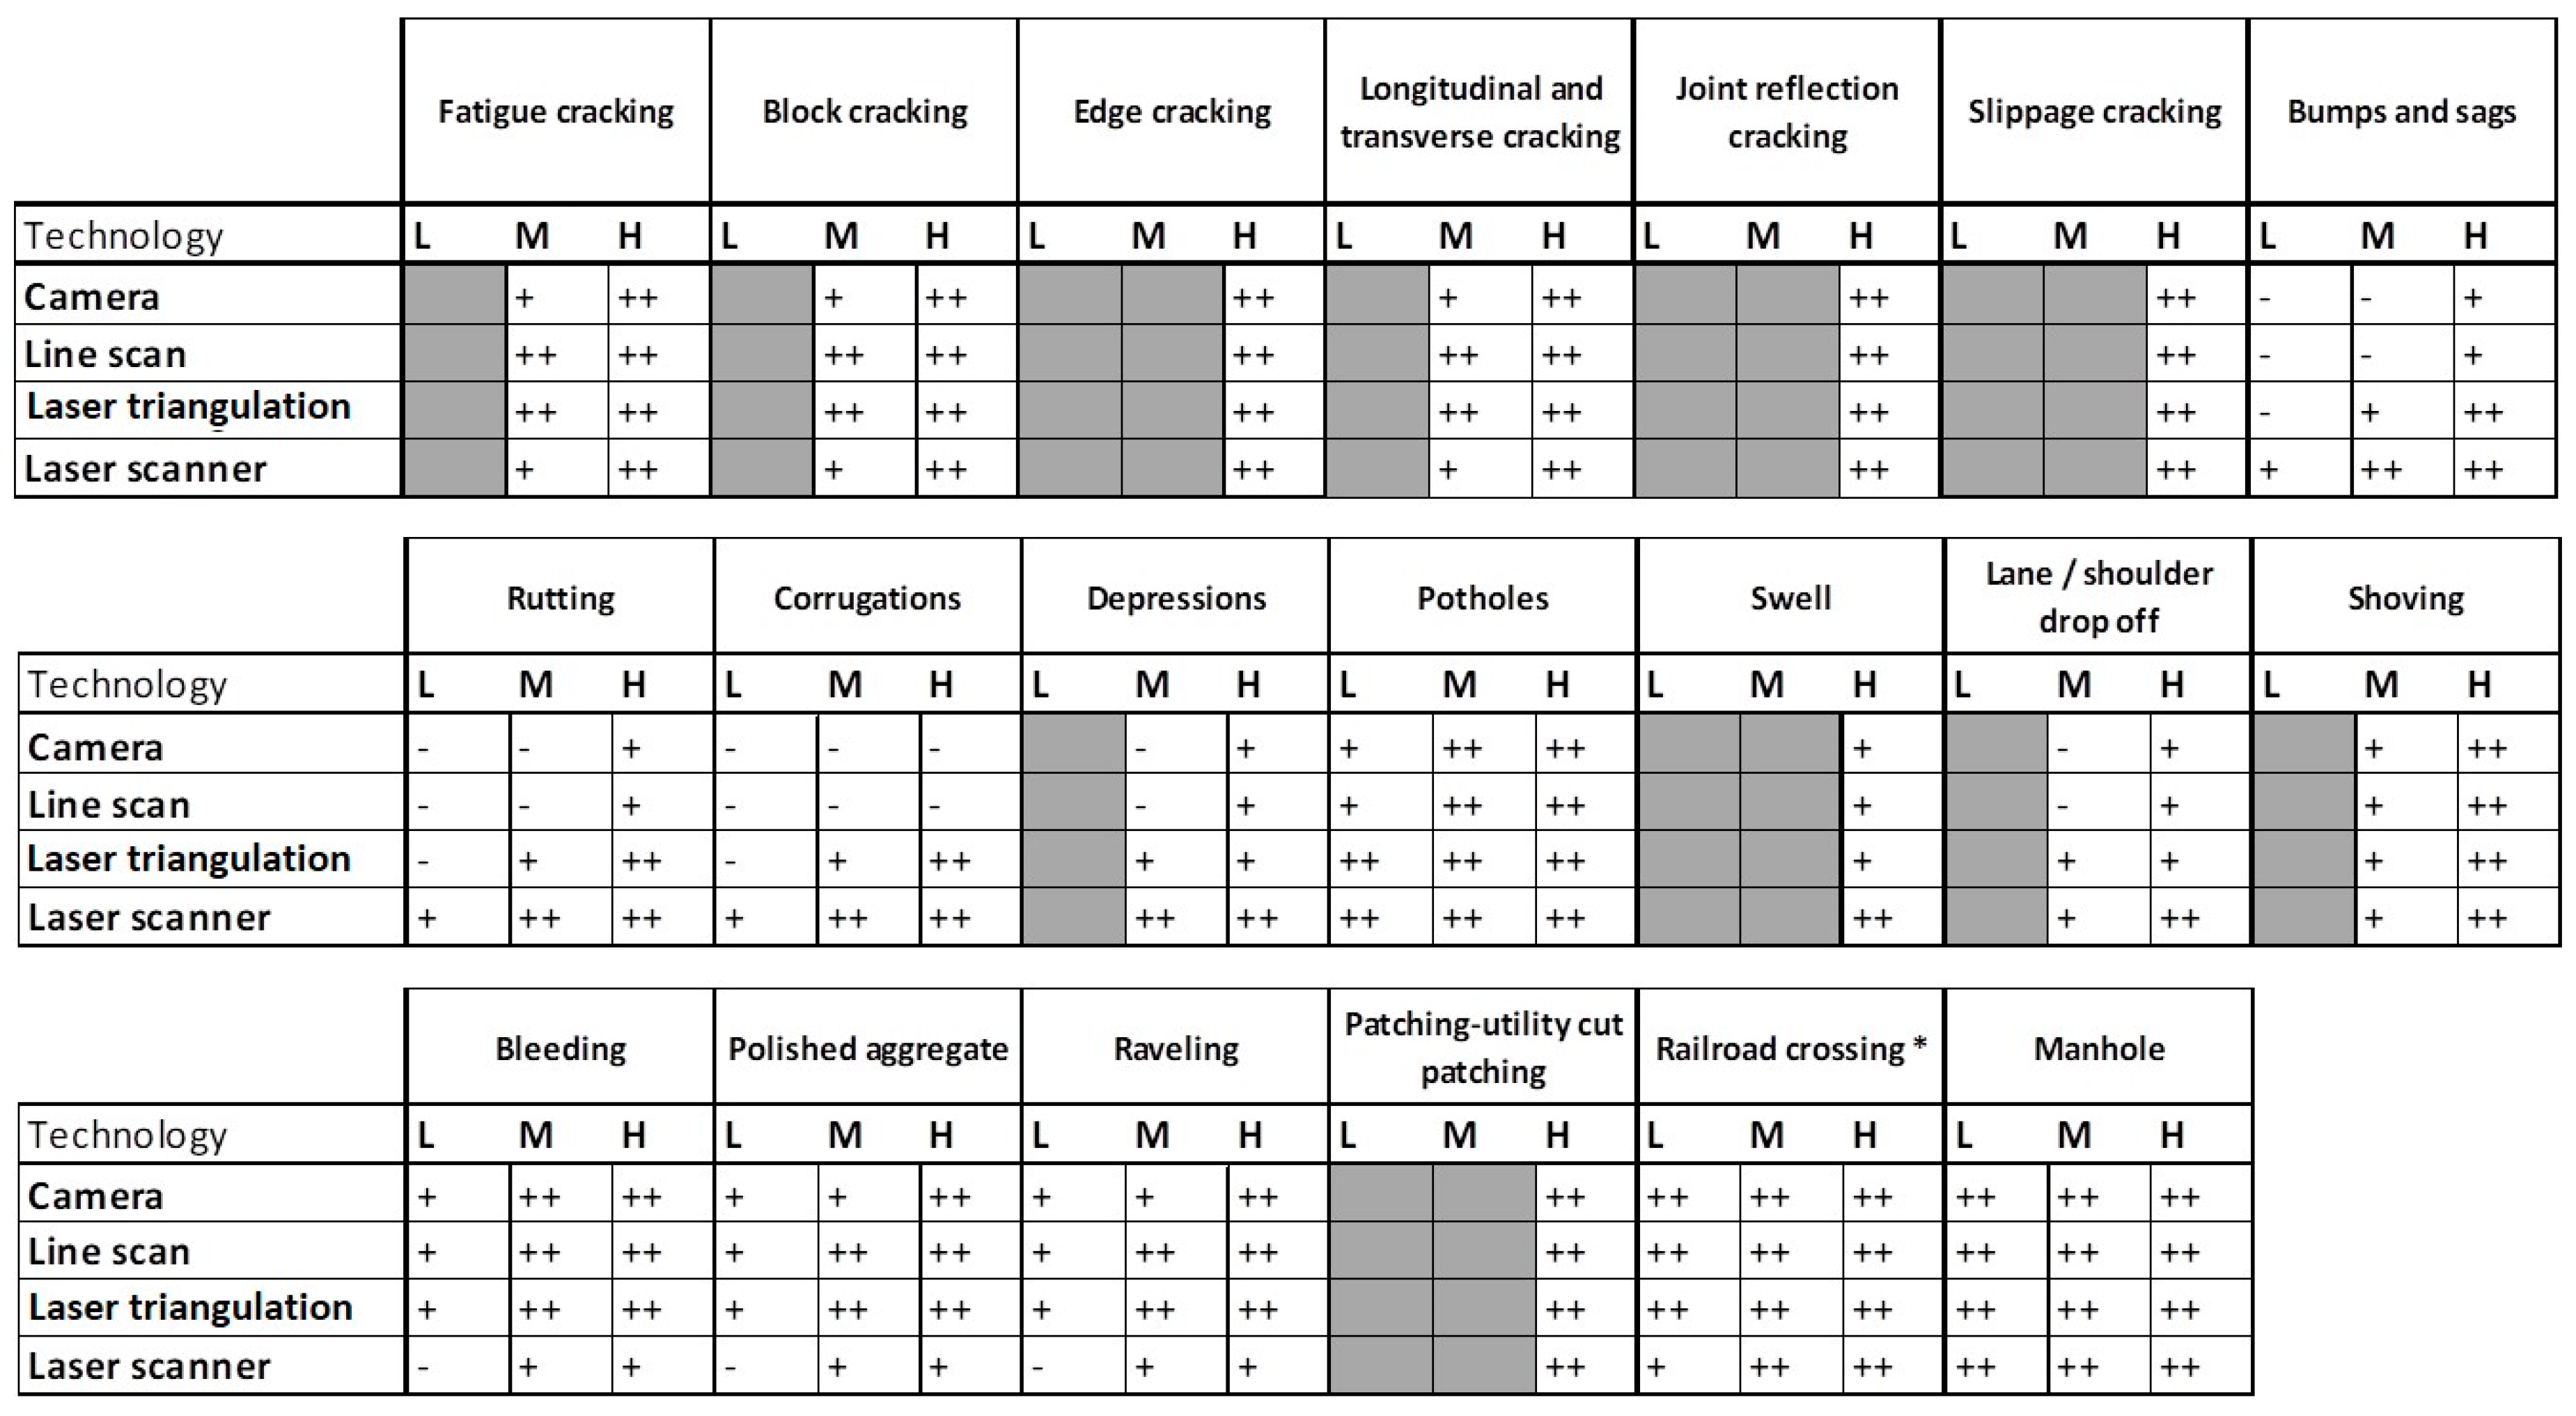
The first step of the present review has been the classification of the common distress in terms of impaction comfort and safety, in order to realize an effectiveness PMS. In order to correspond the information need, the most popular technological solutions have been considered in order to classify them according to their appropriateness in capturing road pavement data.
Figure 2 summaries the result of the review: each distress has been evaluated as “influent” (white block) or “not influent” (black block) on comfort and safety. Subsequently, according to the geometric features and the severity level of each distress, the appropriate technology for information acquisition has been evaluated, according to a symbolic scale, where “- “means not adequate, “+” means adequate to the survey, and “++” means totally adequate.
The analysis summarized in
Figure 2 shows that the distresses included in the racking group (fatigue cracking, block cracking, edge cracking, longitudinal and transverse cracking, joint reflection cracking, and slippage cracking) are easily recognizable by all technologies considered, excluding the low severity case. The distresses classified in the viscoplastic deformation group (bumps and sags, rutting, corrugation, depressions, potholes, swell, lane/shoulder drop off, and showing) are perfectly detected by the laser scanner, and good results are also obtained while using laser triangulation, because the required information is a different in height. The surface distresses (bleeding, polished aggregate, and raveling) detected by camera, line scan, and laser triangulation technology get good results in terms of accuracy, while the laser scanner is not performant for this group of distresses. The distresses of the last group (patching, railroad crossing, and manhole) are easily detected by all of the technological solutions considered in this paper. This framework can address the survey design and planning starting from the information need for the PMS.
6. Conclusions
A Pavement Management System should guide an Agency in a proactive process, oriented in assuring safety and comfort to all road users through the continuous process of inspection, detection, and mitigation of pavement conditions. This consideration highlights the importance of using specific tools to identify the emerging pavement distresses, supported by the current pavement condition knowledge acquired by technological solutions. A crucial point of the process is the identification of the alert level for each distress, and their effect of safety and comfort reduction for all road users. Another important issue for an Agency is the choice of the proper equipment to employ for intensive road distress detection, depending on the project scope, the budget, and the accuracy required.
The attempt of this paper is drawing the boundary of this operative process focused on distress identification and technological overview aimed for obtaining a proper equipment frame for the PMS implementation, based on information acquired by automated or semi-automated technologies. Crucial aspects for the PMS implementation are the high survey costs and the restrictive operational conditions.
Encouraging the implementation of a basic level of PMS, which is safety and comfort oriented, based on low-cost technologies solution, and can overcome a lack of information and tools, can facilitate the pavement management, even for minor road authorities.
According to the evidence of the review, all distresses play a role in the definition of a global condition index for the road pavement, but the ones affecting the adherence conditions and those that compromise the ride quality, are essential to be detected for safety reasons. Moreover, the knowledge of the current condition of the pavement is fundamental for the definition of an efficient PMS.
In this regard, the role of the technologies for the survey is essential in order to minimize the subjective factor of the traditional methods and in order to improve the productivity and the repeatability. The considered technologies are different in performance and accuracy, moreover, they are specialized in acquiring some particular features of the pavement distresses. One of the preliminary issues to PMS implementation is the definition of the specifications of the survey.
Further researches should be addressed on the evaluation of accuracy and precision of the different types of devices, comparing them and analyzing the possibility of improvement due to the image analysis technique on the final distress detection. In order to encourage the automation of the post processing, a definition of distress severity level in terms of automated index could be very helpful.


