1. Introduction
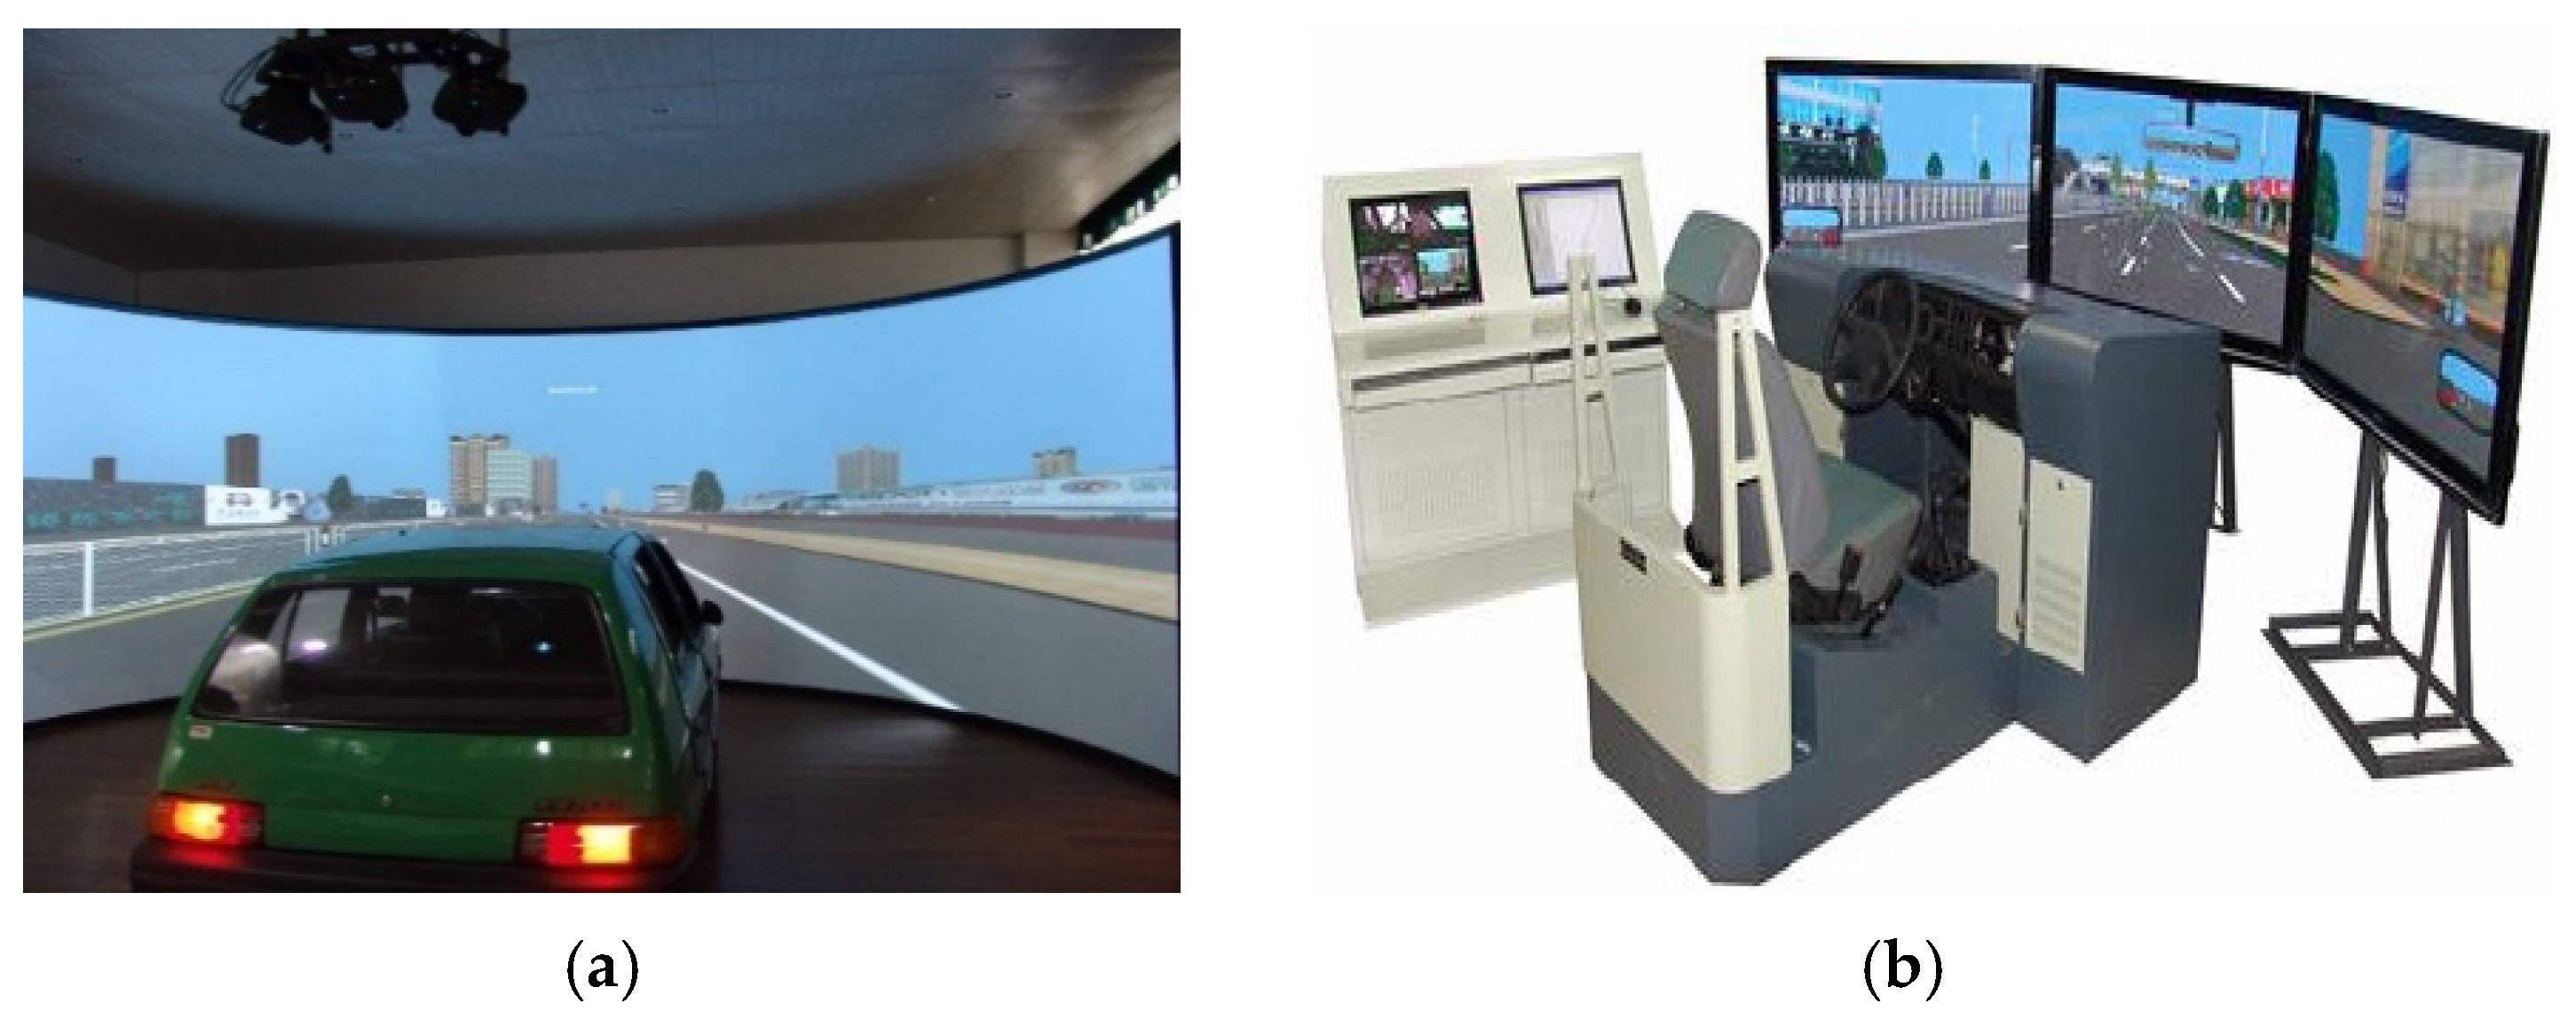
The vehicle driving simulation system is an experimental equipment for the simulation research and development of automobile active safety performance based on the whole performance of a “human-vehicle-road-environment” closed-loop system with the support of electronic computer, hydraulic pressure and control technology (Chen, 2021) [
1]. The vehicle driving simulation system can provide a safe environment for driving research, can conveniently and economically formulate research strategies related to driving behavior, and has the characteristics of a wide range of experimental conditions, regulation and conversion, and online processing and classified storage of experimental data. At present, it has been widely used in the research of vehicle intelligent control, road traffic facilities, intelligent traffic system, driver behavior characteristic evaluation, self-driving and so on for the purpose of improving safety. For example, Min-Wook Kang et al. utilized a driving simulator to assess the impact of auditory warning sounds on driver compliance with roadside safety signs, revealing that compliance significantly increased when AWS was present (Min-Wook Kang et al., 2018) [
2]. Although driving simulators are frequently used in studies, there is relatively little evidence to confirm their effectiveness, that is, how accurately they represent or reproduce real-world driving (Wynne et al., 2019) [
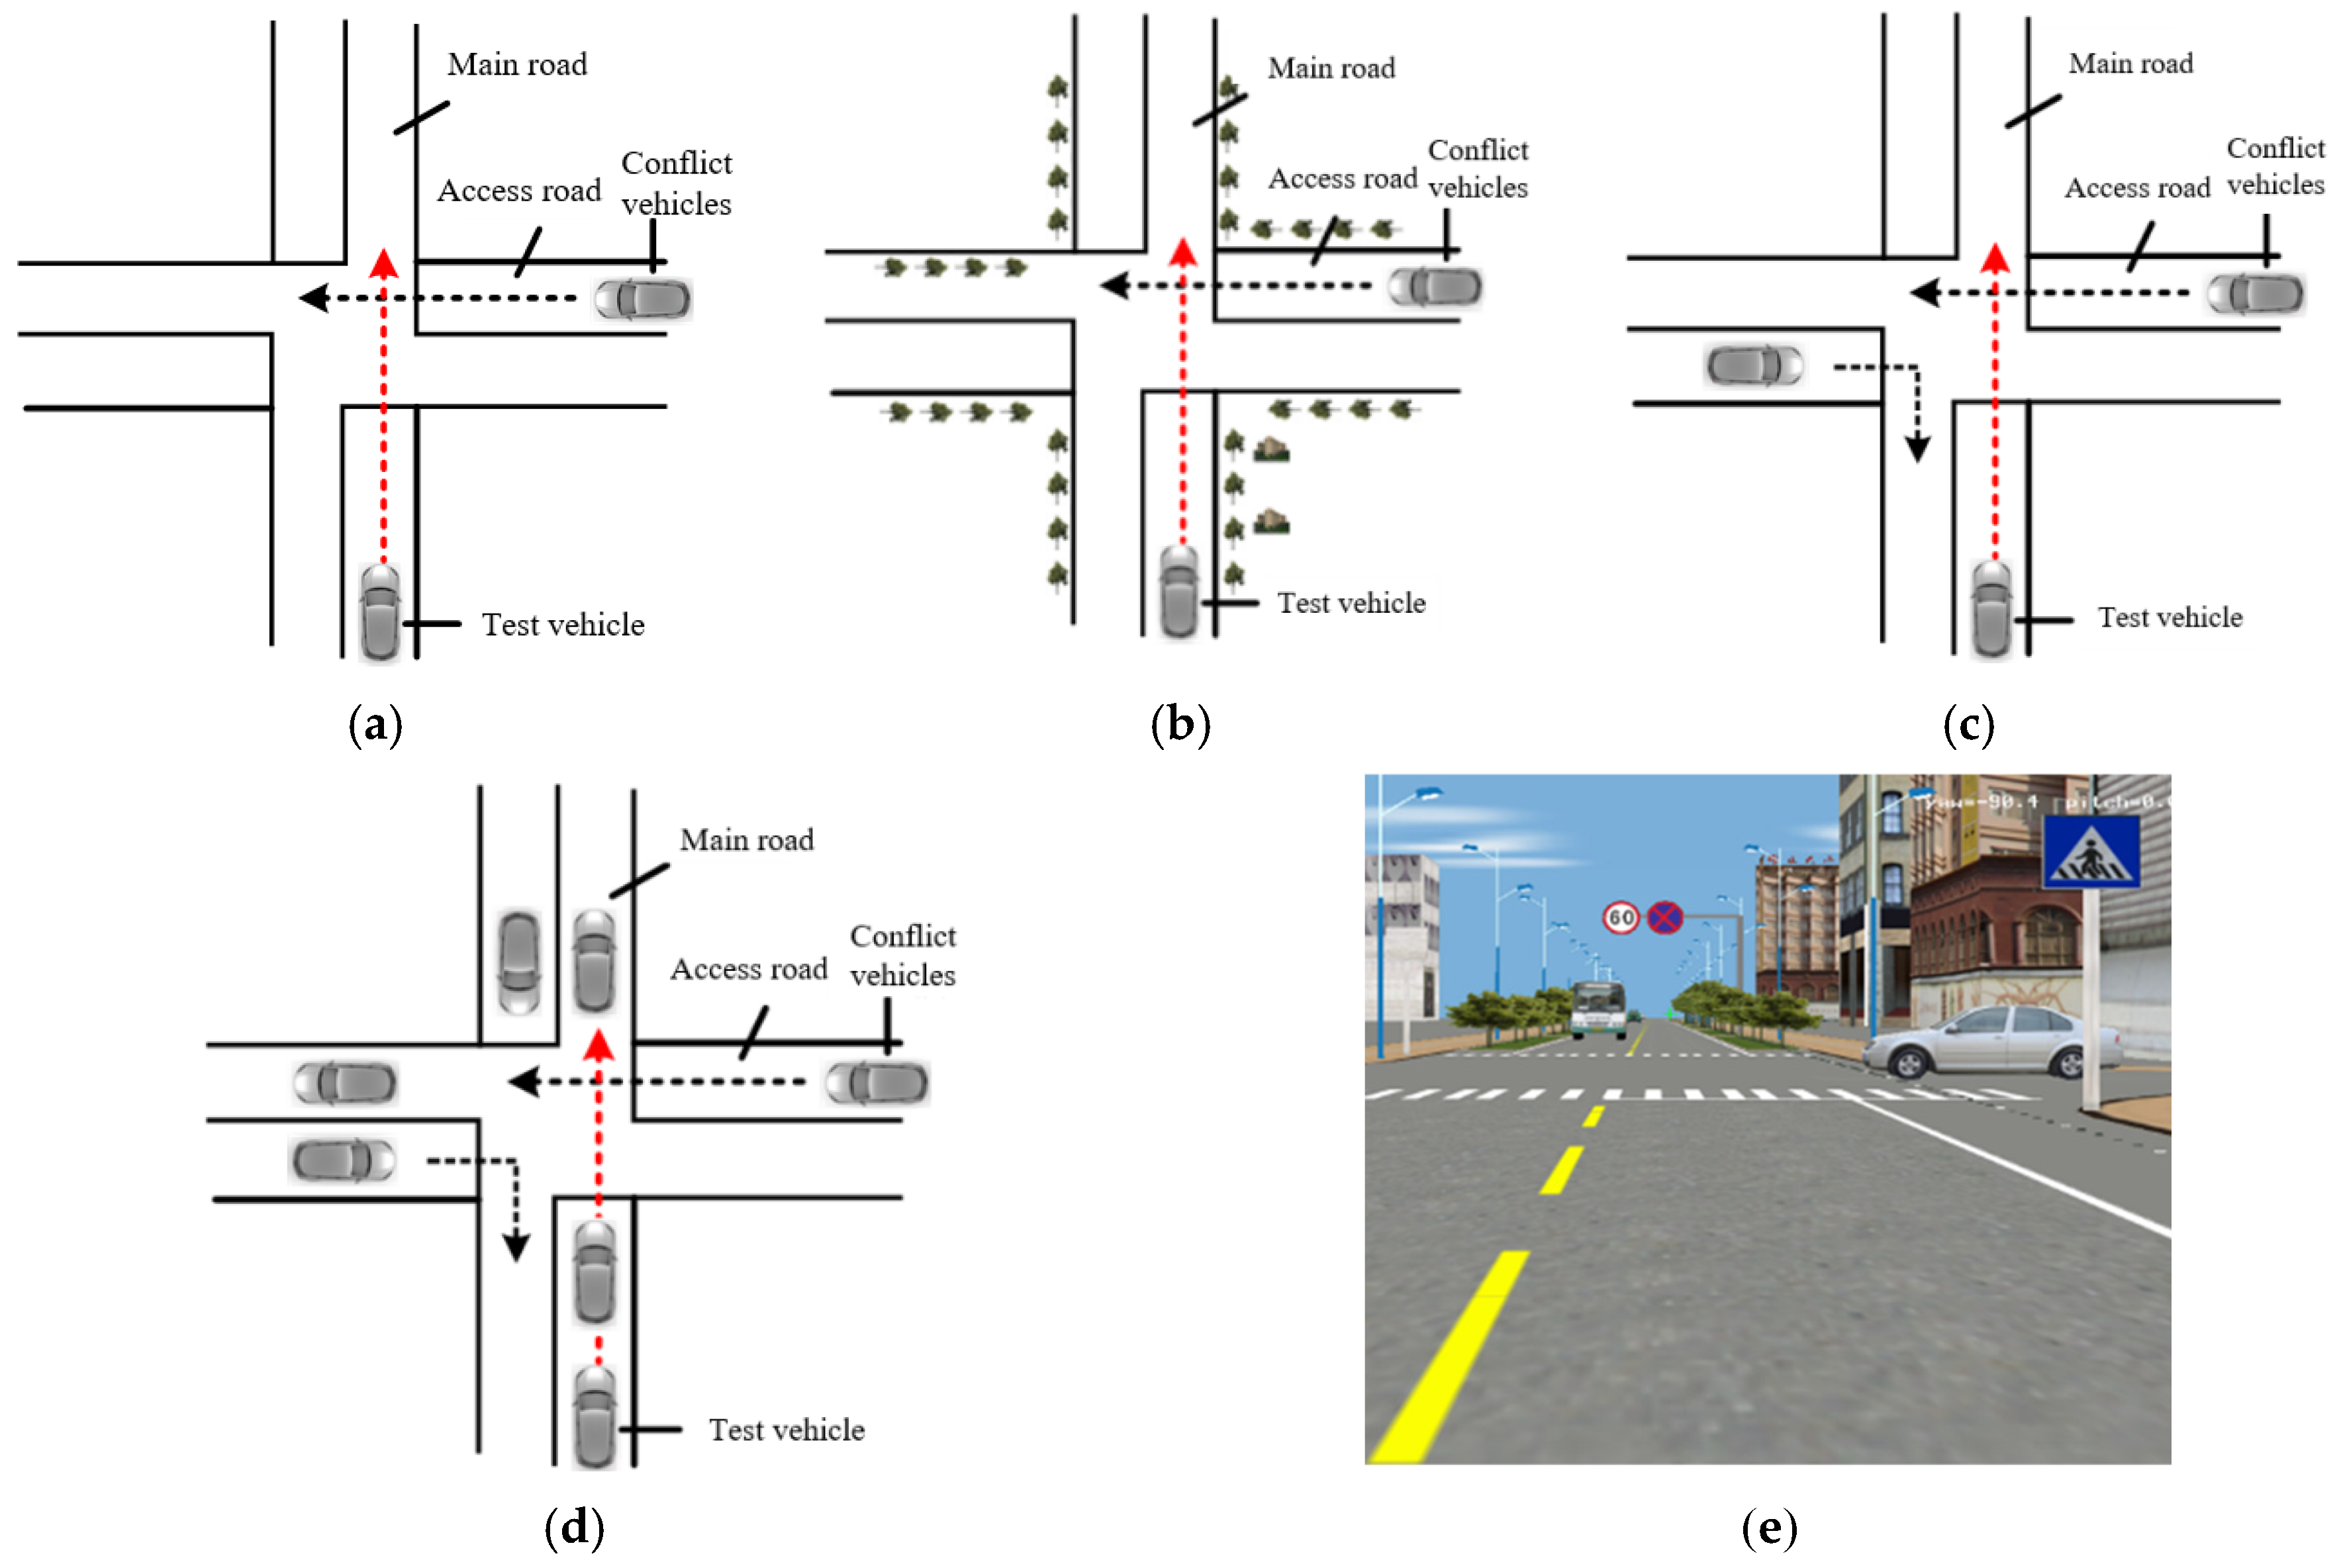
3]. The vehicle driving simulation system offers an artificial virtual environment. In addition, if the risk conflict scenarios designed in this study were conducted directly in real-road vehicle experiments, they could involve high safety risks and road test approval restrictions. Therefore, this study opts to create controlled conflict scenarios in a driving simulator, aiming to assess the simulator’s ability to replicate drivers’ human factor responses under safe, controllable, and repeatable conditions. The experimental results may be affected by various factors, such as the scientific nature of the experimental goal conception, the rationality of the content selection, the representativeness of the sample (subjects) selection, the accuracy of the scenario design, and the realism of the humanoid perception. Therefore, evaluating driving simulation systems can provide new research ideas and directions for simulation systems. This is crucial for enhancing the usability of driving simulation systems and promoting their intelligent development.
To more clearly illustrate the relationship between existing research and the research gap in this paper, the study of the effectiveness of driving simulators is summarized into three stages: physical validity, behavioral validity, and human factor response validity. The first stage mainly focuses on the physical validity of the simulator, with the core issue being whether the simulator’s hardware system, vehicle dynamics, motion feedback, visual display, and control interface can closely approximate real vehicles and real-road environments. At the beginning of the development of driving simulation systems, validity research focused on analyzing the absolute performance differences between the simulation system and the real vehicle, i.e., basic validity (Wang et al., 2009) [
4]. With the improvement of virtual scenario technology and more accurate vehicle-dynamic imitation operations in the model vehicle, the application of driving simulation systems gradually expanded to driving behavior and other research areas with higher requirements for experimental testing, and validity research also focused more on relative validity, behavioral consistency and other indicators, for which statistical tests are the main method for verifying validity (Groeger and Murphy, 2020) [
5]. For example, Groeger completed the validity calibration of a simulator in 2019 by analyzing the parameters of driving behavior characteristics such as vehicle speed, braking, reaction time, and decision execution rate in real and virtual scenarios (Groeger and Murphy, 2020) [
5]. The current validity evaluation of simulation systems is more based on the validity evaluation of driving behavior in integrated traffic scenarios (Hussain et al., 2019) [
6]. Wang Junzheng et al. [
7]. proposed an acceleration control-based physical simulation washout algorithm, which can significantly improve the dynamic fidelity of the driving simulator. Overall, research on physical validity provides an important basis for verifying the fundamental performance of driving simulators, but it mainly focuses on device performance, motion feedback, and scene realism, while paying insufficient attention to drivers’ behavioral responses and physiological and psychological changes in complex risk scenarios.
The research focus of the second stage gradually shifts from realism at the equipment level to the effectiveness of driving behavior. This stage mainly evaluates whether drivers’ explicit behaviors are consistent in the two environments by comparing indicators such as vehicle speed, acceleration, braking response, reaction time, lane position, trajectory deviation, and compliance with stopping in simulated environments and real-road environments. Zoeller selected time interval parameters to evaluate the effectiveness of the simulator by studying the braking behavior of vehicles crossing intersections under real and simulated conditions (Zoeller et al., 2017) [
8]. Zhang Yanning et al. designed real vehicle and driving simulation experiments to verify the effectiveness of driving simulation techniques in a study of following speed (Zhang et al., 2020) [
9]. Pawar et al. developed a generalized linear mixture (GLM) model to explore the behavioral (absolute and relative) validity of fixed-base driving simulators by conducting a comparative analysis of different driving behaviors (Pawar et al., 2022) [
10]. Llopis-Castello et al. arranged volunteers to drive through the same section built by the self-developed simulator (SE2RCO) and selected 79 curves and 52 tangents of speed data for analysis (Llopis-Castelló et al., 2016) [
11]. The objective validity of the simulator based on the average and working speeds was ensured by comparing the actual and simulated speeds. Cao et al. confirmed the reliability of driving simulators for driver behavior analysis at urban underpass entrances by continuously recording the speed of real car tests and driving simulator test feature points using two-factor variance analysis (Cao et al., 2015) [
12]. In recent years, driving simulators have gradually been applied to studies of more complex road and infrastructure scenarios, such as underground interchanges, rural road curves, road markings, and traffic safety facility evaluations. Liu et al. used driving simulators and data mining methods to analyze the impact of traffic safety facilities at underground interchanges on driving safety and comfort; Martin-Castresana et al. [
13]. investigated the effect of different road markings on speed control on rural road curves using driving simulators; and Bosurgi et al. proposed new behavioral evaluation indicators from the perspective of drivers’ steering behavior on curves. Tessa et al. verified the validity of a driving simulator with a mobile motion platform by comparing the analysis of motion sickness symptoms in real and virtual driving scenarios (Talsma et al.,2023) [
14]. Larue et al. monitored driver behavior at passive level crossings in the Brisbane area of Australia for three months. They replicated the level crossing in an advanced driving simulator and established the relative effectiveness of stopping compliance and approach speed, validating the effectiveness of the driving simulator through comparison (Larue et al., 2018) [
15]. Zhao Zhiguo verified the validity of the driving simulator data by collecting driving behavior data under different radius steering, regular lane change and emergency collision avoidance steering conditions and clustering the data using an improved K-means clustering method (Zhao et al., 2020) [
16]. Overall, research on behavioral validity can fairly well evaluate a simulator’s ability to replicate driving behaviors, but the focus of such evaluations still mainly concentrates on observable behavior aspects such as speed, braking, reaction time, and trajectory, making it difficult to comprehensively reflect the driver’s psychological tension, risk perception, and physiological arousal in risky scenarios.
The third stage begins to focus on drivers’ human factor responses in risky traffic environments. With the development of human factor engineering and intelligent transportation research, merely analyzing overt driving behavior is no longer sufficient to fully explain the internal state of drivers. Therefore, physiological and psychological indicators have gradually been introduced into driving behavior analysis and the effectiveness evaluation of driving simulators. Napcil et al. evaluated the validity of the driving simulator by analyzing and comparing bicep surface EMG signals in steering behavior (Nacpil et al., 2020, 2021) [
17,
18]. Healey and Picard [
19] collected physiological signals such as ECG, EMG, skin conductance, and respiration during real driving tasks to identify levels of driving stress. Nacpil evaluated the validity of driving simulator data by analyzing surface EMG signals during the steering process, In addition, Kierzkowski et al. [
20]. involved eye movement and skin conductance response analysis in tram simulator studies, reflecting the development trend of human factor data collection in simulator research. Paliotto and Meocci [
21] also developed road safety evaluation procedures from a human factors perspective, illustrating the importance of human factors in road safety assessment. Ghulam et al. [
22] used a driving simulator to analyze the effects of vehicle-mounted attenuator markings on young drivers in work zones. Bella [
23] validated the applicability of driving simulators in speed-related research from the perspectives of continuous speed profiles and speed behavior on two-lane rural roads, respectively. Liu et al. [
24] combined a driving simulator with data mining methods to evaluate driving safety at underground interchanges, while Bosurgi et al. [
25]. further extended the application of simulators to human–machine interaction and driving behavior analysis from the perspectives of simulator console design and steering behavior on curves. Overall, existing studies have provided a foundation for applying driving simulators to traffic safety and driving behavior analysis. However, a systematic simulator effectiveness evaluation framework that integrates driving behavior, biopsychological responses, and comprehensive evaluation methods is still lacking. Overall, behavioral validity research can effectively evaluate the simulator’s ability to replicate driving behaviors, but it is difficult to fully capture the psychological stress, risk perception, and physiological arousal processes of drivers in risky scenarios. Existing studies mostly focus on a single physiological signal or specific driving scenarios and still lack a systematic framework that integrates driving behavior, physiological and psychological responses, machine learning modeling, and comprehensive weighted evaluation.
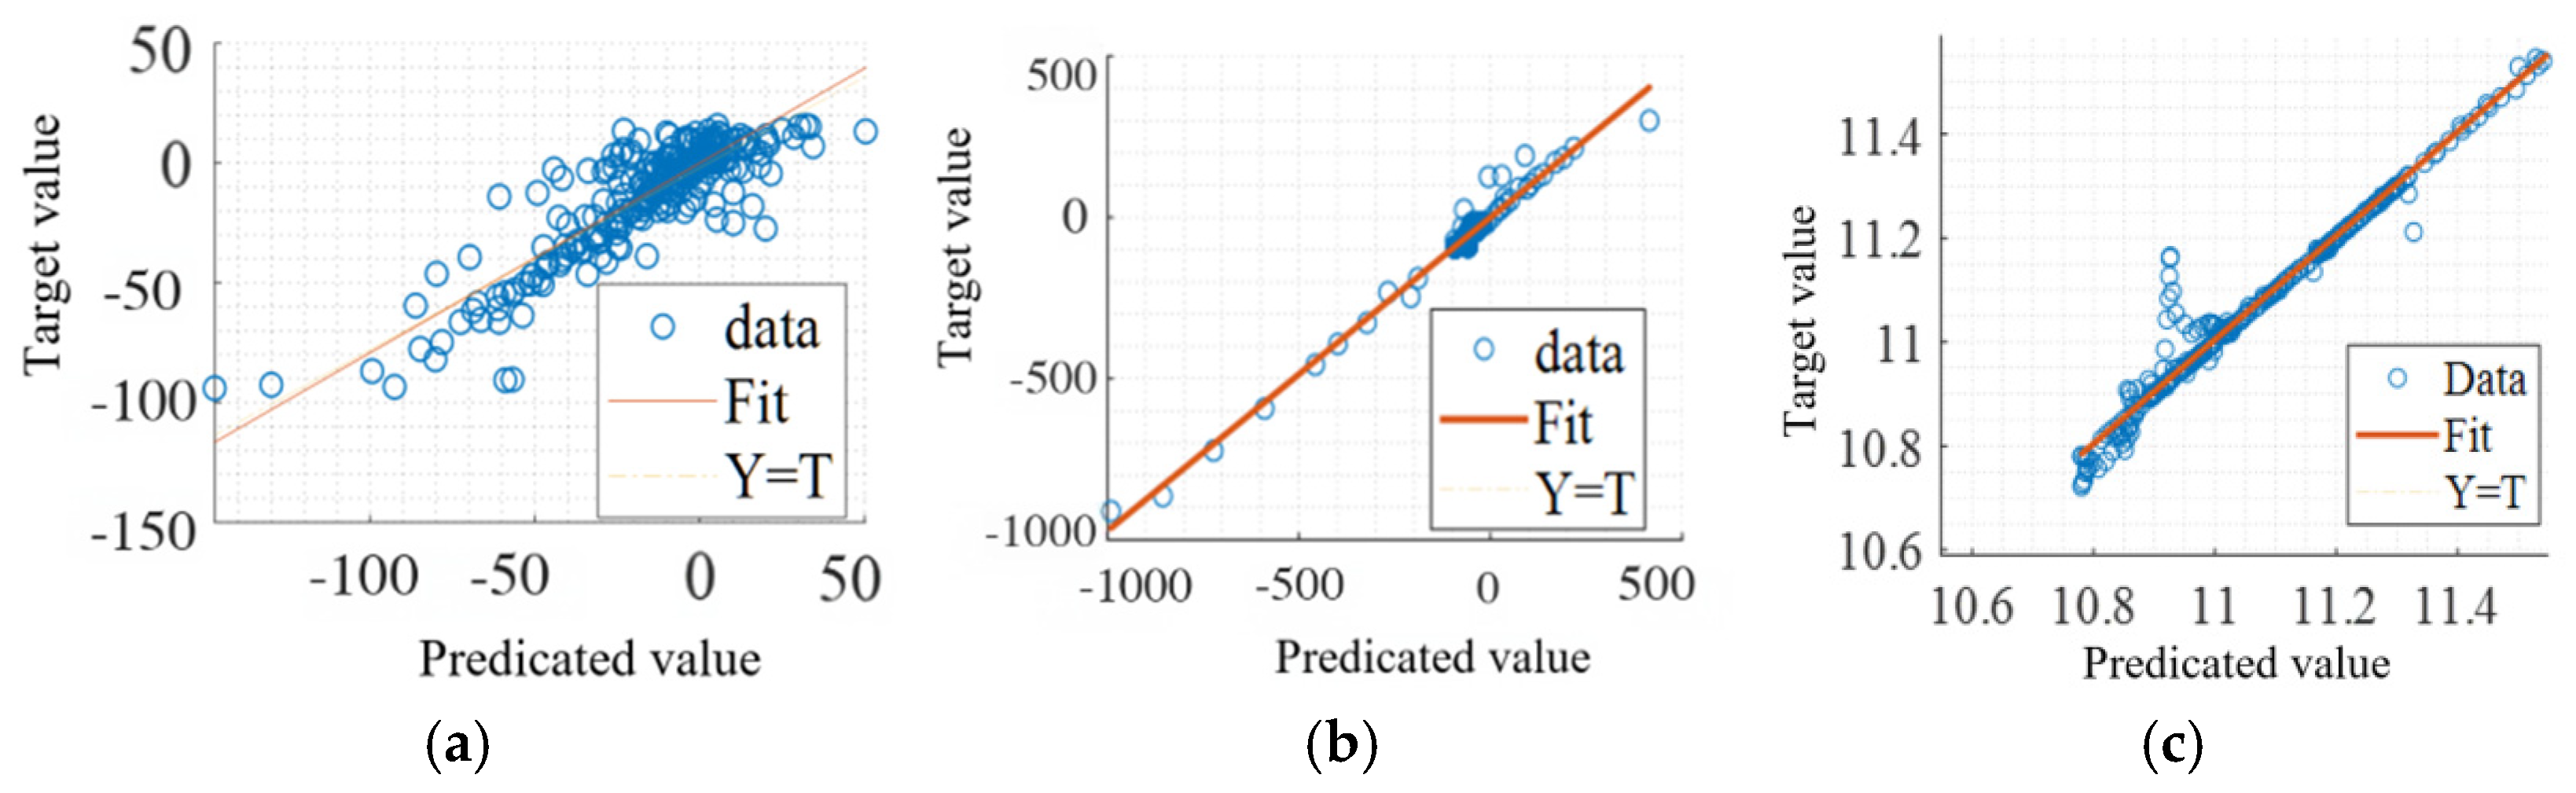
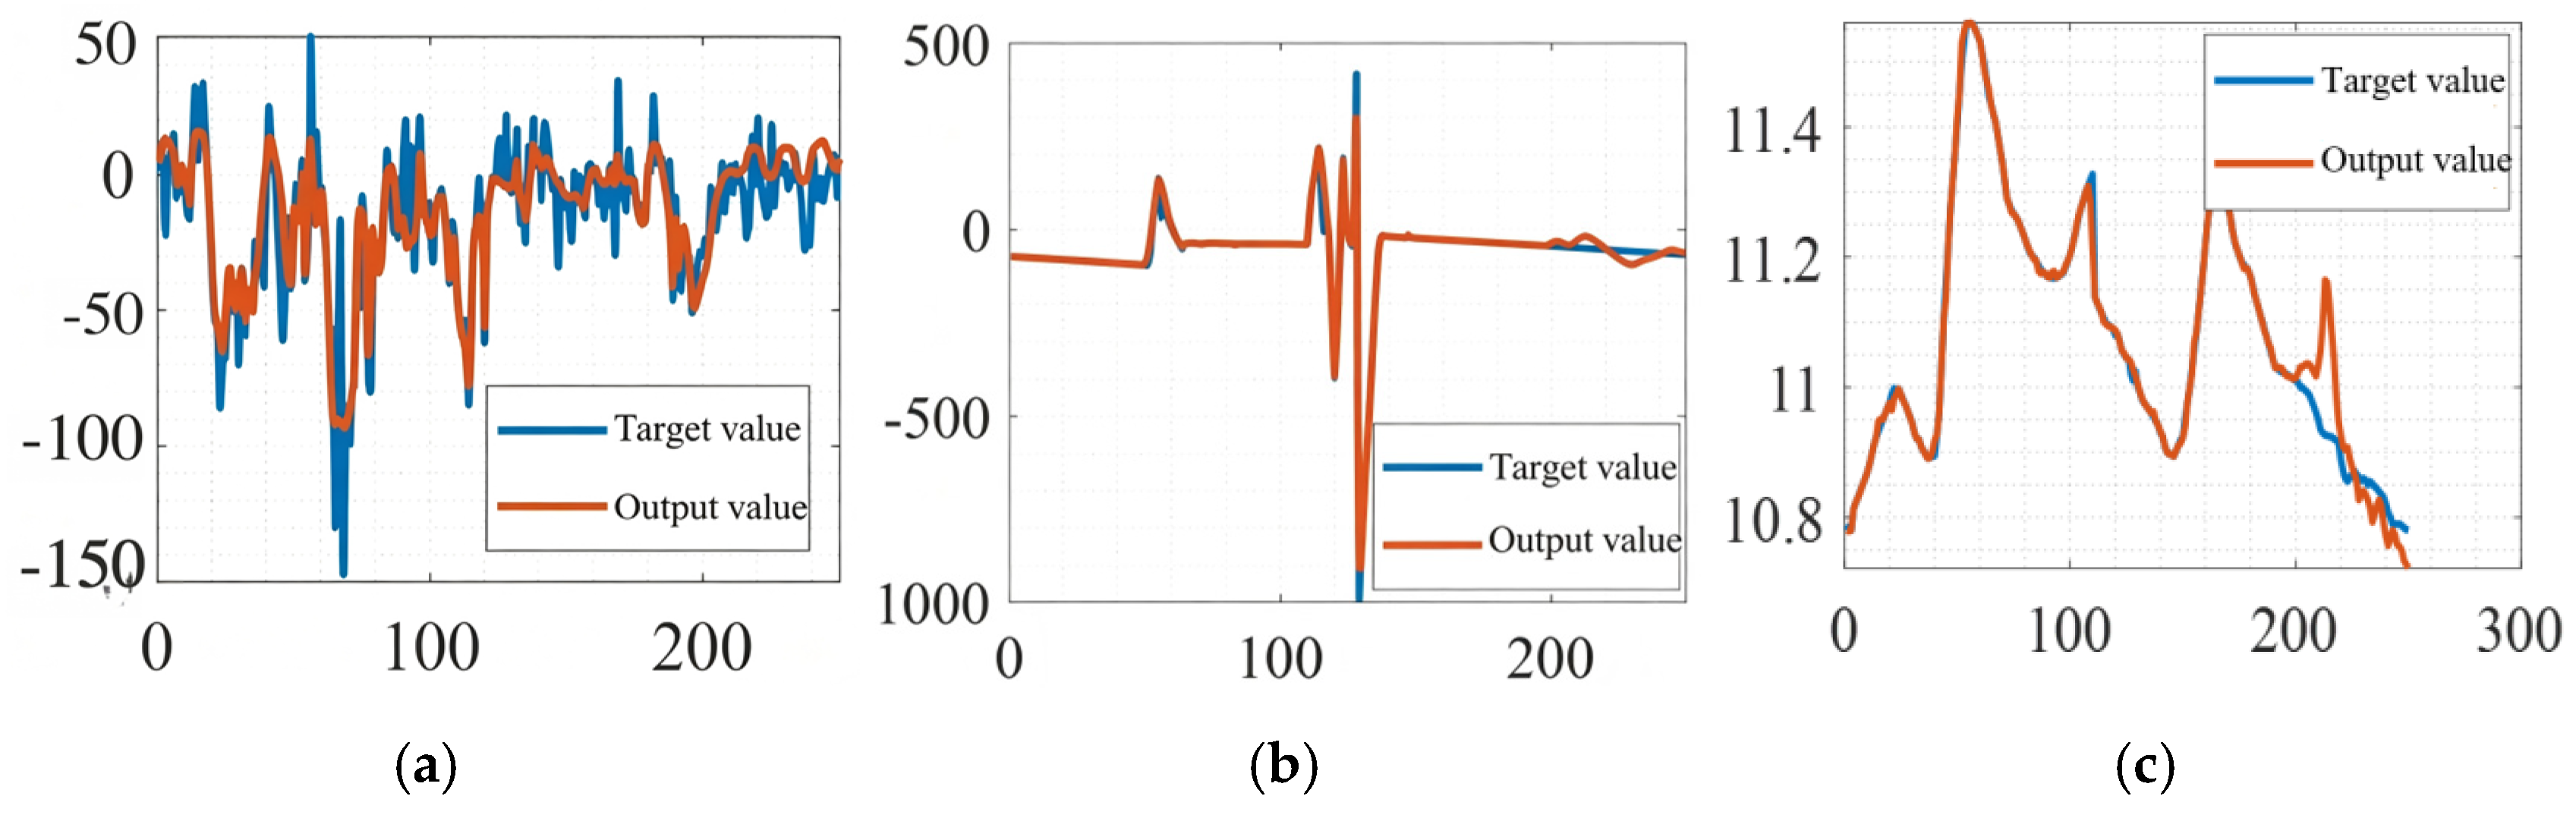
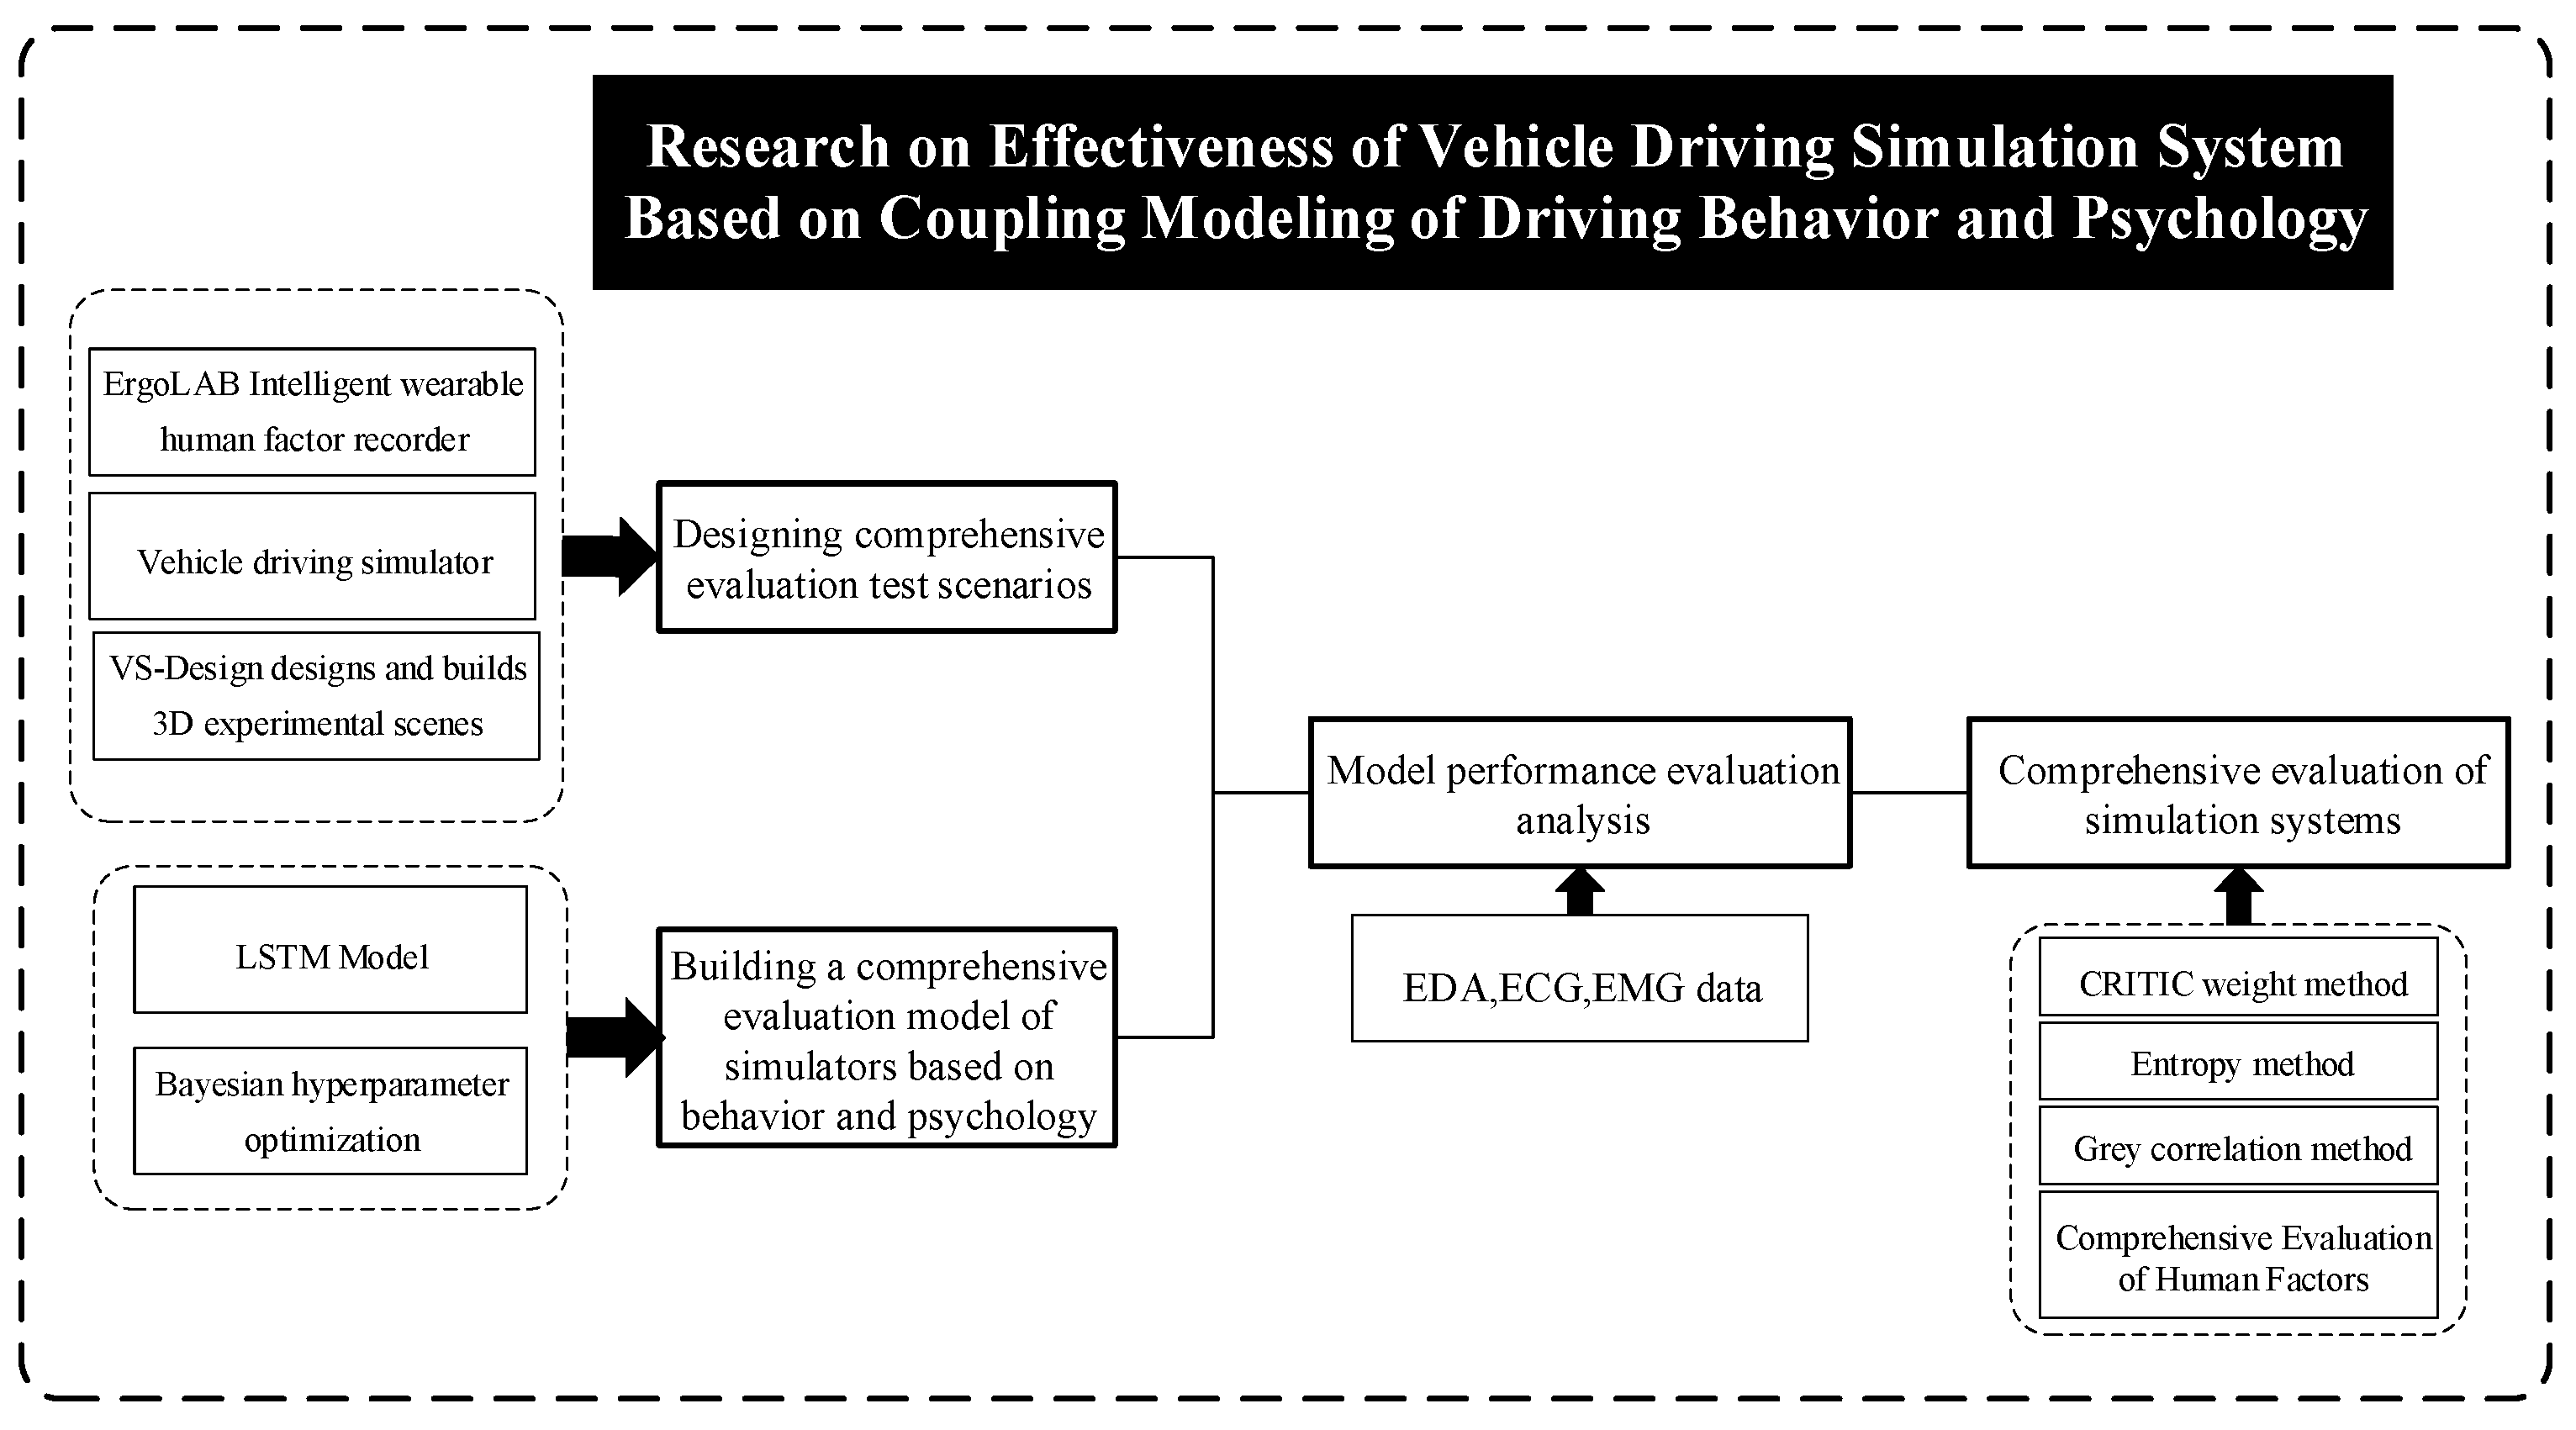
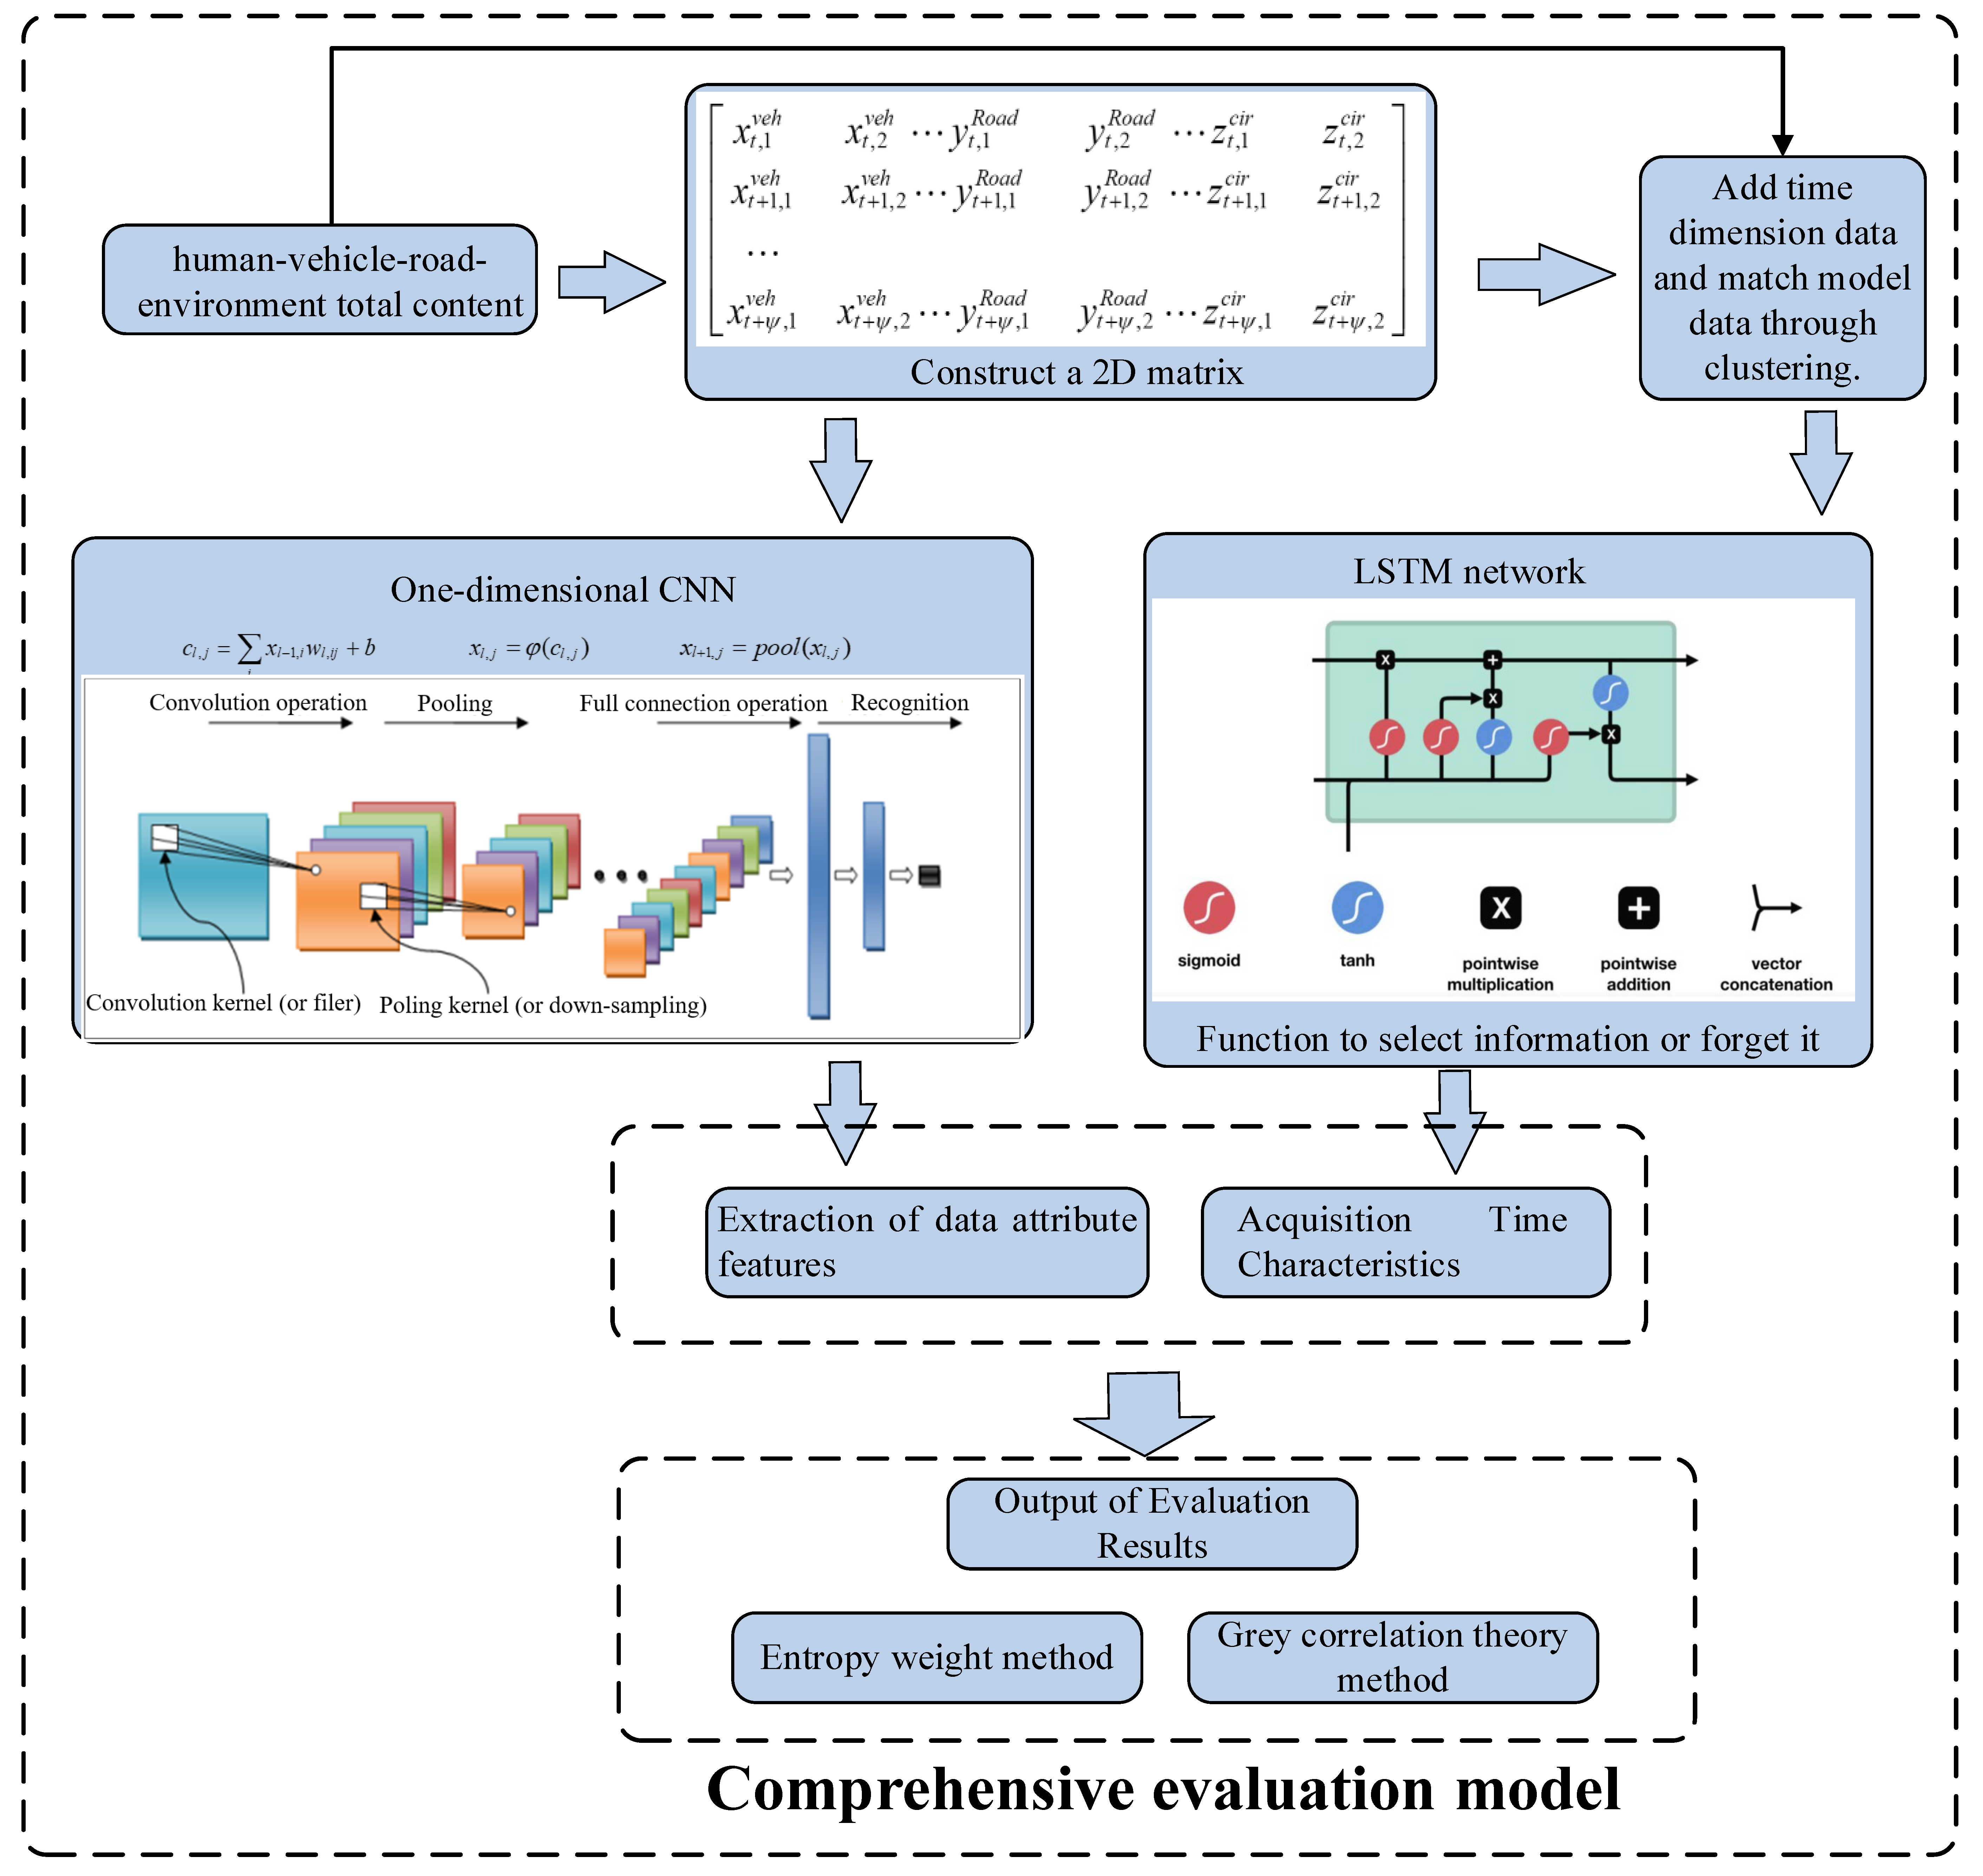
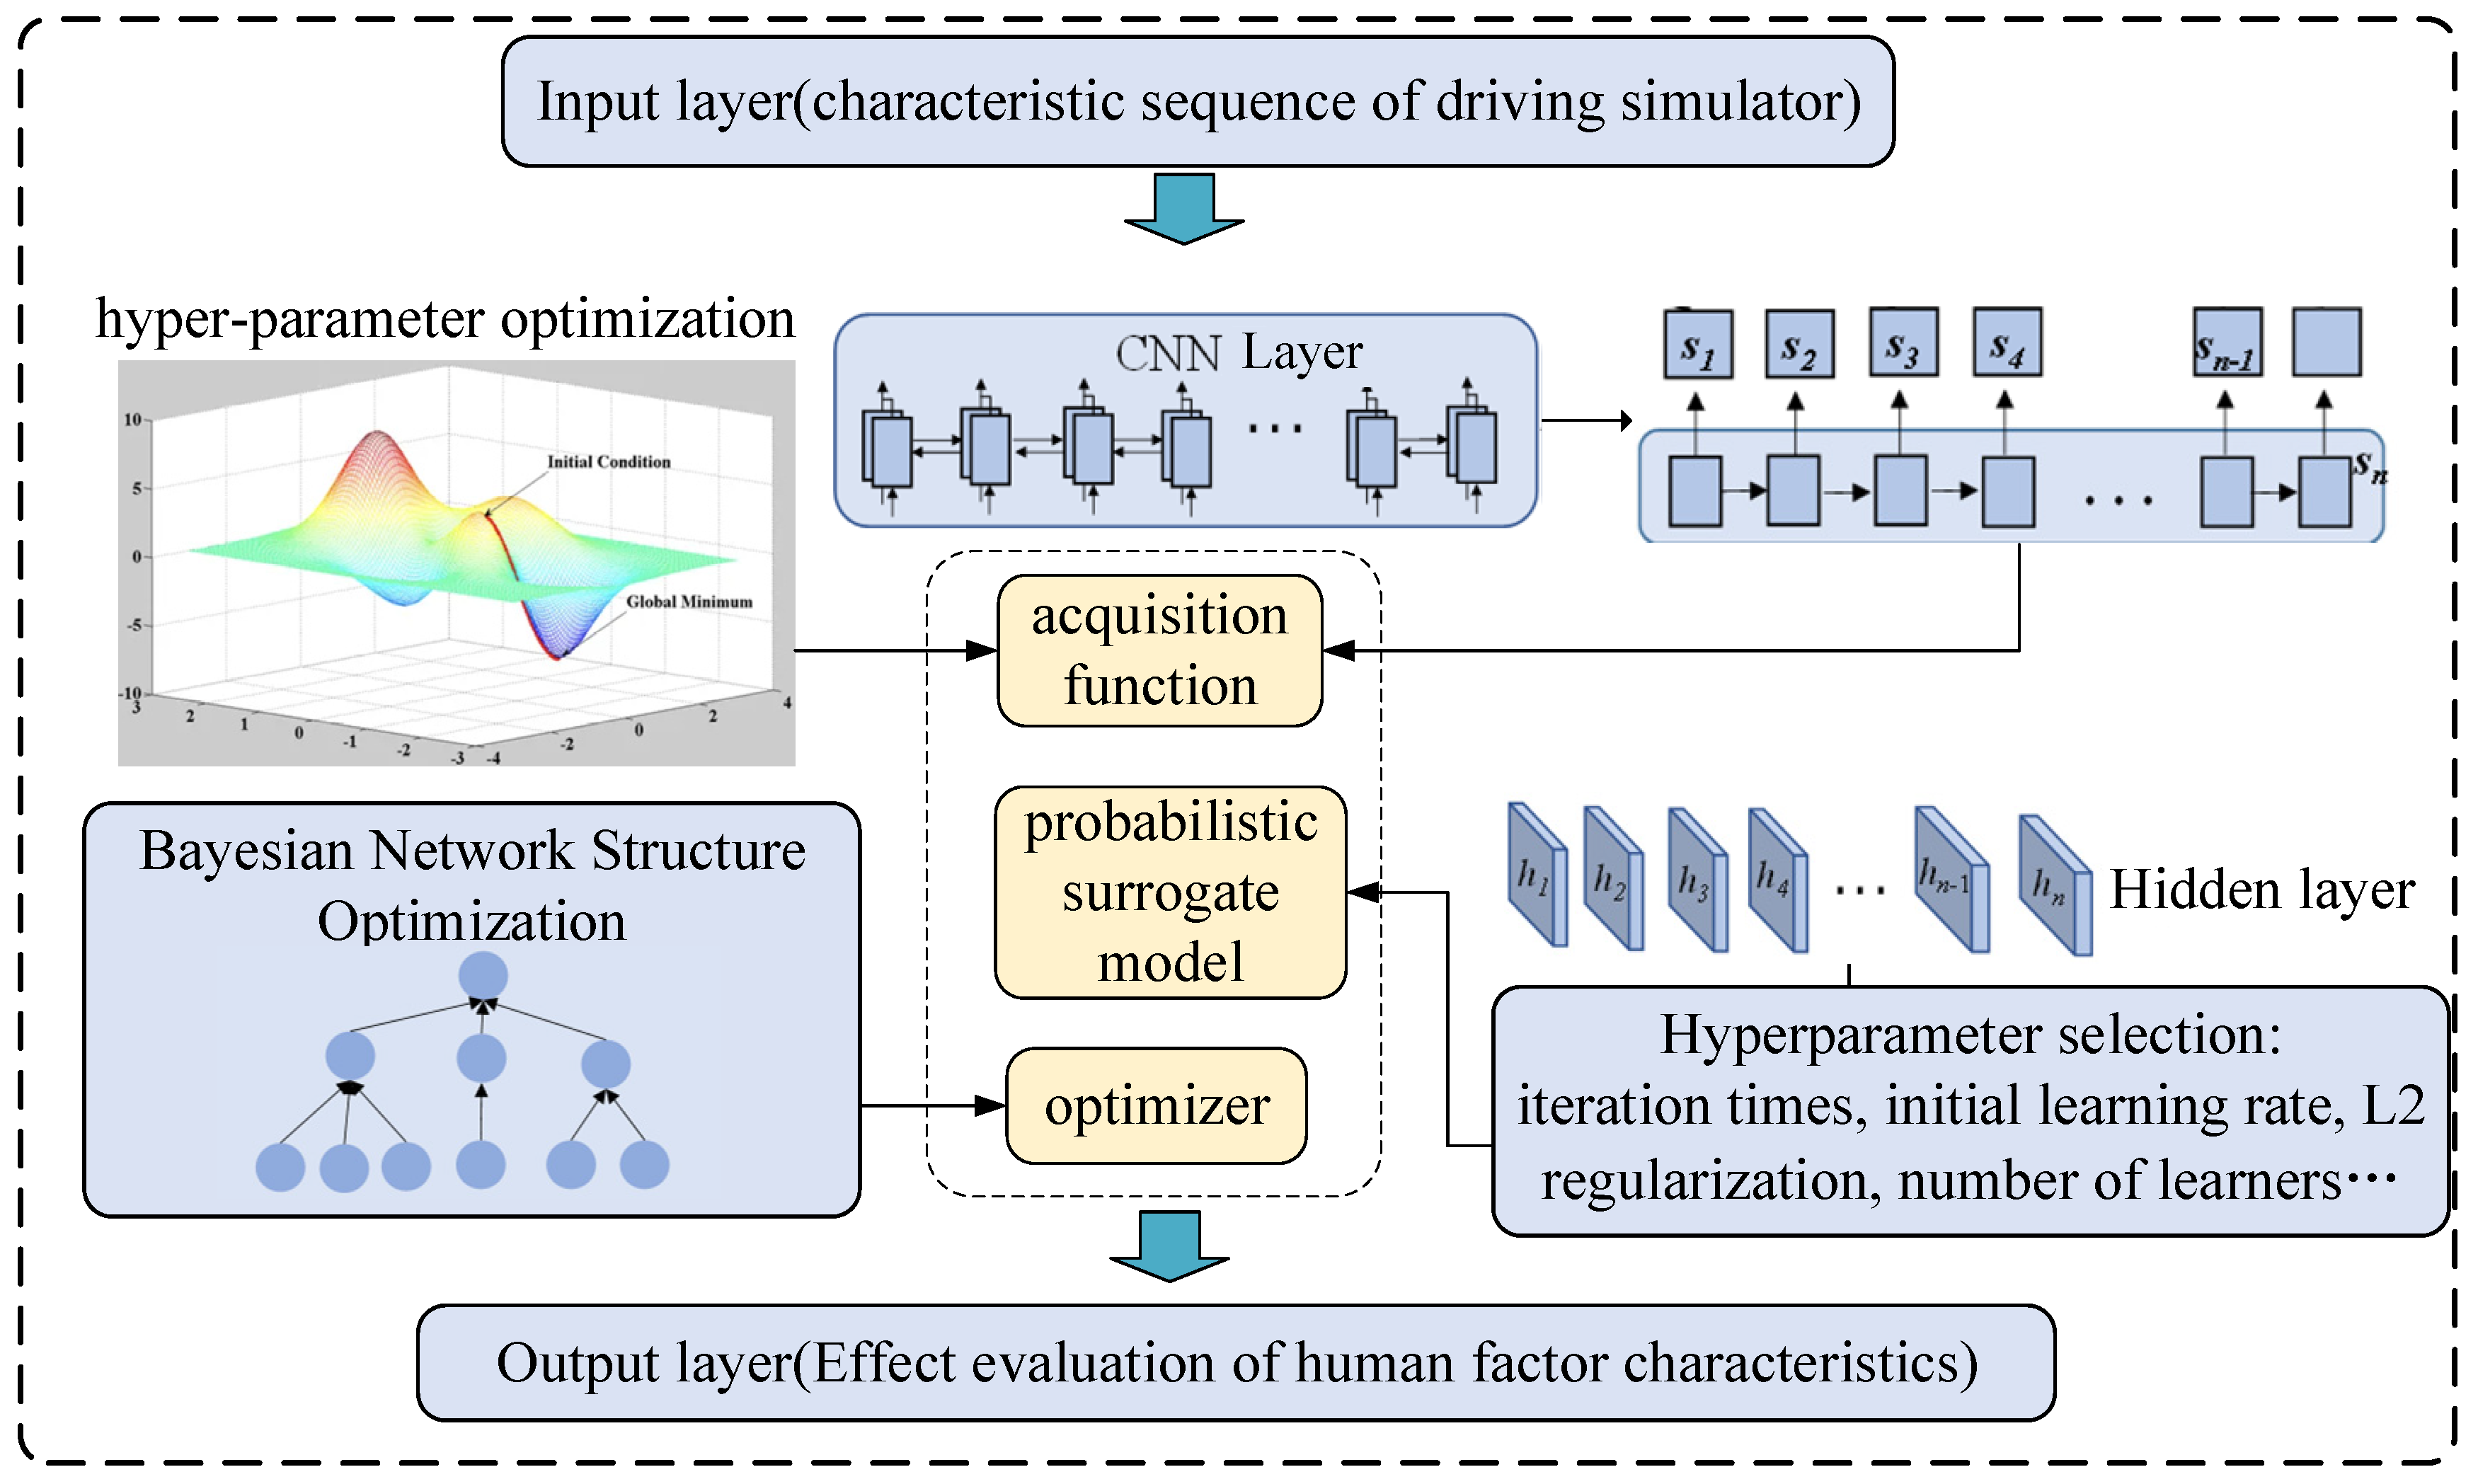
Based on the comprehensive analysis of the above research results, the effectiveness of driving simulators is mainly studied from the perspectives of absolute realism and relative behavioral validity. However, in the “human-vehicle-road-environment” system of road traffic, drivers play a dominant role as users of the road, operators of vehicles, and perceivers of the external environment. The current research on the effectiveness of simulators from the perspective of drivers is insufficient. With the development of human–machine ergonomics, biopsychological indicators of drivers are increasingly used to analyze driving behavior. Considering the nonlinearity and uncertainty of psychological parameters of drivers in simulator experiments, and the good nonlinear fitting and deep feature mining capabilities of deep learning models, this paper constructs a comprehensive evaluation model of simulators based on the biopsychological and behavioral characteristics of drivers using machine learning methods. The model input layer consists of variables of vehicle, road, and environmental features of the simulator, and the output layer is a two-dimensional feature matrix of human factors. Based on Bayesian hyperparameter optimization to better match the human factors, reflect the actual experimental effects of the simulator, and complete the comprehensive evaluation of the simulator based on weighted analysis, this paper explores the comprehensive effectiveness evaluation method of automobile driving simulators based on human factors. This paper constructs a Mul-Bayes-LSTM evaluation model, taking vehicle, road, and conflict scene parameters as inputs, and EDA, ECG, and EMG as outputs, aiming to extract the correlation features between driving behavior and physiological–psychological responses, and to evaluate the effectiveness of the driving simulator.
5. Comprehensive Evaluation of Simulation Systems
Based on the model evaluation results, this chapter conducts a comprehensive assessment of the validity of the driving simulator. Considering the differences in information content, variability, and indicator contribution of EDA, ECG, and EMG, this study uses the CRITIC method, entropy weight method, and gray relational analysis to determine the indicator weights and form a comprehensive evaluation index.
5.1. Evaluation Parameter Weighting Based on CRITIC Method
The CRITIC weighting method is an objective weighting method, which uses the variability of evaluation indicators and the conflicts between evaluation indicators as criteria to calculate CRITIC weights. The comparison intensity is represented by the standard deviation, the conflict is measured by the correlation coefficient between indicators, and the information amount is calculated by multiplying the comparison intensity and conflict indicators, and normalized to obtain the final weight. The specific steps for calculating the weight are as follows:
Data standardization. For the EDA, ECG, and EMG indicators of the driver’s biopsychology, the change value of the indicators can better reflect the driver’s life biopsychology characteristics. Therefore, when standardizing the indicators, the data should be uniformly standardized on the basis of data interpolation and matching. The standardization process specifically includes:
The positive indicator is shown in Formula (17):
The negative indicator is shown in Formula (18):
Here, represents the original value of the j-th indicator for the i-th evaluation object, and represents the standardized value of the indicator. In this study, R2 and rank correlation are considered positive indicators, while MSE, RMSE, NRMSE, ErrorMean, and ErrorStd are considered negative indicators. After standardization, all indicators are converted into a unified direction where “the larger the value, the better the evaluation performance,” providing a basis for subsequent CRITIC weighting and comprehensive evaluation calculations.
- ii.
Calculate the contrast strength as shown in Formula 19:
where
is the coefficient of variation in the j-th indicator, also known as the standard deviation coefficient;
is the standard deviation of the j-th item; and
is the j-th directional mean.
- iii.
Calculate correlation coefficients and quantify conflict indicators. The correlation coefficient between the ith and jth indicators is shown in Formula (20):
where
and
are the value of the i-th indicator and the j-th indicator of the h-th evaluation object, and
and
are the mean value of the i-th indicator and the j-th indicator.
The conflicting quantitative indicator values for the j-th indicator and the other indicators are:
- iv.
Calculate the amount of indicator information. The objective weight of each indicator is measured in a combination of contrast intensity and conflict. Let denote the amount of information contained in the j-th evaluation index, which can be expressed as:
- v.
The calculation of indicator weights is shown in Formula (16):
where the larger
is, the more information the j-th evaluation index contains, and the greater the relative importance of the index, i.e., the greater the weight. According to the calculation method, the CRITIC weight calculation results are obtained by substituting the model data as shown in
Table 3.
5.2. Evaluation Parameter Weighting Based on Entropy Method
The entropy method measures the information content of indicator data through their degree of dispersion and determines the weights of the indicators accordingly. The greater the difference in indicators, the higher the information content and the larger the weight; the smaller the difference in indicators, the weaker the distinguishing ability and the smaller the weight.
- (1)
Data standardization. Suppose there are evaluation subjects and m evaluation indicators. First, standardize the positive and negative indicators.
- (2)
The calculation of the entropy value of the i-th evaluation index at level j in the simulator test evaluation is shown in the formula below:
In the formula , represents the probability of the i-th indicator at the j-th level, and represents the number of states of a single indicator.
- (3)
The entropy calculation of the weight of the i-th indicator is shown in the formula:
According to the properties of entropy, it can be obtained that: , . Finally, the set of evaluation indicator weights can be obtained: .
According to the calculation method, substituting the model data yields the entropy method weight calculation results shown in
Table 4:
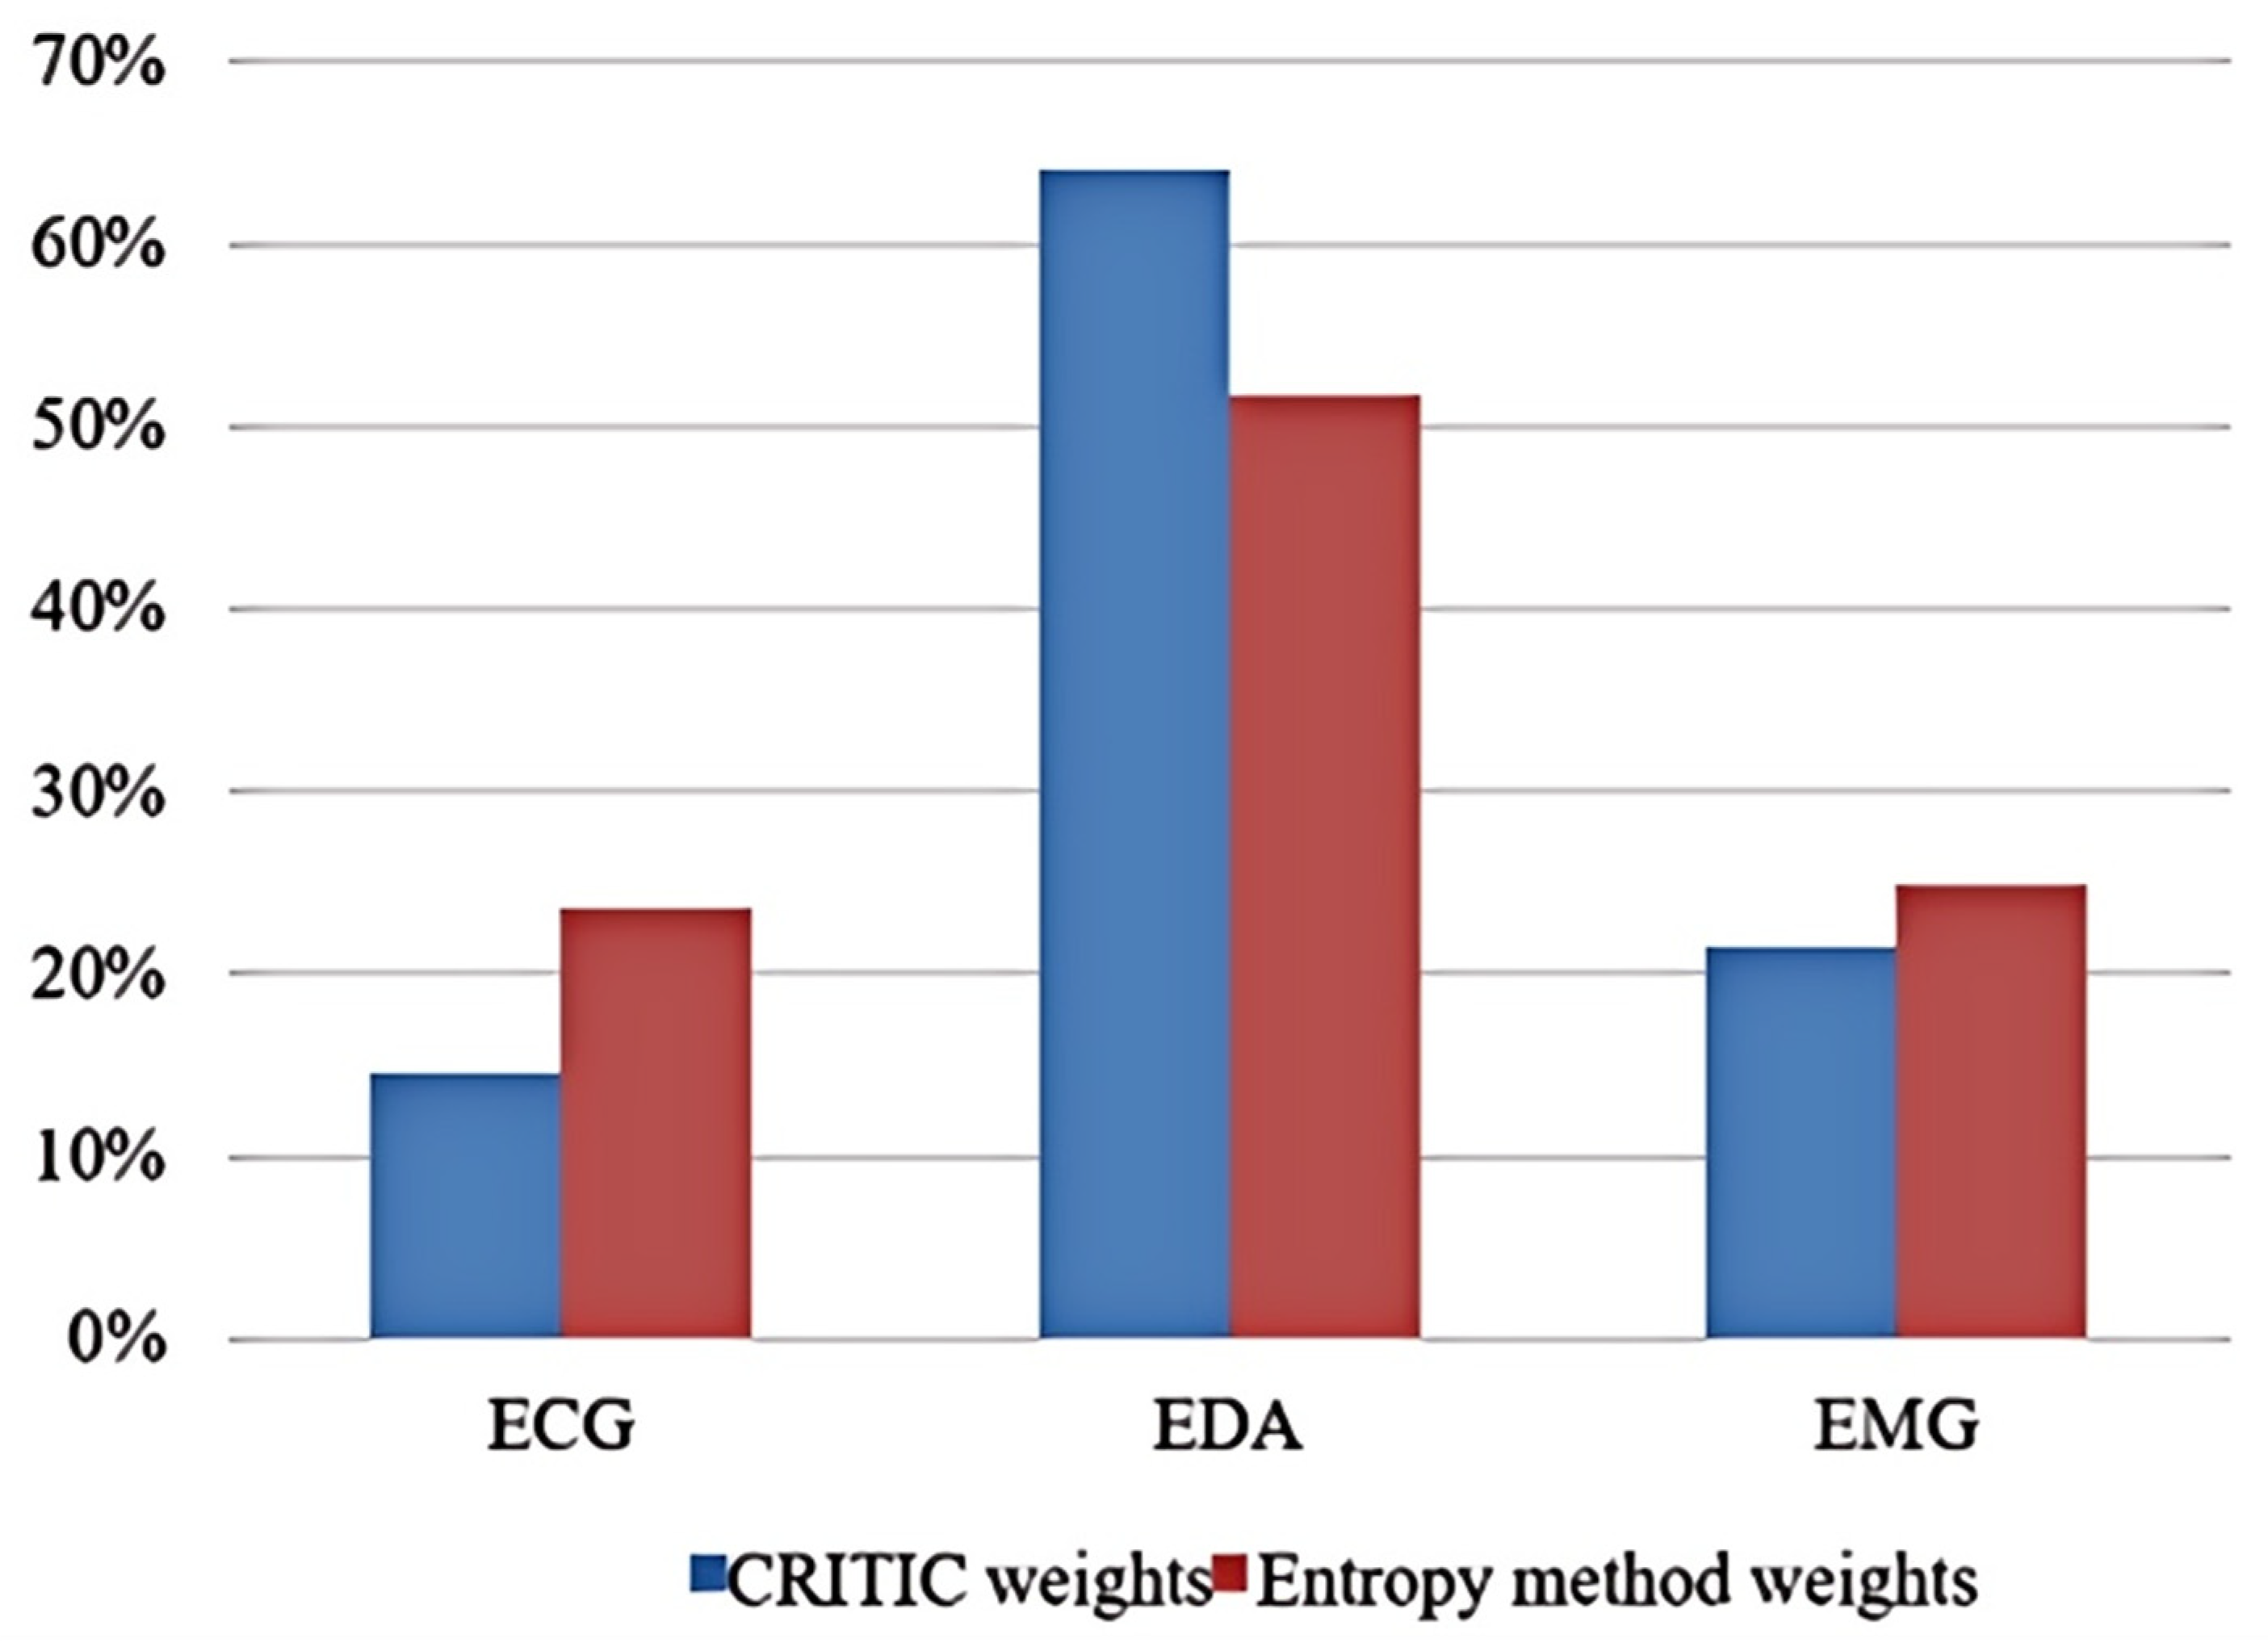
The weights of MMS_ECG, MMS_EDA, and MMS_EMG were calculated using the entropy method, and their weight values are 0.235, 0.517, and 0.248, respectively. The weights among the items are about 0.333, which is relatively uniform.
5.3. Analysis of Evaluation Parameters Based on Gray Relational Method
Gray system theory is a theory used to study and deal with complex systems. The theory begins by acknowledging the incompleteness of information and processes information mathematically at a certain level of the system, rather than analyzing it based on the specific laws within the system. This approach allows for a higher-level understanding of the trend of change and interrelationships within the system. To evaluate the automotive simulation system, the gray correlation theory analysis method can be applied, assuming that the biopsychological evaluation index of the simulation system is incomplete. This method considers the evaluation index of the simulation system as a gray system, and the specific steps of the evaluation are as follows:
Determine the evaluation indicators and collate the indicator values to obtain the matrix to be evaluated;
Determine the reference series, the value of which consists of the best value among the indicators;
Dimensionless processing of evaluation index values.
Calculate the correlation coefficient and index score of the comparison sequence and the reference sequence as shown in Formula (27):
Calculate the gray correlation (total indicator score). The indicator scores are weighted with the indicator weights to obtain the indicator scores corresponding to the total indicator layer as shown in Formula (28):
According to the calculation method, the correlation results were obtained by substituting the model data as shown in
Table 5.
Based on the table above, gray correlation analysis was conducted on three evaluation items (MMS_ECG, MMS_EDA, and MMS_EMG) and the corresponding biopsychological data from the standard field experiment. As no “reference value” was provided, the maximum value of each evaluation item was used as the default “reference value” for the analysis. The discrimination coefficient used in the gray correlation analysis was 0.5, and the final correlation value ranged from 0 to 1. A higher correlation value indicates a stronger correlation with the “reference value” (parent series), which in turn indicates a higher evaluation. The table above indicates that MMS_EDA received the highest overall rating (correlation: 0.870) among the three evaluations, followed by MMS_EMG (correlation: 0.737). This finding is consistent with the overall pattern of weights derived from CRITIC and the entropy value method, which confirms the reliability of the above assignment from another perspective.
After obtaining the weights of the evaluation indicators of the simulator through the entropy method and CRITIC analysis, a comprehensive comparison was conducted, and the comparison results are shown in
Figure 13.
According to the weighting analysis of evaluation indicators by the entropy value method and CRITIC analysis method, the overall weight allocation ratio trend is consistent, regardless of the variability of EDA, ECG, EMG, and the conflict between evaluation indicators from the standard experimental driving biopsychological indicators of the simulator, or the amount of effective information of EDA, ECG, and EMG, is used to assign weights. To effectively improve the respective advantages of the entropy method and CRITIC analysis method, the article selected a combination of the two methods to determine the weights of the simulator evaluation indicators, and after calculating the indicator weights
for the entropy method and wk for the CRITIC method, the integrated weights were calculated as shown in Formula (29):
The comprehensive weight for obtaining the indicators of the car simulator is finally determined. According to specific calculations, the comprehensive indicator weights of ECG, EDA, and EMG for test driving are selected by using the error evaluation indicators and two parameter property values obtained from the model operation to characterize the data situation, and set as the lowest level of the evaluation hierarchy. The weights of ECG, EDA, and EMG are assigned values of 0.5, 0.5, and 0.5, respectively. Based on the weight allocation, the simulator’s comprehensive evaluation value is set as shown in Formula (30) for the car simulator comprehensive evaluation model based on the driver’s psychological state.
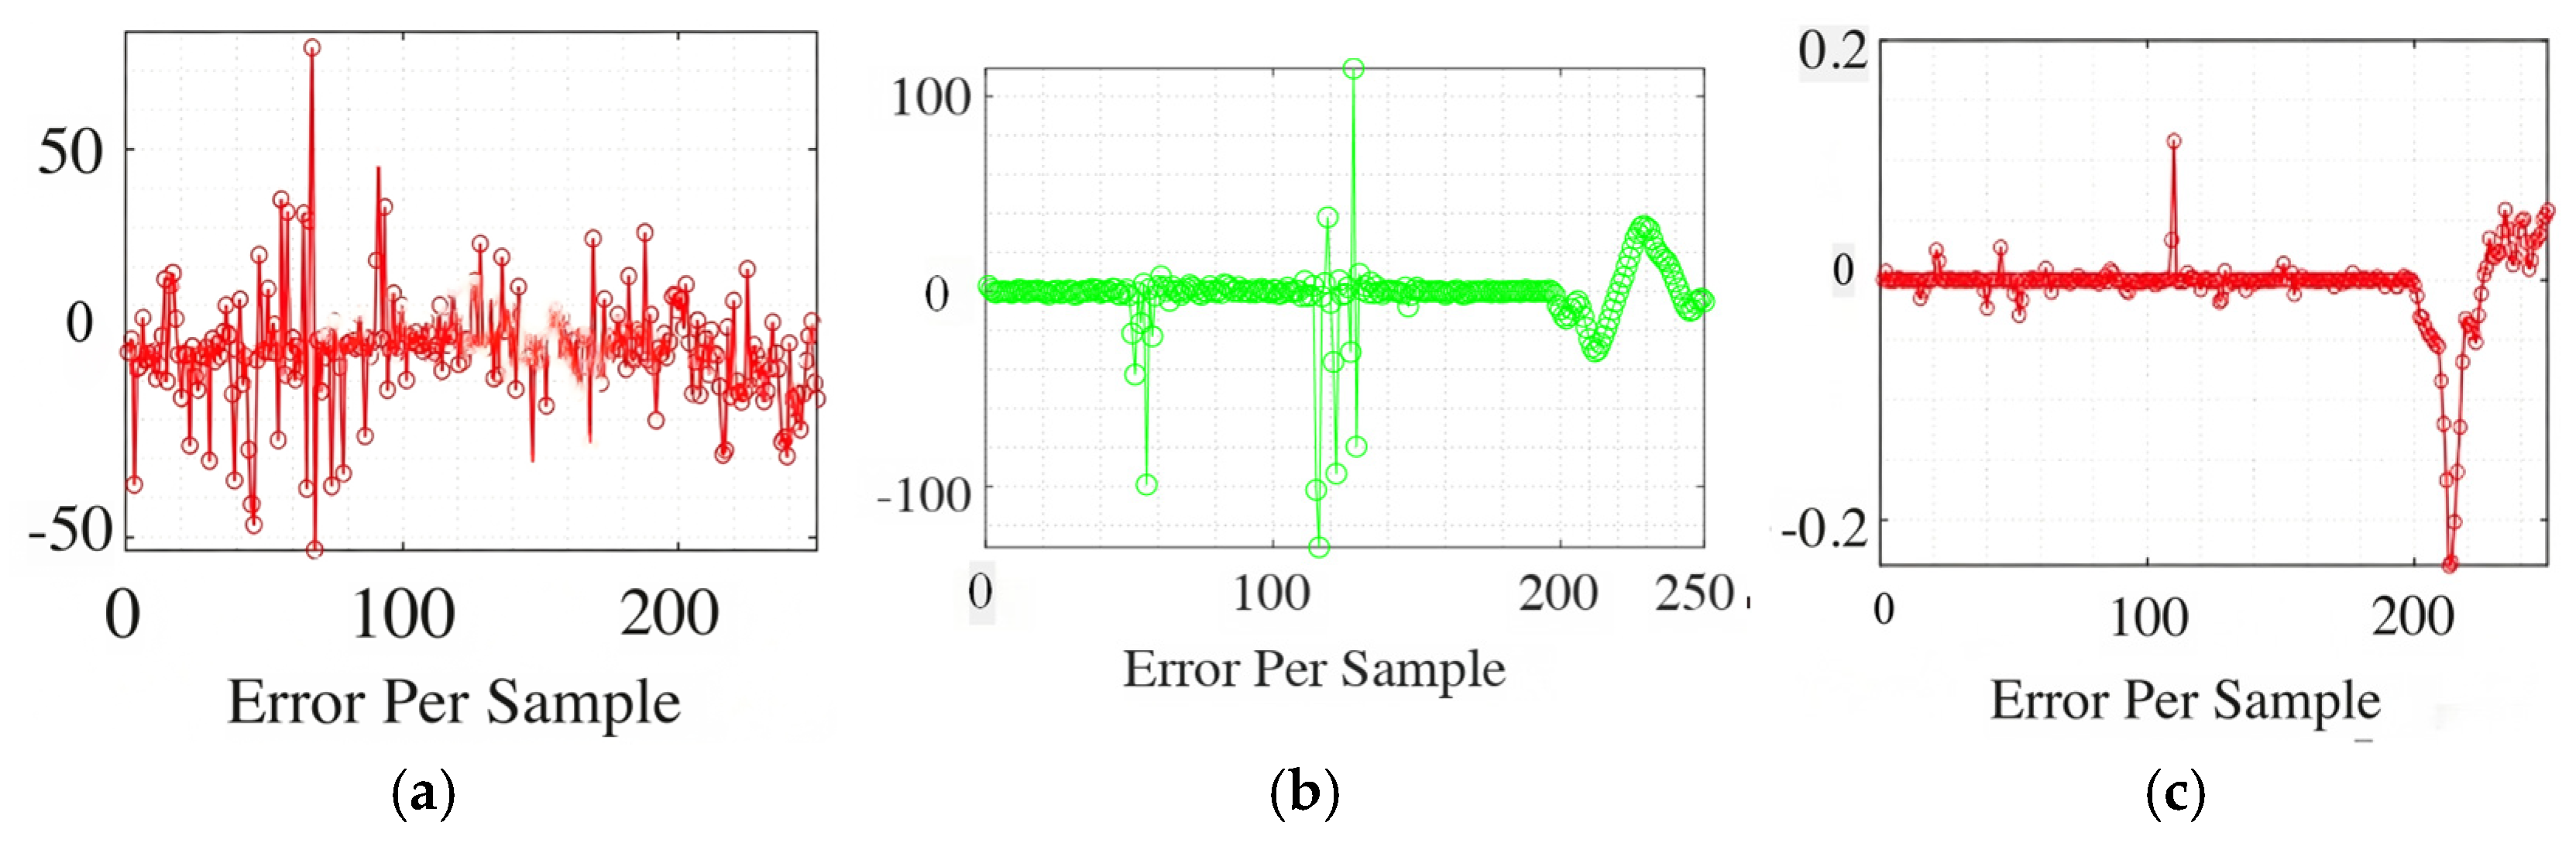
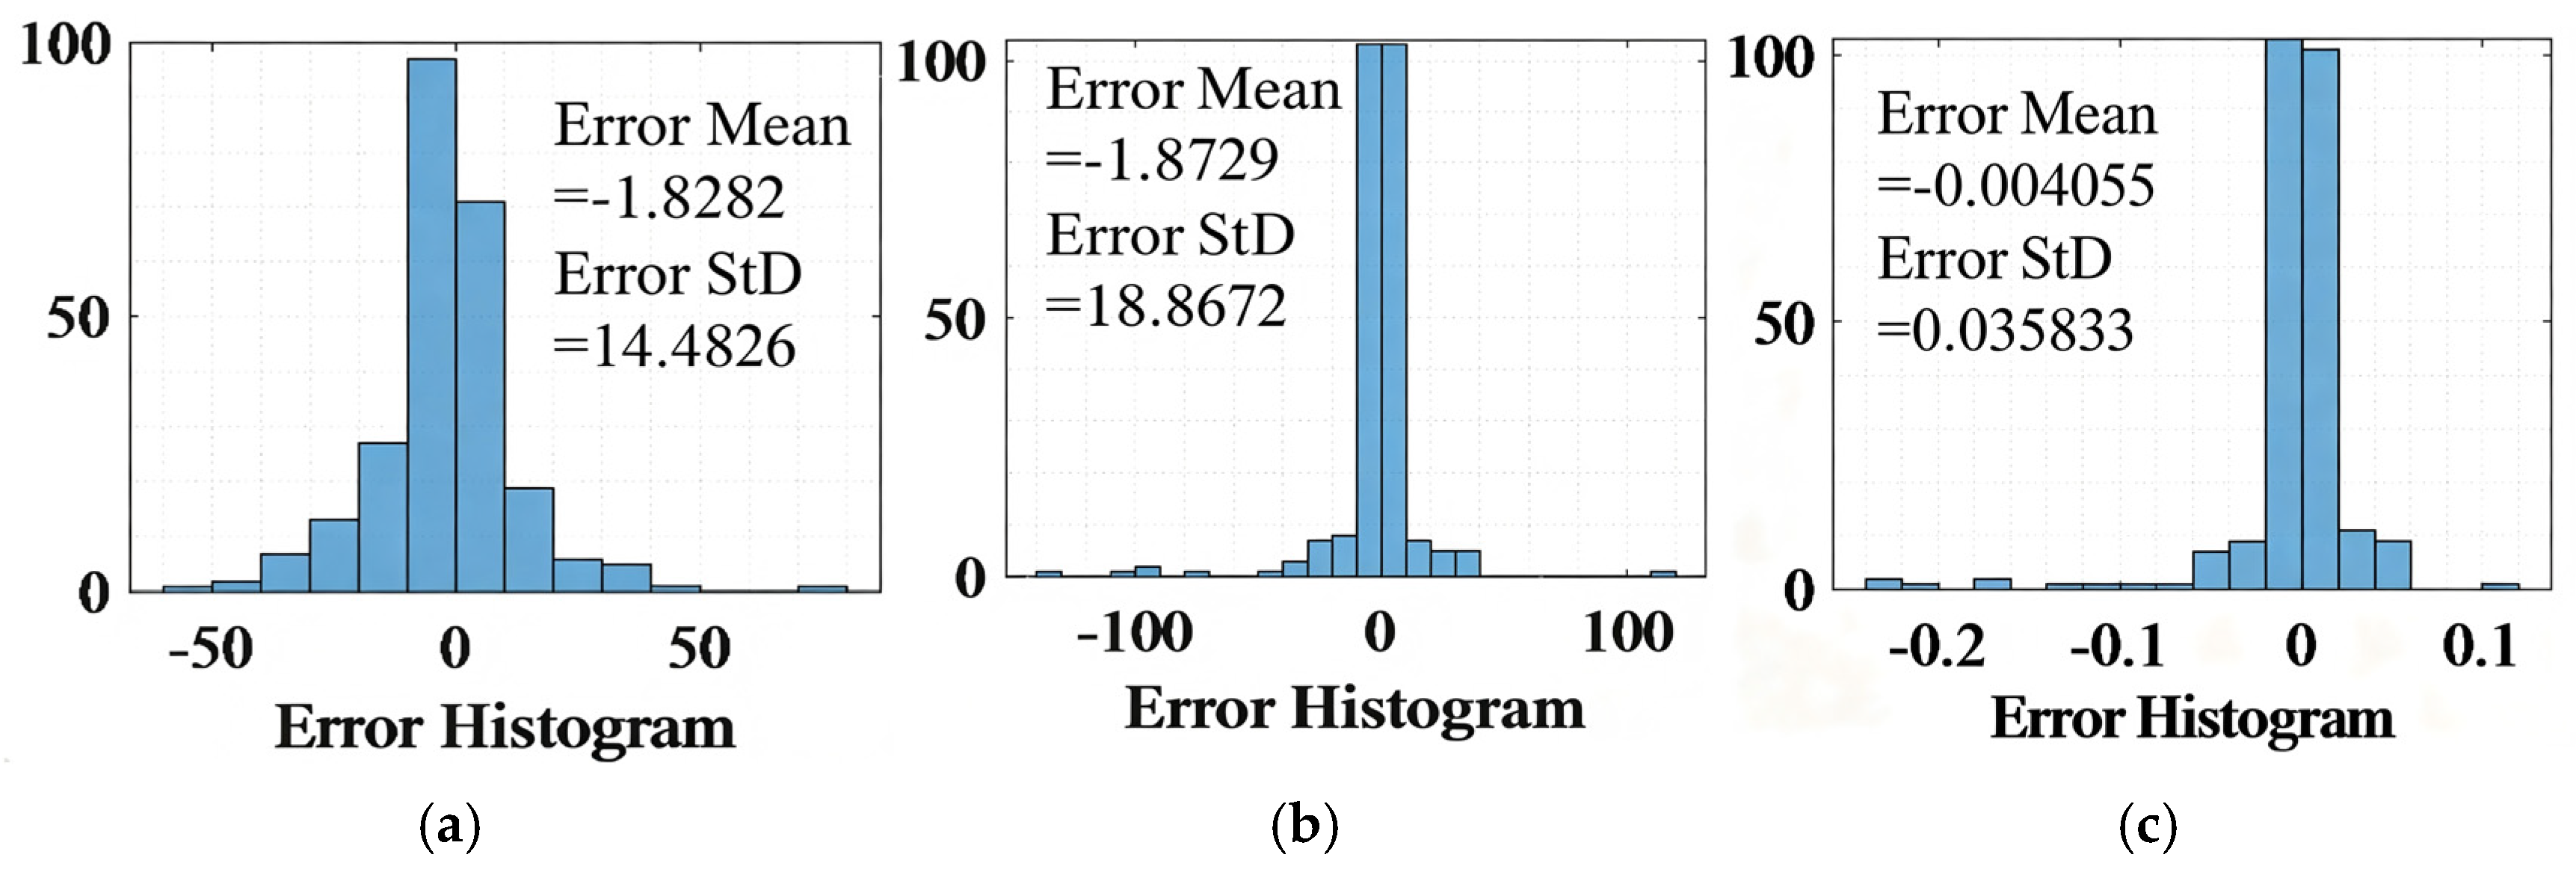
The prediction error index of the test simulator model is summarized in
Table 6. According to the parameter values in the above table, the comprehensive evaluation index of the test simulator is obtained as 94.04, which indicates that the test simulator reaches an intermediate to advanced effective level and can meet the demand of more complex simulation applications in the traffic field with better robustness and applicability. It also indicates that the designed simulator standard scenario can effectively reflect both the actual human raw mental performance in the simulator experiment and the real traffic characteristics of the driver in the car driving simulation experiment in a simple and efficient way.
6. Conclusions
The paper utilizes the characteristics of deep learning models such as good nonlinear fitting and deep feature mining ability to solve modeling problems such as simulator parameters with nonlinearity and uncertainty. Considering the heterogeneity of human factor parameters such as ECG, EMG and EDA, the standard experimental data statistical interval is designed to be 0.2 s according to human reaction time to ensure that the model can identify human factor parameters in a timely and efficient manner. At the same time, to avoid interference such as driving fatigue caused by the complexity of the scene, the experimental duration is set to about 10 min and the experimental mileage is about 10 km.
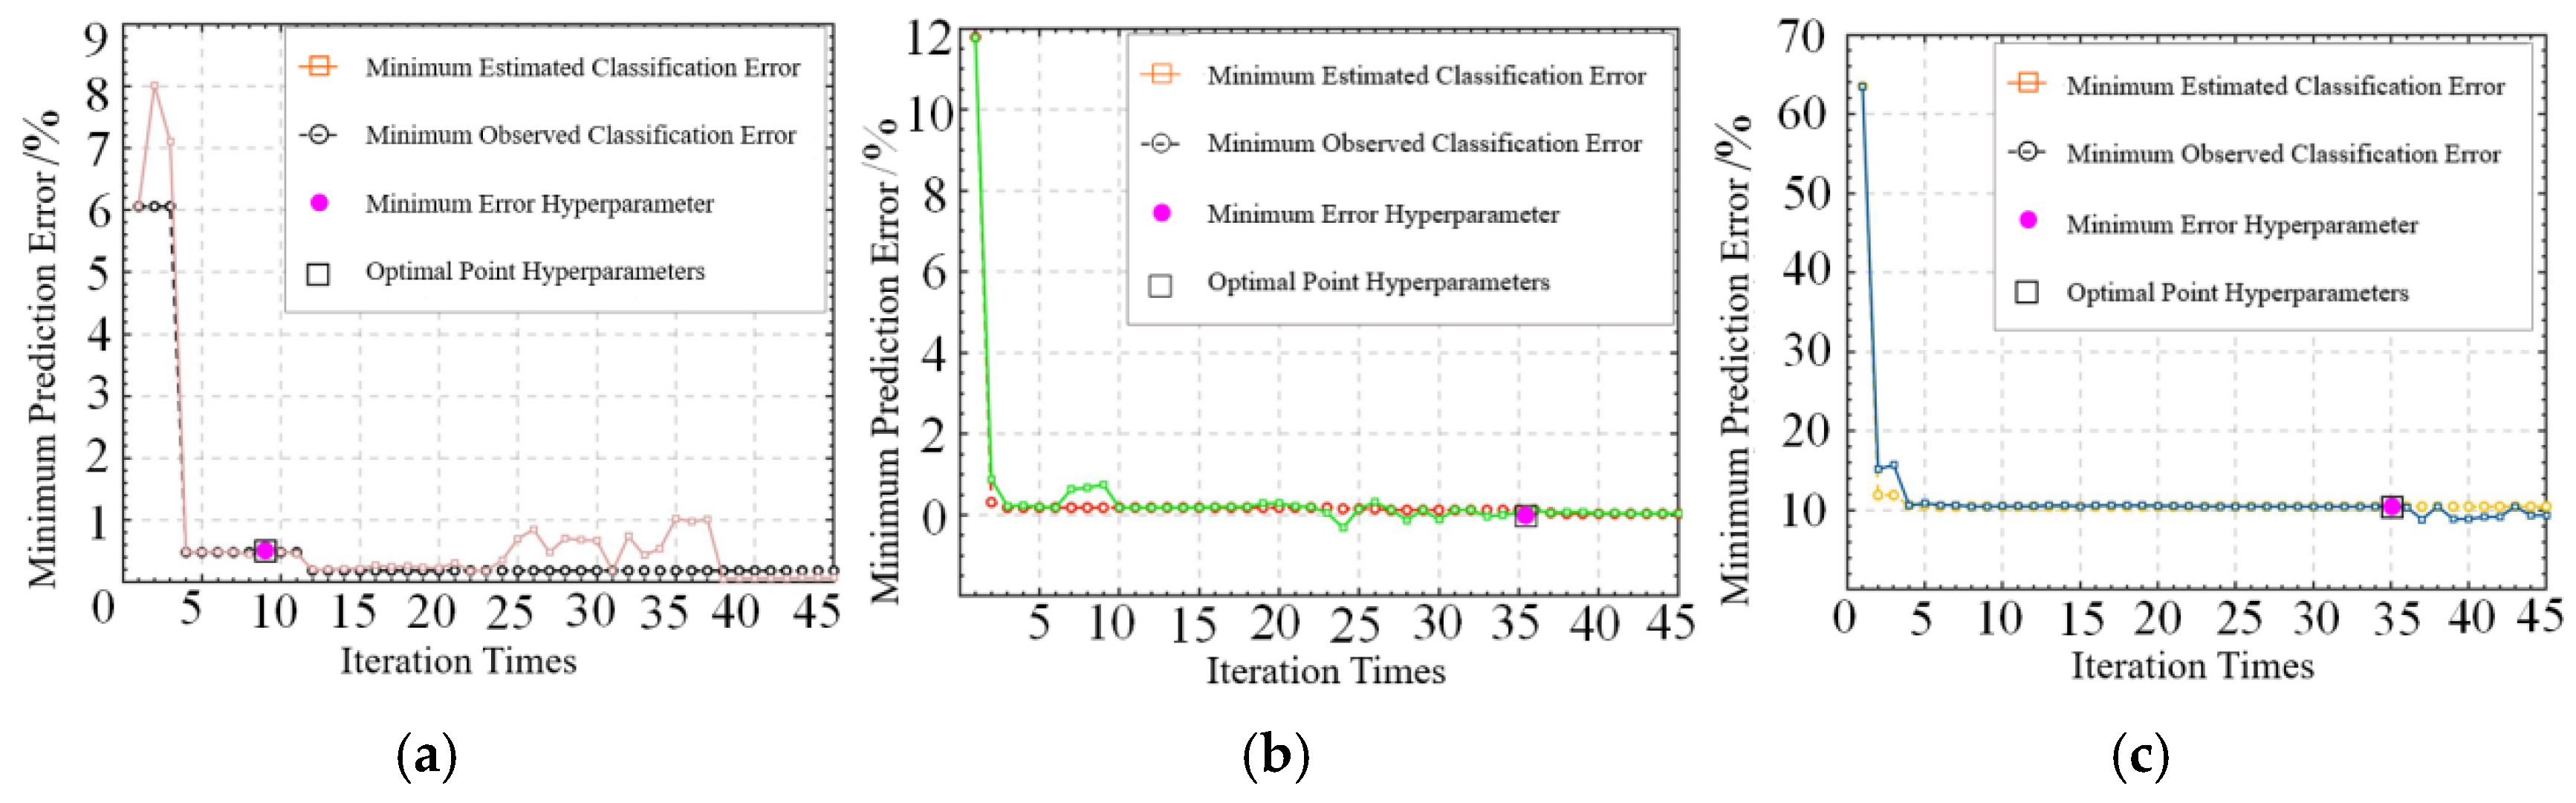
An integrated machine learning method based on the LSTM model is constructed to transform the experimentally collected simulator high-dimensional multi-attribute data into a two-dimensional matrix and then input it into the integrated machine learning model. The integrated machine learning model is based on Bayesian optimization for hyperparameter tuning, and reflects the experimental performance of the simulator with the driver’s biopsychological indicators in the simulator experiment by matching the driver’s causal characteristics. The integrated machine learning method based on the LSTM model improves the deficiency of single-parameter prediction of the integrated machine learning method and makes it applicable to high-dimensional multi-attribute simulator data evaluation.
The specific prediction results of the model are as follows: Based on the entropy value method and CRITIC analysis of the evaluation indicators for weighting analysis, the overall trend of the proportion of weight distribution is consistent, whether it is from the variability of EDA, EMG, ECG and the conflict between the evaluation indicators in the simulator standard experimental driving biopsychological indicators, or the use of the amount of effective information to assign weights. Combining the weights of both indicators, the EDA, EMG, and ECG weights are 79.12%, 12.71%, and 8.16%, respectively. This yields a comprehensive evaluation indicator of 94.04 for the test simulator, indicating that it achieves a medium to high level of validity and can meet the needs of more complex simulation applications in the traffic field. This shows that the test simulator can meet the requirements of complex simulation applications in the traffic field, and it shows that the standard scene designed by the paper can effectively reflect and evaluate the actual biopsychological performance of people in the experiment, and can also simply and effectively reflect the real traffic characteristics of drivers, and the model has good robustness and applicability.
This paper has several limitations, and future research can be carried out in the following aspects: First, this study mainly focuses on the biopsychological characteristics of experienced drivers. Future research could increase the sample size to examine the differences in characteristics among drivers of different genders, ages, and personality types. Second, the driver characteristic parameter system can be further expanded. In the future, visual perception, EEG signals, vehicle speed parameters, and other sensory parameter data could be integrated to build a comprehensive evaluation model and improve the overall performance of the model. Third, the results of this paper are mainly based on controlled risk conflict scenarios in driving simulators, reflecting the simulator’s ability to reproduce drivers’ behavioral and physiological–psychological responses in such scenarios. Therefore, the evaluation results in this paper should be understood as the internal validity of the simulator under controlled experimental conditions and cannot be directly equated with the external validity under real-road driving conditions. Future research still needs to combine real-road experiments, closed-field experiments, or natural driving data to further compare and verify the simulator experiment results. Finally, this paper has not yet conducted a direct comparison with real-road or natural driving data. Future research could use closed-field tests, real-road driving tests, or natural driving data to compare simulator data with real driving data in terms of speed, braking behavior, reaction time, vehicle trajectory, EDA, ECG, and EMG, in order to further verify the external validity of the evaluation framework proposed in this paper.