1. Introduction
Large structures such as skyscrapers, bridges and flyovers, offshore and nearshore structures, embankments for transport corridors, tall chimneys and transmission towers, underground basements, etc., typically require deep foundations to transmit the heavy loads from their superstructures to deeper soil strata [
1]. Besides various types of deep foundations, pile foundations or piled rafts are mostly preferred, as they provide solutions that offer crucial safety, limit differential settlement, are suitable for soft ground surfaces, and are cost-effective and seismically stable [
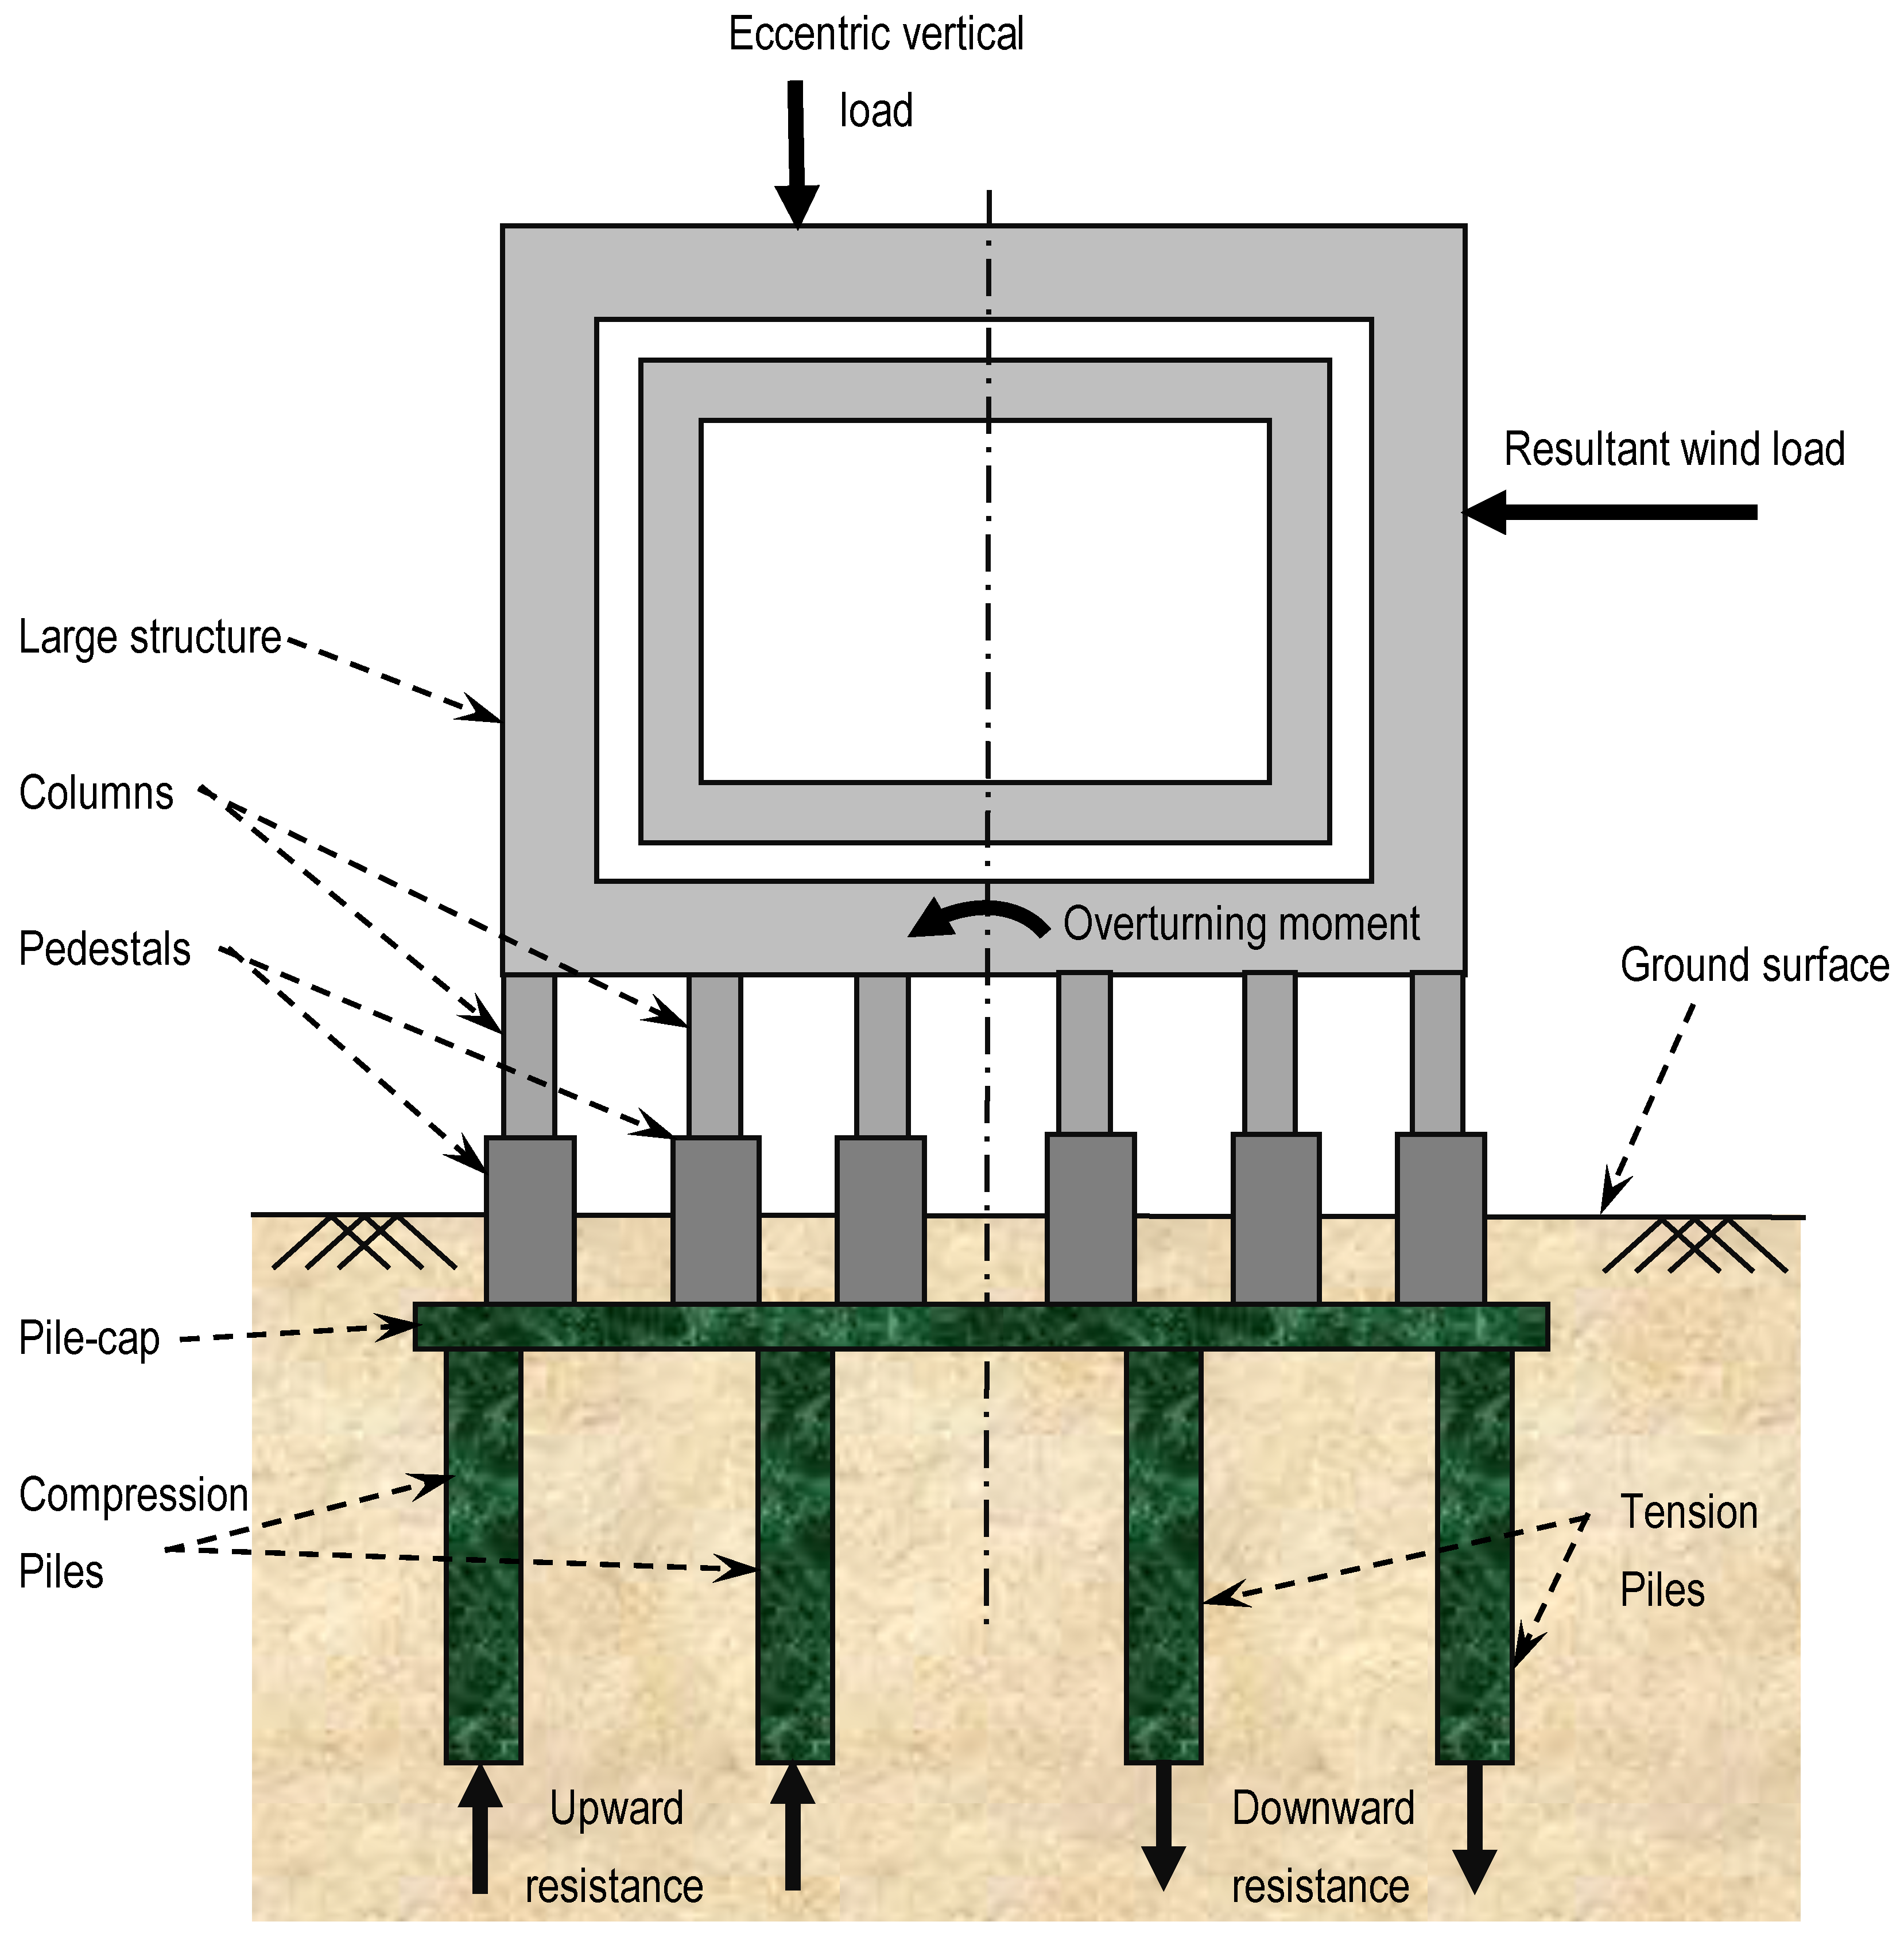
2]. In several instances, the imparted lateral load, eccentric vertical load, and buoyancy originated by wind and wave loading, traffic movement, and hydrostatic forces (in the case of underground structures) produce overturning moments on large structures, initiating significant pullout loads on corner piles [
3]. In these instances, the piles, which are specifically termed ‘tension piles’, should be designed to withstand the imposed uplift loads. An illustration is presented in
Figure 1.
The uplift loads imposed on tension piles are resisted primarily by negative skin friction and the self-weight of the piles, while the base resistance against tension is negligibly small. In the case of under-reamed or socketed piles, on the other hand, the majority of the resistance is produced by base restraint [
4,
5,
6].
A brief review of existing contributions on tension piles reveals several studies which include theoretical and experimental investigations. Among the different theoretical contributions, some are analytical [
7,
8,
9,
10], while others are numerical [
11,
12,
13]. Some recent experimental works consisted of laboratory model studies [
14,
15,
16] and field-based investigations [
17,
18,
19]. There are limited contributions available that highlight design recommendations for tension piles [
10,
20,
21].
In spite of several contributions in areas related to tension piles, an extensive literature review indicates a knowledge gap regarding pile–soil interactive performance under tensile loading, specifically in modeling the nonlinear stress–strain response of soils. The hyperbolic soil model has been widely utilized in numerous engineering applications, including pile–soil interaction, although several limitations of the model necessitate alternative solutions [
13,
22,
23,
24,
25]. The parabolic soil model appeared to be a feasible substitute when adopted in a few studies [
26]. Appropriate prediction of the load–displacement response and the ultimate capacity of tension piles is made possible by using adequate soil models.
Existing models of tension piles have been developed for purely cohesive or granular soils. In the proposed numerical model, this research gap was eliminated by extending analysis to c-ϕ soil as well as cohesive or granular soils. However, the model does not capture the installation effects initiating residual stresses in the soil and the influence of pile group effect. Furthermore, the model, being applicable to pure uplift load, does not account for complex loading involving the simultaneous effect of uplift, lateral and torsional loads.
2. Objectives and Research Methodology
The primary objective of this study is to develop a numerical model for analyzing the response of vertical pile subjected to tensile load using parabolic stress–strain correlations for soil and elastic–perfectly plastic pile material and to carry out a detailed parametric study.
The boundary element model has been adopted to model the pile, whereas the soil has been modeled as a nonlinear material as stated above. The developed numerical model has been validated by comparing it with the results available from existing laboratory small-scale tests and full-scale field tests obtainable from the literature. Thereafter, extensive parametric studies have been conducted to investigate the influence of critical parameters on pile–soil interactive performance under tension. Details of the work conducted have been sequentially described below.
3. Numerical Modeling
The numerical model and associated computer program have been developed to analyze the pile–soil interactive response under tensile load. The details of the analysis and algorithms adopted have been described in this section.
3.1. Problem Documentation
A single, vertical pile with diameter
D and embedded depth
L is subjected to tensile load
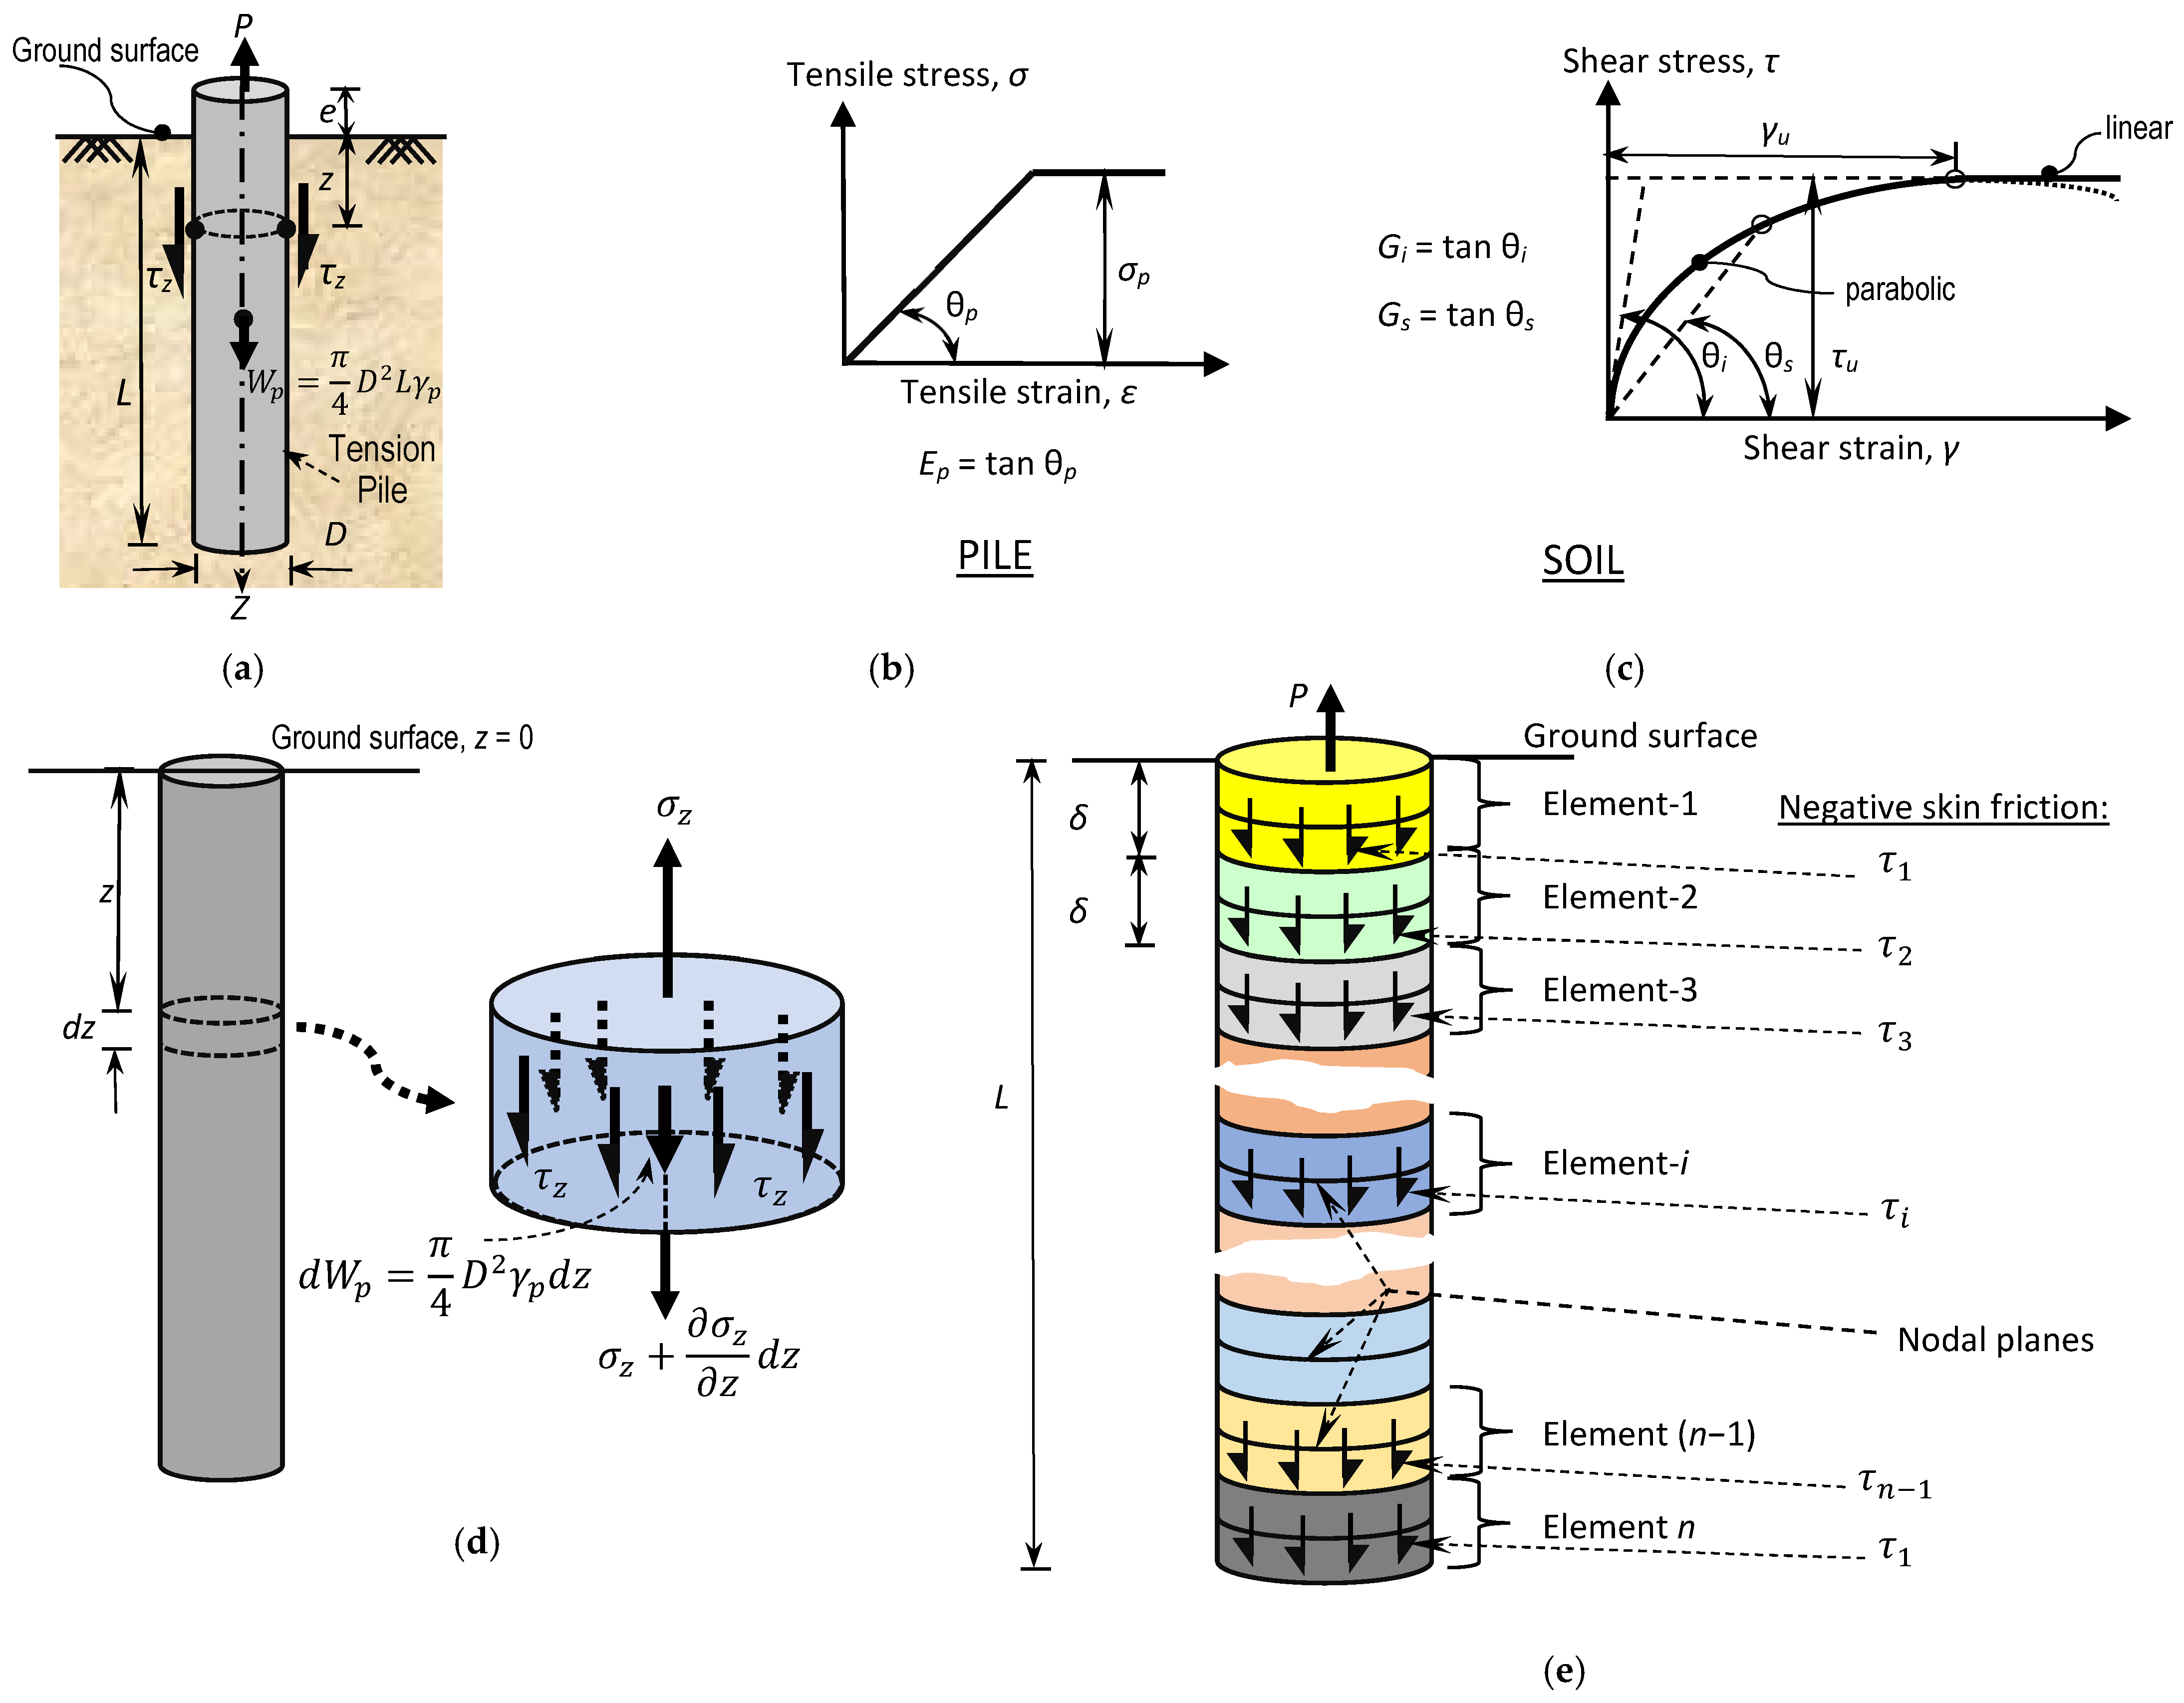
P, as shown in
Figure 2a. As mentioned above, the uplift load is resisted by negative skin friction and the self-weight of the pile. Hence, the following mathematical correlation holds good:
where
τz is the negative skin friction at a depth of
z below the ground surface, and
is the density of the pile material.
3.2. Material Idealization
The pile material is idealized as elastic–perfectly plastic, having a limiting tensile stress of
σp, as shown in
Figure 2b. Thus, the upper bound magnitude for tensile failure of the pile is given by [
26]:
For characterization of soil to represent the nonlinear stress–strain response, the parabolic model has been adopted in this analysis [see
Figure 2c].
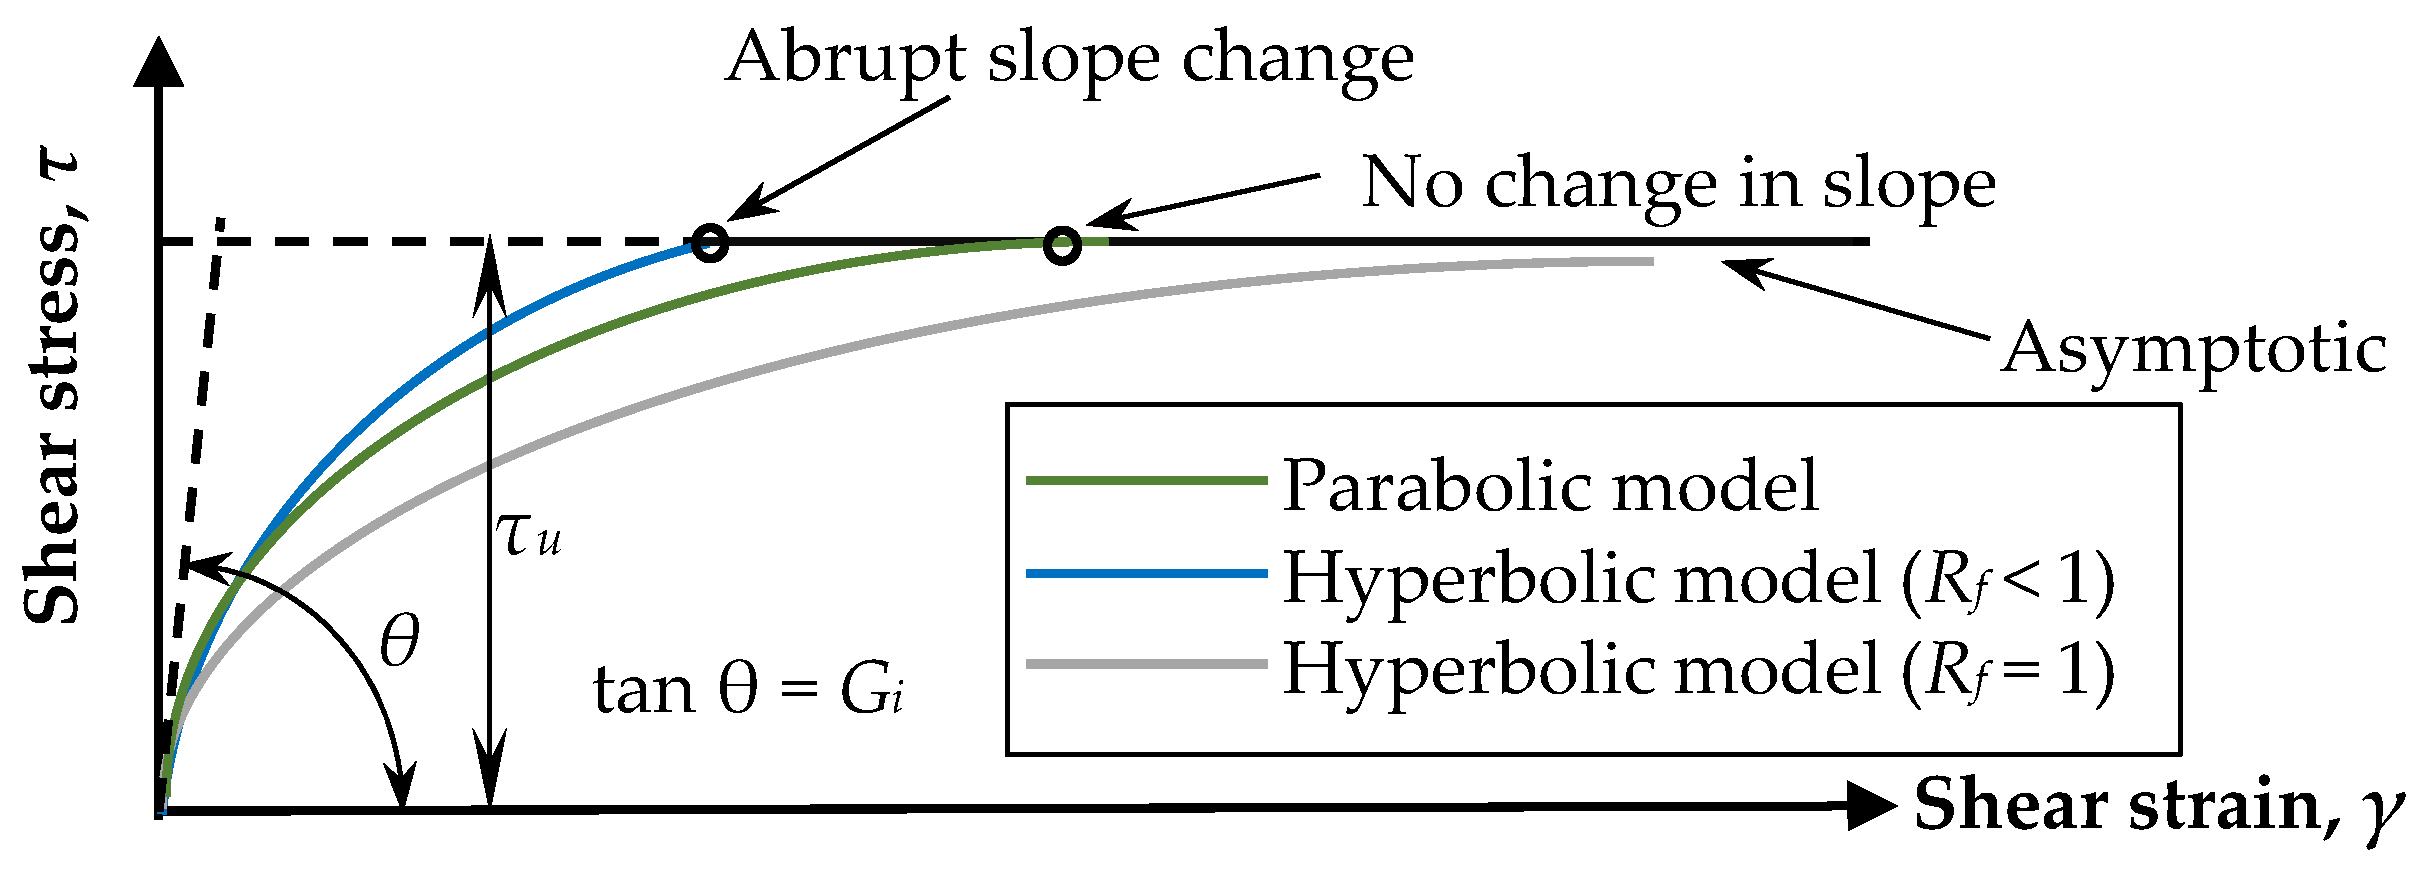
Due to the introduction of a reduction parameter, an abrupt variation in the slope of the stress–strain curve was evidenced in the previously adopted hyperbolic soil model, which produced minor discrepancies in the output results [
13]. To overcome this difficulty, a parabolic stress–strain response has been introduced, as initially recommended by Randolph [
25]. Mathematically, the following correlations are applicable:
Solving the quadratic equation in terms of
γ, the following expression is obtained:
Using Equation (4) above and neglecting the unrealistic ‘+’ sign, the secant modulus is given by:
3.3. Limiting Shear Stress
The upper bound values of limiting shear stress
τu are different for diverse soil types, which are given as [
13,
27,
28]
where α is the adhesion factor,
cu is the undrained cohesion of soil,
Ks is the in situ earth pressure coefficient,
is the effective overburden pressure, and
δs is the pile–soil interface friction angle.
3.4. Differential Equations
Considering the equilibrium condition of the typical cylindrical pile element in
Figure 2d with the given stress condition, the following differential equation has been derived:
From classical theory of solid mechanics [
29], the correlation for unit elongation of the infinitesimal pile element is given by:
Eliminating
σz from Equations (7) and (8), the following expression has been derived:
where
σz is the axial stress in the pile cross-section,
τz is the negative skin friction,
is the elongation of the pile element at a depth of
z below the ground’s surface, and
Ep is Young’s modulus of the pile.
3.5. Boundary Element Modeling
The pile has been longitudinally discretized equally into
n cylindrical elements, each of which have a length of
δ (=
L/
n), as portrayed in
Figure 2e. Each of the elements are subjected to negative skin friction, assumed to be distributed uniformly on the cylindrical element. Analysis has been performed under no-slip and slipped conditions, as detailed below.
For the no-slip condition, it is assumed that no slippage occurred between the pile and the soil. Expanding Equation (9) in finite difference form, the following correlation is obtained:
where
is the upward displacement of the central nodal plane corresponding to the
ith pile element, and
τi is the negative skin friction at the surface of the
ith element.
From the existing solution of Randolph and Wroth [
30], the upward soil displacement (
) adjacent to the
ith nodal plane is given by:
where
is the soil stiffness relevant the
ith element, given by:
where
and
are the secant modulus and Poisson’s ratio of soil at the
ith nodal plane, and
rg is a non-dimensional shear modulus parameter given as the ratio of the average secant modulus of soil along the embedded pile length to that at the pile base.
Under the no-slip condition,
; thus, we let the displacement be denoted as
. Combining Equations (10)–(12), applying appropriate boundary conditions and utilizing the equilibrium condition of the pile, the following matrix correlation is derived:
Details of the derivations and appropriate quantifications of individual elements of the above matrices, i.e.,
aij and
bi, are described elsewhere [
13]. Solving Equation (13) above, the initial values of the unknown negative skin friction
τi are evaluated. These initial values are compared with their relevant upper bound limits
. For the elements where
, slippage is assumed to occur, and Equations (11) and (12) are no longer applicable, but Equation (10) is still valid. In the case of these slipped elements, the corresponding values of negative skin friction are replaced by the relevant upper bound limit, and the entire procedure is repeated until
for all the pile elements. Once the correct values of
τi are evaluated, the nodal pile displacements are determined using Equation (10).
The upward groundline displacement of pile
obtained by parabolic extrapolation from the known values of displacements of nodal planes of the first, second and third elements, is given by:
Due to redundancy, the upward displacements for complete pile–soil slippage are not available mathematically; hence, appropriate extrapolation should be adopted.
3.6. Ultimate Uplift Capacity
To evaluate the ultimate uplift capacity of pile, the imparted load
P is increased in small steps. When either slippage of the entire cylindrical pile surface or tensile failure of the pile material has taken place, whichever is earlier, the corresponding value of
P is taken as the ultimate uplift pile capacity
Pu. Mathematically, this is written as [
10],
where
is the minimum value of
P required to initiate slippage at the entire cylindrical pile surface. Previous studies have revealed that for a short and medium embedded length of pile, failure takes place by interface slippage, whereas in the case of sufficiently long pile, failure is accompanied by tensile yield of the pile material itself [
30]. Thus, it is evidenced that the
L/
D ratio plays a crucial role in the failure pattern of tension piles.
3.7. Computational Algorithm
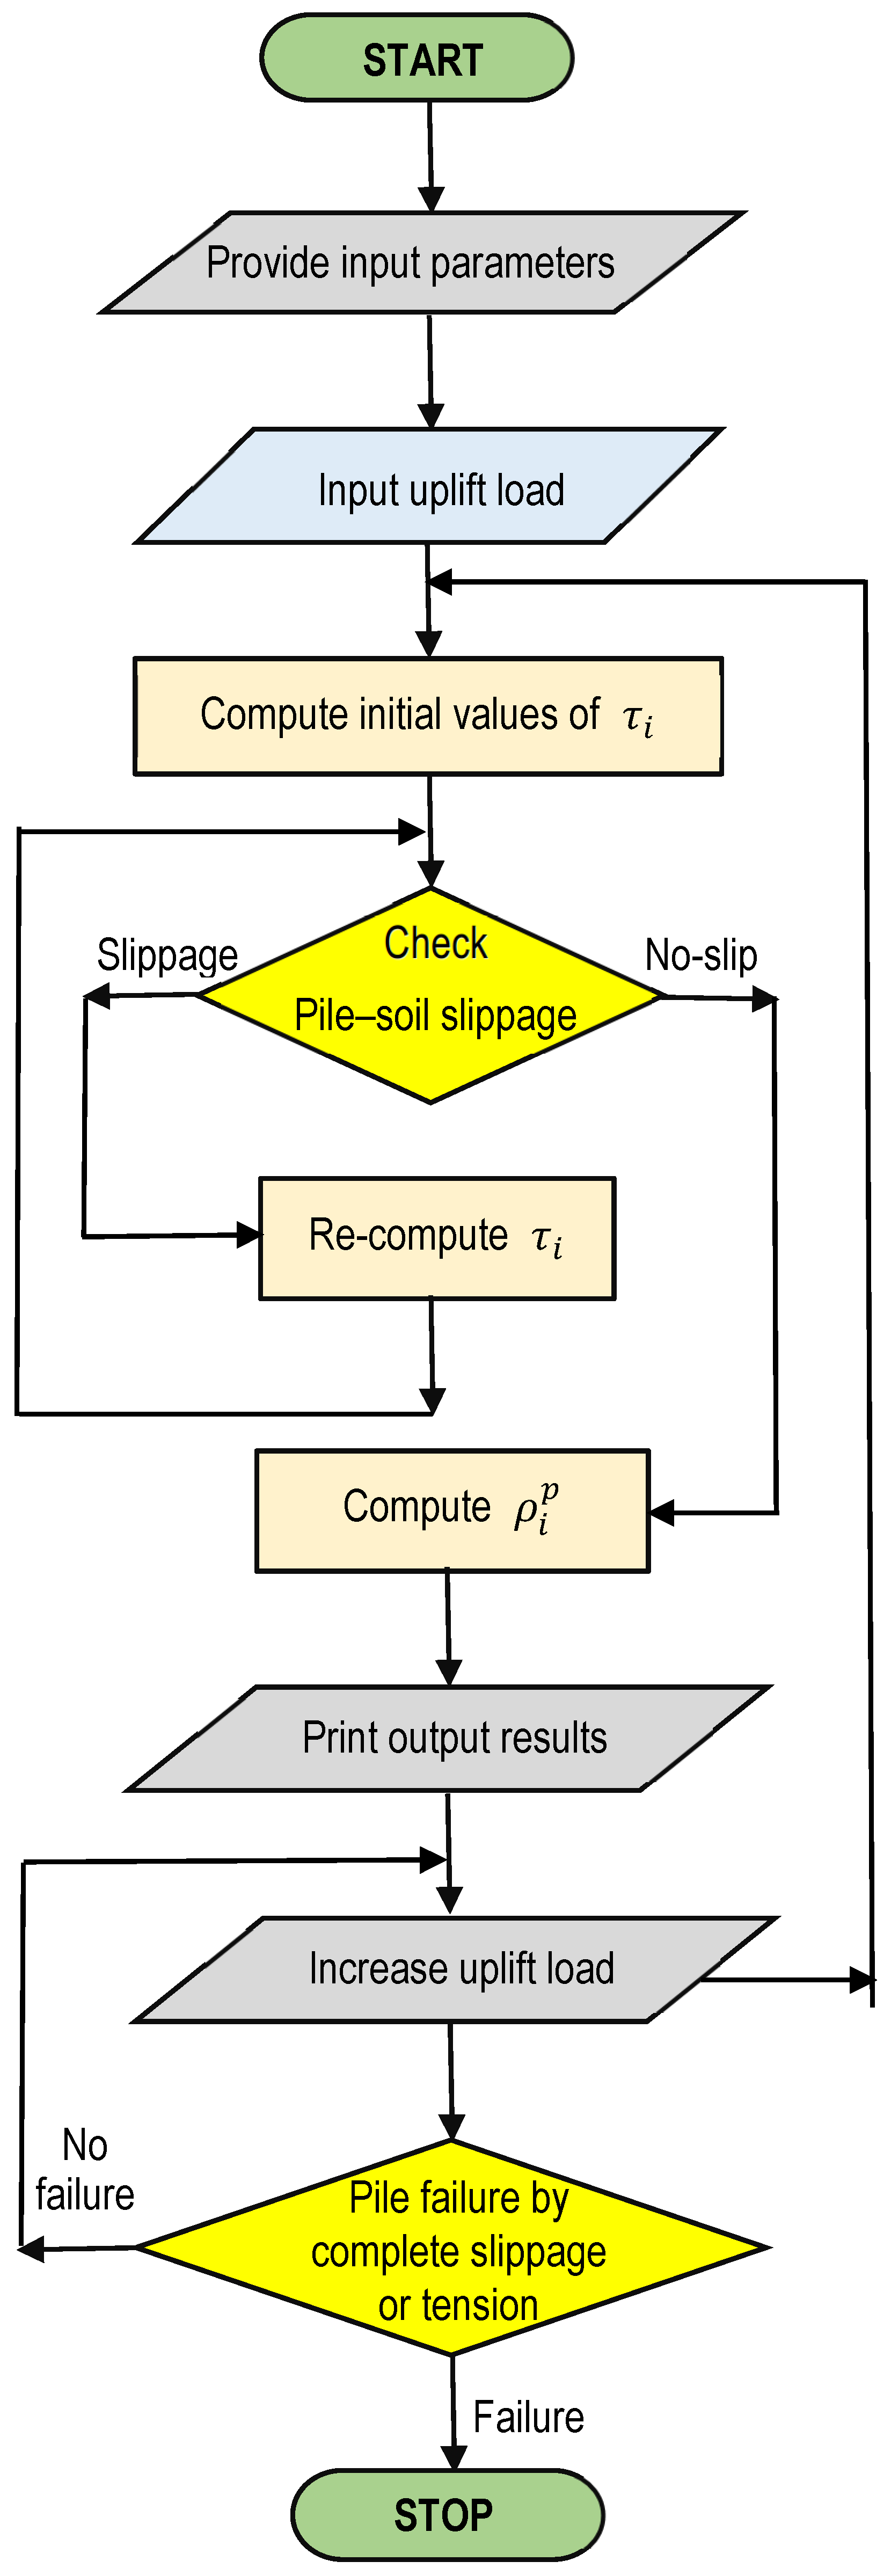
In order to execute the entire computation, a user-friendly computer program has been developed utilizing Fortran 90 language. The input values of soil parameters, pile geometry and properties, and tensile loading are given in the program and the output values of elemental negative skin friction, nodal displacement and ultimate uplift pile capacities are computed. The program is compiled with appropriate subroutines which adopt the iterative trial and error technique to implement the entire analysis. The flowchart of the program is presented in
Figure 3. The computational time, computer memory space consumed and accuracy of the numerical results were found to be significantly influenced by the number of pile elements
n. Optimum output was observed when
n = 100, wherein reasonable compromise between precision and computational efforts was found. Hence, this value of
n has been chosen in this paper.
4. Validation: Comparison with Experimental Data
The boundary element model (BEM) developed has been validated by comparison with available experimental data and existing numerical/analytical results. Comparative studies have been carried out for piles embedded in clay, sand and c-ϕ soil.
4.1. Cohesive Soil
Zhao et al. [
31] performed large deformation finite element analysis on the pullout response of piles and compared it with the laboratory model test results of Shin et al. [
32], who conducted uplift load tests with metallic piles embedded in a remolded test bed of cohesive soil. The results obtained from the current BEM have been compared with the experimental and numerical results obtained from these earlier studies. The input data for BEM analysis are mostly taken from these earlier works [
31,
32] and are included in
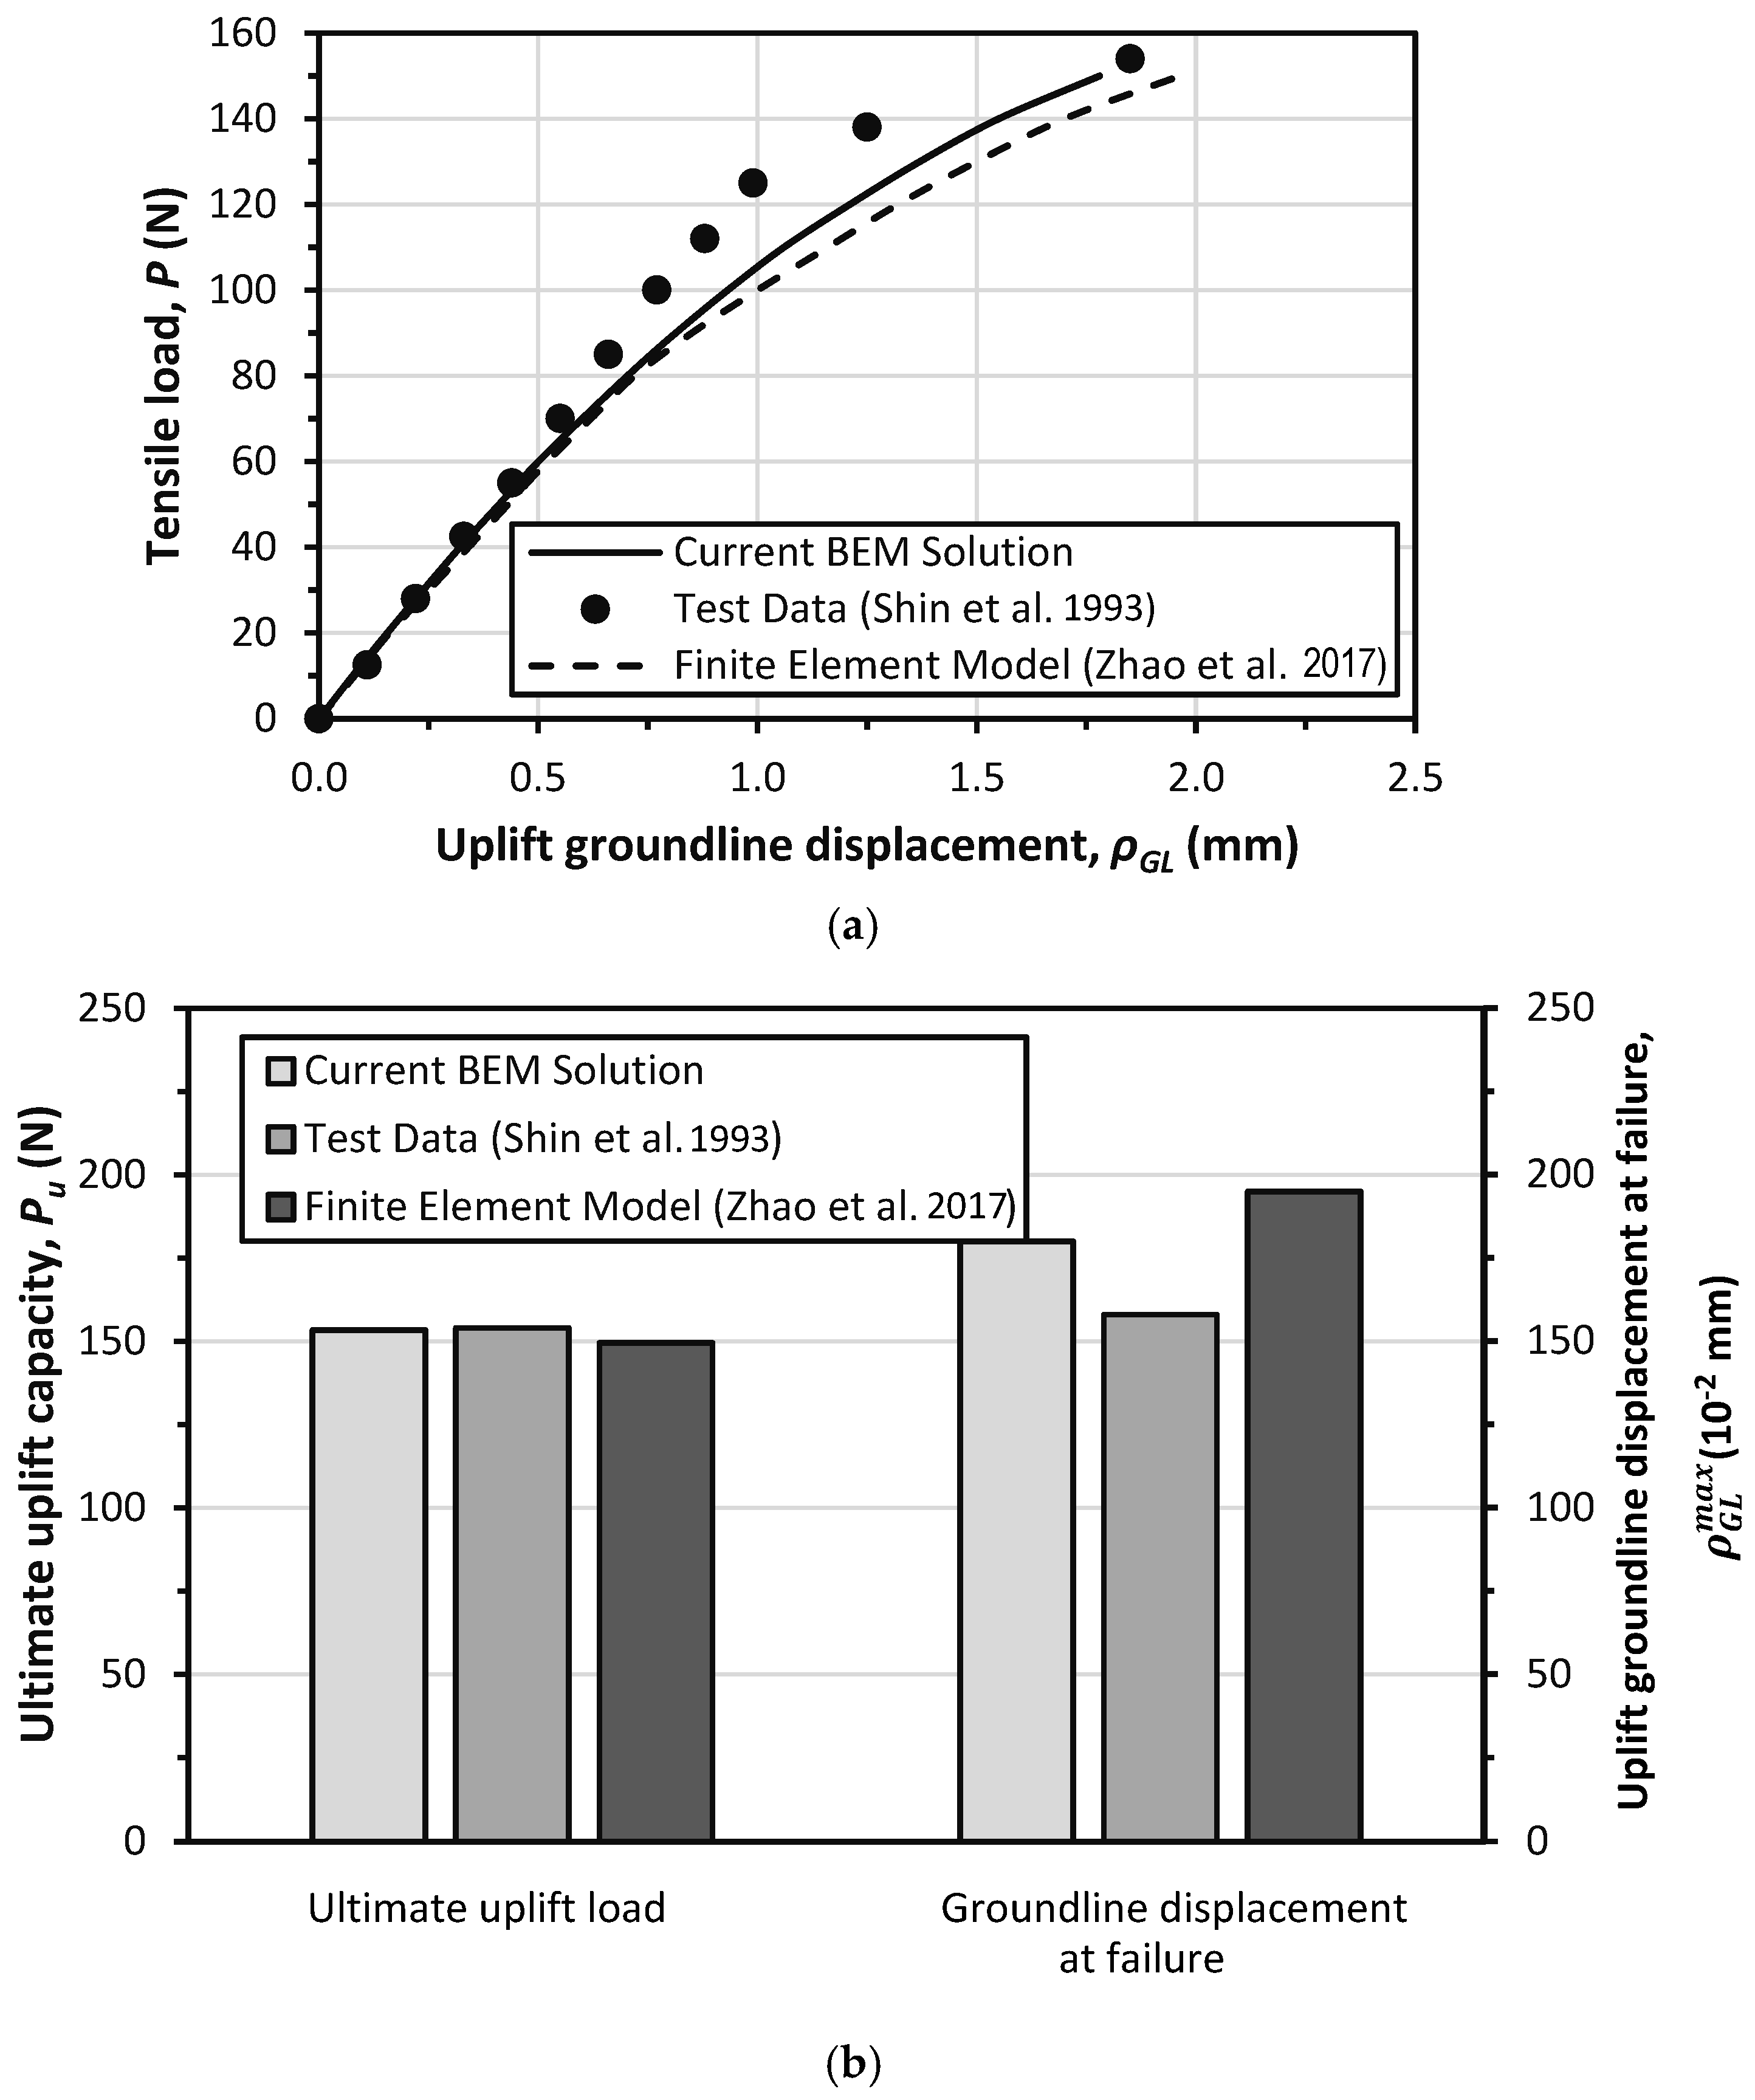
Table 1. The comparisons between numerical and experimental load–displacement response and ultimate uplift capacities are given in
Figure 4a and
Figure 4b respectively.
As observed from
Figure 4a, the average deviation of the current BEM results with the test data is about 9%, compared to a value of about 13% in the case of finite element results. Both the curves corresponding to the BEM and finite element analysis almost coincide with the test data up to
P = 50 N, exceeding which both the computed displacements over-predict the relevant test values, with the BEM results being lesser. As found from
Figure 4b, the BEM-computed ultimate uplift capacity (
Pu) was 153.4 N, with a relevant groundline displacement (
) of 1.8 mm, compared to the corresponding test- and finite element-computed values of 154 N, 149.5 N, 1.58 mm and 1.98 mm, respectively. Thus, the deviation of
Pu relevant to the computed values from BEM analysis and the previous finite element model with the test data are 0.4% and 2.9%, and those for
are 13.9% and 25.3%, respectively.
The possible reason for the observed deviation is the few assumed values of pile parameters (see
Table 1). The boundary effects of the soil confinement chamber have also reduced the pile displacement to some extent.
The BEM-computed results were compared with the experimental and FEM results of Shin et al. [
32] and Zhao et al. [
31], respectively. The laboratory model tests were conducted in a square soil confinement tank and the ratio of the tank length to pile diameter was about 18. The rigidity of the walls of the soil tank possibly influenced the test results, especially at higher load levels near failure where the induced displacements were also higher. Since the boundary effect has not been taken into account in BEM solution nor in the FEM analysis, the numerically obtained pile displacements at higher load levels are more than the relevant test values.
4.2. Cohesionless Soil
Gaaver [
41] conducted laboratory model tests to investigate the tensile responses of model mild steel pipe piles in dry cohesionless soil in a dense state. The remolded sand bed was prepared in a cylindrical confining chamber by rainfall technique in three different relative densities (75%, 85% and 95%). The piles were closed-ended and fully embedded in the test bed, while tensile load was imparted on the pile head using a loading machine and calibrated proving ring. The experimental results are utilized in the current study for validation of the present BEM solution. The input parameters for the soil and pile are taken from the test data [
41], as given in
Table 1. For pipe piles, a non-dimensional parameter
ξ =
Di/
D is included in Equations (7)–(10), based on previous solutions [
23,
24].
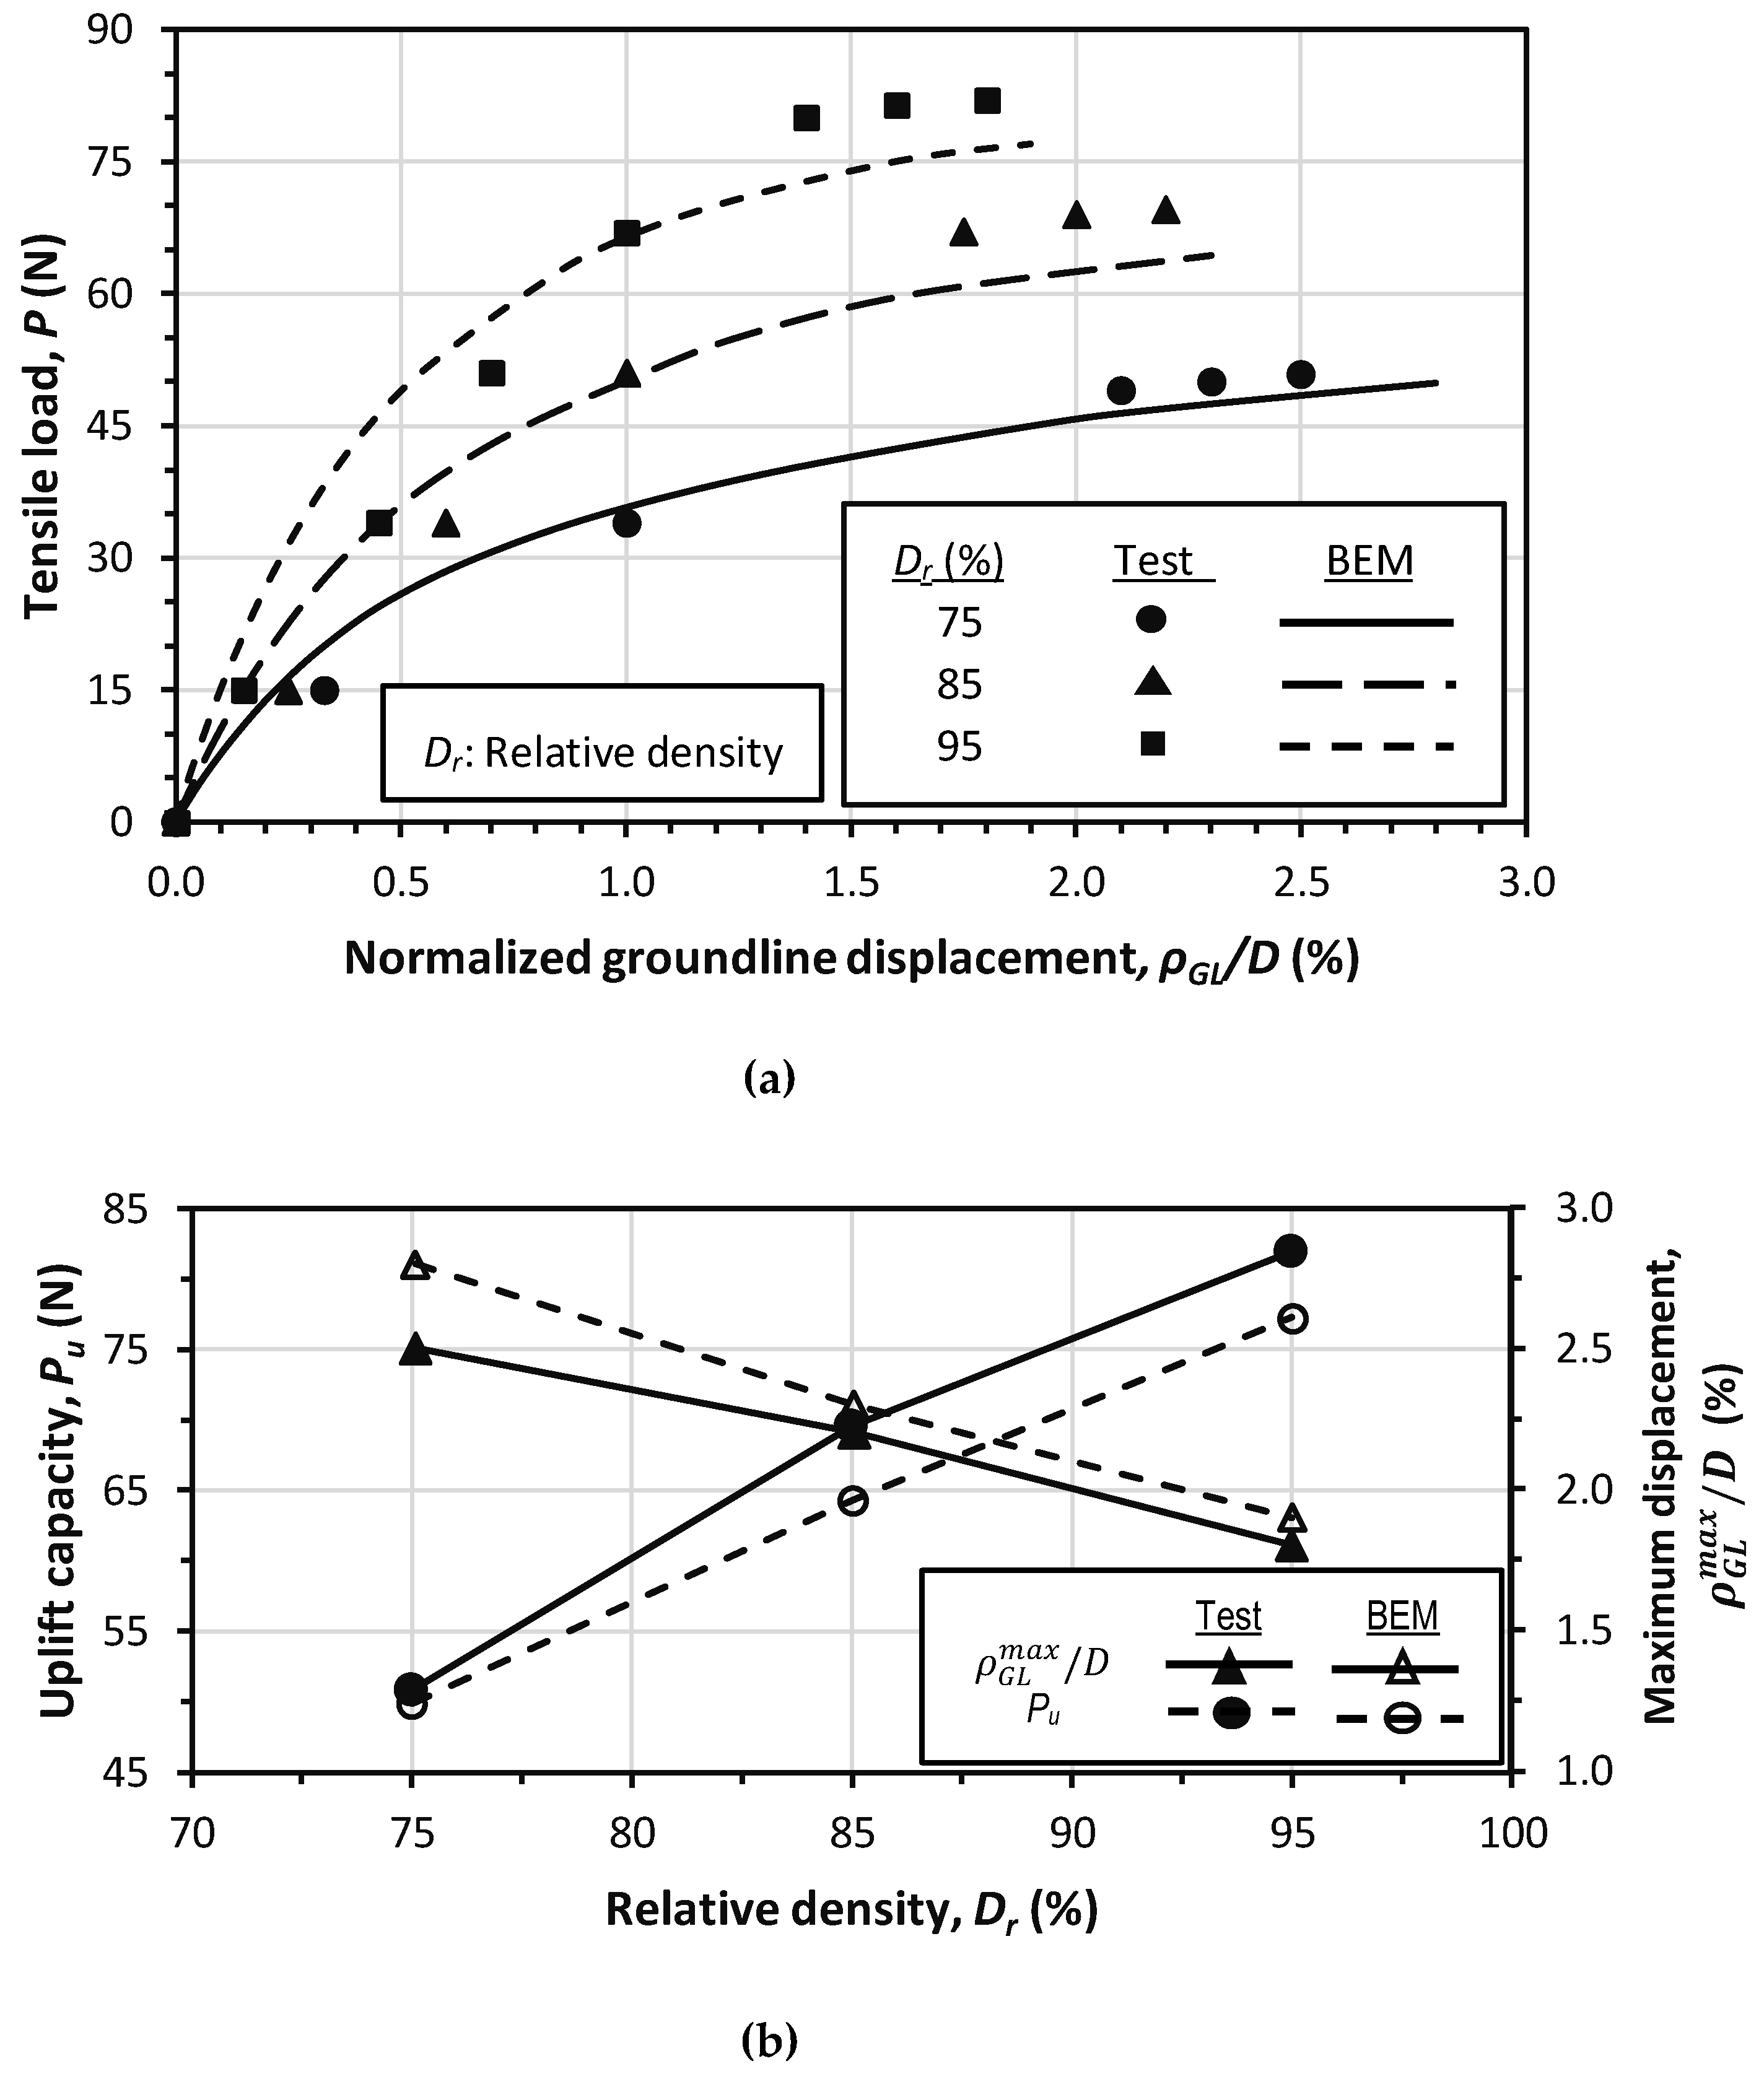
The experimental and BEM-computed tensile load versus uplift displacement responses for the sand beds of different relative densities are portrayed in
Figure 5a. The comparison of ultimate uplift pile capacities (
Pu) and maximum groundline displacements (
) is depicted in
Figure 5b.
As observed from
Figure 5a, the BEM-computed load–displacement responses for the test beds closely matched with the experimental patterns of variation, with average deviations of about 4%, 8% and 9% for the three relative densities of 75%, 85% and 95%, respectively. For all three cases, the BEM-computed pile displacements are under-predicted for load up to about 60–70% of the relevant ultimate uplift pile capacities. Closer to the failure loads, opposite observations are noted.
Figure 5b reveals that with respect to ascending sand relative density, the numerical and experimental values of ultimate uplift capacities
Pu increased while maximum displacement
decreased, both following a fairly linear trend. The BEM-computed
Pu under-predicted the relevant test values with the deviation ranging from 1.8% to 7.6%. The numerical values of
were found to be more than the corresponding experimental magnitudes with deviations varying from 4.5% to 12%.
The BEM results are in acceptable agreement with experimental data, with the deviations being significantly low. These deviations can be justified by the fact that the magnitudes of a few soil parameters which were not available in the test report [
41] were reasonably assumed from the available literature summarized in
Table 1.
4.3. c-ϕ Soil
Xu et al. [
42] performed laboratory-based model studies on the uplift response of piles in a remolded silty clay test bed. A solid circular pile from organic glass was used in the experiments. The pile diameter was 35 mm, while the embedded lengths used were 245 mm, 350 mm and 525 mm, corresponding to
L/
D ratios of 7, 10 and 15, respectively. The tensile loading on piles was imparted via a system consisting of a loading lever, reaction beam and lever support. The input data for BEM analysis were mostly taken from the test report [
42], together with a few assumed parameters, as given in
Table 1. Since the skin friction between the glass surface and soil is expected to be low, the magnitudes of
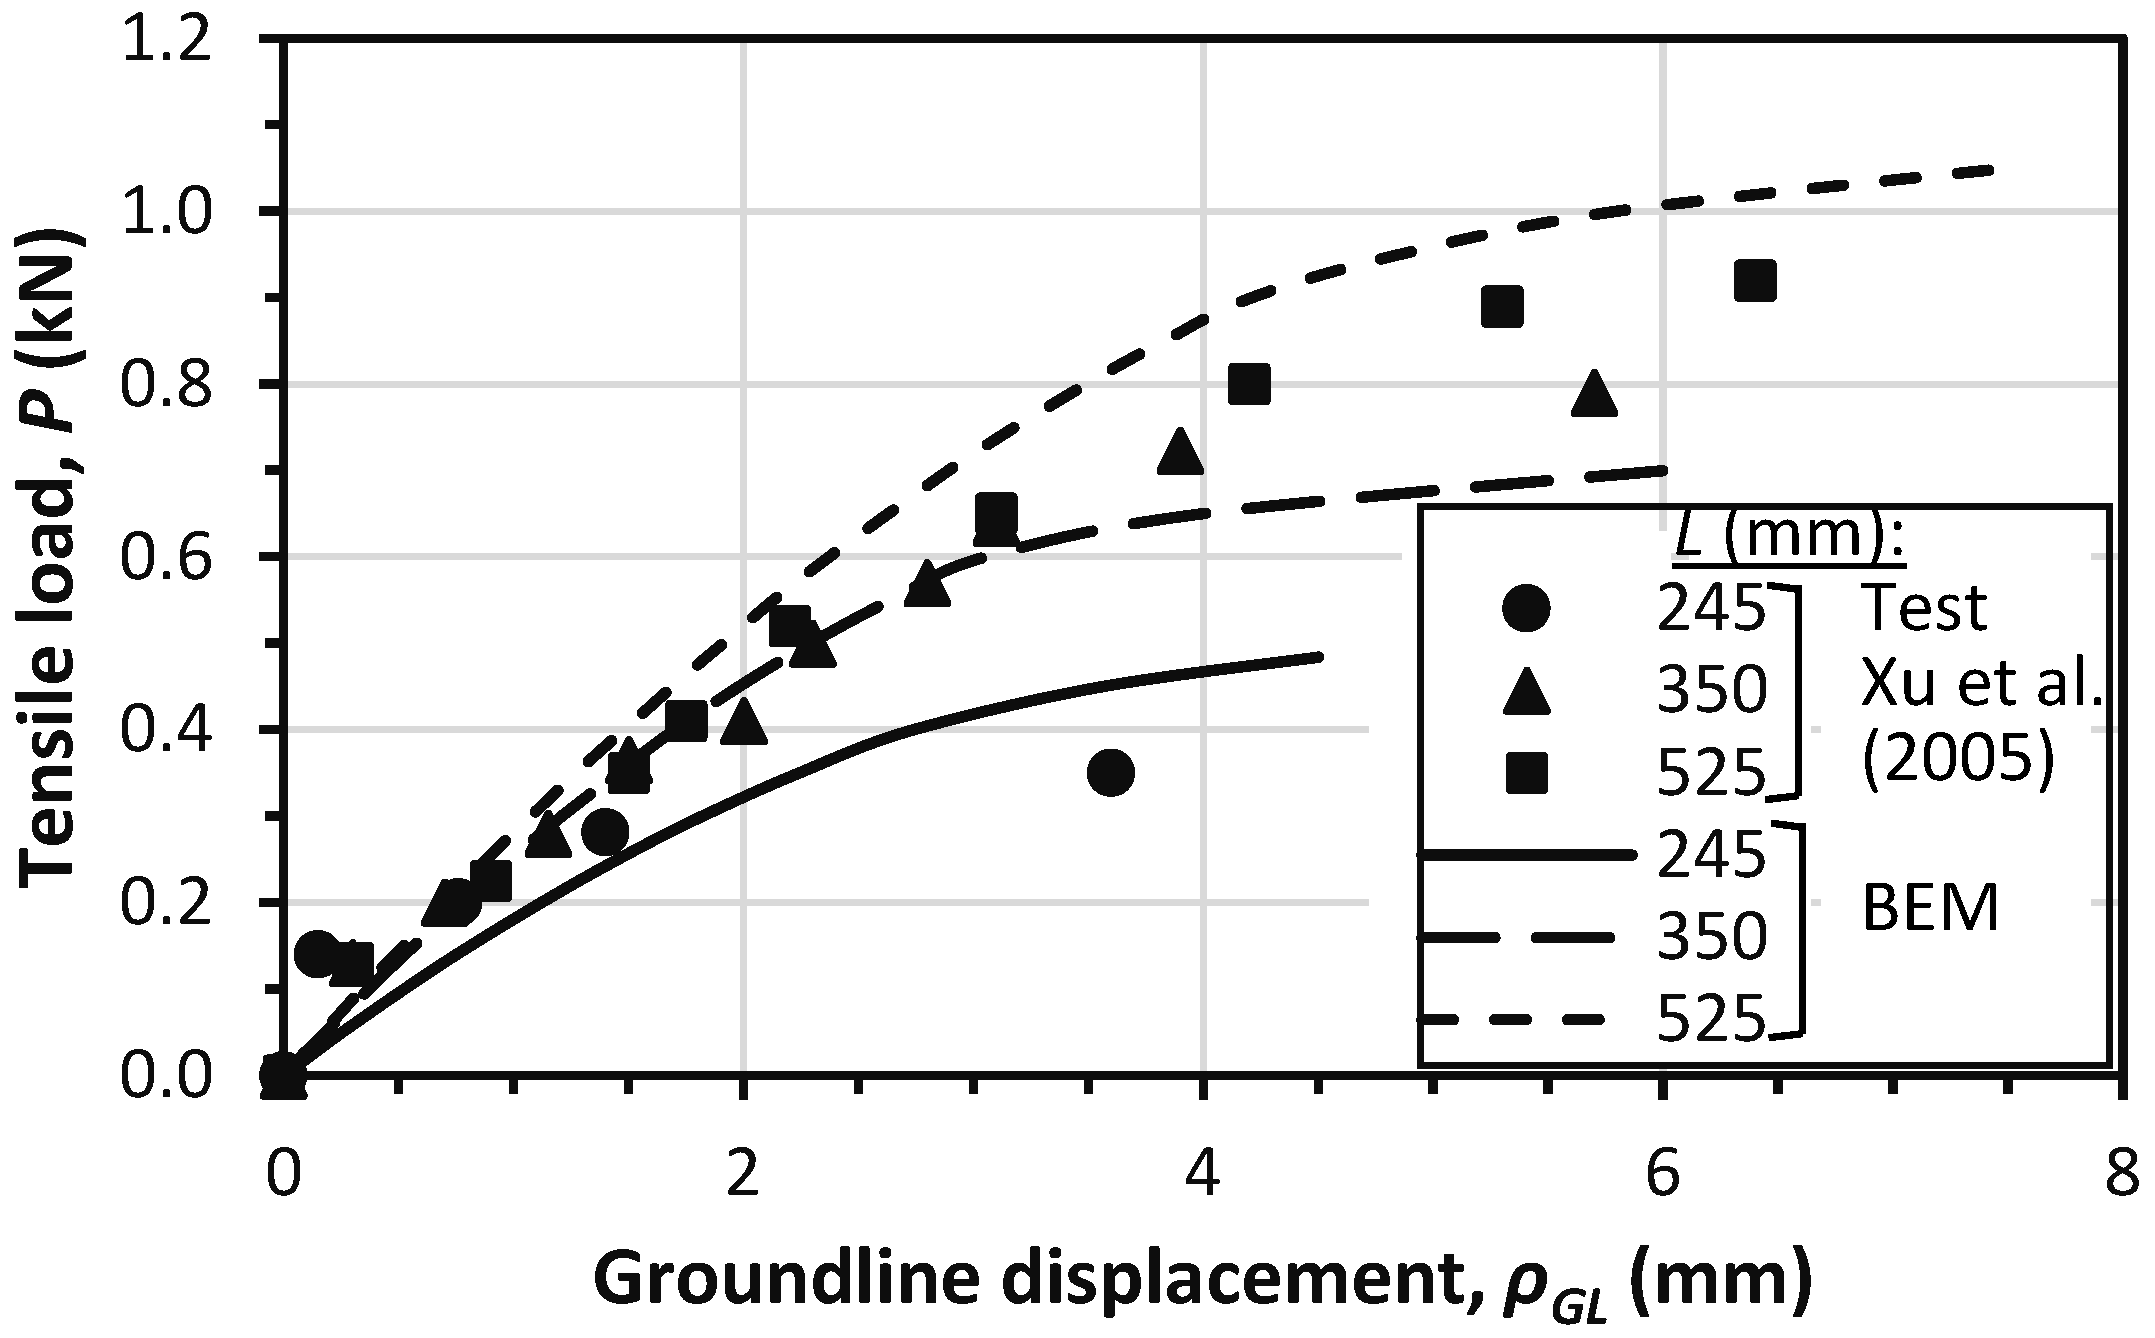
α and
Ks are chosen to be as low as 0.3 and 0.65. The comparisons between BEM-computed and experimentally observed load–displacement responses of the three piles under tension are depicted in
Figure 6.
As observed, the numerical results agree with test data with average deviations of about 17%, 9% and 14% for
L/
D ratios of 7, 10 and 15 only. For
L/
D = 7, the pile mostly behaved as a rigid body in soil compared to the higher values, justifying the significant deviation. In the case of
L/
D = 10 and 15, the deviations were less for lower load levels (up to about 50–70% of failure loads), and the deviations were found to increase progressively when the imparted tensile loads approached the ultimate values. Such an observation was possibly because at higher load levels, the organic glass behaves more like a brittle material compared to metal or concrete piles [
43]. The assumed values of the soil and pile parameters are also attributed to such deviations.
5. Case Studies
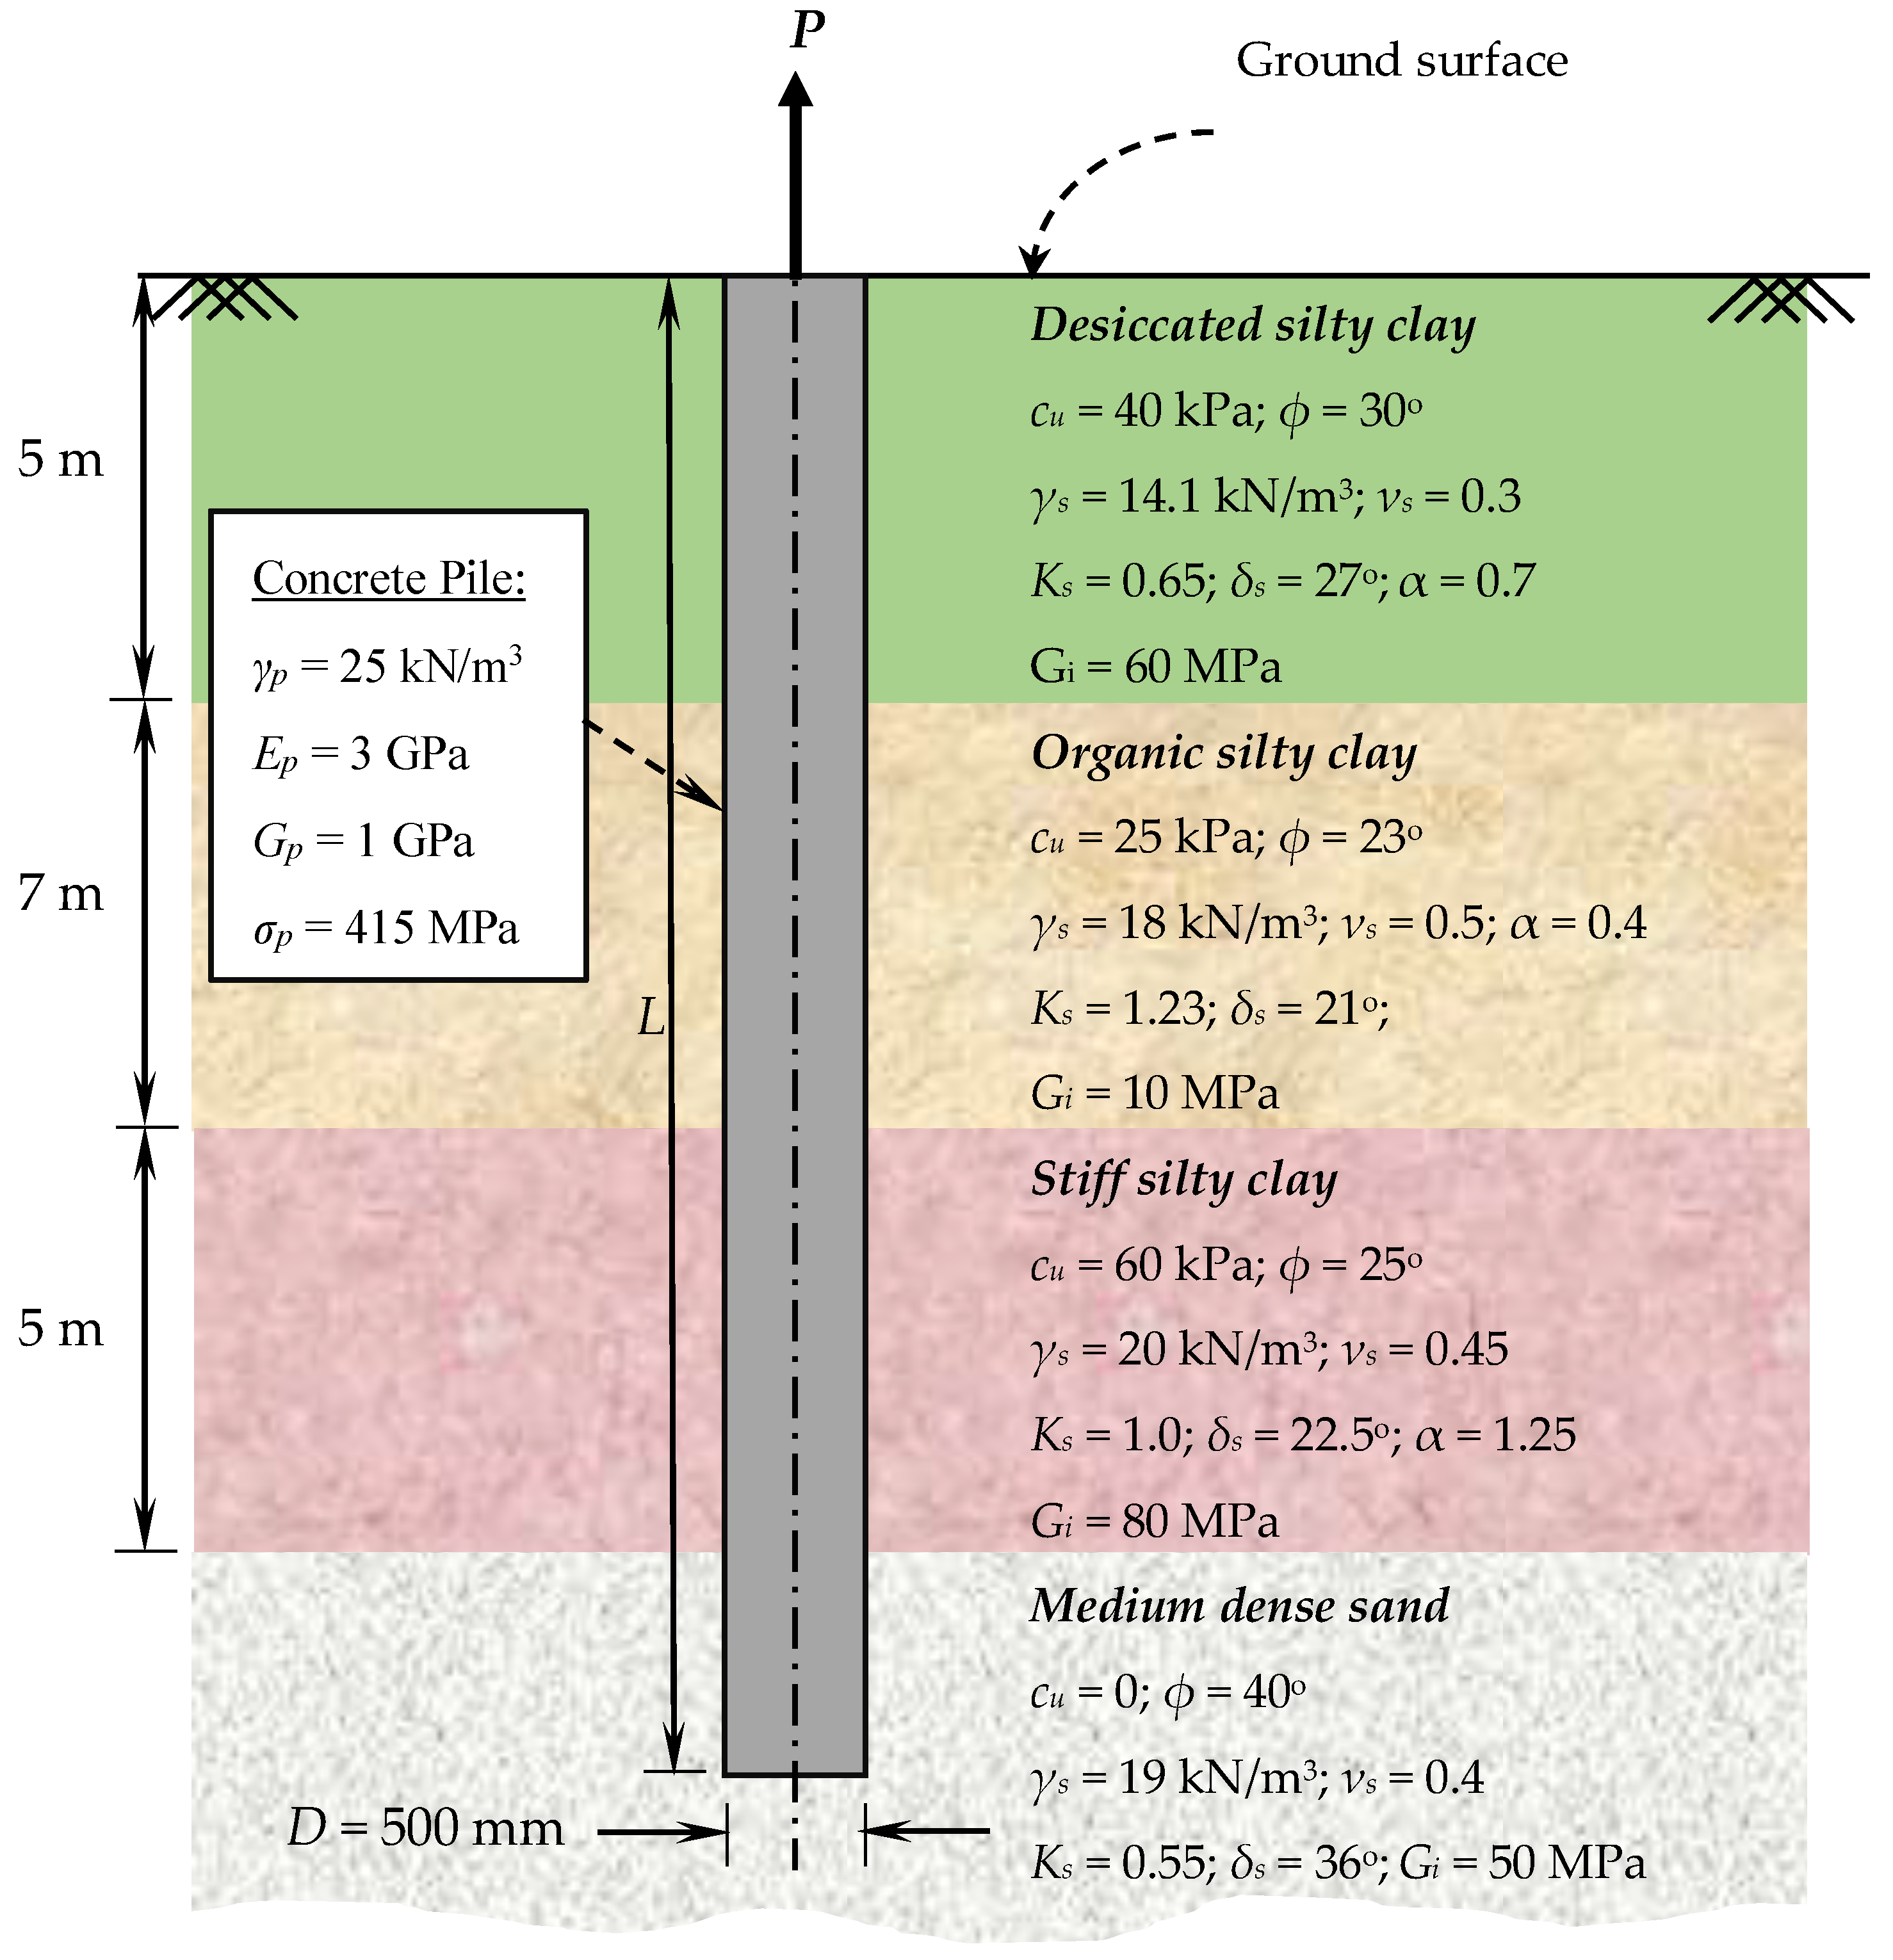
To investigate the response of a full-scale tension pile in the field, a typical case study has been conducted considering a driven concrete pile embedded in a layered subsoil in the city of Kolkata, India. The soil parameters available from a few previous studies on Kolkata soil [
44,
45,
46] have been utilized to carry out the case study. The soil and pile parameters taken for BEM computation are shown in
Figure 7. The groundwater table is assumed at ground surface. The embedded pile length
L varies from 10 m to 20 m, so as to study the influence of the parameter
L/
D on the tensile response of the pile, keeping the diameter constant (
D = 500 mm). In the case of
L/
D = 10, the pile penetrates only through the upper two soil layers, while for a gradually increasing
L/
D ratio, the pile penetrates through the bottom layers as well. The pile material has a Young’s modulus of 30 GPa, while its rigidity modulus is taken as
Gp = 1 GPa. From Equation (2), the value of
is evaluated as 81.5 MN.
As mentioned above, the soil parameters described in
Figure 7 are summarized from the existing literature on the Kolkata soil condition [
44,
45,
46]. The geometry and parameters of concrete pile given in
Figure 7 have been assumed from the available literature [
13,
23,
24,
25].
In order to alter the L/D ratio, analyses have been performed by varying the embedded pile length at 10 m, 12.5 m, 15 m, 17.5 m and 20 m, corresponding to L/D ratios of 20, 25, 30, 35 and 40, respectively.
5.1. Load–Displacement Response
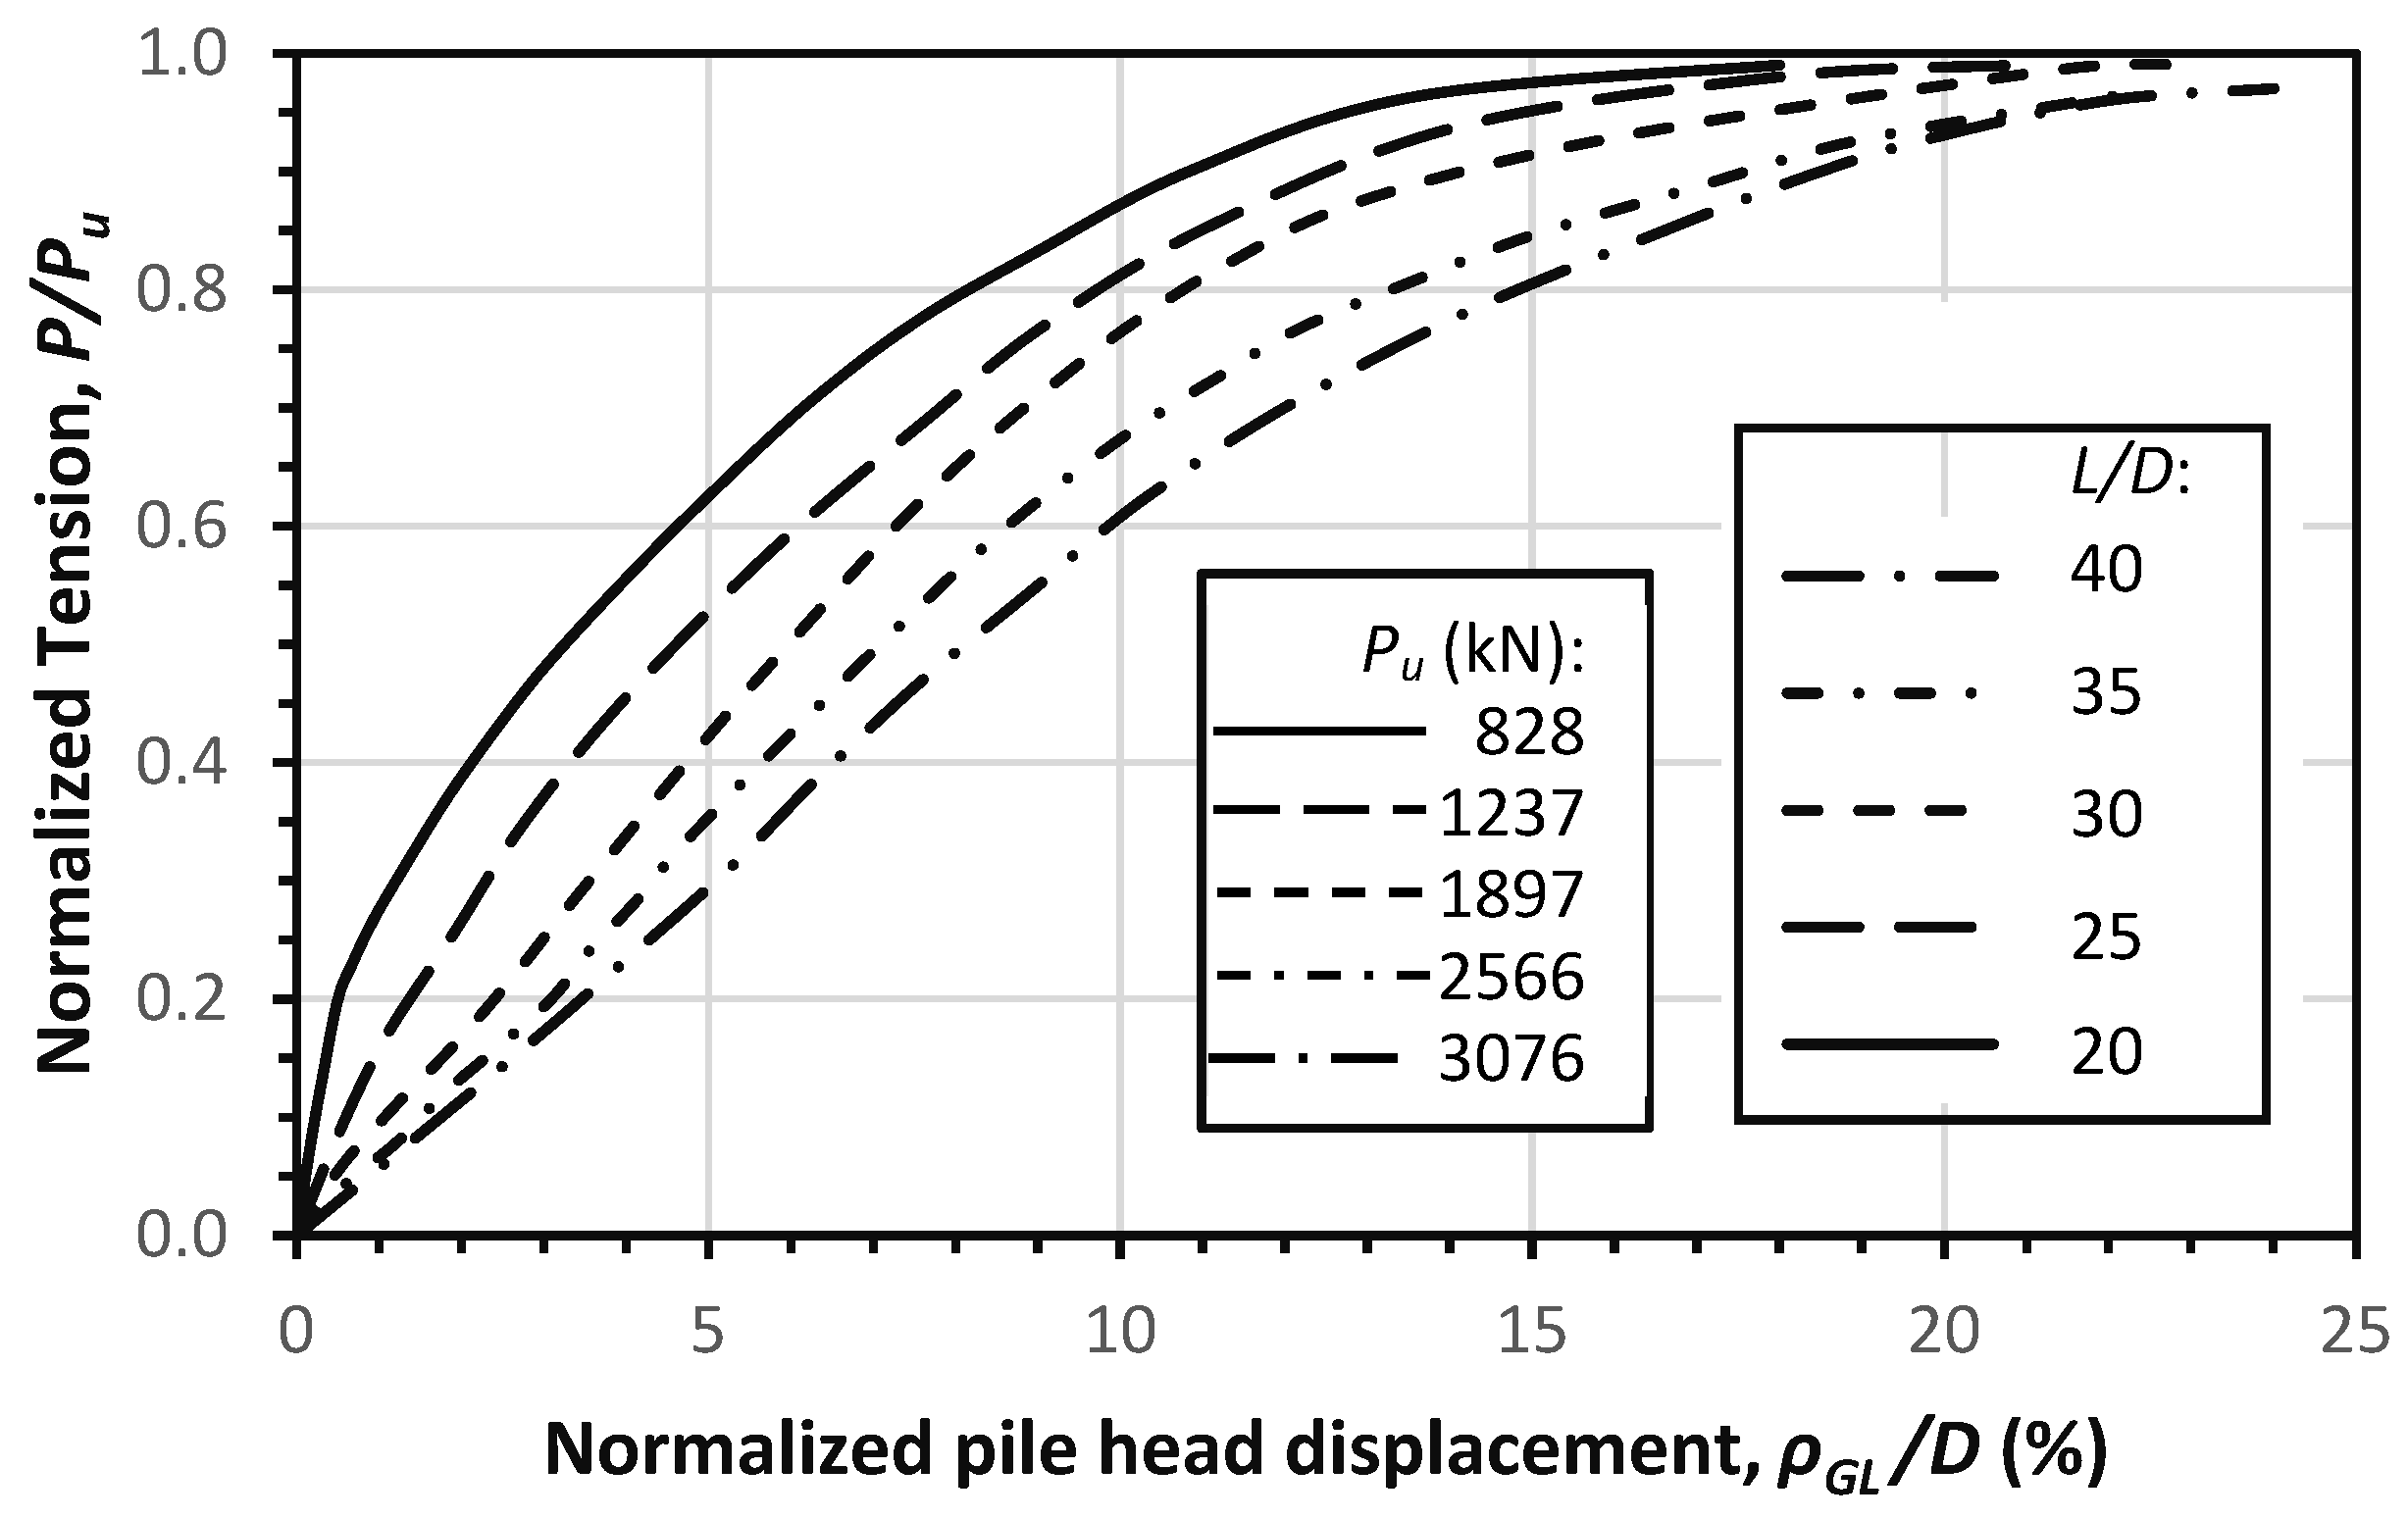
The uplift load–displacement responses of the pile for different
L/
D ratios are portrayed in
Figure 8. The imparted tension and resulting displacements have been normalized by
Pu and
D, respectively.
It is pertinent to note that a gradually increasing L/D ratio is accompanied by the pile being penetrated to some or all of the four soil layers. For example, for L/D = 20 with an embedded pile length of L = 10 m, the pile is penetrated up to the upper two soil layers only, while for L/D = 35 and 40, the pile passes through all four soil layers.
The load–displacement responses are observed to be parabolic in nature. For the initial values of uplift loads, the curves are found to be linear, and gradually curvilinear trends are visible as the load increases. In the case of a specific value of the uplift load, the corresponding pile head displacement is found to progressively increase with ascending
L/
D ratio. For a higher
L/
D ratio (35 and 40), a slight reverse curvature is noted. Since the model is unable to compute the pile displacements at failure load (i.e.,
P =
) due to redundancy, as mentioned earlier, these limiting displacements are estimated by extrapolation. The computed values of failure load are given in
Figure 8 and none of them are found to exceed the ultimate tension of pile
itself, which indicates that the failure occurs by pile–soil slippage.
The above observations are inconsistent with a few earlier studies [
13,
16] wherein the nonlinearity in load–displacement response took place due to progressive slippage of pile elements with increasing tensile load. Shorter piles behaved as rigid body displacements in the soil medium, whereas elastic characteristics in longer piles were evident.
5.2. Influence of L/D Ratio
The
L/
D ratio was found to play crucial role in pile–soil interactive performance under tension. The variations in uplift pile capacity and limiting pile head displacement with
L/
D are depicted in
Figure 9. The ultimate pile capacity
Pu has been normalized by
, where
is the weighted average of the bulk unit weight of soil layers up to the depth of pile embedment. The limiting pile head displacement
, on the other hand, has been normalized by
D.
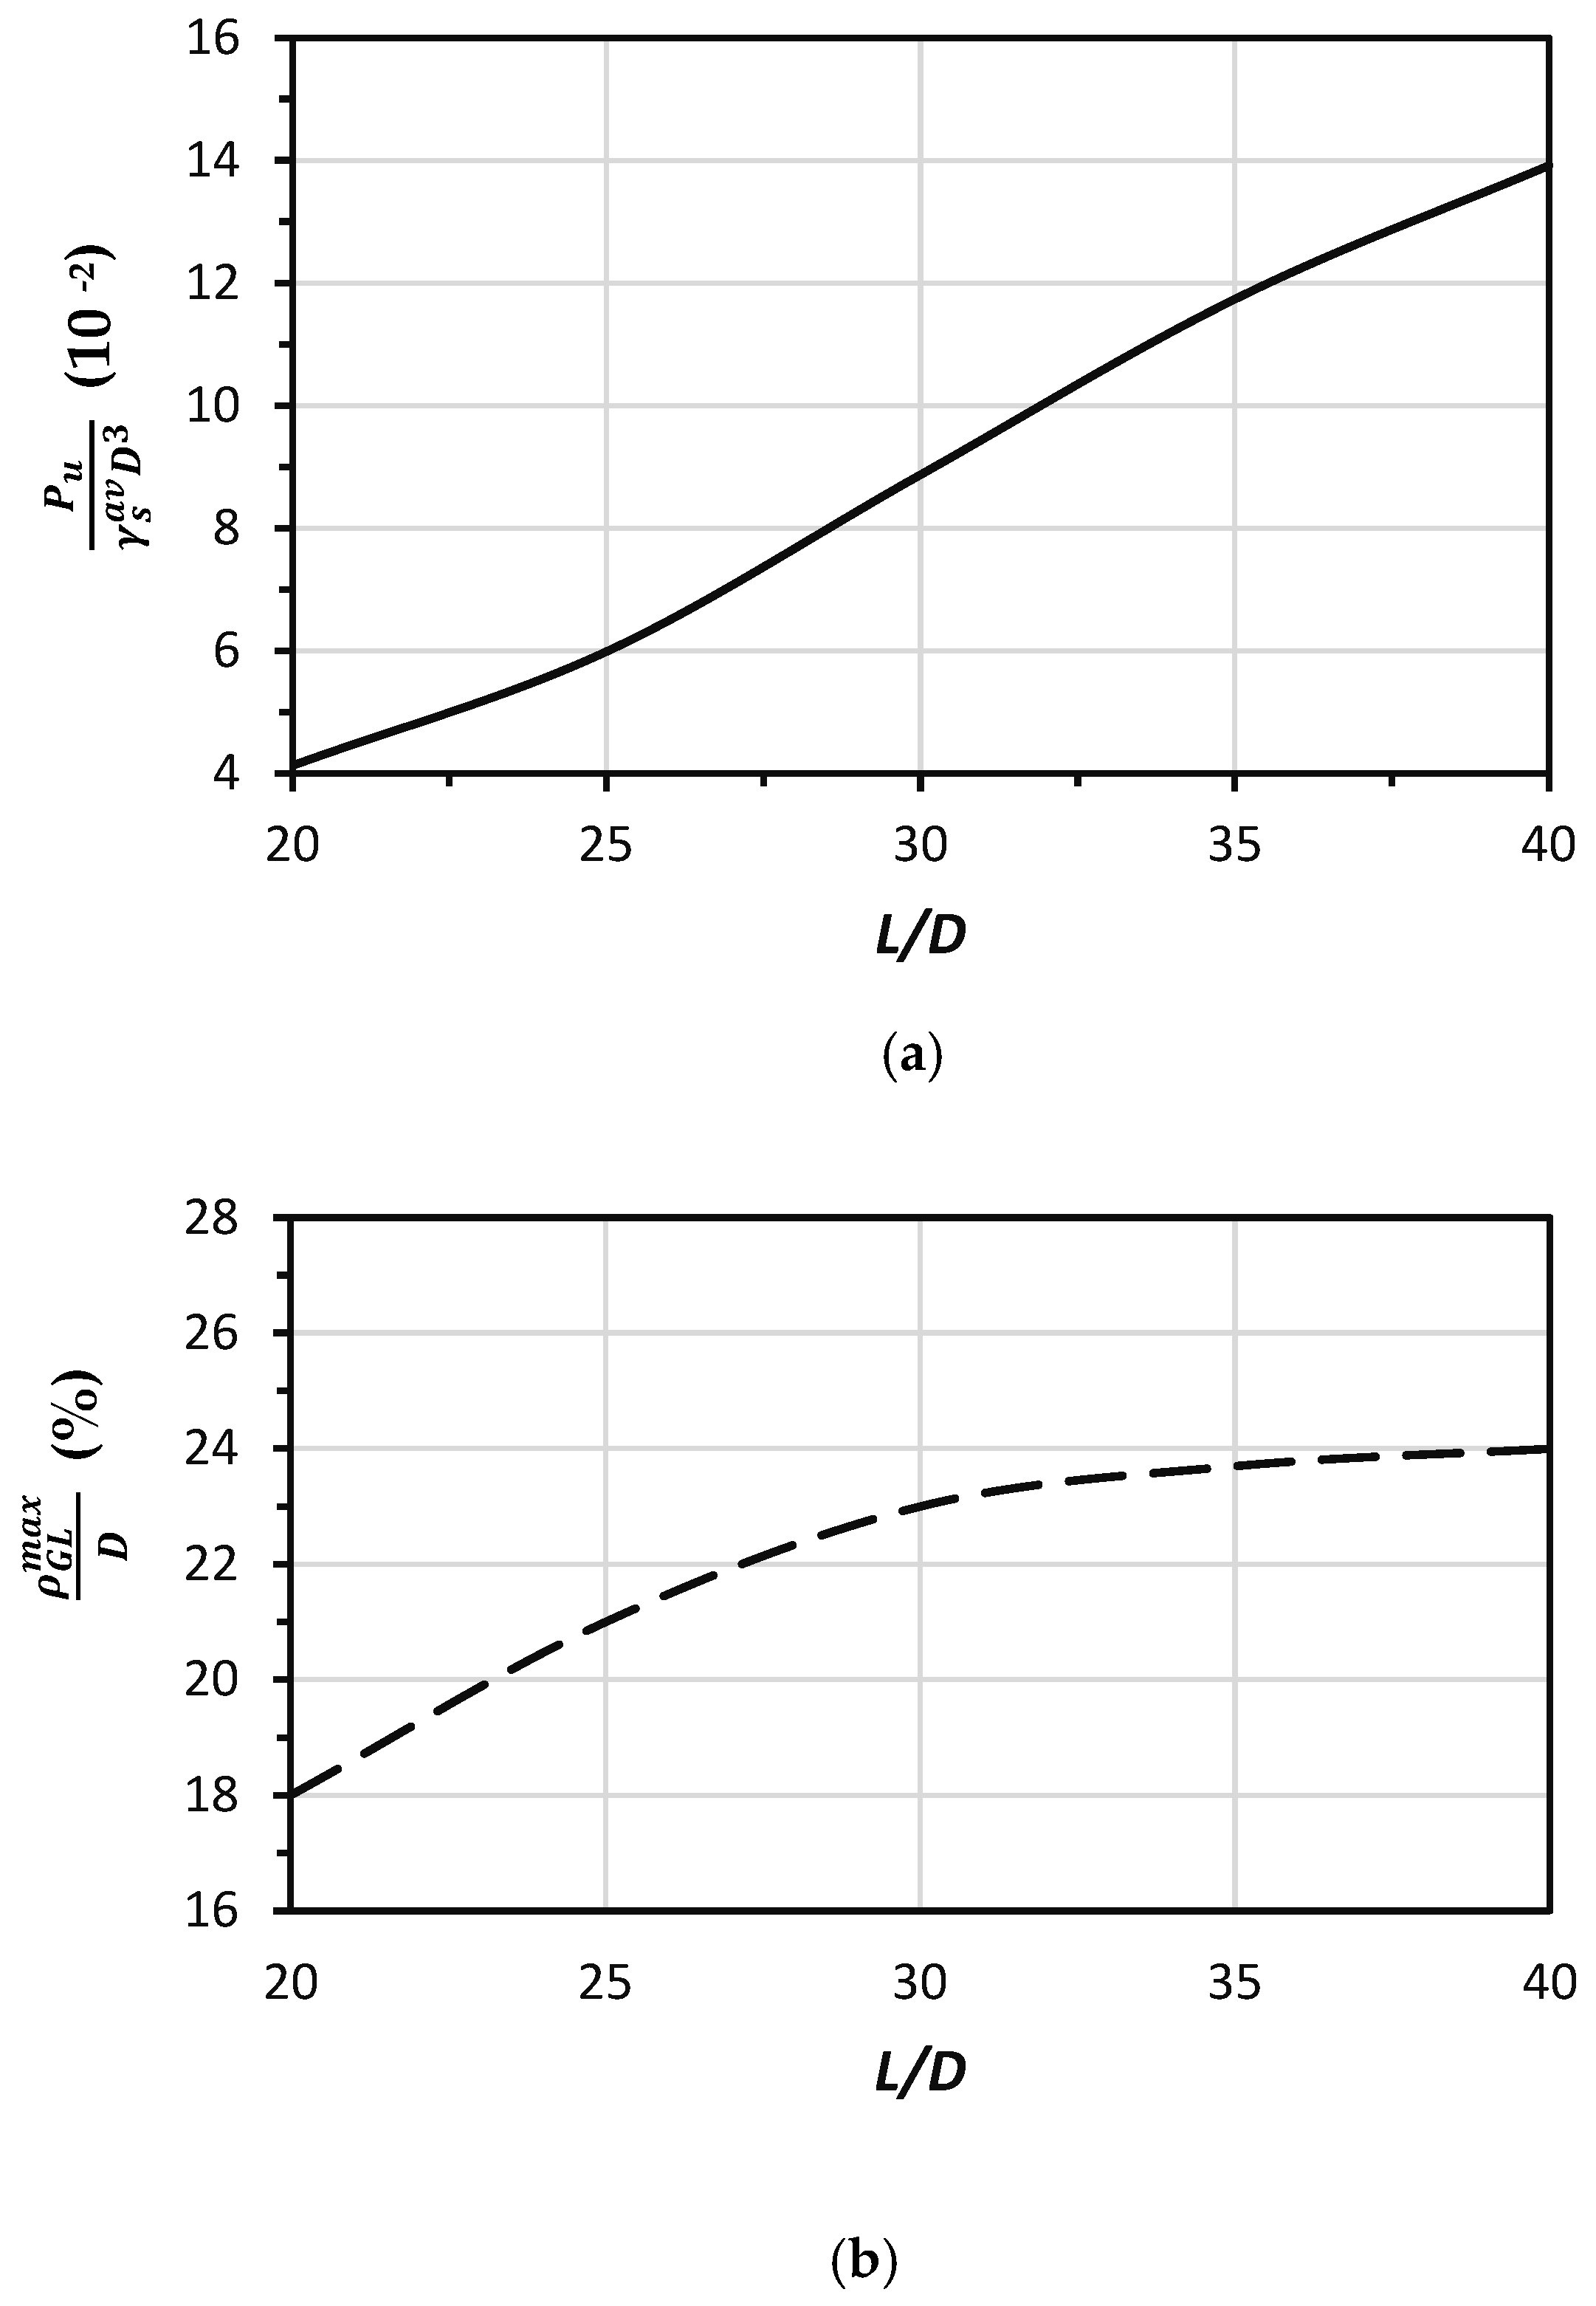
Both curves in
Figure 9a and
Figure 9b are found to be curvilinear. For the chosen range of
L/
D, the normalized ultimate capacity and limiting displacement increased in the ranges of 4.15–14 and 18.1–24%, respectively. With ascending
L/
D ratio, the normalized ultimate capacity increased with increasing slope up to
L/
D = 30 and thereafter a decreasing slope was observed. The normalized limiting displacement, on the other hand, increased with descending slope with an asymptotic stabilizing trend. Such an observational pattern may be justified by the fact that a higher
L/
D ratio initiates longer piles with greater capacity and increased displacement due to elastic behavior.
As observed from
Figure 7, ascending
L/
D ratio implied that the pile had been penetrated through different soil layers. For
L/
D = 30, the pile penetrated through the upper three soil layers only, but for
L/
D > 30, the pile also penetrated to the bottom sand layer. Due to significant frictional resistance of the medium dense sand layer, the ultimate uplift capacity
was influenced and therefore the pattern of variation in normalized ultimate uplift pile capacity with
L/
D = 30 altered, with a change in slope.
5.3. Stress Distributions
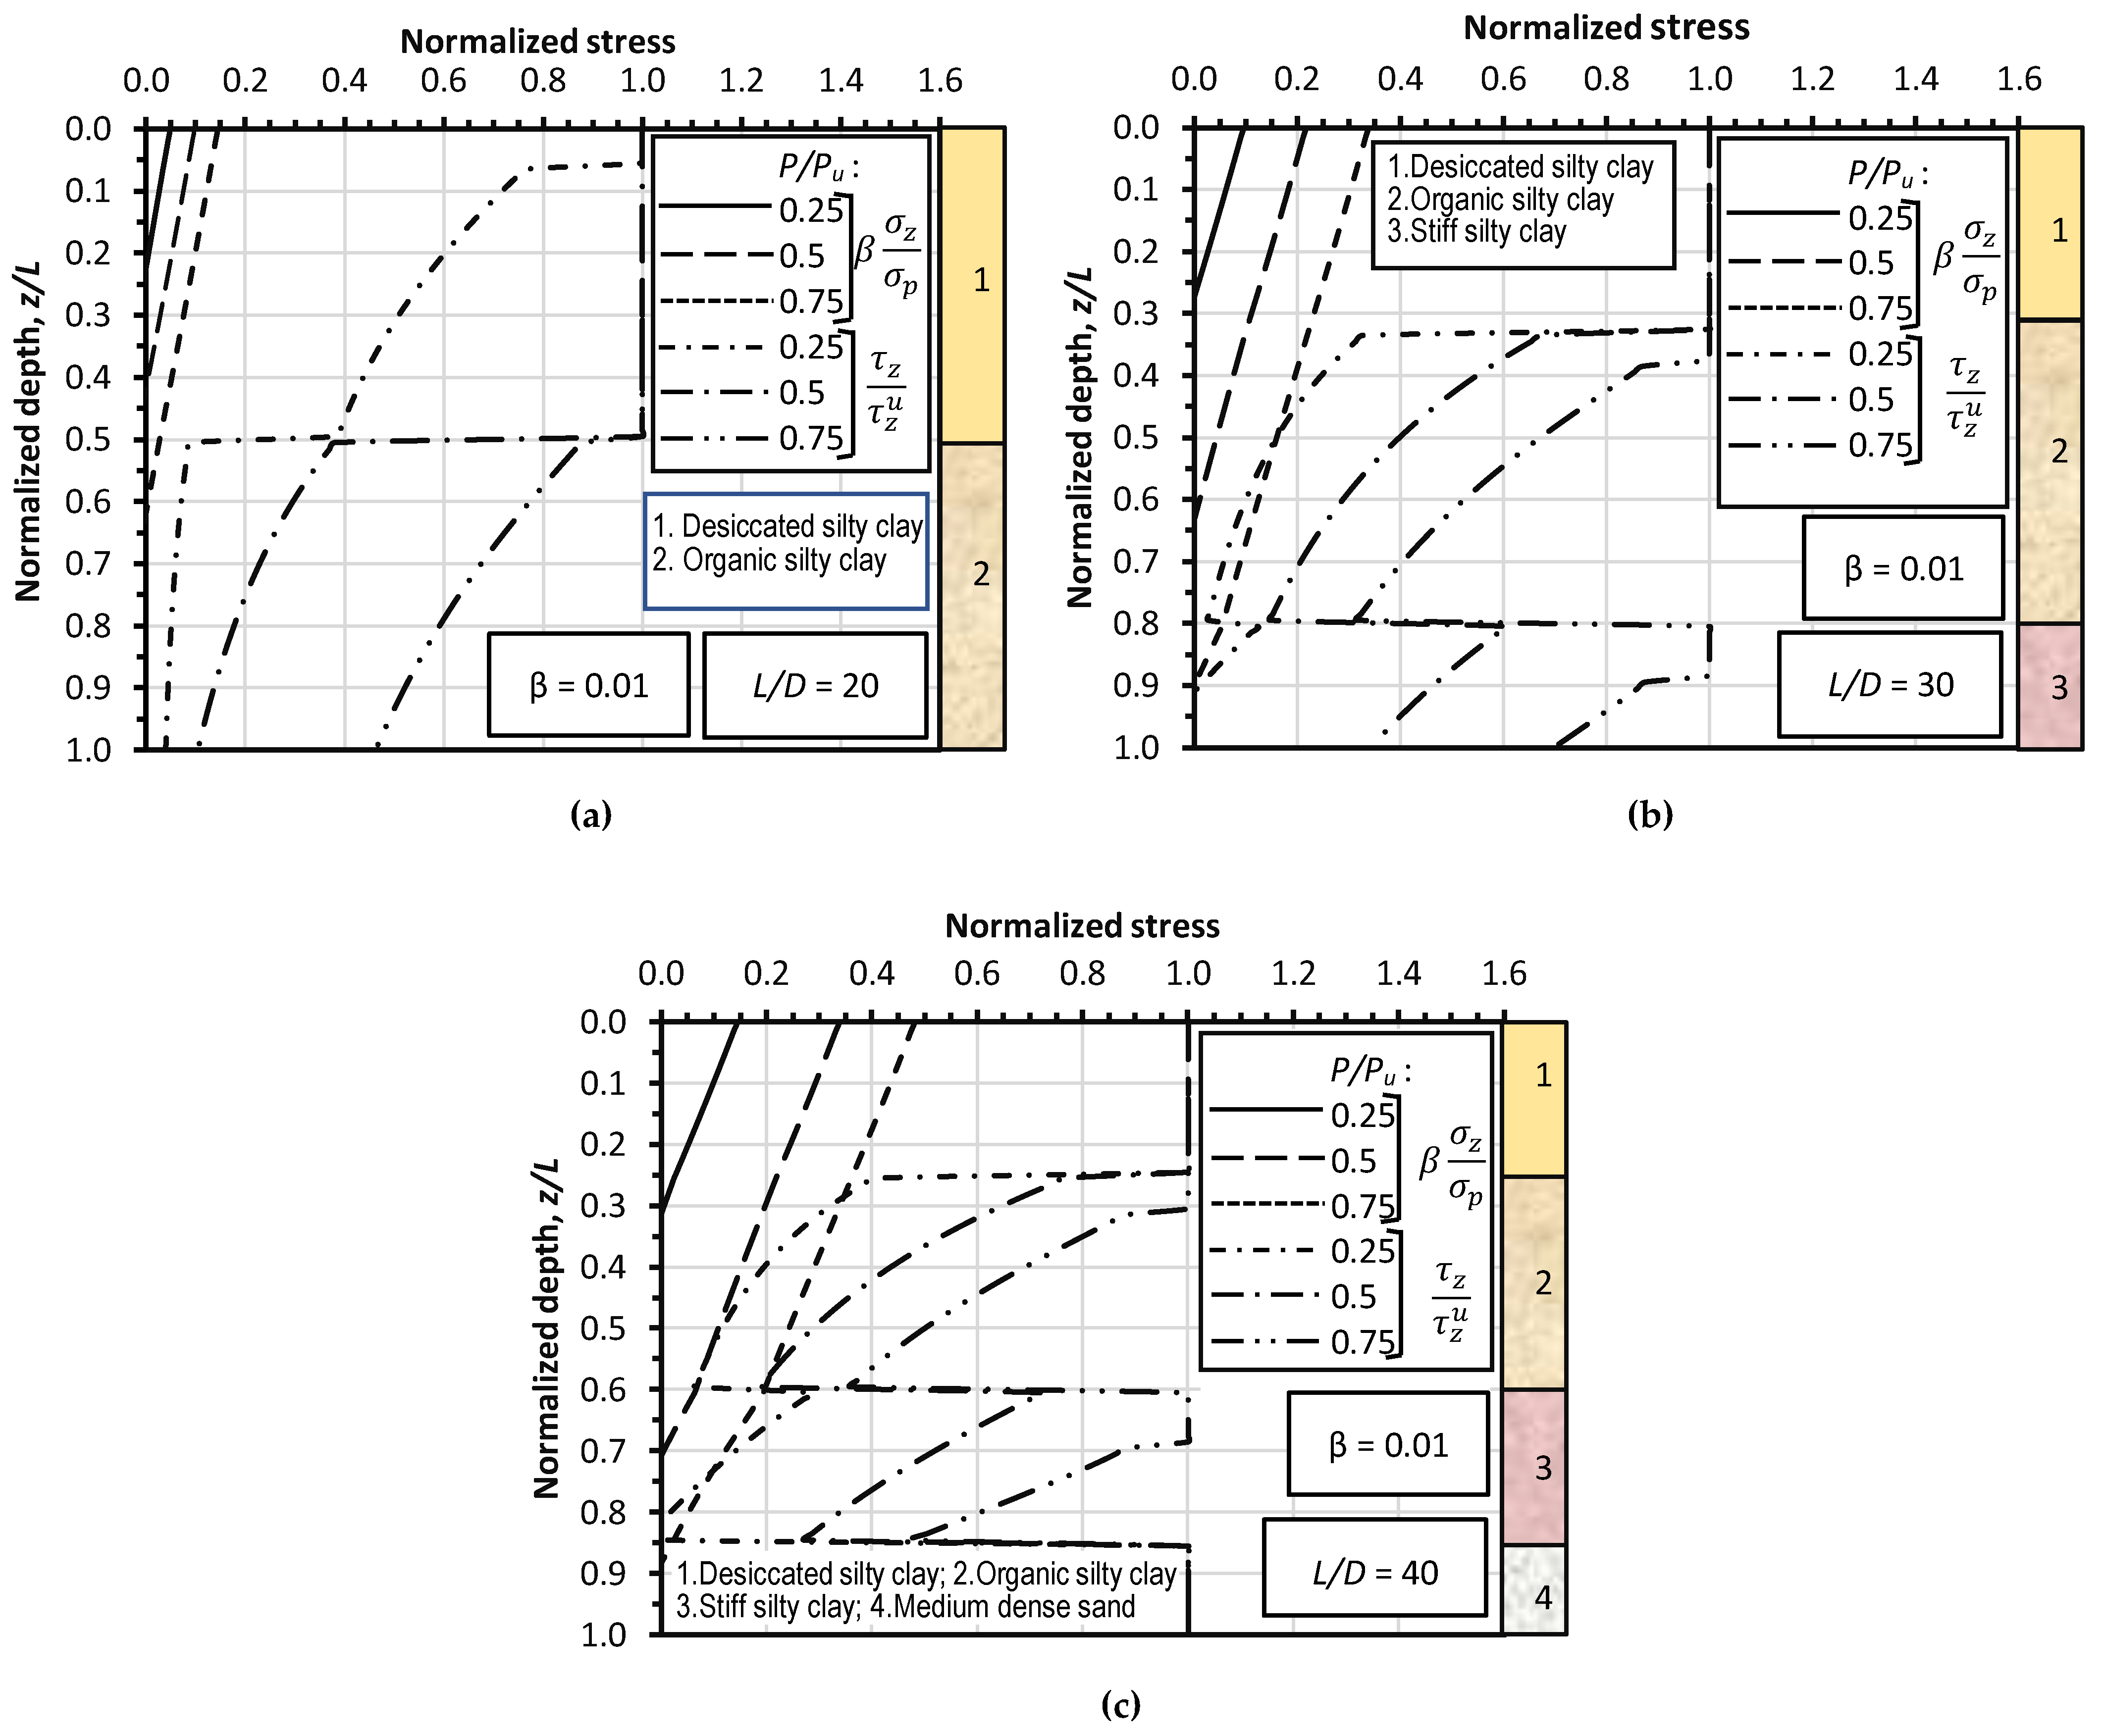
The distributions of interface shear stress
and tensile stress
in the pile cross-section along the embedded pile length are presented in
Figure 10. The shear stress has been normalized by the corresponding limiting value
, while the tensile stress is normalized by the limiting tensile stress of pile
.
Analyses were done for the longitudinal stress distribution of imparted tensile load levels (P/Pu) of 0.25, 0.5 and 0.75, and L/D ratios of 20, 30 and 40. The tensile stresses are observed to be at their maximum at the ground surface and linearly decrease to be negligibly small at a certain depth. The shear stresses, on the other hand, are found to decrease nonlinearly with depth. A sudden change in the magnitude of shear stress has been noted at the junction of two adjacent layers, due to alterations in soil strength and stiffness.
In the case of L/D = 20, the pile penetrated only through the first two soil layers. The magnitudes of tensile stress () were found to vary in the range of 4.76 × 10⁻⁴–14.4 × 10⁻⁴, and the depth where it diminished varied from z/L = 0.25 to z/L = 0.6 for the chosen range of load levels. In the case of an L/D of 30 and 40, the relevant normalized values ranged as 9.55 × 10⁻⁴ ≤ ≤ 33.6 × 10⁻⁴ and 14.3 × 10⁻⁴ ≤ ≤ 48.1 × 10⁻⁴, with the relevant depths (z/L) varying in the ranges of 0.3–0.9 and 0.33–0.9, respectively.
From the shear stress distributions, it has been observed that for the majority of the cases, pile–soil slippage occurred for certain depths of all the soil layers, as evidenced by , following a curvilinear descent. With ascending uplift load level, the depth of slippage pertaining to each of the layers progressively increased.
The above observations are justified by the fact that tensile stresses were highest in the vicinity of the ground surface and gradually decreased with depth when the imparted uplift load was primarily balanced by the shear stress components. For each of the soil layers, pile–soil slippage was accompanied by progressive slip of pile elements commencing from the top of the layers, with increasing uplift load. A similar observation was noted in earlier studies [
47,
48].
6. Discussions
The boundary element model involves stresses and displacements relevant to the pile–soil interface. Under imparted uplift load, the displacement-compatibility condition and possible pile–soil slippage condition are applicable to the interface only. Thus, the stress condition and strain induced in the soil away from the interface are not captured by the present model. Hence, the pile has been longitudinally discretized into a number of elements in a one-dimensional manner. Since the analysis does not account for the possible radial variation in soil stiffness due to pile installation, and the soil is assumed to be homogenous within each soil layer, the circumferential discretization of soil has not been done in the current boundary element model.
It is evident that the pile installation technique initiates residual stress in the soil adjacent to the pile surface, tangibly modifying the properties of surrounding soil, including unit weight, state of stress, void ratio, etc. To adequately capture the installation effects, appropriate and advanced constitutive models were proposed in the recent past [
49,
50]. Reasonable modification in the present parabolic stress–strain curve by shifting the starting point might be a realistic option, which the authors are currently investigating for future publication.
Furthermore, tension piles below the water table supporting offshore platforms are subjected to scour erosion due to the hydrodynamic effects of sea wave [
51]. Although not captured in the current model, incorporation of scouring would be interesting for future study.
The proposed parabolic soil model has several advantages over the conventional hyperbolic model. In the latter model, a non-dimensional reduction factor (
Rf) is required, but information available for its appropriate and problem-specific value is limited, although the numerical results are observed to be influenced by the alteration of its magnitude. Moreover, in the hyperbolic model, sudden changes in slope of the stress–strain curve at yield point (i.e.,
τ =
τu) were found to affect the numerical results adversely. The above problems have been eliminated in the proposed parabolic soil model, where no reduction factor is required and at the same time, no abrupt alteration in the slope of stress–strain curve takes place anywhere. This is illustrated in
Figure 11.
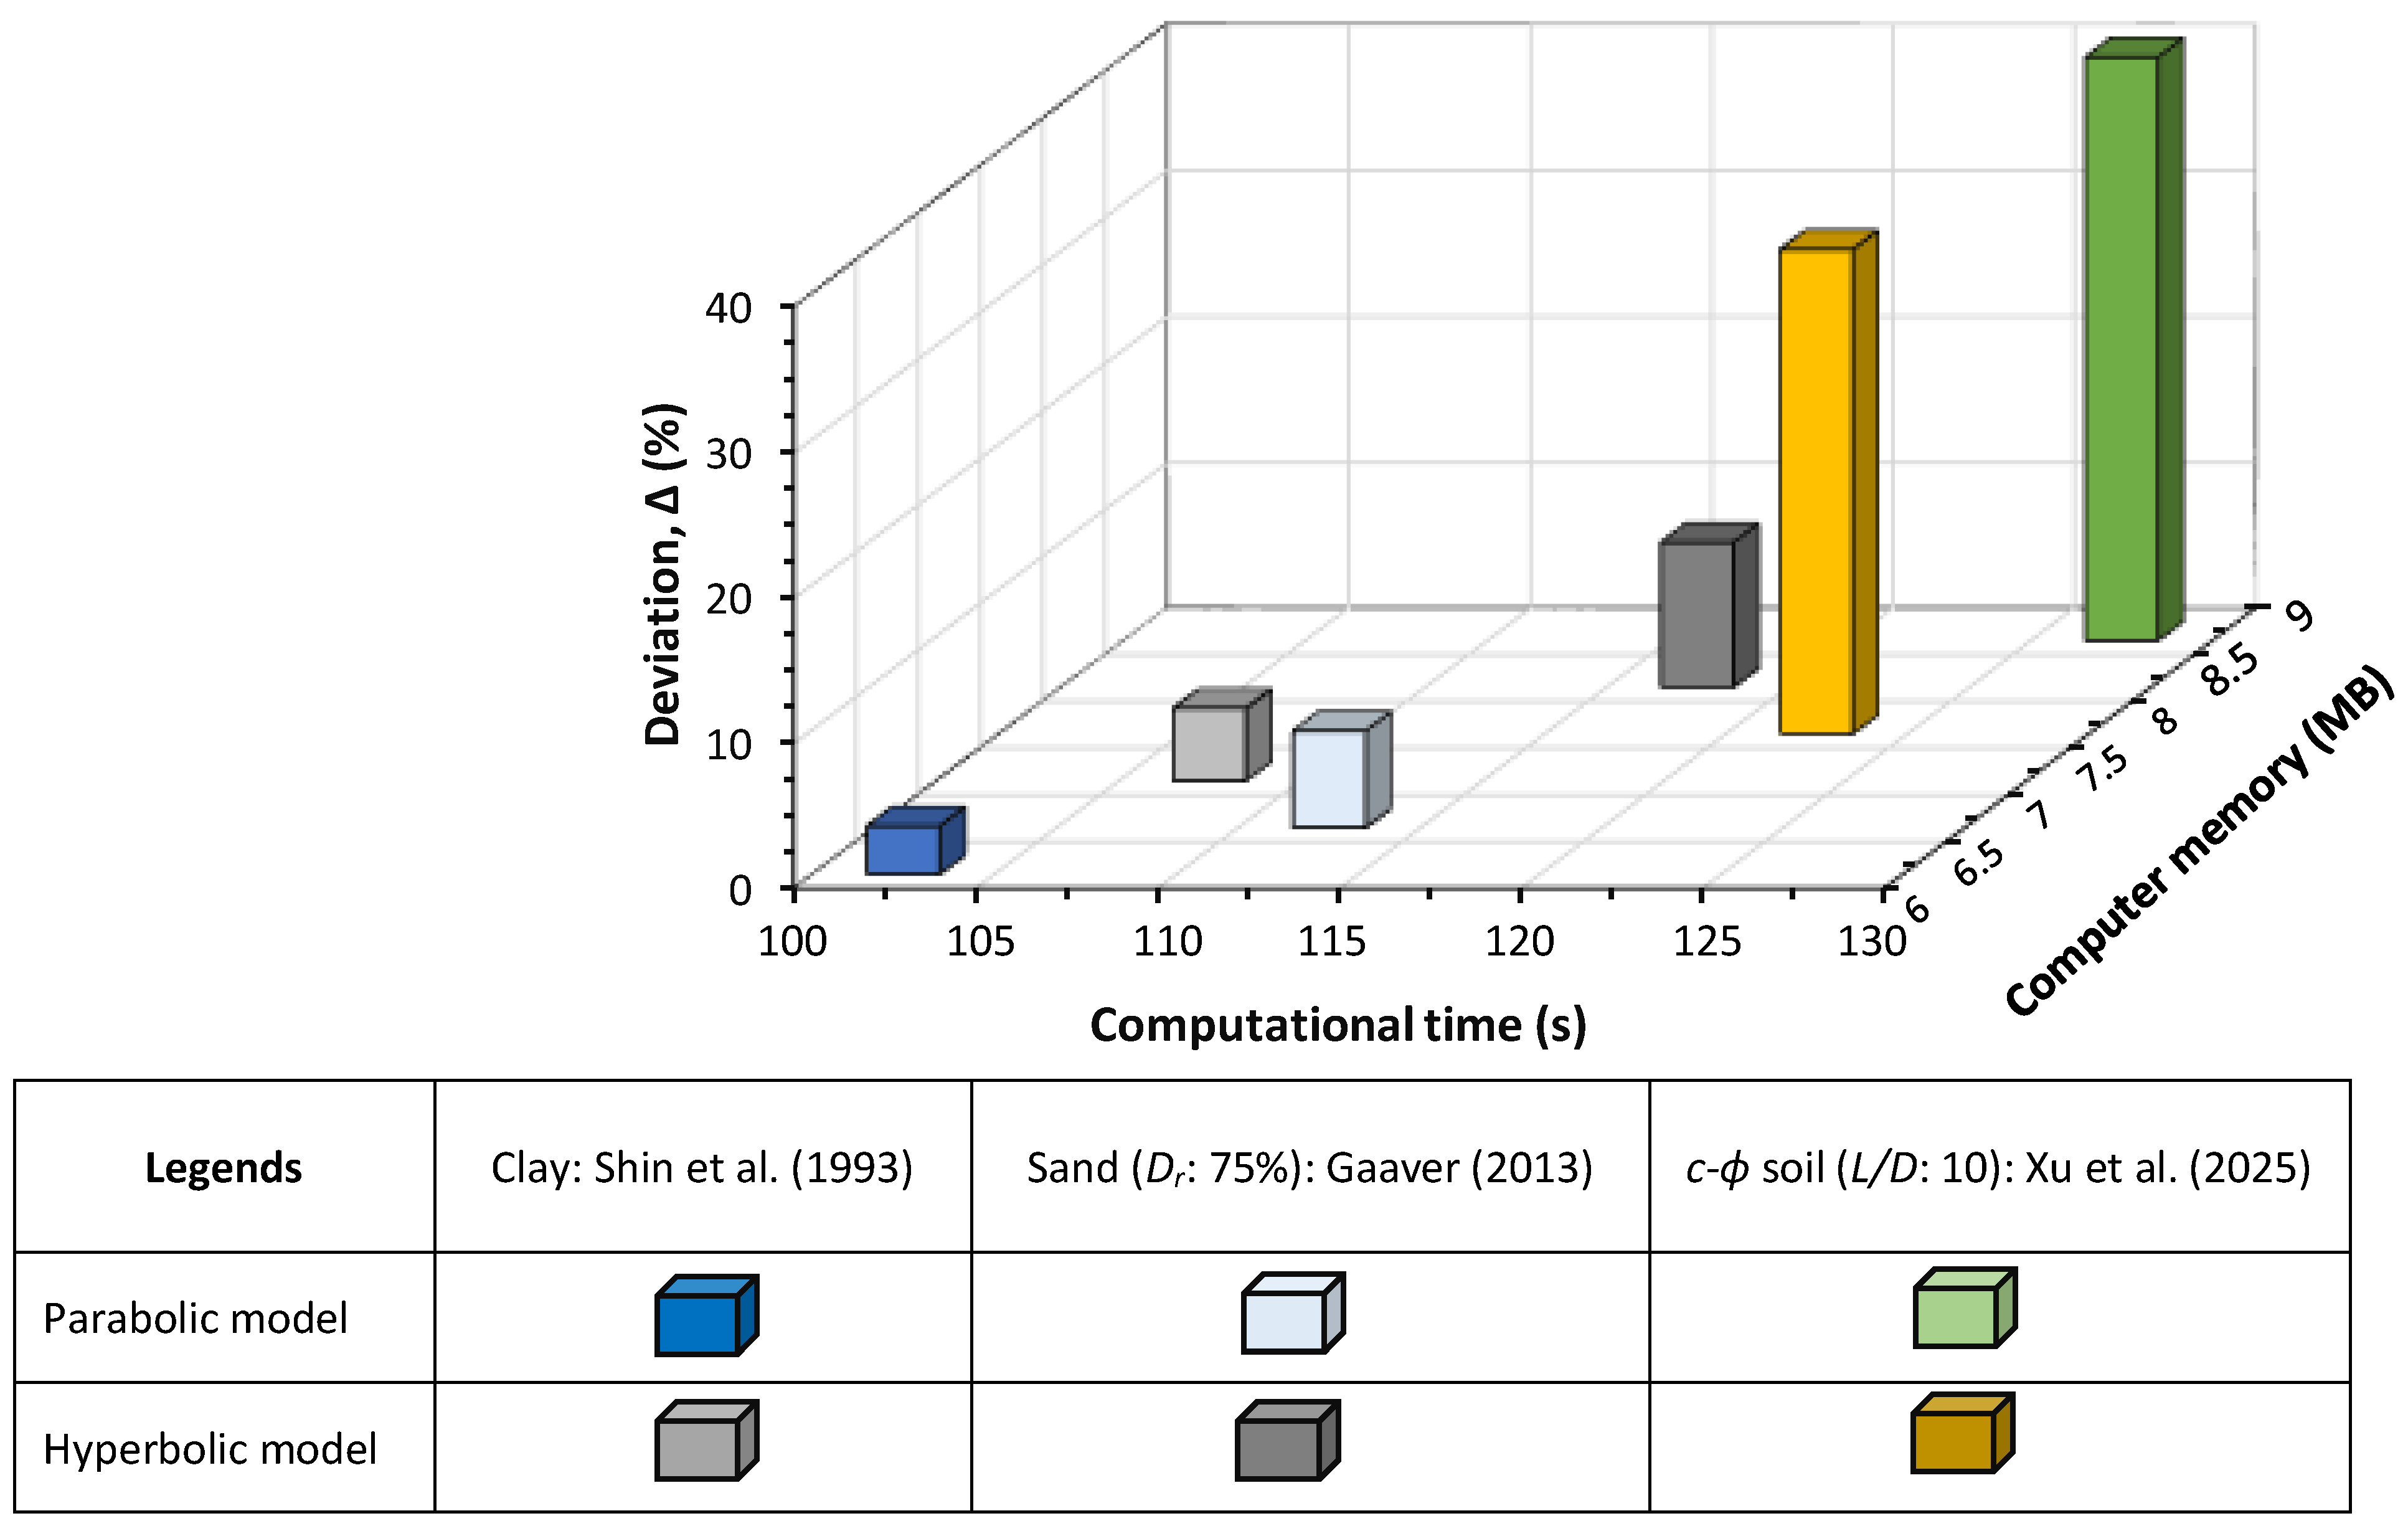
To conduct a comparative study between the proposed parabolic model and existing hyperbolic model [
13] in terms of computational accuracy and efficiency, the results obtained by current and previous soil models have been compared, as portrayed in
Figure 12.
The experimental results described above in
Section 4 have been compared with numerical results obtained by the current parabolic soil model and previous hyperbolic model.
In the comparative study, the imparted load corresponding to the groundline displacement of 1% of the pile diameter is chosen for convenience. A non-dimensional term deviation (∆) is introduced, defined by:
where
Mexp and
Mth are the experimental and theoretical magnitudes of an output parameter.
The values of deviations have been plotted against the computation time and computer memory space consumed, as shown in
Figure 12. It is observed that the current parabolic model yielded lower deviation with relatively less computational time and computer memory space consumed compared to the conventional hyperbolic soil model.
7. Novelty and Limitations
This paper presents a novel numerical solution using the boundary element method employing the parabolic soil model and elastic–perfectly plastic pile material to analyze the performance of tension piles. The proposed parabolic stress–strain correlation of soil has several advantages over the conventional hyperbolic soil model including its simplicity and progressively descending secant modulus of soil. The model also adopted appropriate correlations for c-ϕ soil, unlike the existing models which were largely based on purely cohesive or granular soils. In reality, the majority of the in situ soil characteristics necessitate analysis by considering both their cohesion as well as friction angle. The proposed model exhibited acceptable agreement with the existing test data which ensured the accuracy of the mathematical correlations developed. The model has been successfully applied to an in situ case study pertaining to concrete pile in a multi-layered soil for investigating the load–displacement characteristics in tension, the influence of the L/D ratio on ultimate load and limiting pile displacements, and the induced stress distributions.
Although the proposed numerical solution offers promising results, it has a few inherent limitations, as sequentially detailed below:
Techniques undertaken for pile installation produce initial stress in the soil and pile which largely affects the performance of the pile–soil system subjected to tension. The influence of such initial stresses on the numerical results is not studied.
Piles supporting a few complex structures, e.g., offshore platforms, transmission towers, etc., are sometimes subjected to simultaneous uplift, lateral and torsional loadings. The numerical model is unable to capture the effects of such a compound loading condition.
In practical engineering, tension piles are mostly served in the form of pile groups. The current study focused on single pile captures the primary load-transfer mechanism and failure and displacement pattern considering pile–soil slippage, although a further study deliberating on the pile group effect is crucial [
52,
53].
The authors are currently conducting an in-depth investigation on pile–soil interactions incorporating the group effect and under complex loading conditions with the combined effects of uplift, lateral, and torsional loads, and the upcoming work will be published in the future.
8. Conclusions
A boundary element-based numerical solution to investigate the pile–soil interactive performance under tension has been presented in this paper. Comparison of the results obtained by utilizing the solution with available test data indicated the accuracy of the proposed model.
This study revealed that the uplift load–displacement response was parabolic with reducing slopes, with more displacement at a specific load level with an ascending L/D ratio. A slight reverse curvature was observed for initial load levels at higher L/D ratios.
It was found that both the ultimate uplift capacity and limiting upward displacement depend significantly upon the L/D ratio. With an ascending L/D ratio in the range of 20 ≤ L/D ≤ 40, the normalized ultimate capacity increased nonlinearly in the range of 4.15 ≤ ≤ 14, with the slope ascending up to L/D = 30, and thereafter descending. With the same L/D ratio range, the normalized limiting upward displacement increased curvilinearly in the range 0.181 ≤ ≤ 0.24, following a descending slope with a stabilizing trend.
The longitudinal distributions of tensile stress and interface shear stress in the piles exhibited significant dependency on imparted load levels as well as L/D ratios. The tensile stress assumed the highest value at the ground surface and linearly decreased to negligibly small magnitudes at a certain depth. The shear stress distribution, on the other hand, was found to be nonlinear, and slippage was observed to occur at the pile elements near the top of the soil layers. A sudden alteration in the magnitude of shear stress was noted at the junction of two adjacent soil layers.
A comparative study of the parabolic soil model with the conventional hyperbolic model confirms that the proposed model is more accurate, with lower computational time and effort.
Although the developed numerical solution was successful in predicting the pile–soil interactive responses under uplift load, a few inherent limitations necessitate future research and development. Such limitations include inability of the model to capture the pile installation effects; the effects of compound loading like simultaneous uplift, lateral and torsional loads; and the influence of pile group effect.
Author Contributions
Conceptualization, S.B. and M.Q.A.; methodology, S.B., M.Q.A. and S.I.; software, S.B., M.Q.A. and S.I.; validation, S.B., M.Q.A. and S.I.; formal analysis, S.B., M.Q.A. and S.I.; investigation, S.B., M.Q.A., S.I. and M.K.; resources, data curation, S.B., M.Q.A. and S.I.; writing—original draft preparation, S.B., M.Q.A. and S.I.; writing—review and editing, S.B., M.Q.A., S.I. and M.K.; visualization, S.B., M.Q.A., S.I. and M.K.; supervision, S.B.; project administration, S.B. and M.Q.A.; funding acquisition, M.Q.A. and S.I. All authors have read and agreed to the published version of the manuscript.
Data Availability Statement
All data are available in the paper.
Acknowledgments
The authors extend their appreciation to the Deanship of Research and Graduate Studies at King Khalid University for funding this work through the Large Research Project under grant number RGP2/57/46. The infrastructural support received from Graphic Era Deemed to be University, India, and University of Nevada, Las Vegas, USA, are acknowledged as well.
Conflicts of Interest
The authors declare no conflicts of interest.
Abbreviations
The following abbreviations are used in this manuscript:
| BEM | Boundary element model |
| aij | Element in square matrix |
| bj | Element of augment vector |
| c | Cohesion of soil |
| cu | Undrained cohesion of soil |
| D | Diameter of pile |
| Ep | Young’s modulus of pile material |
| Gi | Initial tangent modulus of soil |
| Gp | Modulus of rigidity of pile material |
| Gs | Secant modulus of soil |
| Soil stiffness relevant the ith element |
| Ks | In situ earth pressure coefficient |
| L | Embedded pile length |
| n | Number of pile elements |
| P | Uplift load on pile head |
| Pu | Ultimate upload pile capacity |
| Upper bound magnitude for tensile failure of pile |
| Upper bound magnitude for complete interface slippage |
| Rf | Reduction factor for hyperbolic soil model |
| rg | Non-dimensional shear modulus parameter |
| z | Depth below ground surface |
| α | Adhesion factor |
| δ | Pile element thickness |
| δs | Interface friction angle |
| ϕ | Soil friction angle |
| γ | Shear stress in soil |
| γp | Unit weight of pile material |
| γs | Unit weight of soil |
| Average unit weight of soil |
| νs | Poisson’s ratio of soil |
| σp | Ultimate tensile stress of pile |
| Effective overburden pressure in soil |
| σz | Tensile stress in pile |
| Uplift displacement |
| Uplift pile displacement at ground surface |
| Maximum uplift pile displacement at ground surface |
| Nodal displacement |
| Nodal pile displacement |
| Nodal soil displacement |
| τ | Soil shear stress |
| τu | Limiting shear stress |
| Elemental limiting shear stress |
| τz | Interface shear stress at depth z |
| Limiting interface shear stress at depth z |
References
- Ajdukiewicz, A.; Brola, J.; Kotalaa, B.; Węglorz, M. Some aspects of structural design of massive foundations for new power plant buildings. Procedia Eng. 2017, 193, 321–328. [Google Scholar] [CrossRef] [Scilit]
- Singh, H.; Tiwary, A.K. Analysis and effect of piles on raft foundation for High-Rise framed structure under seismic loading. Mater. Today Proc. 2022; in press. [CrossRef] [Scilit]
- Sakellariadis, L.; Gerolymos, N.; Anastasopoulos, I. Deformation analysis of RC piles and pile groups under combined loading: A nonlinear phenomenological modelling approach. Soil Dyn. Earthq. Eng. 2026, 201, 109875. [Google Scholar] [CrossRef] [Scilit]
- Wong, I.H. Methods of resisting hydrostatic uplift in substructures. Tunn. Undergr. Space Technol. 2001, 16, 77–86. [Google Scholar] [CrossRef] [Scilit]
- Sakr, M.; Nasr, A.; Khaffaf, M.; Basha, A. Behavior of under-reamed piles under inclined uplift loads in sand. Int. J. Geo-Eng. 2025, 16, 9. [Google Scholar] [CrossRef] [Scilit]
- Yang, B.; Qin, C.; Yang, Y.-h.; Cheng, F.; Zhao, S. Field test study on uplift bearing characteristics of rock socketed piles in sandstone stratum. Soils Found. 2025, 65, 101598. [Google Scholar] [CrossRef] [Scilit]
- Zhang, Q.Q.; Li, S.C.; Zhang, Q.; Li, L.P.; Zhang, B. Analysis on response of a single pile subjected to tension load using a softening model and a hyperbolic model. Mar. Georesources Geotechnol. 2015, 33, 167–176. [Google Scholar] [CrossRef] [Scilit]
- Liu, C.; Ji, F.; Song, Y.; Wang, H.; Li, J.; Xuan, Z.; Zhao, M. Upper bound analysis of ultimate pullout capacity for a single pile using Hoek–Brown failure criterion. Buildings 2023, 13, 2904. [Google Scholar] [CrossRef] [Scilit]
- Ronold, K.O. Reliability analysis of tension pile. J. Geotech. Eng. 1990, 116, 760–773. [Google Scholar] [CrossRef] [Scilit]
- Basack, S.; Alkahtani, M.Q.; Islam, S. Analysis of single pile in two-layered soil subjected to uplift load. Geomech. Eng. 2025, 41, 583–596. [Google Scholar] [CrossRef]
- Alkateeb, D.; Grabe, J. Advanced hypoplastic contact modelling of field tests for tension piles in layered soils. Comput. Geotech. 2026, 194, 107997. [Google Scholar] [CrossRef] [Scilit]
- Zhao, Y.; Lu, Z.; Venkateswarlu, H.; Tabaroei, A.; Ateş, B.; Tang, C.; Feng, Y.; Yao, H. Three-dimensional numerical analysis of uplift capacity for horizontal plate anchors in geocell-reinforced sandy soil. Comput. Geotech. 2026, 191, 107765. [Google Scholar] [CrossRef] [Scilit]
- Basack, S.; Alkahtani, M.Q.; Islam, S. Single pile response to uplift load: Computational model and analysis. Mar. Georesour Geotechnol. 2025, 43, 2034–2056. [Google Scholar] [CrossRef] [Scilit]
- Yang, X.; Tang, L.; Mei, L.; Zhang, T.; Niu, S.; Sun, Z.; Wang, Z.; Feng, D.; Gui, F. laboratory investigation of the uplift resistance of a new winged H-pile anchor developed for offshore marine aquaculture. J. Mar. Sci. Eng. 2025, 13, 342. [Google Scholar] [CrossRef] [Scilit]
- Gui, F.; Kong, J.; Feng, D.; Qu, X.; Zhu, F.; You, Y. Uplift resistance capacity of anchor piles used in marine aquaculture. Sci. Rep. 2021, 11, 20321. [Google Scholar] [CrossRef] [Scilit]
- Karami, M.; Basack, S.; Pan, M.; Das, G.; Gupta, A.; Karakouzian, M. Experimental and numerical investigations on the performance of screw micropiles under pull-out and lateral loads. Int. J. Geotech. Eng. 2025, 19, 18–40. [Google Scholar] [CrossRef] [Scilit]
- Wang, Q.; Ma, J.; Xiao, Z.; Chen, W.; Ji, Y. Field test on uplift bearing capacity of rock-socketed belled piles. KSCE J. Civ. Eng. 2020, 24, 2353–2363. [Google Scholar] [CrossRef] [Scilit]
- Sharma, A.; Silva, A.P.D.; Lange, D.D.; Jafarian, Y.; Gavin, K.G.; Kenkhuis, J. Field test to investigate the cyclic tensile response of open-ended piles installed in sand. In Proceedings of the 5th International Symposium on Frontiers in Offshore Geotechnics (ISFOG2025), Nantes, France, 9–13 June 2025; International Society for Soil Mechanics and Geotechnical Engineering: London, UK, 2025. [Google Scholar]
- Moayedi, H.; Mosallanezhad, M. Uplift resistance of belled and multi-belled piles in loose sand. Measurement 2017, 109, 346–353. [Google Scholar] [CrossRef] [Scilit]
- Chen, K.; Dou, Y.B. Study on design of uplift piles according to the elastic foundation beam theory. Adv. Mater. Res. 2013, 838–841, 907–912. [Google Scholar] [CrossRef] [Scilit]
- Cai, Y.; Bransby, F.; Gaudin, C.; Uzielli, M. A framework for the design of vertically loaded piles in spatially variable soil. Comput. Geotech. 2021, 134, 104140. [Google Scholar] [CrossRef] [Scilit]
- Duncan, J.M.; Chang, C.Y. Nonlinear analysis of stress and strain in soils. J. Soil Mech. Found. Div. 1970, 96, 1629–1653. [Google Scholar] [CrossRef] [Scilit]
- Basack, S.; Sen, S. Numerical solution of single piles subjected to pure torsion. J. Geotech. Geoenviron. Eng. 2014, 140, 74–90. [Google Scholar] [CrossRef] [Scilit]
- Basack, S.; Sen, S. Numerical solution of single pile subjected to simultaneous torsional and axial loads. Int. J. Geomech. 2014, 14, 06014006. [Google Scholar] [CrossRef] [Scilit]
- Basack, S.; Nimbalkar, S. Numerical solution of single pile subjected to torsional cyclic load. Int. J. Geomech. 2017, 17, 04017016. [Google Scholar] [CrossRef] [Scilit]
- Randolph, M.F. RATZ: Load Transfer Mechanism of Axially Loaded Piles. Technical Manual, Centre for Offshore Foundation Systems; University of Western Australia: Crawley, Australia, 2003. [Google Scholar]
- Reese, L.C.; van Impe, W.F. Single piles and pile groups under lateral loading. Appl. Mech. Rev. 2001, 55, B9–B10. [Google Scholar] [CrossRef] [Scilit]
- Zhang, W.M. Ultimate lateral capacity of rigid pile in c φ soil. China Ocean Eng. 2018, 32, 41–50. [Google Scholar] [CrossRef] [Scilit]
- Gere, J.M.; Goodno, B.J. Mechanics of Materials; Cengage Learning: Oshawa, ON, Canada, 2012. [Google Scholar]
- Sirén, R.M.; Tanttu, L.K. The tensile capacity of steel pipe piles drilled into the bedrock. In Proceedings of the 17th Nordic Geotechnical Meeting, Reykjavik, Iceland, 25–28 May 2016; International Society for Soil Mechanics and Geotechnical Engineering: London, UK, 2016. [Google Scholar]
- Zhao, Y.; Liu, H.; Liu, M. Failure mode and pullout capacity of anchor piles in clay. Am. J. Eng. Appl. Sci. 2017, 10, 769–780. [Google Scholar] [CrossRef] [Scilit]
- Shin, E.C.; Das, B.M.; Puri, V.K.; Yen, S.C.; Cook, E.E. Ultimate uplift capacity of model rigid metal piles in clay. Geotech. Geol. Eng. 1993, 11, 203–215. [Google Scholar] [CrossRef] [Scilit]
- Poulos, H.G.; Davis, E.H. Pile Foundation Analysis and Design; John Wiley & Sons: New York, NY, USA, 1980. [Google Scholar]
- Zupanič, F. Structure and Properties of Aluminium Alloys; MDPI: Basel, Switzerland, 2021. [Google Scholar]
- Zhang, L. Nonlinear analysis of torsionally loaded piles in a two-layer soil profile. Int. J. Geomech. 2010, 10, 65–73. [Google Scholar] [CrossRef] [Scilit]
- Hardin, B.O. Dynamic versus static shear modulus for dry sand. Mater. Res. Stand. 1965, 5, 232–235. [Google Scholar]
- Kumar, S.; Toan, C.D.; Vahedifard, F. Poisson’s ratio characteristic curve of unsaturated soils. J. Geotech. Geoenviron. Eng. 2021, 147, 04020149. [Google Scholar] [CrossRef] [Scilit]
- Chen, S.F.; Kong, L.W.; Li, C. Nonlinear characteristics of Poisson’s ratio of silty clay under low amplitude strain. Rock Soil Mech. 2018, 39, 580–588. [Google Scholar]
- Reddy, C.S.; Begum, G.; Rao, B.H. Pile capacity estimation considering variability in soil adhesion factor. In Proceedings of the Indian Geotechnical Conference, Kochi, India, 15–17 December 2022; Springer: Singapore, 2022. [Google Scholar]
- Joshi, V.C.; Sun, C.C. A global analysis of the mechanical properties of organic glasses below Tg. Mol. Pharm. 2025, 22, 3949–3960. [Google Scholar] [CrossRef] [Scilit]
- Gaaver, K.E. Uplift capacity of single piles and pile groups embedded in cohesionless soil. Alex. Eng. J. 2013, 52, 365–372. [Google Scholar] [CrossRef] [Scilit]
- Xu, W.; Wang, B.; An, Z. Model test on uplift capacity of short pile foundation on clay foundation. In Proceedings of the International Conference on Engineering Management and Safety Engineering (ESME 2025), Nanjing, China, 21–23 March 2025; Atlantic Press: Dordrecht, The Netherlands, 2025. [Google Scholar]
- Jiang, Q.-G.; Cao, C.; Lin, T.-C.; Wu, S.; Li, X. Strong and tough glass with self-dispersed nanoparticles via solidification. Adv. Mater. 2019, 31, 1901803. [Google Scholar] [CrossRef] [Scilit]
- Som, N.N.; Gupta, A.K. Time Effect on Ground Settlement Due to braced excavation in soft clay. In Proceedings of International Symposium on Underground Construction in Soft Ground, New Delhi; Fujita, K., Kusakabe, O., Eds.; Balkema Publishers: Rotterdam, The Netherlands, 1997; pp. 143–146. [Google Scholar]
- Nandi, S.; Bandyopadhyay, K.; Halder, A.; Basu, D. Equivalent CPT Method for estimation of shear strength parameters for a project in Kolkata using combination of SPT, DMT and CPT—A case study. In Proceedings of the 20th International Conference on Soil Mechanics and Geotechnical Engineering, Sydney, Australia, 1–5 May 2022; International Society for Soil Mechanics and Geotechnical Engineering: London, UK, 2022. [Google Scholar]
- Pal, S.; Adhikary, K.; Mukherjee, S.; Ghosh, S. Potential of silty clay soil as an attenuation material for containment of phenolic wastewater outfall site. Int. J. Environ. Sci. Dev. 2015, 6, 805–900. [Google Scholar] [CrossRef] [Scilit]
- Soundara, B.; Robinson, R.G. Hyperbolic model to evaluate uplift force on pile in expansive soils. KSCE J. Civ. Eng. 2017, 21, 746–751. [Google Scholar] [CrossRef] [Scilit]
- Nie, L.; Wang, T. Analysis of shear test on pile-soil interface. Chem. Eng. Trans. 2015, 46, 727–732. [Google Scholar]
- Dijkstra, J.; Broere, W.; Heeres, O.M. Numerical simulation of pile installation. Comput. Geotech. 2011, 38, 612–622. [Google Scholar] [CrossRef] [Scilit]
- Staubach, P.; Machaček, J.; Moscoso, M.C.; Wichtmann, T. Impact of the installation on the long-term cyclic behaviour of piles in sand: A numerical study. Soil Dyn. Earthq. Eng. 2020, 138, 106223. [Google Scholar] [CrossRef] [Scilit]
- Peng, Y.; Yin, Z.Y. Micromechanical analysis of local scour behaviors around circular piles in granular soil under steady flows with SPH-DEM. Ocean Eng. 2025, 328, 121061. [Google Scholar] [CrossRef] [Scilit]
- Li, Y.; Li, H.; Yao, A. A unified nonlinear–optimization framework for anti-uplift pile–raft systems: Influence-radius–based stiffness mapping and layout optimization under engineering constraints. Comput. Geotech. 2026, 191, 107836. [Google Scholar] [CrossRef] [Scilit]
- Li, Y.; Gong, Y.; Li, H.; Yao, A.; Lu, J. Interaction analysis of uplift pile groups based on nonlinear deformation: Theory and model test. Int. J. Geomech. 2025, 25, 04025163. [Google Scholar] [CrossRef] [Scilit]
| Disclaimer/Publisher’s Note: The statements, opinions and data contained in all publications are solely those of the individual author(s) and contributor(s) and not of MDPI and/or the editor(s). MDPI and/or the editor(s) disclaim responsibility for any injury to people or property resulting from any ideas, methods, instructions or products referred to in the content. |