Article

A Digital Twin-Driven System for Road Maintenance: Integrating UAVs and AMRs for Automated Inspection and Measurement


by
Ivan Villaverde
1,*,
Damien Sallé
1,
Marco Antonio Montes-Grova
2,
Pablo Jiménez-Cámara
2,
Amaia Castelruiz-Aguirre
1,
Nicolas Pastorelly
3,
Jose Carlos Jimenez Fernandez
1,
Irina Stipanovic
4,
Sandra Skaric
4 and
Daniel Rodik
4
1
TECNALIA, Basque Research and Technology Alliance (BRTA), Mikeletegi Pasealekua 7, 20009 Donostia-San Sebastián, Gipuzkoa, Spain
2
Advanced Center for Aerospace Technologies (CATEC), 41309 Seville, Seville, Spain
3
Centre Scientifique et Technique du Bâtiment (CSTB), 77447 Champs-sur-Marne, Île-de-France, France
4
Infra Plan Consulting, Nova Cesta 109, 10000 Zagreb, Croatia
*
Author to whom correspondence should be addressed.
Infrastructures 2026, 11(4), 124; https://doi.org/10.3390/infrastructures11040124
Submission received: 20 February 2026 / Revised: 25 March 2026 / Accepted: 31 March 2026 / Published: 1 April 2026
(This article belongs to the Section Infrastructures Inspection and Maintenance)

Abstract

Road maintenance remains one of the most resource-intensive and hazardous operations in infrastructure management. Traditional inspection practices rely heavily on manual labour and discrete procedures, often resulting in limited scalability, operator exposure to traffic hazards, and inefficiencies in data collection. This paper presents a novel automated methodology that integrates Unmanned Aerial Vehicles (UAVs) and autonomous mobile robots (AMRs) to enable automated inspection and measurement of road assets through a digital twin (DT) system. The system leverages data fusion and real-time synchronisation between field agents and a centralised digital twin to monitor the retro-reflectivity of vertical and horizontal signage, detect obstacles and vegetation, and support data-driven maintenance planning. A case study conducted on the Italian highway network demonstrated improvements in operational safety, inspection efficiency, and measurement consistency. The results confirm that the integration of UAVs and AMRs within a digital twin framework can significantly improve sustainability, productivity, and workers’ safety in road maintenance operations.

1. Introduction

1.1. Context and Motivation

Road maintenance is a major and recurring concern for European transport systems, as road networks require continuous inspection, routine upkeep, and timely interventions to ensure safety and serviceability. At the European Union (EU) level, governments invest approximately €112 billion annually in transport infrastructure [1], with road construction and maintenance accounting for the largest share of this expenditure. More broadly, European Commission data indicate that general government spending on economic affairs in the EU amounted to €991 billion, or 5.8% of Gross Domestic Product (GDP), in 2023 [2], confirming that infrastructure-related public expenditure represents a structural budgetary commitment for public authorities.
The motivation for improving inspection workflows extends beyond economic considerations. Road operations continue to expose workers and users to significant safety risks: the European Commission reported approximately 19,800 road fatalities in the EU in 2024 [3], while the European Transport Safety Council (ETSC) estimates that up to 40% of road deaths in Europe may be work-related [4]. Maintenance activities also generate indirect environmental impacts, as inspections often require slow-moving vehicles, repeated site visits, or temporary traffic management—factors that increase congestion and associated emissions. Together, these challenges highlight the limitations of conventional inspection practices and strengthen the case for solutions that reduce manual exposure, limit traffic disruption, and support more efficient maintenance planning.
Against this backdrop, recent advances in autonomous robotics, digital twins (DTs), and Artificial Intelligence (AI) offer a promising technological pathway. A digital twin—a dynamic digital replica of a physical asset—can provide a unified environment for integrating multi-source inspection data and supporting informed, timely decision-making. When combined with autonomous agents such as Unmanned Aerial Vehicles (UAVs) and autonomous mobile robots (AMRs), this approach enables a transition from on-demand, labour-intensive inspections to a more continuous, data-driven, and potentially predictive maintenance workflow.

1.2. Current Challenges

The main barriers to the adoption of automated road maintenance systems are no longer primarily related to data acquisition, but to the practical deployment and integration of these systems in real-world road environments. Despite significant advances in sensing, robotics, and digital technologies, road maintenance workflows remain largely semi-manual, and the transition from isolated demonstrations to reliable field operations remains limited. The recent literature highlights a persistent gap between promising inspection prototypes and fully operational autonomous systems, particularly in terms of sensing robustness, control, and actuation under real site conditions [5].
The first challenge is system interoperability. Road maintenance involves heterogeneous data sources, software platforms, and asset representations, yet the sector lacks widely accepted DT standards and reference models. This hinders the integration of inspection outputs, asset data, and maintenance planning into a cohesive workflow, especially when multiple tools or stakeholders are involved. Recent studies and road operator reports consistently identify standardisation, common data models, and interface compatibility as key unresolved needs for large-scale implementation [6].
The second challenge is operational robustness in outdoor environments. Autonomous inspection systems on roads must handle variable lighting, weather conditions, traffic interactions, localisation uncertainty, and safety constraints—factors that are significantly more complex than in controlled test settings. Technical, regulatory, and safety-related obstacles continue to limit the widespread use of UAVs and autonomous robots in transport infrastructure, affecting data repeatability and quality and the feasibility of routine deployment [7].
Finally, the third challenge is the conversion of inspection data into actionable, decision-ready information. Even when data are successfully collected, their value depends on how well they can be structured, fused, contextualised, and linked to maintenance actions. Recent reviews on road DTs [8] emphasise that future progress will depend not only on improved sensing capabilities but also on better data integration, life cycle management, and frameworks that support real operational use rather than isolated technical demonstrations.

1.3. State of the Art

1.3.1. Digital Twins in Infrastructure Asset Management

Digital twins have become a cornerstone in the digitalisation of the Architecture, Engineering, and Construction (AEC) sector, enabling continuous synchronisation between the physical and virtual domains of infrastructure assets. Initially conceived for the manufacturing industry, DTs are now increasingly applied to civil infrastructure monitoring and maintenance, providing real-time insight into structural condition, performance, and environmental interactions. By integrating data from multiple sources—such as sensors, numerical simulations, and inspection records—DTs offer a holistic understanding of asset behaviour throughout its life cycle.
Recent research has highlighted the potential of DTs to improve decision-making in roads, bridges, and tunnels, promoting predictive maintenance and life cycle optimisation [9,10]. For example, several studies have explored DT-based frameworks for infrastructure health monitoring using Internet of Things (IoT) networks, Building Information Modelling (BIM) integration, and AI-driven diagnostics. However, most of these implementations remain static or semi-dynamic, relying on fixed sensor networks or manual data input. Real-time DTs that incorporate mobile autonomous agents—such as aerial or ground robots—are still under development. Key challenges include data interoperability, latency in real-time communication, and standardisation of models for multi-source data fusion.

1.3.2. UAV-Based Inspection and Maintenance

Unmanned Aerial Vehicles, or drones, have revolutionised infrastructure inspection due to their ability to collect high-resolution visual, Light Detection And Ranging (LiDAR), and multispectral data efficiently and safely. UAVs are increasingly used for road and bridge condition monitoring, including crack detection [11], surface deformation analysis, and retro-reflectivity evaluation of traffic signage [12]. These platforms allow for rapid, non-invasive surveys of large areas while minimising human exposure to hazardous environments.
Nonetheless, current UAV applications in road maintenance are typically semi-automated, relying on manual piloting and offline data processing. Consequently, scalability and temporal continuity remain limited. Moreover, the integration of UAV-generated data into asset management systems or digital twins is rarely achieved in real time. Ongoing research aims to overcome these limitations through Global Navigation Satellite System (GNSS)-denied navigation, AI-based visual perception, and autonomous flight planning, enabling UAVs to function as intelligent, self-coordinated inspection agents.

1.3.3. Autonomous Mobile Robots for Road Assessment

Ground-based autonomous mobile robots offer complementary capabilities for close-proximity inspection and physical measurements. AMRs can perform tasks that UAVs cannot, such as retro-reflectivity measurement of horizontal markings, texture and roughness assessment, and contact-based surface analysis. Previous developments have demonstrated autonomous robotic systems for pavement distress detection [13], automated lane-marking analysis [14], and digital mapping of road geometry [15]. These systems commonly employ Simultaneous Localisation and Mapping (SLAM)-based localisation, path planning, and computer vision for navigation and measurement accuracy.
Despite their potential, AMRs face challenges when deployed outdoors, particularly regarding localisation precision, robustness under varying illumination or weather conditions, and multi-agent coordination. Furthermore, most existing approaches rely on offline data analysis, without full integration into higher-level DT architectures. To enable seamless collaboration between AMRs, UAVs, and data management systems, further advances in communication protocols, semantic data modelling, and edge computing are required.

1.3.4. Integration of Digital Twins, UAVs, and AMRs

The convergence of digital twins with autonomous aerial and ground robots represents a frontier in smart infrastructure management. Recent efforts have investigated coordinated multi-robot systems for inspection [16] and data fusion frameworks for creating dynamic 3D representations of assets [17]. These integrated systems aim to establish real-time feedback loops between physical environments and virtual models, allowing continuous monitoring, analytics, and decision support.
However, operational demonstrations of such integrated frameworks remain limited, especially in real traffic or maintenance conditions. Most reported studies are confined to laboratory or simulated environments, where external factors such as environmental variability, regulatory restrictions, and data latency are not fully addressed.
Within this context, the BEEYONDERS project advances the current state of the art by demonstrating a digital twin-driven road maintenance ecosystem, where UAVs and AMRs cooperate autonomously to perform inspection, measurement, and reporting tasks. This implementation validates the feasibility of a fully connected, multi-agent digital twin for proactive and sustainable road maintenance at scale.

1.4. Paper Contributions

This paper contributes to the advancement of digital and automated road maintenance by presenting a novel framework that integrates digital twin technology with autonomous aerial and ground robotic systems for infrastructure inspection. The work introduces, for the first time in an operational environment, a coordinated workflow where UAVs and AMRs operate as complementary sensing agents within a unified DT ecosystem. The UAVs perform autonomous visual and LiDAR-based inspections of vertical signage and roadside vegetation, while the AMR conducts autonomous retro-reflectivity measurements of horizontal road markings, providing high-precision, contact-based data. All sensor streams are fused in real time through a cloud-based digital twin platform that integrates ontology-based semantic data models and Key Performance Indicator (KPI)-driven analytics to enable visualisation, storage, and decision support.
The main scientific and technical contributions of this study are threefold. First, it demonstrates the feasibility of combining heterogeneous robotic agents through a digital twin for the automated assessment of road assets, moving from periodic and manual inspection schemes towards continuous and predictive maintenance. Second, it provides a validated field deployment carried out on an Italian motorway, proving that the integrated system can safely operate in realistic environmental conditions while maintaining accurate and repeatable measurements. Third, it evaluates the impact of automation in terms of efficiency, safety, and sustainability, highlighting significant reductions in operator exposure to hazards, time savings in inspection routines, and improvements in data quality and traceability.

1.5. Paper Structure

Beyond this introduction and contextualisation, the remainder of this paper is structured as follows. Section 2 presents a comprehensive system architecture, detailing each component, its integration into the overall framework, and the intended operational workflow. Section 3 focuses on the autonomous capabilities of the agents—specifically the UAV and AMR—highlighting their ability to execute missions and collect data autonomously. The case study used to validate the approach is described in Section 4, which outlines the testing environment, the specific tests conducted, and the technical results achieved. Section 5 provides a quantitative assessment of multiple KPIs used to evaluate the proposed approach. Finally, Section 6 provides a discussion of the system’s performance, followed by concluding remarks and an overview of future work in Section 7.

2. System Architecture

The BEEYONDERS road management demonstrator implements an integrated cyber–physical architecture, combining aerial and ground inspection robotic systems with a digital twin platform for optimised monitoring and maintenance operations of road infrastructure. This section describes the main components of this architecture: the digital twin, the Unmanned Aerial Vehicle, and the autonomous mobile robot.
The DT serves as a central, dynamically updated virtual model of the road environment, integrating data from heterogeneous sources within a modular framework. It acts as a bridge between physical devices and their digital supervision, enabling real-time data fusion, visualisation, and decision support. The architecture includes an IoT layer with devices such as UAVs and AMRs, an acquisition layer that collects and processes data via the MQTT protocol, and a persistence layer for storing static and dynamic data. The system also features a KPI-driven interface that supports real-time monitoring, operational control, and performance assessment.
The UAV functions as an autonomous aerial agent, performing remote inspections of vertical signage, retro-reflectivity assessment, obstacle detection, and vegetation encroachment monitoring. It operates in outdoor road environments with sufficient payload capacity and flight endurance to carry the required sensors and complete extended inspection missions. The UAV is equipped with autonomous navigation capabilities, including self-localisation and path planning, to enable coordinated operations.
The AMR operates at ground level, conducting high-precision, contact-based measurements such as retro-reflectivity of horizontal road markings and potentially other tasks such as surface texture analysis or pavement distress detection. It uses 3D-based localisation for accurate navigation and data collection. The AMR is designed to work in real-world conditions, including varying illumination and weather, and supports seamless integration into the digital twin ecosystem.
Together, the UAV and AMR operate as complementary sensing agents within a unified DT framework, enabling coordinated, autonomous inspection, measurement, and reporting tasks. This integration supports continuous monitoring, real-time data fusion, and proactive maintenance planning, advancing the transition from manual, periodic inspections to scalable, data-driven, and sustainable road management.

2.1. Digital Twin Framework

The BEEYONDERS digital twin acts as a central bridge between the physical devices and operations and their digital supervision. It provides a dynamically updated virtual model of the road environment that integrates heterogeneous data sources within a digital framework. The following section presents an overview of the modular architecture of the DT, with a description of each of its layers.

Architectural Overview and Implementation

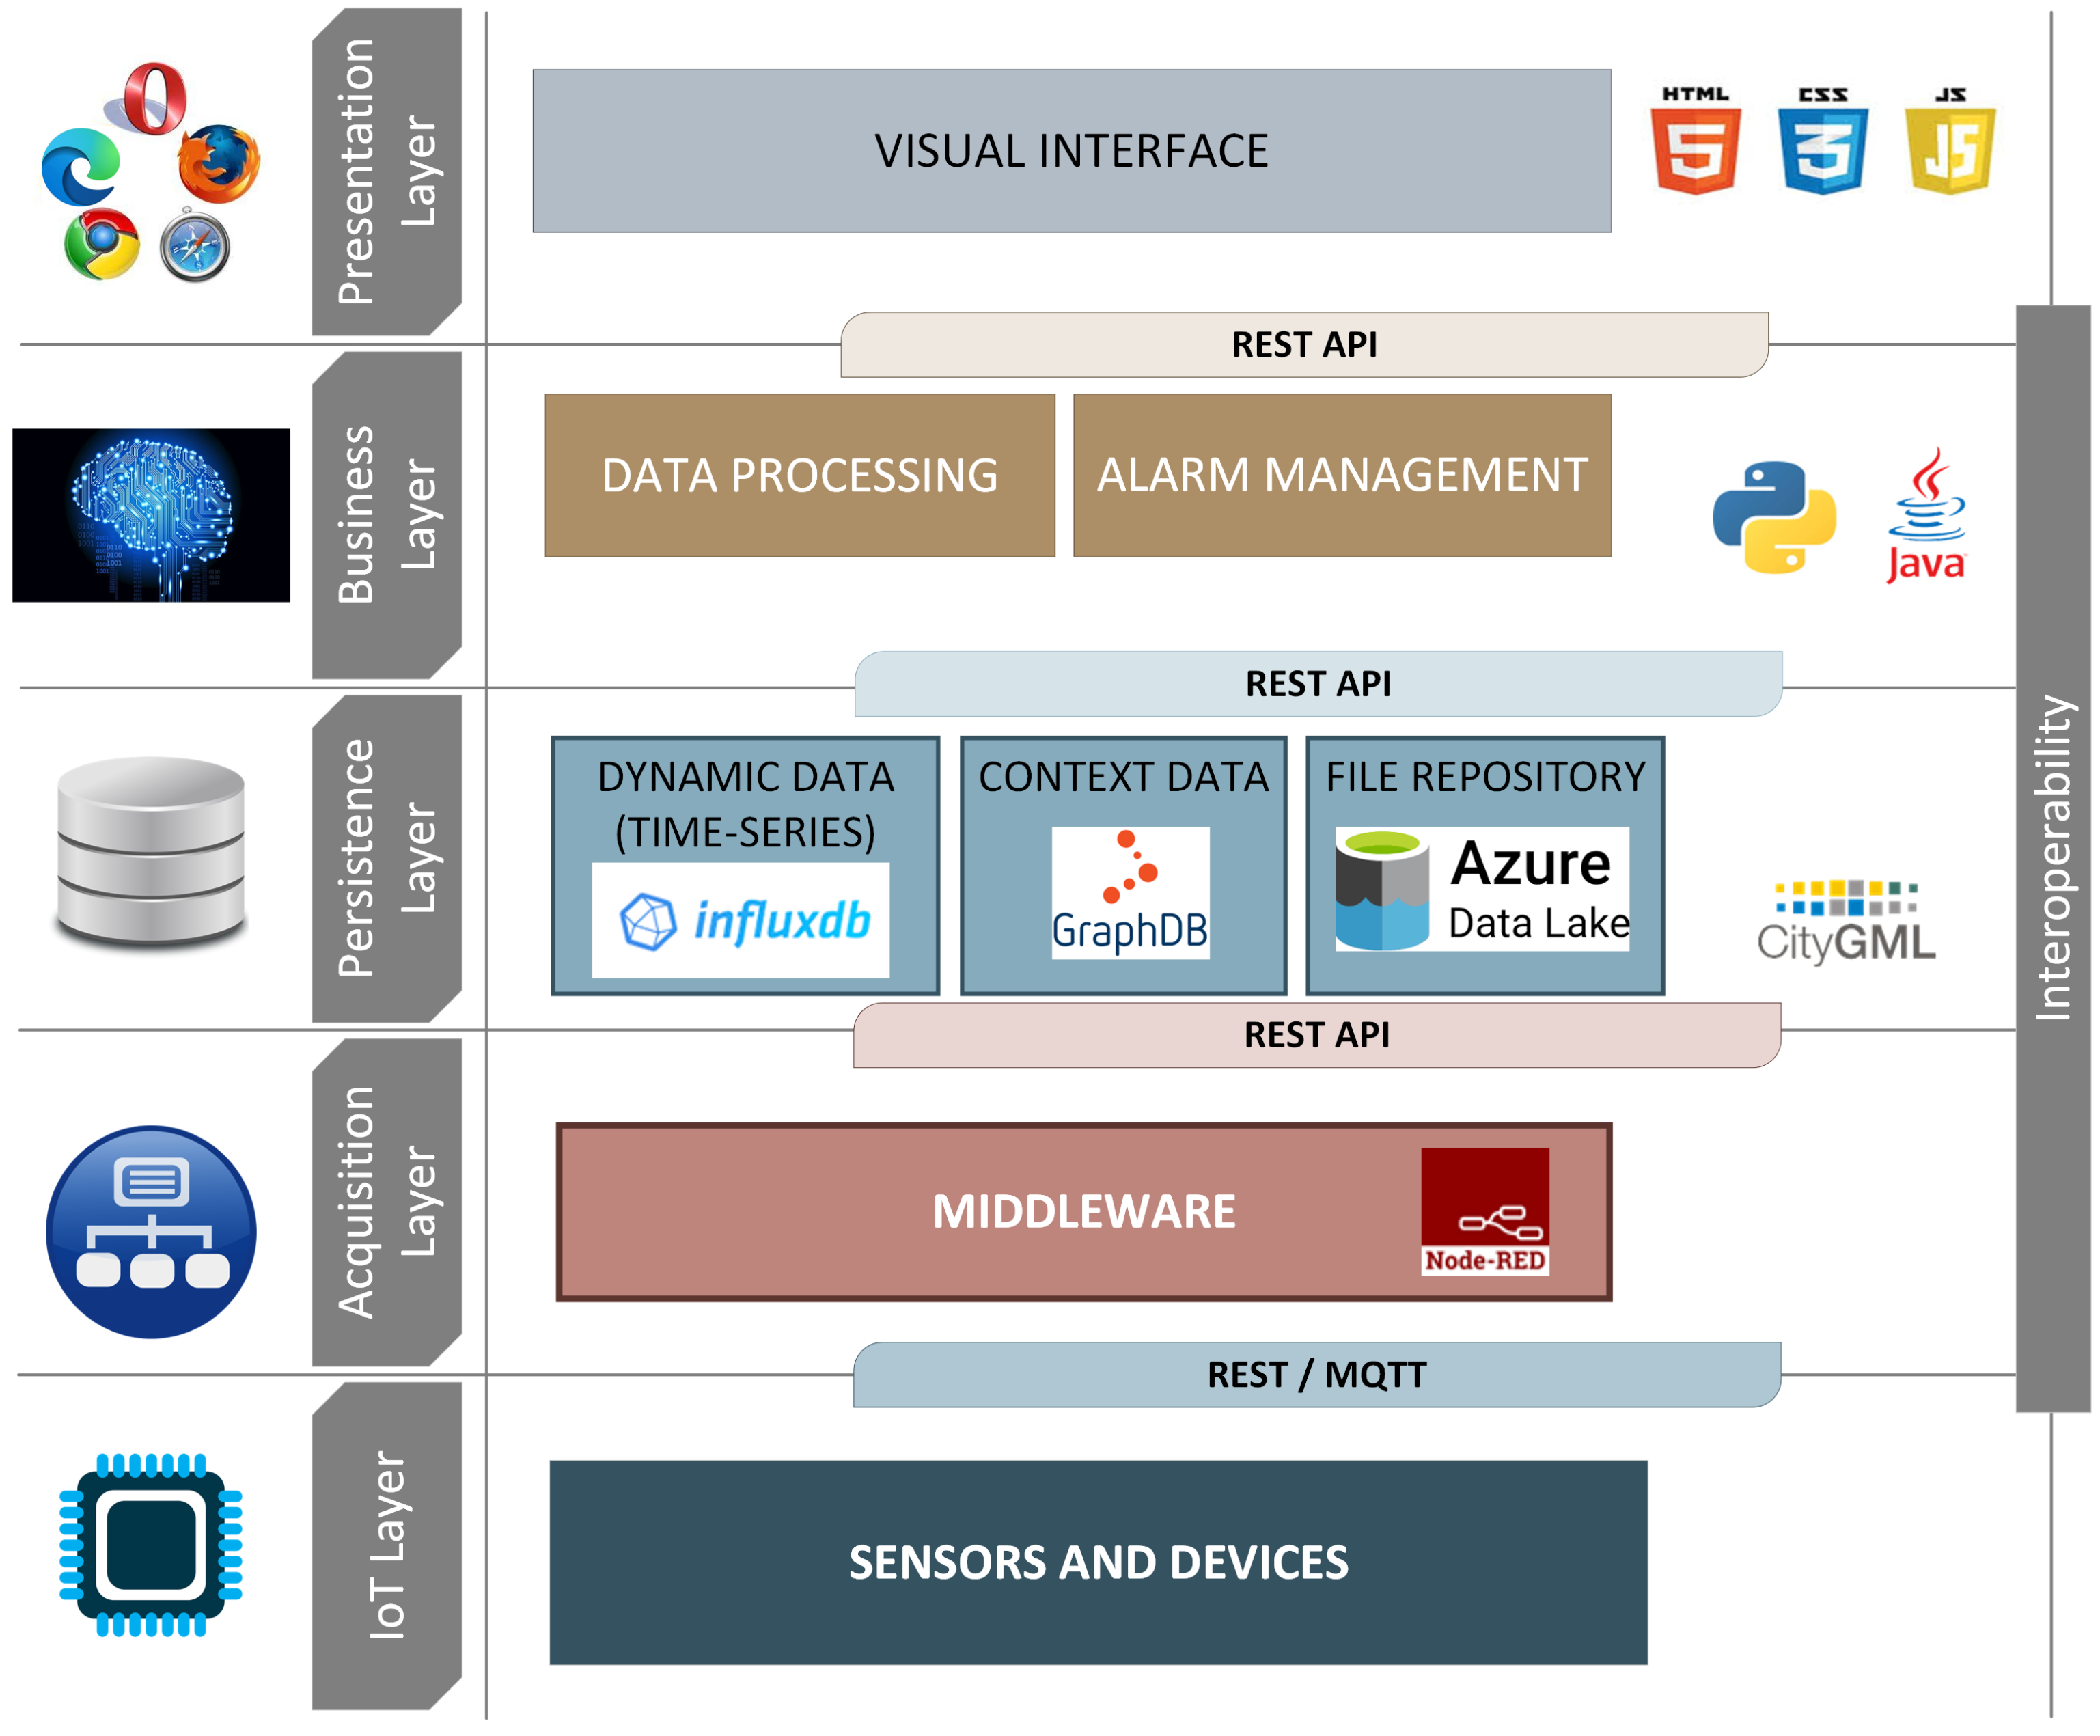
The BEEYONDERS digital twin is based on a modular architecture, shown in Figure 1.
The IoT layer comprises the devices and sensors that participate in the monitoring process, such as the UAV and the AMR that participate in the road maintenance case.
The acquisition layer contains the Node-RED-based [18] middleware that collects data coming from the devices through the MQTT protocol and transforms and prepares them for storage and analysis.
The persistence layer provides this storage infrastructure for the heterogeneous data sources. The digital twin integrates heterogeneous data sources, combining static and dynamic data. Static context data add semantic context to data coming from the devices, enabling a more sophisticated analysis and providing the necessary background to interpret and make sense of the data. This context data is described in a Semantic Web ontology that defines the main components of a project, their properties, and relations between them. The Knowledge Graph, based on this ontology and containing data from the particular use cases, is stored in a GraphDB [19] triplestore. Regarding the dynamic information provided by the different physical devices, it may consist of IoT data—stream data that is sent in nearly real time—or files such as point clouds or recorded videos. IoT data are stored in a time-series InfluxDB [20] database, whereas files are stored in an Azure Data Lake file repository. A RESTful Application Programming Interface (API) has been developed to facilitate structured access to these heterogeneous data sources within BEEYONDERS, providing a single access point that combines and integrates all the information contained in the architecture.
The Business layer performs the high-level processing of the stored data, to allow, for instance, the generation of alarms—also stored in InfluxDB. These include visibility alerts, triggered when reflectivity values measured by the AMR fall below a given threshold.
Finally, the Presentation layer contains the user interfaces that give access to the implemented functionalities. These will be shown in Section 2.4.

2.2. UAV Component

The UAV component of the system represents an autonomous aerial agent able to provide remote inspection and surveillance capabilities for vertical signage retro-reflectivity assessment, obstacle detection, and vegetation encroachment monitoring for the DT. This high-level task implies several functional requirements that the UAV must fulfil:
  • It must be a UAV able to operate in outdoor road environments with sufficient payload capacity and flight endurance to carry the required perception sensors and complete inspection missions over extended road sections.
  • It must have autonomous capabilities to self-localise, navigate along pre-planned routes, detect and analyse vertical traffic signs, identify obstacles and vegetation encroaching onto the road surface, and process sensor data in real time using onboard deep learning algorithms.
  • It must be able to communicate with the DT, sending telemetry, detection results, retro-reflectivity measurements, and alarm notifications while receiving mission commands to execute autonomously.

UAV Systems Integration

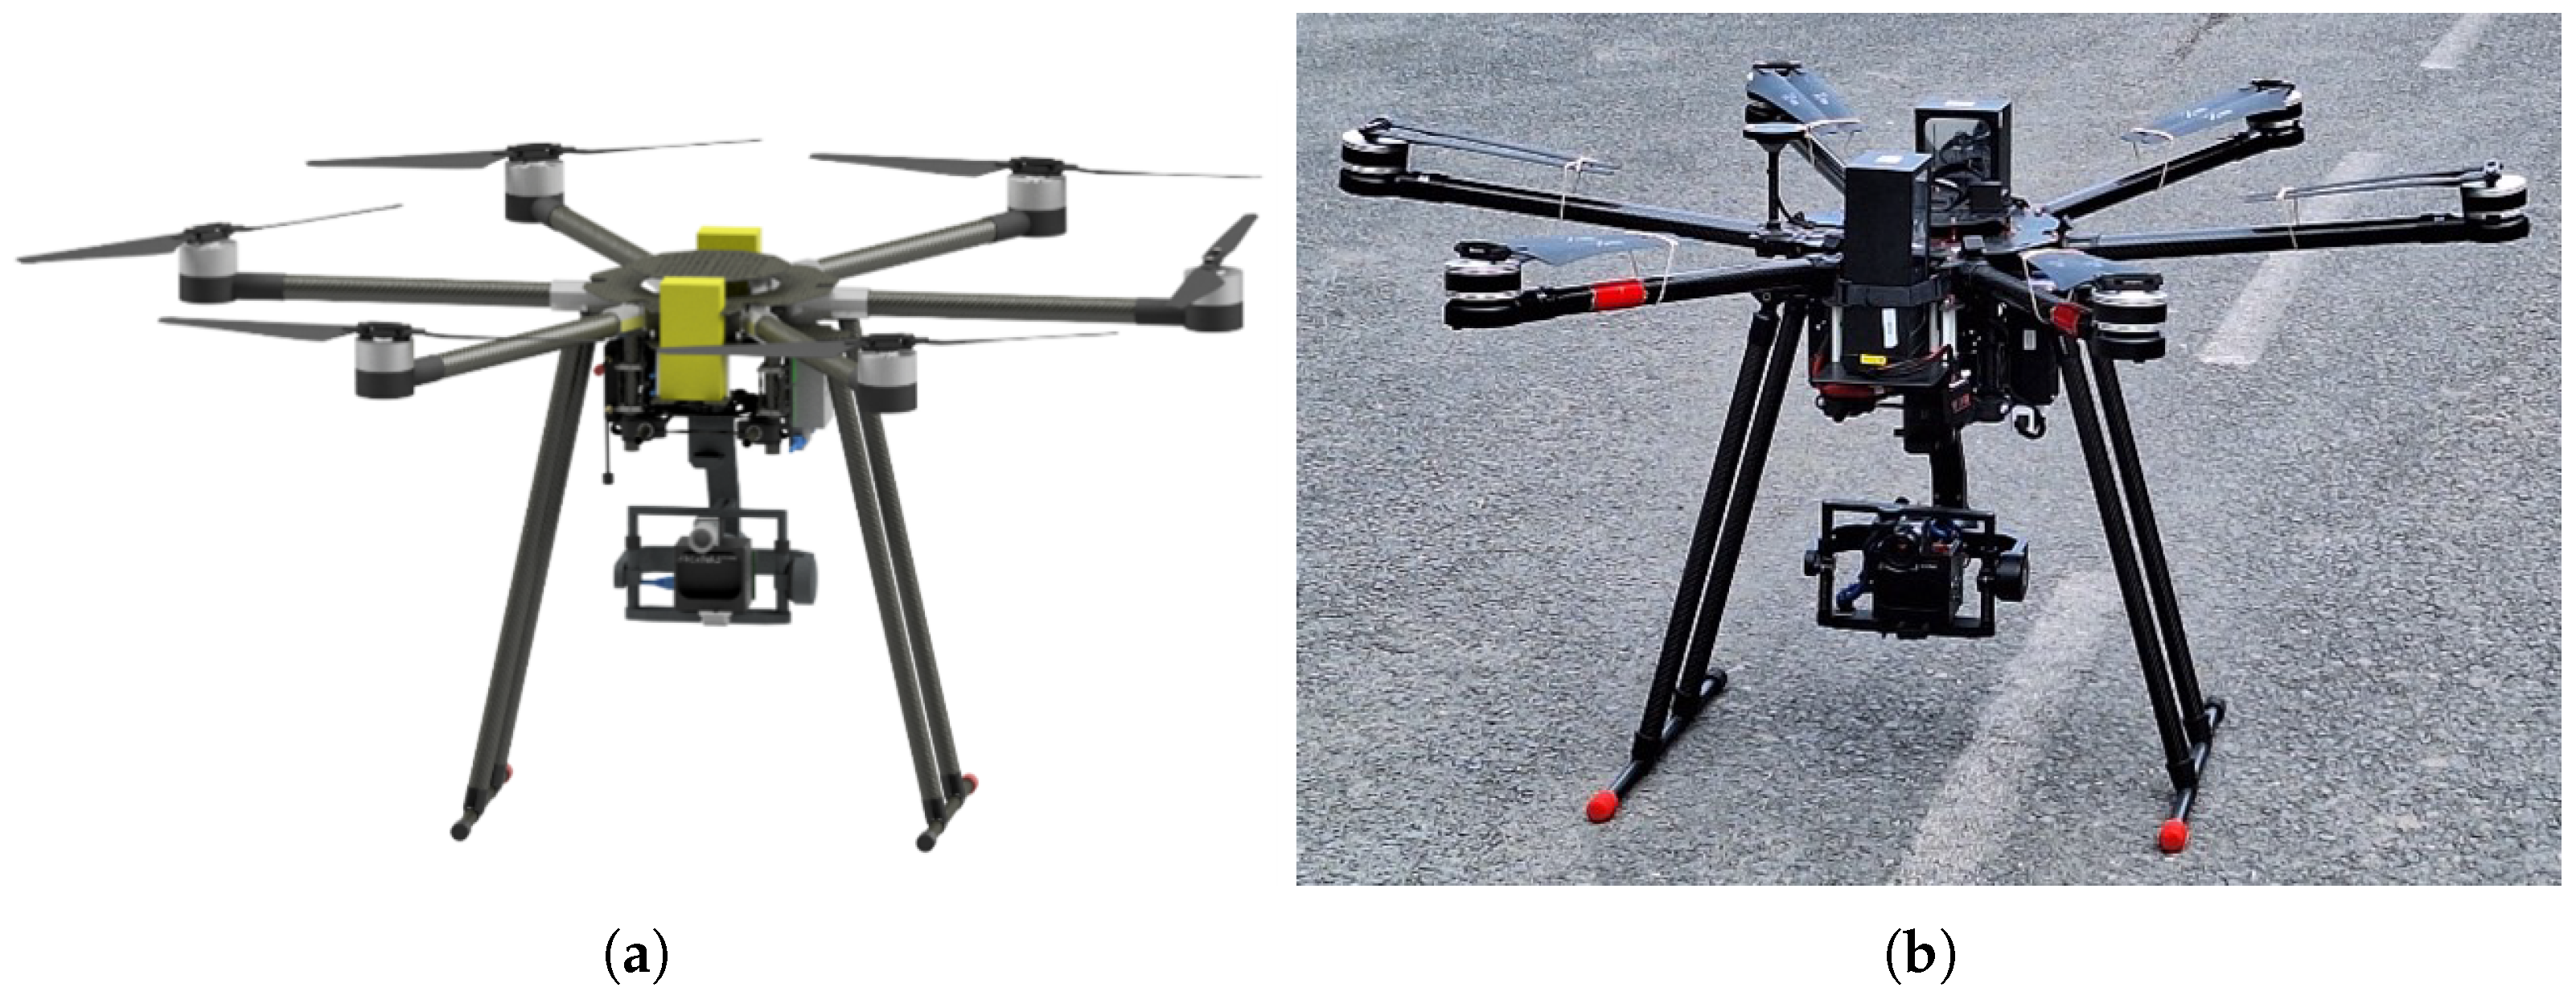
The CATEC 750 (FADA-CATEC, Sevilla, Spain) is an innovative aerial platform developed by the Advanced Centre for Aerospace Technologies (CATEC), designed to meet the most demanding requirements in strategic sectors such as construction, infrastructure maintenance, and environmental monitoring. This is a mid-sized multirotor platform with a Maximum Take-Off Weight (MTOW) of 25 kg, an operational endurance of up to 25 min, and a payload capacity of 10 kg. The platform operates at altitudes between 15 and 20 m above ground level, with cruise speeds ranging from 5 to 18 m/s, and can withstand wind speeds up to 10 m/s.
The UAV is equipped with state-of-the-art flight controllers (APM, PX4, and DJI), long-range transmission systems operating at 868 MHz, and intelligent batteries with optimised management that maximise its autonomy and performance. Its modular design allows for quick configuration and customisation, adapting to different applications without compromising operational efficiency. The Computer-Aided Design (CAD) model and the real aerial robot are shown in Figure 2.
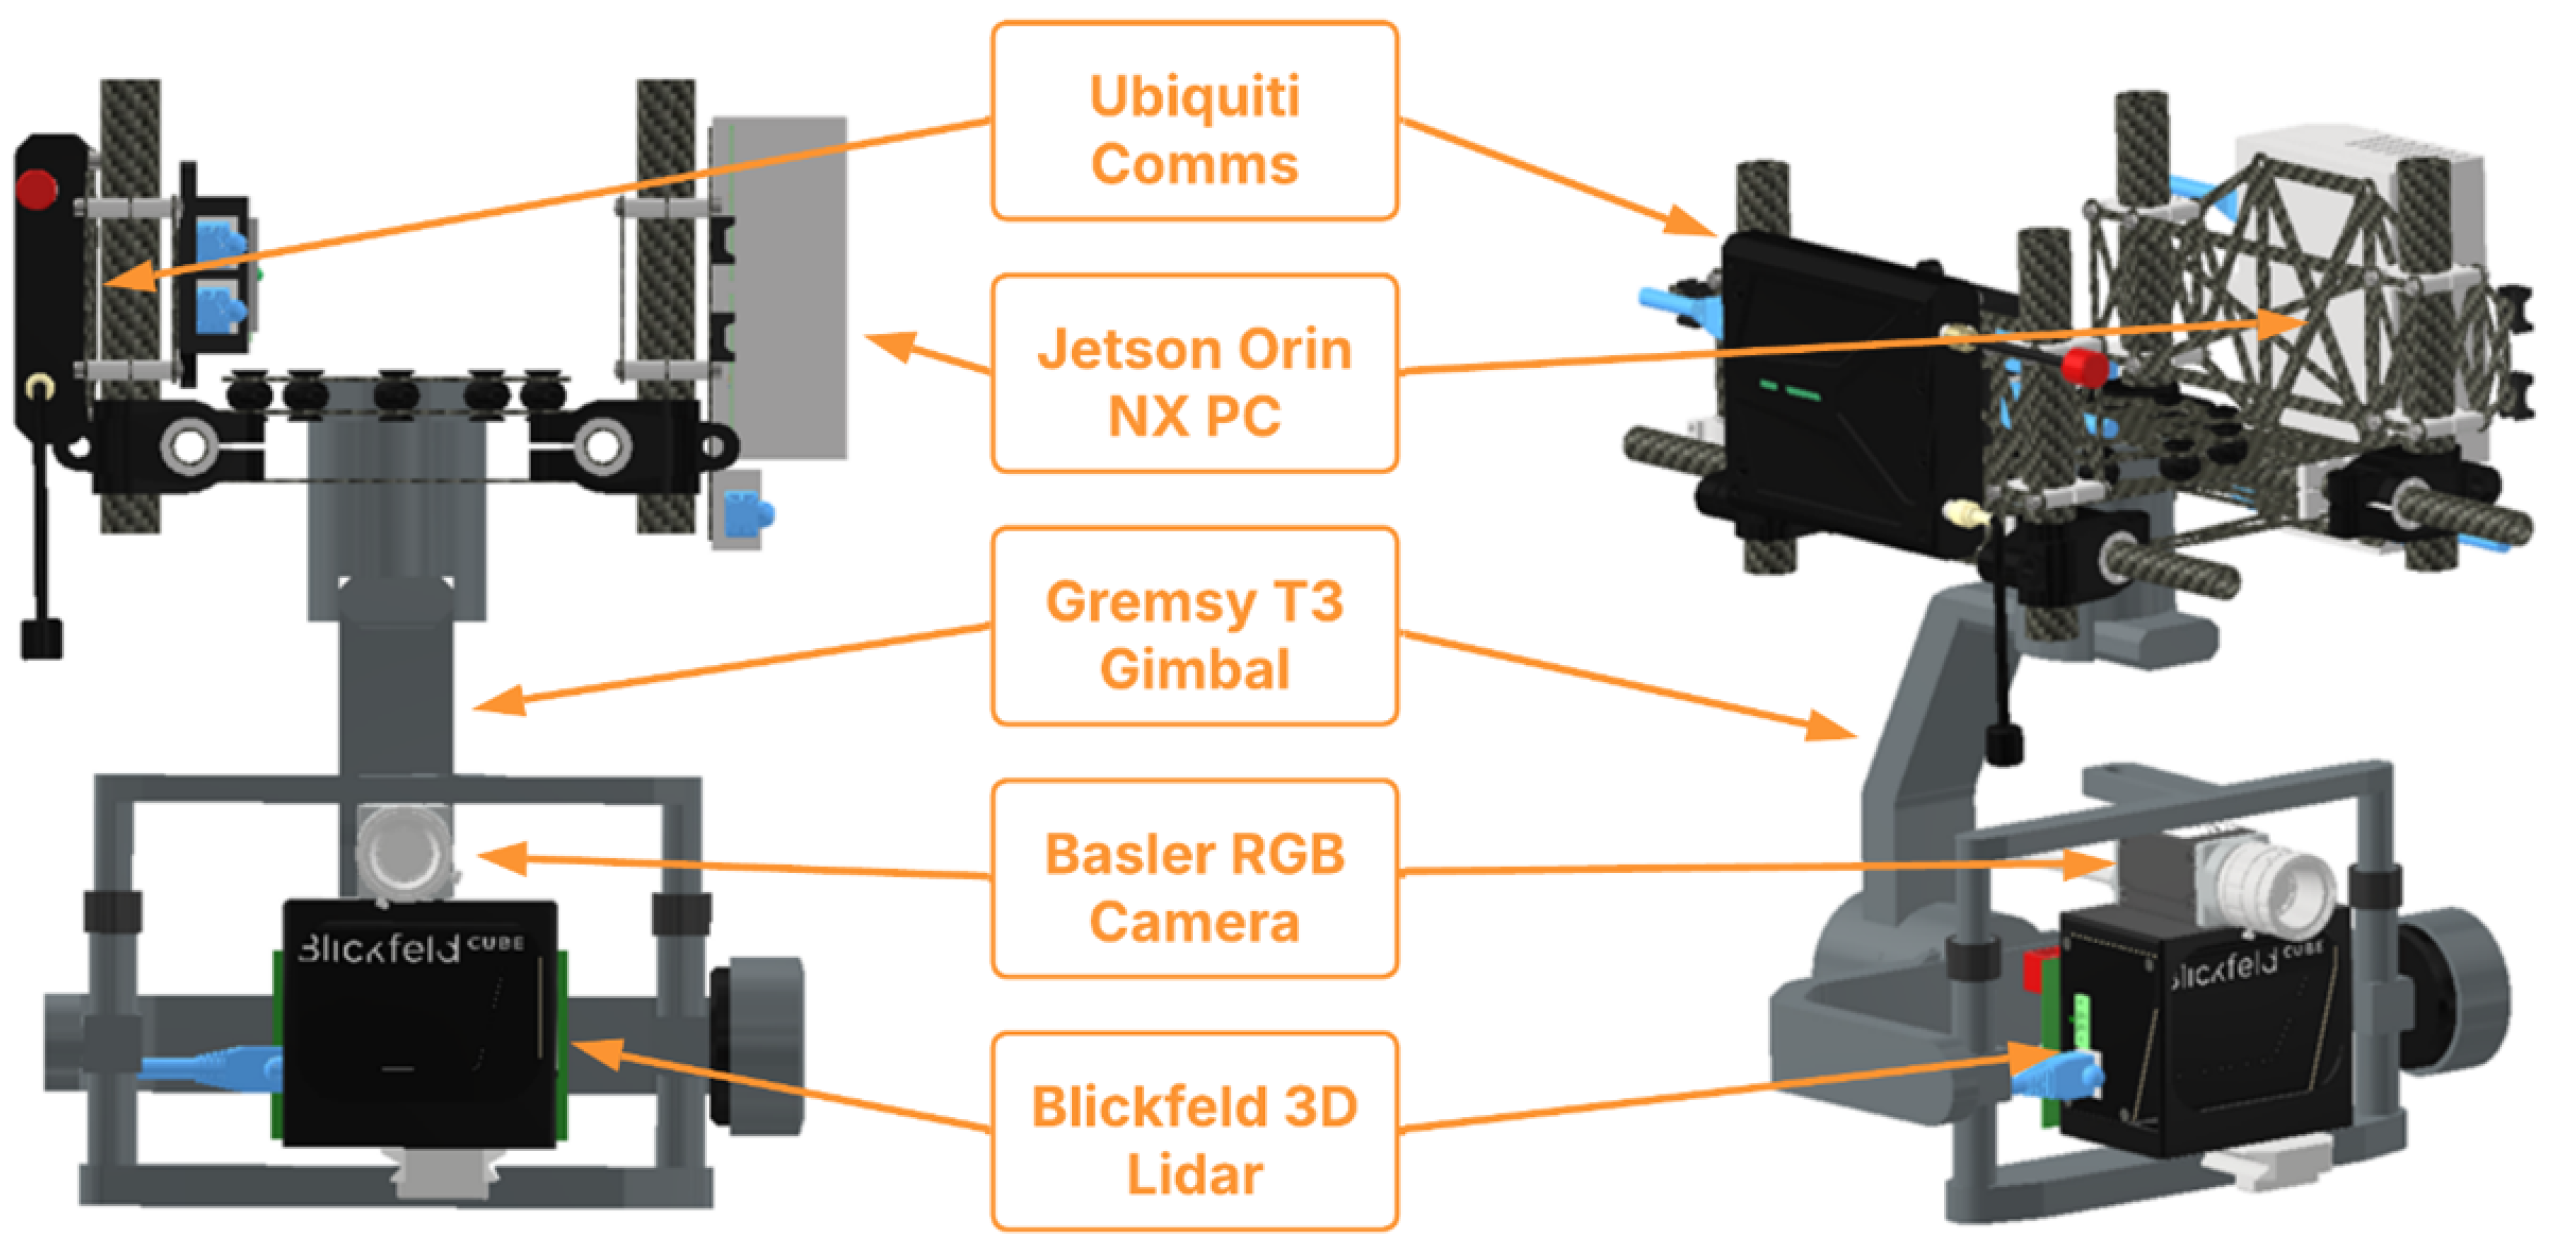
For the integration of the inspection and surveillance payload, the lower area of the aircraft has been chosen. This configuration provides a series of operational and structural advantages, particularly in terms of stability and accessibility. By placing the centre of mass below the rotor plane, greater flight stability is achieved, contributing to improved manoeuvrability and control of the aircraft. Another key advantage of this arrangement is the improvement in the visibility of attached devices. Located on the bottom, sensors and other equipment can operate without obstructions, maximising efficiency in data capture and accuracy for missions that require visual analysis or remote sensing. It should be noted that, to ensure the quality and stability of the captured images, the UAV’s gimbal is equipped with a damping system designed to reduce vibrations generated during flight. This payload, shown in detail in Figure 3, contains not only the inspection sensors but also the companion computer on which the algorithms needed to perform the onboard calculations will run, as well as the ground communications system.
The perception system for road maintenance inspection was designed around a complementary sensor suite integrated on a Gremsy T3V3 gimbal platform (Ho Chi Minh City, Vietnam). The sensor configuration comprises a Basler a2A2448-23gcPRO 5MP Red–Green–Blue (RGB) camera (Ahrensburg, Germany) equipped with a Kowa LM3NCM 3.5 mm lens and a Blickfeld Cube1 LiDAR. This dual-sensor approach was driven by the multifaceted inspection requirements of the use case, which demanded simultaneous capabilities for traffic sign detection, retro-reflectivity analysis, vegetation encroachment monitoring, and obstacle detection.
The onboard computation system is built around an NVIDIA Jetson Orin NX (Taiwan). This computational platform was selected to enable real-time execution of deep learning algorithms during flight operations, a critical requirement for autonomous road inspection tasks.
Finally, to monitor the progress of the mission from the ground control station, a Ubiquiti-based communications system has been implemented.

2.3. AMR Component

The AMR component of the system represents an autonomous agent able to provide remote reflectivity measurement of horizontal road signs for the DT. This high-level task implies several functional requirements that the AMR must fulfil:
  • It must be an AMR able to operate in outdoor road environments, so a car-like vehicle should be preferred as the base for the AMR.
  • It must have autonomous capabilities to self-localise, navigate, detect and measure horizontal road signs, integrating the required sensors.
  • It must be able to communicate with the DT, sending telemetry and measurements and receiving missions that must be carried out autonomously.
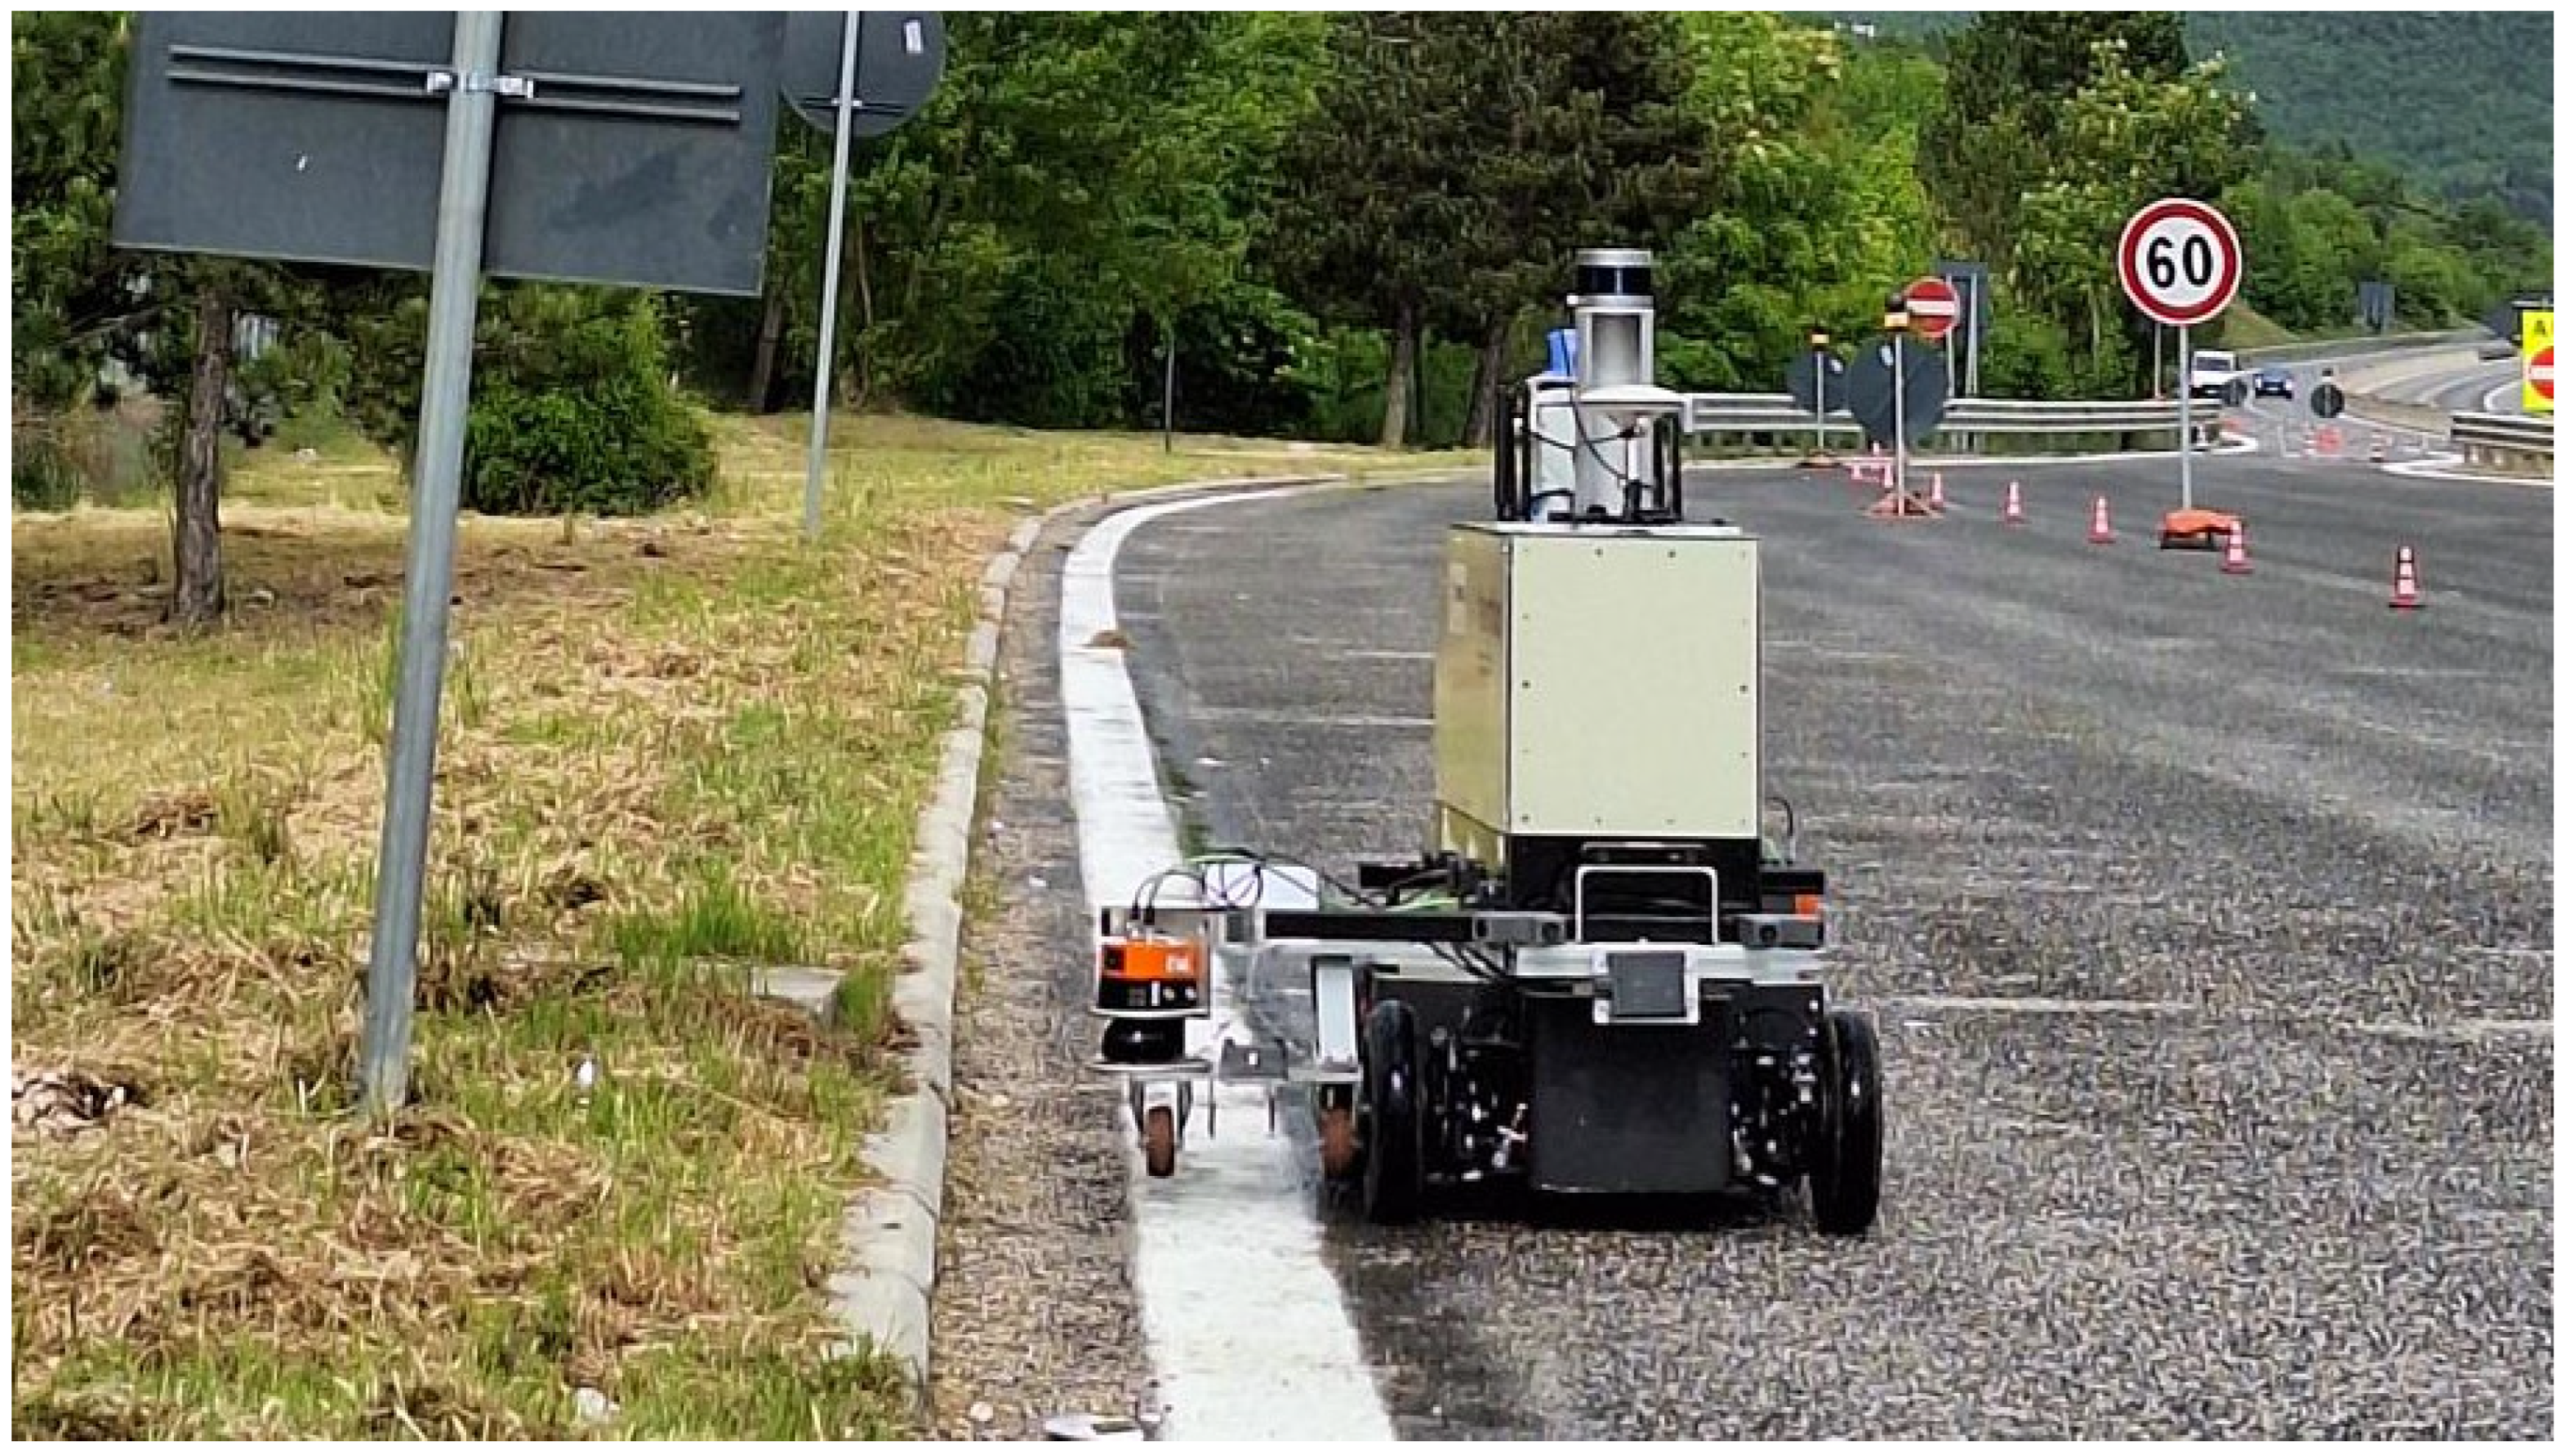
Tackling these requirements, a prototype AMR has been developed to be integrated into the system, based on a commercial drive-by-wire Pixloop Planck platform from PixMoving (Guiyang, China). This is a mid-sized, car-like platform able to drive at up to 15 km/h with a payload of 120 kg. Several modifications have been made to this platform to integrate the required navigation and measurement sensors. Several software solutions provide the required autonomous capabilities.

AMR Systems Integration

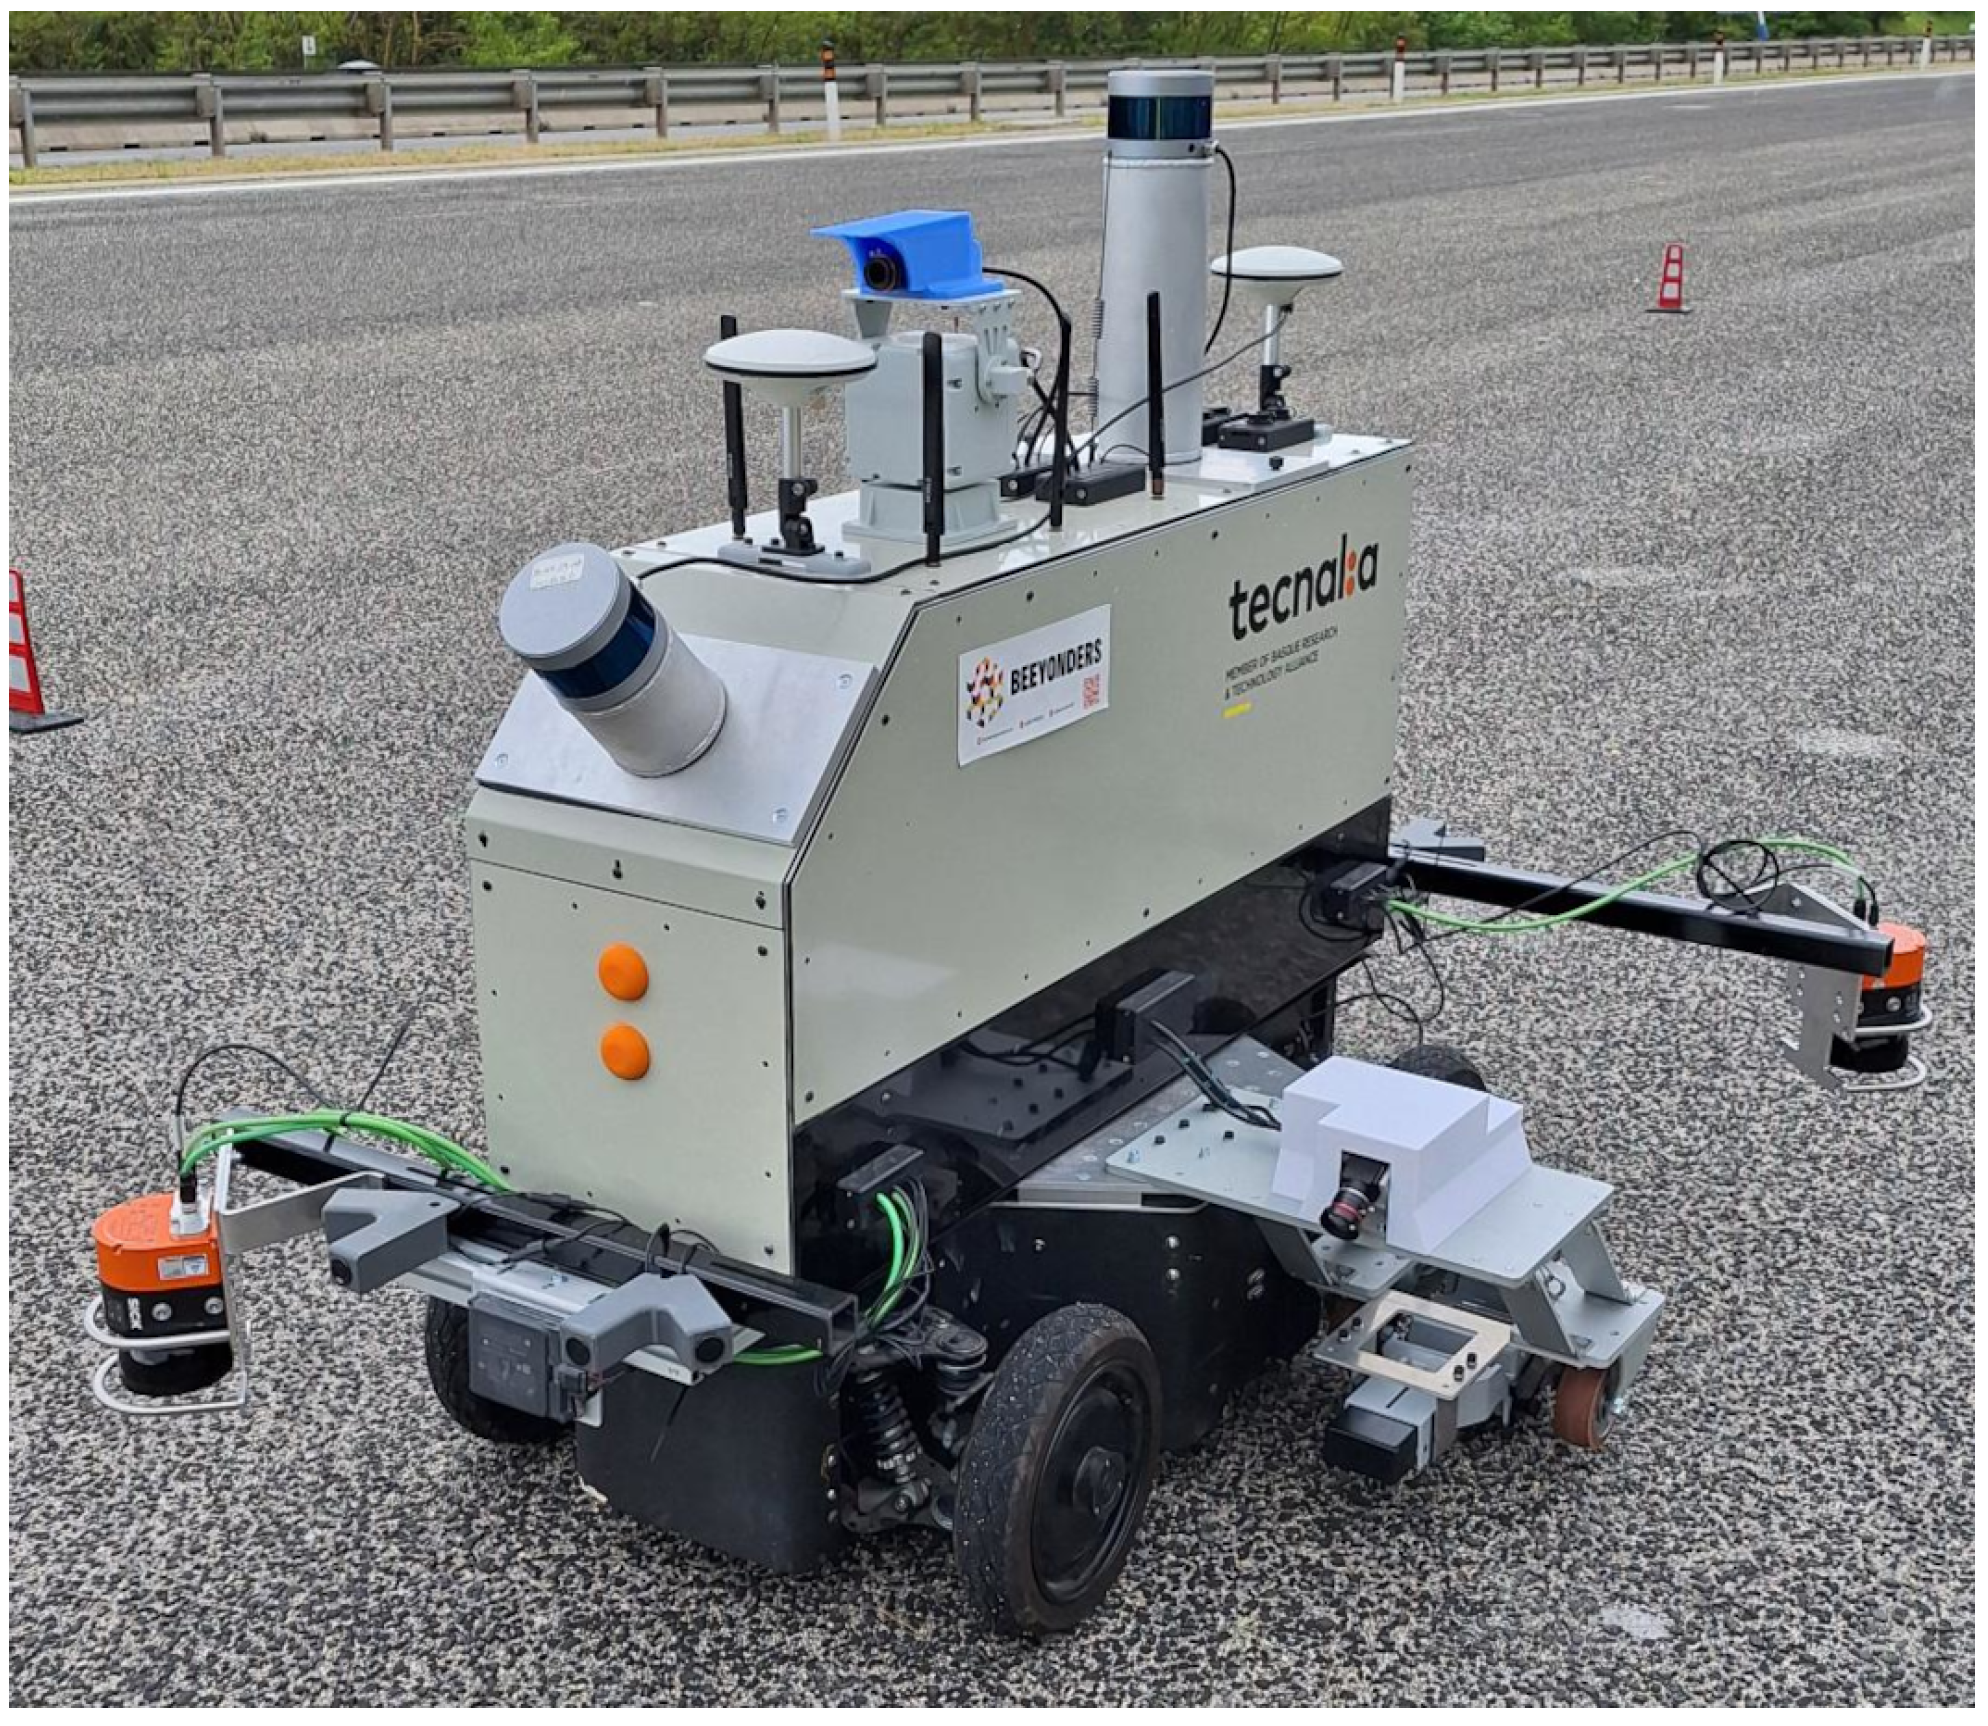
Outdoor navigation is a complex task that requires adequate perception of the environment around the vehicle. The AMR component integrates a wide panoply of sensors, including two Robosense RS-Helios-16 3D LiDARs (for localisation), (Suteng Innovation, Shenzhen, China), two Sick OutdoorScan3 2D LiDARs (safety), (SICK AG, Waldkirch, Germany), a CHCNAV Real-Time Kinematics Global Positioning System (RTK-GPS) GNSS (for global localisation), (CHCNAV, Shanghai, China), a Vectornav VN-100 Inertial Measurement Unit (IMU) (navigation), (VectorNav Technologies, Richardson, TX, USA) and two FLIR Blackfly optical RGB cameras (Teledyne FLIR, Wilsonville, OR, USA) for sign detection and teleoperation.
The integration of these sensors is achieved through the use of the Robot Operating System (ROS) middleware. This middleware greatly eases the integration of the systems by providing off-the-shelf drivers for some sensors (LiDARs and cameras) and offering a framework to easily develop and deploy custom drivers (GPS and IMU).
Communications between the different sensors, the main computing unit, and the DT also required the integration of several communication devices, including an Ethernet switch, Bluetooth dongle and 4G/5G router. Integration of the drive-by-wire vehicle into the system was achieved through a custom ROS-CAN interface.
All these systems were physically integrated onto the drive-by-wire platform within a custom all-weather bodywork, specially designed and built for the vehicle.
One of the key systems to be integrated was the sensor required to measure the reflectivity of the horizontal lines. This sensor, an EasyLux Mini retro-reflectometer, has very restrictive placement requirements to ensure accurate measurements. Due to the required clearance for the sensor, it had to be mounted externally.
For this purpose, a custom liftable platform was designed to integrate the retro-reflectometer. This liftable platform keeps the sensor at a safe distance from the floor when the AMR is travelling, while allowing it to be deployed and guaranteeing the 11mm maximum measurement distance from the floor. The platform is elevated using a National Electrical Manufacturers Association (NEMA) stepper-based pulley mechanism that is controlled directly from the ROS using a custom driver.
The final deployment and configuration of the sensors in the all-weather bodywork, as used during the demonstrator, is shown in Figure 4.

2.4. Operator Interface

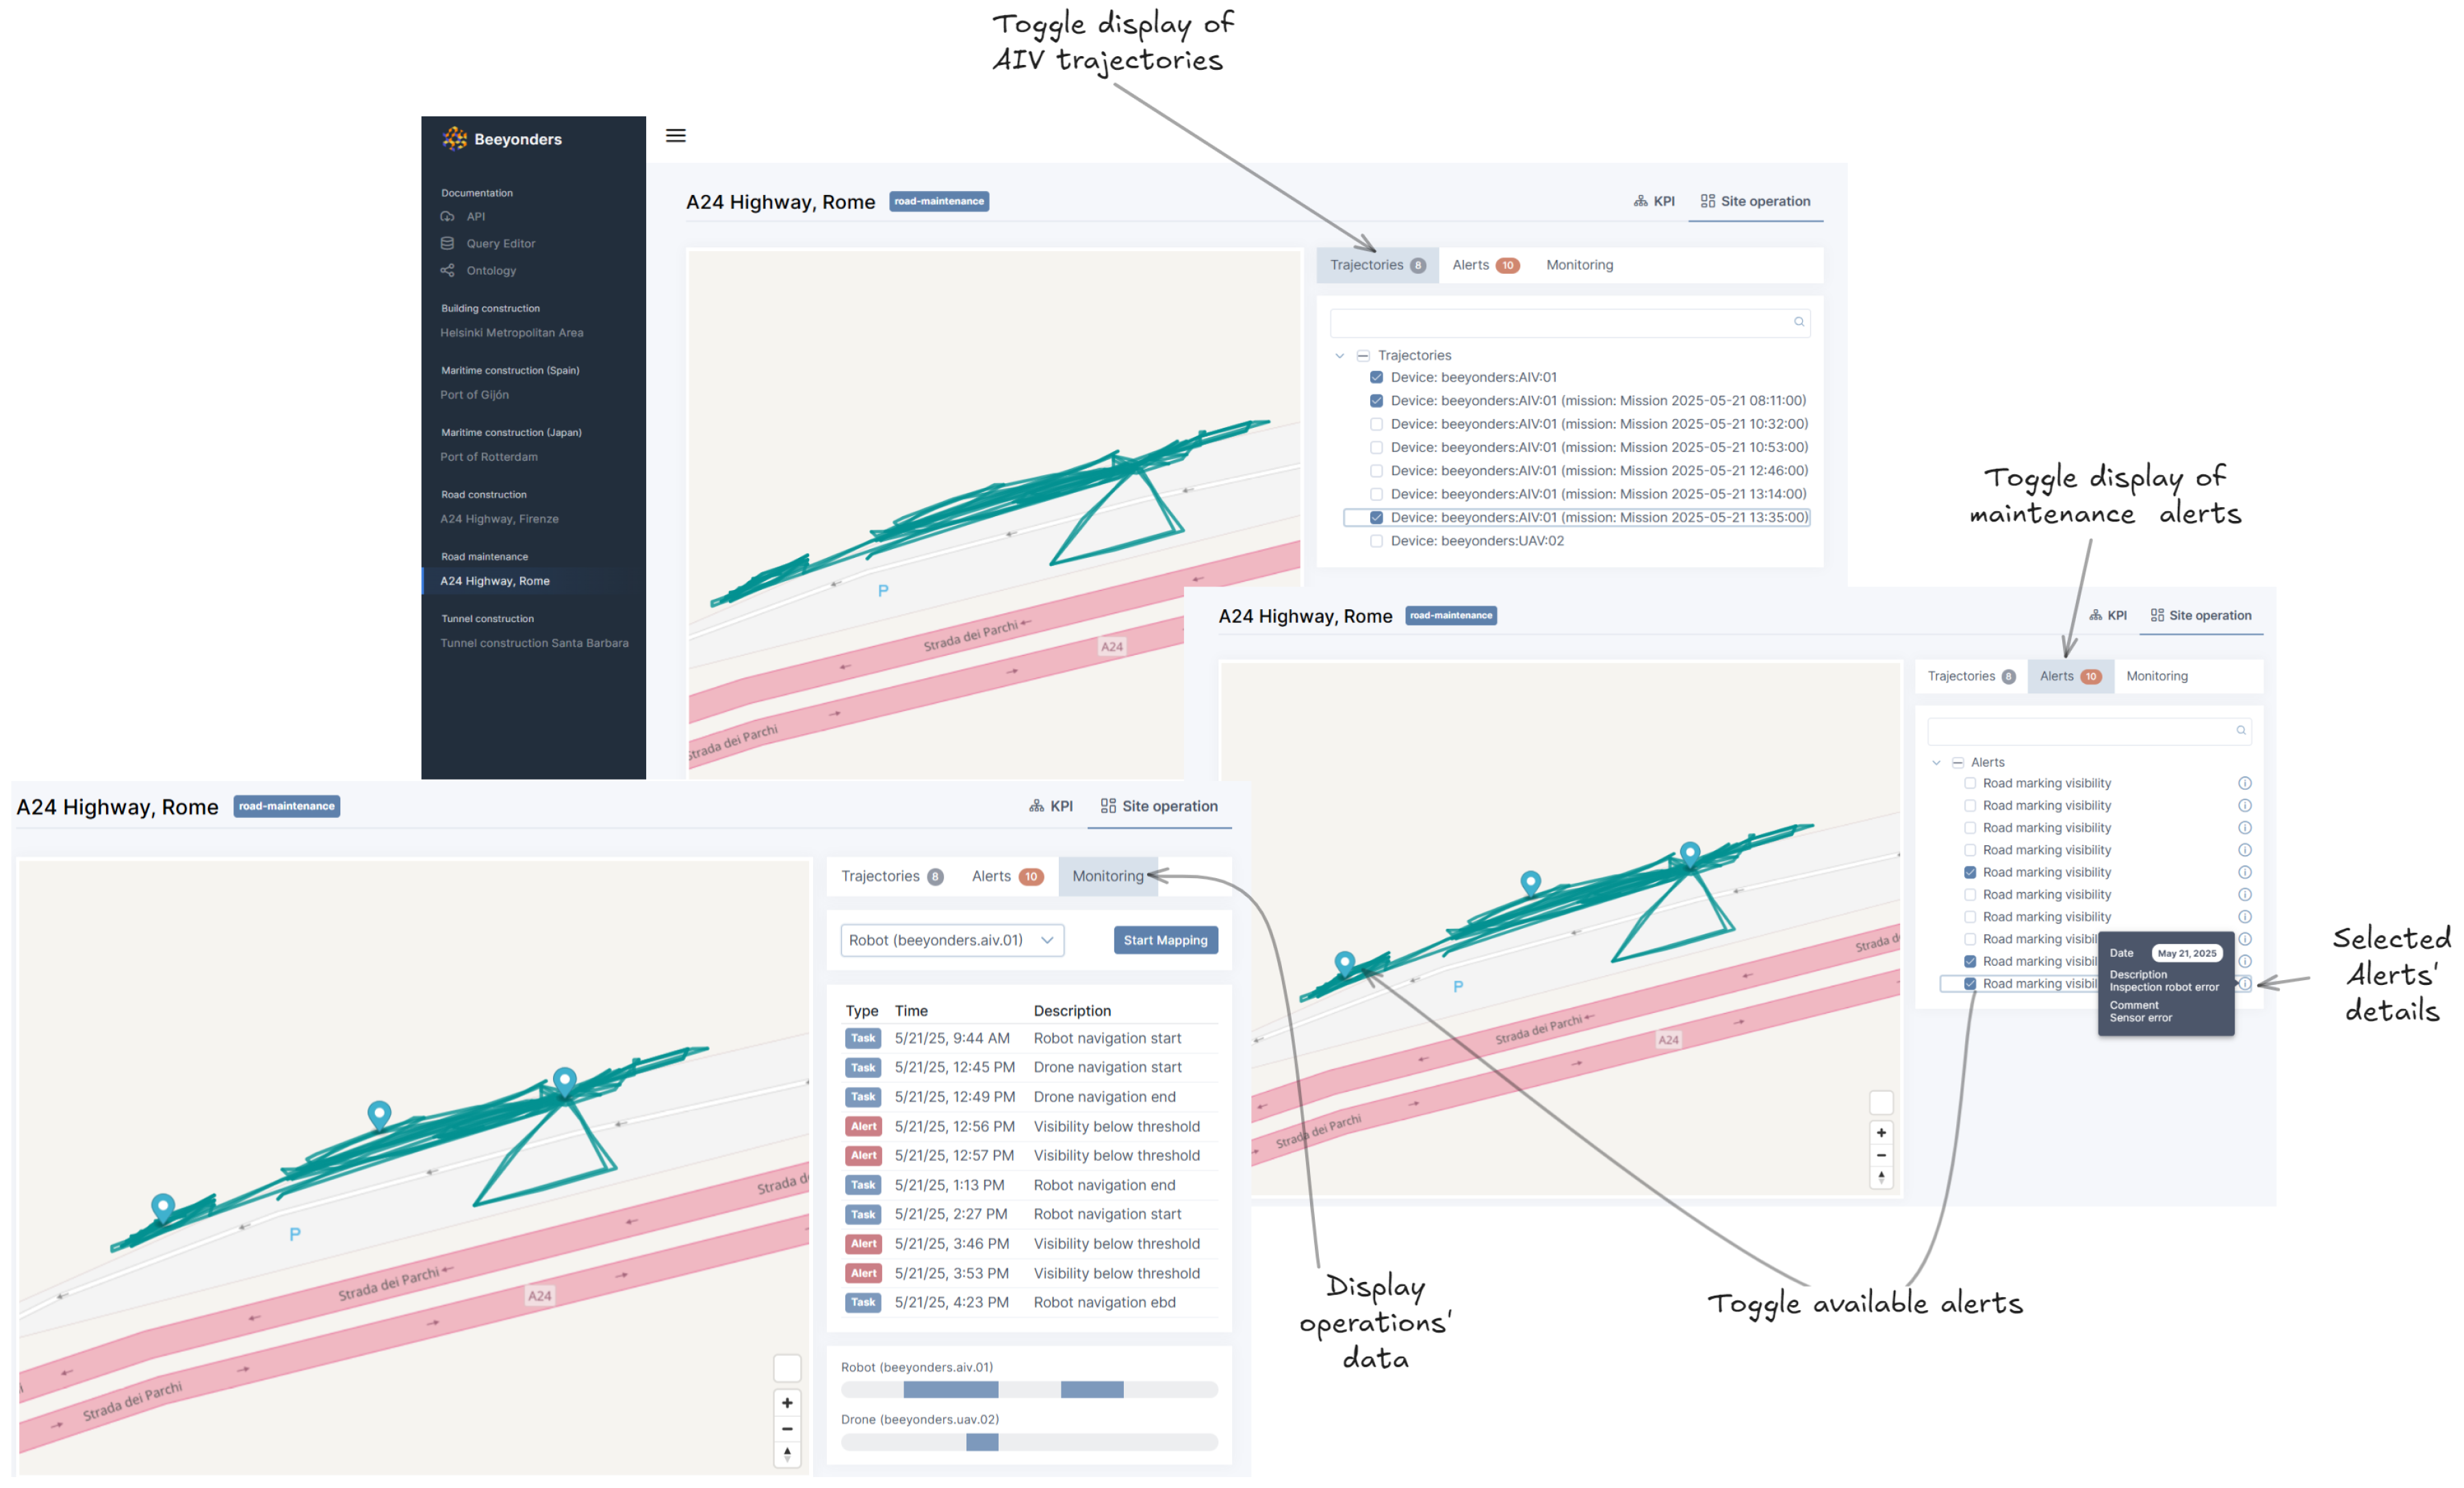
The BEEYONDERS dashboarding service is a core component of the project’s digital twin ecosystem, designed to provide real-time monitoring, visualisation, and decision-support capabilities tailored to various maintenance use cases. It is built on a structured KPI knowledge model using Semantic Web technologies, enabling flexible and extensible data representation through a triplestore database. This model is complemented by a robust API layer that facilitates seamless data exchange between the DT and the dashboard, allowing KPIs and operational metrics to be pushed and retrieved dynamically. The dashboard interface, developed with AngularJS, supports advanced 3D visualisations using open-source libraries such as Three.js and IfcOpenShell. The development process was highly iterative and user-driven, involving collaborative wireframing workshops with stakeholders to ensure the dashboards meet specific operational needs. The road maintenance use case supervision interface connects directly to the DT API to retrieve pilot information from the system.
For the road maintenance use case, a customised interface for monitoring site operations is shown in Figure 5. The monitoring section of the dashboard allows the visualisation of information available in the DT, including AMR trajectories, device status, and visibility alerts. It also enables the initiation of UAV or AMR missions and the launch of their operations.
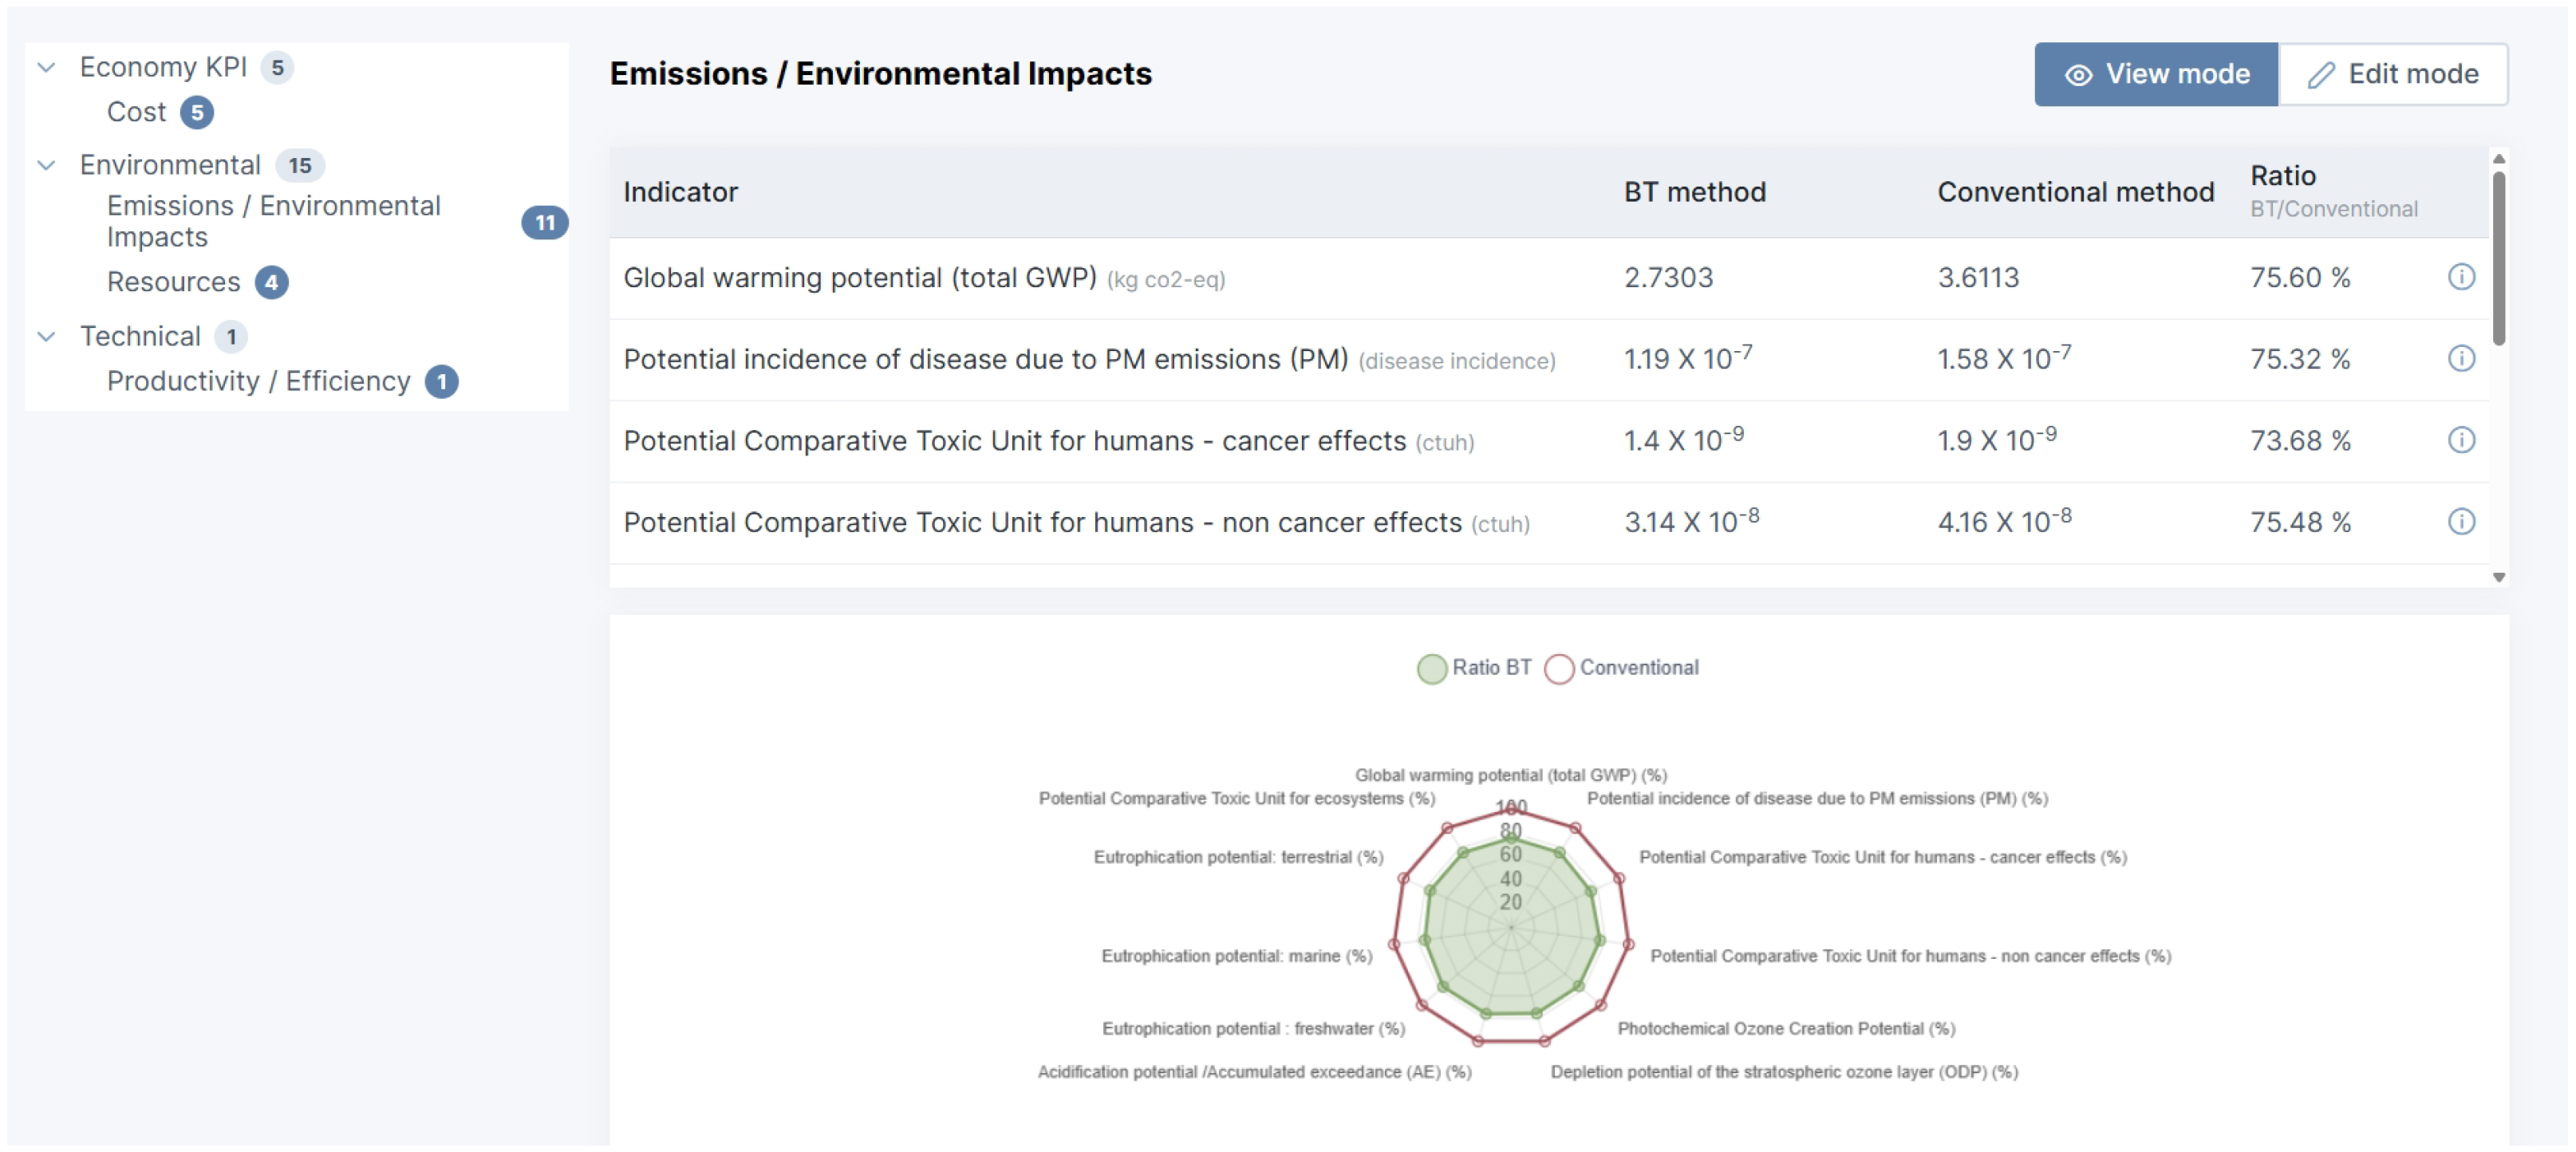
The BEEYONDERS KPI interface (Figure 6) is accessible via the KPI button located in the top-right corner of the road maintenance dashboard, displaying the environmental, technical, social, and economic indicators defined for the automated road management assessment. A more comprehensive description of the related KPIs for the deployed use case is provided in Section 5—Impact Assessment.
The service also leverages technical specifications for JSON-based data contracts, ensuring standardised and reliable integration with the DT. Overall, the dashboarding service acts as the visual and analytical front end of the DT, empowering users with actionable insights related to road maintenance to optimise the deployment and performance of BEEYONDERS’ breakthrough technologies.

2.5. Methodology and Workflow

The road maintenance inspection process begins with the identification of the road section to be studied, based on the asset database and the road manager’s maintenance schedule. A mission is then assigned to the UAV, which performs a flyover of the area to detect vegetation, dead animals, and other objects along the roadside. It also conducts a reflectivity analysis of vertical signs. The resulting point-cloud data—enriched with reflectivity information—is uploaded to the DT. After that, the AMR mission begins, checking the reflectivity of road markings. Measurements made by the AMR are sent in real time to the DT, which analyses them and generates alerts in case of low reflectivity. Reflectivity analyses from both devices are compared and validated, and vegetation and obstacles requiring action are identified based on LiDAR data. Additionally, KPIs are evaluated to assess the benefits of the automated approach (in terms of productivity, cost, workforce, environmental impact, etc.). Finally, the maintenance status of the road section is updated based on the integrated results of both inspection methods.

3. System’s Autonomous Capabilities

3.1. UAV Autonomous Capabilities

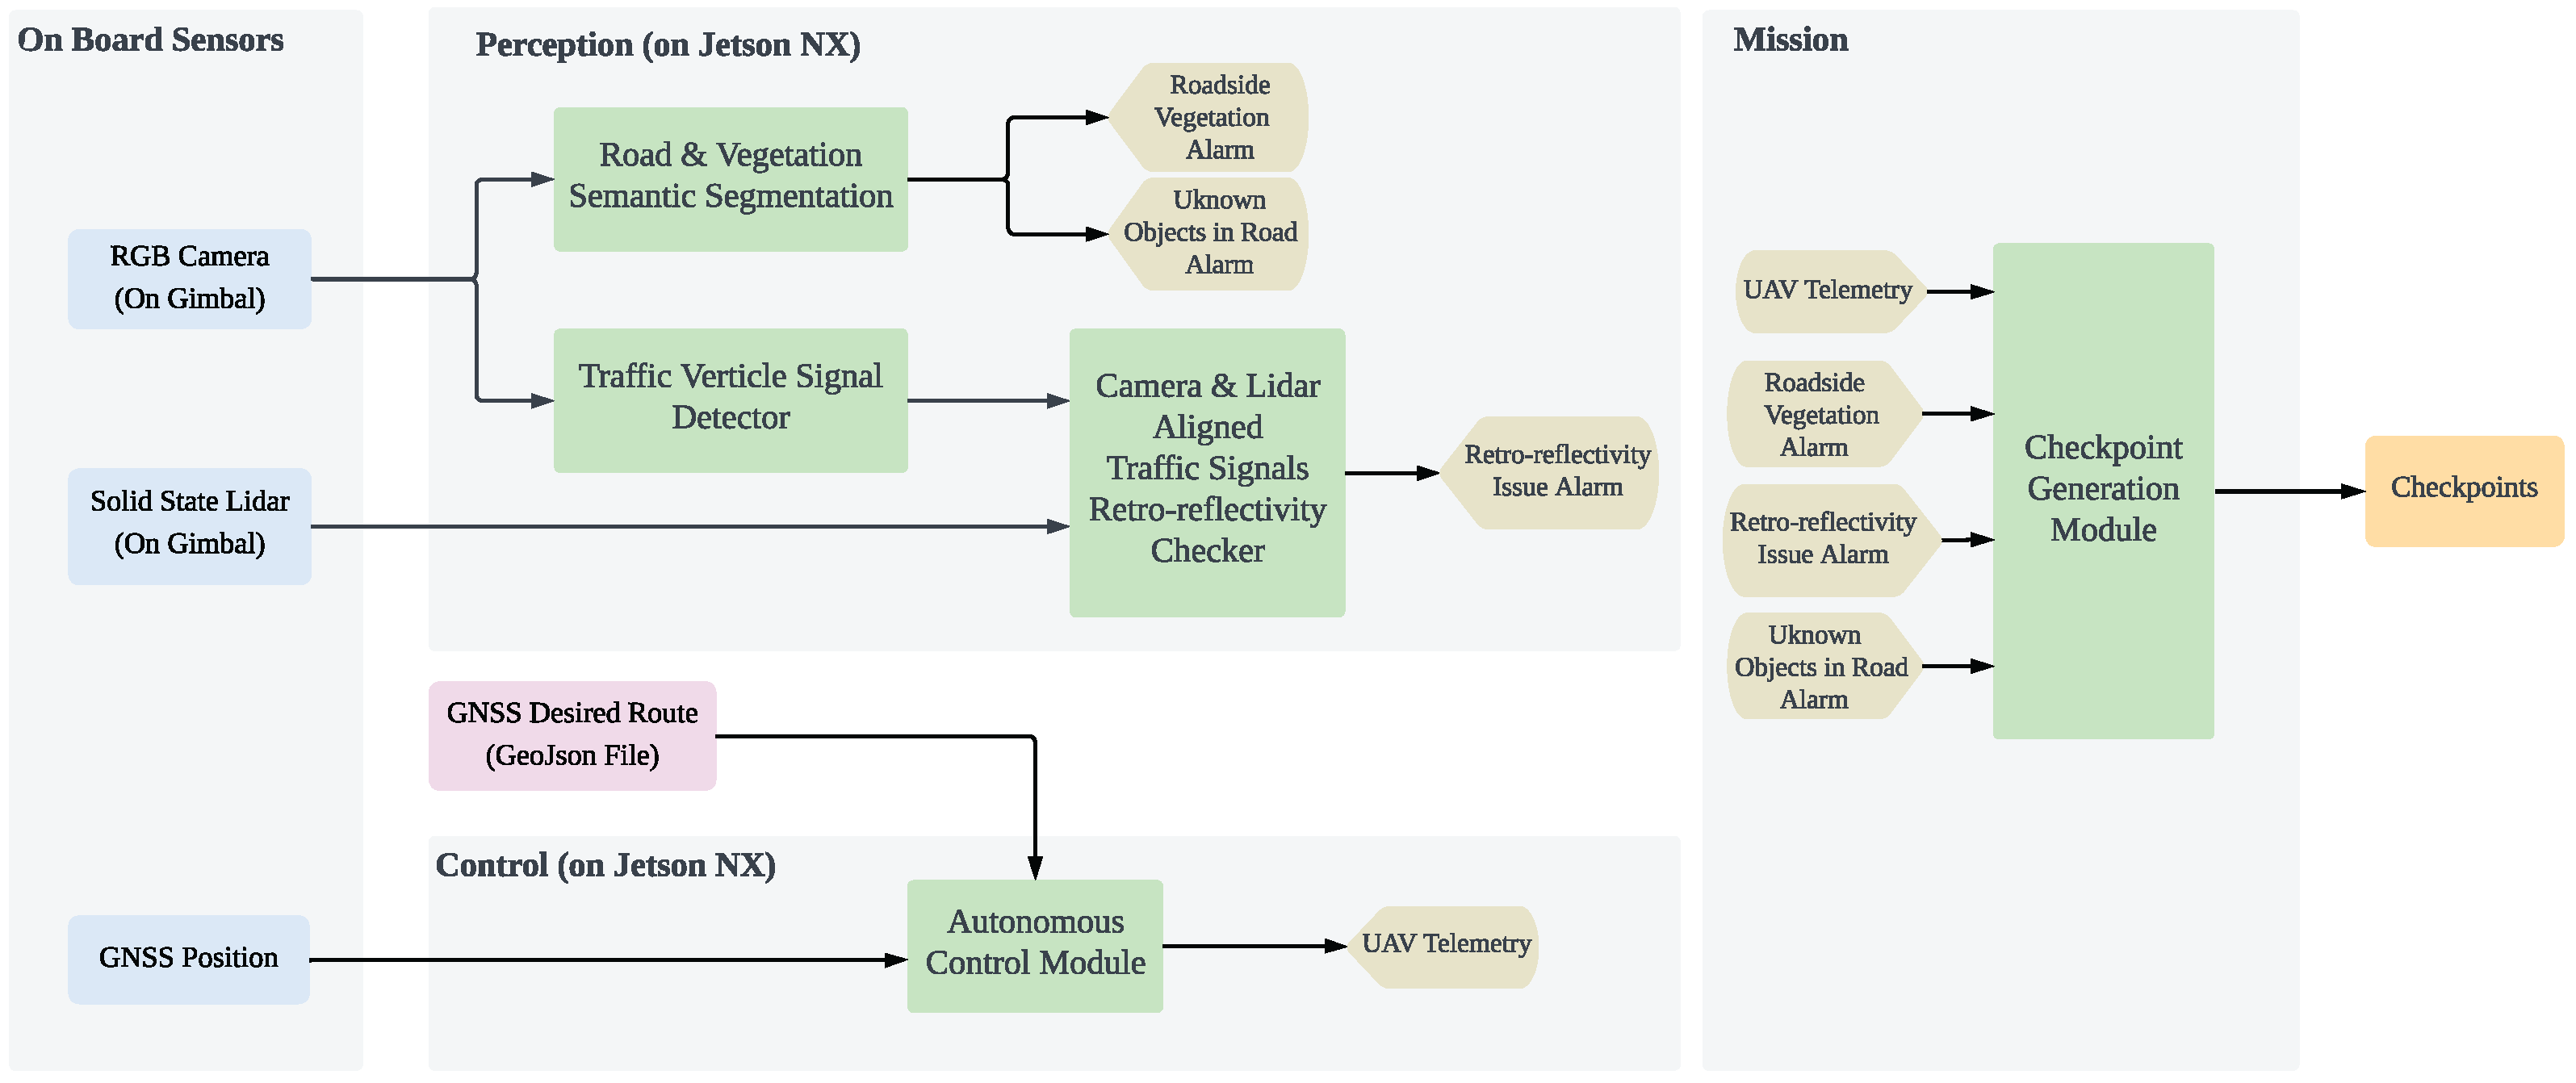
The UAV software architecture is built upon the ROS [21] framework, operating primarily on the onboard NVIDIA Jetson Orin NX computing module. The architecture is organised into three main functional blocks, as shown in Figure 7: Perception, Control, and Mission, which work in coordination to enable autonomous road inspection capabilities. All perception processing and flight control operations execute onboard the UAV in real time, requiring no external computational resources or continuous communication links during mission execution. The only human intervention required is the initial route definition provided by the operator through a GeoJSON file, after which the UAV operates completely autonomously, capturing sensor data, processing imagery and point clouds with deep learning models, detecting anomalies, generating georeferenced alarms, and executing the planned trajectory until mission completion.

3.1.1. Perception Module

The Perception block executes on the Jetson Orin NX and encompasses all software modules responsible for environmental awareness and road condition analysis. This block processes data from two primary onboard sensors mounted on the gimbal: an RGB camera and a solid-state LiDAR.
Synthetic Dataset Generation
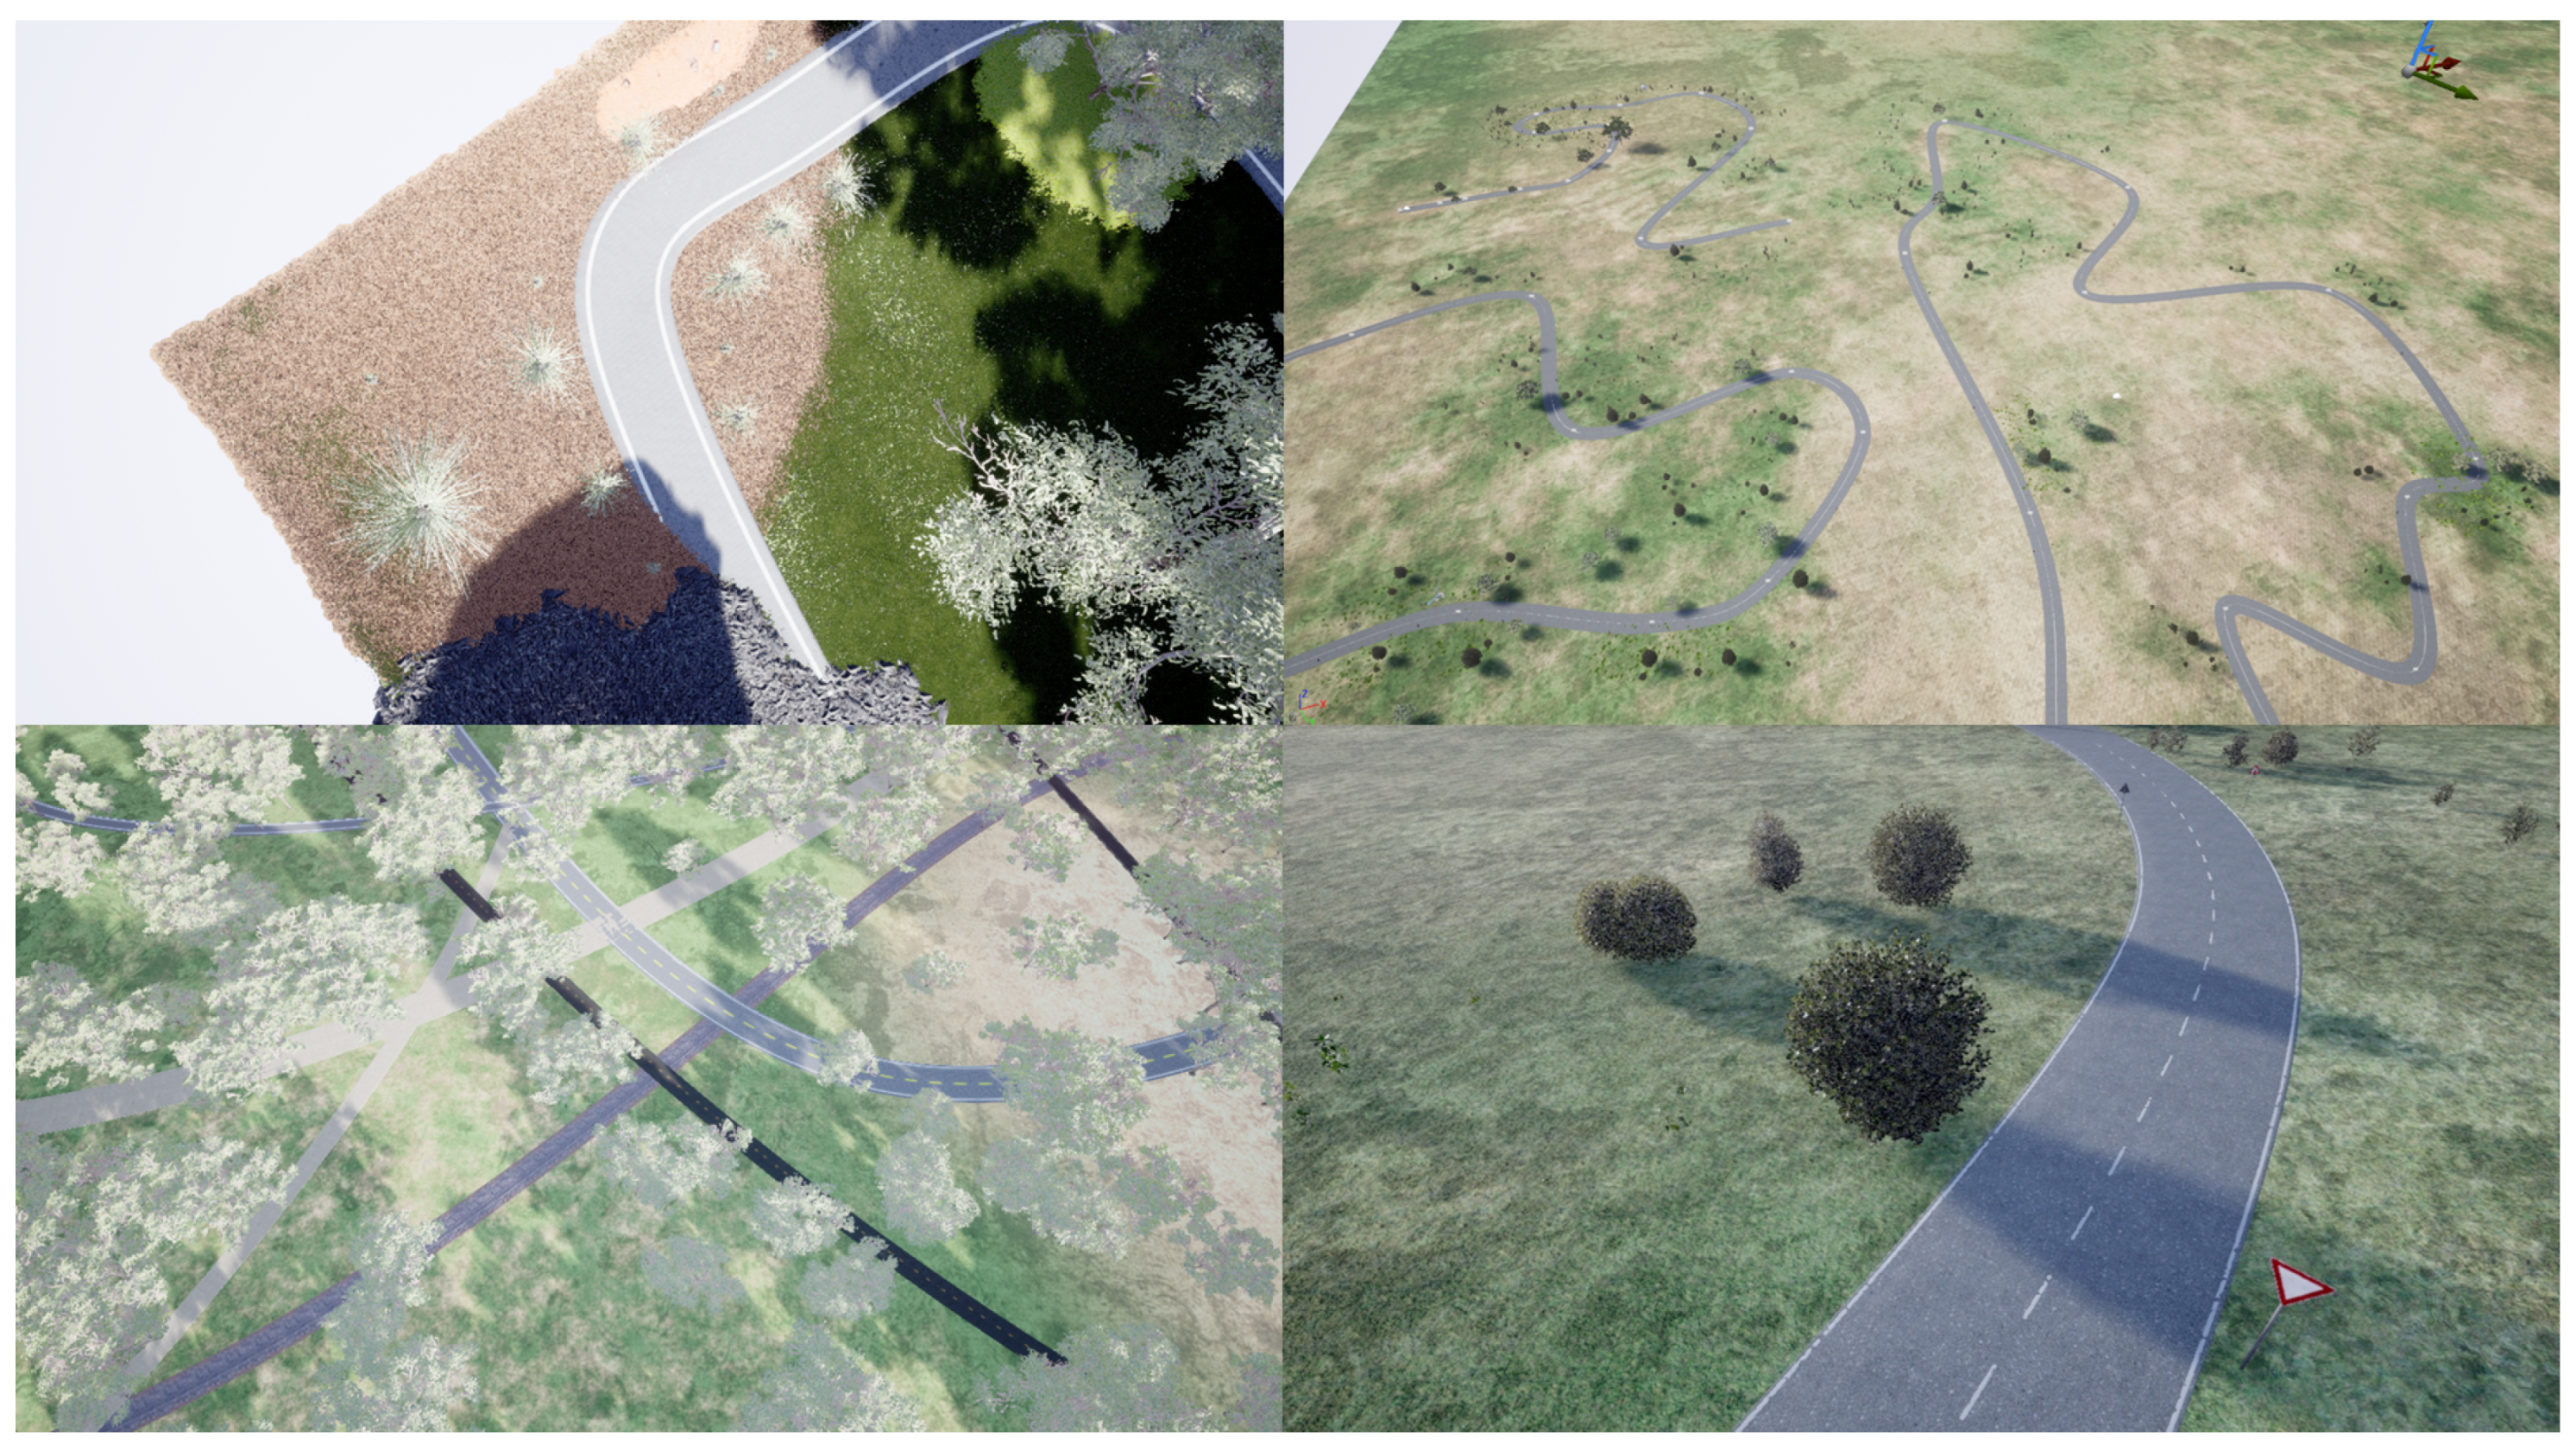
The development of robust deep learning models for road inspection presented a unique challenge: the scarcity of appropriate training data. Most publicly available road datasets provide satellite or car-mounted perspectives, neither of which adequately represents the aerial viewpoint required for UAV-based inspection at 15–20 m altitudes. To address this limitation, a comprehensive synthetic data generation pipeline was developed using Unreal Engine as the simulation platform.
The virtual environment creation process followed an iterative approach, beginning with basic road scenarios and progressively incorporating increased complexity and realism, as shown in Figure 8. Multiple virtual environments were designed to replicate realistic road conditions, including various road textures, different types of horizontal markings, traffic signs of multiple sizes and retro-reflective classes, diverse vegetation types (trees, shrubs, and grass), and potential obstacles such as debris and fallen objects. These environments were constructed using Unreal Engine’s [22] photorealistic rendering capabilities, ensuring visual fidelity comparable to real-world imagery.
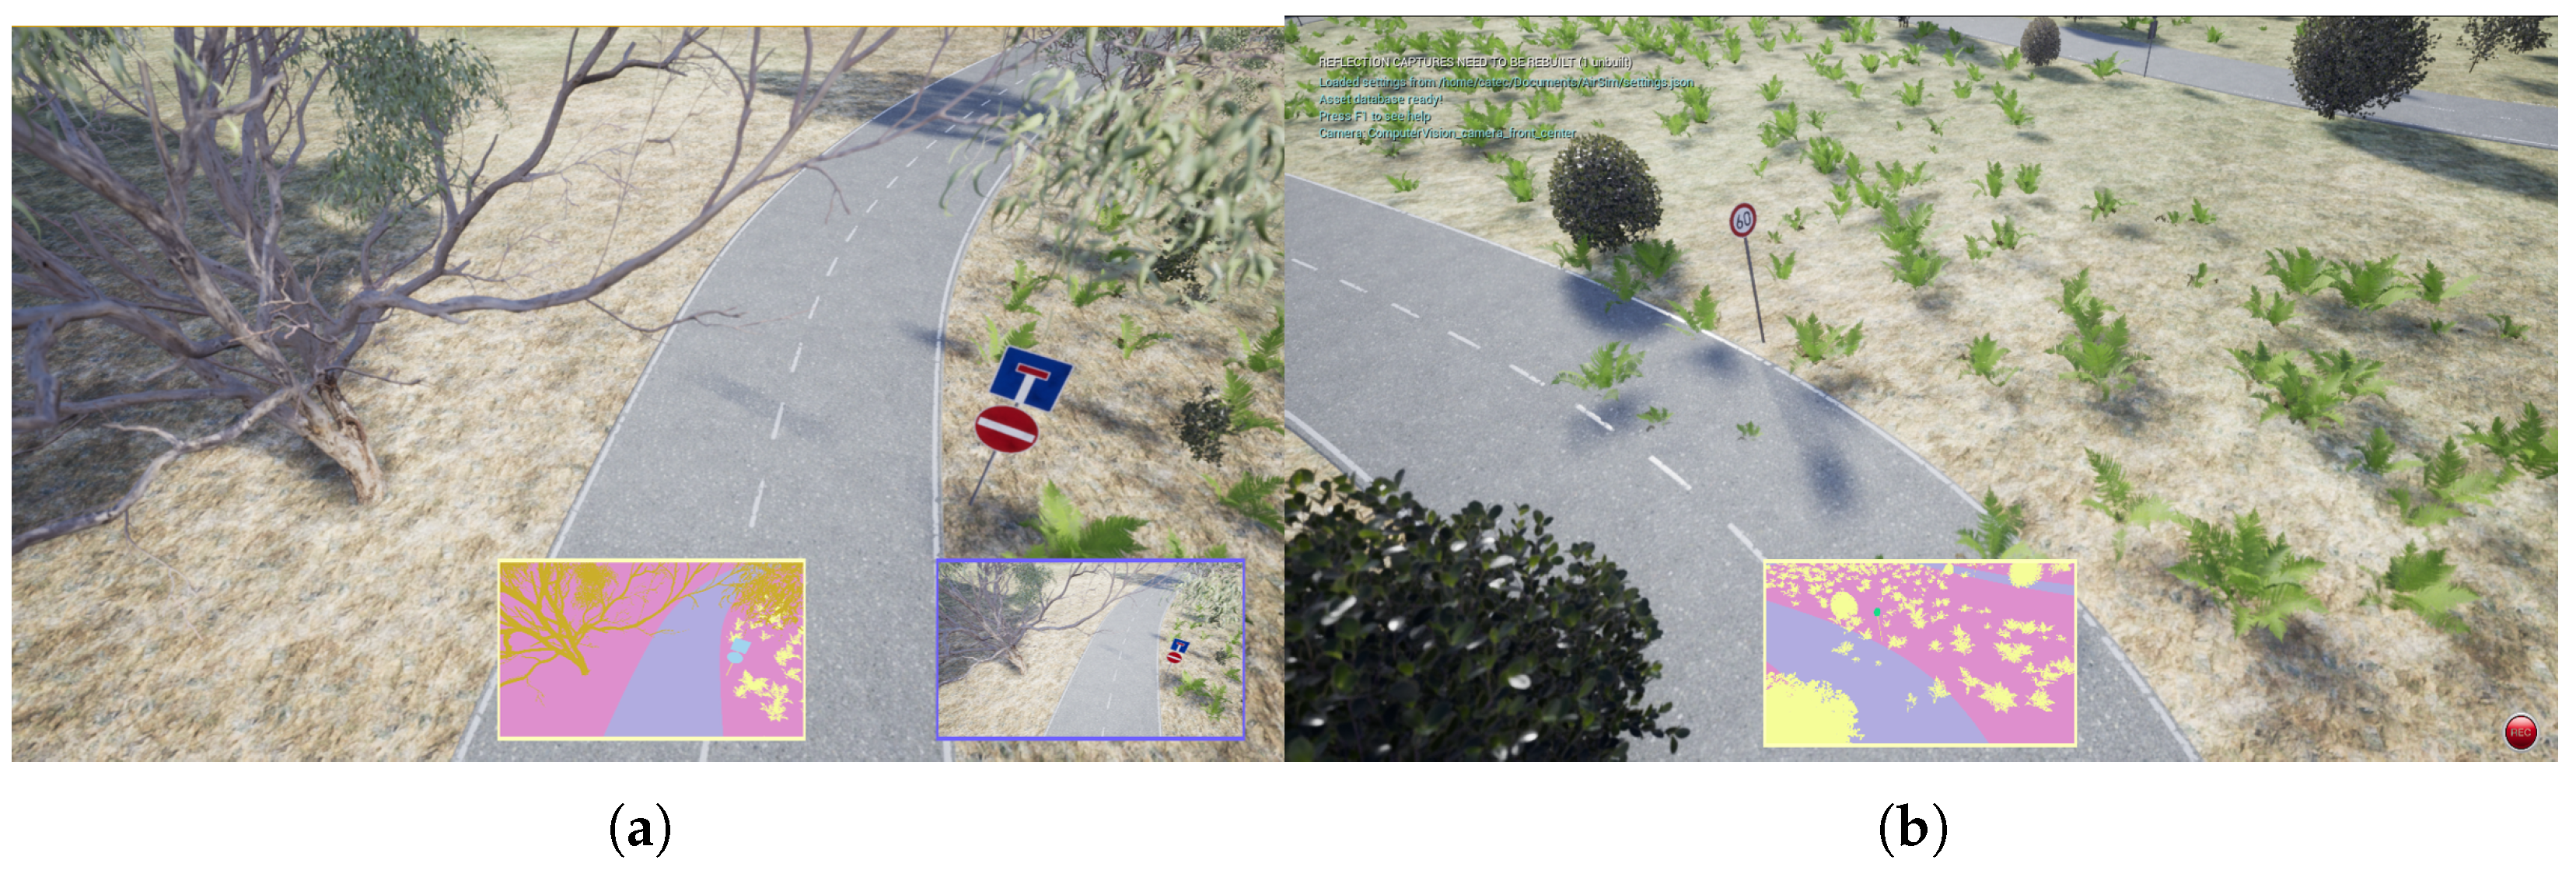
For automated data collection, the AirSim [23] plugin was integrated into the virtual environments, providing ComputerVision-mode functionality that enables retrieval of RGB imagery, depth maps, and pixel-perfect semantic segmentation masks from simulated UAV perspectives. The AirSim API facilitated extensive data augmentation by programmatically varying camera positions, gimbal orientations (pitch angles from 20° to 50°), flight altitudes (10–30 m), lighting conditions, and weather parameters. This systematic variation generated diverse training samples that improved model generalisation to real-world conditions. An example of two images captured using the computer vision mode is shown in Figure 9.
Two distinct synthetic datasets were generated to address the dual perception tasks. For semantic segmentation, a fully synthetic dataset was created comprising RGB images paired with ground-truth segmentation masks, where each pixel is labelled with one of three classes: road, vegetation, or background. The final segmentation dataset evolved through three iterations of increasing complexity, with the ultimate version containing 1043 images at 1280 × 720 resolution, incorporating varied vegetation densities, diverse road geometries, and realistic lighting conditions.
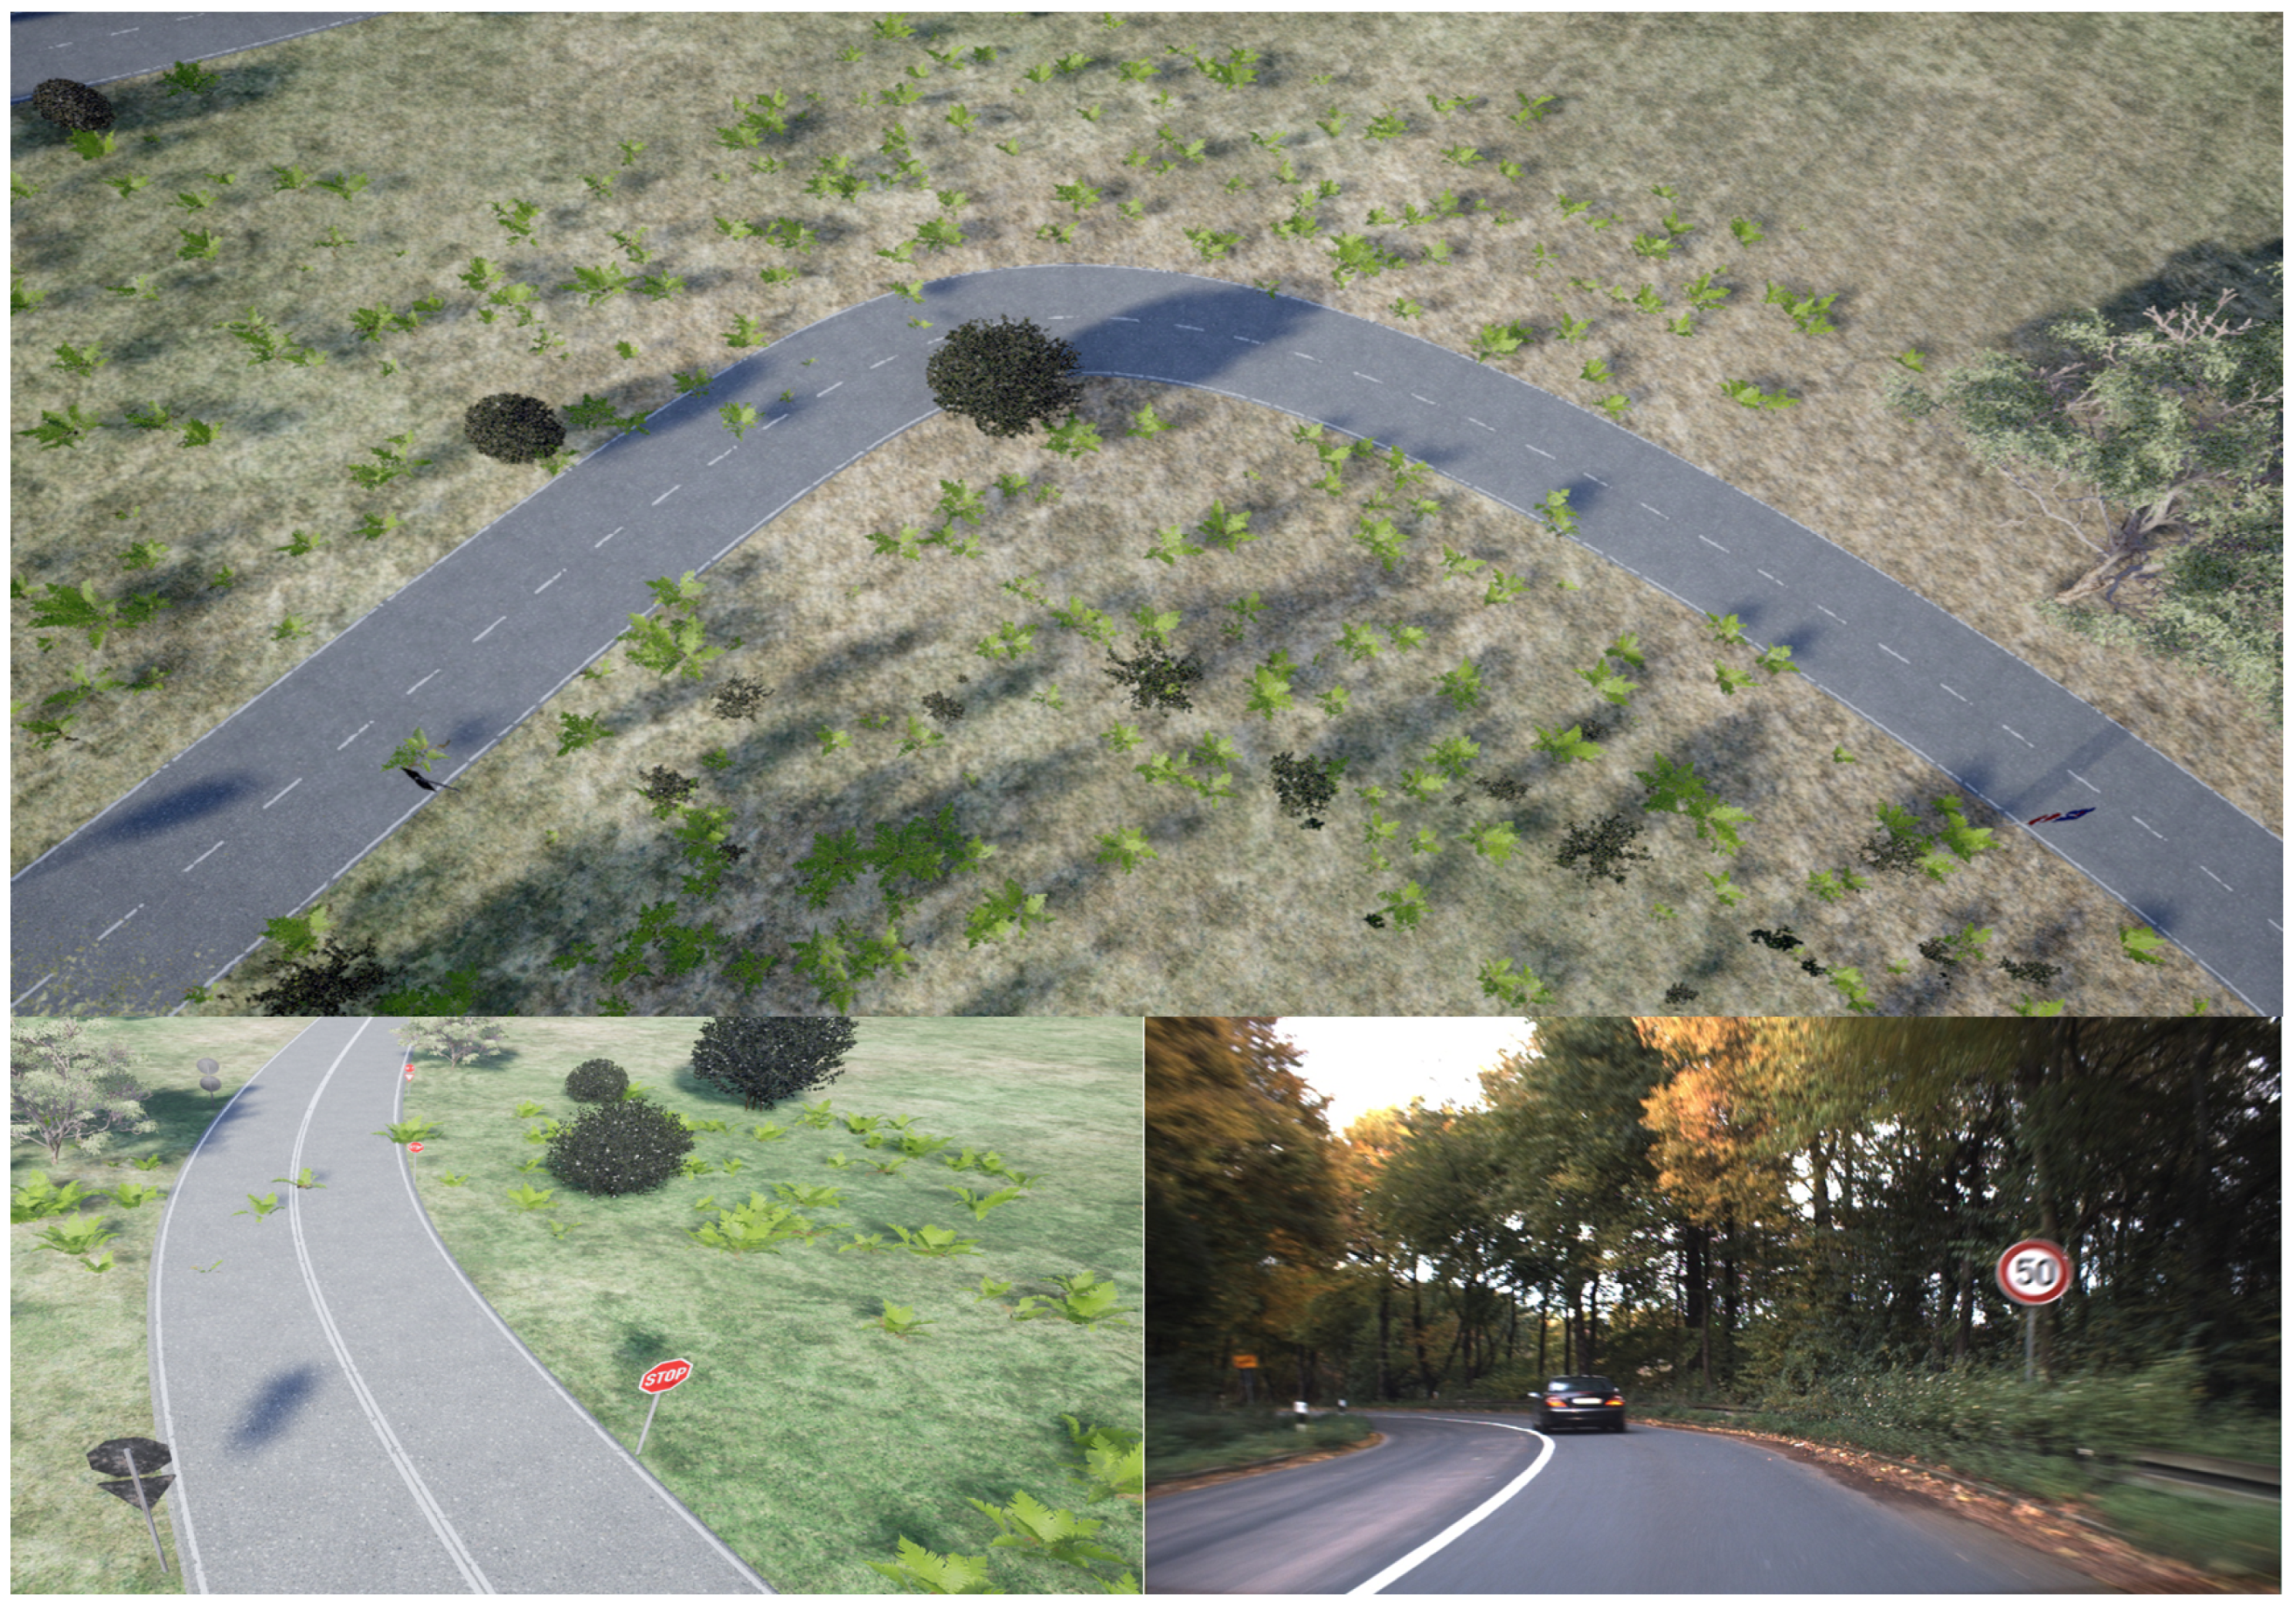
For traffic sign detection, a hybrid approach proved most effective. Initial experiments with the public German Traffic Sign Detection Benchmark (GTSDB) dataset, containing 600 images from car-mounted cameras, provided insufficient performance when applied to aerial perspectives. A purely synthetic dataset of approximately 870 images was generated from the virtual environments, featuring traffic signs captured from UAV altitudes and viewing angles. However, optimal results were achieved by combining both datasets into a mixed training set of approximately 1400 images, balancing the diversity of real-world sign appearances from the GTSDB with the aerial perspective and geometric variations from synthetic data. This hybrid dataset significantly reduced false-positive detections while maintaining high detection rates across varying altitudes and sign sizes. All detection annotations were simplified to a single “traffic sign” class rather than multiple sign type categories, as the subsequent retro-reflectivity analysis does not require sign type classification. A showcase of the images used in the training task is shown in Figure 10.
Table 1 and Table 2 present the quantitative evaluation metrics for both perception models. For traffic sign detection (Table 1), the model trained on the hybrid synthetic–real dataset achieves a recall of 0.959 and an mAP@0.5 of 0.895, outperforming the purely synthetic-trained model in terms of false-positive reduction, despite a marginal difference in mAP. This confirms the benefit of combining real-world and synthetic data, as the purely synthetic model tends to over-detect, including false positives, while the hybrid model produces cleaner detections at the cost of a slightly lower overall recall. For semantic segmentation (Table 2), the UPerNet model achieves strong per-class IoU scores across all three categories, with 99.11% for background, 96.61% for road, and 76.51% for vegetation, reflecting the higher visual variability of vegetation compared with road surfaces.
Deep Learning Inference Pipeline
The perception pipeline comprises three primary analysis capabilities operating in parallel. First, Road and Vegetation Semantic Segmentation employs the UPerNet [24] architecture, selected through comprehensive benchmarking against alternative models (DeepLabv3, PSPNet, BiSeNetV1, and Fast-SCNN). This module performs pixel-wise classification of the camera imagery, generating segmentation masks that distinguish between road surface, vegetation, and background classes. When vegetation encroachment or obstacles invading the road surface are detected through morphological analysis and contour detection on the segmentation masks, the system triggers a "roadside vegetation" alarm and an "unknown objects in road" alarm, which are forwarded to the Mission block for geolocation tagging and digital twin integration.
Second, Traffic Vertical Signal Detection employs the YOLOX [25] object detection architecture, chosen for its anchor-free detection approach and decoupled-head design that separates classification and regression tasks. The model was trained on the hybrid synthetic–real dataset and deployed using TensorRT format for GPU-accelerated inference on the Jetson platform. This module identifies and localises vertical traffic signs in the camera stream, providing bounding-box coordinates and confidence scores for each detection. The system processes detections across multiple flight altitudes (15–20 m) and gimbal orientations (20°–40° pitch angles), adapting confidence thresholds dynamically to maintain detection reliability while minimising false positives.
The third perception capability is the Camera and Lidar Aligned Traffic Signal Retro-reflectivity Checker, which performs sensor fusion between visual detections and LiDAR intensity measurements. This module utilises extrinsic calibration parameters to project detected traffic sign bounding boxes onto the 3D LiDAR point-cloud coordinate frame. For each detected sign, the corresponding point-cloud region is extracted and its intensity values are analysed. It is acknowledged that absolute retro-reflectivity modelling from LiDAR intensity is not straightforward: intensity values vary across LiDAR systems, and many sensors saturate when measuring highly retro-reflective surfaces, making a direct quantitative mapping to standardised retro-reflectivity units non-trivial without sensor-specific calibration data [26]. Consequently, the analysis performed in this work is qualitative in nature. Rather than computing absolute retro-reflectivity values, the module estimates the relative reflective condition of each sign by comparing the mean intensity of the sign’s point-cloud cluster against the mean intensity of adjacent non-reflective road surface regions extracted from the same scan. When the ratio between these two values falls below an empirically defined threshold, the sign is flagged as potentially degraded and a “retro-reflectivity issue” alarm is generated and transmitted to the Mission block with the corresponding GPS coordinates and timestamp. This relative comparison approach provides a practical indicator to prioritise signs for on-site verification, without claiming to replace standardised retro-reflectometer measurements.
All perception modules operate concurrently during flight, processing sensor data streams in real time through ROS topic subscriptions and generating georeferenced alarms that are aggregated by the Mission management system.

3.1.2. Control Module

The control block is responsible for autonomous navigation and flight stability. The core of this module is the Autonomous Control Module, which executes on the Jetson Orin NX and interfaces directly with the APM autopilot system. This module receives GNSS data along with complementary sensor inputs (IMU, compass, and altimeter) to maintain robust position estimation throughout the mission.
The control architecture implements a cascade controller structure executing on the autopilot, where position control outputs are transformed into velocity references tracked by a Proportional–Integral–Derivative (PID) controller. The velocity control loop generates attitude setpoints that feed the low-level attitude control system, ensuring stable flight even under varying wind conditions and payload configurations.
The control module receives mission waypoints from the operator in the form of a GNSS Desired Route specified in GeoJSON format, which defines the road section to be inspected. The controller autonomously executes this route while maintaining the specified altitude and speed parameters and continuously provides UAV telemetry feedback to the Mission block, including real-time position, attitude, battery status, and flight mode information.

3.1.3. Mission Module

The Mission block serves as the high-level coordinator between the UAV system and the digital twin infrastructure. This module operates the Checkpoint Generation Module, which aggregates all perception-generated alarms (roadside vegetation, unknown objects, and retro-reflectivity issues) together with their corresponding geospatial coordinates and timestamps.
The module processes four primary input streams: UAV telemetry for position tracking, roadside vegetation alarms, retro-reflectivity issue alarms, and unknown objects in road alarms. Each alarm is enriched with precise GPS coordinates captured at the moment of detection, enabling accurate mapping of road maintenance needs within the digital twin environment.
The output of the Mission block consists of georeferenced checkpoints that are transmitted to the digital twin system for storage, visualisation, and maintenance planning. This seamless integration enables operators to monitor inspection progress in real time, visualise detected anomalies on a digital map, and prioritise maintenance interventions based on the severity and location of identified issues.
The Mission block also handles the initial route-planning interface, accepting GeoJSON-formatted route files that operators create using standard GIS tools. This route specification is then parsed and converted into MAVLink waypoint messages compatible with the autopilot, enabling fully autonomous mission execution from take-off to landing.

3.2. AMR Autonomous Capabilities

3.2.1. Outdoor Localisation and Navigation

Two different autonomous localisation and navigation systems are available in the AMR: a 3D map-based solution and a purely inertial + GPS-based solution. This approach also allowed us to test the system in environments where the lack of spatial features could make the use of 3D maps less suitable. In both cases, global Universal Transverse Mercator (UTM) coordinates are used to represent goals and positions, so both the map and map-less representation are fully compatible.
  • 3D mapping and localisation: This solution is provided by a 3D navigation suite compiled by TECNALIA by integrating different off-the-shelf ROS components into a single, easily deployable localisation and navigation solution. This solution has been previously used successfully in different indoor industrial applications, including localisation and navigation in constrained spaces [27]. The suite is composed of two main components:
    Mapping module: The mapping process is performed using the LIO-SAM library [28]. LIO-SAM is a state-of-the-art odometry generation library based on LiDAR and IMU sensors. Sensor movement is accurately estimated by combining point-cloud matching with inertial measurement. The point-cloud matching is performed against a 3D representation created from invariant points detected in the point clouds. This 3D representation is dense enough to be used as a 3D map for later navigation.
    Localisation module: For the 3D localisation part, the suite incorporates the HDL_localization library [29]. The localisation done by this library is based on a variant of the Normal Distribution Transform (NDT) point-cloud matching method against a global map. The system keeps track of the estimated position using an Unscented Kalman Filter. At each step, the estimated pose is updated using inertial measurement and then is refined using the mentioned NDT method. Since the maps generated by LIO-SAM are not geolocalised, a GPS fusion method is used to obtain the transformation between the local map poses and global UTM coordinates. This fusion is provided by the ROS robot_localization module [30], which provides an implementation of a Extended Kalman Filter (EKF), fusing GPS and IMU inputs for continuous global positioning of the robot in UTM coordinates.
  • Inertial + GPS map-less localisation: In this approach, the 3D map used for localisation is replaced by a continuous pose estimator fusing odometry, inertial and GPS measurements. Odometry information is calculated using a custom fusion of GPS and vehicle speed provided by the CAN interface. The localisation, also based on the robot_localization pacakge, allows us to accurately estimate the robot’s relative pose in a local framework from its starting position. As in the 3D map-based system, an additional GPS integration layer provides the transformation from the local reference system to UTM coordinates.
  • Planning: Basic planning functionality is provided by the standard ROS navigation stack. However, the map used for this planning is different depending on the localisation used:
    In the case of the GPS localisation, planning is done on an empty map with only customised “lanes”, but no environment obstacles.
    Planning over the 3D map module requires us to know the parts of the map that represent unsalvable obstacles. This is achieved by estimating the floor from the 3D map as an elevation map using the ROS grid_map library [31]. This 2.5D representation of the environment is then used to estimate the “transitable” space of the environment in the form of a “transitability” map that represents the areas of the environment that the robot can reach by its own means. This transitability map is the occupancy grid used by the standard ROS navigation stack for planning.

3.2.2. Horizontal Sign Detection and Sampling

To ensure accurate measurements with the retro-reflectometer, the sensor must be precisely aligned with the horizontal sign, with at least 75 cm of the sign positioned in front of the sensor. This requires the AMR to place the sensor with high accuracy in both position and orientation. To minimise external sources of error, the positioning is performed relative to the sign itself rather than relying on the map or global positioning.
The positioning system consists of two main modules: a detection system that estimates the relative position and orientation of the sign with respect to the sensor and a visual-servoing system that drives the AMR to the correct position based on the information provided by the detection system.
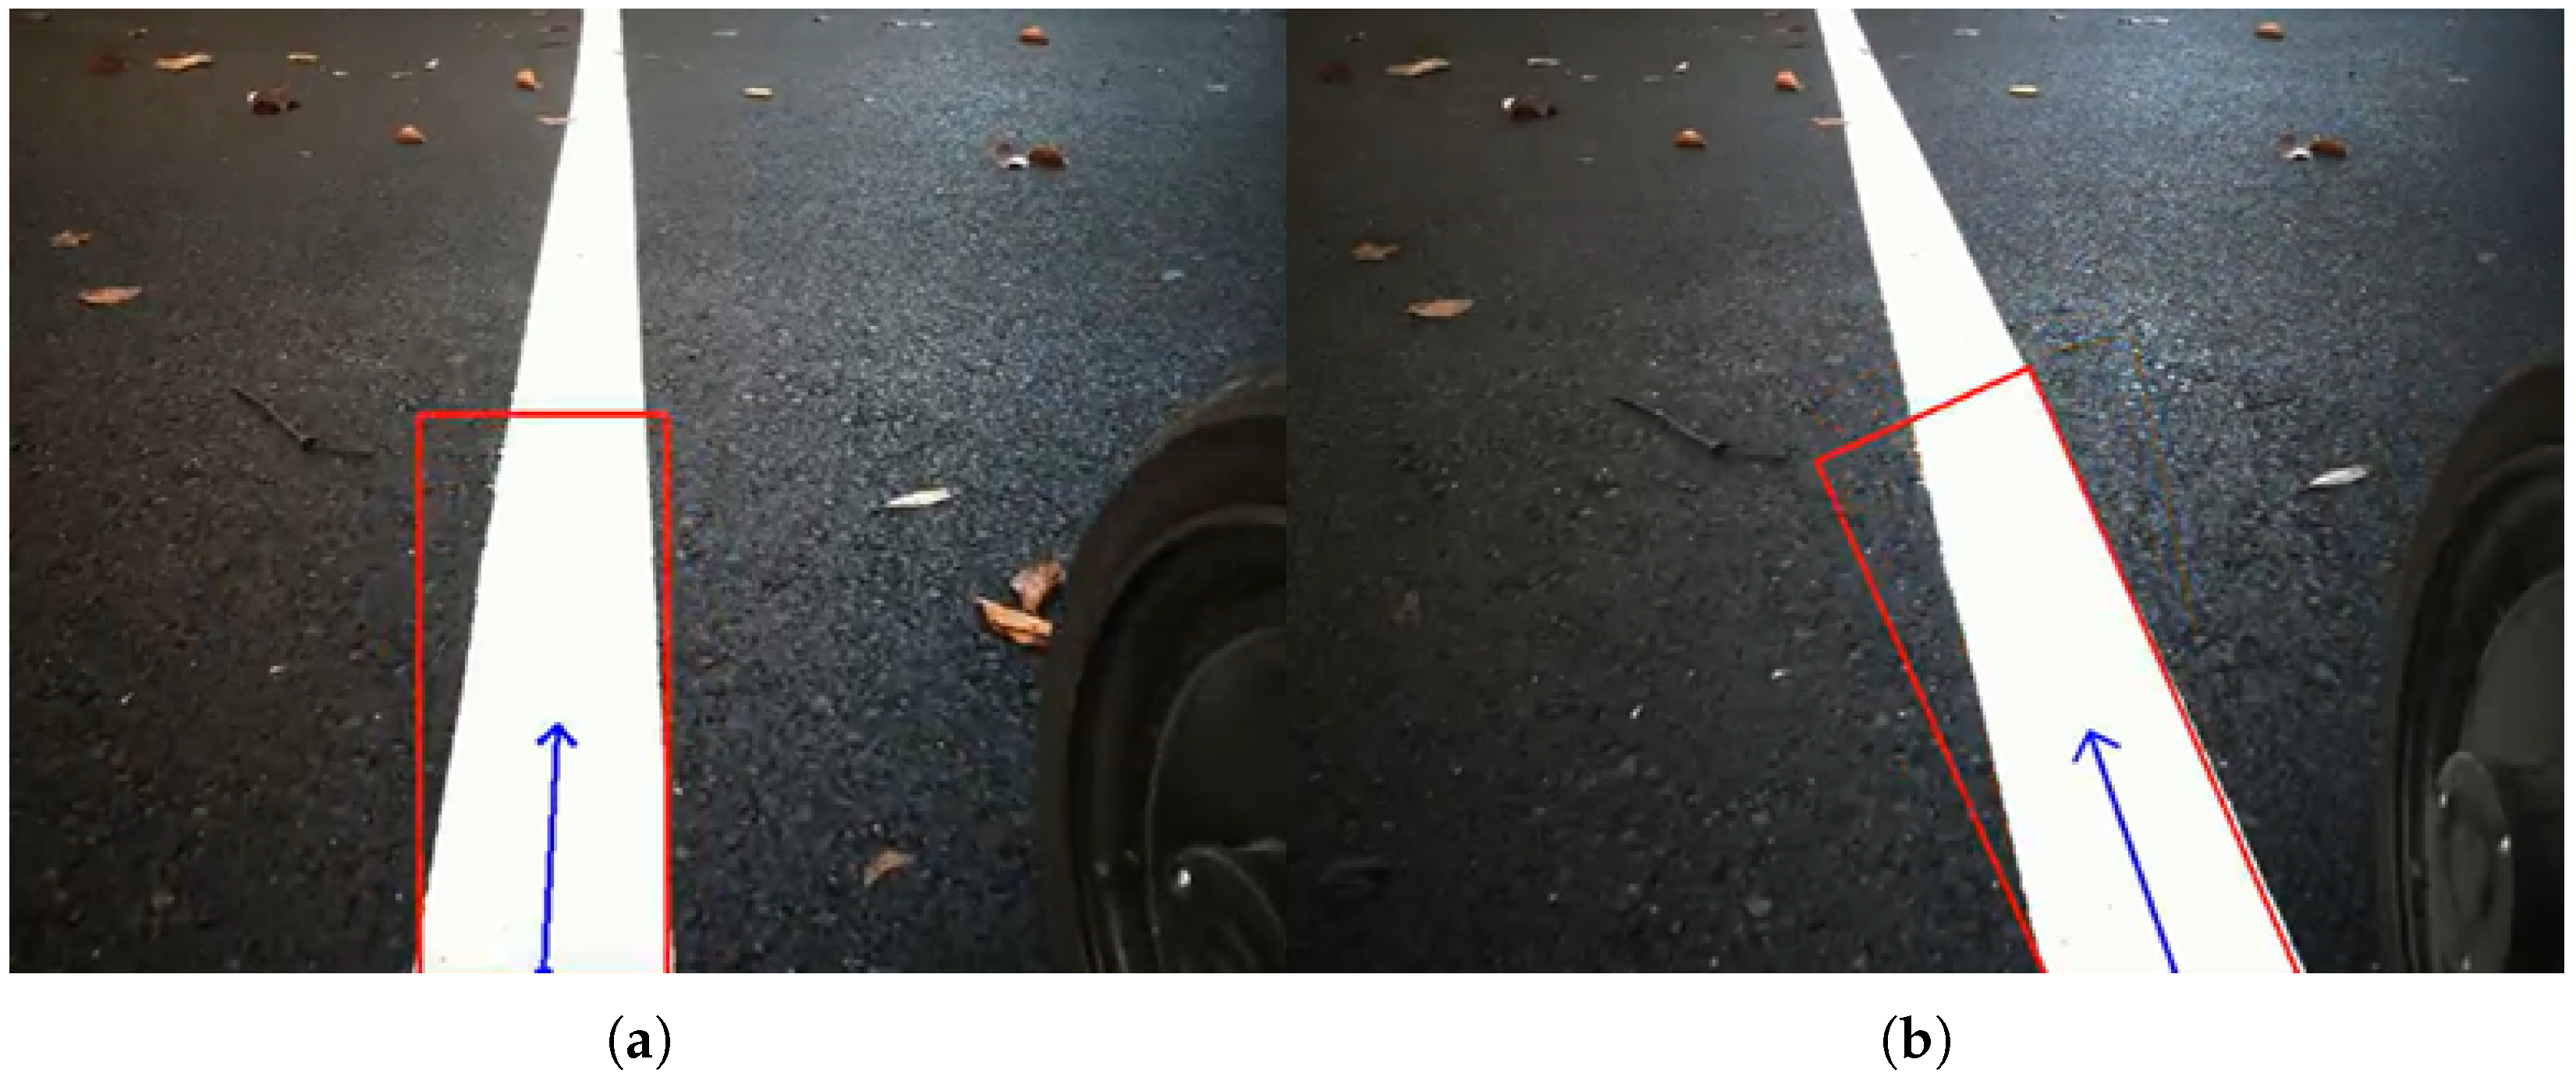
The line detection system uses images from a coaxial camera and exploits the high contrast between the white lines and the black asphalt background. The image processing pipeline follows a standard approach, including resizing, converting to greyscale, and applying Gaussian blur to reduce noise and improve image quality. A threshold is then applied to separate the line from the background, creating a binary image that isolates the sign. To extract the sign’s features, contour detection is performed on the binary image, using morphological operations to refine edges and remove noise. The detected contours are approximated as polygonal shapes, and their bounding boxes are calculated. The reference point of the sign, or base point, is determined as the mean of the lower side of the bounding box. The centroid of the contour is also computed using its moments, and the direction vector of the sign is defined as the vector from the base point to the centroid. Figure 11 shows two examples of the estimation of this direction vector.
The direction vector serves as the reference for the visual-servoing system, which employs a PID controller to steer the AMR, minimising both the distance between the base point and the centre of the image and the angle of the vector relative to the vertical. Once the visual-servoing system determines that the position is correct, the AMR stops, lowers the liftable platform, and triggers the retro-reflectometer measurement via Bluetooth. The measurement data are then retrieved and sent to the digital twin.

3.2.3. Mission Management

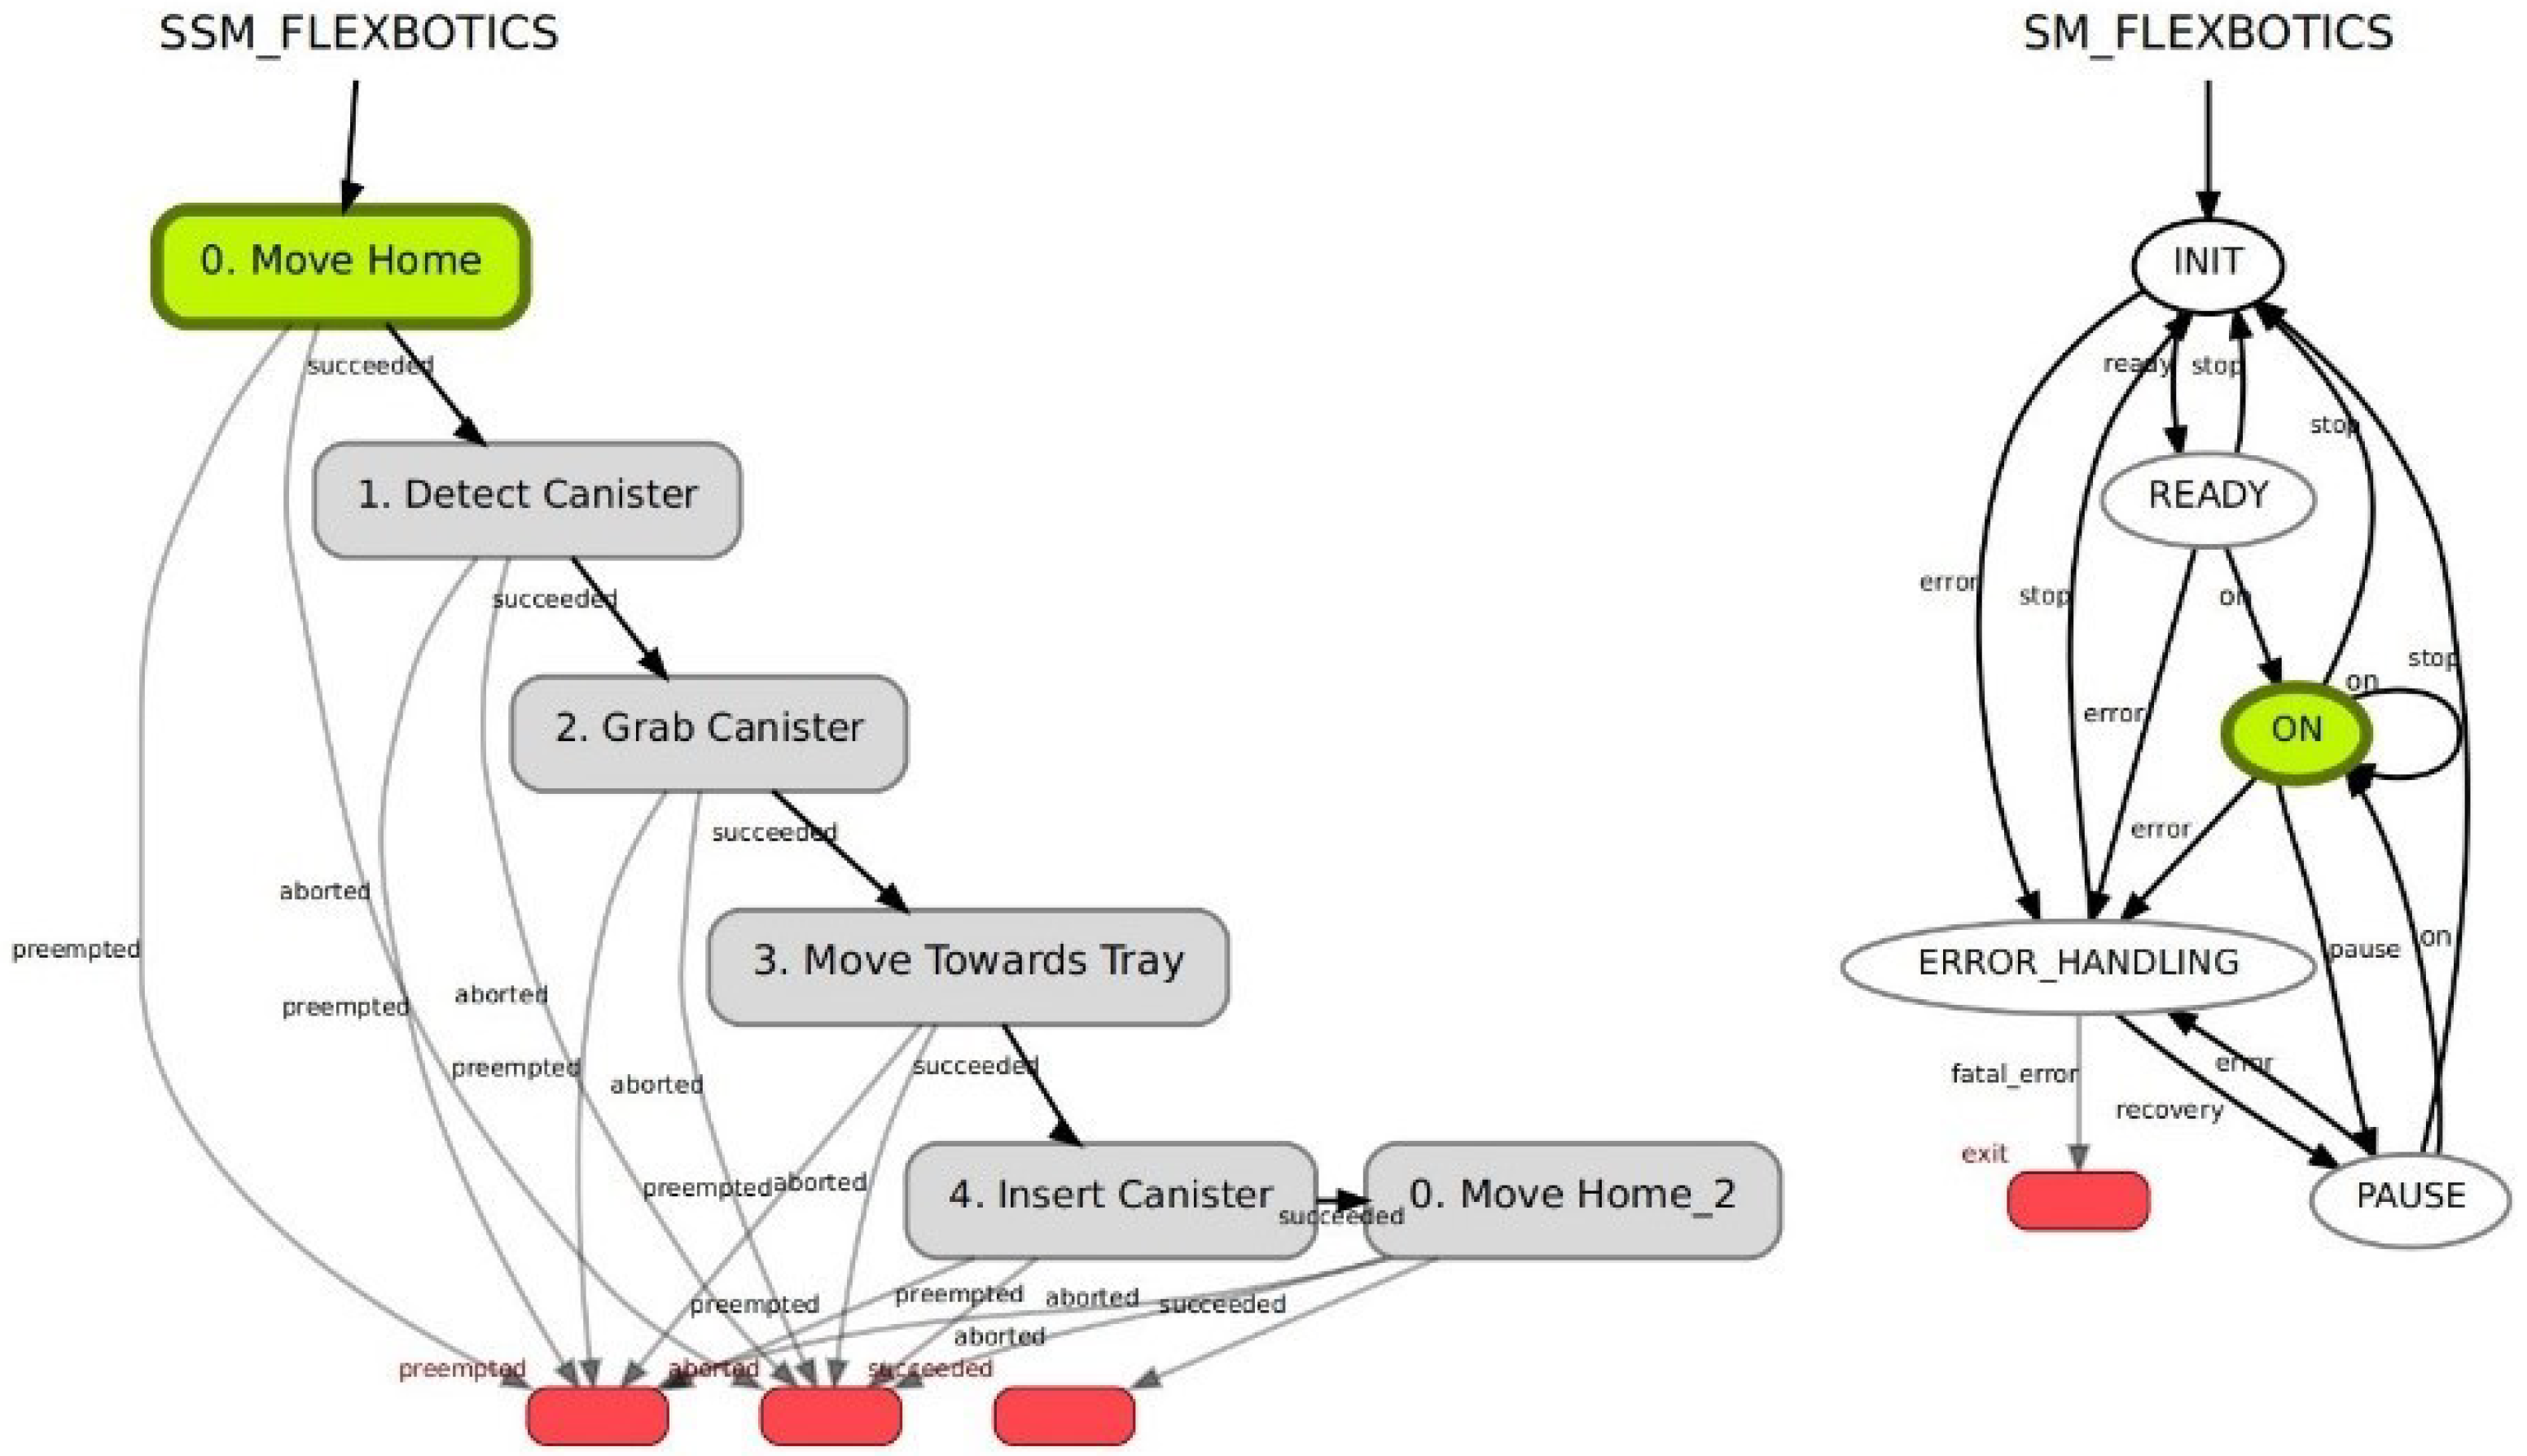
AMR missions are generated by the DT and sent to the vehicle using MQTT over 5G wireless communications through a <CommandMessage> message. The <CommandMessage> message and other message types exchanged between the DT and the AMR are defined using Smart Data Models [32]. Autonomous missions are managed through TECNALIA’s Flexbotics Execution Manager (FEM) [33], which is based on a Finite State Machine (FSM) architecture. FEM is responsible for executing “.process” files—YAML-formatted documents that define a sequence of skills or actions to be performed by the robot. These files are parsed and executed sequentially, enabling flexible and robust mission control. The FSM structure allows for real-time management of execution states, including the ability to pause, resume, stop, and handle errors dynamically.
The actual execution of missions is carried out using Smach State Machines (SSMs) [34], which are generated automatically from the <CommandMessage> inputs received from the DT. Each message received triggers the creation of a YAML file containing the specific sequence of actions required to complete the mission. This modular and automated approach ensures seamless integration between high-level mission planning and low-level robotic execution. Figure 12 shows a generic example of the two-state-machine structure of the FEM, with one FSM controlling the execution of different missions (start, end, and error handling) and an SSM controlling mission execution.
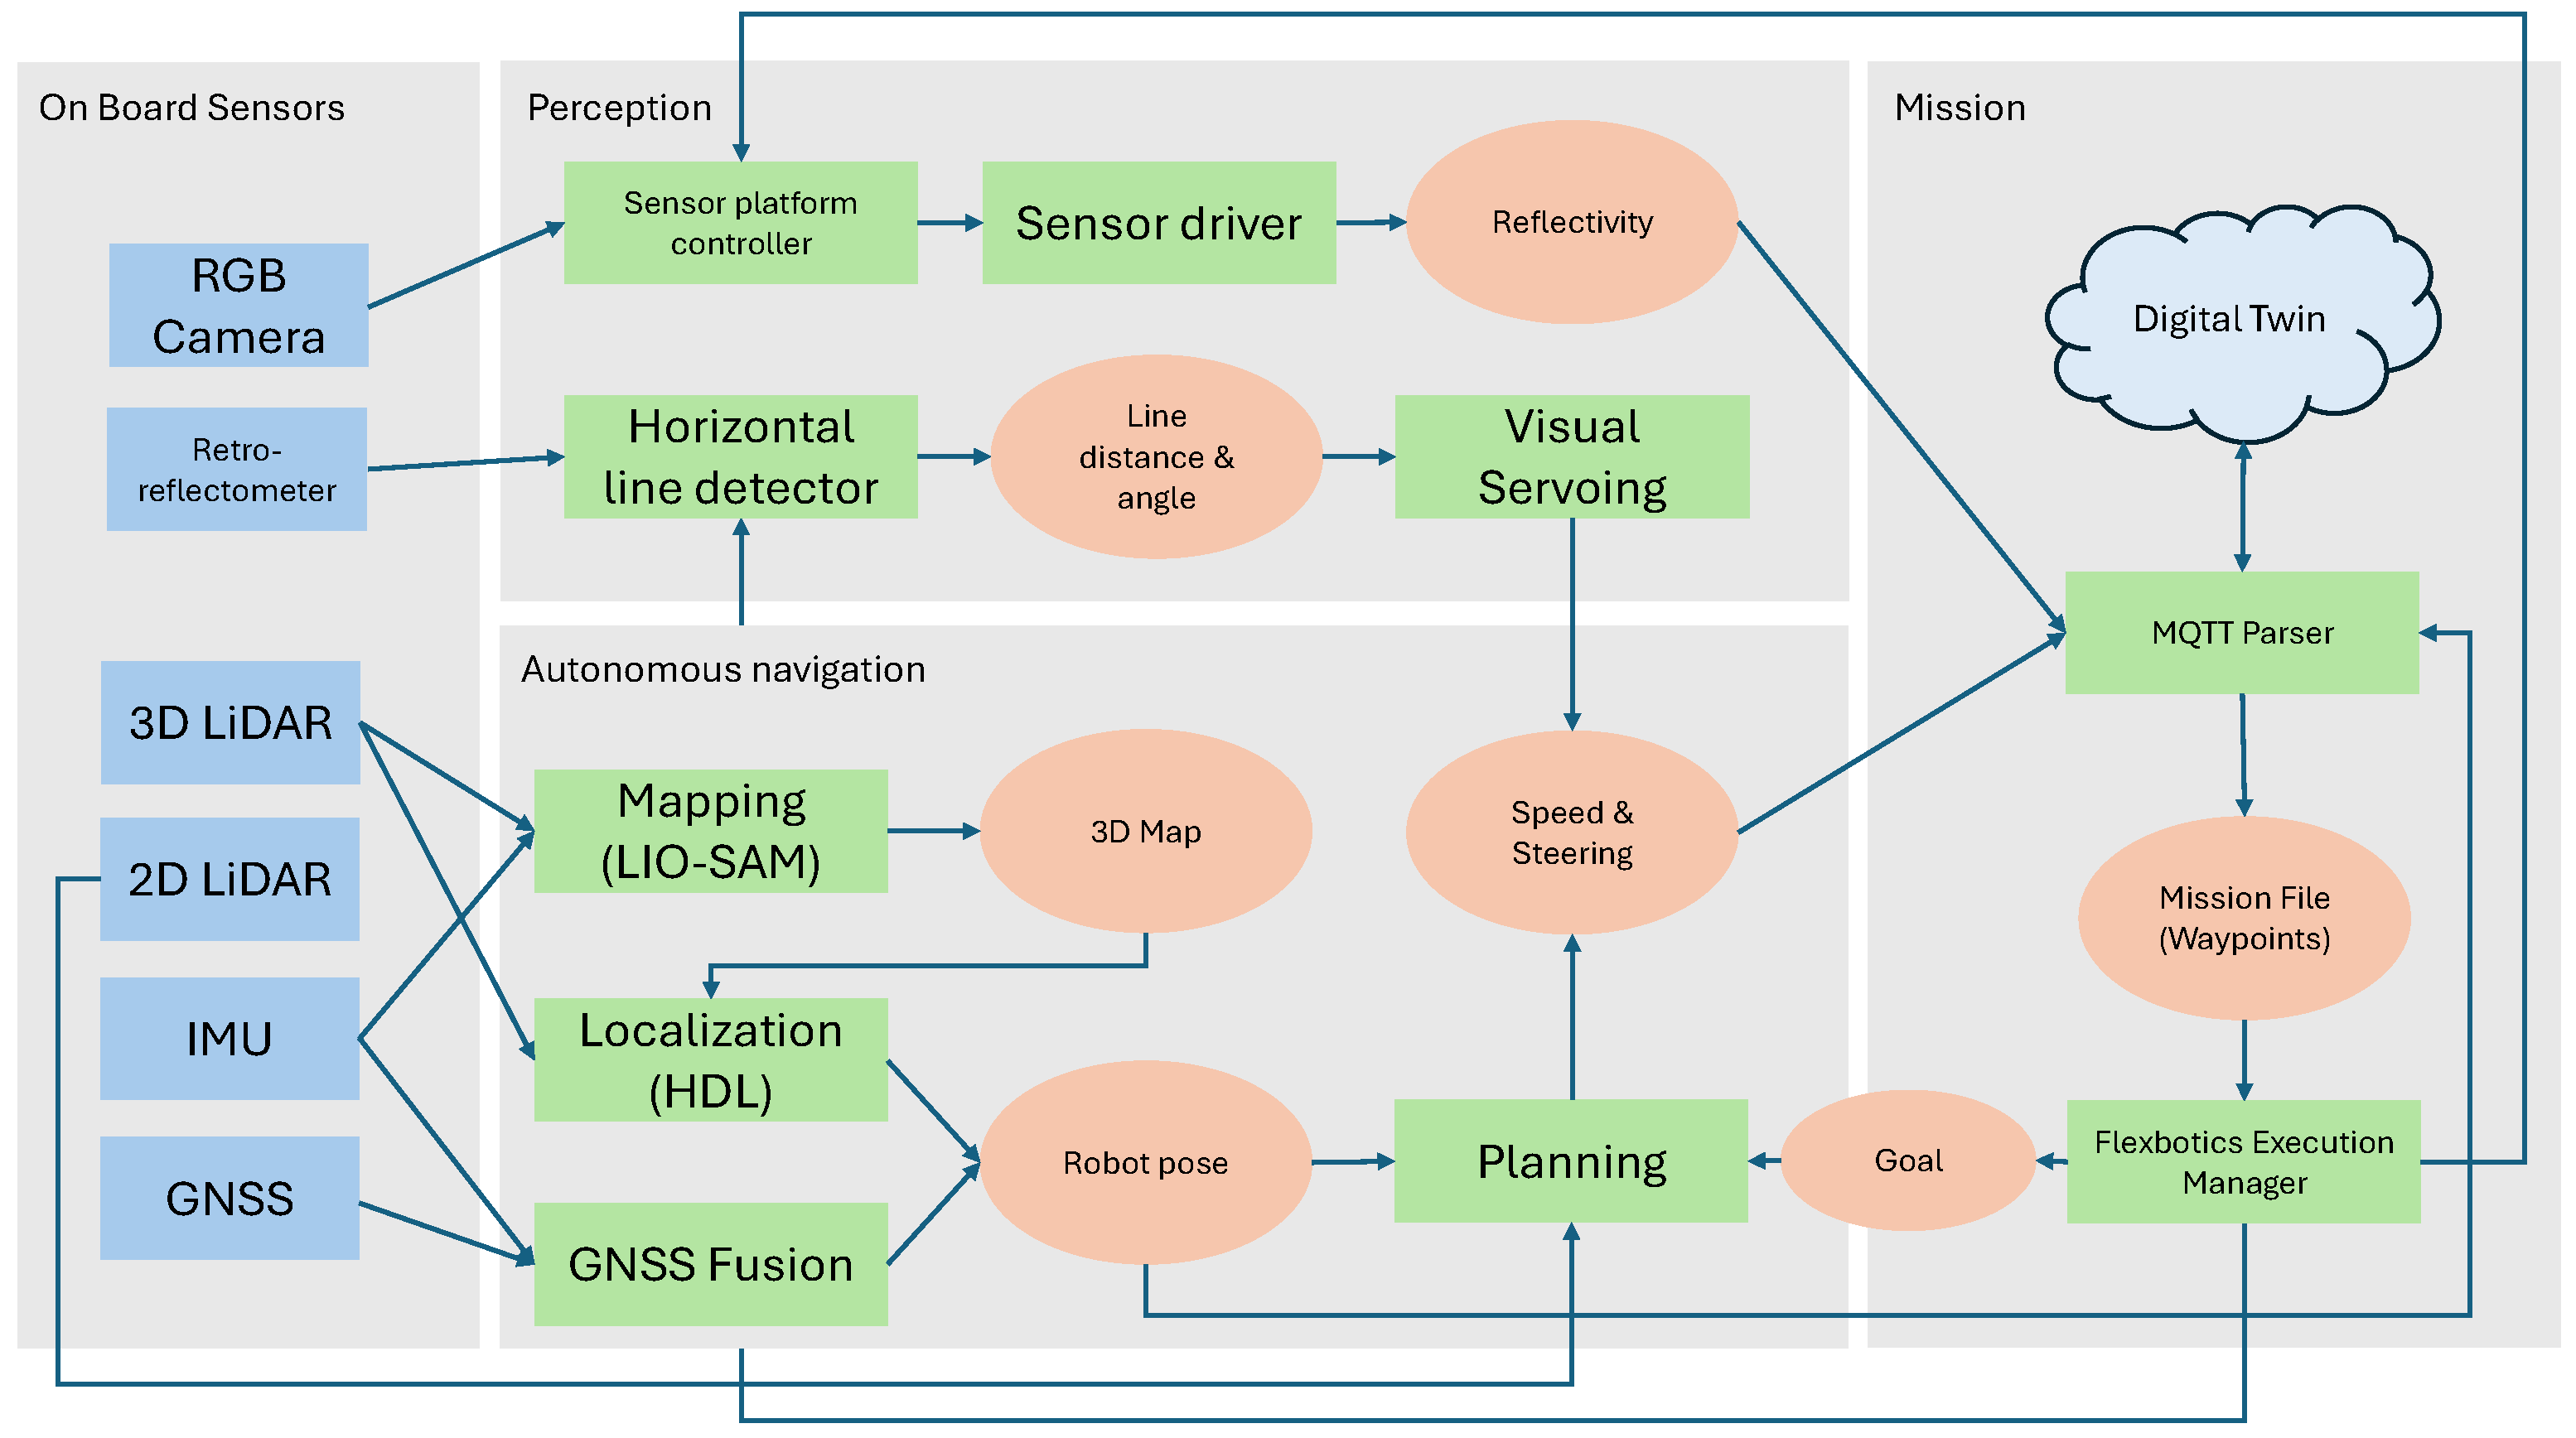
For visual reference, Figure 13 shows a diagram of the main modules of the system architecture described in this section.

4. Case Study: Application in Road Maintenance

4.1. Study Area

As a case study, a field demonstration was carried out on a highway in Italy. Italian road maintenance and inspection practices for highways follow the highest standards and are governed by the Codice della Strada [35] and technical standards such as UNI EN 1436 [36] and UNI EN 12899-1 [37]. As such, these regulations require regular inspections to ensure the detection of obstacles and debris on the carriageway and that road signs and markings maintain high visibility and retro-reflectivity under all weather and lighting conditions. This type of inspection and maintenance presents an excellent use case for the proposed approach. As stated previously, current inspection methods involve manual checks and the use of manual and dynamic vehicle-based retro-reflectometers to assess both horizontal and vertical signage. However, these processes are labour-intensive, fragmented, and often limited by human factors such as fatigue and environmental conditions, which can affect the accuracy and frequency of inspections. Additionally, the current lack of centralised data integration hinders predictive maintenance and efficient planning.
The proposed use case study will involve all the elements of the presented system:
  • An AMR for autonomous horizontal marking retro-reflectivity assessment.
  • A UAV for road obstacle detection, roadside vegetation detection, and vertical signage retro-reflectivity assessment.
  • A DT for gathering and presenting data to operators, enabling them to manage maintenance and inspection tasks.
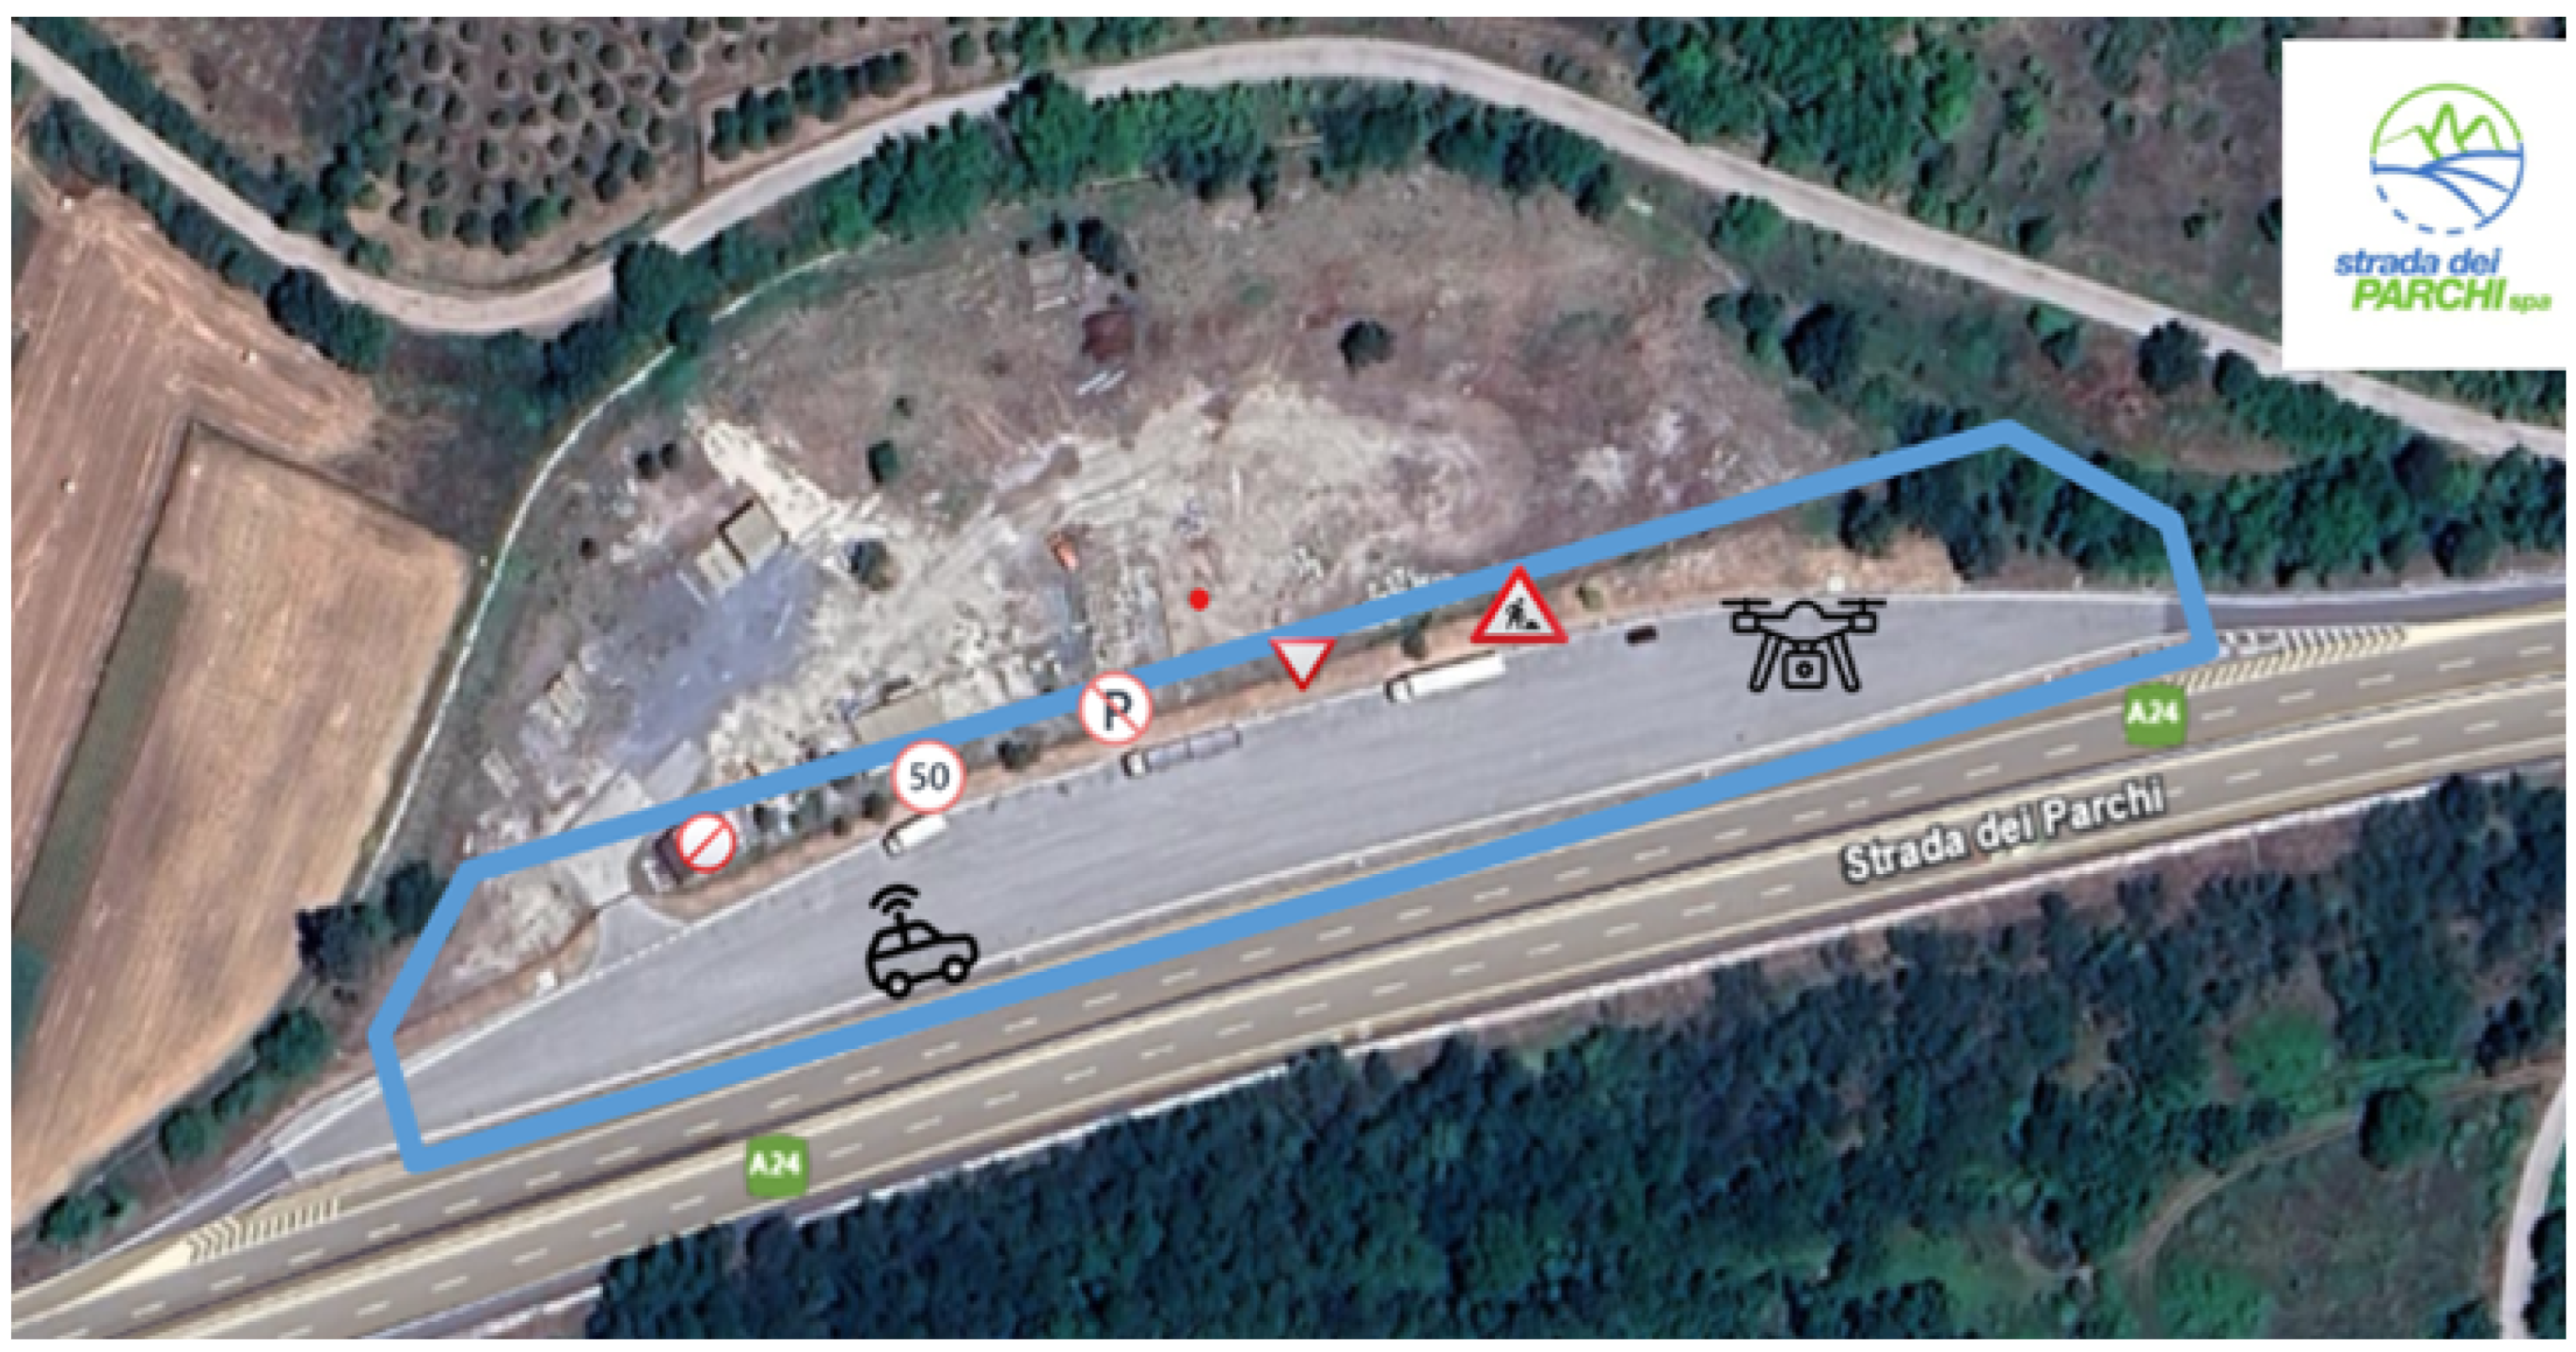
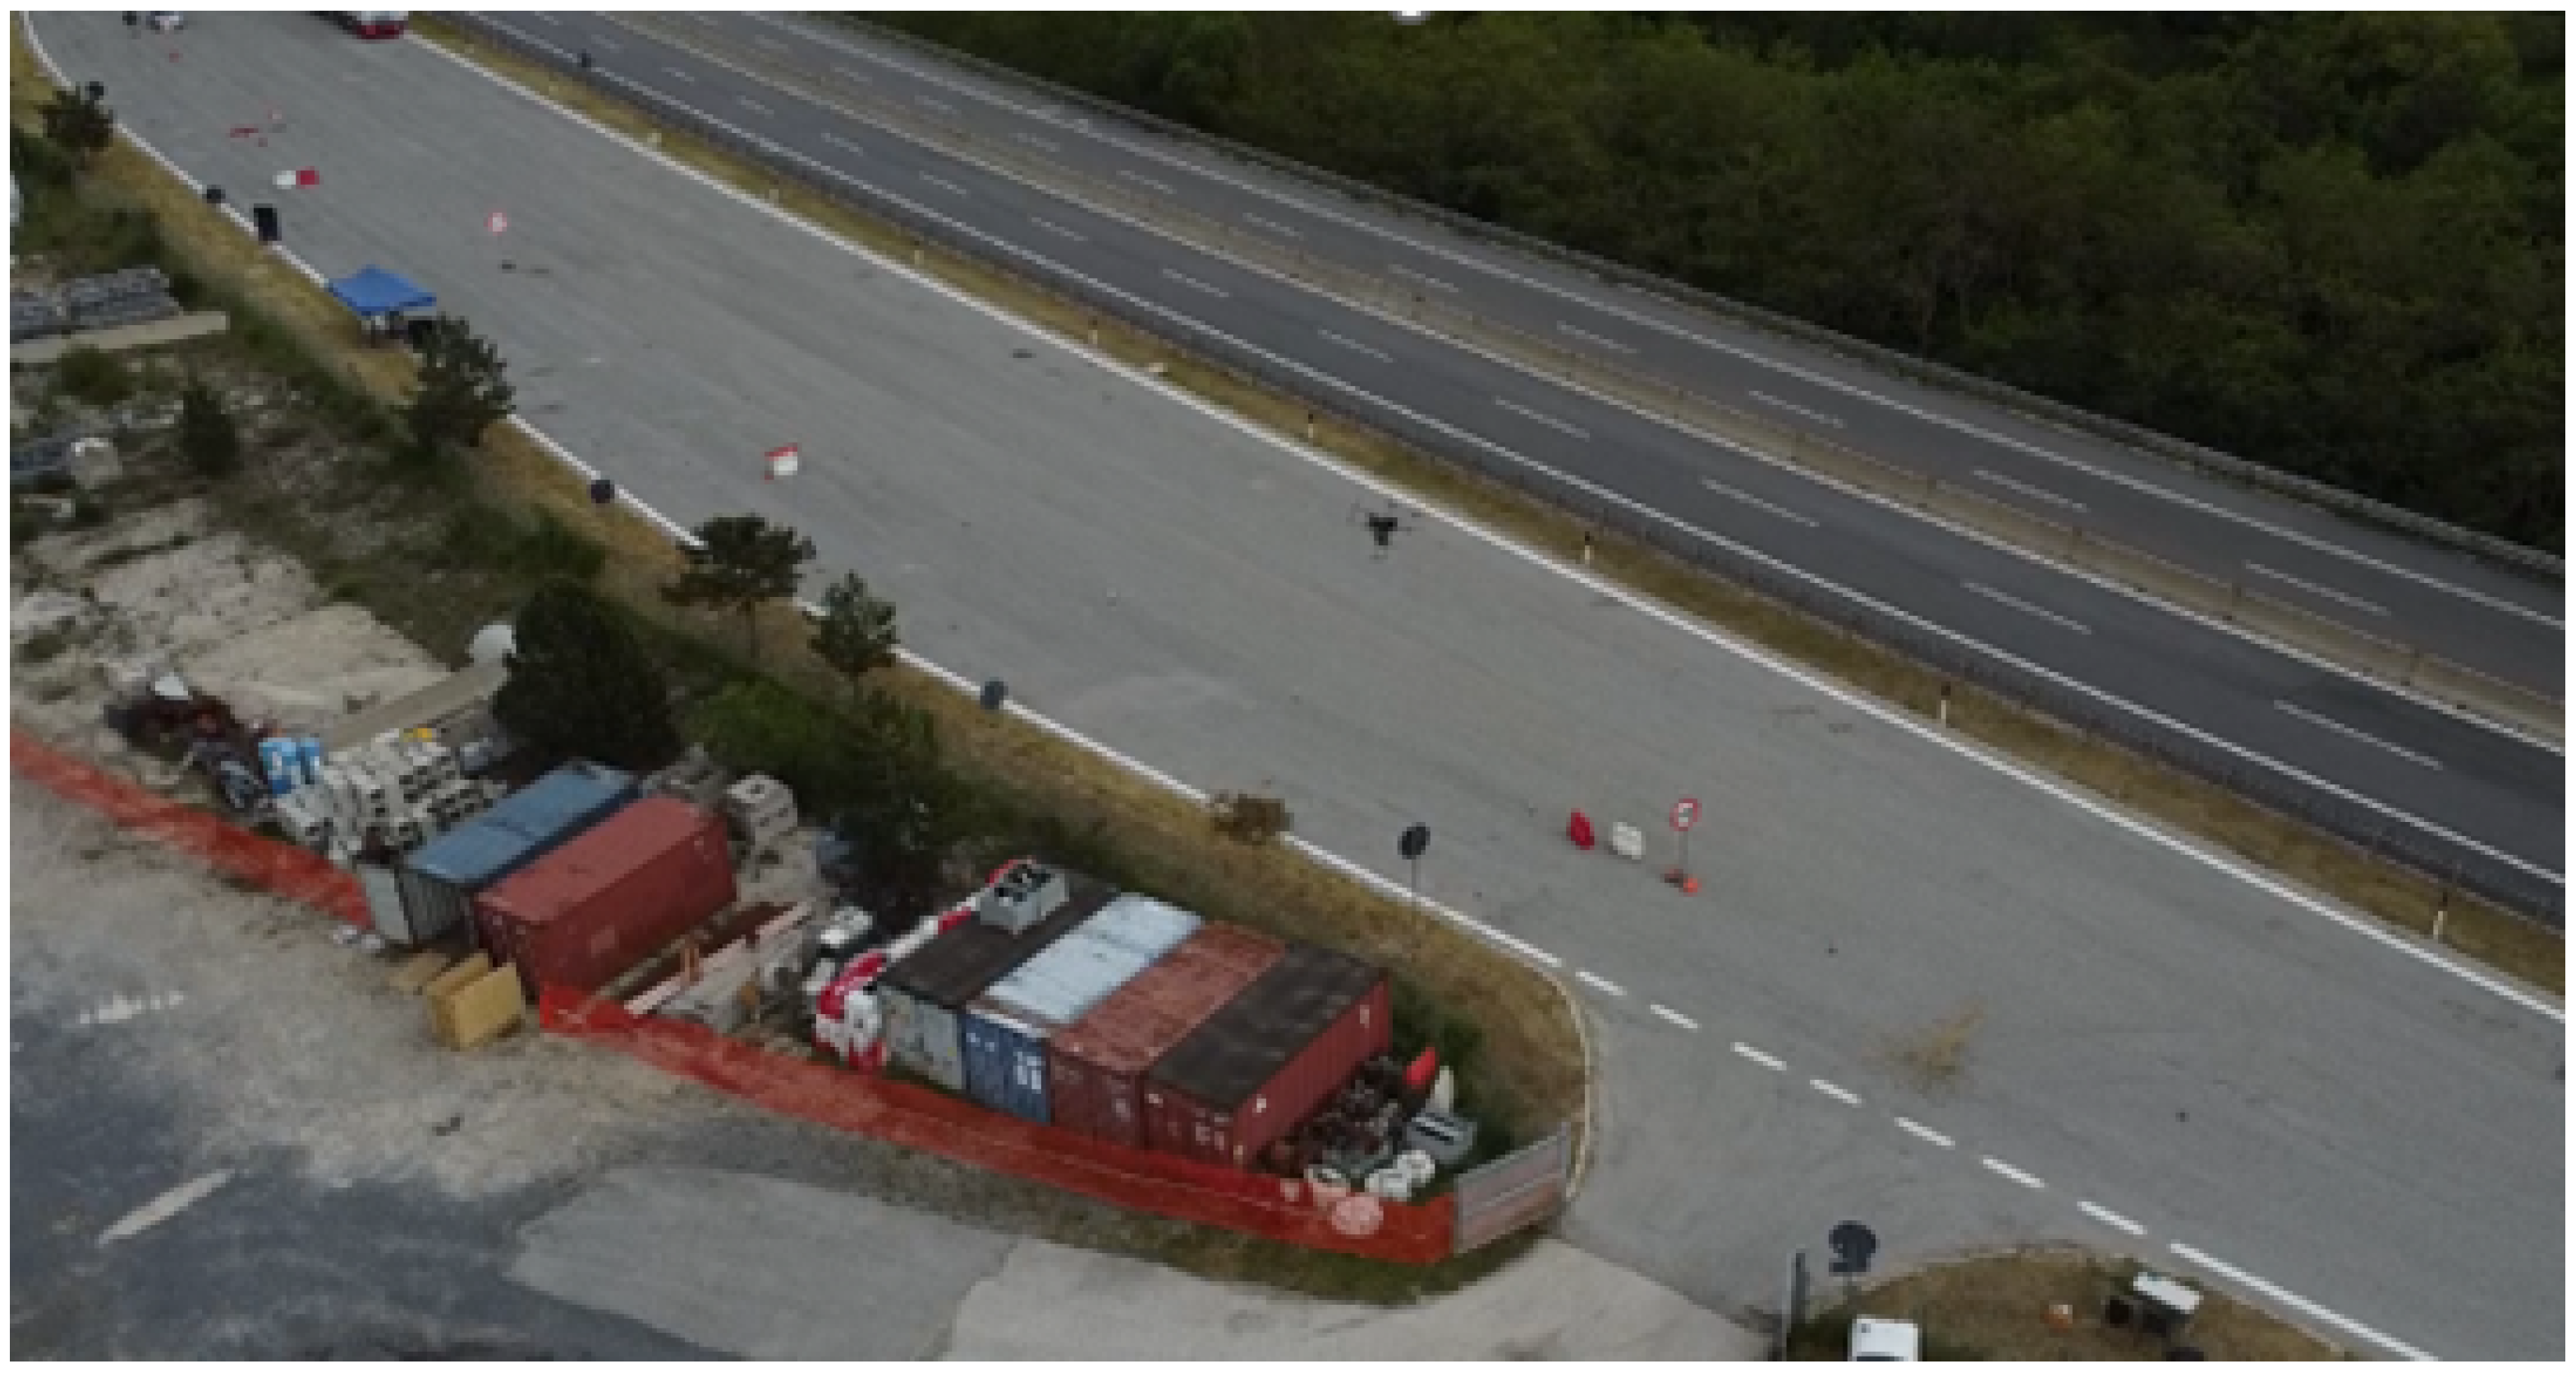
To carry out the case study, the project’s partner and motorway operator, Strada dei Parchi, authorised the use of the Gran Sasso Nord parking lot (42°23′14″ N, 13°27′35″ E) on the A24 highway. A section of approximately 200 × 10 m of the parking lot was closed to traffic to allow safe operation, simulating a single-carriageway road. Several vertical signs were also installed (Figure 14).
The demonstrator aimed to reproduce a standard inspection and maintenance procedure, following five steps:
  • Select the road section to be inspected and plan the autonomous agents’ routes using the DT’s tools.
  • Deploy the UAV over the defined section to detect vegetation and obstacles and to assess vertical signs. Acquired data are uploaded to the DT.
  • Deploy the AMR with a list of points or horizontal markings to inspect. Acquired measurements are uploaded to the DT.
  • Analyse the uploaded data, validating retro-reflectivity measurements, identifying vegetation and obstacles, and assessing KPIs.
  • Update the maintenance status with the newly acquired data.

4.2. System Deployment

4.2.1. Aerial Robot Deployment

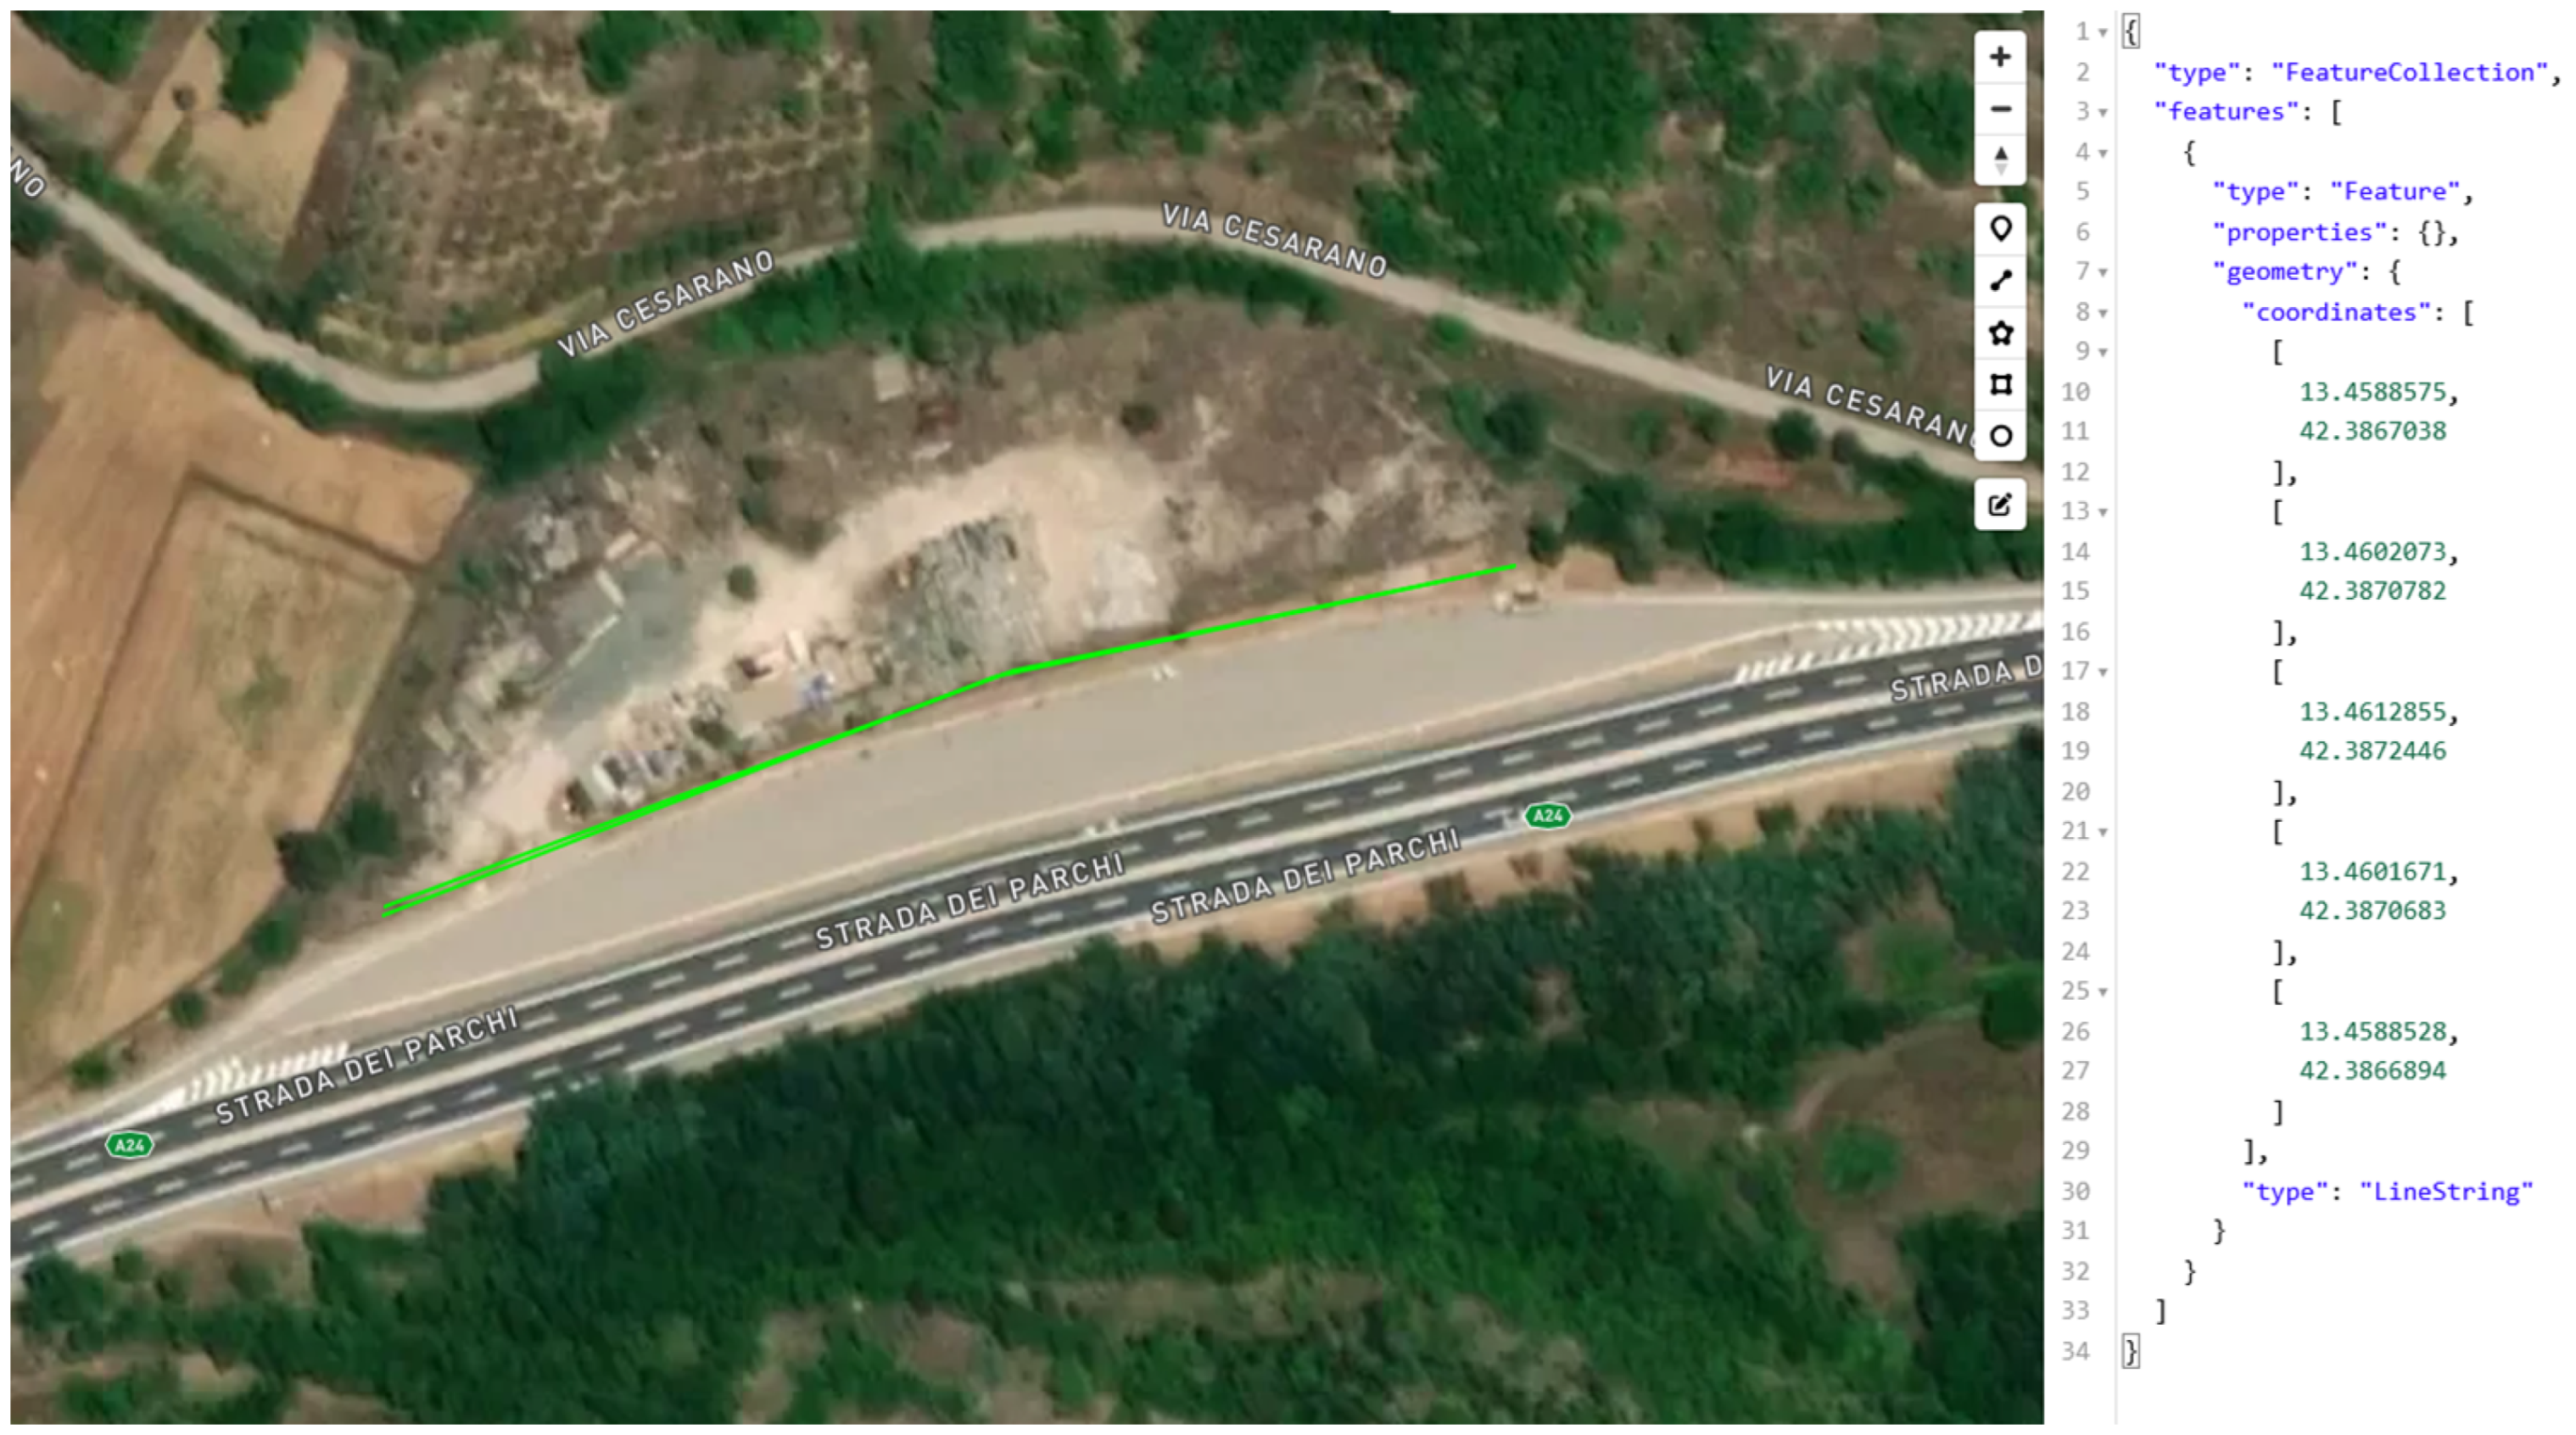
Of the steps defined above, the aerial robot will be involved in the first two. In the first step, the operator will generate the route over the area to be inspected, along with a series of optional low-level parameters such as the orientation of the inspection gimbal, the drone’s speed, and the flight height. After that, the route—defined in standard GeoJSON format—will be loaded onto the aerial robot via the digital twin. An example of a route and the associated GeoJSON is shown in Figure 15. To initiate step 2, the autonomous inspection by the UAV, the start trigger will also be sent via the same interface. Once the mission has been completed autonomously, from start to finish, the captured data will be uploaded to the DT.
A simplified diagram of the UAV´s operation can be seen in Figure 16.

4.2.2. AMR Deployment

The tasks carried out by the AMR correspond mainly to step 3 of the workflow: the operation of the autonomous inspection vehicle to measure the retro-reflectivity of horizontal road markings and the transmission of results to the DT database. In addition, the data produced by the vehicle contribute to step 4 (validation of reflectivity analyses) and are consolidated in step 5 (updating of the overall maintenance status).
The testing of the AMR in the use case focused on the following aspects:
  • Testing the autonomous localisation and navigation capabilities for both systems, based on 3D maps and GPS + inertial data.
  • Testing the bidirectional communication with the DT, including the transmission of telemetry and retro-reflectivity measurements to the DT and the reception of missions from it.
  • Testing the system’s capability to effectively measure the retro-reflectivity of horizontal road markings, including accurate sensor positioning over them.
  • Testing the capability to autonomously complete missions composed of several arbitrary measurement locations.
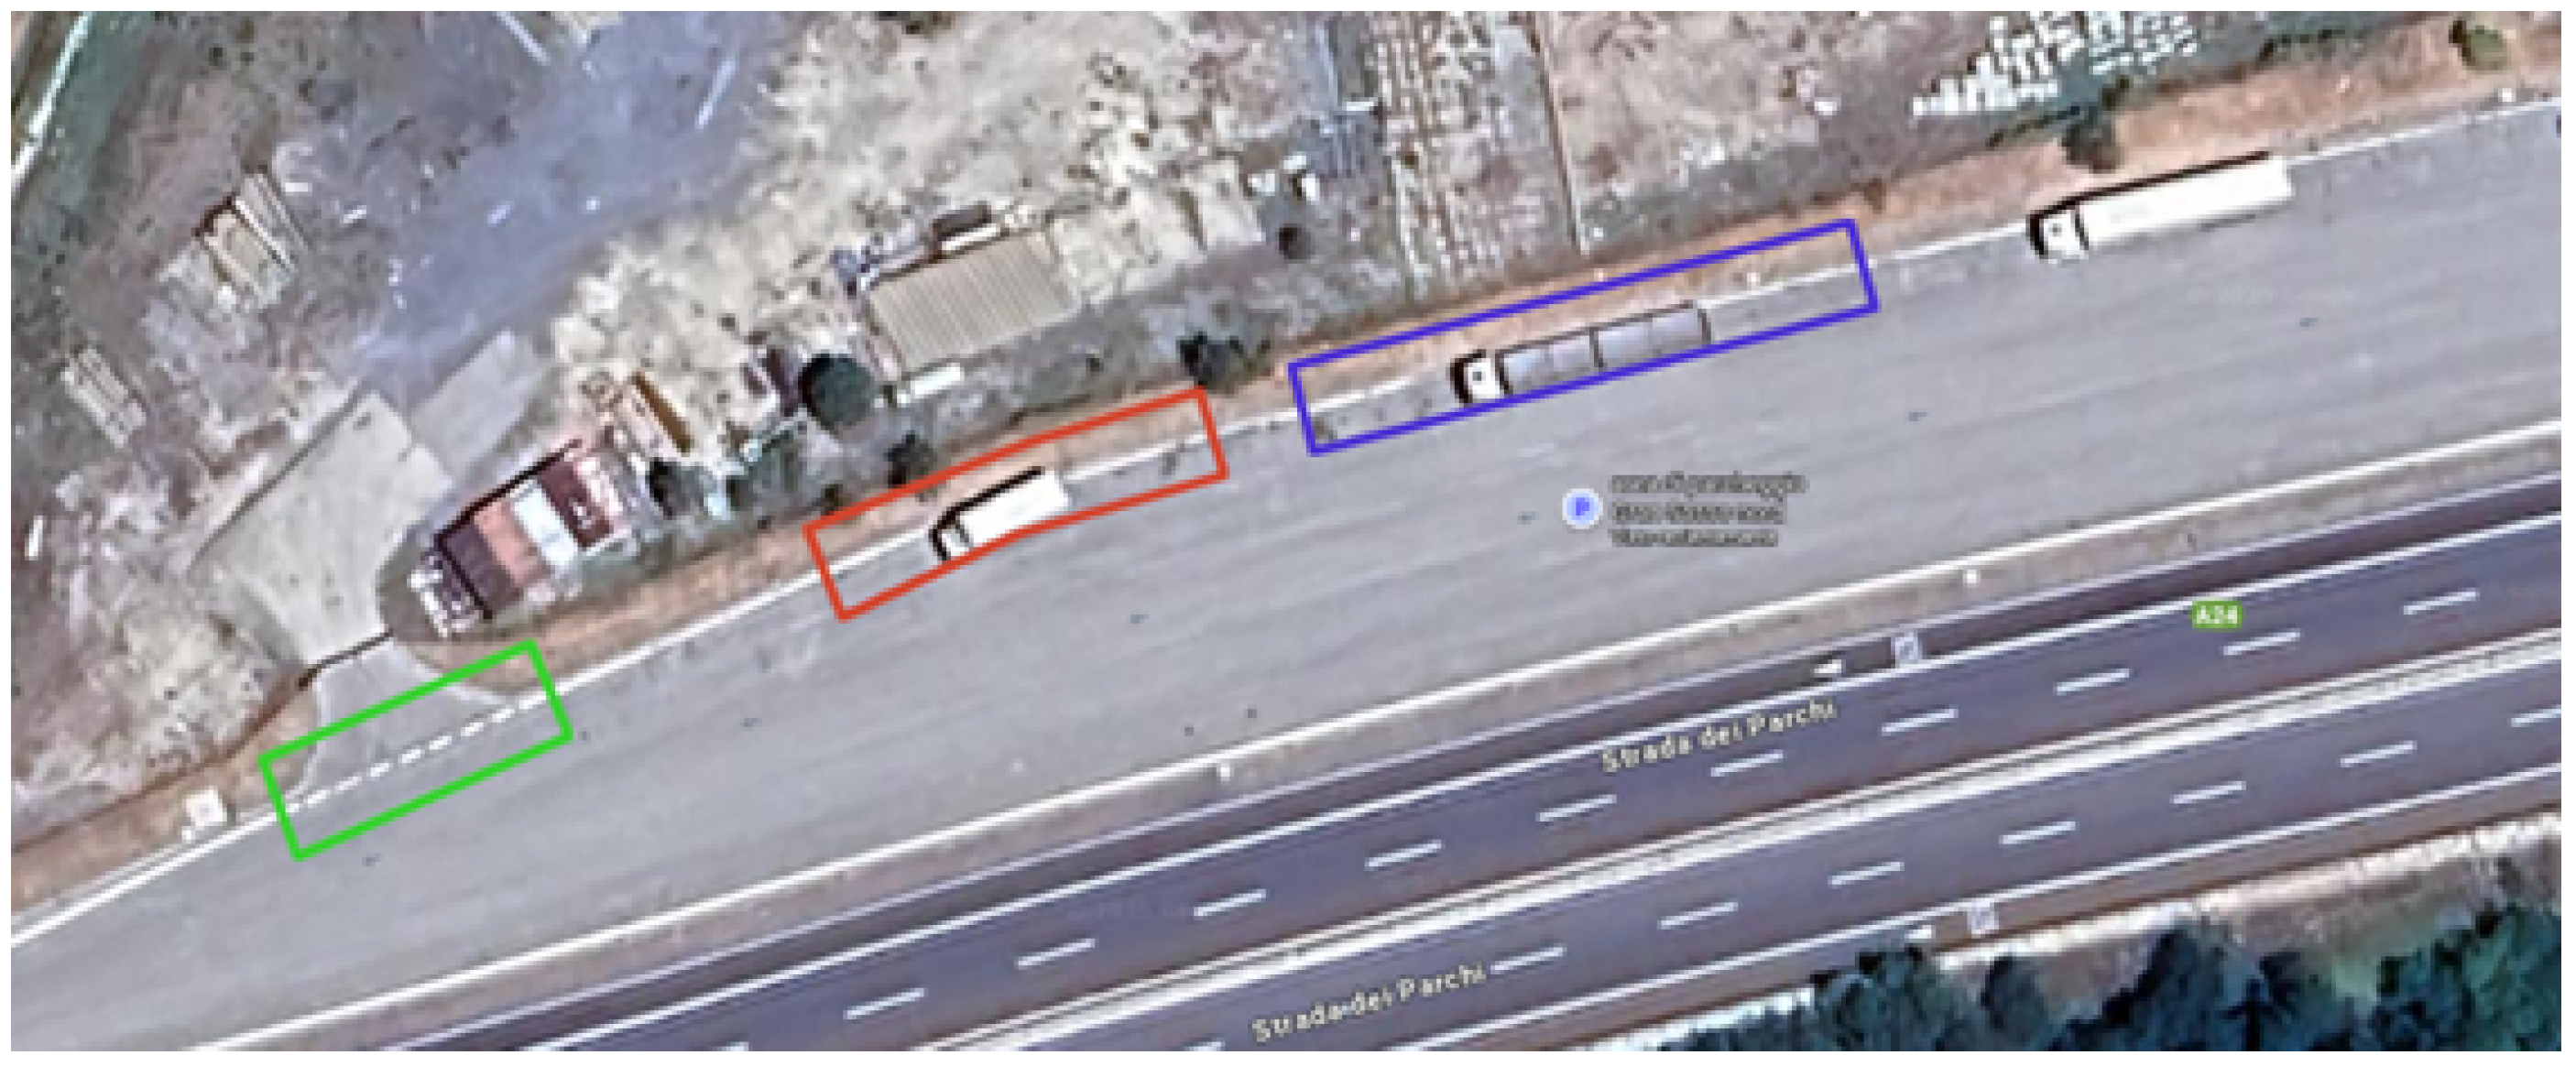
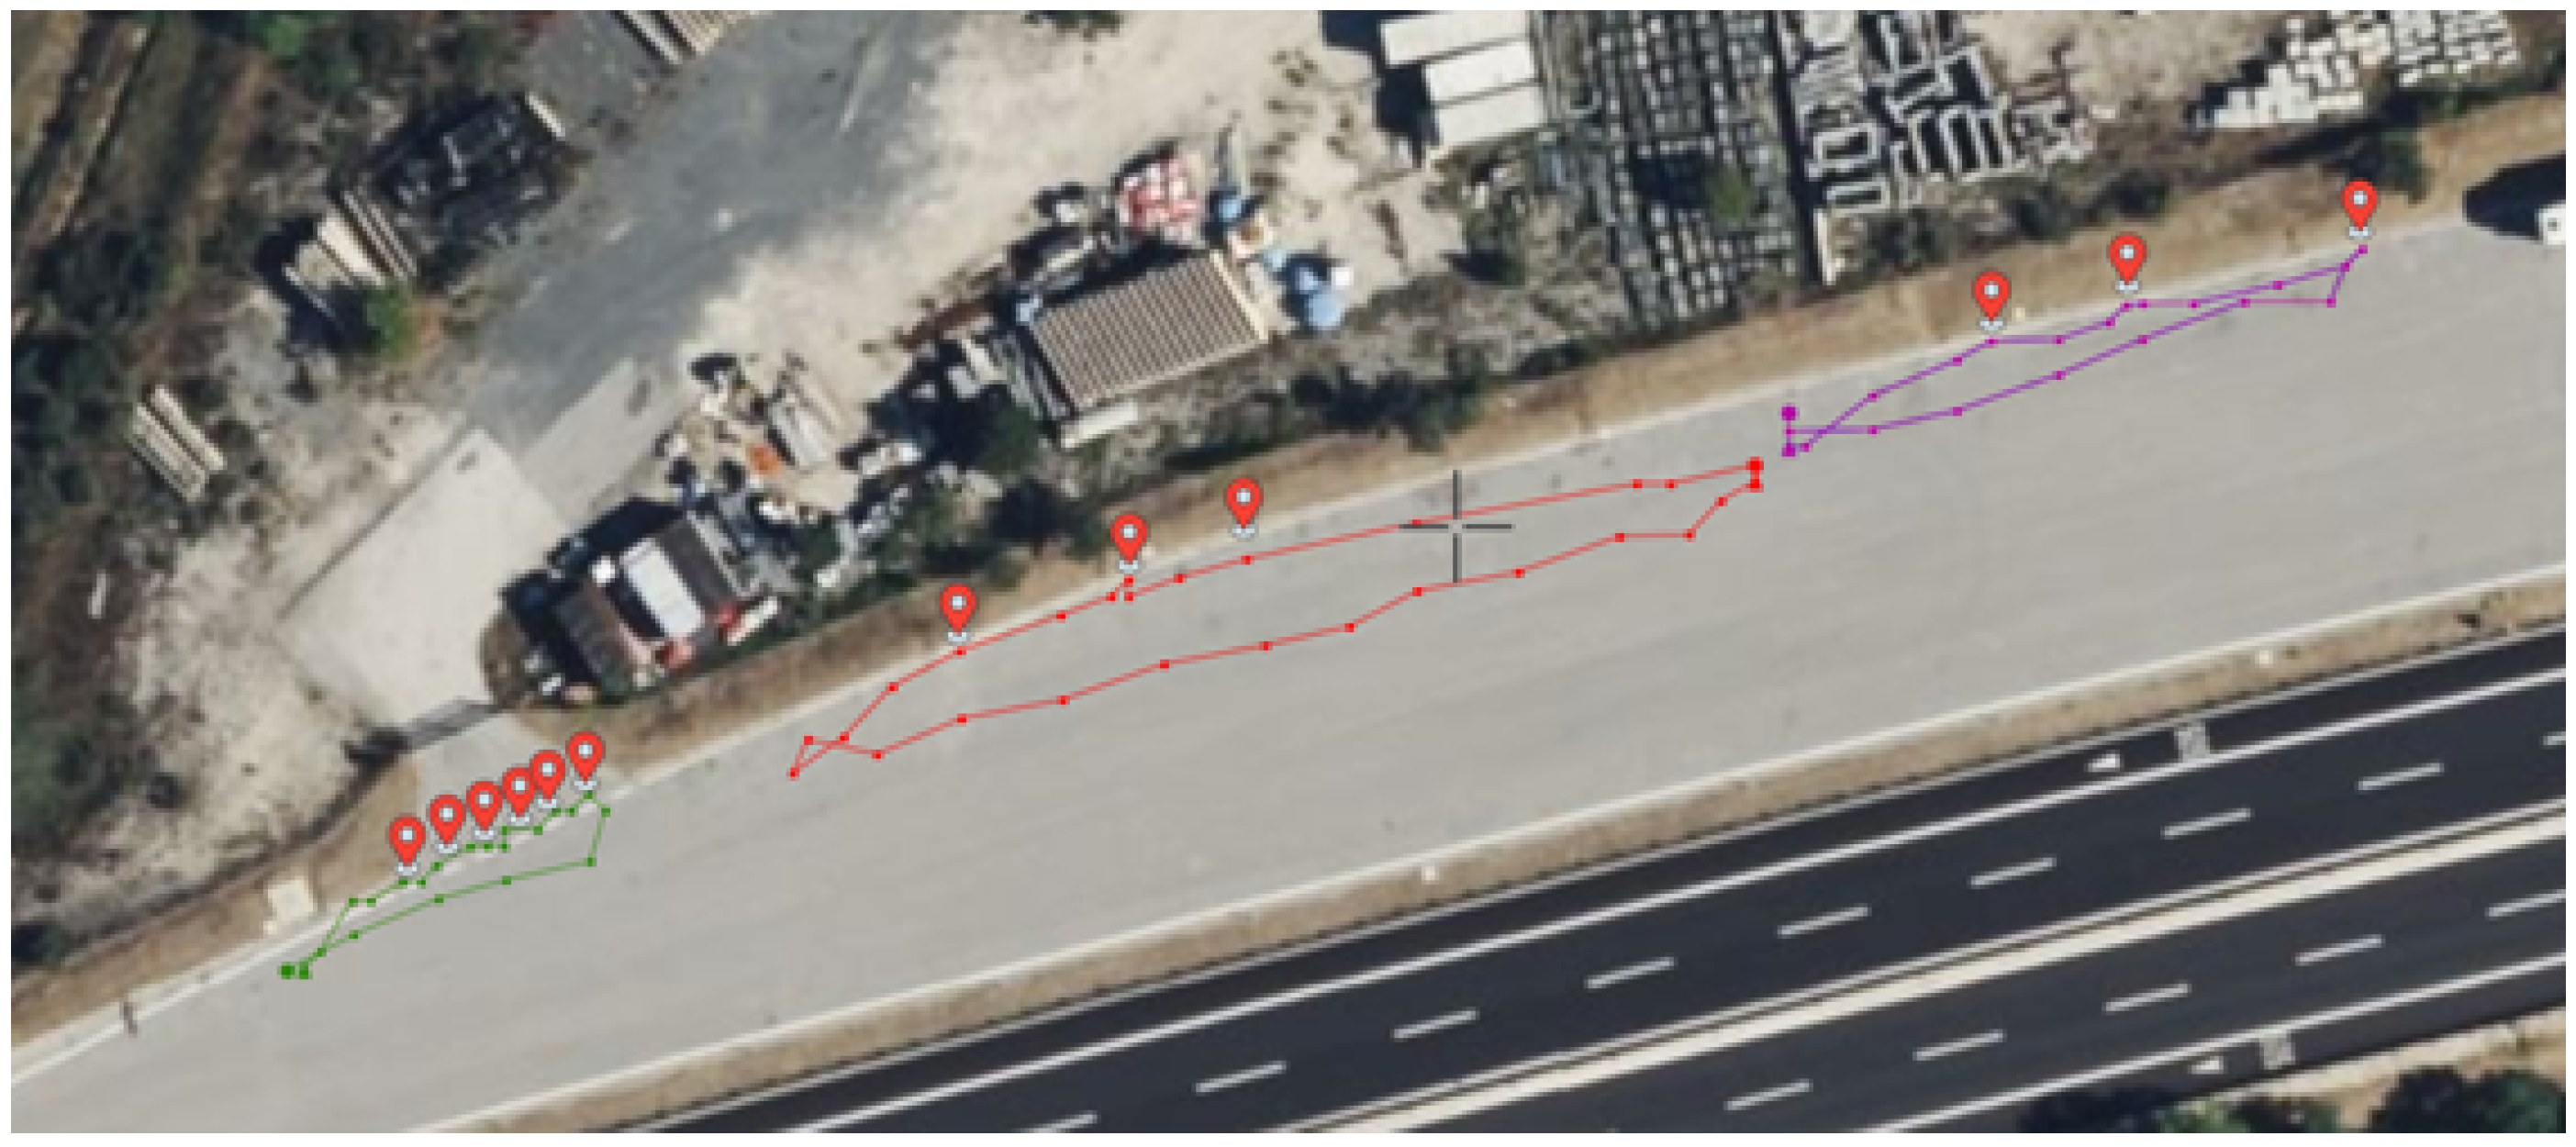
To carry out these tests, three mission types were defined in the available area (Figure 17):
  • A mission measuring several points in a continuous line along a straight section of the road.
  • A mission measuring several points in a continuous line along a curved section of the road.
  • A mission measuring a discontinuous-line section.
In each mission area, the GPS-RTK coordinates of several points were acquired. In the case of the discontinuous-line section, the position of each line segment was recorded. These points were used to create missions for each area.
In each test, the AMR would start at an arbitrary position in the testing area. After receiving a mission through the DT, it would navigate sequentially to each of the positions provided in the mission. Once it reached the goal, it would detect the horizontal marking (line), align the sensor with it, deploy the retro-reflectometer, take a measurement, and transmit it to the DT. After completing the measurement, the AMR would navigate to the next point and repeat the process until all points in the mission had been measured. Figure 18 shows the location of the recorded measurement points, along with sample paths followed by the AMR for each mission.

4.3. Technical Results

This section will summarise the main technical results of the deployment of the autonomous agents in the demonstrator scenario.

4.3.1. UAV Surveillance Results

As described earlier, the complete system was deployed at the Gran Sasso Nord parking area on the A24 motorway near L’Aquila, Italy, in collaboration with the road operator Strada dei Parchi (Figure 19). The test area replicated motorway conditions with authentic asphalt surfaces, regulation road markings (aprox. 500 m), five vertical traffic signs, and strategically placed obstacles (vegetation and debris) to simulate real maintenance scenarios.
Traffic Sign Detection Validation
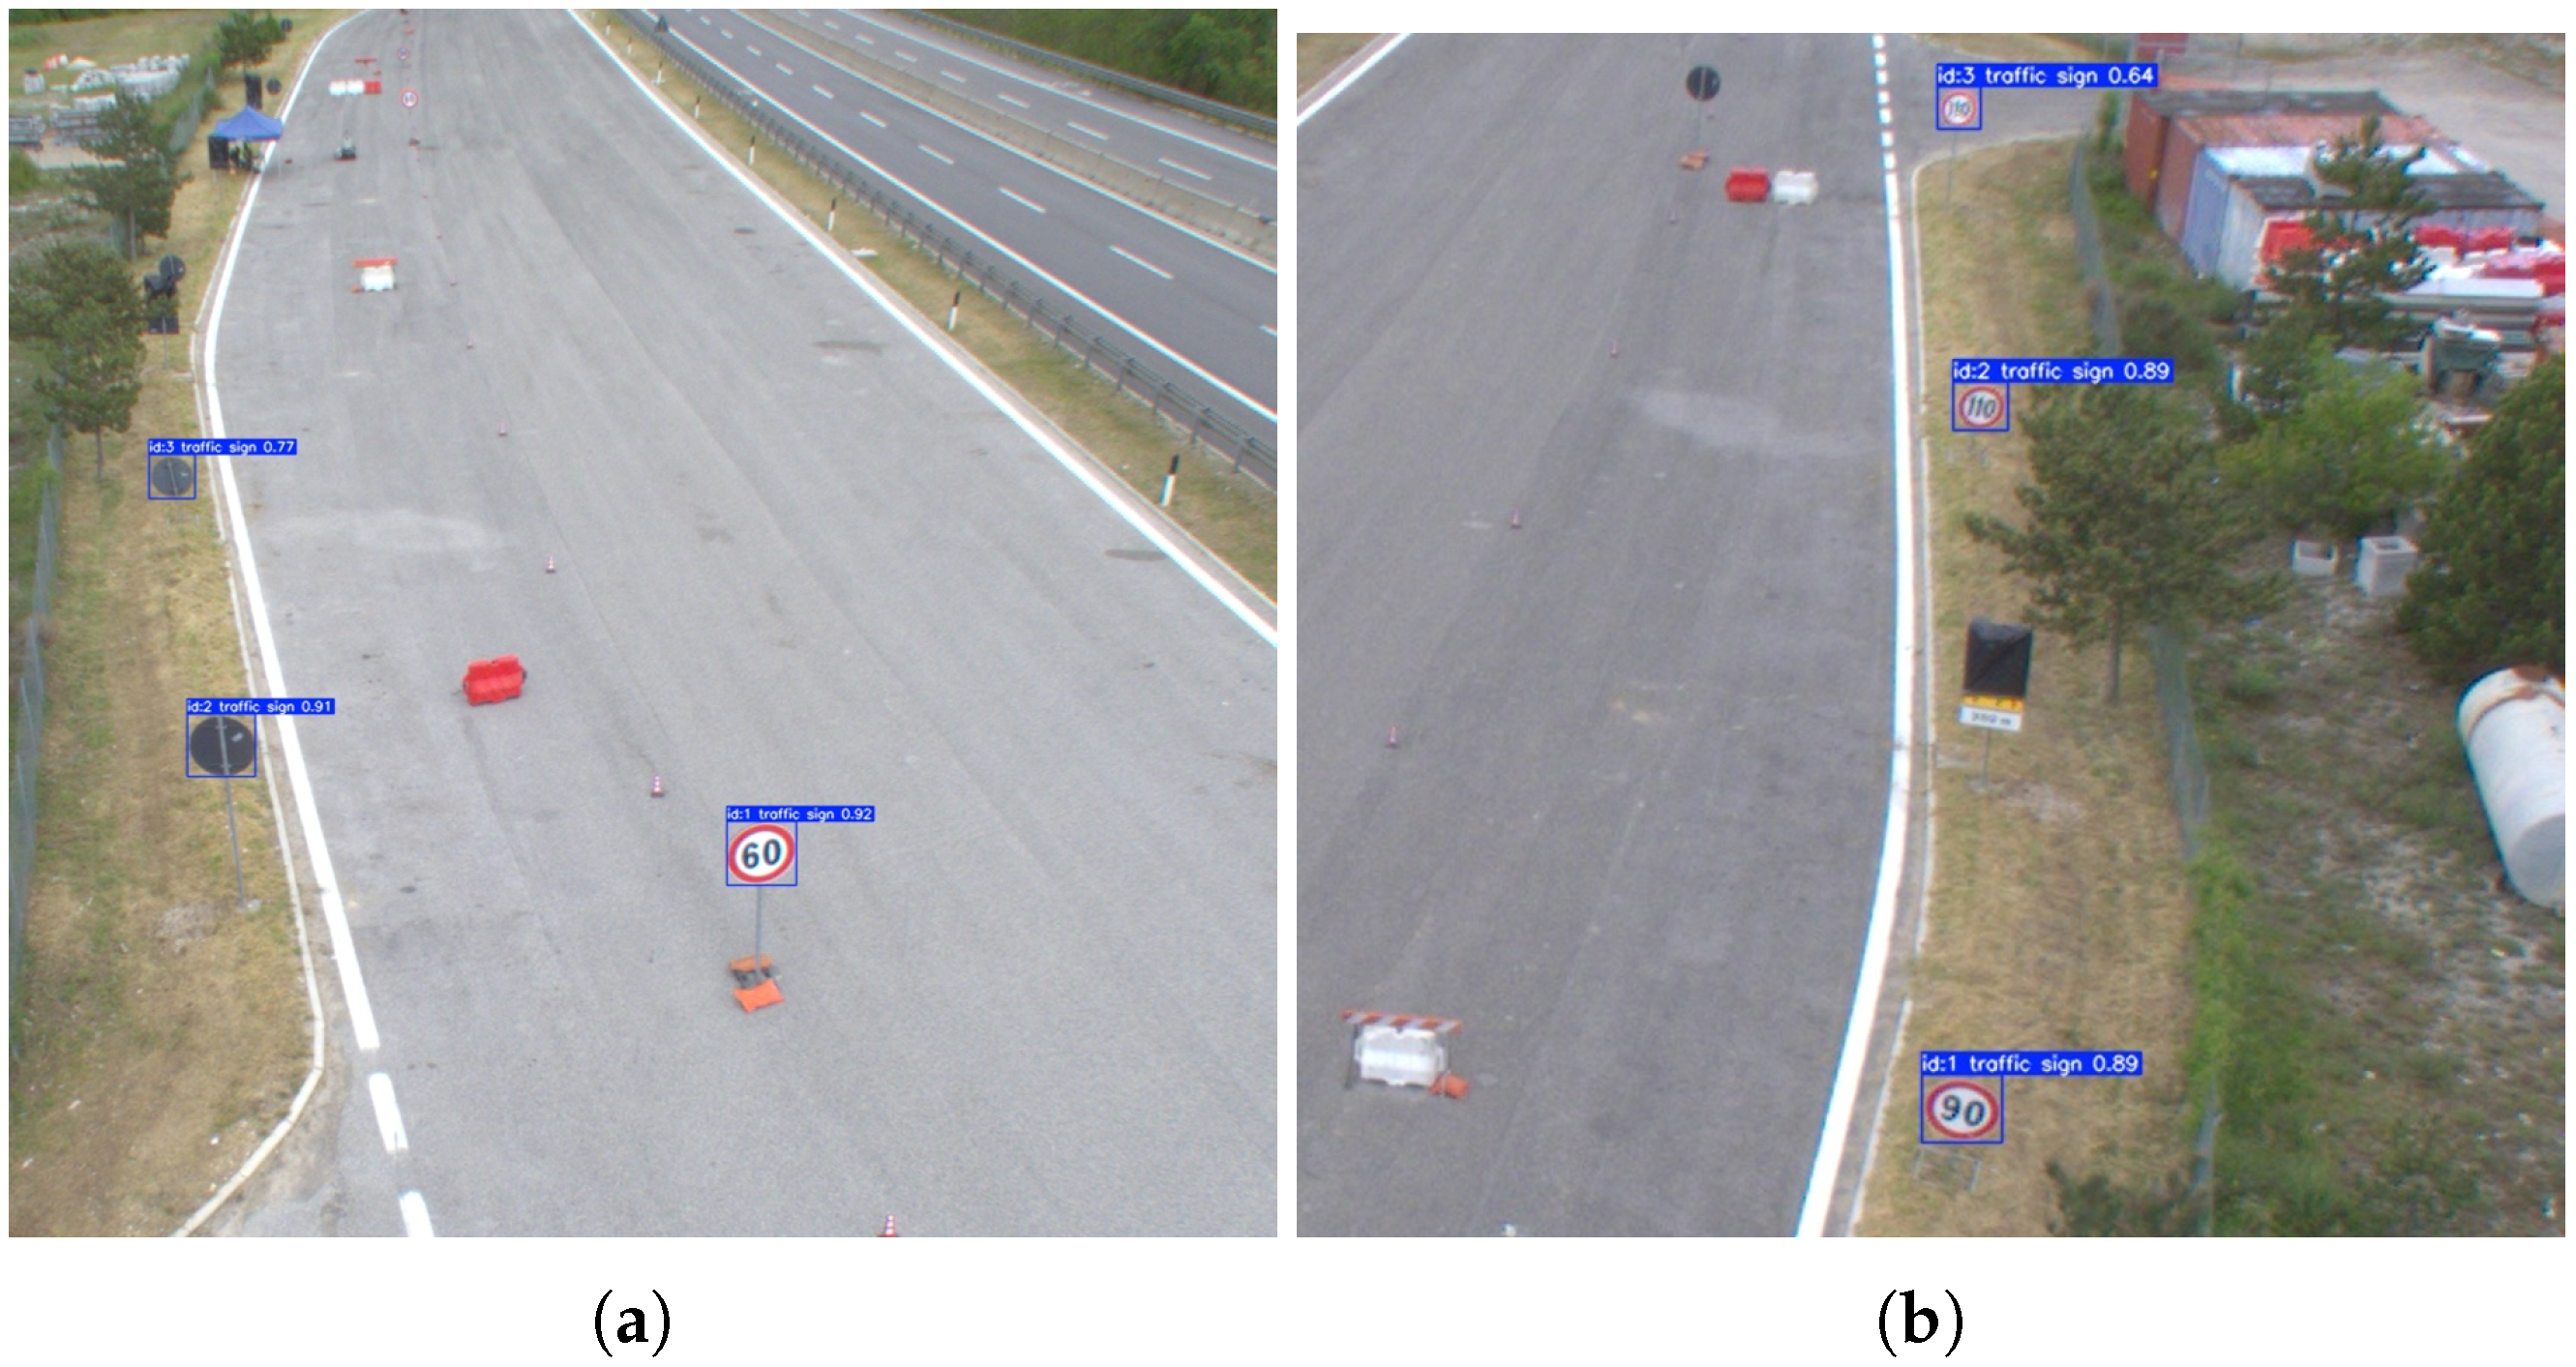
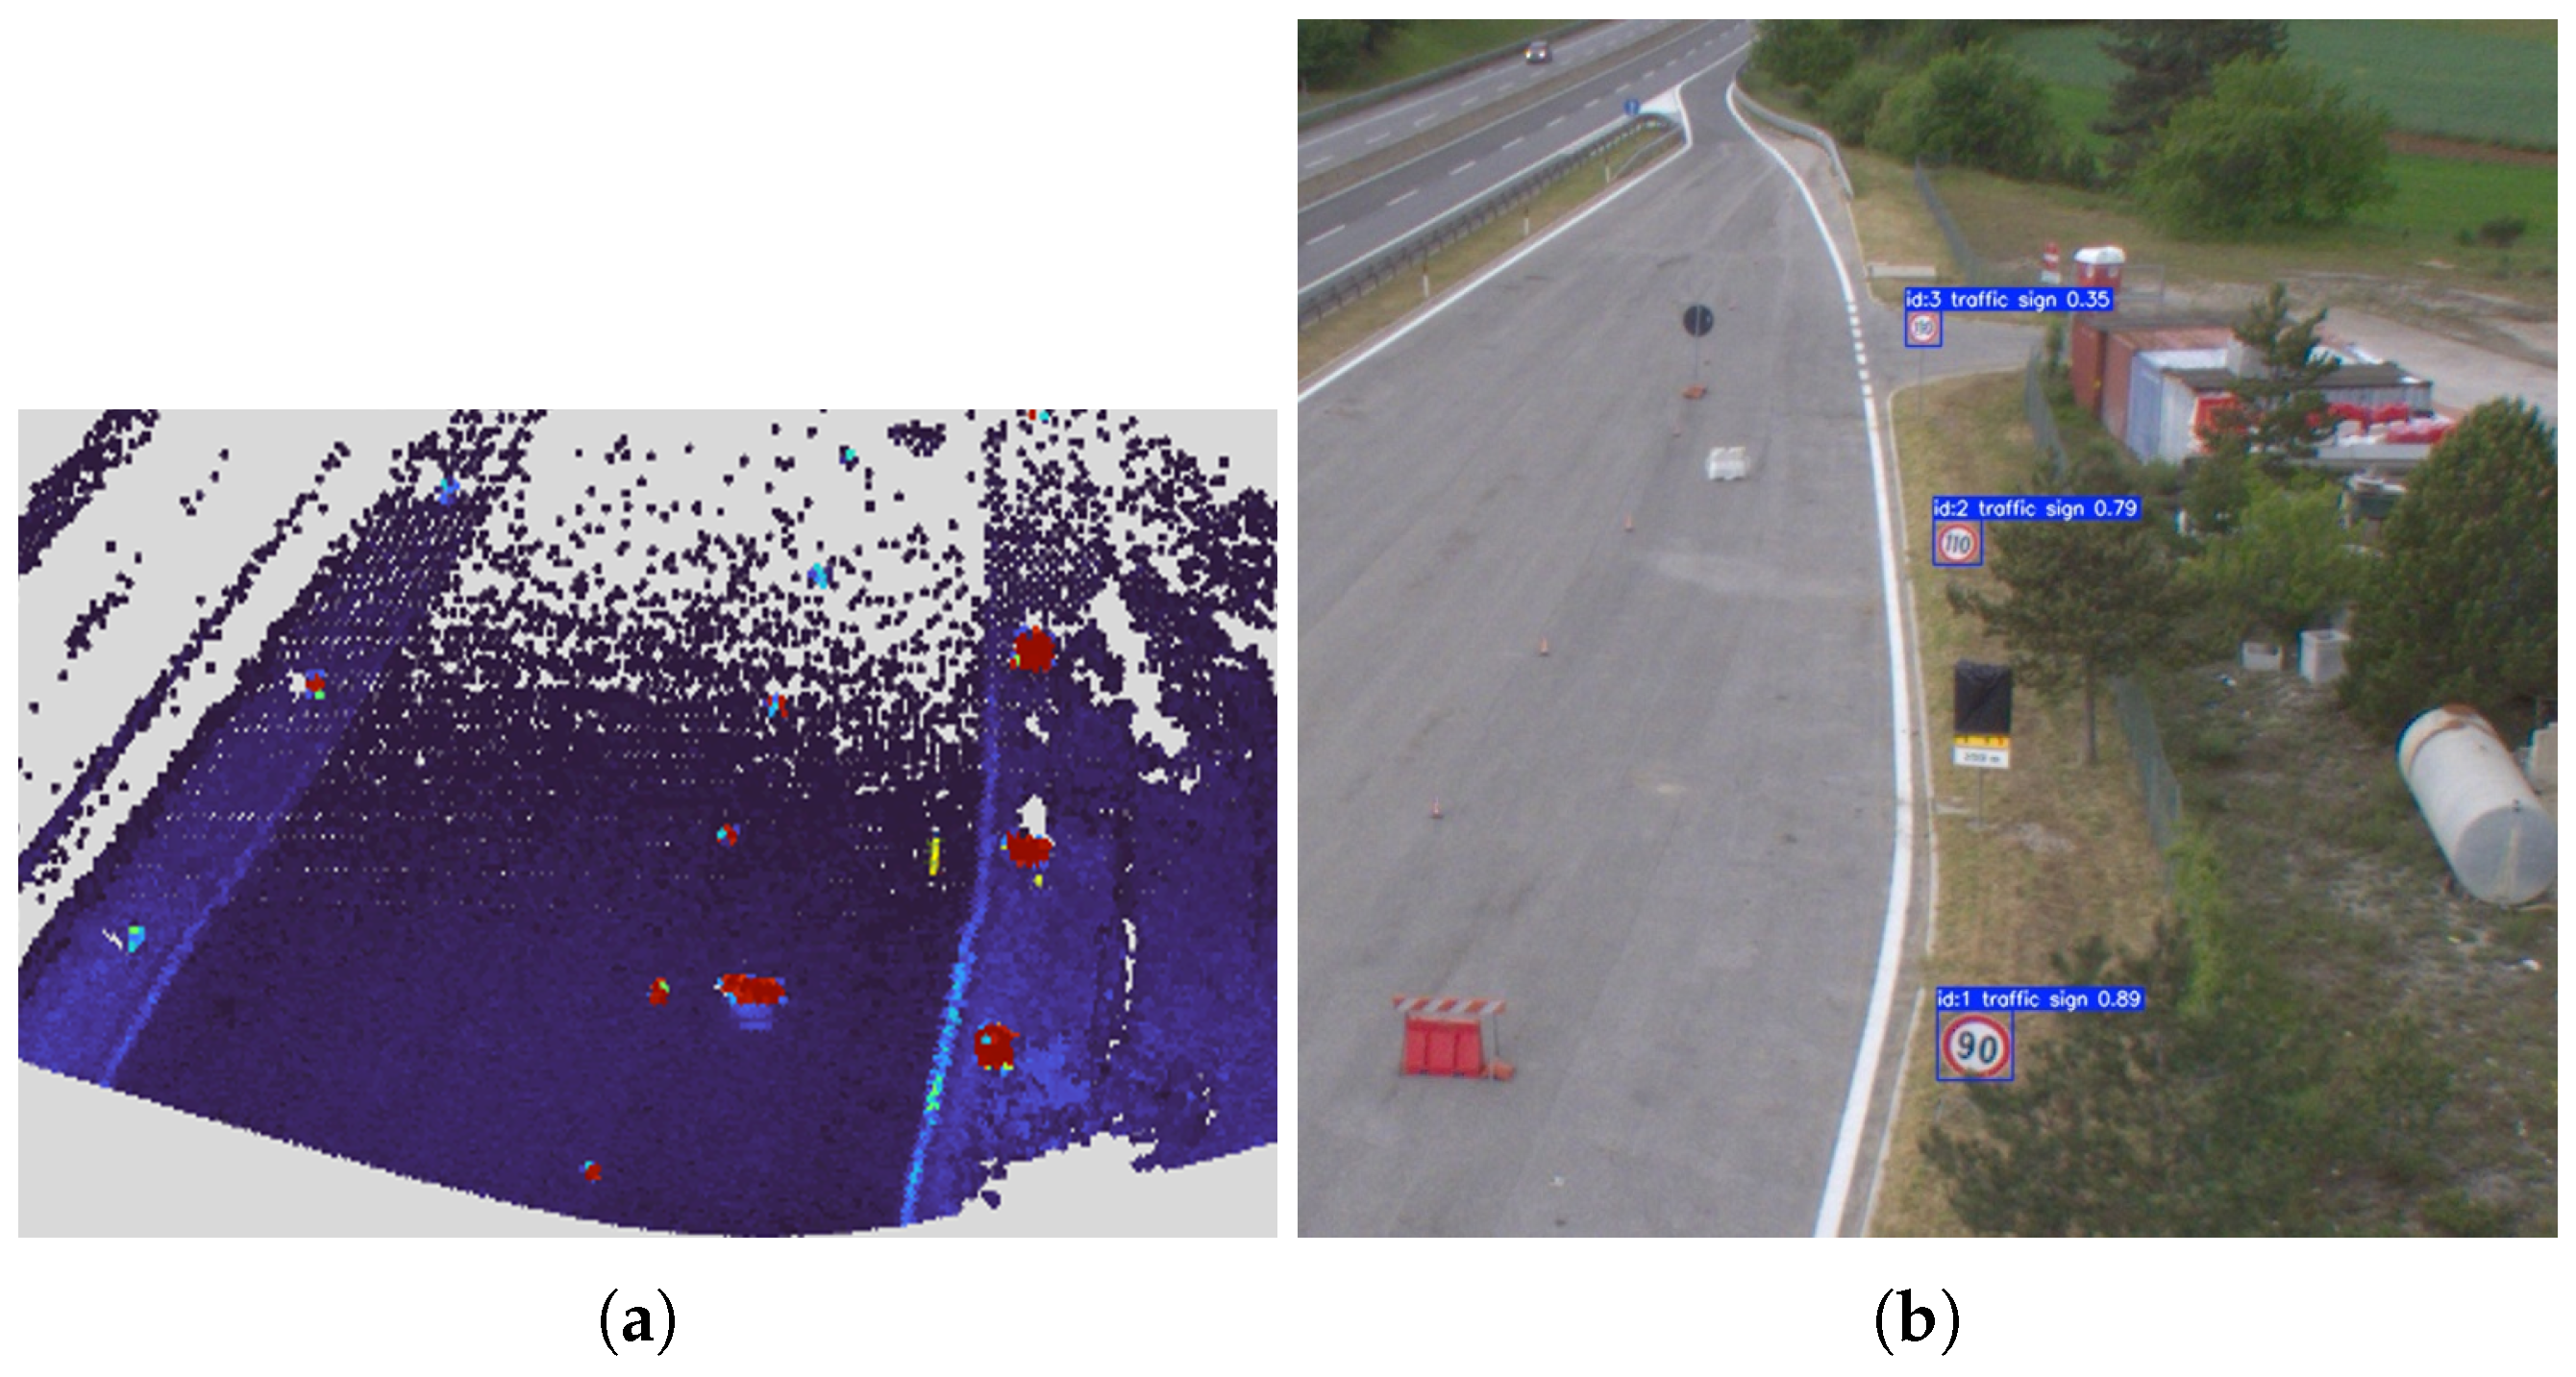
The system successfully detected all five vertical traffic signs across multiple flight passes at 15 m and 20 m altitudes, with gimbal pitch angles of 20°, 30°, and 40°. Detection remained robust across varying orientations, confirming the effectiveness of the multi-angle synthetic training approach. The increased variety of sign types in this environment (compared with previous tests) further validated the model’s generalisation capabilities. An example of detection at a 30° gimbal pitch and 20 m altitude is shown in Figure 20.
Semantic Segmentation Performance
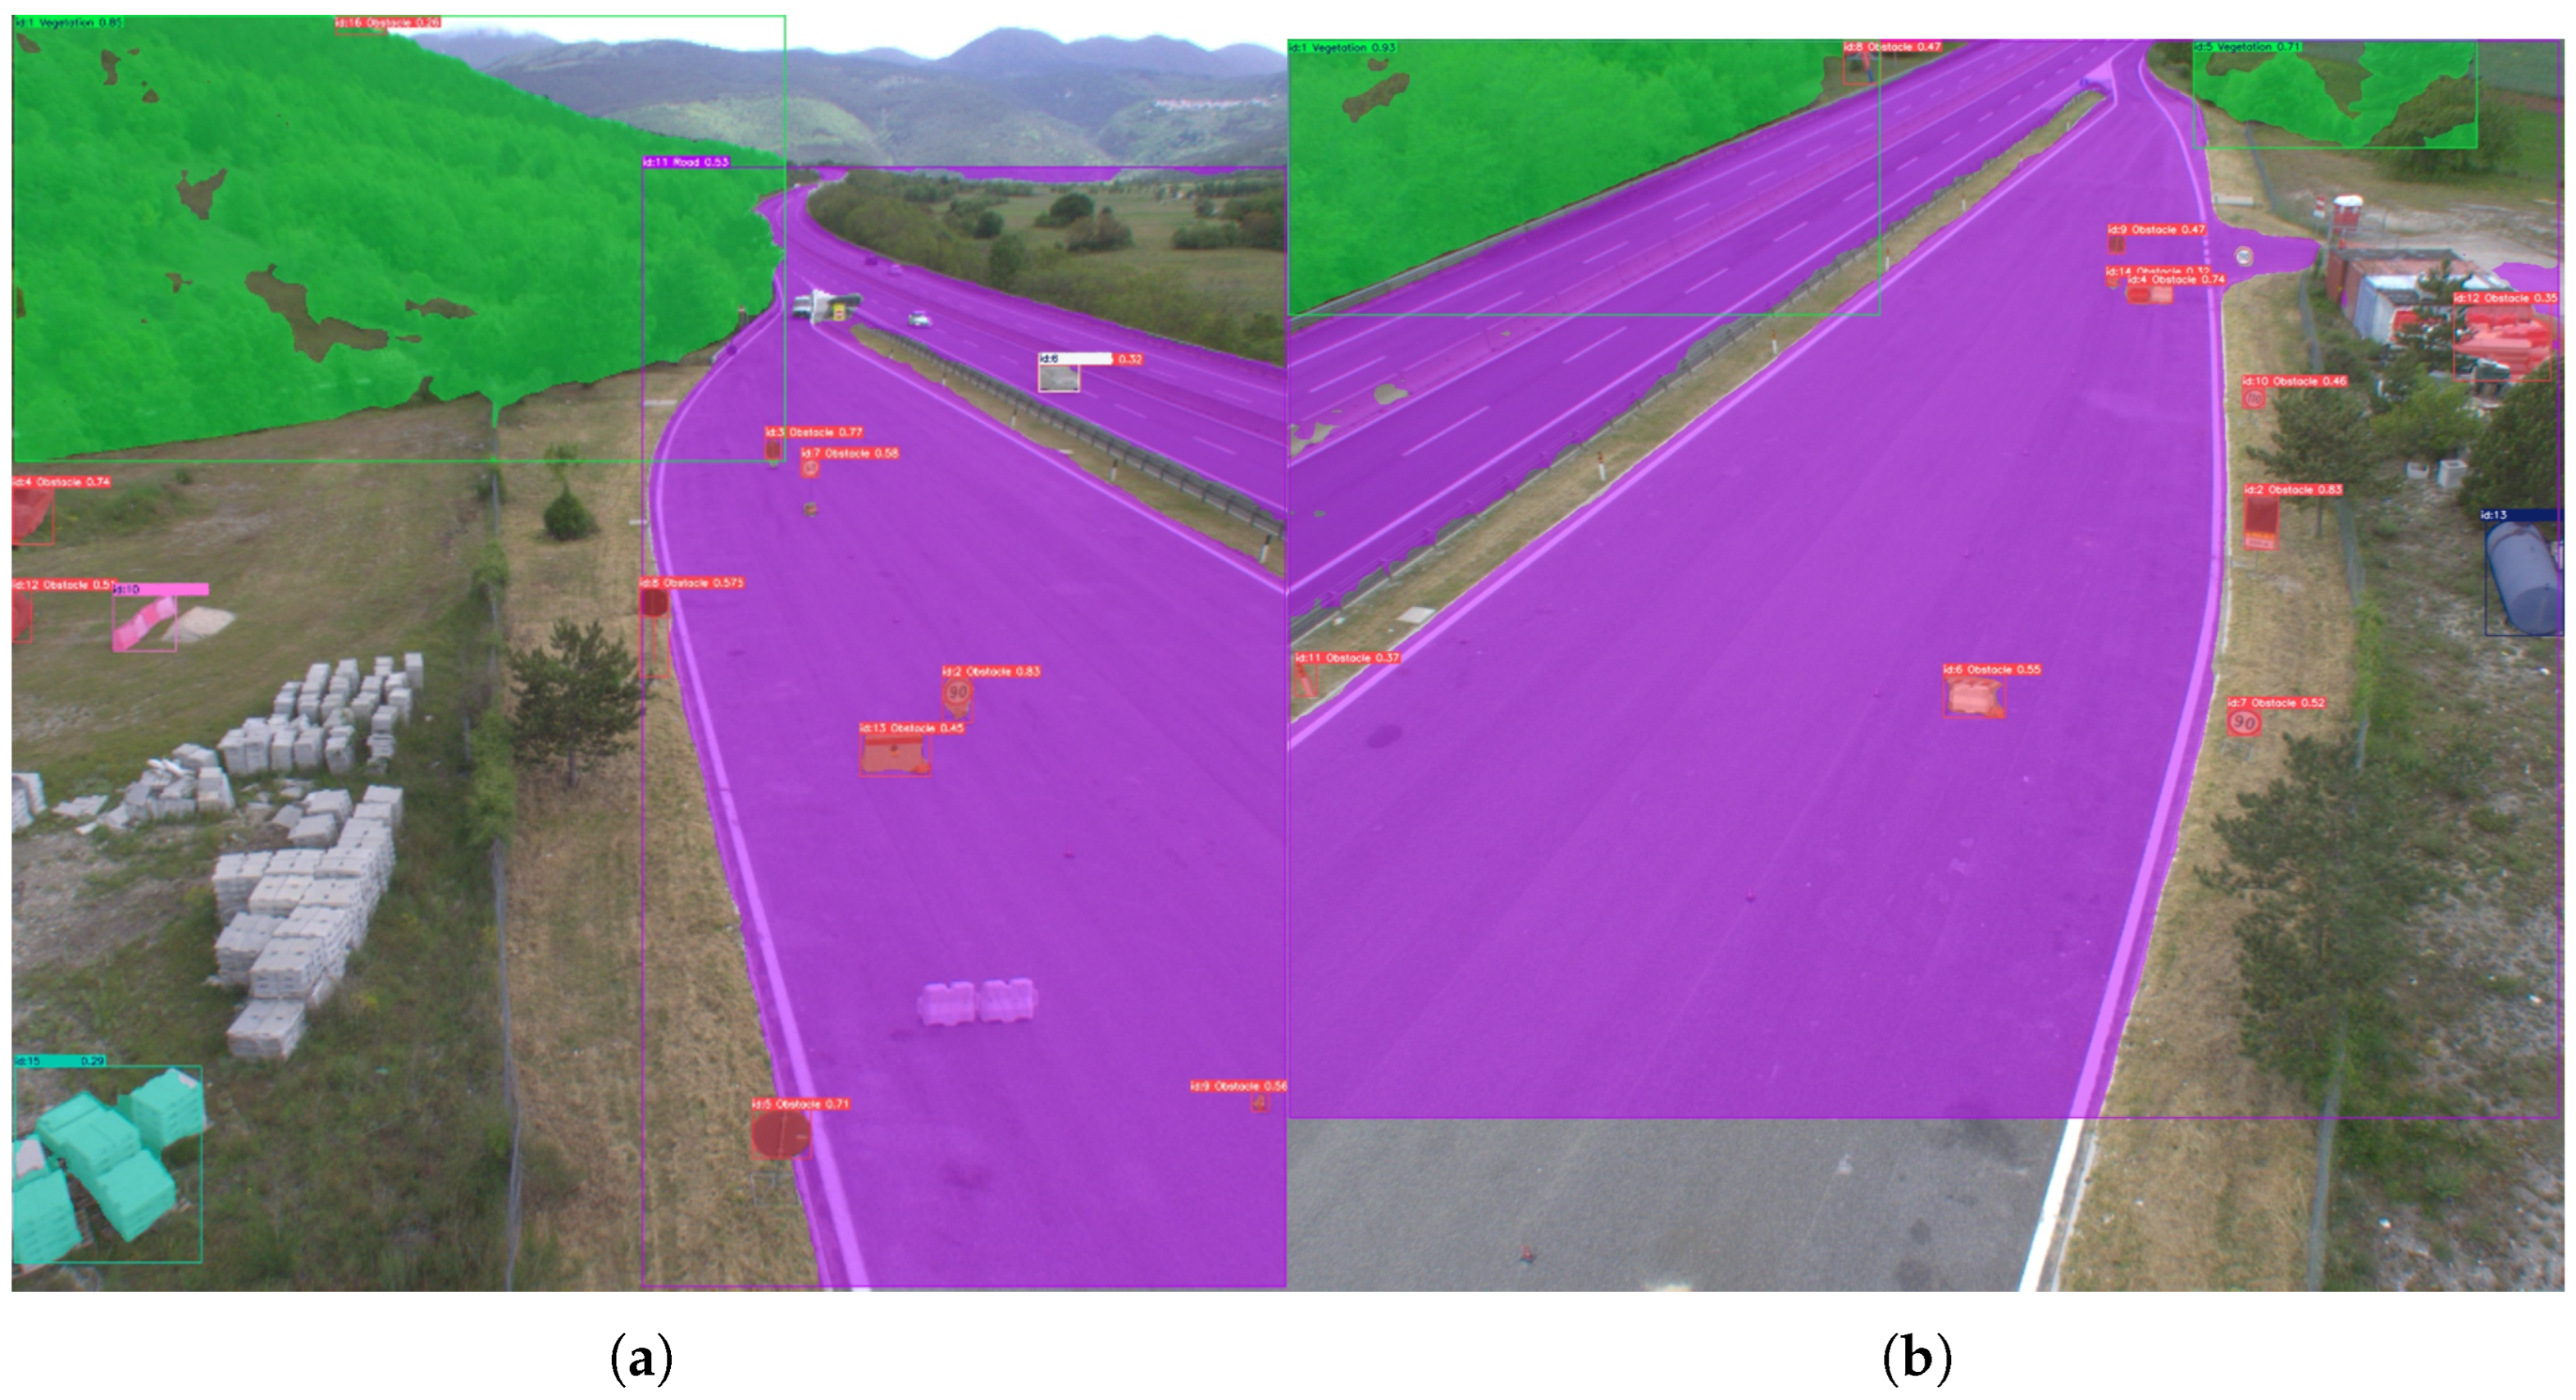
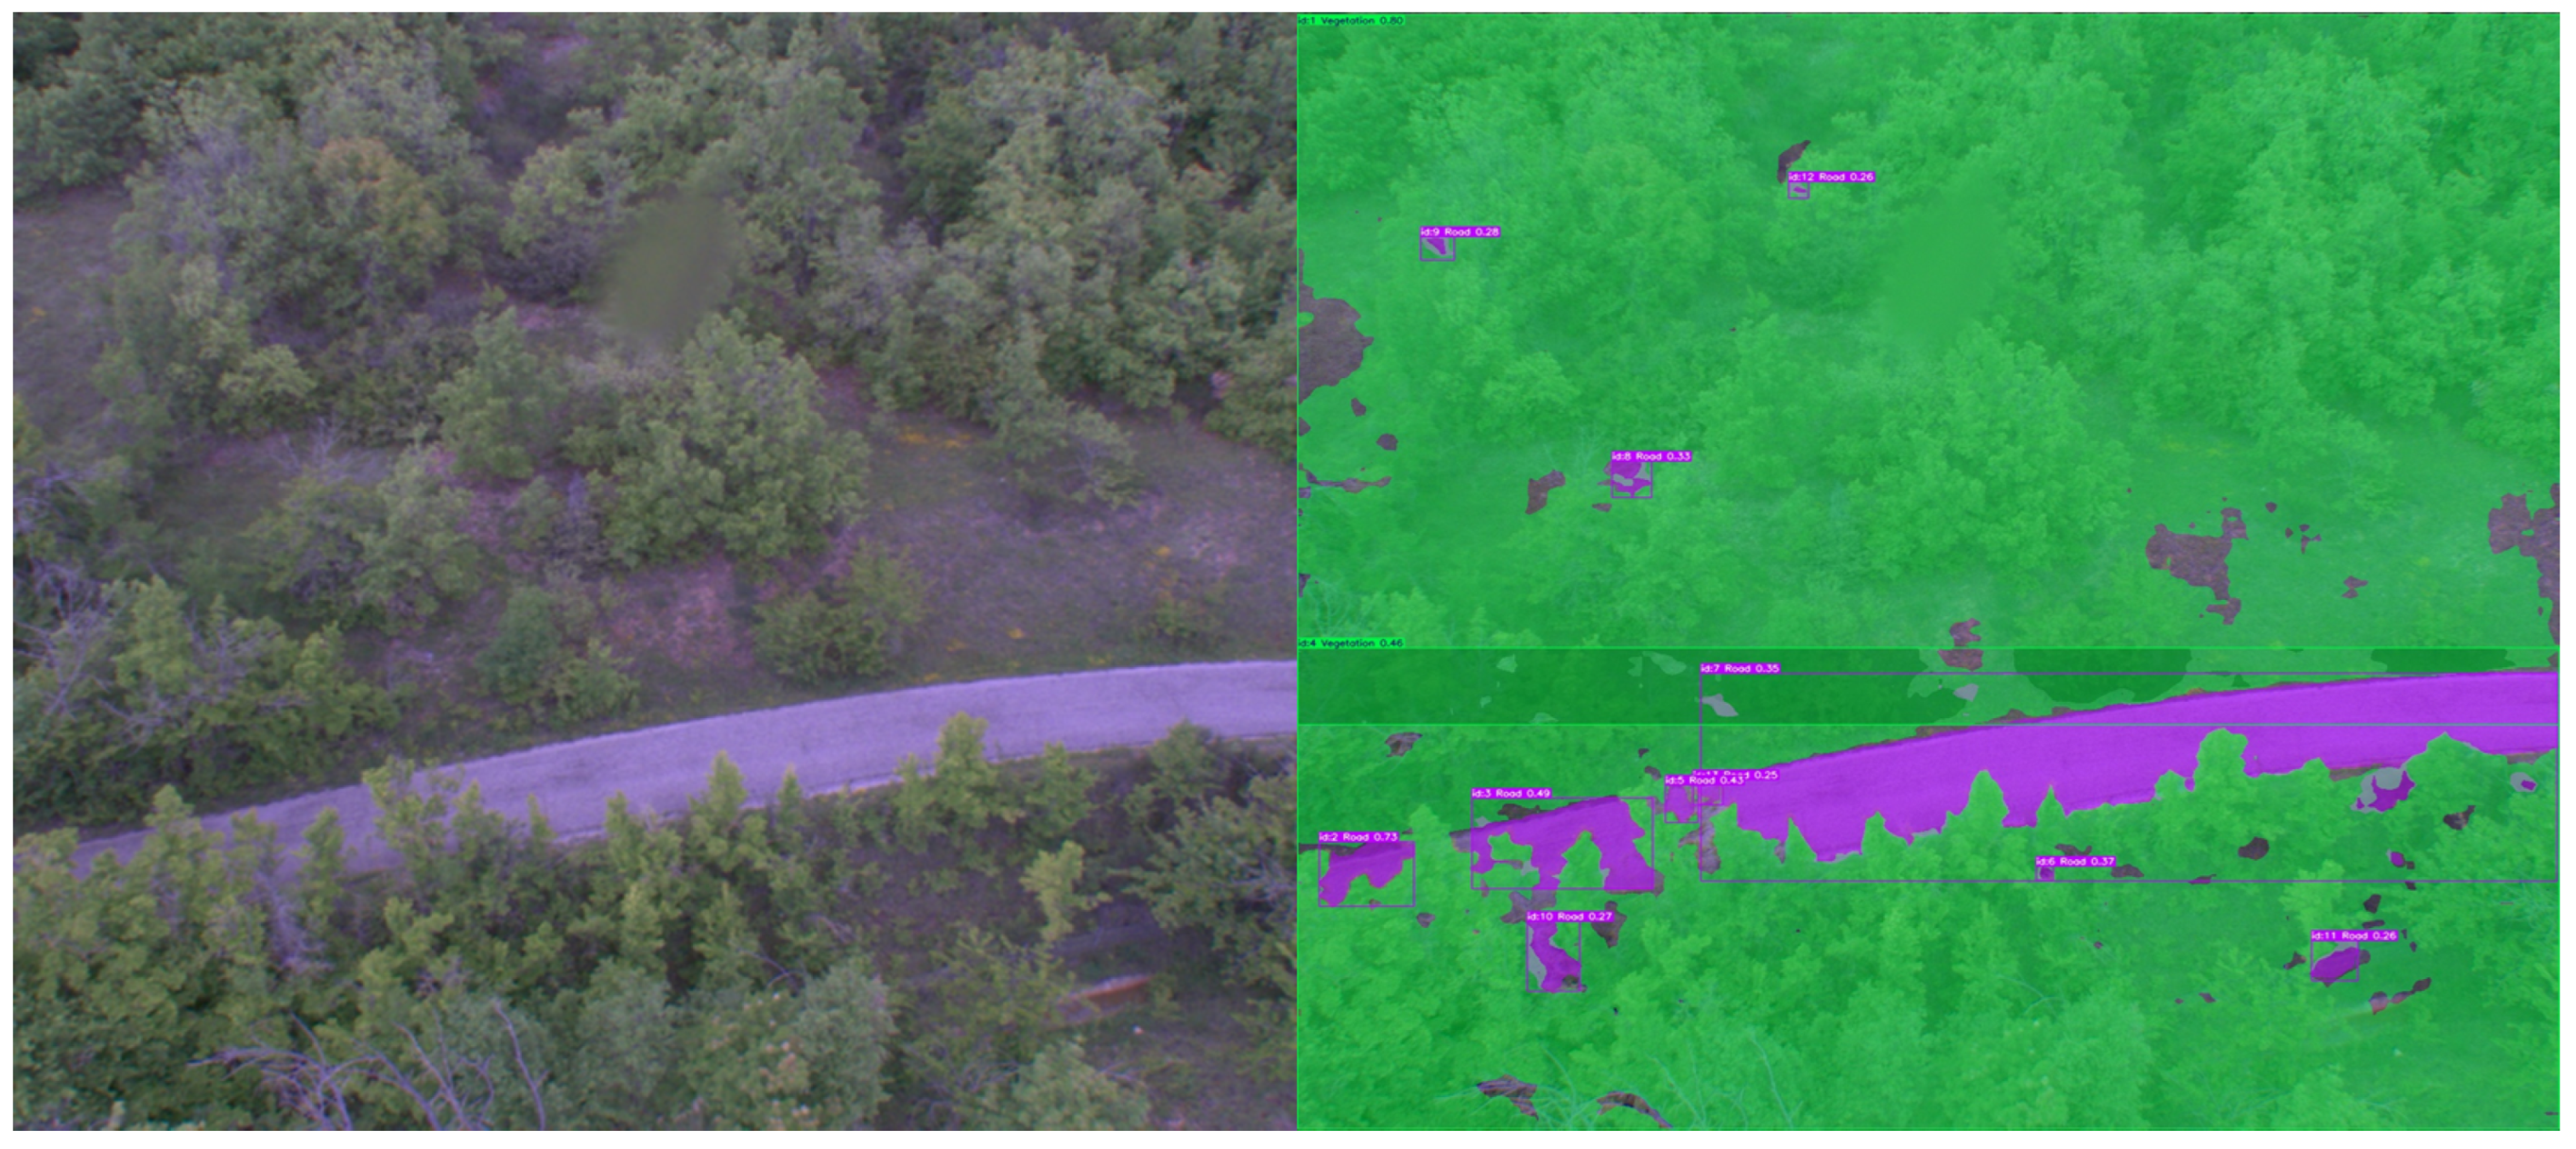
Obstacle and vegetation detection demonstrated good performance regardless of flight altitude or gimbal configuration. The model exhibited minimal class confusion between road, vegetation, and background categories, as shown in Figure 21.
A specific vegetation encroachment test along a secondary road with abundant roadside growth successfully identified invasive vegetation, triggering appropriate alarms that were transmitted to the DT with accurate GPS coordinates. This roadside vegetation invasion is shown in Figure 22.
Retro-Reflectivity Analysis
The LiDAR-based retro-reflectivity assessment was validated at 15, 20, and 30 m altitude—the maximum operational height for comprehensive road inspection. At these altitudes, the system successfully detected vertical traffic signs using the camera-based YOLOX detector and subsequently performed a qualitative analysis of their retro-reflective condition using LiDAR intensity measurements. The sensor fusion pipeline accurately projected detected-sign bounding boxes onto the 3D point-cloud coordinate frame, enabling the extraction of intensity values from the corresponding sign regions. As described in Section 2.2, the analysis is qualitative in nature: rather than computing absolute retro-reflectivity values, the system compares the mean intensity of each sign’s point-cloud cluster against adjacent non-reflective road surface regions. Figure 23 illustrates the intensity distributions observed for signs with different reflective conditions, showing a clear relative contrast between surfaces, which serves as the basis for the alarm generation mechanism.

4.3.2. AMR Localisation, Navigation, and Measurement Results

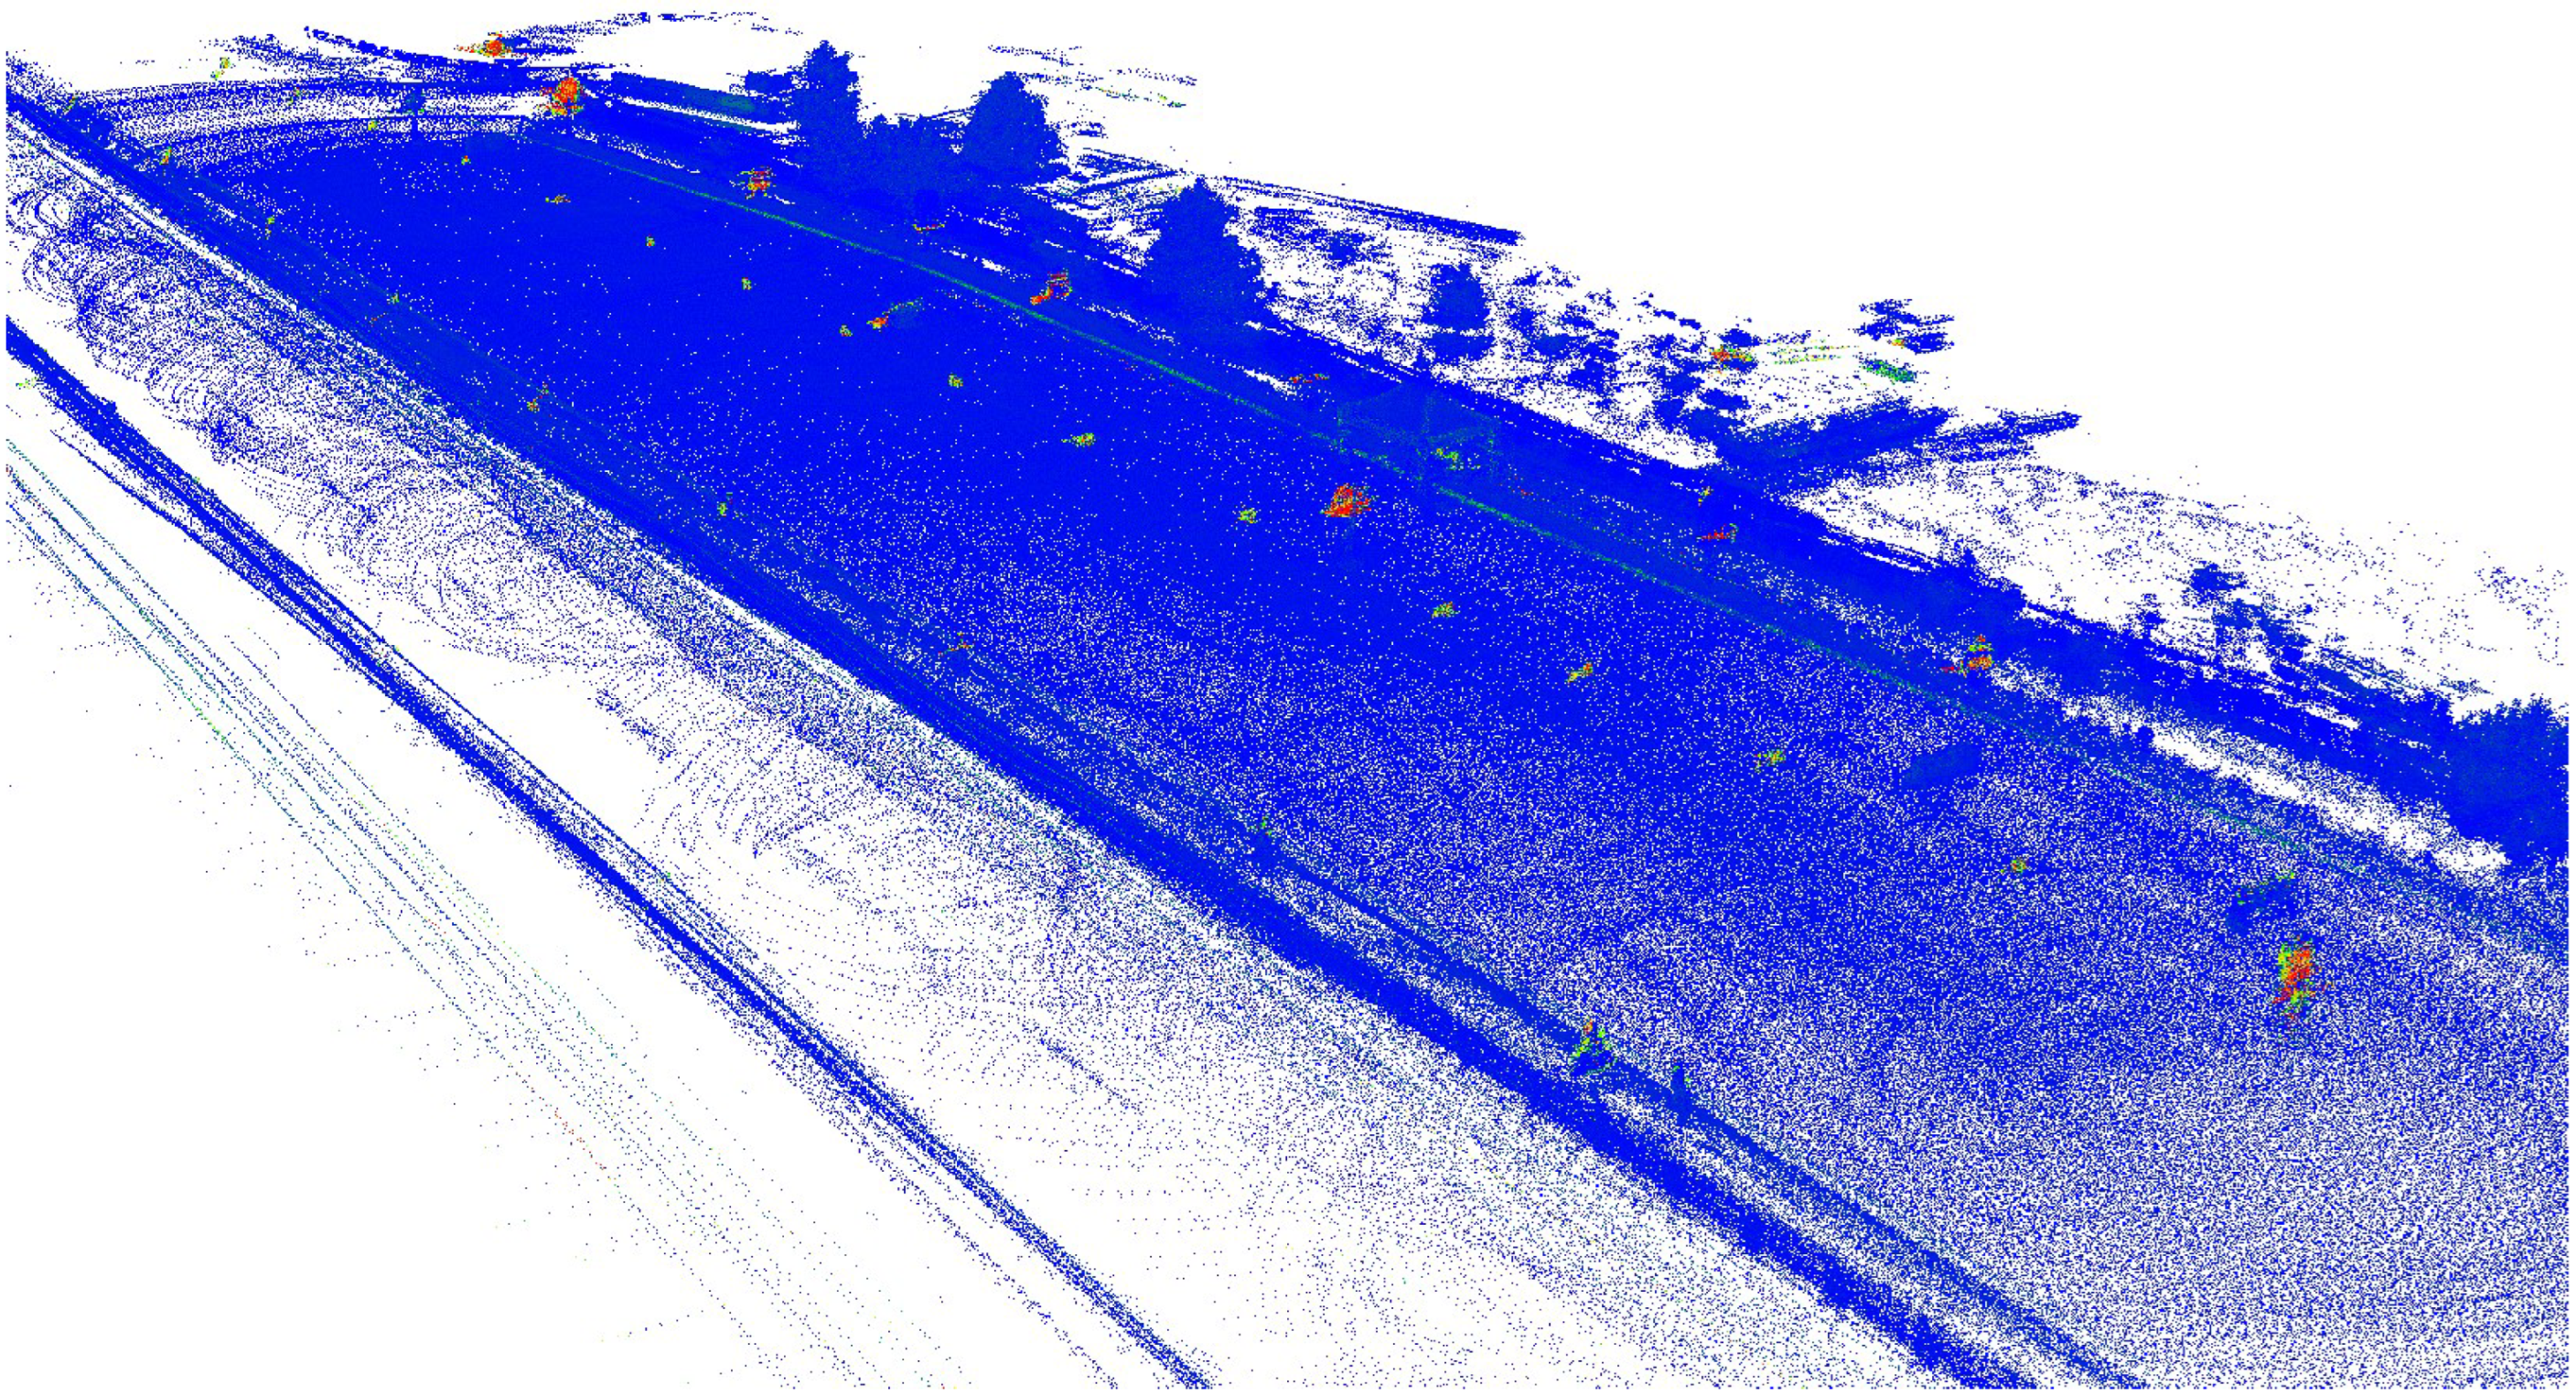
AMR localisation and navigation tests were successful, achieving notable repeatability in reaching the predefined goals, well within the navigation margin of error (±10 cm). Initial concerns about the feasibility of using 3D maps, due to the lack of features in the testing environment, were dismissed in the test area, as the trees and other elements present in the boundaries helped “lock” the localisation. Figure 24 shows the 3D map of the test site built by the 3D mapping system. However, the small size of the test area does not allow extrapolation of the results to larger, longer areas, where there may be many featureless stretches. Using a pure GPS-RTK + inertial system also provided robust and repeatable localisation but still presents the problem of operating in GPS-deprived environments, such as tunnels.
The detection and alignment of the horizontal signs also demonstrated sufficient accuracy and robustness, safely positioning the sensor over the line even with low clearance between the line and the road’s kerb (Figure 25). The main issue detected was that the system had been trained on much narrower lines, causing the visual-servoing system to converge more slowly than expected. This resulted in a few instances where some discontinuous lines were missed due to their short length, preventing the system from aligning before the line ended. This problem was resolved by tuning the PID controller to converge faster, as the wider lines allowed for sharper vehicle movements.

5. Impact Assessment

This chapter assesses the impacts of introducing a UAV- and AMR-based inspection system for road maintenance, designed to monitor roadside vegetation, obstacles, and the condition and retro-reflectivity of horizontal and vertical signage within a digital twin environment. The assessment applies a set of KPIs to examine how the introduction of this technology influences inspection processes, focusing on improvements in inspection quality and worker and road-user safety and potential reductions in labour requirements, costs, and environmental impacts compared with traditional manual inspection practices [38].

5.1. Scope and Objective

The impact assessment applies a comparative methodology analysing two scenarios: traditional road inspection practices as the reference scenario and the proposed automated inspection system using UAVs and AMRs described in this article, which we refer to as the BEEYONDERS scenario in this section. The analysis follows a consistent comparison logic in which certain parameters are kept constant across both scenarios while others are allowed to vary, ensuring that observed differences reflect the effects of the technology rather than inconsistencies in the underlying assumptions. The key operational characteristics of the two scenarios used in the comparison are outlined below. All collected data are structured and scaled according to these scenarios and selected indicators to ensure a consistent and comprehensive analytical framework.
  • In the reference scenario, inspections rely on patrol vehicles and manual visual observations. Obstacle detection is carried out through daily patrols using four vehicles (two per traffic direction), each operated by a two-person crew covering approximately 150 km per day. When obstacles or hazards are detected, a mobile work site—comprising signalling vehicles and a removal crew—is deployed to secure the area and perform the intervention. Vertical signage inspections are conducted once per year using visual checks, supported by portable retro-reflectometers when necessary, typically carried out by two operators using a patrol vehicle. Horizontal road marking retro-reflectivity is measured using a dedicated inspection vehicle equipped with measurement instrumentation and operated by a single driver during periodic inspection campaigns.
  • The BEEYONDERS scenario introduces an automated inspection system integrating UAVs, an autonomous inspection vehicle, and a digital twin platform. UAVs perform aerial monitoring of roadside infrastructure, enabling the detection of obstacles and assessment of vertical signage conditions. Horizontal road markings are inspected using the AMR equipped with retro-reflectivity sensors, operating autonomously along the roadway. Inspection data from both platforms are transmitted to the digital twin environment, enabling centralised data processing, performance monitoring, and data-driven maintenance planning, while reducing the need for continuous on-road patrols.
Data were collected from technology deployment, operational trials, and relevant previous projects involving technology developers and stakeholders. Some parameters, such as operational time, energy use, and resource consumption, were directly translated into KPI values, while others required additional analysis using Life Cycle Impact Assessment (LCIA) and Life Cycle Costing (LCC) approaches in accordance with EN ISO 14044 [39]. This methodology enables a structured and transparent evaluation of how automated inspection technologies influence the efficiency, sustainability and safety of road maintenance operations.
To establish an initial understanding of the potential impacts of the proposed technologies, a qualitative comparison between the conventional inspection process and the BEEYONDERS automated inspection approach was first performed. This preliminary screening identified key differences in operational characteristics, safety conditions, environmental performance, and cost structures, as shown in Table 3. The most influential indicators emerging from this comparison form the basis for the subsequent quantitative impact assessment.

5.2. Functional Unit and System Boundaries

The impact assessment is based on a defined functional unit that enables a consistent comparison between conventional and autonomous road inspection scenarios. In this study, the functional unit is “1 km of road inspected”, covering obstacle detection and vertical and horizontal signage inspection. All operational data—such as crew size, vehicle use, energy consumption, and inspection time—are normalised to this unit to allow transparent comparison.
Because the two scenarios differ operationally, the collected data are scaled to a 1 km level so that labour input, equipment use, and environmental impacts can be compared on equal terms. The system boundary includes all processes required to inspect 1 km of road, including patrol vehicles, the specialised inspection vehicle, and manual inspections in the conventional scenario and drones, autonomous robots, and the digital twin system in the automated scenario. Environmental, cost, and labour indicators are evaluated within these boundaries to assess how autonomous inspection technologies affect operational efficiency, safety, and environmental performance.
The system boundary for this assessment includes all processes directly required to perform the inspection of 1 km of roadway. In the reference scenario, this encompasses routine patrol vehicles, mobile work-site trucks, manual inspections, and obstacle removal activities, along with their associated fuel use, labour time, and data-handling procedures. In contrast, the autonomous scenario incorporates the operation of drones, autonomous mobile robots, and the digital twin data environment, as well as supporting vehicles and remote operators. Processes such as battery charging, software operation, and automated data handling are included, reflecting the digital and electric nature of the new technology system.
During the definition of the scenarios, it was observed that obstacle detection and vertical signage inspections in the baseline process are carried out from patrol vehicles travelling at relatively high speeds. While this approach allows large road sections to be covered quickly, it typically results in fragmented and largely visual observations, providing limited traceability and detail. To enable a comparable inspection duration in the automated scenario while improving data quality, the inspection process was configured using multiple UAVs operating in parallel. Three drones are deployed simultaneously and distributed longitudinally along the road section, allowing the inspection workload to be shared while maintaining a similar overall inspection timeframe. Consequently, operational parameters and collected data were scaled to reflect the use of multiple drones operating in parallel. This configuration enables the collection of continuous, traceable, and spatially referenced data, providing a more comprehensive representation of roadside conditions compared with the conventional patrol-based approach.

5.3. Environmental Analysis

The main environmental impact of conventional road inspection is associated with the use of road vehicles equipped with internal combustion engines, which produce direct emissions of gases (e.g., CO2, CH4, and NOX) through exhaust. Road inspection involves three main activities—vertical and horizontal signage reflectivity checks and obstacle detection. All three activities are performed using customised road vehicles.
Furthermore, various vehicle engine types are used depending on the road maintenance aspect. Vehicles for vertical and horizontal signage reflectivity checks are mainly diesel or hybrid/petrol, while fully electric vehicles are also used for obstacle detection.
Table 4 shows the estimated fuel and energy consumption over a 1 km inspection route for three types of vehicles, depending on engine type and fuel used. Table 5 gives electricity consumption for the BEEYONDERS scenarios using AMRs and UAVs. This electric-powered equipment replaces conventional vehicles performing the same functional unit—1 km of road inspected—resulting in the testing of vertical and horizontal signage retro-reflectivity and obstacle detection. Estimated energy consumption KPIs are based on the distance covered by each vehicle, average speed during inspection mode, and average fuel or energy consumption rate (average reference vehicle: large personal vehicle, engine capacity above 2.0 L, average weight of 2000 kg) for this type of road vehicle.
Electricity consumption for horizontal signage inspection is based on the use of an AMR equipped with four electric motors, each rated at 400 W, with a total power demand of 1750 W including all auxiliary equipment. The operating time is approximately 4 min per kilometre travelled. Electricity consumption for vertical signage inspection is based on the use of a UAV (CATEC C750), with a maximum power rating of 1700 W and an operating time of 6 min per kilometre of inspected route. Electricity consumption for obstacle detection is based on the same UAV used for vertical signage inspection, with three operational vehicles in use. The IT equipment consists of a laptop computer with an average power consumption of 150 W, operating for an average of 10 min per kilometre of road inspected.
The environmental impacts throughout the life cycle of the road inspection service are assessed in accordance with EN15804:2012+A2:2019, the European standard [40], and are calculated using the OpenLCA software and the Ecoinvent 3.12 database [41].
Life Cycle Impact Assessment (LCIA) includes the complete life cycle of the fuel and electricity consumed, covering both direct and upstream impacts. Direct impacts from vehicle operation include exhaust emissions from fuel combustion in the engine, fuel evaporation, and emissions from tyre, brake and road wear (“tank-to-wheel” impact). Upstream impacts include the production and transport of fuel (“well-to-tank” impact), the production, transmission and distribution of electricity, passenger-car production and maintenance, and road construction.
Electricity used to charge electric inspection vehicles, such as the equipment used in the BEEYONDERS scenario, is environmentally valorised as indirect emissions resulting from electricity production at remote locations. Emission factors for electricity production and distribution are valid for Italy in 2025.
Table 6 presents calculation results for a functional unit of 1 km of road inspected with four different engine type combinations that could be used in the reference scenario:
  • Only diesel vehicles used (EURO 5 standard);
  • Only hybrid/petrol vehicles used (EURO 5 standard);
  • Diesel for vertical and horizontal inspection, EV for obstacle detection;
  • Hybrid/petrol for vertical and horizontal inspection, EV for obstacle detection.
The main difference, in environmental terms, between the two scenarios is the type of energy used for inspection. Since no internal combustion engine vehicles are used for road inspection in the BEEYONDERS scenario, the environmental benefit is a reduction in emissions due to avoided direct exhaust emissions per functional unit of 1 km of road inspected. Table 7 presents calculation results for a functional unit of 1 km of road inspected.
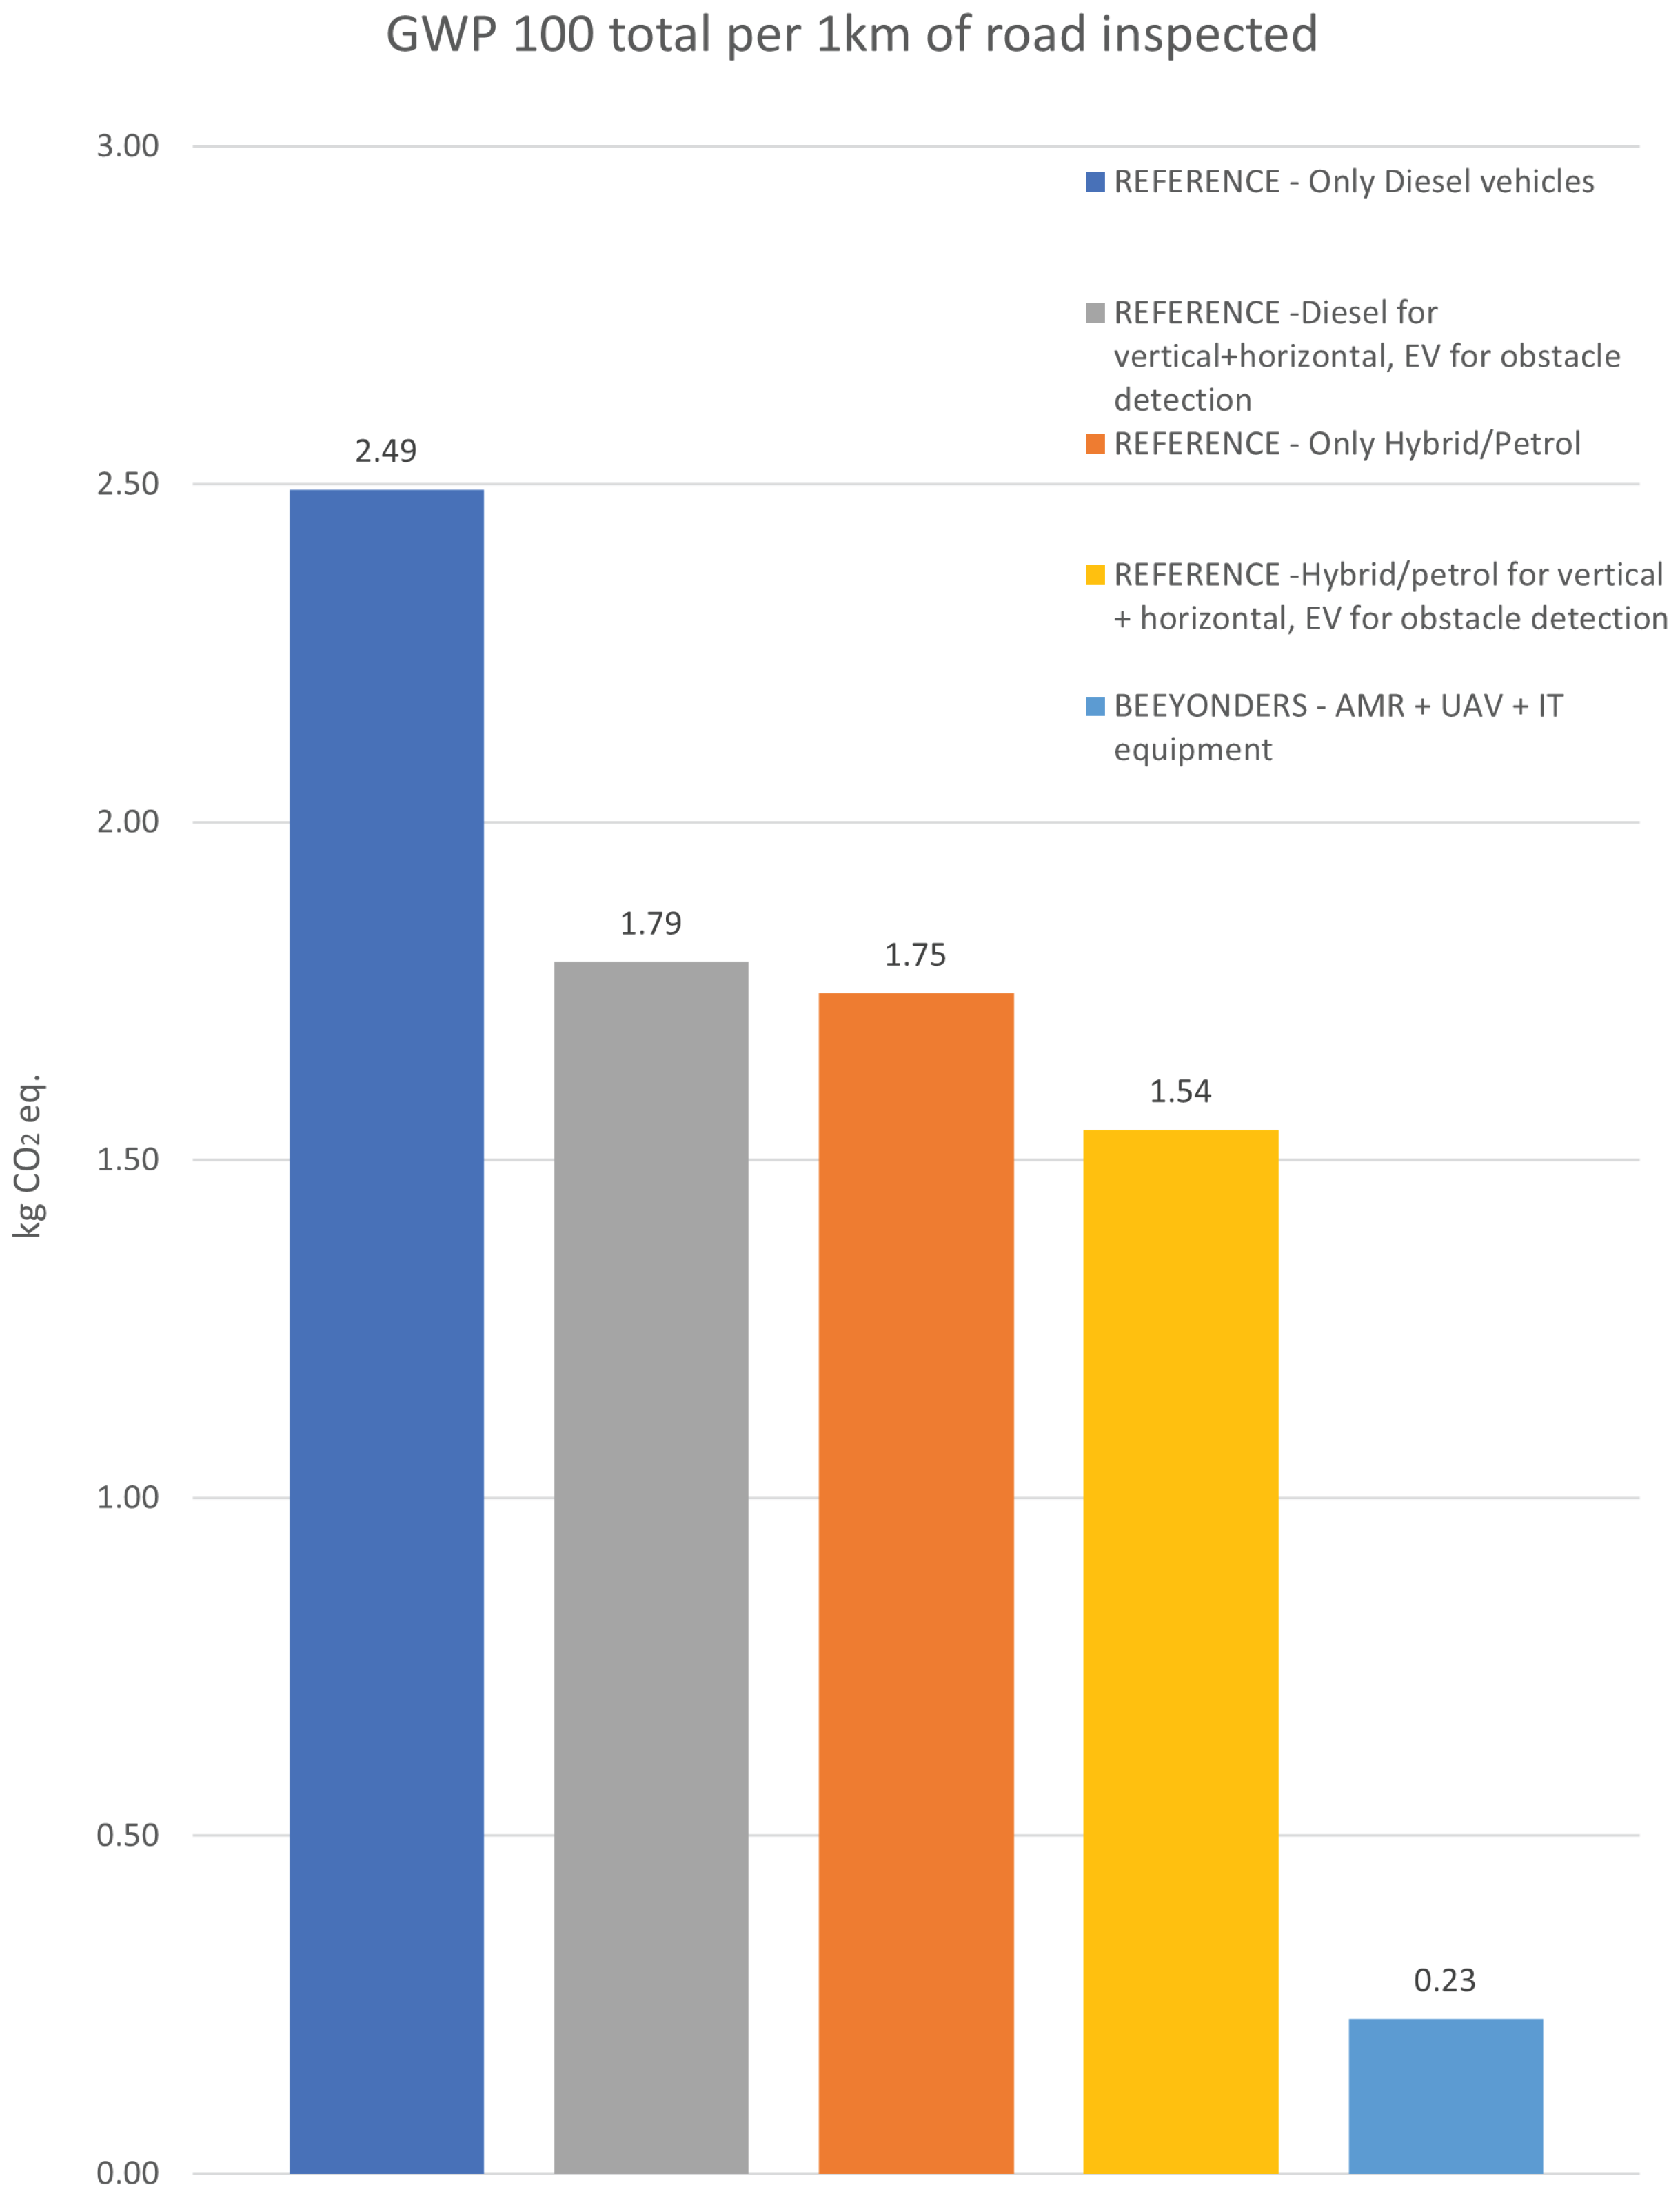
Figure 26 shows a comparison of the climate change impact category, presented with the GWP 100 total indicator, for a functional unit of 1 km of inspection performed in both the reference and BEEYONDERS scenarios.
It is clear that the reference scenario shows a range of environmental impacts, as reflected by the GWP-total indicator, which depends strongly on the type of vehicle used for road inspection.
The GWP-total indicator in the BEEYONDERS scenario shows significant reduction potential, ranging from 85% when compared to the reference scenario option with hybrid and electric vehicles to 91% compared with diesel-only vehicles.

5.4. Economic and Productivity Analysis

The economic and productivity assessment evaluates how the introduction of autonomous inspection technologies influences operational costs and efficiency compared with conventional road inspection practices. The evaluation focuses on key cost drivers such as labour requirements, equipment utilisation, energy consumption, and operational duration. Where sufficient quantitative data are available, indicators such as inspection time, resource use, and equipment performance are used to estimate relative cost differences between the scenarios. This approach provides an evidence-based understanding of how automation and digitalisation can improve productivity and contribute to the economic feasibility of technology adoption in road maintenance operations.
Cost estimates for vehicles and specialised inspection equipment are derived from market prices and information provided by infrastructure operators involved in the case study. Operational costs also consider maintenance and calibration requirements for inspection equipment, as well as typical service-life assumptions for vehicles and measurement systems. For labour costs, the analysis relies on publicly available economic statistics for the case study area, ensuring that the estimates reflect representative wage levels for relevant technical and operational personnel [42,43,44,45].
Productivity and operational duration are derived from real operational practices and expert input from infrastructure operators. These data describe how frequently inspections are carried out, how long typical inspection campaigns last, and how many personnel and vehicles are required to perform the activities. The analysis also considers operational factors such as patrol routines, inspection coverage rates, and the deployment of additional equipment or work zones when interventions are required.
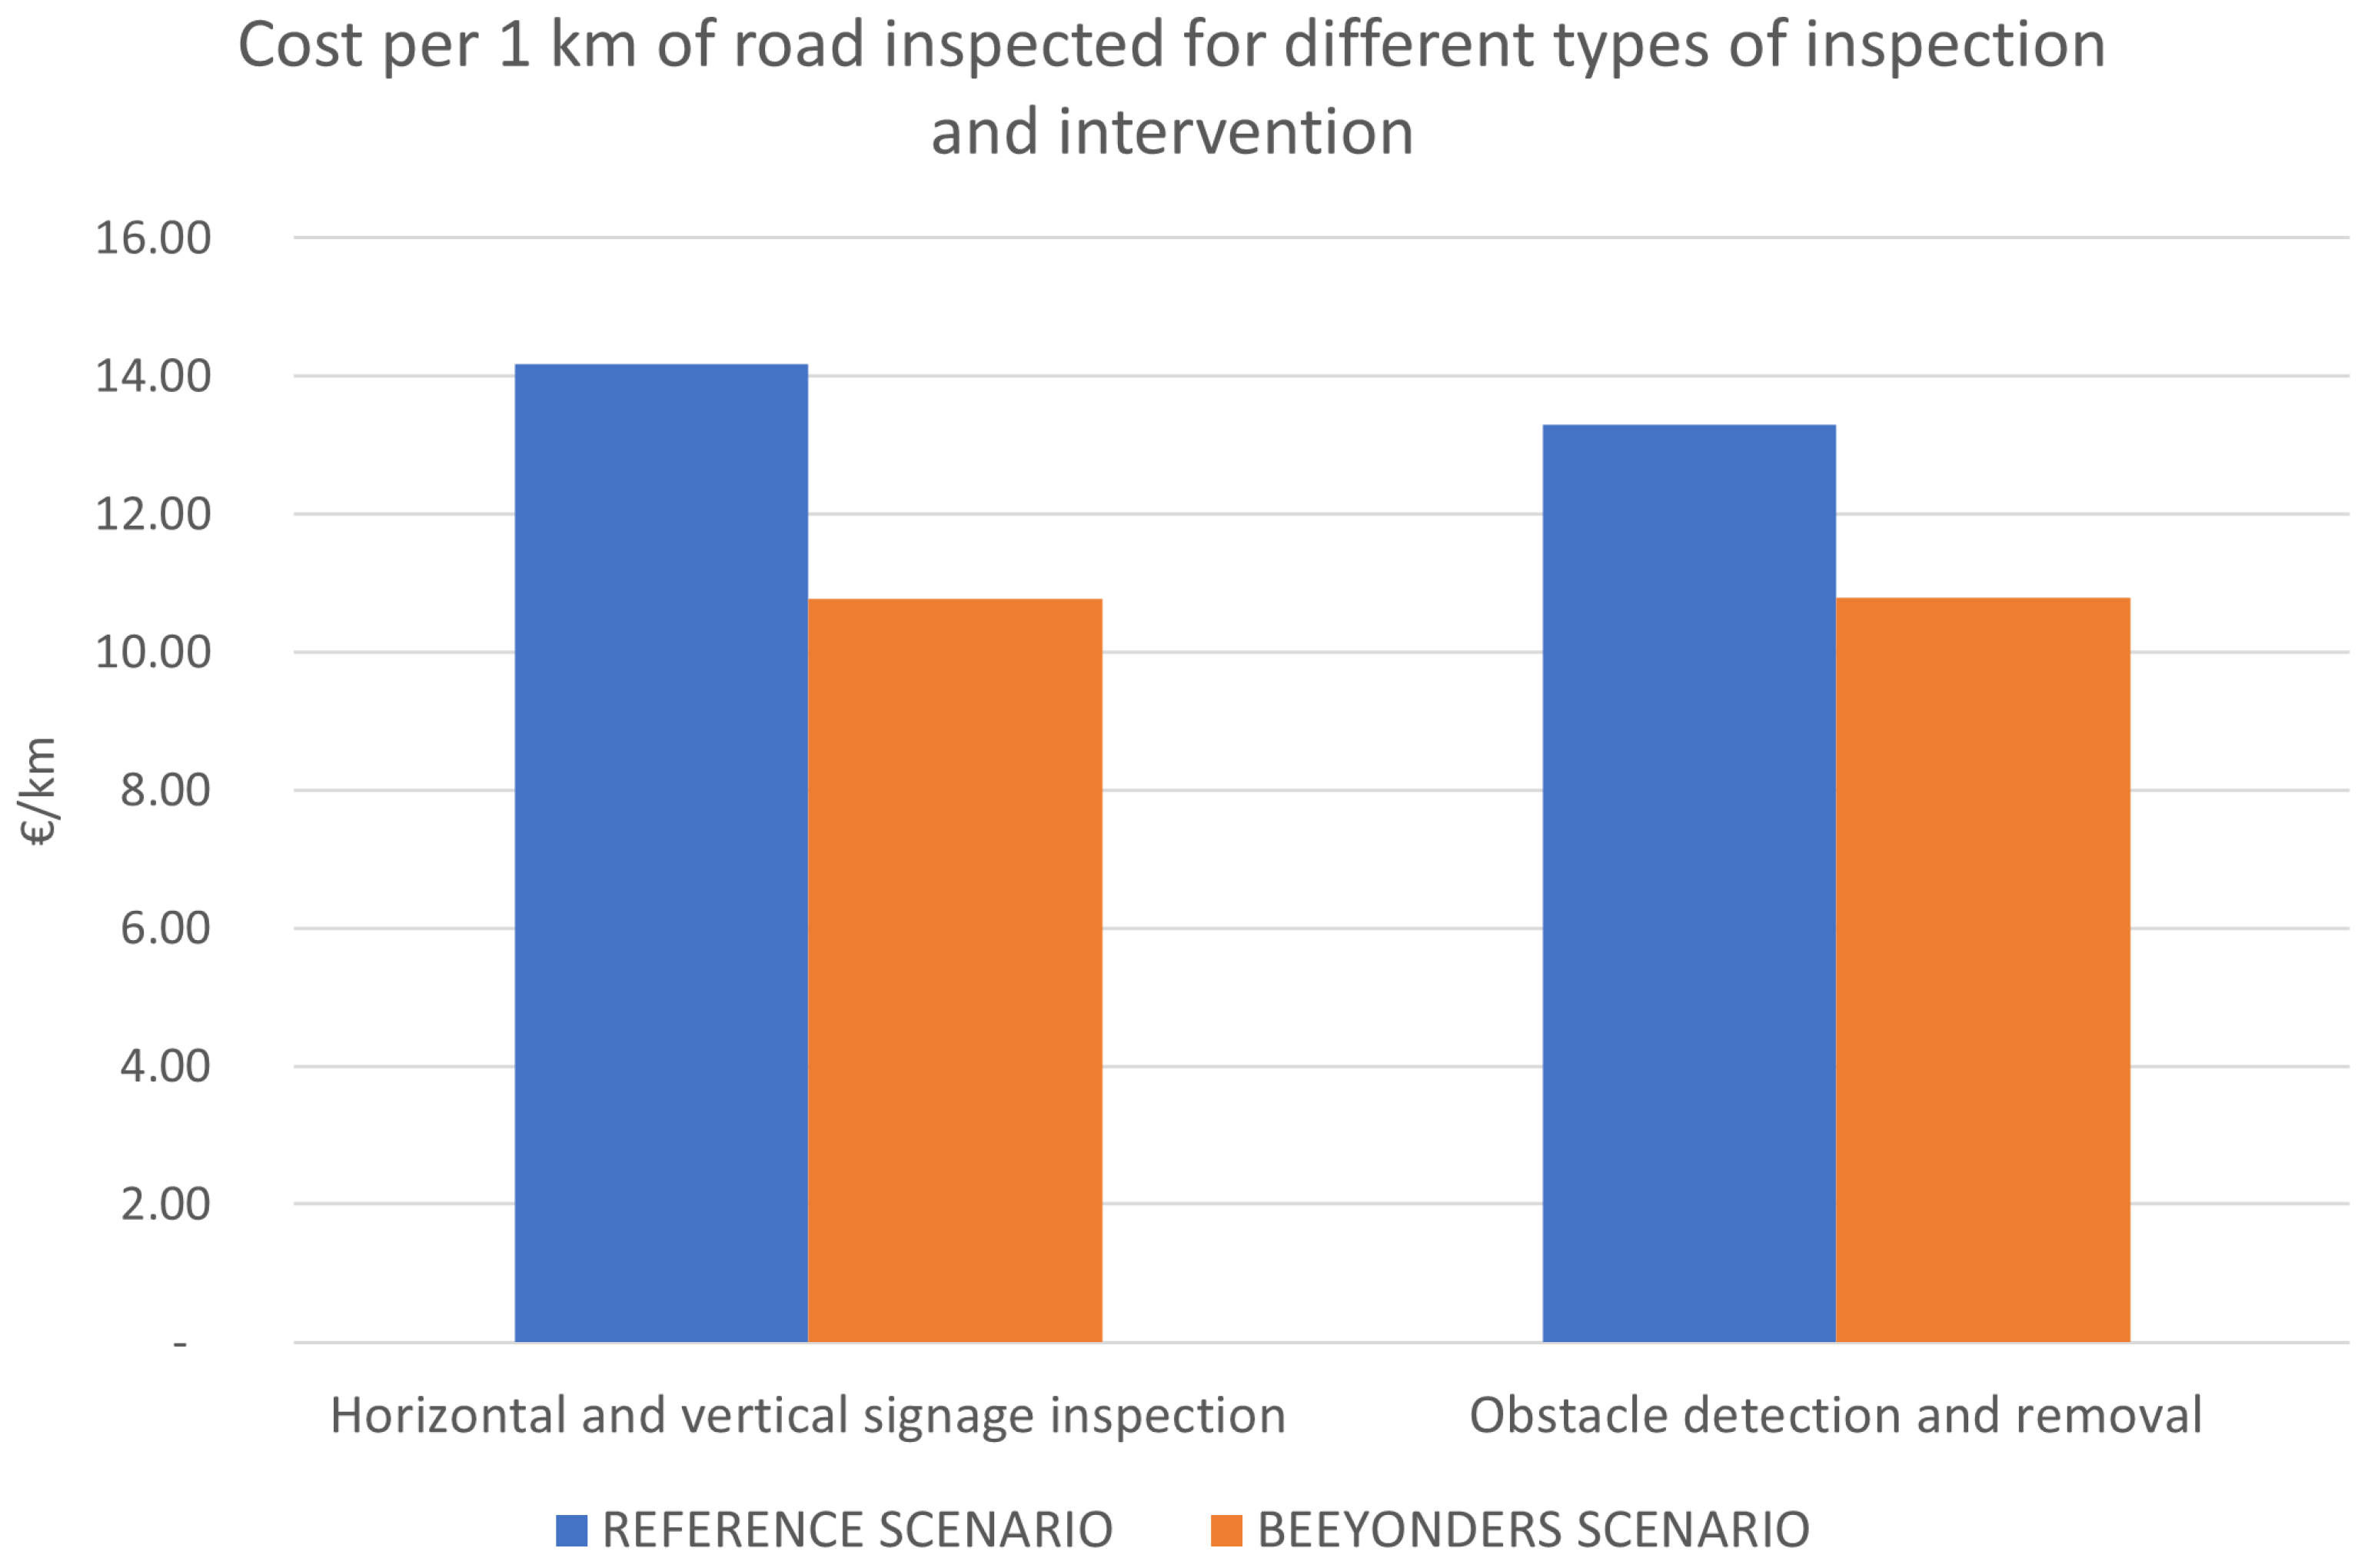
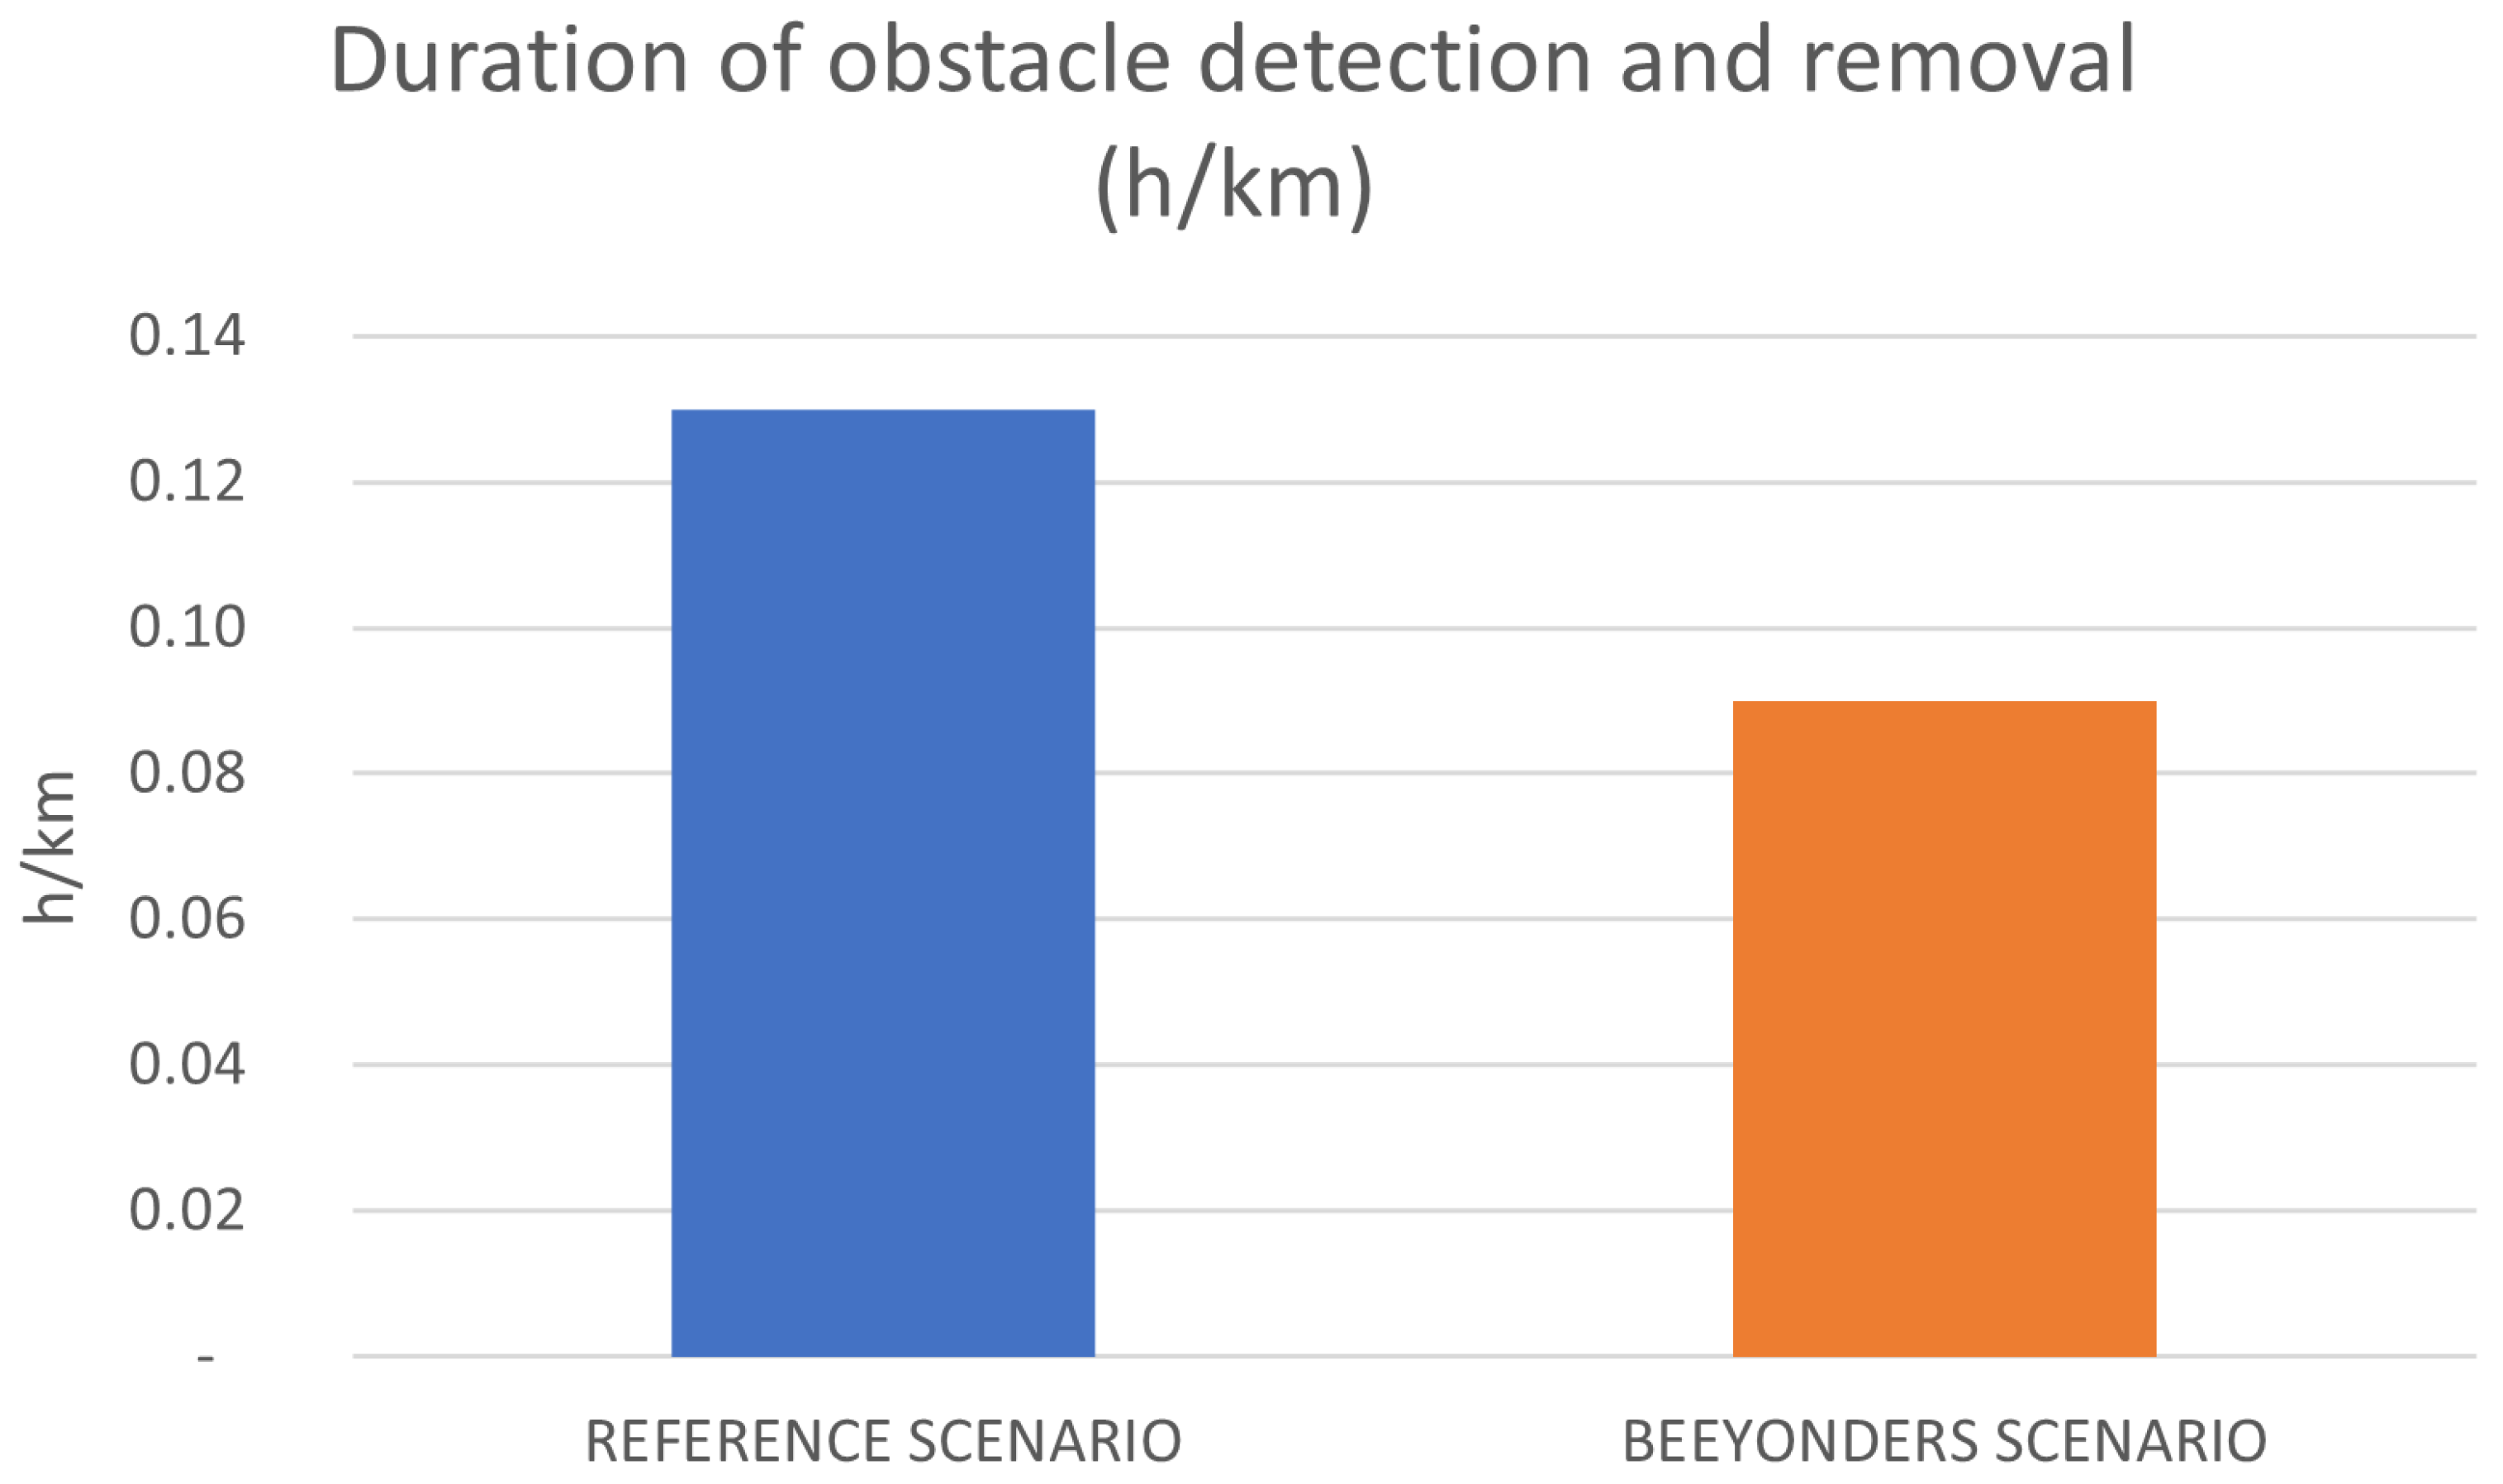
For horizontal and vertical signage inspections, where the comparison was performed under an equalised inspection duration, the results indicate a reduction in economic costs in the automated scenario (24%), while obstacle detection shows a reduction of 19%, as shown in Figure 27. In addition, the automated scenario reduces the total duration of the obstacle detection and removal process by 31%, as shown in Figure 28.
The results demonstrate clear benefits of the proposed technology already at the level of individual inspection processes. When combined with broader organisational integration and the parallel use of high-quality inspection data across multiple operational functions, these technologies have the potential to further enhance efficiency, safety, and data-driven decision-making in road infrastructure management.

6. Discussion

6.1. Technical Advantages

The integration of autonomous aerial and ground robotic systems within a digital twin framework introduces several technical advantages over traditional road maintenance practices. Foremost among these is the significant improvement in operator safety. Conventional inspection workflows often require maintenance personnel to work near traffic or in hazardous roadside environments, exposing them to considerable risk. By deploying Unmanned Aerial Vehicles for overhead inspections and autonomous mobile robots for ground-level retro-reflectivity measurements, these tasks can be executed remotely and autonomously, thereby eliminating the need for on-site manual operations. The continuous monitoring of environmental and positional data through the digital twin further enhances safety by enabling real-time supervision and decision-making without physical exposure to the work zone.
Another key advantage lies in the scalability of the proposed system, which can be extended to cover extensive road networks with minimal additional human or logistical effort. The autonomous navigation capabilities of UAVs and AMRs, combined with their integration into a cloud-based digital twin, allow multiple agents to operate concurrently across distributed maintenance sites. This multi-agent coordination enables efficient scheduling, resource optimisation, and dynamic reallocation of inspection missions according to weather conditions, asset priority, or detected anomalies. As a result, infrastructure managers can shift from periodic and reactive inspections to continuous, data-driven maintenance strategies that are cost-effective and adaptable to different road typologies and operational constraints.

6.2. Limitations and Challenges

6.2.1. UAV Sensor Accuracy in Adverse Weather

The current system’s perception capabilities are constrained by environmental conditions that affect sensor performance. The RGB camera’s detection accuracy degrades significantly under adverse weather conditions such as heavy rain, fog, or snow, which reduce the contrast and visibility of traffic signs and road markings. Similarly, LiDAR intensity measurements used for retro-reflectivity analysis can be affected by rain or atmospheric moisture, as water droplets scatter the laser pulses and introduce noise into the intensity readings. The validation campaigns were conducted under favourable weather conditions (clear or partly cloudy skies, dry roads, and wind speeds below 10 m/s), and system performance under challenging meteorological scenarios remains to be systematically characterised.
Additionally, lighting conditions significantly impact the camera-based perception modules. While the deep learning models were trained with data augmentation including various illumination scenarios, extreme conditions—such as direct sunlight causing lens flare, deep shadows on signs, or low-light situations near dawn or dusk—may reduce detection confidence scores and increase false-positive rates. The gimbal-mounted sensors lack active illumination systems, limiting operations to daylight hours with adequate natural lighting.

6.2.2. UAV Computational Demands of Real-Time Data Processing

While the NVIDIA Jetson Orin NX enables onboard execution of deep learning inference, the computational requirements impose constraints on system scalability and operational flexibility. The current perception pipeline processes camera streams at approximately 71.75 ms per frame for semantic segmentation and comparable rates for object detection using TensorRT-optimised models. Although these inference times enable real-time operation at typical UAV flight speeds (5–10 m/s), they represent near-maximum GPU utilisation, leaving limited computational headroom for additional perception tasks or higher-resolution imagery processing.
The multi-model architecture—comprising YOLOX for detection, UPerNet for segmentation, and LiDAR processing and sensor fusion algorithms—requires careful resource management and sequential processing scheduling to avoid frame dropping or processing delays. Memory constraints on the embedded platform (shared between model weights, intermediate feature maps, and point-cloud data) necessitate model compression techniques and limit the complexity of deployable neural network architectures. More sophisticated models with higher accuracy potential (e.g., larger backbone networks, transformer-based architectures, or multi-scale processing) cannot be accommodated without exceeding real-time performance requirements.
Furthermore, simultaneous logging of raw sensor data for post-flight analysis—such as high-resolution imagery, full LiDAR point clouds, and telemetry—competes with processing resources and storage bandwidth, requiring trade-offs between real-time autonomous operation and comprehensive data archiving for quality assurance and algorithm refinement.

6.2.3. AMR General Limitations

In the case of the AMR, several limitations and challenges must be addressed for a more complete and robust deployment in real-world scenarios.
The first limitation is regulatory. Current EU regulations (2022/1426) restrict the use of fully automated vehicles to three scenarios: predefined-area operations, hub-to-hub routes, and automated valet parking. As a result, the deployment of a fully autonomous AMR on open roads is currently not permitted and would require a closed environment, significantly reducing the benefits of the solution.
Technically, the main current limitation is the robust detection and alignment of a variety of road signs under different conditions, including variations in colour, background, and ambient lighting. The tested solution focuses on lines and relies heavily on specific shapes and contrast. To broaden the system’s applicability, a more advanced, AI-driven object detection and tracking system should be developed and deployed to ensure reliable detection of multiple marking types under all conditions.
Finally, most of the challenges faced by autonomous driving must be addressed, particularly in decision-making and planning, safety and reliability, cybersecurity, and public acceptance.

7. Conclusions and Future Work

This paper presents a road-maintenance use case as an end-to-end, human-centric digitalised workflow that connects autonomous inspection assets with a digital twin for decision support. The demonstrated pipeline shows how heterogeneous sensing and autonomy can be orchestrated into a consistent operational process, reducing manual effort and enabling more systematic and repeatable asset condition assessment.
Despite the successful validation of the proposed workflow, this work remains constrained by several methodological and operational limitations that should be acknowledged. The experiments were conducted under favourable weather and lighting conditions, and therefore the robustness of the UAV perception pipeline under adverse meteorological scenarios, low illumination, or high-glare scenes has not yet been fully characterised. Similarly, the embedded computation available on the UAV and AMR platforms limited the complexity of deployable models and required trade-offs between inference accuracy, resolution, and real-time processing. On the regulatory side, both aerial and ground robotic deployments were bounded by current EU operational constraints, which restrict the generality of the demonstrated autonomy. These limitations do not undermine the feasibility of the approach but highlight the need for broader, more challenging validation campaigns and for system designs that explicitly incorporate resilience, redundancy, and compliance considerations.
Experimental validation in a representative road environment confirmed the feasibility of the integrated approach and highlighted the practical value of coupling robotic inspection with a DT layer. Beyond pure data acquisition, the DT provides traceability, contextualisation, and operational readiness by consolidating observations into actionable indicators. At the same time, the trials exposed real-world constraints typical of outdoor robotics—such as variable illumination, weather sensitivity, computational limits on embedded platforms, and the need for robust localisation and mission execution under safety constraints—reinforcing the importance of designing for resilience rather than ideal conditions.
Future work should address these limitations through sensor redundancy (e.g., thermal imaging for low-light conditions), improvements in algorithm robustness (e.g., training with adverse-weather synthetic data), and the development of weather-adaptive thresholds that dynamically adjust detection confidence requirements based on real-time environmental assessments. Further improvements could leverage next-generation embedded computing platforms with enhanced GPU capabilities, implement hierarchical processing strategies (e.g., lower-resolution full-frame analysis for detection followed by high-resolution region-of-interest processing), or explore edge-computing architectures in which preliminary processing occurs onboard while detailed analysis is offloaded to ground-based systems via high-bandwidth communication links. Additionally, research into more efficient neural network architectures optimised for aerial inspection tasks could reduce computational demands while maintaining or improving detection accuracy.
In parallel, the AMR/AGV subsystem can be extended towards higher operational autonomy and throughput by improving localisation robustness in GNSS-challenged areas, refining motion planning for lane-level precision during measurement, and integrating richer safety mechanisms and human–robot interaction protocols for mixed-traffic deployments.
On the DT side, future work should focus on scaling to larger road networks and multi-site operations, strengthening interoperability (e.g., standardised asset semantics and interfaces), and closing the loop from inspection to intervention by integrating predictive maintenance models, automated work order generation, and continuous performance monitoring (including data quality, drift detection, and MLOps practices). A logical progression for the dashboard and its underlying KPI ontology is to expand the system with predictive analytics and automated reasoning, enabling it to shift from merely reporting current conditions to actively forecasting risks, inefficiencies, and sustainability impacts. Enhancing these capabilities should go hand in hand with further refining the ontology and strengthening its alignment with key international standards—particularly those governing construction data, BIM frameworks, and sensor interoperability—to ensure long-term scalability and cross-platform compatibility. Formalising and disseminating the ontology through recognised standardisation bodies or publication channels would bolster its credibility and promote its adoption across the construction industry.
Finally, broader validation campaigns—across seasons, weather conditions, and road typologies—will be essential to quantify long-term reliability and to mature the solution for routine deployment by road operators.
Beyond technical maturation, real-world deployment in operational roads and public spaces is strongly conditioned by normative and regulatory constraints. These include aviation regulations for UAV operations (e.g., authorisation requirements, geofencing, operational limitations, and procedures for flying near traffic and populated areas), as well as safety and liability obligations for ground robots operating in proximity to vehicles and pedestrians (e.g., functional safety, fail-safe behaviour, emergency stop, speed and space separation, and risk assessments aligned with applicable standards and road operator rules). Future work should therefore incorporate “compliance-by-design” approaches: early engagement with road authorities and regulators, structured safety cases and operational risk assessments, geo-fenced and supervised modes as intermediate steps toward higher autonomy, robust cybersecurity and data protection measures for connected DT pipelines, and clear human-in-the-loop procedures for mission approval, incident handling, and accountability. Addressing these aspects alongside performance metrics is essential to move from demonstrations to routine, scalable deployments.
More broadly, the proposed paradigm—robotic, data-driven inspection coupled with a DT for operational decision support—has the potential to shift road maintenance from periodic, manual surveys towards continuous, measurable, and risk-informed asset management. By improving inspection frequency, traceability, and the timeliness of interventions, such systems can support safer roads, reduce traffic disruption through better planning of works, and enable more efficient allocation of resources by prioritising maintenance based on objective condition indicators. Beyond road maintenance, the same architecture can be extrapolated to other infrastructure domains that require recurrent inspection and performance tracking, such as railways, tunnels, bridges, ports, airports, and industrial facilities. In these contexts, heterogeneous robotic sensing (aerial and ground), standardised data pipelines, and DT-based analytics can similarly enable scalable monitoring, consistent reporting, and progressive automation of inspection-to-intervention workflows, supporting more resilient and sustainable infrastructure operations.

Author Contributions

Conceptualisation, A.C.-A., J.C.J.F., M.A.M.-G. and I.V.; methodology, A.C.-A., J.C.J.F., M.A.M.-G., N.P., I.V., I.S., S.S. and D.R.; software, A.C.-A., P.J.-C., M.A.M.-G., N.P. and I.V.; validation, A.C.-A., J.C.J.F., P.J.-C., M.A.M.-G., N.P., I.V., I.S., S.S. and D.R.; formal analysis, A.C.-A., J.C.J.F., M.A.M.-G., N.P. and I.V.; investigation, A.C.-A., J.C.J.F., M.A.M.-G., N.P. and I.V.; resources, A.C.-A., J.C.J.F., M.A.M.-G., N.P., D.S. and I.V.; data curation, A.C.-A., J.C.J.F., M.A.M.-G., N.P. and I.V.; writing—original draft preparation, A.C.-A., J.C.J.F., M.A.M.-G., N.P., I.V., I.S., S.S. and D.R.; writing—review and editing, A.C.-A., J.C.J.F., M.A.M.-G., N.P., D.S., I.V., I.S., S.S. and D.R.; visualisation, A.C.-A., J.C.J.F., M.A.M.-G., N.P. and I.V.; supervision, A.C.-A., J.C.J.F., M.A.M.-G., N.P., D.S. and I.V.; project administration, J.C.J.F. and D.S.; funding acquisition, J.C.J.F. All authors have read and agreed to the published version of the manuscript.

Funding

This work was performed within the context of the BEEYONDERS project, funded by the Horizon Europe research and innovation programme under grant agreement No 101058548.

Data Availability Statement

The raw data supporting the conclusions of this article will be made available by the authors on request.

Acknowledgments

During the preparation of this manuscript, the authors used Gure-GPT v0.8.10 (internal TECNALIA GenAI tool) for the purposes of providing initial document structure. The authors have reviewed and edited the output and take full responsibility for the content of this publication.

Conflicts of Interest

The authors declare no conflicts of interest.

Abbreviations

The following abbreviations are used in this manuscript:
AECArchitecture, Engineering, and Construction
AIArtificial Intelligence
AMRAutonomous Mobile Robot
APIApplication Programming Interface
BIMBuilding Information Modelling
CADComputer-Aided Design
CANController Area Network
DTDigital Twin
EKFExtended Kalman Filter
ETSCEuropean Transport Safety Council
EUEuropean Union
FEMFlexbotics Execution Manager
FSMFinite State Machine
GDPGross Domestic Product
GNSSGlobal Navigation Satellite System
GPSGlobal Positioning System
GTSDBGerman Traffic Sign Detection Benchmark
IMUInertial Measurement Unit
IoTInternet of Things
KPIKey Performance Indicator
LCIALife Cycle Impact Assessment
LiDARLight Detection And Ranging
MTOWMaximum Take-Off Weight
NDTNormal Distribution Transform
NEMANational Electrical Manufacturers Association
PIDProportional–Integral–Derivative
RGBRed–Green–Blue
ROSRobot Operating System
RTK-GPSReal-Time Kinematics Global Positioning System
SLAMSimultaneous Localisation And Mapping
SSMsSmach State Machines
UAVUnmanned Aerial Vehicle
UTMUniversal Transverse Mercator

References

  1. Brons, M.; Dijkstra, L.; Ibáñez, J.N.; Poelman, H. Road Infrastructure in Europe: Road Length and Its Impact on Road Performance; Number WP 03/2022; Publications Office of the European Union: Luxembourg, 2022. [Google Scholar]
  2. Eurostat. Expenditure on Road Transport Vehicles and Road Infrastructure. 2026. Available online: https://ec.europa.eu/eurostat/databrowser/view/road_ec_invest/default/table?lang=en (accessed on 11 March 2026).
  3. European Comission—Directorate-General for Mobility and Transport. EU Road Fatalities Drop by 3% in 2024, but Progress Remains Slow. 2025. Available online: https://transport.ec.europa.eu/news-events/news/eu-road-fatalities-drop-3-2024-progress-remains-slow-2025-03-18_en (accessed on 11 March 2026).
  4. European Transport Safety Council. Up to 40% of Road Deaths in Europe Are Work-Related. 2017. Available online: https://etsc.eu/up-to-40-of-road-deaths-in-europe-are-work-related/ (accessed on 11 March 2026).
  5. Xu, J.; N’Zebo, R.A.; Taha-Abdalgadir, H.; d’Avigneau, A.M.; Palin, D.; Wei, R.; Hadjidemetriou, G.; Schaefer, S.; de Silva, L.; Al-Tabbaa, A.; et al. Highway digital twin-enabled Autonomous Maintenance Plant: A perspective. Data-Centric Eng. 2024, 5, e24. [Google Scholar] [CrossRef] [Scilit]
  6. Yan, Y.; Ni, L.; Sun, L.; Wang, Y.; Zhou, J. Digital twin enabling technologies for advancing road engineering and lifecycle applications. Engineering 2025, 44, 184–206. [Google Scholar] [CrossRef] [Scilit]
  7. Adibfar, A.; Razkenari, M.; Costin, A. Review and assessment of technical and legal challenges in application of unmanned aerial vehicles in monitoring and inspection of bridges. Intell. Transp. Infrastruct. 2023, 2, liad023. [Google Scholar] [CrossRef] [Scilit]
  8. Soni, S. DROIDS—Information Maintenance and Availability. 2024. Available online: https://www.cedr.eu/docs/view/67bf3ab3bf2a1-en (accessed on 11 March 2026).
  9. Omrany, H.; Al-Obaidi, K.M.; Husain, A.; Ghaffarianhoseini, A. Digital Twins in the Construction Industry: A Comprehensive Review of Current Implementations, Enabling Technologies, and Future Directions. Sustainability 2023, 15, 908. [Google Scholar] [CrossRef] [Scilit]
  10. Opoku, D.G.J.; Perera, S.; Osei-Kyei, R.; Rashidi, M. Digital twin application in the construction industry: A literature review. J. Build. Eng. 2021, 40, 102726. [Google Scholar] [CrossRef] [Scilit]
  11. Chen, X.; Liu, C.; Chen, L.; Zhu, X.; Zhang, Y.; Wang, C. A Pavement Crack Detection and Evaluation Framework for a UAV Inspection System Based on Deep Learning. Appl. Sci. 2024, 14, 1157. [Google Scholar] [CrossRef] [Scilit]
  12. Aldoski, Z.N.; Koren, C. Assessment of traffic sign retroreflectivity for autonomous vehicles: A comparison between handheld retroreflectometer and LiDAR data. Arch. Transp. 2024, 70, 7–26. [Google Scholar] [CrossRef] [Scilit]
  13. Yang, X.; Zhang, J.; Liu, W.; Jing, J.; Zheng, H.; Xu, W. Automation in road distress detection, diagnosis and treatment. J. Road Eng. 2024, 4, 1–26. [Google Scholar] [CrossRef] [Scilit]
  14. Huang, X.; Houshangi, N. A vision-based autonomous lane following system for a mobile robot. In 2009 IEEE International Conference on Systems, Man and Cybernetics; IEEE: Piscataway, NJ, USA, 2009; pp. 2344–2349. [Google Scholar] [CrossRef] [Scilit]
  15. Khanmohamadi, M.; Guerrieri, M. Advanced Sensor Technologies in CAVs for Traditional and Smart Road Condition Monitoring: A Review. Sustainability 2024, 16, 8336. [Google Scholar] [CrossRef] [Scilit]
  16. Munasinghe, I.; Perera, A.; Deo, R.C. A Comprehensive Review of UAV-UGV Collaboration: Advancements and Challenges. J. Sens. Actuator Netw. 2024, 13, 81. [Google Scholar] [CrossRef] [Scilit]
  17. Hakimi, O.; Liu, H.; Abudayyeh, O.; Houshyar, A.; Almatared, M.; Alhawiti, A. Data Fusion for Smart Civil Infrastructure Management: A Conceptual Digital Twin Framework. Buildings 2023, 13, 2725. [Google Scholar] [CrossRef] [Scilit]
  18. Node-RED. Available online: https://nodered.org/ (accessed on 11 March 2026).
  19. GraphDB. Available online: https://graphdb.ontotext.com/ (accessed on 11 March 2026).
  20. InfluxDB. Available online: https://www.influxdata.com/ (accessed on 11 March 2026).
  21. Quigley, M.; Gerkey, B.; Conley, K.; Faust, J.; Foote, T.; Leibs, J.; Berger, E.; Wheeler, R.; Ng, A. ROS: An open-source Robot Operating System. In ICRA Workshop on Open Source Software; IEEE: Piscataway, NJ, USA, 2009; Volume 3, p. 5. [Google Scholar]
  22. Epic Games. Unreal Engine. Available online: https://www.unrealengine.com (accessed on 11 March 2026).
  23. Shah, S.; Dey, D.; Lovett, C.; Kapoor, A. AirSim: High-Fidelity Visual and Physical Simulation for Autonomous Vehicles. arXiv 2017, arXiv:1705.05065. [Google Scholar]
  24. Xiao, T.; Liu, Y.; Zhou, B.; Jiang, Y.; Sun, J. Unified Perceptual Parsing for Scene Understanding. In Proceedings of the Computer Vision—ECCV 2018; Ferrari, V., Hebert, M., Sminchisescu, C., Weiss, Y., Eds.; Springer: Cham, Switzerland, 2018; pp. 432–448. [Google Scholar]
  25. Ge, Z.; Liu, S.; Wang, F.; Li, Z.; Sun, J. YOLOX: Exceeding YOLO Series in 2021. arXiv 2021, arXiv:2107.08430. [Google Scholar] [CrossRef] [Scilit]
  26. Ai, C.; Tsai, Y.J. An automated sign retroreflectivity condition evaluation methodology using mobile LIDAR and computer vision. Transp. Res. Part C Emerg. Technol. 2016, 63, 96–113. [Google Scholar] [CrossRef] [Scilit]
  27. Villaverde, I.; Urquiza, A.; Outón, J.L. A Reconfigurable UGV for Modular and Flexible Inspection Tasks in Nuclear Sites. Robotics 2024, 13, 110. [Google Scholar] [CrossRef] [Scilit]
  28. Shan, T.; Englot, B.; Meyers, D.; Wang, W.; Ratti, C.; Daniela, R. LIO-SAM: Tightly-coupled Lidar Inertial Odometry via Smoothing and Mapping. In IEEE/RSJ International Conference on Intelligent Robots and Systems (IROS); IEEE: Piscataway, NJ, USA, 2020; pp. 5135–5142. [Google Scholar]
  29. Koide, K.; Miura, J.; Menegatti, E. A portable three-dimensional LIDAR-based system for long-term and wide-area people behavior measurement. Int. J. Adv. Robot. Syst. 2019, 16, 1729881419841532. [Google Scholar] [CrossRef] [Scilit]
  30. Moore, T.; Stouch, D. A Generalized Extended Kalman Filter Implementation for the Robot Operating System. In Proceedings of the 13th International Conference on Intelligent Autonomous Systems (IAS-13); Springer: Cham, Switzerland, 2014. [Google Scholar]
  31. Fankhauser, P.; Hutter, M. A Universal Grid Map Library: Implementation and Use Case for Rough Terrain Navigation. In Robot Operating System (ROS)—The Complete Reference (Volume 1); Koubaa, A., Ed.; Springer: Cham, Switzerland, 2016; Chapter 5. [Google Scholar] [CrossRef] [Scilit]
  32. Community, S.D.M. Smart Data Models. 2023. Available online: https://github.com/smart-data-models (accessed on 30 March 2026).
  33. Herrero, H.; Outón, J.L.; Puerto, M.; Sallé, D.; López de Ipiña, K. Enhanced Flexibility and Reusability through State Machine-Based Architectures for Multisensor Intelligent Robotics. Sensors 2017, 17, 1249. [Google Scholar] [CrossRef] [Scilit] [PubMed]
  34. Bohren, J.; Cousins, S. The SMACH High-Level Executive [ROS News]. IEEE Robot. Autom. Mag. 2010, 17, 18–20. [Google Scholar] [CrossRef] [Scilit]
  35. Ministero delle Infrastrutture edei Trasporti. Codice della Strada. 2024. Available online: https://www.mit.gov.it/documentazione/codice-della-strada (accessed on 11 March 2026).
  36. UNI EN 1436:2018; Materiali Per Segnaletica Orizzontale—Prestazioni della Segnaletica Orizzontale per gli Utenti della Strada e Metodi di Prova. UNI—Ente Italiano di Normazione: Milan, Italy, 2018.
  37. UNI EN 12899-1:2008; Segnaletica Verticale Permanente—Requisiti per Segnali Nuovi Fissi non Retroriflettenti e Retroriflettenti, Inclusi Quelli Illuminati Esternamente e Quelli Transilluminati. UNI—Ente Italiano di Normazione: Milan, Italy, 2008.
  38. Stipanovic, I.; Skaric, S.; Kucinic, L. D2.3 LCA/LCC KPIs, BEEYONDERS. 2023. Available online: https://beeyonders.eu/wp-content/uploads/2025/12/D2.3-LCALCC-KPIs.pdf (accessed on 11 March 2026).
  39. ISO 14044:2006; Environmental Management—Life Cycle Assessment—Requirements and Guidelines. International Organization for Standardization: Geneva, Switzerland, 2006.
  40. EN 15804; Sustainability of Construction Works—Environmental Product Declarations—Core Rules for the Product Category of Construction Products. European Committee for Standardization (CEN): Brussels, Belgium, 2012.
  41. Wernet, G.; Bauer, C.; Steubing, B.; Reinhard, J.; Moreno-Ruiz, E.; Weidema, B. The ecoinvent database version 3 (part I): Overview and methodology. Int. J. Life Cycle Assess. 2016, 21, 1218–1230. [Google Scholar] [CrossRef] [Scilit]
  42. Castel-Branco, A.P.; Ribau, J.P.; Silva, C.M. Taxi Fleet Renewal in Cities with Improved Hybrid Powertrains: Life Cycle and Sensitivity Analysis in Lisbon Case Study. Energies 2015, 8, 9509–9540. [Google Scholar] [CrossRef] [Scilit]
  43. RICS. Life Cycle Costing, 1st ed.; Technical Report; RICS Royal Institution of Chartered Surveyors: London, UK, 2016. [Google Scholar]
  44. istat.it. Italy’s Economic Outlook 2025–2026. Available online: https://www.istat.it/en/press-release/italys-economic-outlook-2025-2026-2/ (accessed on 14 March 2026).
  45. istat.it. Hourly Wages by Employees Class. 2023. Available online: https://esploradati.istat.it/databrowser/#/en/dw/categories/{I}{T}1,{Z}0500{L}{A}{B},1.0/{L}{A}{B}_{E}{M}{P}{L}{W}{A}{G}{E}/{D}{C}{S}{C}_{R}{A}{C}{L}{I}/{I}{T}1,533_957_{D}{F}_{D}{C}{S}{C}_{R}{A}{C}{L}{I}_6,1.0 (accessed on 14 March 2026).
Figure 1. BEEYONDERS digital twin (DT) architecture.
Infrastructures 11 00124 g001
Figure 2. CATEC C750 aerial robot. (a) Computer-Aided Design (CAD). (b) Real Unmanned Aerial Vehicle (UAV).
Infrastructures 11 00124 g002
Figure 3. Complete inspection and surveillance payload.
Infrastructures 11 00124 g003
Figure 4. Final configuration of the AMR with all sensors installed in the all-weather bodywork and the liftable platform.
Infrastructures 11 00124 g004
Figure 5. Operations monitoring interface.
Infrastructures 11 00124 g005
Figure 6. Key Performance Indicator (KPI) assessment interface.
Infrastructures 11 00124 g006
Figure 7. Diagram of software components in the autonomous UAV. Blue: Raw data from a sensor; Green: Software-component block; Pink: File input provided by the operator; Brown: Information connector to make the diagram easier to read; Orange: Output to the DT.
Infrastructures 11 00124 g007
Figure 8. Evolution of designed virtual environments. (top-left) First environment created with very pronounced changes in terrain texture. (top-right) Second environment with improved ground texture and a greater variety of road shapes. (bottom-left) Third environment in which trees have also been added to cast realistic shadows and introduce different types of roads. (bottom-right) Final environment in which, in addition to trees and realistic shadows, vertical road signs have been added.
Infrastructures 11 00124 g008
Figure 9. AirSim ComputerVision mode generated images showing (a) sparse and (b) dense vegetation.
Infrastructures 11 00124 g009
Figure 10. Training images from the synthetic segmentation dataset (top), the synthetic detection dataset (bottom-left corner) and the German Traffic Sign Detection Benchmark (GTSDB) dataset (bottom-right corner).
Infrastructures 11 00124 g010
Figure 11. Two samples of line detection and direction vector estimation, with (a) the line close to be properly aligned and (b) the line on one side of the image. The red rectangle represents the bounding box approximation of detected line and the blue arrow its direction vector.
Infrastructures 11 00124 g011
Figure 12. Example of the Flexbotics Execution Manager (FEM)’s SM (right) for execution control and Smach State Machines (SSMs) for mission execution (left).
Infrastructures 11 00124 g012
Figure 13. Diagram of the software and control components and architecture of the AMR. Blue boxes represent sensor, green boxes software modules and red ovals data representations.
Infrastructures 11 00124 g013
Figure 14. Aerial view of the test site. The blue line shows the location of the closed road, while traffic-sign symbols show the approximate placement of auxiliary signage. Image courtesy of Strada dei Parchi. Map data © Google Maps, Airbus, Maxar Technologies 2025.
Infrastructures 11 00124 g014
Figure 15. Designed route for the aerial robot in GeoJSON. (left) A green line showing the planned route displayed on a GPS map. (right) Route text file in GeoJSON format.
Infrastructures 11 00124 g015
Figure 16. Aerial robot workflow.
Infrastructures 11 00124 g016
Figure 17. Zones for each type of mission. (Green) Discontinuous-line mission. (Red) Curved section. (Blue) Straight section. Map data © Google Maps, Airbus, Maxar Technologies 2025.
Infrastructures 11 00124 g017
Figure 18. Samples of trajectories followed in each test type (green for the discontinuous-line test, red for the curved-line test, and purple for the straight-section test), with approximate measurement positions. Map data © Microsoft, Bing Maps, and its data providers.
Infrastructures 11 00124 g018
Figure 19. C750 performing an autonomous road assessment in L’Aquila.
Infrastructures 11 00124 g019
Figure 20. Traffic-sign detection validation flying at 20 m with 30° pitch on the gimbal, showing the test site from (a) west–east and (b) east–west directions.
Infrastructures 11 00124 g020
Figure 21. Road semantic segmentation validation flying at 20 m with 30° pitch on the gimbal, showing the test site from (a) west–east and (b) east–west directions.In the segmentation images, vegetation is masked in green, the road in purple, and the background in other colours.
Infrastructures 11 00124 g021
Figure 22. Roadside vegetation invasion near a secondary road. (left) Camera image; (right) segmentation result. Vegetation is marked in green and the road in purple.
Infrastructures 11 00124 g022
Figure 23. Retro-reflectivity assessment. (a) LiDAR detection 3D visualisation using retro-reflectivity as a colour map. Red dots indicate higher reflectivity. (b) Deep-learning detection from the camera.
Infrastructures 11 00124 g023
Figure 24. 3D point-cloud map of the testing area. Environmental elements like trees or crash barriers can be observed. Note that highly reflective elements such as vertical signals and traffic cones also appear in brighter colours.
Infrastructures 11 00124 g024
Figure 25. Tolerance between line and kerb.
Infrastructures 11 00124 g025
Figure 26. GWP 100 total comparison for four combinations of vehicles used in the reference scenario and the BEEYONDERS scenario for road inspection.
Infrastructures 11 00124 g026
Figure 27. Economic impact result for the two analysed scenarios.
Infrastructures 11 00124 g027
Figure 28. Operational efficiency—overall duration of the process for obstacle detection on the road and the removal of detected objects/materials.
Infrastructures 11 00124 g028
Table 1. Traffic sign detection performance comparison between synthetic-only and hybrid training datasets (IoU threshold = 0.5).
Training DataRecallmAP@0.5
Synthetic only0.9280.899
Hybrid (Synthetic + real)0.9590.895
Table 2. Per-class segmentation performance of the UPerNet model on the synthetic validation dataset.
ClassIoU (%)Acc (%)
Background99.1199.53
Road96.6198.04
Vegetation76.5187.63
Table 3. Preliminary qualitative comparison of conventional and automated road inspection processes.
IndicatorREFERENCE (Conventional Process)BEEYONDERS (Automated Inspection Process)Indicative Impact
Safety
Exposure
Medium–high (routine work near live lanes)Very low (remote operations, no roadside presence)Substantial reduction in worker exposure
Environmental
Impact
Diesel/hybrid fleet → fuel consumption and CO2 emissionsElectric AMRs & UAVs → low-carbon operationPotential reduction in operational emissions
Data
Integration
Manual or semi-automatic upload; separate systemsFully automatic cloud sync to digital twinImproved real-time integration & traceability
Inspection
Frequency
Annual + targeted repeatsAnnual + on-demand or continuous digital checksIncreased temporal monitoring capability
Cost
Drivers
Labour, fuel, vehicle maintenanceEquipment amortisation, energy, softwareShift from operational to capital cost; potential long-term savings
Operational
Characteristics
High throughput but labour-intensive; moderate safety; fragmented data chainLower per-unit speed but scalable, safe, and digitally integratedOperational procedure shifts from labour-intensive to technology-driven operations
Table 4. Energy consumption KPIs for reference-scenario road maintenance with various engine options.
Inspection TypeHorizontal
Signage
Vertical
Signage
Obstacle
Detection
DieselHybrid/
Petrol
DieselHybrid/
Petrol
DieselHybrid/
Petrol
Electric
Distance covered (vehicles·km)1111444
Fuel consumption rate (L /100 km)85.685.685.6n/a
Total fuel per 1 km (L)0.080.0560.080.0560.320.224n/a
Energy consumption rate per km (kWh)0.800.540.800.543.202.170.80
Total energy consumption per km (kWh):
Only diesel vehicles: 4.8
Only hybrid/petrol vehicles: 3.26
Diesel for vertical + horizontal, EV for obstacle detection: 2.4
Hybrid/petrol for vertical + horizontal, EV for obstacle detection: 1.88
Table 5. Energy consumption KPIs for the BEEYONDERS scenario with an AMR and UAV.
Inspection TypeHorizontal Signage (1 AMR)Vertical Signage (1 UAV)Obstacle Detection (3 UAVs)IT Equipment (Laptop)
Electricity consumption per km (kWh)0.120.110.330.03
Total electricity consumption per km (kWh): 0.59
Table 6. Environmental KPIs for the reference scenario with four vehicle options. (The functional unit in the table dataset represents the service of transport in a passenger car with an internal combustion engine (powered by diesel or hybrid/petrol) and electric engine, for a journey length of 1 km (Source: ECOINVENT 3.12. database). The vehicle size is large, with an engine size above 2.0 L and an average weight of 2000 kg. The data used for the creation of the global datasets are initially based on European data. Technology classifications are based on those used widely within the works of the European Environment Agency, particularly in the Emissions Inventory Guidebook).
Impact IndicatorOnly Diesel
Vehicles
Only Hybrid/
Petrol
Diesel for Vertical + Horizontal, EV for Obstacle DetectionHybrid/Petrol for Vertical + Horizontal, EV for Obstacle DetectionUnit
Global Warming Potential total (GWP-total)2.491.751.791.54kg CO2 eq./km
Global Warming Potential fossil fuels (GWP-fossil)2.491.75 8.33 × 10 1 5.84 × 10 1 kg CO2 eq./km
Global Warming Potential biogenic (GWP-biogenic) 9.64 × 10 4 5.91 × 10 4 9.59 × 10 1 9.58 × 10 1 kg CO2 eq./km
Global Warming Potential land use and land use change (GWP-luluc) 1.10 × 10 3 6.80 × 10 4 2.00 × 10 3 1.86 × 10 3 kg CO2 eq./km
Abiotic depletion potential fossil resources (ADPF) 3.37 × 10 1 2.26 × 10 1 2.41 × 10 1 2.04 × 10 1 MJ/km
Abiotic depletion potential non-fossil resources (ADPE) 2.85 × 10 5 1.73 × 10 5 1.84 × 10 5 1.47 × 10 5 kg Sb eq./km
Acidification potential Accumulated Exceedance (AP) 9.45 × 10 3 4.57 × 10 3 9.43 × 10 3 7.79 × 10 3 mol H+ eq./km
Depletion potential of the stratospheric ozone layer (ODP) 5.97 × 10 8 3.91 × 10 8 3.24 × 10 8 2.57 × 10 8 kg CFC-11 eq./km
Eutrophication potential freshwater (EP-freshwater) 3.61 × 10 4 5.69 × 10 5 1.76 × 10 4 9.71 × 10 5 kg P eq./km
Eutrophication potential marine (EP-marine) 2.78 × 10 3 7.84 × 10 4 1.96 × 10 3 1.30 × 10 3 kg N eq./km
Eutrophication potential terrestrial (EP-terrestrial) 3.00 × 10 2 8.79 × 10 3 2.11 × 10 2 1.41 × 10 2 mol N eq./km
Photochemical Ozone Creation Potential (POCP) 1.21 × 10 2 5.90 × 10 3 9.36 × 10 3 7.32 × 10 3 kg NMVOC eq./km
Water (user) deprivation potential (WDP) 2.85 × 10 1 1.81 × 10 1 3.66 × 10 1 3.31 × 10 1 m3 World eq./km
Table 7. Environmental KPIs for the BEEYONDERS scenario.
Impact IndicatorHorizontal, Vertical and
Obstacle Detection
Unit
Global Warming Potential total (GWP-total) 2.29 × 10 1 kg CO2 eq./km
Global Warming Potential fossil fuels (GWP-fossil) 2.29 × 10 1 kg CO2 eq./km
Global Warming Potential biogenic (GWP-biogenic) 4.66 × 10 4 kg CO2 eq./km
Global Warming Potential land use and land use change (GWP-luluc) 4.80 × 10 5 kg CO2 eq./km
Abiotic depletion potential fossil resources (ADPF)3.65MJ/km
Abiotic depletion potential non-fossil resources (ADPE) 2.69 × 10 6 kg Sb eq./km
Acidification potential, Accumulated Exceedance (AP) 1.00 × 10 3 mol H+ eq./km
Depletion potential of the stratospheric ozone layer (ODP) 5.85 × 10 9 kg CFC-11 eq./km
Eutrophication potential freshwater (EP-freshwater) 7.78 × 10 5 kg P eq./km
Eutrophication potential marine (EP-marine) 1.64 × 10 4 kg N eq./km
Eutrophication potential terrestrial (EP-terrestrial) 1.72 × 10 3 mol N eq./km
Photochemical Ozone Creation Potential (POCP) 6.22 × 10 4 kg NMVOC eq./km
Water (user) deprivation potential (WDP) 1.08 × 10 1 m3 World eq./km
Disclaimer/Publisher’s Note: The statements, opinions and data contained in all publications are solely those of the individual author(s) and contributor(s) and not of MDPI and/or the editor(s). MDPI and/or the editor(s) disclaim responsibility for any injury to people or property resulting from any ideas, methods, instructions or products referred to in the content.