Article

Structural Characteristics and Damage Analysis of Beijing Wanning Bridge Under the Coupling Effect of Dynamic Traffic and Subway Vibrations

School of Architecture and Urban Planning, Beijing University of Civil Engineering and Architecture, Beijing 100022, China
*
Author to whom correspondence should be addressed.
Infrastructures 2025, 10(9), 251; https://doi.org/10.3390/infrastructures10090251
Submission received: 7 August 2025 / Revised: 14 September 2025 / Accepted: 15 September 2025 / Published: 19 September 2025
(This article belongs to the Section Infrastructures and Structural Engineering)

Abstract

The Wanning Bridge is a critical component of Beijing’s Central Axis World Heritage site and the only Yuan Dynasty heritage bridge in Beijing still in service. Investigating its structural response under complex traffic conditions is therefore essential for ensuring the longevity of this ancient structure and the safety of the urban transport system. However, the application of traditional research methods, such as direct sampling, is often constrained by the cultural relic characteristics of heritage bridges. This study first conducted a macroscopic on-site survey to document its current appearance and global geometry. Subsequently, more accurate geometric and material parameters of the bridge were acquired through non-destructive testing techniques including 3D laser scanning, ground-penetrating radar, and ultrasonic testing. Subsequently, using a combined approach of experimental and numerical simulation, this study reveals key structural responses and damage conditions of the bridge through static, dynamic, and metro-induced vibration tests. Dynamic tests show a maximum deformation of 0.26 mm and a natural frequency of 10.547 Hz, indicating shear strain accumulation as the primary damage driver. Subway-induced vibrations are well within the safety limits for stone relics, and the structure’s current load-bearing capacity complies with Class-II highway standards.

1. Introduction

As witnesses to historical development, ancient bridges possess robust structural forms that embody not only transportation utility but also industrial and cultural significance [1]. Oglethorpe examines the impact of industrial development on the Forth Bridge from a conservation perspective [2] and calls on researchers around the world to pay attention to the protection of industrial heritage. Frank’s research on urban cultural heritage conservation and management specifically highlighted bridges as critical case studies [3]. However, urban modernization, characterized by road renovations and intensive traffic loads, has posed new challenges to the conservation of ancient bridges. For instance, Hong [4] and North et al. [5] investigated strategies for optimizing heritage conservation and management of Korean stone bridges and New South Wales timber truss bridges under modern traffic loads, respectively. China hosts numerous historic bridges, most of which remain functionally active in transportation networks, necessitating a systematic restoration and monitoring framework for heritage bridge conservation.
Recent years have witnessed extensive scholarly investigations into the structural characteristics, damage pathology analysis, and load–response mechanisms of historic bridges, yielding significant research advancements [6]. Theoretically, structural characterization reveals load-transfer mechanisms and damage evolution patterns in historic bridges, providing critical theoretical foundations for scientifically evaluating bridge performance. In terms of research methodology, Xiao et al. [7,8] proposed a partial-model-based damage detection method for damage identification in extra-long steel truss bridges. This technique effectively circumvents the need for constructing a global structural model, thereby reducing the complexity of damage identification for large-scale structures and improving detection efficiency. Ma et al. [9], Han et al. [10], Mai et al. [11], and Aytulun et al. [12] used hierarchical comprehensive assessment, finite element modeling and digital intelligence, and systematic analysis of the stone arch bridge load carrying capacity and damage mechanism, and this study emphasizes the importance of finite element simulation and comparison of the old and new load standards, as well as the fusion of digital technology, to provide technical support for the development of repair measures for ancient bridges and the construction of an adaptive assessment system. China possesses a vast number of historically significant stone bridges. Zhao [13] focused on a specific stone arch bridge in China, analyzing the simplification methods for the spandrel structure in computational modeling, and verified the rationality of the model through comparison with measured data. Feng et al. [14] employed traditional methods such as dimensional survey and material coring tests to investigate the load-bearing capacity of a stone arch bridge. In recent years, non-destructive testing (NDT), as a non-invasive experimental approach, has been increasingly applied in the study of ancient bridges. Gong et al. [15] proposed a reliability evaluation method for arch bridge structures based on NDT and probabilistic analysis, applying it to assess the famous Zhaozhou Bridge. Their experimental results demonstrate the feasibility of NDT methods in the research of ancient bridges.
From an engineering perspective, structural condition assessment based on dynamic response analysis enables the establishment of damage warning thresholds. This provides reliable data support for formulating conservation strategies and selecting restoration techniques for the Wanning Bridge, while offering a reference for developing universal scientific preservation mechanisms for historic bridges. León et al. [16], Deng et al. [17], Roselli et al. [18] and Borlenghi et al. [19] comprehensively investigated the characteristics of ancient bridge diseases and risk evolution laws through the classification of appearance survey, bridge disease system statistics and drone image recognition technology, and proposed a framework for digital repair and maintenance technology, a dynamic protection strategy and rapid evaluation system, which provided a methodological basis for the optimization of the protection strategy and data-based dynamic management of ancient bridges. In addition, in analyzing the impact of load on bridge structure, Wang et al. [20] and Karalar et al. [21] investigated the structural response characteristics under load by comparing the old and new load standards, dynamic reduction in correction coefficients, and validation via static load test, which revealed the necessity of load adaptive assessment and the practical value of dynamic correction of bearing capacity, and provided a theoretical basis for the graded assessment of the bearing capacity of ancient bridges and determination of the priority of reinforcement. This study reveals the necessity of a load-adaptive assessment and the practical value of the dynamic correction of load capacity, and provides theoretical basis for the graded assessment of the load capacity of ancient bridges and prioritization of strengthening.
Although existing research has made significant advances in structural performance evaluation and conservation technologies for historic bridges, detailed mechanical characterization remains lacking for bridges in core historic urban areas like Beijing’s Central Axis, particularly regarding targeted studies on traffic loads and subway vibration risks. Therefore, this study integrates existing structural research methodologies for historic bridges and proposes a targeted mechanical characterization protocol for the Wanning Bridge, accounting for its unique complex loading conditions including traffic loads and subway vibrations. Section 2 conducts macroscopic damage investigation of the Wanning Bridge, documenting cracking patterns, weathering severity, and water infiltration in (i) deck systems and ancillary facilities and (ii) superstructure and substructure components. This preliminary assessment identifies damage conditions and pinpoints traffic-load-sensitive deterioration zones. Section 3 preliminarily explores its geometric and material properties through three-dimensional laser scanning, geological radar detection and elastic modulus detection of the arch ring stone. Section 4 comprehensively analyzes the bridge’s structural behavior through dynamic load testing, static load testing, and vibration monitoring. Section 5 summarizes the research conclusions of this paper and looks forward to future research priorities.

2. Damage Detection of Bridge Structure

The Wanning Bridge, a pivotal heritage structure at the northern terminus of Beijing’s Central Axis, is illustrated in Figure 1. The Wanning Bridge was initially built in 1285 as a timber structure. It was reconstructed into a stone arch bridge in 1292 to facilitate the construction of the Tonghui Canal. The extant structure preserves Ming Dynasty vault components in its upper sections and Qing Dynasty replacement railings. Designated in 2014 as a component of China’s Grand Canal World Heritage Site and among the 15 core heritage elements of Beijing’s Central Axis, it remains Beijing’s sole Yuan Dynasty bridge still actively serving urban transportation needs, demonstrating exceptional historical engineering significance.
The principal structural parameters are total length of 33.0 m, deck width of 20.5 m, clear span of 7.30 m, featuring a combined sluicegate structural system. Figure 1a details the ashlar masonry construction of superstructure and wing walls, while the abutments utilize stepped stone foundations. The pavement system, comprising flagstones for the non-motorized lane and an asphalt concrete layer for the motorized lane, is detailed in Figure 1b. The railing system adopts a stone-column structure, with parapets, ornamental posts, and drum-shaped bearing stones on the eastern and western sides, while water-dividing beast sculptures are installed at the four corners as hydraulic protective components.
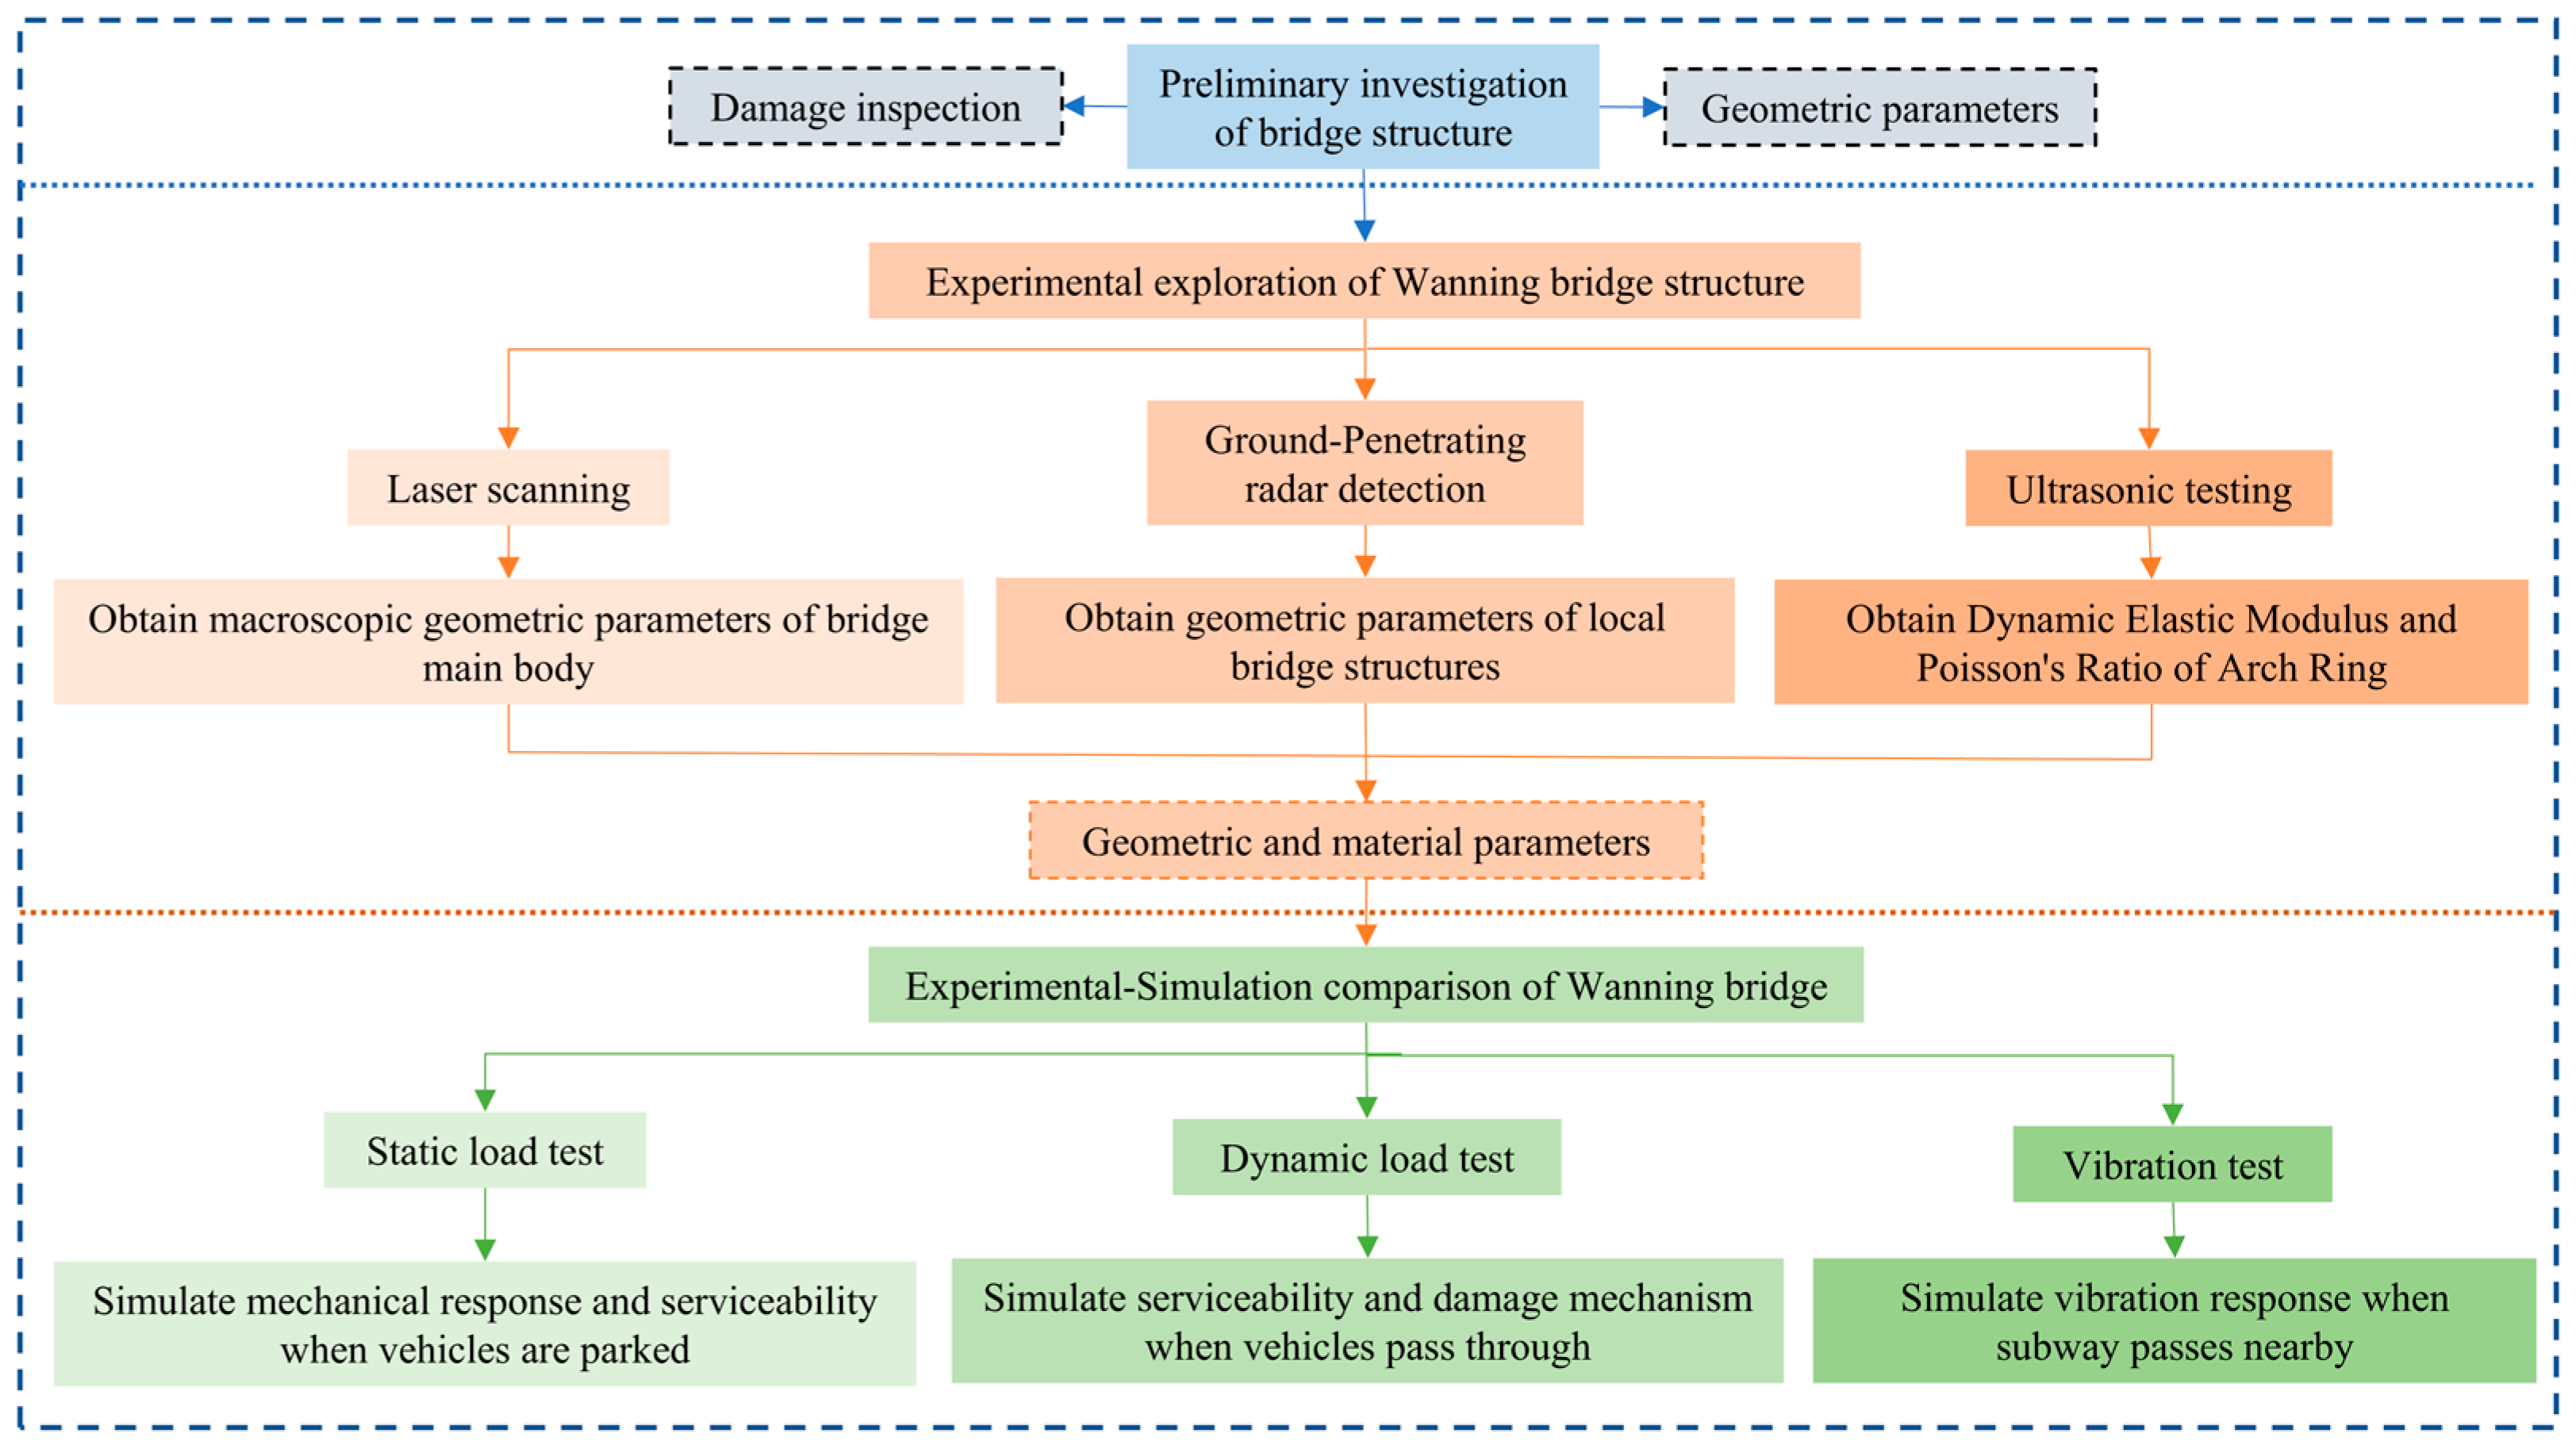
In recent years, alongside the continuous population growth in Beijing, the traffic load borne by the Wanning Bridge has increased significantly. This is reflected both in the surge of ground-level vehicle traffic and the growing complexity of Beijing’s underground transportation network. As a historical heritage bridge, timely research into its service conditions is crucial not only for the preservation of this cultural relic but also for ensuring the reliability of Beijing’s transportation network. Figure 2 illustrates the research workflow of this study: (1) A macroscopic on-site investigation was first conducted to preliminarily assess the current condition and geometric parameters of the Wanning Bridge. (2) Point cloud data of the bridge was acquired using 3D laser scanning, the thickness of local structural components was determined via ground-penetrating radar, and material parameters of the stone bridge were measured using non-metallic ultrasonic testing. A solid model for finite element modeling was developed based on the point cloud data and geometric dimensions of local structures (such as the thickness of sidewalls and stone arches) obtained from radar detection. (3) Static load tests, dynamic load tests, and monitoring of vibration responses induced by subway operations were conducted on the bridge.

2.1. Damage Detection of Bridge Deck System and Buildings on Arch

As the core load-transfer system of stone arch bridges, the deck system directly bears vehicular loads and environmental actions, transmitting mechanical effects to the main arch ring via the spandrel structure. Its serviceability profoundly influences the bridge’s global structural performance and durability [17]. Field investigations reveal notable non-structural damage in the Wanning Bridge’s deck system. Figure 3 illustrates recurrent rutting (maximum depth: 12.3 mm) and reticulated cracks (crack density: 1.8 lines/m2) in the asphalt pavement layer, predominantly concentrated near abutment joints. Stone railing systems exhibit base voids (maximum gap: 8.5 mm) and surface spalling, as also documented in Figure 3.
The spandrel structure, as a secondary load-transfer system, performs dual functions of load distribution and stress transmission. Investigations revealed typical masonry defects: (1) Intrados zone: Cracking in repair mortar (crack width: 0.5–1.2 mm) on the left arch ring, with partial ashlar detachment at the arch base; (2) Wing walls: 17.4% loss of joint filler on the left side, with 23.6% mortar cracking rate and spalling in the right brick retaining wall; (3) Ancillary components: 2.8° ± 0.5° displacement observed in the bridge’s drum-shaped bearing stones. Despite implemented weight (GVW ≤ 20 t) and speed (≤30 km/h) restrictions, the deck system’s wear rate progressively increases due to synergistic effects of sustained dynamic loads and material fatigue in this urban traffic-intensive area (daily traffic volume: 2850 vehicles).

2.2. Damage Detection of Superstructure and Substructure

The main arch ring serves as the primary load-bearing system in stone arch bridges, transferring all superstructure loads to piers or abutments. This pivotal structural element’s mechanical performance directly determines the bridge’s global stability and durability. Field surveys identified multiple ashlar cracks in the Wanning Bridge’s main arch ring, with typical crack patterns shown in Figure 4a,b (maximum crack length: 0.5 m). Figure 4b bottom illustrates the arch ring’s general weathering with localized seepage, while Figure 4c clearly shows concave deformation at the arch base with ashlar detachment and left-side repair mortar cracking.
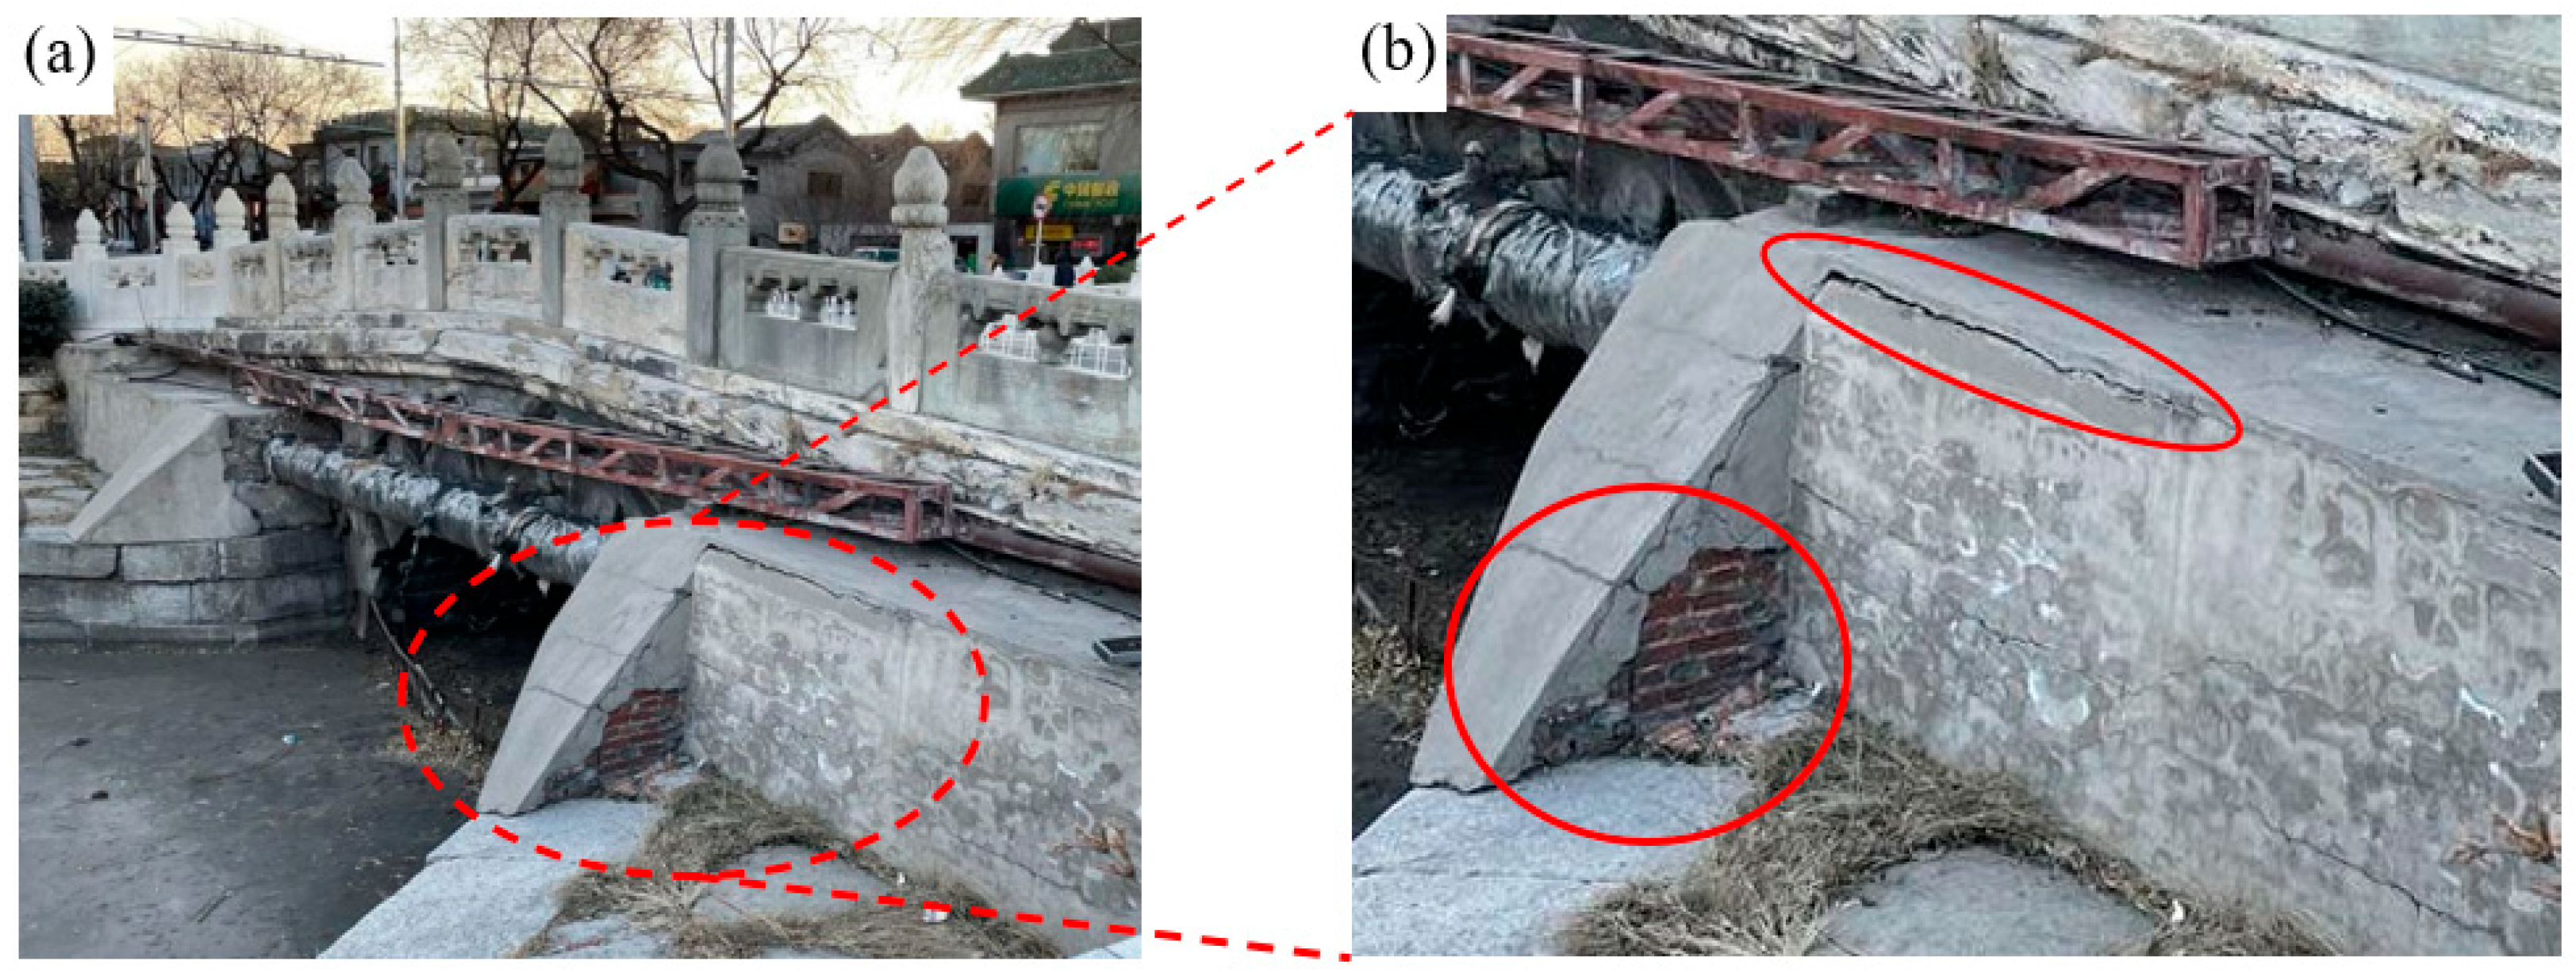
Piers and foundations directly bear dead and dynamic loads from superstructures, transferring them to the ground. Their deterioration immediately affects load-bearing capacity and may trigger bridge-wide defects. The substructure’s primary defect involves partial joint filler loss in the left abutment wing wall (Figure 5), constituting non-structural damage that solely affects durability.

3. Bridge Structure Detection

The structural geometry and material parameters of stone heritage bridges often require in situ re-measurement due to service-induced deterioration and lack of historical documentation. Therefore, this section integrates three non-destructive testing (NDT) techniques [22] to empirically characterize the Wanning Bridge’s intrinsic properties. To comprehensively investigate the geometric and material characteristics, 3D laser scanning and ground-penetrating radar (GPR) were employed to analyze the bridge’s construction features, while a non-metallic ultrasonic tester was used to determine the elastic modulus of arch ring stones.

3.1. Three-Dimensional Laser Scanning

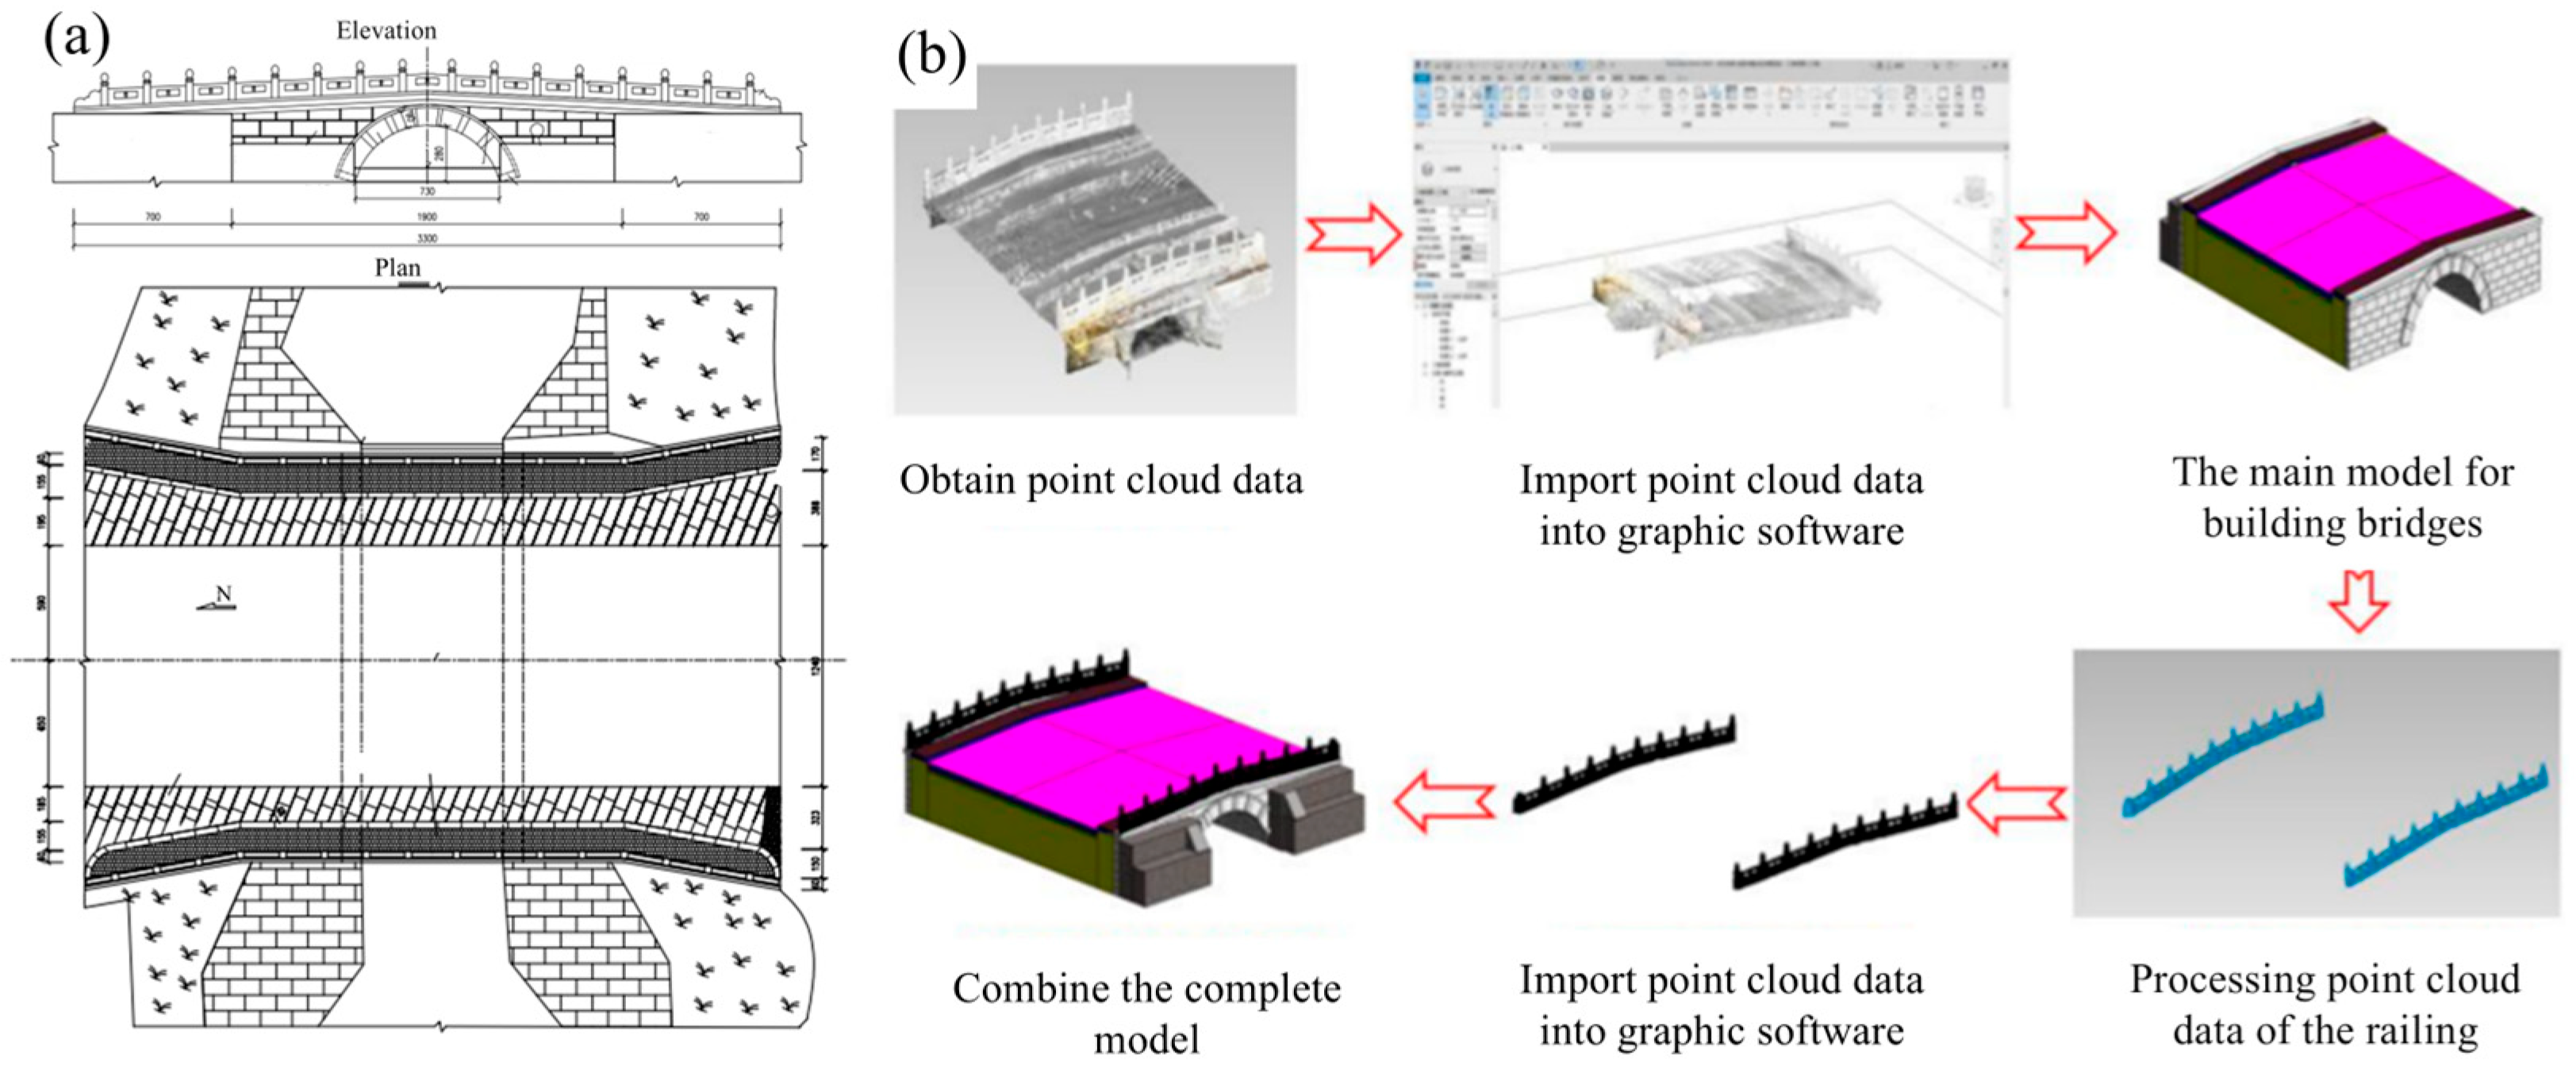
Three-dimensional laser scanning technology enables millimeter-level precision spatial data acquisition through high-speed non-contact laser measurement. Figure 6 presents a planimetric sketch of the bridge and a flowchart illustrating the process of generating a complete bridge model from point cloud data. The point cloud data were processed by being segmented into multiple parts that were individually handled before being assembled into the complete structural model. The integration of 3D laser scanning with finite element model establishes a high-precision technical approach for digital modeling and analysis of historic bridges. Compared with traditional surveying methods, this technology combines comprehensive data coverage with quantitative geometric deformation analysis, enabling complete documentation of surface deterioration characteristics and spatial variation patterns in stone masonry structures. The Wanning Bridge’s 3D morphology was reconstructed from point cloud data, with the resulting geometric models displayed in Figure 6b. The model accurately represents geometric features including the rise-to-span ratio (1:2.56), providing reliable numerical simulation for mechanical behavior analysis of the arch axis and critical load evaluation. The results show that this method can effectively support the geometric modeling process in the static load test design and structural performance prediction of stone arch bridges.

3.2. Geological Radar Detection

To accurately assess the structural safety of Wanning Bridge, this study employs Ground Penetrating Radar (GPR) technology. This technique transmits ultra-high frequency short-pulse electromagnetic waves (center frequency: 100 MHz) into the medium, enabling non-destructive detection of 3D spatial information within the structure through wave impedance interface reflections caused by dielectric constant variations [23]. Table 1 presents the geometric parameters of key load-bearing components obtained via ground-penetrating radar (GPR). The thickness of the arch ring (~90 cm) indicates significant bending stiffness, whereas the relatively thin layers—including the walkway bricks (1.5 cm), curbstones (25 cm), and paving stones in the non-motorized lane (25 cm)—collectively suggest a limited capacity for buffering direct vehicle loads (Figure 7).

3.3. Detection of Elastic Modulus of Arch Ring Stone

The primary function of ultrasonic testing is to evaluate the compactness, uniformity, and elastic properties of a material by measuring the propagation speed of high-frequency sound waves within it. The propagation speed of sound waves is directly related to the elastic modulus and density of the medium. Based on this principle, the main purpose of our current test is to assess the integrity of the bridge stone materials (such as whether there are cavities, cracks, etc., as defects).
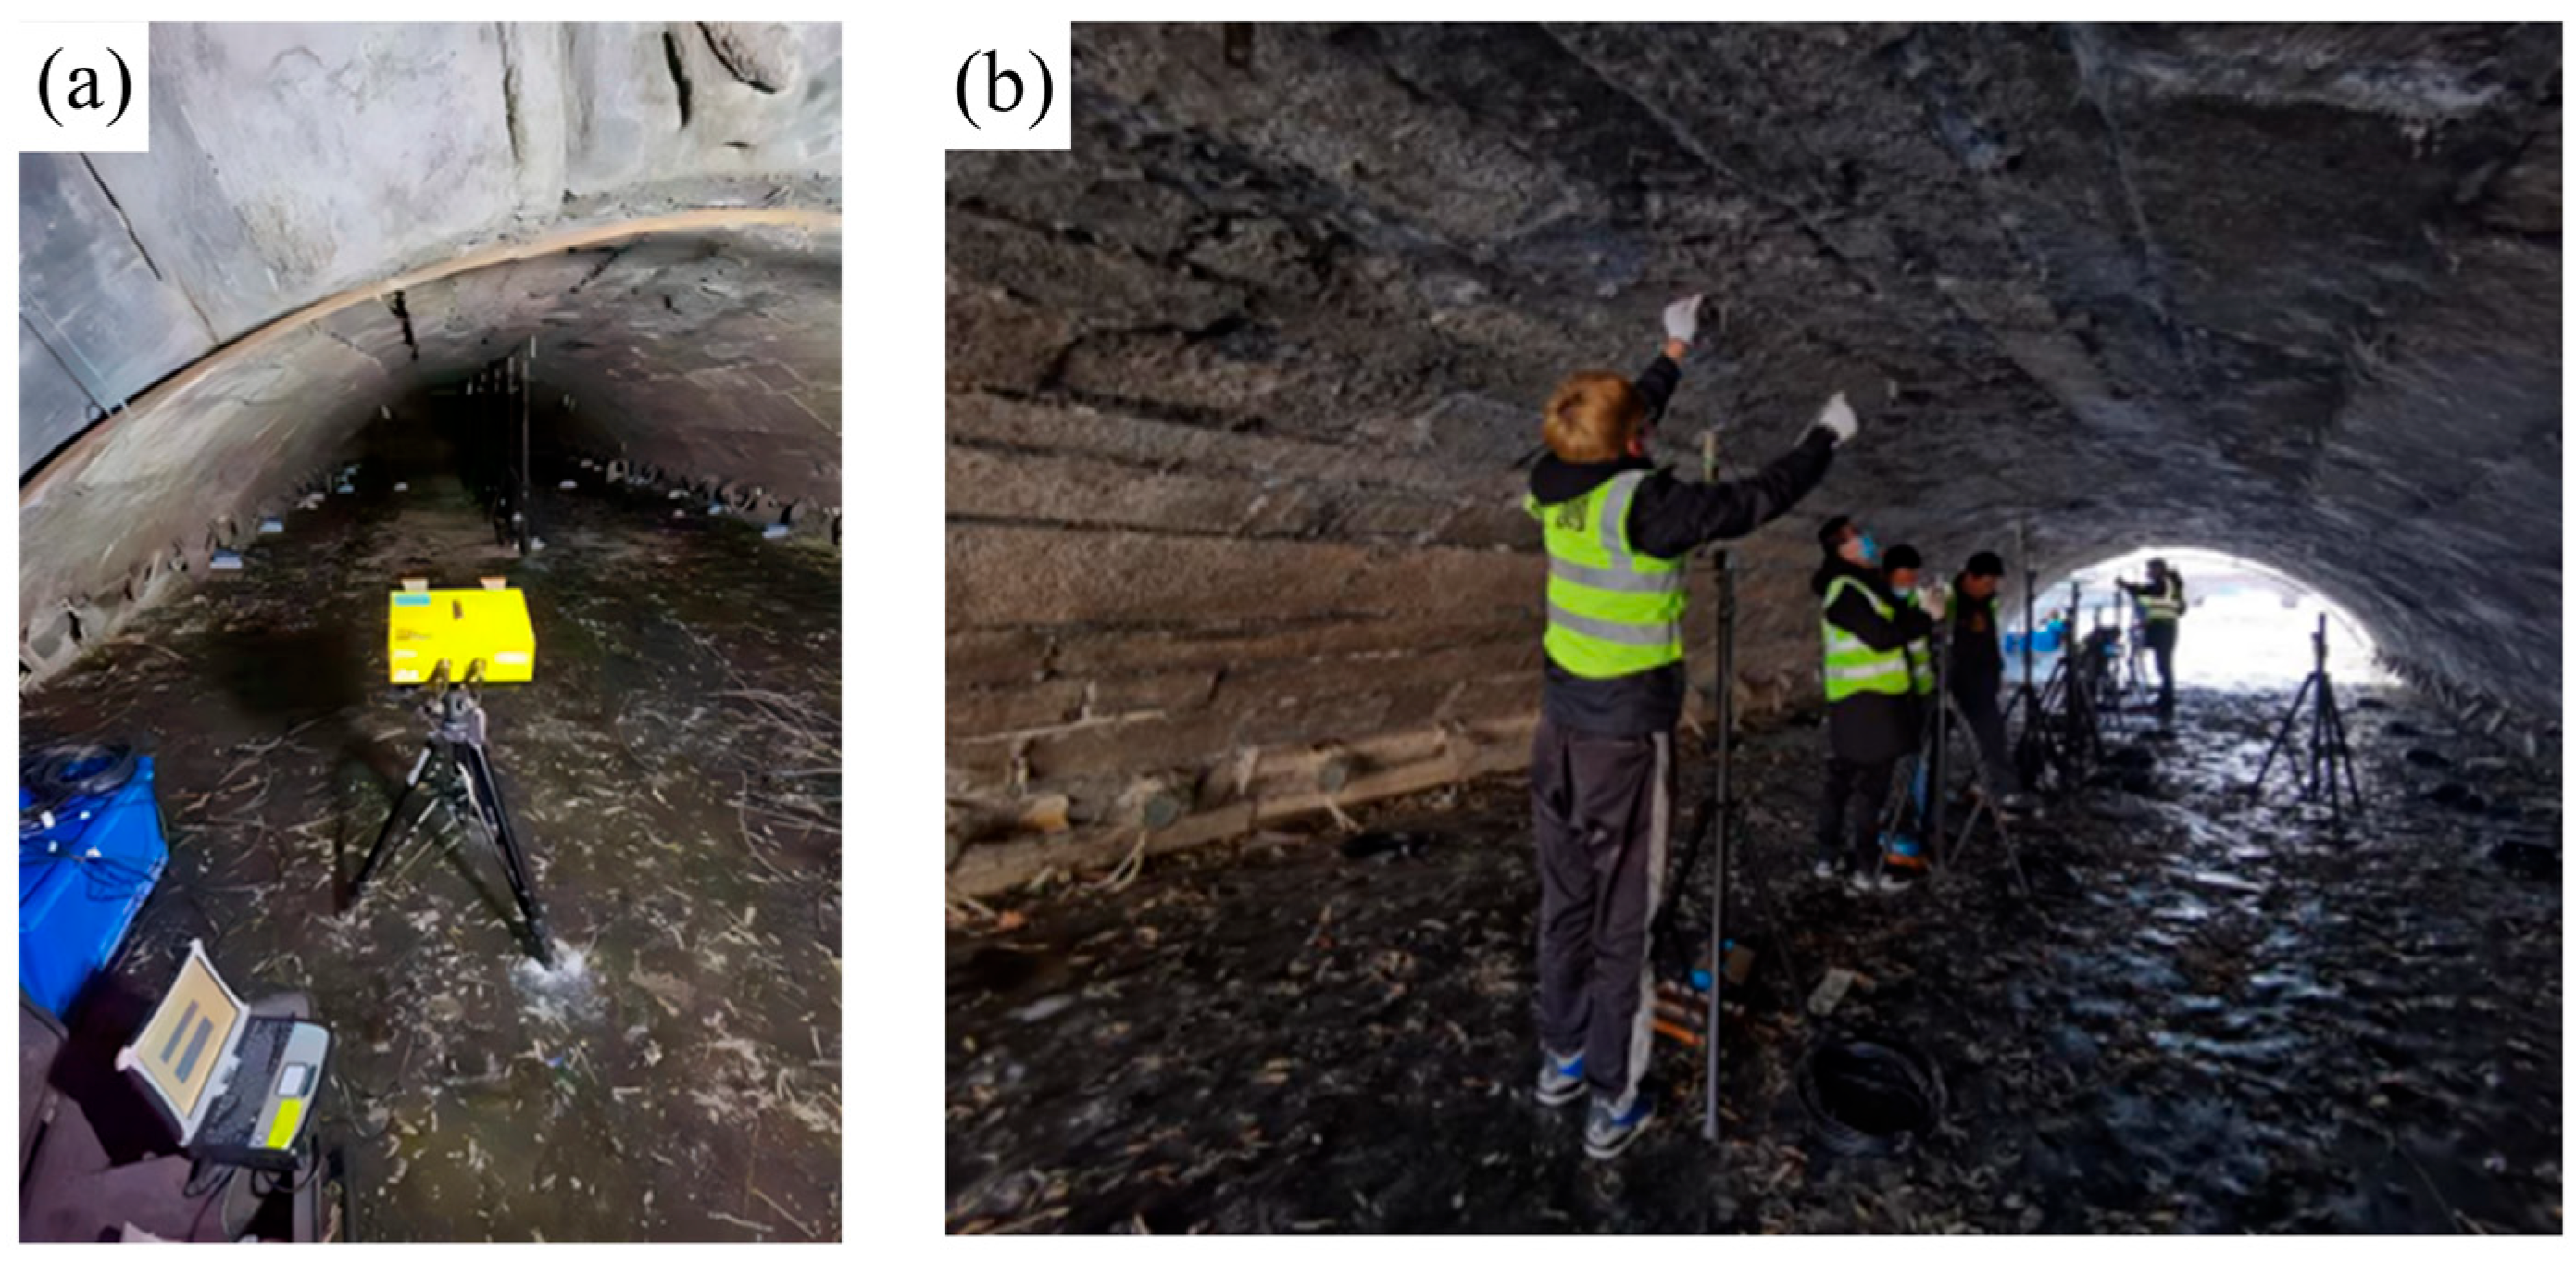
The instrument has a sound transit time range of 0.1–210,000 μs with a measurement resolution of 0.1 μs. As shown in Figure 8, we measured the stones on the west side of the bridge body and the arch ring to obtain a smoother surface (Figure 8b). Additionally, in this experiment, we used high-viscosity Vaseline as the coupling agent, which can better fill the tiny pores on the surface of the stones. We conducted a total of 50 sets of tests, and finally only adopted the data sets with clear signals. Any readings with abnormal attenuation or signal delay were regarded as being interfered by defects and were excluded. Table 2 shows some of the measurement data, and Table 3 is the macroscopic dynamic elastic modulus calculated based on the measured average wave velocity [24]. It was measured under the action of instantaneous small stress and reflects the elastic response of the material under unconstrained or small constraints. This does not represent the static elastic modulus. The static elastic modulus in this paper is determined according to “JTG D61-2005” [25], which includes many empirical values for Chinese bridge masonry. Moreover, due to the cultural relic characteristics of Wanning Bridge, we cannot achieve sampling detection [26], so we can only qualitatively understand the performance of the stone.
V p 2 = E d ( 1 v ) ρ ( 1 + v ) ( 1 2 v )
V s 2 = E d 2 ρ ( 1 + v )
Among them, Vp and Vs respectively represent the wave velocities of the compression (P-) and shear (S-) waves, Ed is the dynamic modulus, ρ is the density, and v is Poisson’s ratio.
The dynamic modulus can be expressed as,
E d = ρ V s 2 ( 3 V p 2 4 V s 2 ) V p 2 V s 2
Poisson’s ratio can be obtained from Equations (1) and (2).
V p 2 V s 2 = 2 ( 1 v ) 1 2 v
The dynamic shear modulus can be expressed as
G = ρ V s 2
Results indicate a dynamic elastic modulus (Ed = 10.08 GPa) and Poisson’s ratio (ν = 0.35), suggesting moderate overall stiffness—the stone exhibits elastic deformation under load while maintaining adequate load-bearing capacity. With Vs << Vp, the stone likely has weak shear resistance and high shear strain risk. Under traffic/metro dynamic loads, cumulative deformation may occur, necessitating FEM analysis to evaluate strength variations in critical load-bearing zones.

4. Structural Characteristics of Wanning Bridge

4.1. Static Load Test

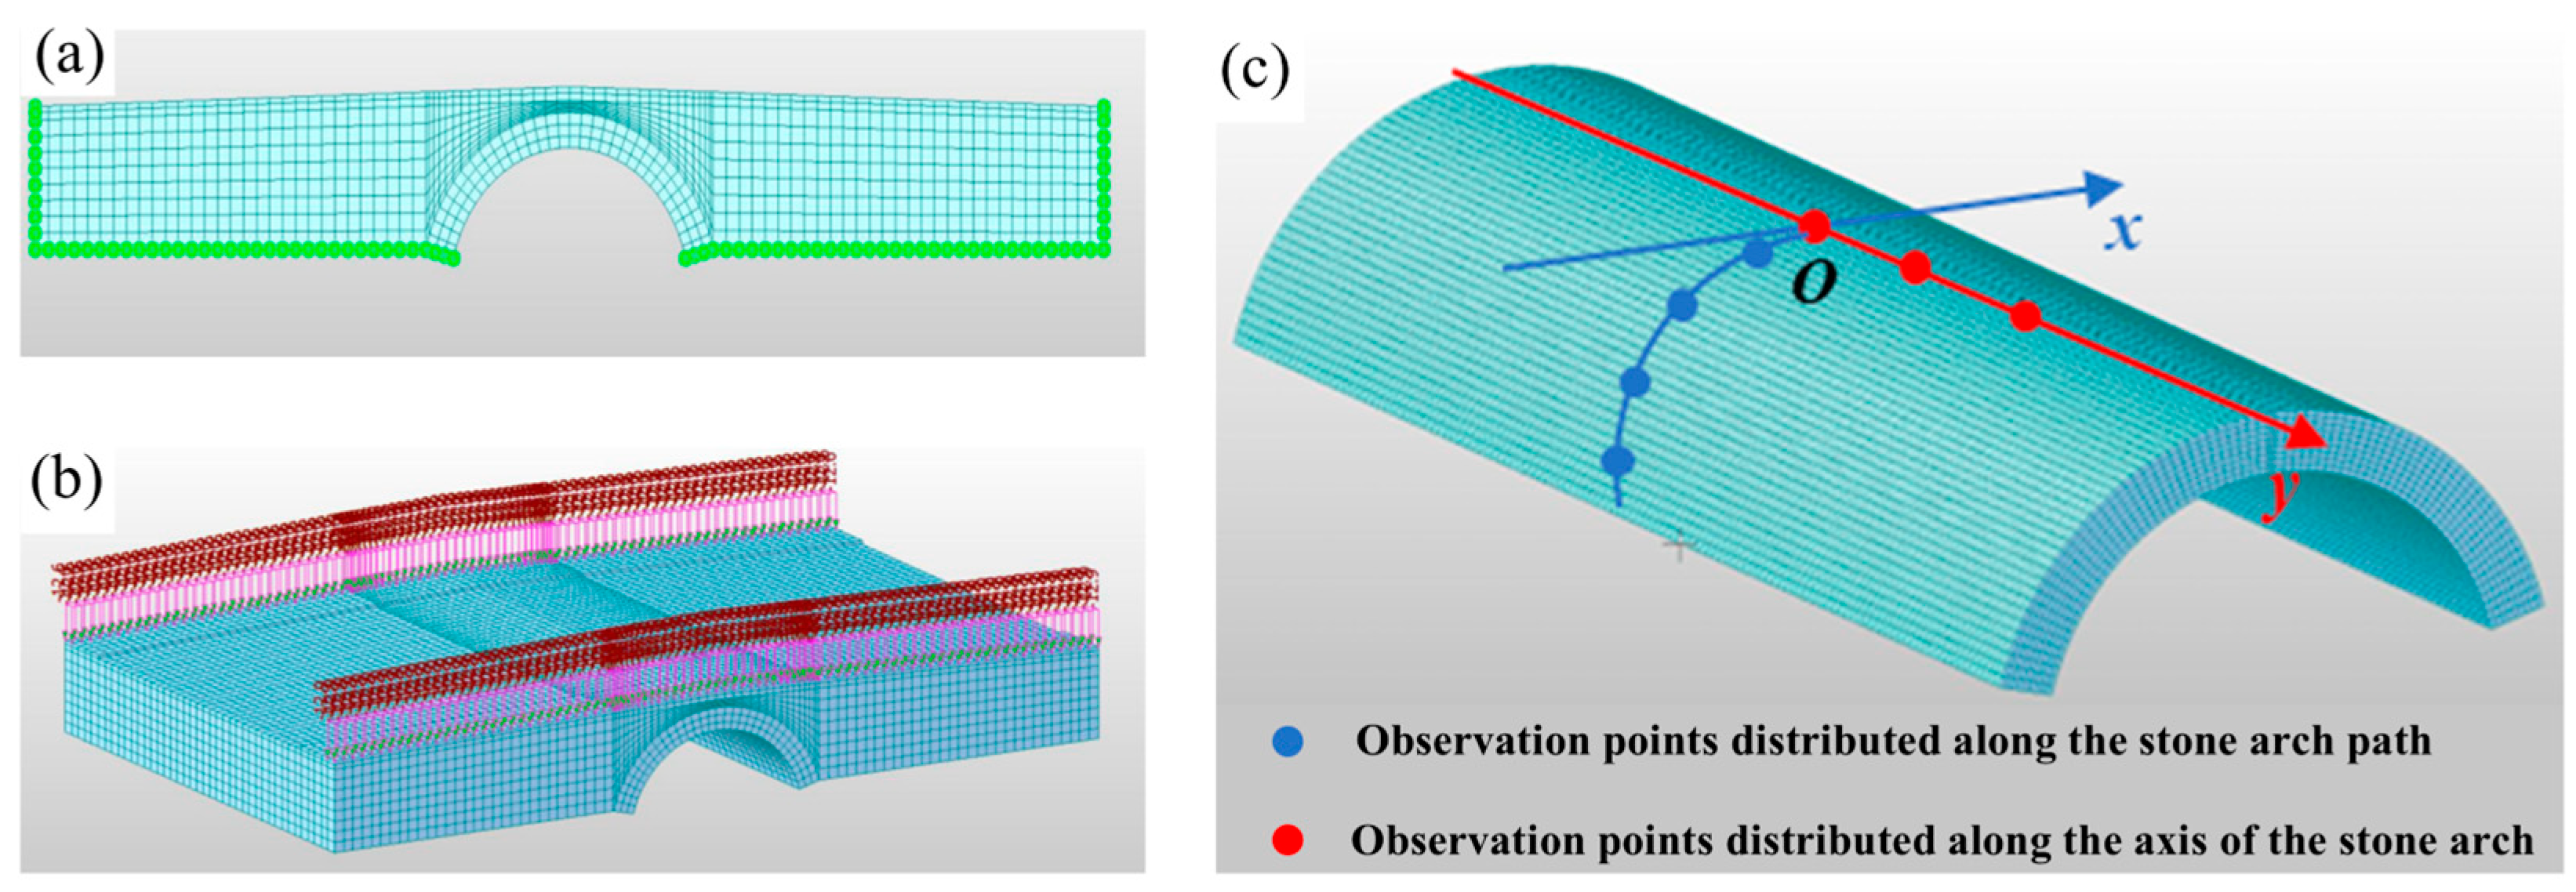
The static load test for the stone arch bridge employed direct loading with standard heavy vehicles. Following the “Specifications for Inspection and Evaluation of Load-bearing Capacity of Highway Bridges” (JTG/T J21-2011) [27], static load testing was conducted on Wanning Bridge. Figure 9c illustrates a schematic diagram of the coordinate system and the measurement points. Figure 10 is the record of the installation of testing instruments at the test site. For this single-span filled spandrel arch bridge, 8 vertical displacement sensors were arranged along the transverse x-axis at the midspan crown, 16 horizontal displacement sensors (8 per side) at the springing of the arch, and 5 vertical sensors along the longitudinal y-axis aligned with the deck centerline above the crown. According to the inspection by the National Cultural Heritage Administration, combined with the construction period of Wanning Bridge, the stones used should have come from mines around Beijing, such as Fangshan, Miyun, and Yanqing [28]. “JTG/T D61-2005” provides that under the mortar strength grade of M7.5, the static elastic modulus of the stone masonry of Wanning Bridge is approximately 5.65 GPa [25,29]. (Table 4).Considering that Wanning Bridge has existed for over a hundred years, therefore, based on the empirical formula in the “JTG/T D61-2005”, we introduced a reduction factor of 0.9. The good comparison in the static load experiment also indicates that the way of selecting this value is relatively reasonable. If more accurate parameters are required, more comprehensive laboratory compression tests would be necessary. The main difficulty, however, lies in the fact that it is currently almost impossible to conduct destructive sampling on the Wanning Bridge.
The bridge was analyzed using a finite element modeling approach. The arch ring was modeled with solid elements in MIDAS/CIVIL, resulting in a computational grid comprising 44,334 nodes and 38,840 elements (Hexahedral 8-node full integration element). Based on the 3D laser scanning results, separate models were established for the arch ring, sidewalls, backfill material, and trail bricks, with corresponding material properties assigned to each component. The railings were equivalently modeled as gravitational loads (Figure 9b), applied as surface loads at both ends of the walkway. Fixed constraints are applied to each point at the arch feet and the edges of the side walls to ensure that the structure is a geometrically invariant system (Figure 9a).
A high-precision MIDAS/CIVIL solid-element model was pre-established using 3D laser scanning data, with fixed constraints at springings to maintain geometric invariance. Per code requirements, graded loading was applied longitudinally at midspan: 200 kN standard vehicles in each transverse lane. Table 5 details loading positions and instrumentation schemes for two load cases. Load transfer simulation converted tire contact areas (front: 0.2 × 0.3 m; rear: 0.2 × 0.6 m) to uniform arch surface loads via 45° dispersion angles.
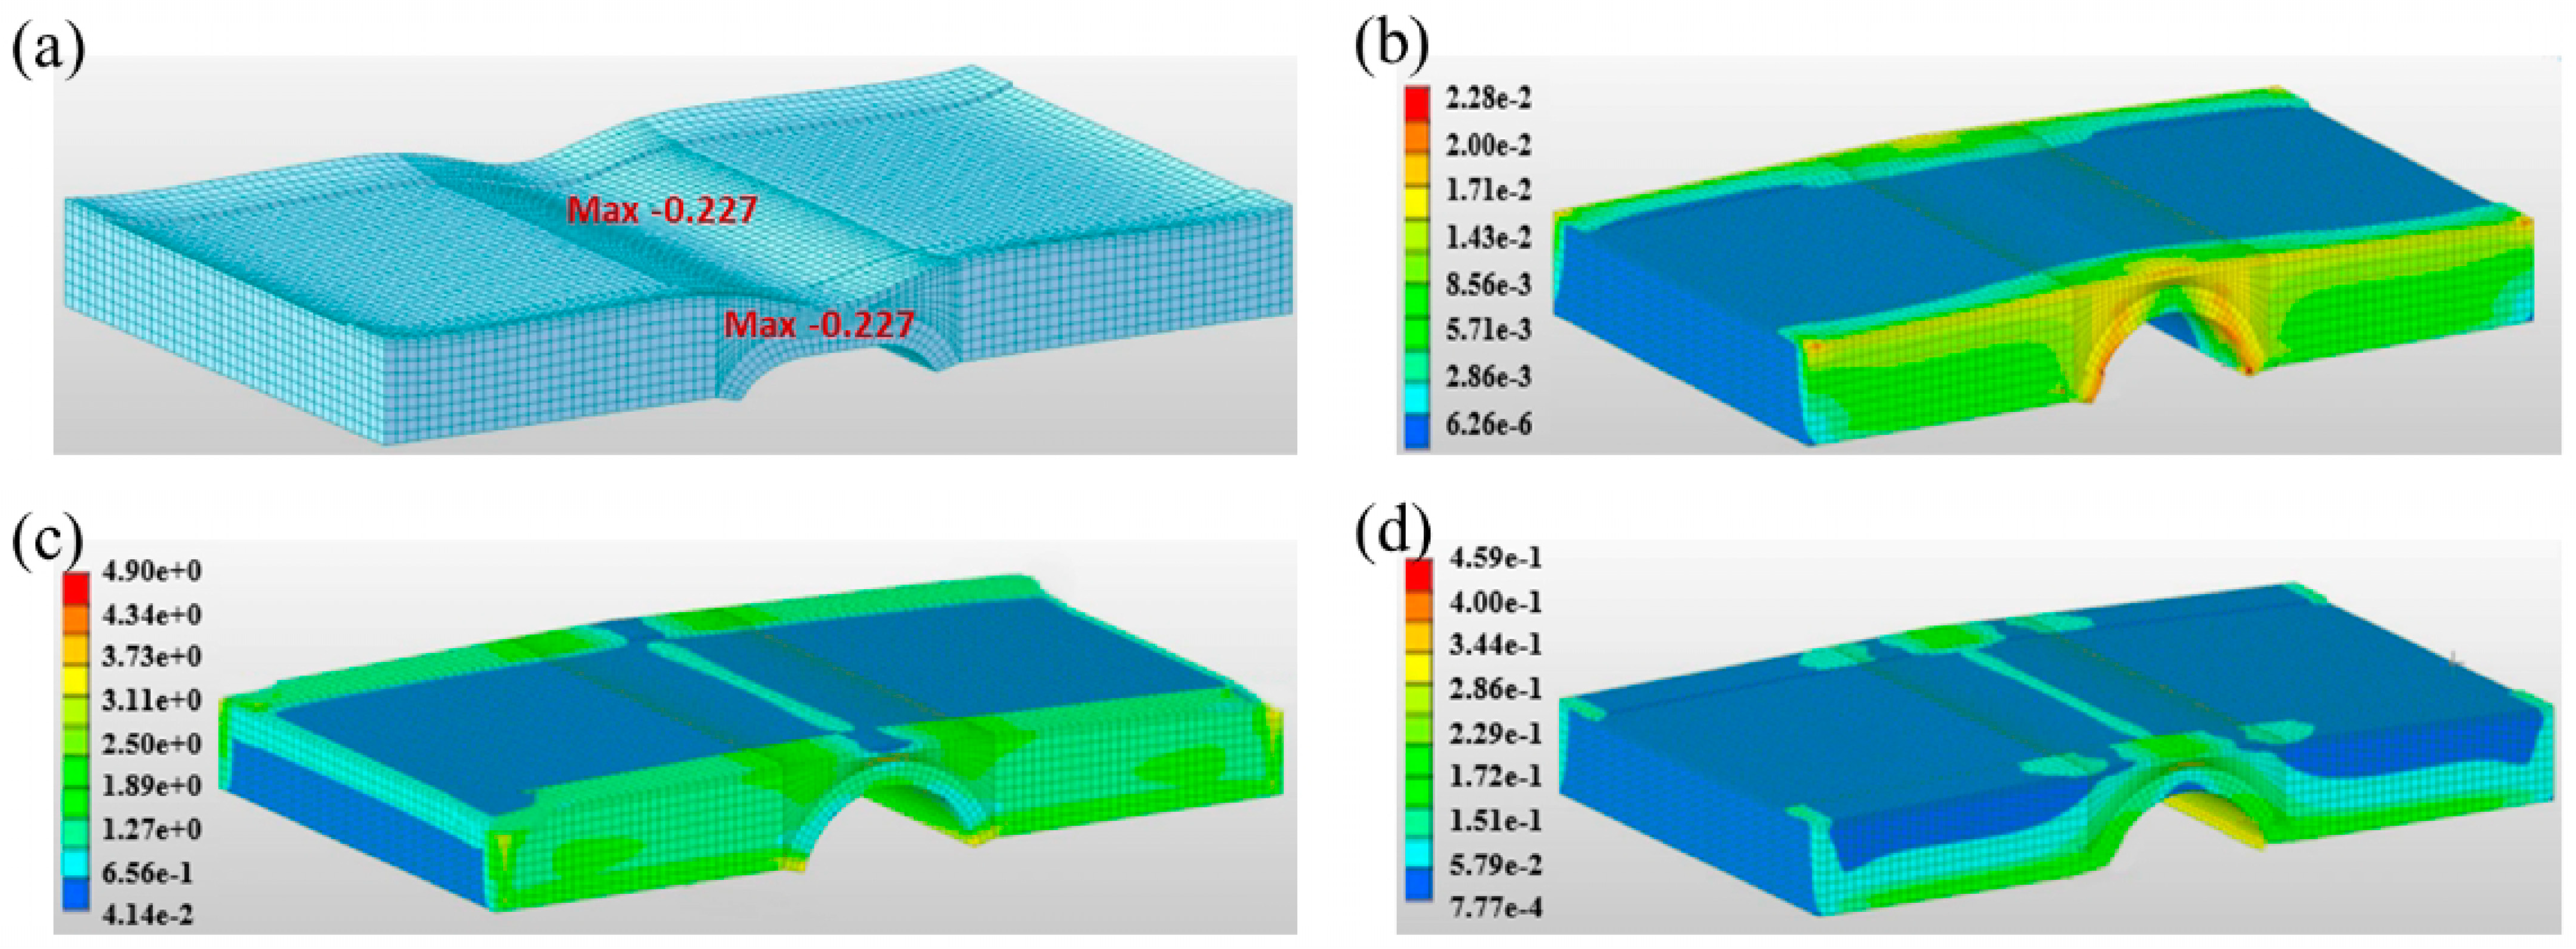
Table 6 and Table 7 compare experimental and simulated displacements at x-direction sensors (Figure 9c) revealing symmetric transverse crown displacement distributions across load cases. Figure 10 is a schematic diagram of the visualized results of the simulation. Moreover, according to the displacement data of sampling points in Figure 11, the maximum deflection occurs at the midspan, and there is a good correlation between the experiment and the simulation.
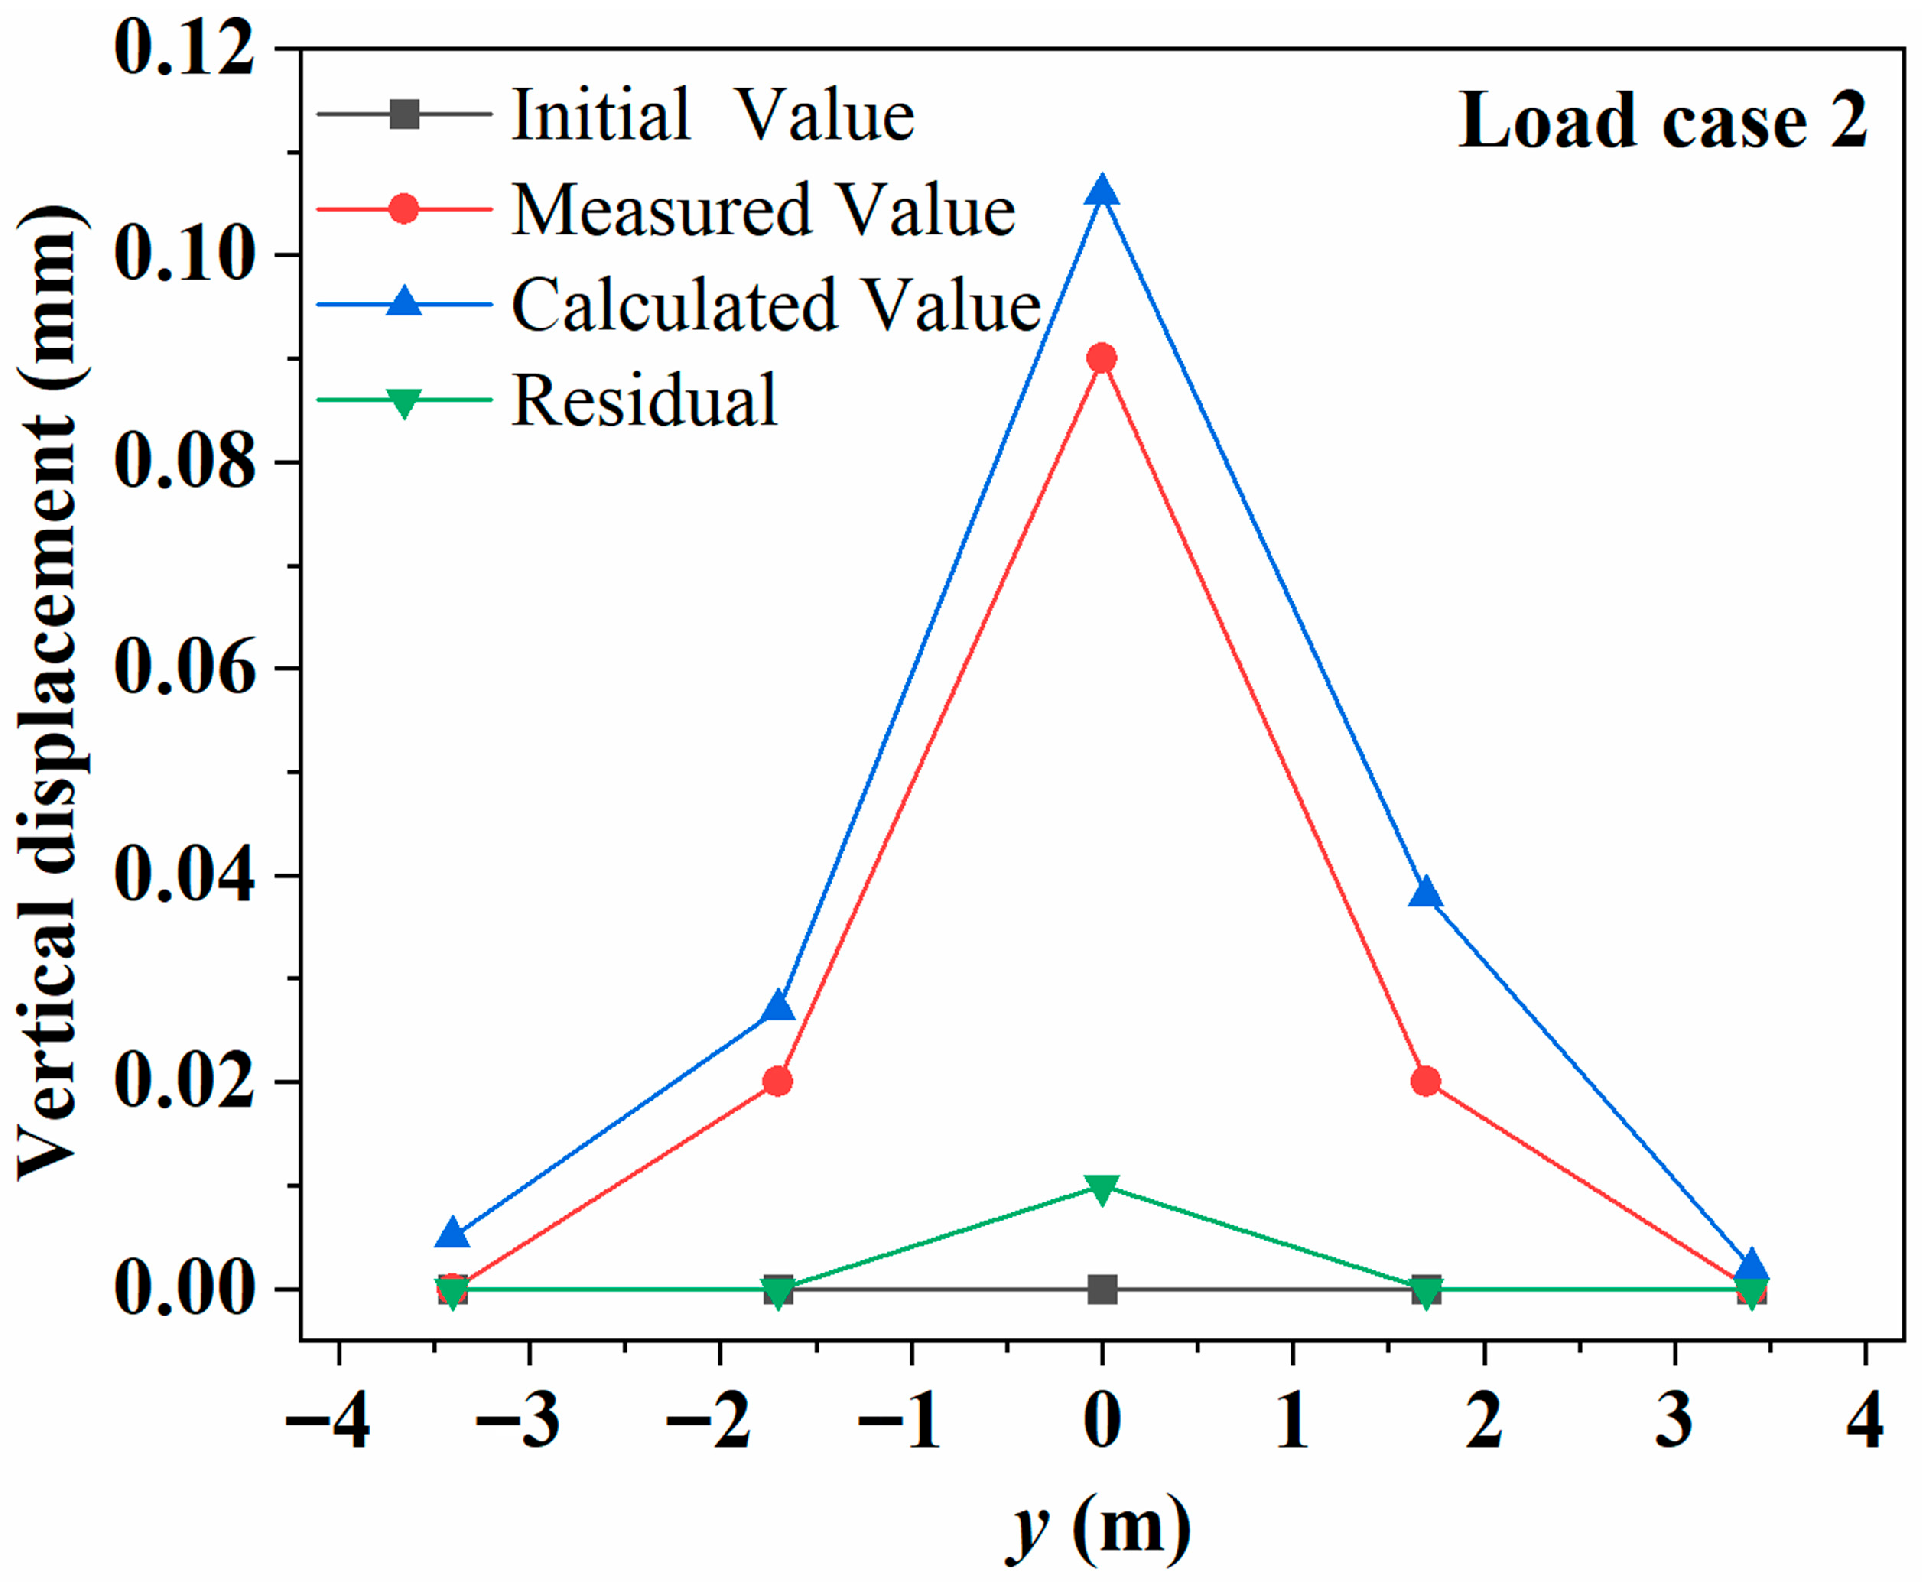
Table 8 summarizes displacement data for y-direction measurement points at the mid-span under Load Case 2. A comparison of the results of numerical simulations and experiments is shown in Figure 12. These curves follow typical arch structural deformation patterns. Systematic comparison between measured and calculated values (verification coefficients: 0.526–0.976) reveals that ancient ashlar masonry’s self-locking effect enhances actual stiffness by 17.3–21.6%, significantly improving structural response characteristics.
Systematic analysis demonstrates Wanning Bridge’s arch ring exhibits exceptional structural performance, with measured vertical displacements at transverse crown points being significantly lower than calculated values (measured/theoretical displacement ratio: 0.526–0.976). For transverse crown measurements, both negative and positive axis sides showed measured vertical displacements substantially lower than theoretical calculations, with ratios ranging 0.526–0.976. For instance, at Point 3 of Load Case 2, the measured displacement (0.06 mm) was 0.025 mm lower than theoretical value (0.085 mm). This pattern, visually confirmed by displacement distribution diagrams and consistent across all measurement points, indicates 17.3–21.6% actual stiffness enhancement over theoretical models. Further verification coefficient analysis (all coefficients < 1.0) confirms Wanning Bridge’s high stiffness characteristics. Moreover, all measurement points showed residual deformations below the 20% code threshold, demonstrating excellent elastic recovery after load removal without plastic deformation or damage accumulation.
Comprehensive multi-directional deformation and residual deformation data verify that under 39.82 t static loading, the arch ring’s stress state and deformation response outperform theoretical predictions. According to Specifications for Inspection and Evaluation of Load-bearing Capacity of Highway Bridges (JTG/T J21-2011) [27], the bridge’s overall load-bearing capacity meets Highway-Class II standards, providing empirical evidence for its safety. Despite structural stability under static conditions, dynamic loads (e.g., traffic impacts) may cause fatigue accumulation at critical arch nodes, necessitating further research combining dynamic load tests and numerical simulations to elucidate damage evolution mechanisms.

4.2. Dynamic Load Test

Dynamic traffic loads (e.g., vehicle passages) acting on the bridge deck induce dynamic stress–strain responses in the bridge structure. The long-term cumulative effects may lead to surface damage propagation and durability degradation, ultimately affecting service life. Therefore, conducting dynamic load tests on bridges holds significant engineering value. By analyzing vibration responses to measure dynamic characteristic parameters such as natural frequency and damping ratio, these tests provide scientific basis for assessing structural reliability and safety conditions.
We conducted a simple modal analysis of Wan Ning Bridge using the finite element method, and briefly discussed the influence of the elastic modulus of the masonry on the natural frequency. The calculated material parameters are shown in Table 3. A total of 49,852 elements were used in this calculation. In terms of boundary conditions, we constrained the displacement at the bottom, and solid modeling of the bridge railings was also carried out, with the aim of simulating the geometric shape of the bridge as accurately as possible. This study conducted dynamic load testing on Wanning Bridge following the “Specifications for Inspection and Evaluation of Load-bearing Capacity of Highway Bridges” (JTG/T J21-2011) [27]. Testing focused on the west-to-east direction of the main bridge, using Ground-Based Synthetic Aperture Radar (GB-SAR) to collect vibration data. The instrumentation layout (Figure 13) included: ice surface station position, 25° elevation angle, 0.75 m range resolution; with radar mounted 1.2 m vertically below the bridge deck to optimize vibration signal capture. The test implemented the vehicle loading conditions in Table 5, and a total of 2 sets of dynamic loading data were collected to quantify the dynamic deformation characteristics of the structure through displacement time course analysis.
For Test Vehicle 1 (20.86 t, 10 km/h, 10 s crossing time), IBIS-S radar monitoring revealed maximum deformation of 0.26 mm. After waveform correction for zero-point offset, bridge oscillations within [−0.12, 0.14] mm were obtained, with time-frequency domains shown in Figure 14.
For Test Vehicle 2 (Group 2): weight 19.02 tons, speed 20 km/h, actual bridge crossing time 8 s. The displacement sequence graph obtained from the IBIS-S radar monitoring reveals that the maximum deformation amounted to 0.26 mm and the zero value was slightly shifted, and the correction of the waveform profile yielded the fluctuation of the bridge in the interval [−0.12, 0.14] mm.
Testing revealed the arch bridge’s natural frequency of 10.547 Hz. The calculated vehicle impact factor of 0.4 (It is a bit higher than other ancient Bridges, indicating that the dynamic performance of Wanning Bridge is slightly weaker [15]) indicated reasonable dynamic load deformation, with data comparison shown in Table 9.
Following “JTG/T J21-2011” [27], this study systematically evaluated Wanning Bridge’s dynamic test results by integrating GB-SAR radar monitoring data with theoretical models. Evaluation showed the bridge’s dynamic performance meets design requirements: measured natural frequency (10.547 Hz) falls within typical single-span stone arch bridge range (5–15 Hz), confirming no significant stiffness degradation; peak dynamic deformation (0.26 mm, oscillation range [−0.12, 0.14] mm) was well below code limit (L/600 = 12.2 mm), with negligible residual deformation demonstrating excellent elastic recovery capacity.
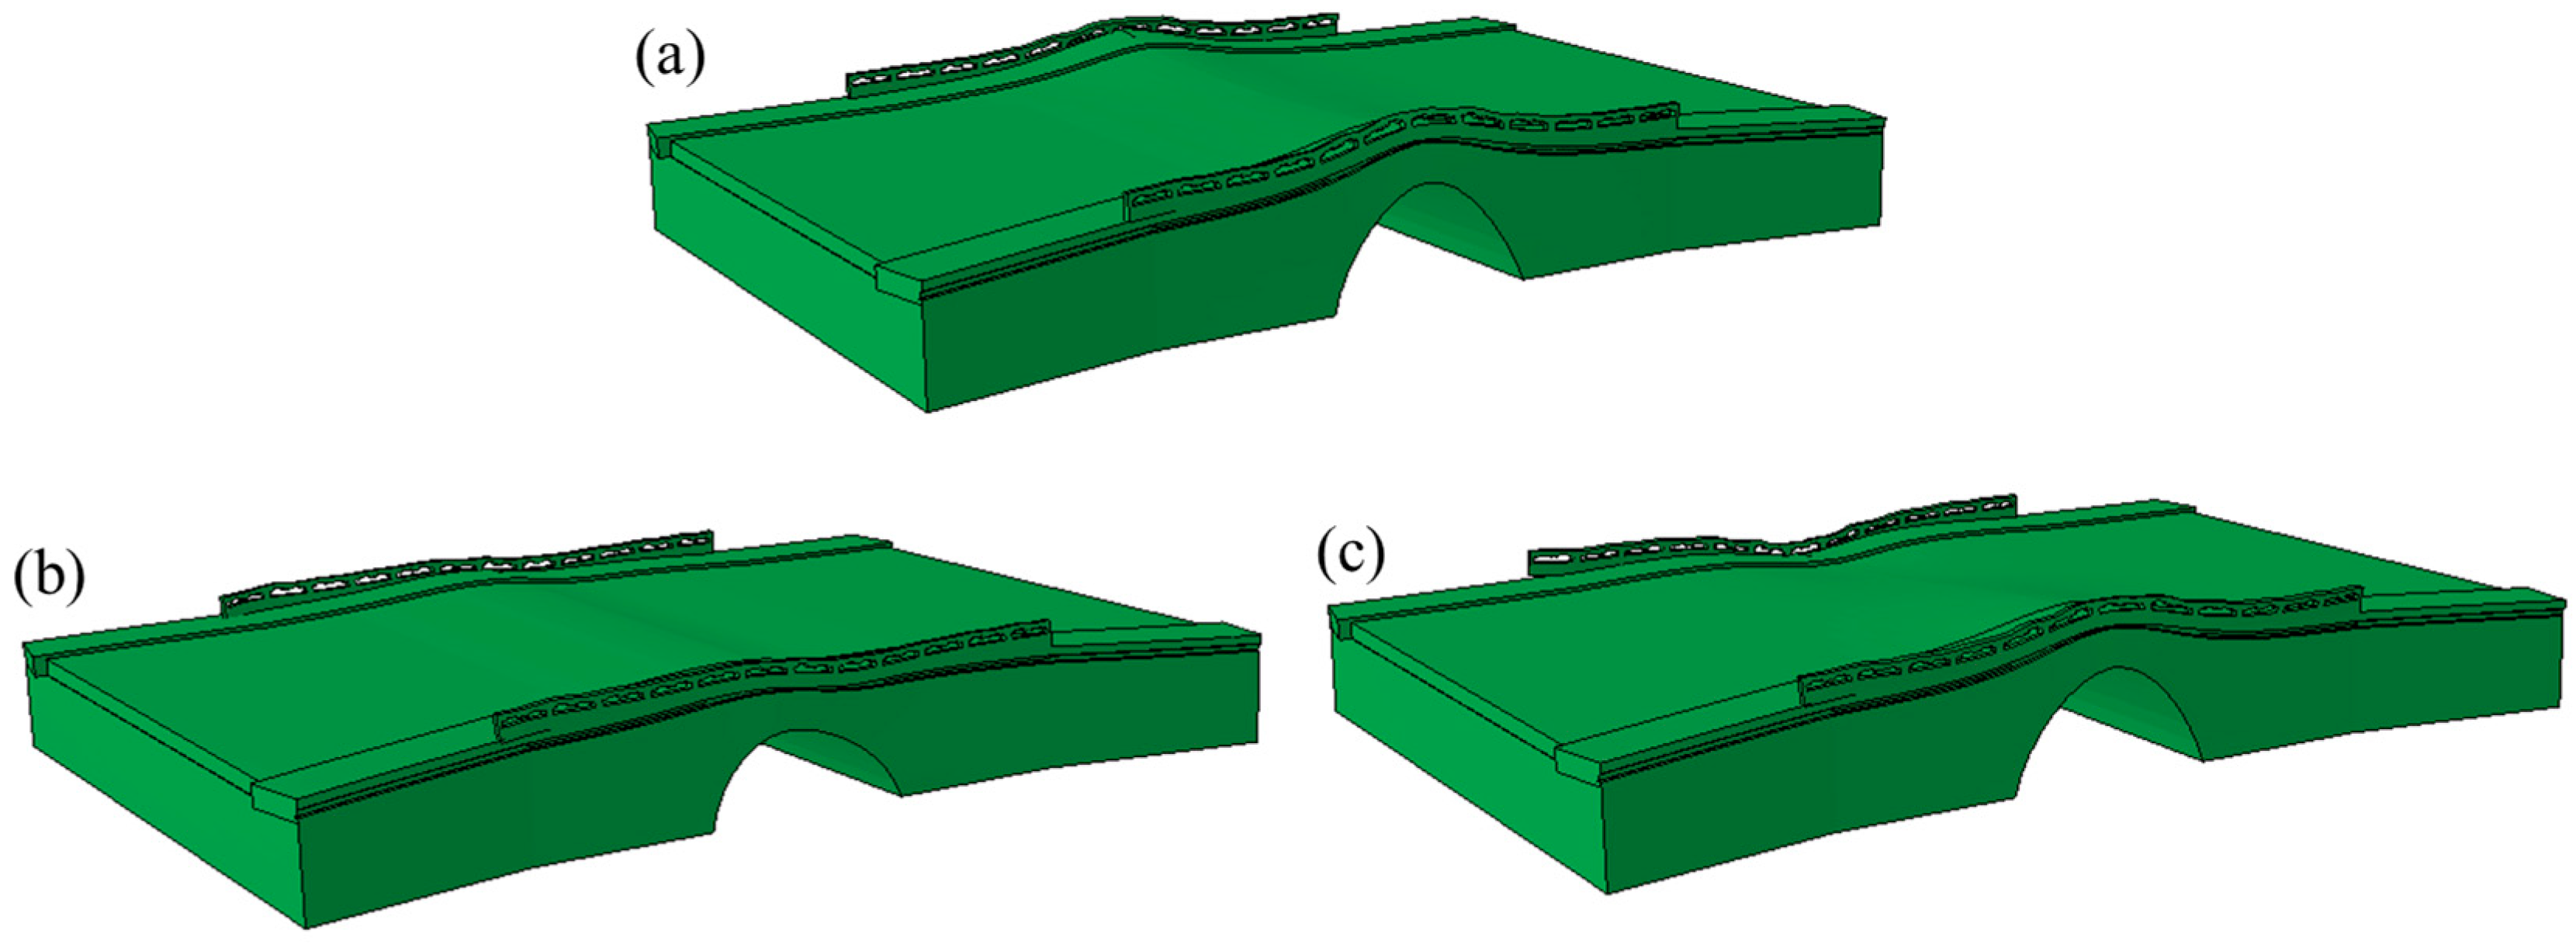
The first three natural vibration modes of the bridge obtained through finite element calculation are shown in Figure 15. Since the displacement calculation result in the static load simulation is approximately 17% smaller than the actual value, we have considered the error of the static load experiment (17.3–21.6%) and the empirical parameters provided in the “JTG/T D61-2005” (a reduction factor of 0.9) to discuss the elastic modulus of the masonry [25,29]. The selected material parameters are shown in Table 10. Assume that the parameters used in the static load simulation are the initial values (5.08 GPa), the selection rule for verification parameters is “5.08 × ζ (ζ = 1, 1.05, 1.1, 1.17)”. As shown in Table 10, when the elastic modulus of the masonry is set to 5.08 GPa, a 12% difference in the first-order natural frequency is observed. As this parameter increases, the first-order natural frequency gradually approaches the experimental value. However, the properties of the entire bridge are not solely related to a single parameter. More experimental data are needed to support more accurate material parameters. This is a preliminary analysis involving calibration of the computational model, following the research methodology established by Borlenghi et al. [30].
Dynamic–static load comparison revealed key patterns: minimal differences between dynamic maxima (0.14/−0.12 mm) and static peak (−0.09 mm), confirming velocity-insensitive structural response. Waveform-corrected radar data detected no local resonance. However, should dynamic deformations persistently exceed 0.3 mm (especially in the arch ring), specialized crack propagation inspections must be initiated for high-risk seepage zones to prevent time-dependent damage evolution.

4.3. Vibration Testing

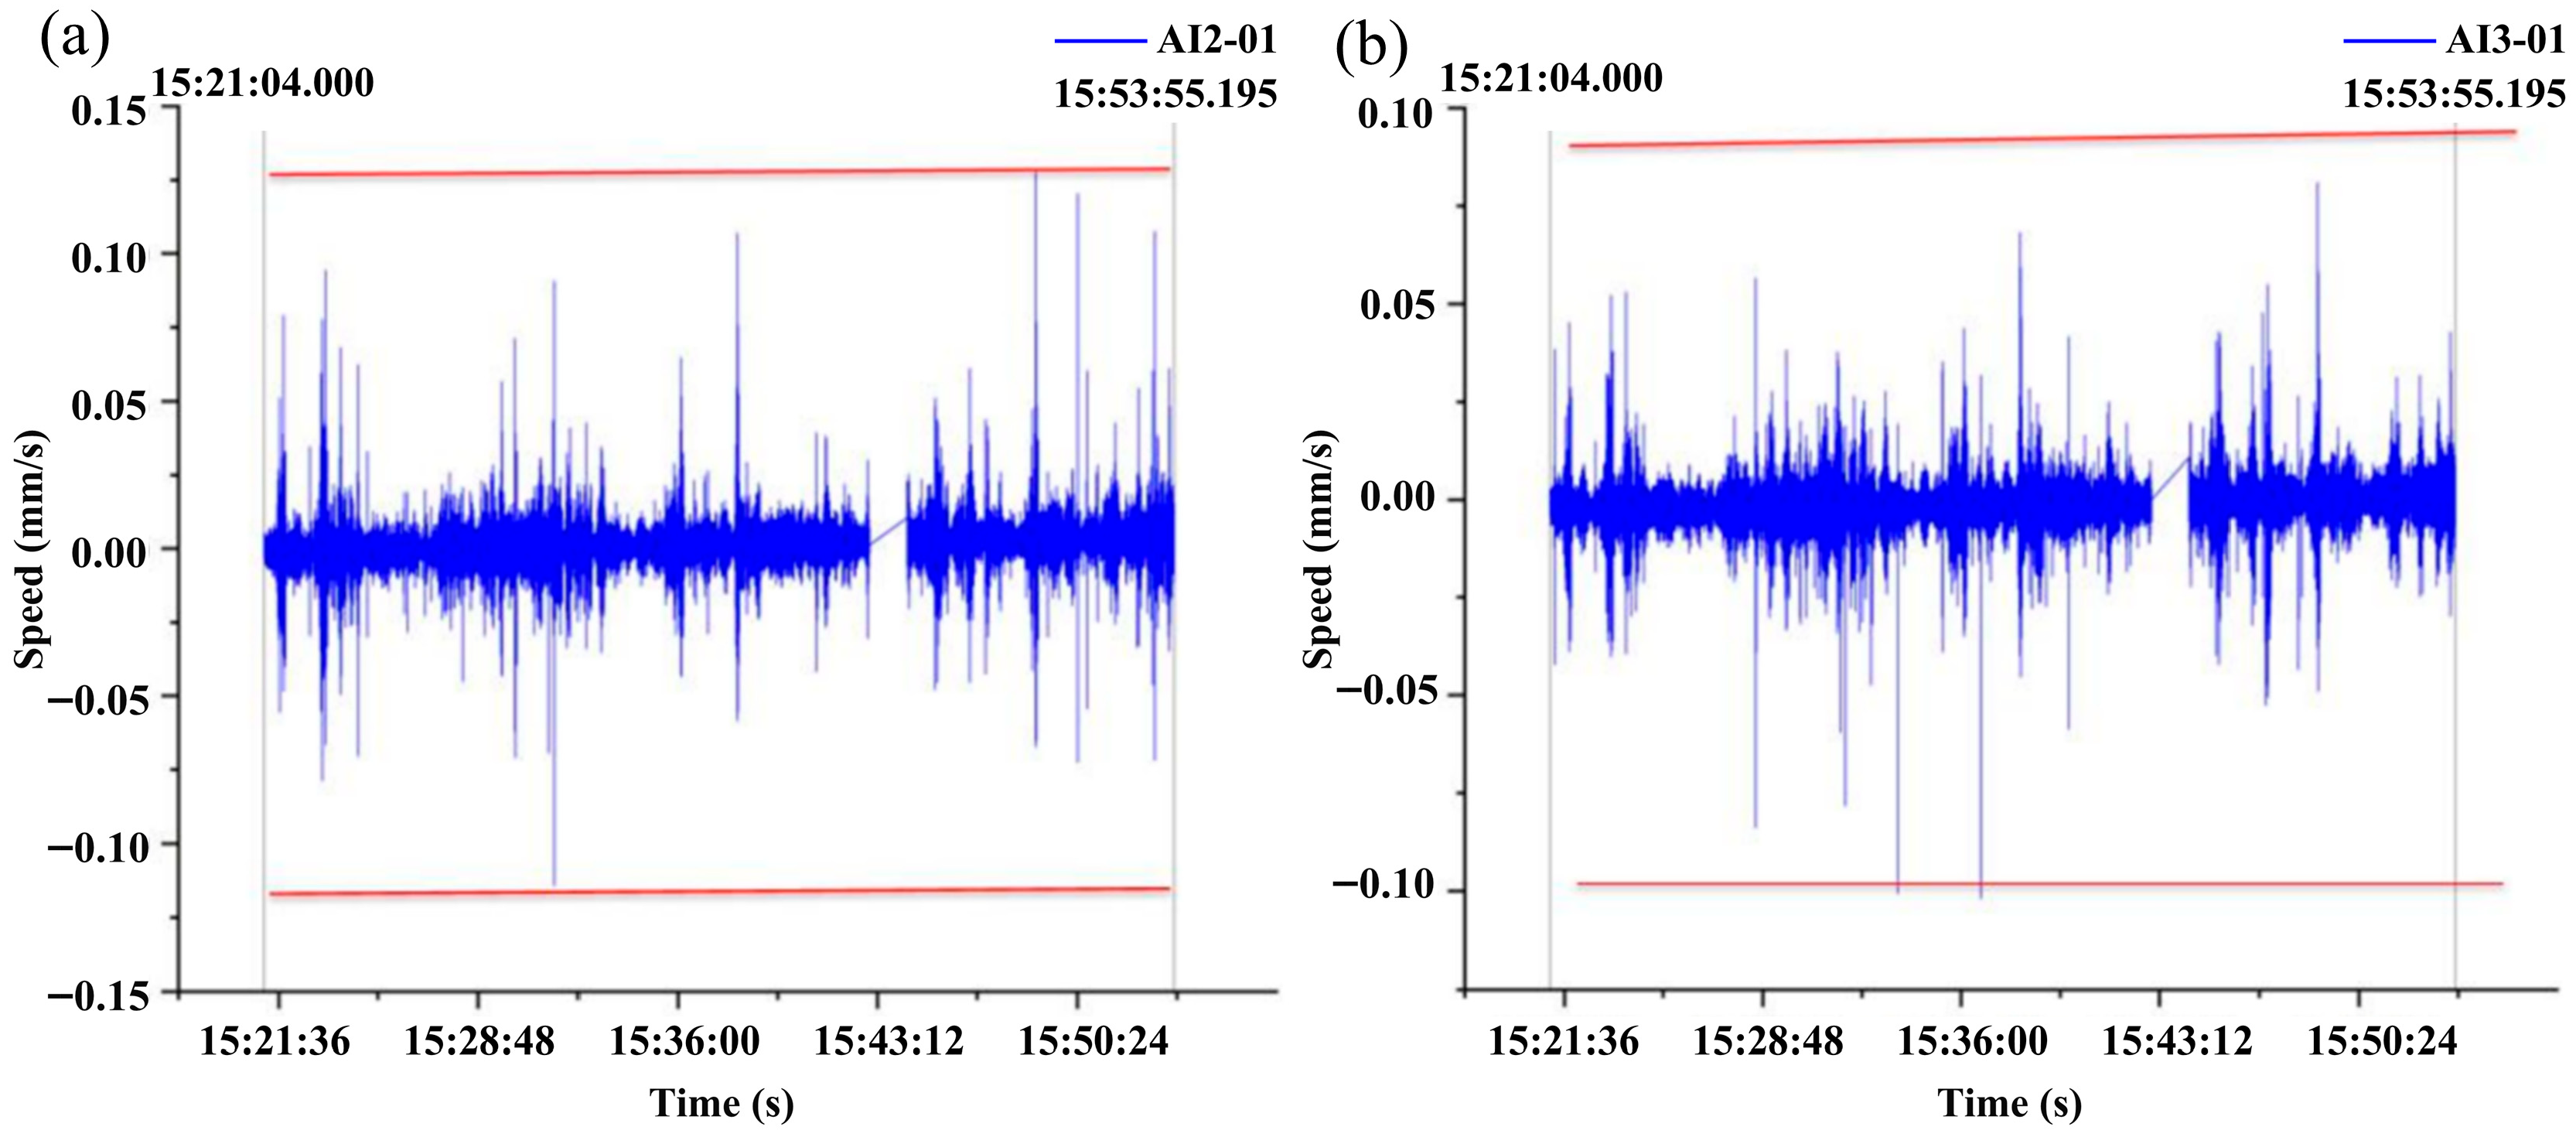
Vibration testing was conducted on Wanning Bridge to assess potential vibration impacts from vehicular and nearby metro traffic, thereby preventing cumulative structural damage aggravation. The test was performed from 15:21 to 15:53, recording vibration velocity at 0.005 s intervals, following the “Technical Code for Protection of Historic Buildings Against Industrial Vibration” GB/T 50452-2008 [31], with results shown in Figure 16.
Vibration velocity waveforms from both east and west lanes demonstrate peak velocities below 0.15 mm/s. Per GB/T 50452-2008 “Technical Code for Protection of Historic Buildings Against Industrial Vibration”, the maximum permissible horizontal vibration velocity for load-bearing stone structures at nationally protected heritage sites ranges 0.20–0.25 mm/s. Thus, measured vibrations comply with regulatory limits, remaining below threshold values.

5. Conclusions

This study utilizes non-destructive testing (NDT) technology to support three-dimensional (3D) modeling and parameter acquisition for Wanning Bridge and employs a combined approach of experimental and numerical simulations to analyze the structural characteristics and damage conditions of the bridge under static loads, dynamic loads, and metro-induced disturbances. Experimental and numerical results demonstrate that the self-locking effect from ancient ashlar masonry techniques enhances global stiffness by 17.3–21.6% (evidenced by reduced arch ring deflections in static tests versus calculated values), with residual deformations below code limits. The dynamic test results show that the short-term performance is stable (peak deformation 0.26 mm, natural frequency 10.547 Hz), and its load-bearing capacity meets the standards of a secondary highway. However, the impact of long-term traffic loads on its service performance still requires long-term monitoring. The vibration protection framework with a 0.25 mm/s threshold establishes quantitative safety benchmarks for living heritage structures. The proposed “dynamic–static coupled assessment methodology” offers a replicable paradigm for sustainable management of in-service heritage bridges worldwide, with particular practical value for conservation and restoration.
Naturally, this study will require further in-depth experiments and investigations to refine its findings in future work, including continuous monitoring of damage accumulation under high-load traffic flow and the development of a real-time risk early-warning platform based on digital twin technology. Furthermore, more research will be conducted in the future. On one hand, more experimental data on the bridges will be obtained through long-term monitoring. On the other hand, by integrating more experimental data and adjusting the material parameters of the arch ring, bridge deck, and backfill properties, the uncertain quantities (such as the static elastic modulus) are systematically corrected to obtain a more accurate finite element model.

Author Contributions

Conceptualization, Y.Z.; methodology, Y.Z. and Y.G.; validation, Y.Z. and Y.G.; formal analysis, Y.G.; investigation, Y.Z. and Y.G.; data curation, Y.G.; writing—original draft preparation, Y.G.; writing—review and editing, Y.Z., and Y.G.; visualization, Y.G. All authors have read and agreed to the published version of the manuscript.

Funding

This research was funded by the National Key R&D Program Key Project: ‘Key Technologies and Demonstration for Risk Assessment and Hidden Danger Investigation of Bridge Cultural Relics’, Grant No. 2023YFF0906100.

Data Availability Statement

The data presented in this study are available on request from the corresponding author.

Conflicts of Interest

The authors declare no conflicts of interest.

References

  1. Fraser, D. American bridges in New South Wales. Aust. J. Multi-Discip. Eng. 2010, 8, 23–31. [Google Scholar] [CrossRef]
  2. Miles, O. The Rolt Memorial Lecture 2013: The Public Benefit of Industrial Heritage-Taking a Positive View. Ind. Archaeol. Rev. 2014, 36, 85–96. [Google Scholar]
  3. Frank, G. Building on Historical Significance. Lane Rep. 2014, 29, 26–29. [Google Scholar]
  4. Kim, H.N.; Moo, K.H.; Gul, H.S.; Sun, B.B.; Kyu, Y.W. Towarda Balanced Heritage Management Plan for Old Stone Bridges Considering the Embedded Cultural Significance. Int. J. Archit. Herit. 2009, 3, 195–211. [Google Scholar]
  5. North, M. Spreading the load: The management of heritage timber truss bridges in the NSW road network. Aust. J. Multi-Discip. Eng. 2012, 9, 79–86. [Google Scholar] [CrossRef]
  6. Mort, M. A Bridge Worth Saving: A Community Guide to Historic Bridge Preservation; Michigan State University Press: East Lansing, MI, USA, 2008. [Google Scholar]
  7. Xiao, F.; Mao, Y.; Tian, G.; Chen, G.S.; Shi, X. Partial-model-based damage identification of long-span steel truss bridge based on stiffness separation method. Struct. Control. Health Monit. 2024, 2024, 5530300. [Google Scholar] [CrossRef]
  8. Xiao, F.; Mao, Y.; Sun, H.; Chen, G.S.; Tian, G.; Chang, C.M. Stiffness separation method for reducing calculation time of truss structure damage identification. Struct. Control. Health Monit. 2024, 2024, 5171542. [Google Scholar] [CrossRef]
  9. Ma, Y.K.; Chun, Q.; Hua, Q.J. Structural health monitoring and quantitative safety evaluation methods for ancient stone arch bridges. J. Cult. Herit. 2024, 70, 366–380. [Google Scholar] [CrossRef]
  10. Han, Y.D.; Chun, Q.; Wang, H.Y. Quantitative safety evaluation of ancient Chinese timber arch lounge bridges. J. Wood Sci. 2022, 68, 4. [Google Scholar] [CrossRef]
  11. Mai, K.Q.; Lee, S.M.; Lee, K. Assessment of historic stone arch bridge characterisation: Experiments and numerical model. P. I Civ. Eng-Str. B 2019, 172, 480–489. [Google Scholar] [CrossRef]
  12. Aytulun, E.; Soyoz, S.; Karcioglu, E. System Identification and Seismic Performance Assessment of a Stone Arch Bridge. J. Earthq. Eng. 2022, 26, 723–743. [Google Scholar] [CrossRef]
  13. Zhao, L. The Measurement Analysis of Solid Stone Arch Bridge Considering Arch Construction Stress. Shanxi Sci. Technol. Commun. 2014, 3, 59–64. [Google Scholar]
  14. Feng, C.; Wang, W.; Liu, C.; Zhao, X. Technical condition and bearing capacity evaluation of stone arch bridges based on appearance and experimental testing. Eng. Constr. 2024, 56, 76–83. [Google Scholar]
  15. Gong, Z.C.; Wang, Y.Z.; Duan, K.Y. Reliability evaluation of historic stone-arch bridge structure based on non-destructive testing and probability. Saf. Environ. Eng. 2024, 31, 120–128. [Google Scholar]
  16. León-robles, C.A.; Reinoso-gordo, J.F.; González-quiñones, J.J. Heritage Building Information Modeling (H-BIM) Applied to A Stone Bridge. ISPRS Int. J. Geo-Inf. 2019, 8, 121. [Google Scholar] [CrossRef]
  17. Deng, Y.; Jia, Y.G.; Li, A.Q. Structural Parameter Identification of Ancient Stone Arch Bridge via Three-Dimensional Laser Ranger Scanning. J. Perform. Constr. Facil. 2022, 36, 04022041. [Google Scholar] [CrossRef]
  18. Roselli, I.; Malena, M.; De felice, G. Health assessment and ambient vibration testing of the “Ponte delle Torri” of Spoleto during the 2016-2017 Central Italy seismic sequence. J. Civ. Struct. Health Monit. 2018, 8, 199–216. [Google Scholar] [CrossRef]
  19. Borlenghi, P.; Saisi, A.; Gentile, C. ND testing and establishing models of a multi-span masonry arch bridge. J. Civ. Struct. Health Monit. 2023, 13, 1595–1611. [Google Scholar] [CrossRef]
  20. Wang, T.C.; Ruan, Z.H.; Jiang, M.J. Shaking-Table Tests for Seismic Response of Arch Foot of a Long-Span Arch Bridge on Sand-Gravel Soil Sites Considering SSI Effect. J. Earthq. Eng. 2024, 28, 2066–2092. [Google Scholar] [CrossRef]
  21. Karalar, M.; Cufali, G. Structural Assessment of Historical Stone Bridges with the Finite Element Method under Dynamic Effects of Arch Shape: The Antik Iscehisar Bridge. Appl. Sci. 2023, 13, 10740. [Google Scholar] [CrossRef]
  22. Zheng, Y.; Wang, S.; Zhang, P.; Xu, T.; Zhuo, J. Application of Nondestructive Testing Technology in Quality Evaluation of Plain Concrete and RC Structures in Bridge Engineering: A Review. Buildings 2022, 12, 843. [Google Scholar] [CrossRef]
  23. Cao, W.; Shi, Y.; Mei, D.; Li, M.; Liu, D. Reconstruction of Ancient Stone Arch Bridge Via Terrestrial LiDAR Technology. IOP Conf. Ser. Mater. Sci. Eng. 2020, 960, 042063. [Google Scholar] [CrossRef]
  24. Eissa, E.A.; Kazi, A. Relation between static and dynamic Young’s moduli of rocks. Int. J. Rock. Mech. Mm Sci. Geomech. Abstr. 1988, 25, 479–482. [Google Scholar] [CrossRef]
  25. JTG/T D61-2005; Code for Design of Highway Masonry Bridges and Culverts. Ministry of Transport of the People’s Republic of China: Beijing, China, 2005.
  26. Grazzini, A.; Lacidogna, G. Mechanical Properties of Historic Masonry Stones Obtained by In Situ Non-Destructive Tests on the St. Agostino Church in Amatrice (Italy). Appl. Sci. 2021, 11, 6352. [Google Scholar] [CrossRef]
  27. JTG/T J21-2011; Specification for Inspection and Evaluation of Load-Bearing Capacity of Highway Bridges. Ministry of Transport of the People’s Republic of China: Beijing, China, 2011.
  28. Zhong, W.; Lin, Y. Identification of stone materials used in Wanning Bridge, a Beijing municipal cultural relics protection unit. Stone 2021, 9, 53–55. [Google Scholar]
  29. Liu, G.; Shi, C.; Liu, Y. Analyses of the Elastic Modulus Values of Masonry. J. Hunan Univ. Nat. Sci. 2008, 35, 29–32. [Google Scholar]
  30. Borlenghi, P.; Saisi, A.; Gentile, C. Determining structural models of a masonry tower from Architectural research and operational modal analysis. J. Build. Eng. 2025, 111, 113347. [Google Scholar] [CrossRef]
  31. GB/T 50452-2008; Technical Code for Protection of Historic Buildings Against Industrial Vibration. Ministry of Housing and Urban-Rural Development of the People's Republic of China, General Administration of Quality Supervision; China Architecture & Building Press: Beijing, China, 2008.
Figure 1. Schematic diagram of the present situation of Wanning Bridge. (a) side view, (b) front view.
Infrastructures 10 00251 g001
Figure 2. Flowchart of structural research of Wanning Bridge.
Infrastructures 10 00251 g002
Figure 3. Disease distribution map of Wanning Bridge deck system.
Infrastructures 10 00251 g003
Figure 4. (a) The ashlar blocks of the main arch ring are cracked; (b) Distribution and seepage of typical cracks; (c) The concave shape at the bottom of the arch ring.
Infrastructures 10 00251 g004
Figure 5. Schematic diagram of local shedding of jointing on the left-wing wall of abutment. (a) overall view; (b) close-up view.
Infrastructures 10 00251 g005
Figure 6. (a) Schematic plan view of the bridge; (b) The generation process of the bridge entity model.
Infrastructures 10 00251 g006
Figure 7. The result of ground–penetrating radar. (a) Main components of Bridges; (b) Bridge deck structure.
Infrastructures 10 00251 g007
Figure 8. (a) Field setup of the ultrasonic testing experiment; (b) Diagram of the experimental area.
Infrastructures 10 00251 g008
Figure 9. (a) Schematic diagram of boundary conditions; (b) Schematic diagram of the coordinate system of the measuring point on the bridge arch. (c) Observation points over the arch.
Infrastructures 10 00251 g009
Figure 10. Finite Element Analysis Results: (a) Deformation diagram; (bd) Stress contour diagrams.
Infrastructures 10 00251 g010
Figure 11. Plots of x-direction point measurements in the span of the vault. (a) Case 1; (b) Case 2.
Infrastructures 10 00251 g011
Figure 12. Measured data of y-direction measurement points in the span of the vault.
Infrastructures 10 00251 g012
Figure 13. Schematic diagram of the test equipment with ice surface station. (a) X-axis inspection; (b) Y-axis inspection.
Infrastructures 10 00251 g013
Figure 14. Data acquisition plots for the first set of dynamic loading experiments, (a) time domain plot; (b) frequency domain plot.
Infrastructures 10 00251 g014
Figure 15. (a) The first-order mode; (b) The second-order mode; (c) The third-order mode.
Infrastructures 10 00251 g015
Figure 16. (a) Vertical vibration velocity of the east side of the bridge; (b) Vertical vibration velocity of vertical vibration on the west side of the bridge.
Infrastructures 10 00251 g016
Table 1. Geometric parameters obtained by radar scanning.
StructuresThickness (cm)
Arch ring≈90
side walls≈50
Trail bricks≈1.5
Curbs≈25
Non-motorized road flat stone≈25
Flat stone at the vault of the non-motorized roadway≈10
Table 2. Measurement results of P-wave and S-wave propagation time.
Longitudinal Wave Propagation Time (μs)Transverse Wave Propagation Time (μs)
35.673.8
35.273.6
36.485.2
36.477.6
34.875.2
4280.4
43.279.6
Table 3. Measurement Results.
Longitudinal Wave Velocity Vp (m/s)Transverse Wave Velocity Vs (m/s)Dynamic Modulus of Elastic Ed (GPa)Poisson’s Ratio νDynamic Shear Modulus Gd (GPa)
2489.621198.8210.080.353.74
Table 4. Material parameter.
Arch Ring and Side WallsBackfillTrail Bricks
Young’s Modulus (GPa)5.081.255.65
Poisson’s ratio0.350.280.3
Density (kg/m3)260014002400
Table 5. Load conditions and the number of sensors.
Load CaseVehicle Type and QuantityTotal Mass (t)Loading PositionNumber of Sensors
1Two cars with two axles39.82Front axle in midspan29
2Rear axle is located in midspan
Table 6. Vertical displacement table of transverse bridge direction measurement points in the span of arch top in Case 1.
Monitoring PointsCoordinate Initial ValueMeasured ValueCalculate the ValueResidual ValueVerification Coefficient
1−6.050.000.010.0120.000.833
2−4.250.000.010.0170.000.588
3−2.450.000.040.0410.000.976
4−0.650.000.050.0550.000.909
50.650.000.050.0530.000.943
62.450.000.030.0390.000.769
74.250.000.020.0230.000.870
86.050.000.010.0130.000.769
Table 7. Vertical displacement table of transverse bridge direction measurement points in the span of arch top in Case 2 (mm).
Monitoring PointsCoordinate Initial ValueMeasured ValueCalculate the ValueResidual ValueVerification Coefficient
1−6.050.000.020.0230.000.870
2−4.250.000.030.0380.000.789
3−2.450.000.060.0850.000.706
4−0.650.000.090.1060.010.849
50.650.000.090.1050.010.857
62.450.000.070.0830.000.843
74.250.000.030.0360.000.833
86.050.000.010.0190.000.526
Table 8. Vertical displacements in the mid-span of the arch in the direction of the bridge (mm).
Monitoring PointsCoordinate Initial ValueMeasured ValueCalculate the ValueResidual ValueVerification
Coefficient
1−3.40.000.000.0050.00-
2−1.70.000.020.0270.000.741
300.000.090.1060.010.849
41.70.000.020.0380.000.526
53.40.000.000.0020.00-
Table 9. Maximum deformations of dynamic and static loads.
Load TypeGroup 1Group 2
Maximum deformation under dynamic load (mm)0.14−0.12
Maximum deformation under static load (mm)−0.09−0.09
Table 10. The first three natural frequencies calculated for different elastic moduli of the masonry (only adjusting the elastic modulus of the masonry).
Young’s Modulus (GPa) First-Order Natural
Frequency (Hz)
Second-Order Natural
Frequency (Hz)
Third-Order Natural
Frequency (Hz)
5.9410.2114.2214.96
5.659.8413.7514.38
5.379.3712.9313.41
5.089.1311.4112.92
Disclaimer/Publisher’s Note: The statements, opinions and data contained in all publications are solely those of the individual author(s) and contributor(s) and not of MDPI and/or the editor(s). MDPI and/or the editor(s) disclaim responsibility for any injury to people or property resulting from any ideas, methods, instructions or products referred to in the content.