Article

Dynamic Simulation and Seismic Analysis of Hillside RC Buildings Isolated by High-Damping Rubber Bearings

1
Faculty of Civil Engineering and Mechanics, Kunming University of Science and Technology, Kunming 650500, China
2
College of Urban Construction, Yunnan Open University, Kunming 650223, China
3
Department of Civil and Environmental Engineering, University of Alabama in Huntsville, Huntsville, AL 35899, USA
4
Faculty of Metallurgical and Energy Engineering, Kunming University of Science and Technology, Kunming 650500, China
*
Authors to whom correspondence should be addressed.
Infrastructures 2025, 10(9), 239; https://doi.org/10.3390/infrastructures10090239
Submission received: 3 June 2025 / Revised: 2 September 2025 / Accepted: 5 September 2025 / Published: 10 September 2025

Abstract

Hillside buildings are particularly vulnerable to earthquakes owing to their structural configuration; however, research addressing this issue remains limited. This study investigates the effectiveness of high-damping rubber bearings (HDRBs) in enhancing the seismic resilience of hillside structures. Five numerical models were analyzed using non-linear time-history (NTH) analysis, including two flat-plane structures (one isolated and one with a fixed base) and three dropped-layer structures on hillside terrain (one with base isolation, one with inter-story isolation, and one with a fixed base). Deformation history integral (DHI) modeling was employed to simulate the HDRBs. Six earthquake ground motions from the PEER database and one scaled from 0.2–0.8 g were used to assess the seismic responses of the buildings. The results indicate that HDRBs significantly improved the seismic performance. The flat-plane isolated system (FIS) model achieved a nearly 90% reduction in peak roof acceleration compared to fixed-base structures. The dropped-layer isolated system (DIS) and dropped-layer inter-story isolated system (DIIS) models exhibited reductions of approximately 80% in the peak roof acceleration. Furthermore, the isolated structures demonstrated up to 78% reduction in the maximum inter-story drift, along with significant decreases in the story shear forces and overturning moments. Compared with non-isolated dropped-layer structures, the DIS and DIIS models showed reductions of 70% and 55% in the base shear force, respectively. The results highlight the efficacy of HDRBs in energy dissipation and their significant role in enhancing the seismic resilience of mountain structures.

1. Introduction

Constructing buildings on hillside terrains poses significant structural challenges because of the inherent irregularities of such sites. These irregularities stem from the varying elevations across the foundation, resulting in an asymmetrical distribution of mass and stiffness throughout the structure’s height. These geometric complexities profoundly influence the seismic response of buildings, amplifying their susceptibility to earthquake-induced forces [1,2,3]. Structural irregularities in hillside buildings are categorized as planar and vertical irregularities. Planar irregularities manifest as asymmetries in the horizontal layout of the structure, whereas vertical irregularities arise from discontinuities in the vertical plane, such as setbacks or variations in the floor heights. Sloped terrain accentuates vertical irregularities, posing significant challenges in structural design and seismic performance assessment [4,5,6,7,8]. These irregularities can lead to an uneven distribution of lateral forces during seismic events, causing torsional movements and increased concentrations in specific areas of the building. The significant damage sustained by hillside residences during the 1994 Northridge Earthquake, which impacted over 10,000 homes and resulted in severe damage to 374 homes, highlights the imperative need for rigorous seismic enhancements in structural design [9]. Similarly, during the 2008 Wenchuan earthquake, numerous hillside structures sustained significant damage owing to stress concentration in short columns [10,11,12].
Several studies have investigated the seismic vulnerability of various building designs across diverse terrains and slope conditions in the past. Halkude et al. [13] conducted a seismic analysis of buildings situated on sloping ground, examining both step-back and step-back-setback frame configurations. Utilizing the response spectrum analysis (RSA), their study investigated key dynamic responses, including the fundamental time period, top-story displacement, and base shear, considering variations in the number of bays and hill slope ratios. The primary finding was that step-back-setback building frames demonstrated superior performance on sloping terrain compared to step-back frames. This study highlighted the structural irregularities inherent in hillside construction due to varying column heights, which can lead to increased torsion and shear during seismic events. Murthy [14] identified the vulnerability of open-ground story buildings, particularly those with flexible ground stories, to shear forces during strong earthquakes. Ghosh and Debbarma [15] explored the deficiencies and vulnerabilities of soft-story structures and advocated the implementation of shear walls to augment stiffness and mitigate displacement. Another study by Roshan and Pal [16] recommended reinforced-concrete-filled steel tube columns to address the vulnerabilities of setback buildings with open-ground stories and prevent collapse during earthquakes. Aggarwal and Saha [17] highlighted that open stories significantly diminish the seismic performance of reinforced-concrete buildings on hilly terrain, with the uppermost foundation level being particularly vulnerable to seismic excitations.
Konakalla et al. [18] investigated the influence of vertical irregularities on multi-story buildings, focusing on their torsional response. The findings indicate that irregular frames experience tensional rotation, causing a different response in columns perpendicular to the applied force, unlike symmetrical frames, which show no torsional effects. Surana et al. [19] analyzed seismic design considerations for hillside buildings by comparing the collapse vulnerability among “flat-land (FL)”, “split-foundation (SF)”, and “step-back (SB)” structures. They found that SF buildings exhibited notable vulnerability, particularly in tall building configurations, underscoring the necessity for tailored seismic design approaches. Birajdar and Nalawade [20] studied the seismic performance of buildings situated on sloping ground by analyzing twenty-four reinforced-concrete frames, including step-back, step-back-setback, and setback configurations, on a 27-degree slope using 3D analysis incorporating torsional effects via the response spectrum method. Their research revealed a proportional increase in the top-story displacement and fundamental period with the building height. Step-back buildings demonstrated heightened vulnerability compared to step-back-setback structures owing to the uneven distribution of shear forces and increased torsional moments, particularly affecting the extreme left ground-level columns.
In this context, reinforced-concrete (RC) split foundations and stilted frame structures are commonly employed to accommodate topographic variations in the ground. Understanding the dynamic response of such structures is crucial, particularly in seismic regions. Consequently, the dynamic characteristics and failure modes of hillside split-foundation frame structures differ significantly from those of structures on flat terrain, necessitating a nuanced understanding of their seismic behavior [10,16,21].
Moreover, seismic isolation systems have demonstrated significant effectiveness in enhancing the seismic resilience of diverse civil engineering structures, such as bridges, residential and public buildings, hospitals, and nuclear power plants [22,23,24,25,26,27,28,29,30,31,32]. Mazza et al. [33] investigated base isolation with high-damping rubber bearings as a retrofitting method to prevent in-plane and out-of-plane seismic collapse of masonry infills in hospitals. Their analysis of a five-story RC-framed hospital revealed that fixed-base structures were highly vulnerable to infill collapse, whereas base isolation prevented collapse and changed the damage distribution, depending on the non-linear behavior of the infill. However, further research is required to precisely address buildings on hillsides with vertical stiffness irregularities and the use of base isolation systems. This study examines the application of HDRBs in hillside structures, with a particular focus on those featuring dropped-layer stories, as illustrated in Figure 1. Finite element analysis (FEA) was utilized for modeling, incorporating the non-linearity of HDRBs through the deformation history integral (DHI) model. In contrast to conventional models that assume simplified elastic behavior and disregard the impact of previous loading cycles, the DHI model effectively captures the complex mechanical behavior of HDRBs, including hysteresis, energy dissipation, and strain softening properties under seismic and cyclic loading conditions.
This study examines the seismic performance of 10-story reinforced-concrete (RC) structures with dropped-layer stories incorporating HDRBs at both the base and inter-story levels. The novelty of this study lies in its focus on hillside structures, a topic that has received limited attention in the existing literature. The seismic behavior of base-isolated hillside buildings was compared with that of the corresponding flat-site structures, emphasizing the unique challenges posed by sloped terrains. The investigation included two configurations of base isolation: one at the base level and the other at the inter-story level. It analyzed non-linear time histories across various seismic events and designed the response spectra. By examining the influence of vertical irregularities on structural performance, this study provides new insights into how HDRBs mitigate seismic forces in hillside buildings. The findings offer practical recommendations for designing and applying HDRBs in hillside buildings and advance the understanding of base isolation systems in complex, non-flat terrains.

2. High-Damping Rubber Bearing Constitutive Model

High-damping rubber bearings are frequently utilized in seismic isolation systems because of their ability to endure significant shear strains while maintaining strong mechanical properties [34,35,36,37,38]. Various analytical models have been devised to simulate the behavior of HDRBs under unidirectional and bidirectional shear load conditions. These models include the Ramberg–Osgood model [39] and others extensively utilized in civil engineering research and practice [40,41,42]. However, the existing models often need to be revised to fully capture the intricate non-linear behaviors observed at high shear strains [43]. The DHI model was developed by Masaki and Mori [44] to address these challenges by incorporating shear strain dependency to provide accurate predictions of HDRB behavior across a broad strain range. Additionally, the DHI model, which has undergone rigorous validation and refinement, has demonstrated its ability to replicate the complex properties and creep-like behavior of HDRBs through experimental validation [39,42,45]. By employing a finite-element-analysis-based constitutive law, the DHI model effectively characterizes the HDRB hysteresis behavior using a reduced set of parameters. This advancement enhances the dynamic analysis accuracy and simulation capabilities and has recently been integrated into FE software packages, such as CSI SAP2000 .v25 and ETABS .v22 [44,46].
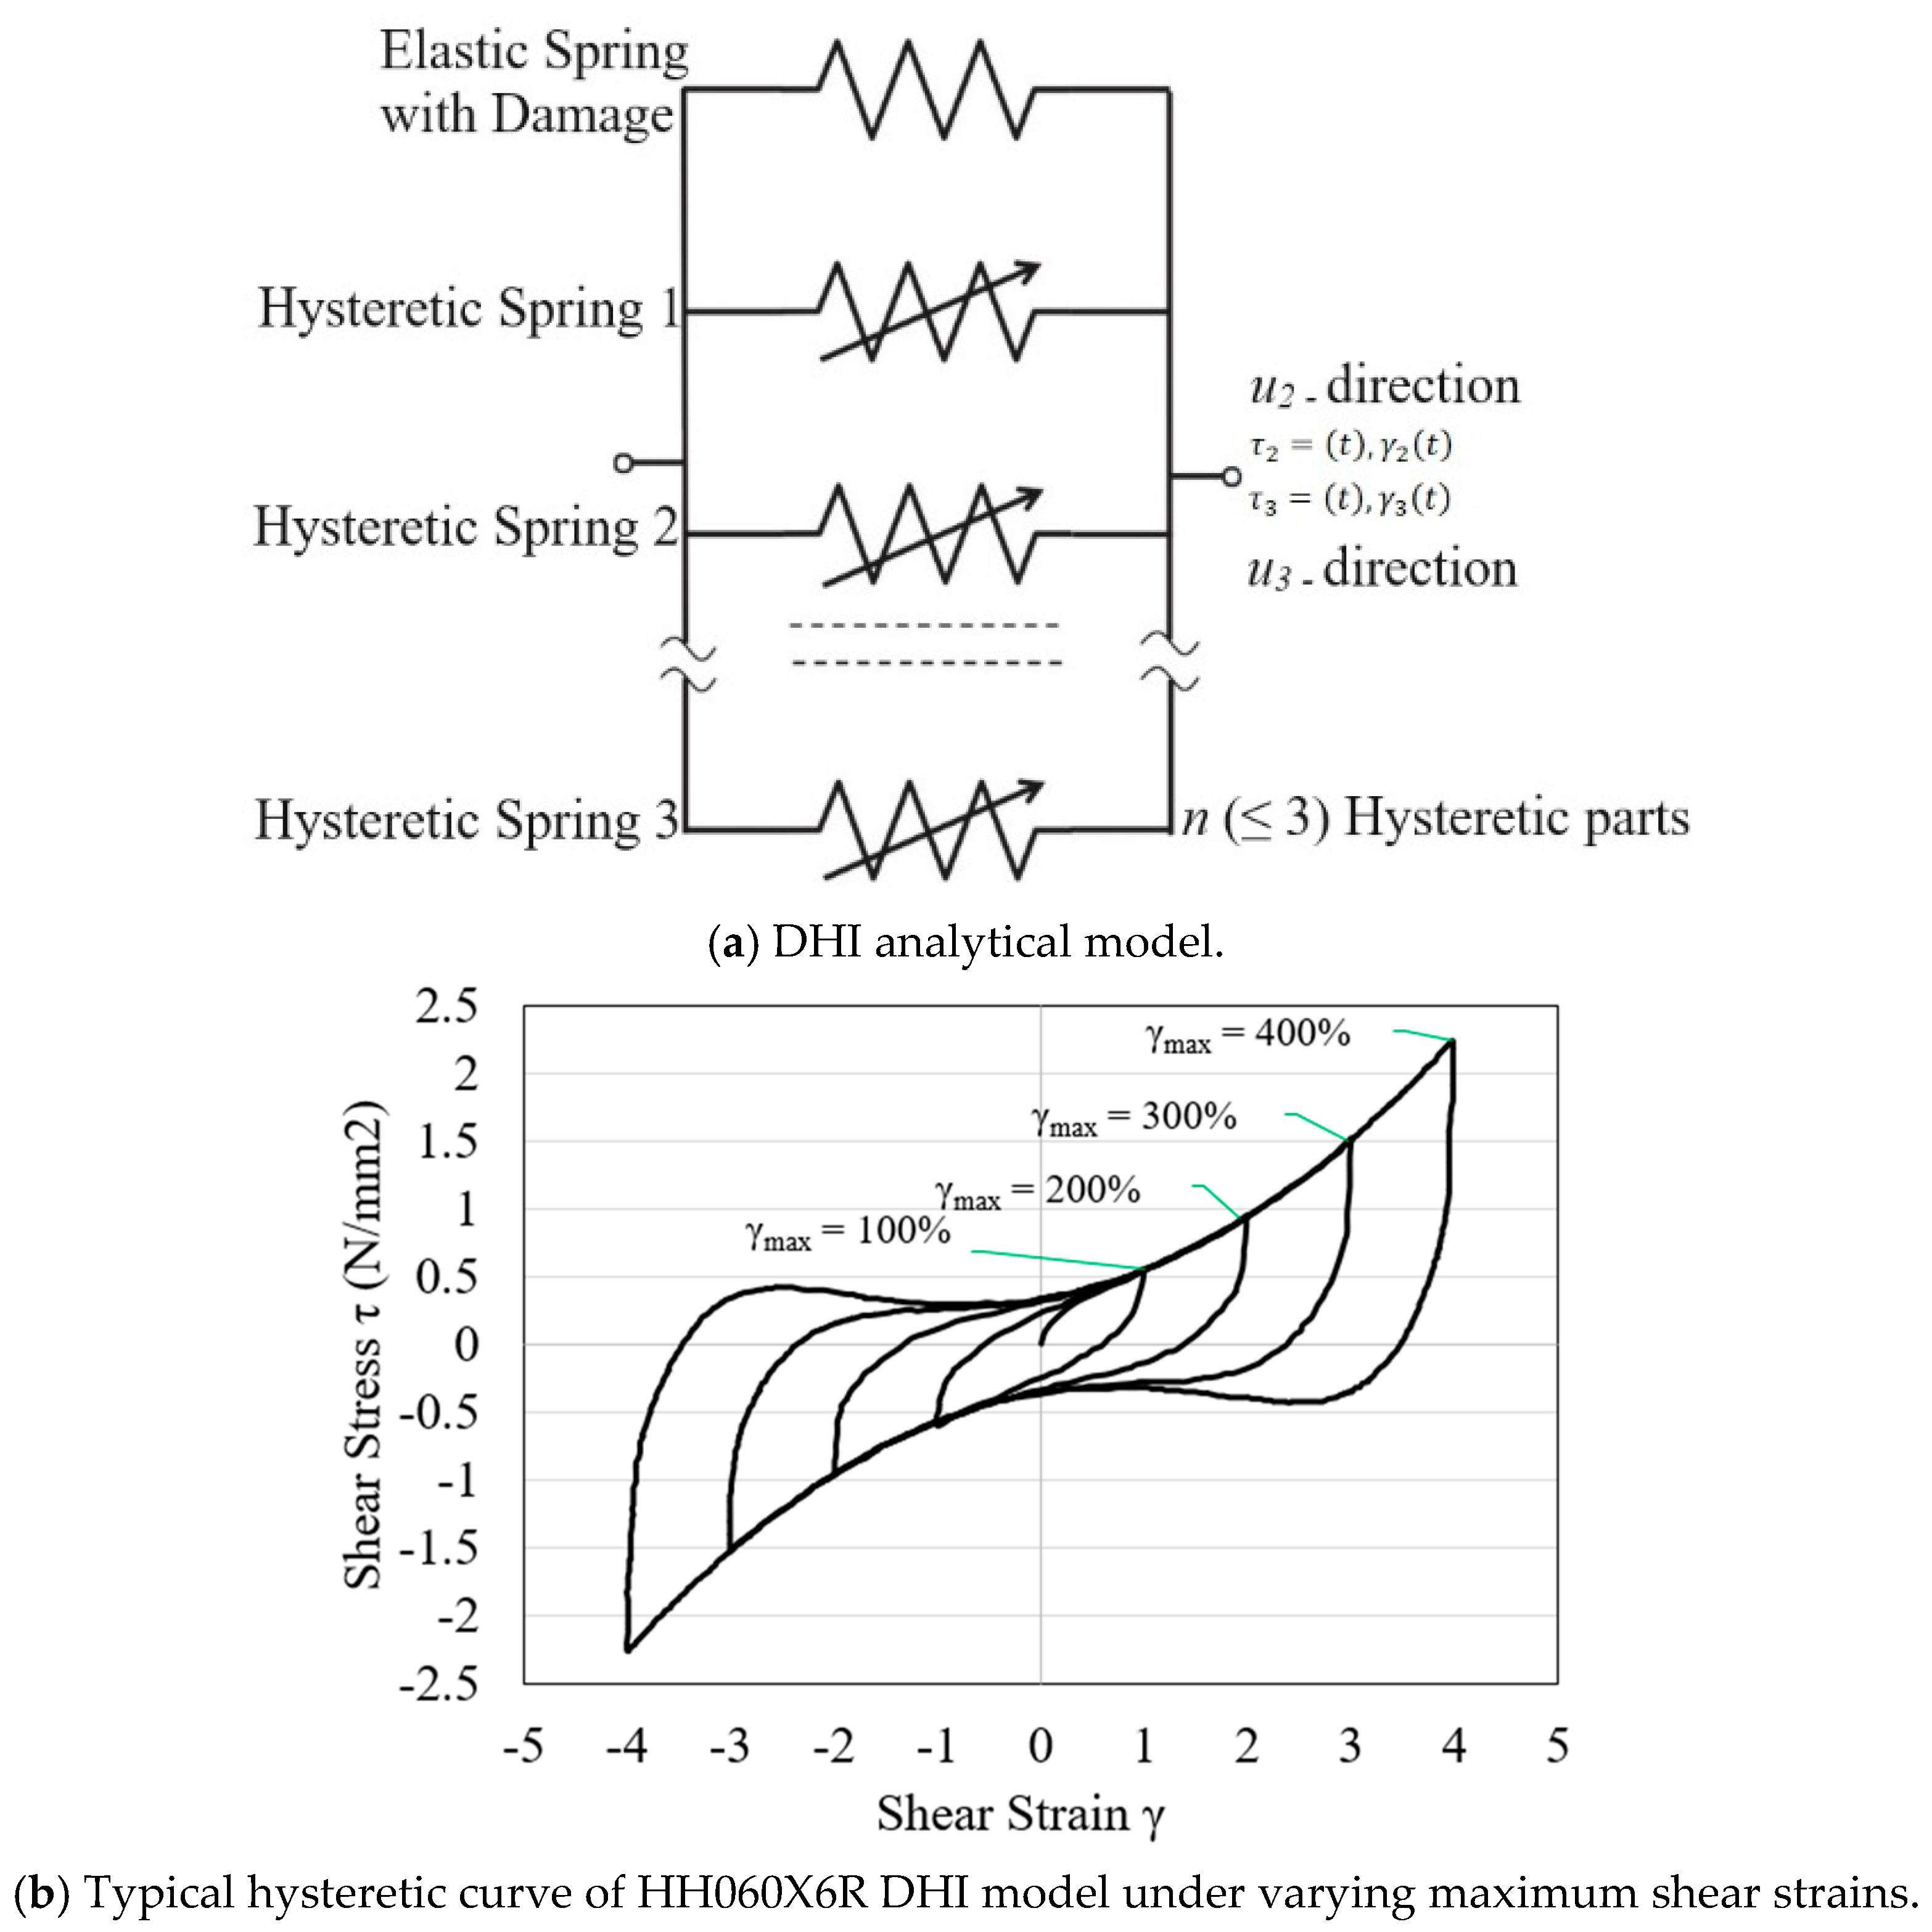
The non-linear shear behavior of HDRBs is characterized by a model that integrates the parallel spring elements. This model incorporates elastic and hysteretic terms, as shown in Figure 2a. It operates time-independently, where t denotes a time-step or load-step sequence rather than real-time sequence. Figure 2b shows a typical hysteresis curve generated under unidirectionally increasing harmonic excitation simulated using the DHI model. In step t , for shear strains in u 2 and u 3 degrees of freedom, denoted as γ 2 and γ 3 , respectively, the shear stresses τ 2 and τ 3 are the sum of the elastic parts ( τ 2 e , τ 3 e ) and n hysteretic parts ( τ 2 h , τ 3 h ) [46]:
τ 2 t   =   τ 2 e   t   +   i = 1 n τ 2 h i
τ 3 t   =   τ 3 e   t   +   i = 1 n τ 3 h i
The following parameters define the behavior of the elastic component. These parameters include the elastic stiffness ( G a ), damage function resistance ratio ( θ ), ranging from zero (total damage) to one (no damage), and damage function control strain ( γ d ). The elastic shear stress for degrees of freedom u 2 and u 3 is given by [44,46].
τ 2 e   =   G a   Ξ   t γ 2 t
τ 3 e   =   G a   Ξ   t γ 3 t
The damage function Ξ   ( t ) is defined as
  Ξ   t   =   θ   +   1   +   θ exp γ m   t γ d  
γ m   t   =   m a x t γ 2 t γ 2 t     1   +   γ 3 t γ 3 t     1
where γ m is the maximum strain experienced at time t .
The hysteretic terms have three parameters: the number of hysteretic components ( n ), the control strain ( γ i ), the strain required for hysteretic behavior in the i t h term, hysteretic control strength ( τ i ), and energy dissipation capacity of the i t h term.
The hysteretic shear stresses for u 2 and u 3 are incrementally calculated as
τ 2 h t i   =   e Δ L t γ i   τ 2 h t     1 i   +   τ i 3 e Δ L t 2 γ i   ·   γ 2 t 2     e Δ L t 2 γ i η t     1 i   +   3     · γ 2 t
τ 3 h t i   =   e Δ L t γ i   τ 3 h t     1 i   +   τ i 3 e Δ L t 2 γ i   · γ 3 t 2     e Δ L t 2 γ i η t     1 i + 3 · γ 3 t
where
η t i   =   e Δ L t γ i   η t     1 i   +   2 e Δ L t 2 γ i   γ 2 t · γ 2 t   +   γ 3 t · γ 3 t
γ 2 t   =   γ 2 t     γ 2 t     1
γ 3 t   =   γ 3 t     γ 3 t     1
Δ L t   =   γ 2 t 2   +   γ 3 t 2
Through the analysis of the hysteretic curve depicted in Figure 2b and the aforementioned equations, the parameters of the DHI model for the HDRB isolator were determined as indicated by [44] and are presented in Table 1.

3. Numerical Modeling

3.1. Structural Modeling of Hilly Buildings

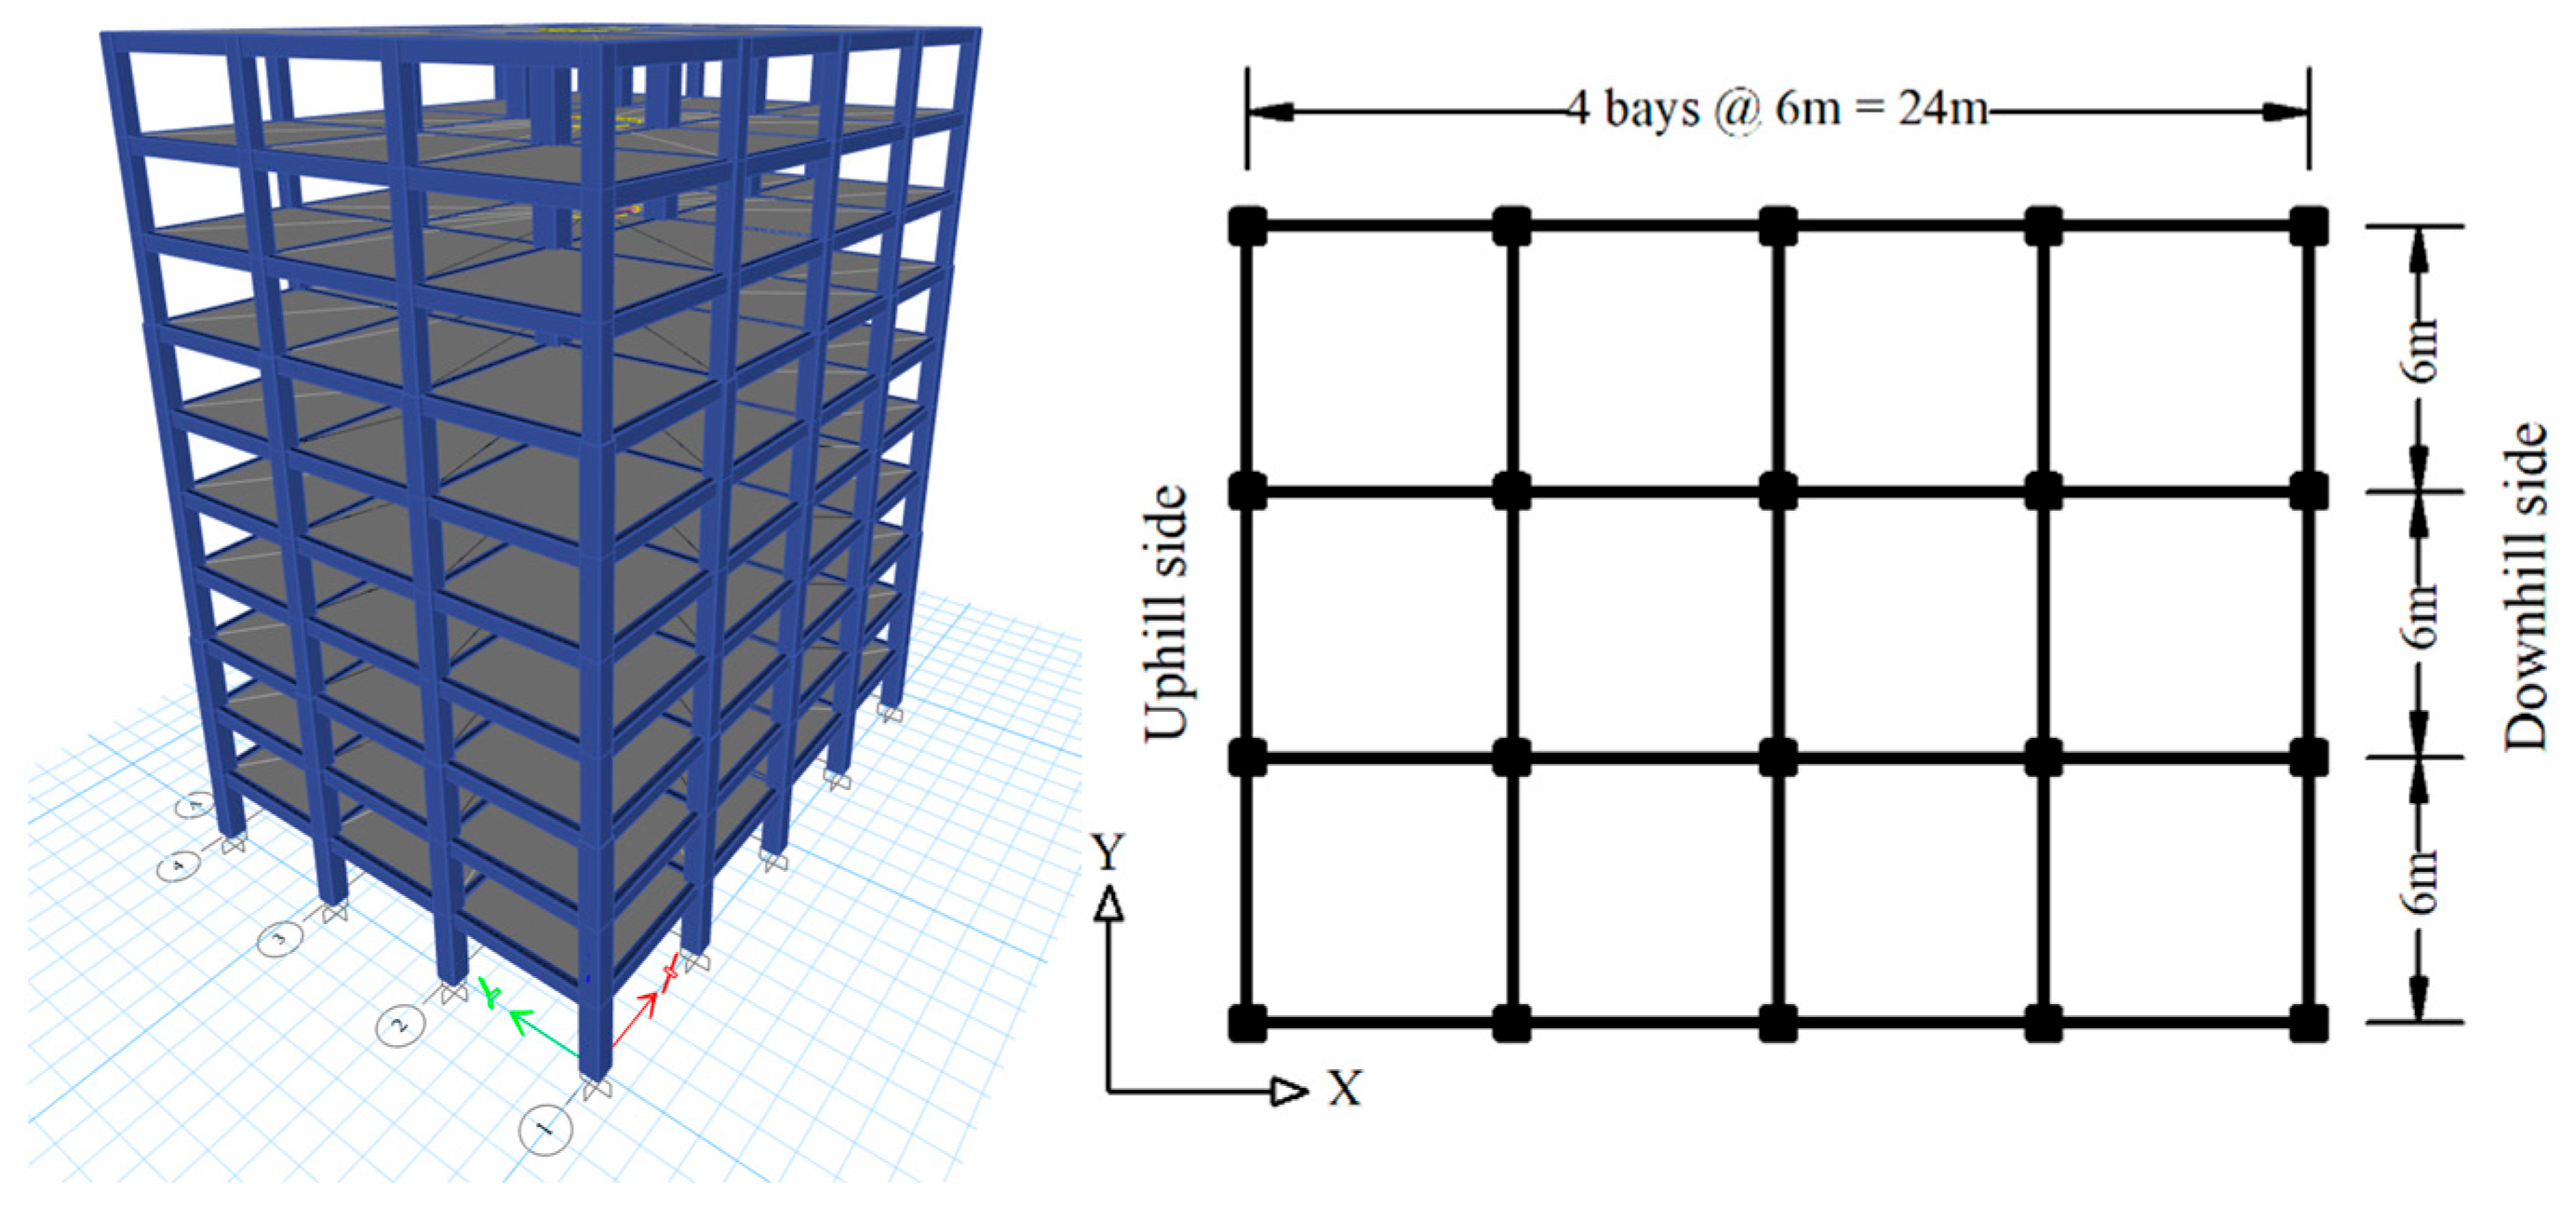
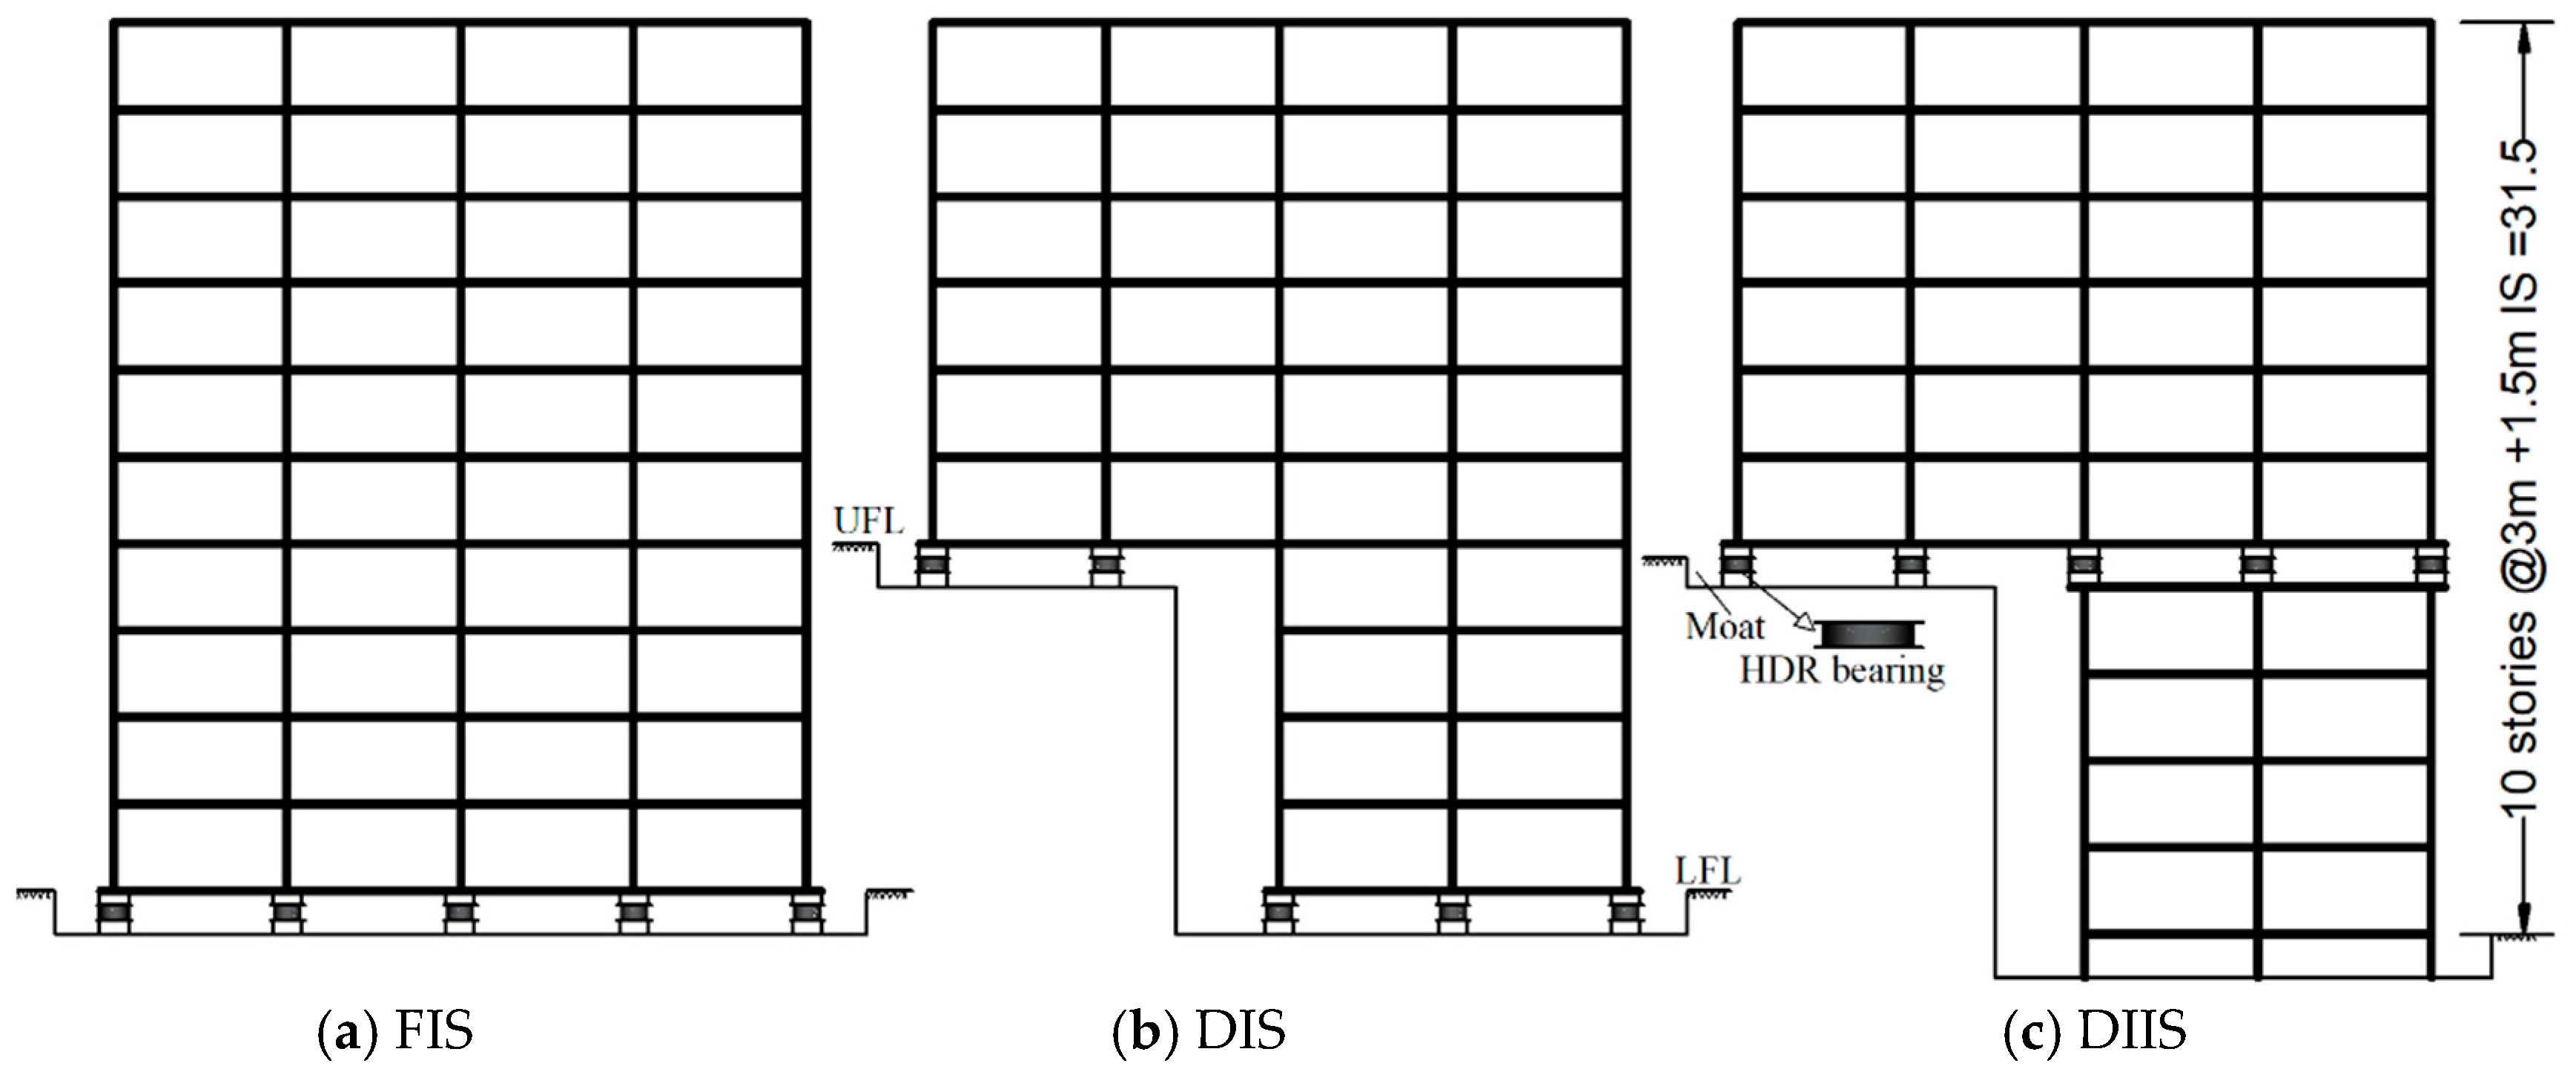
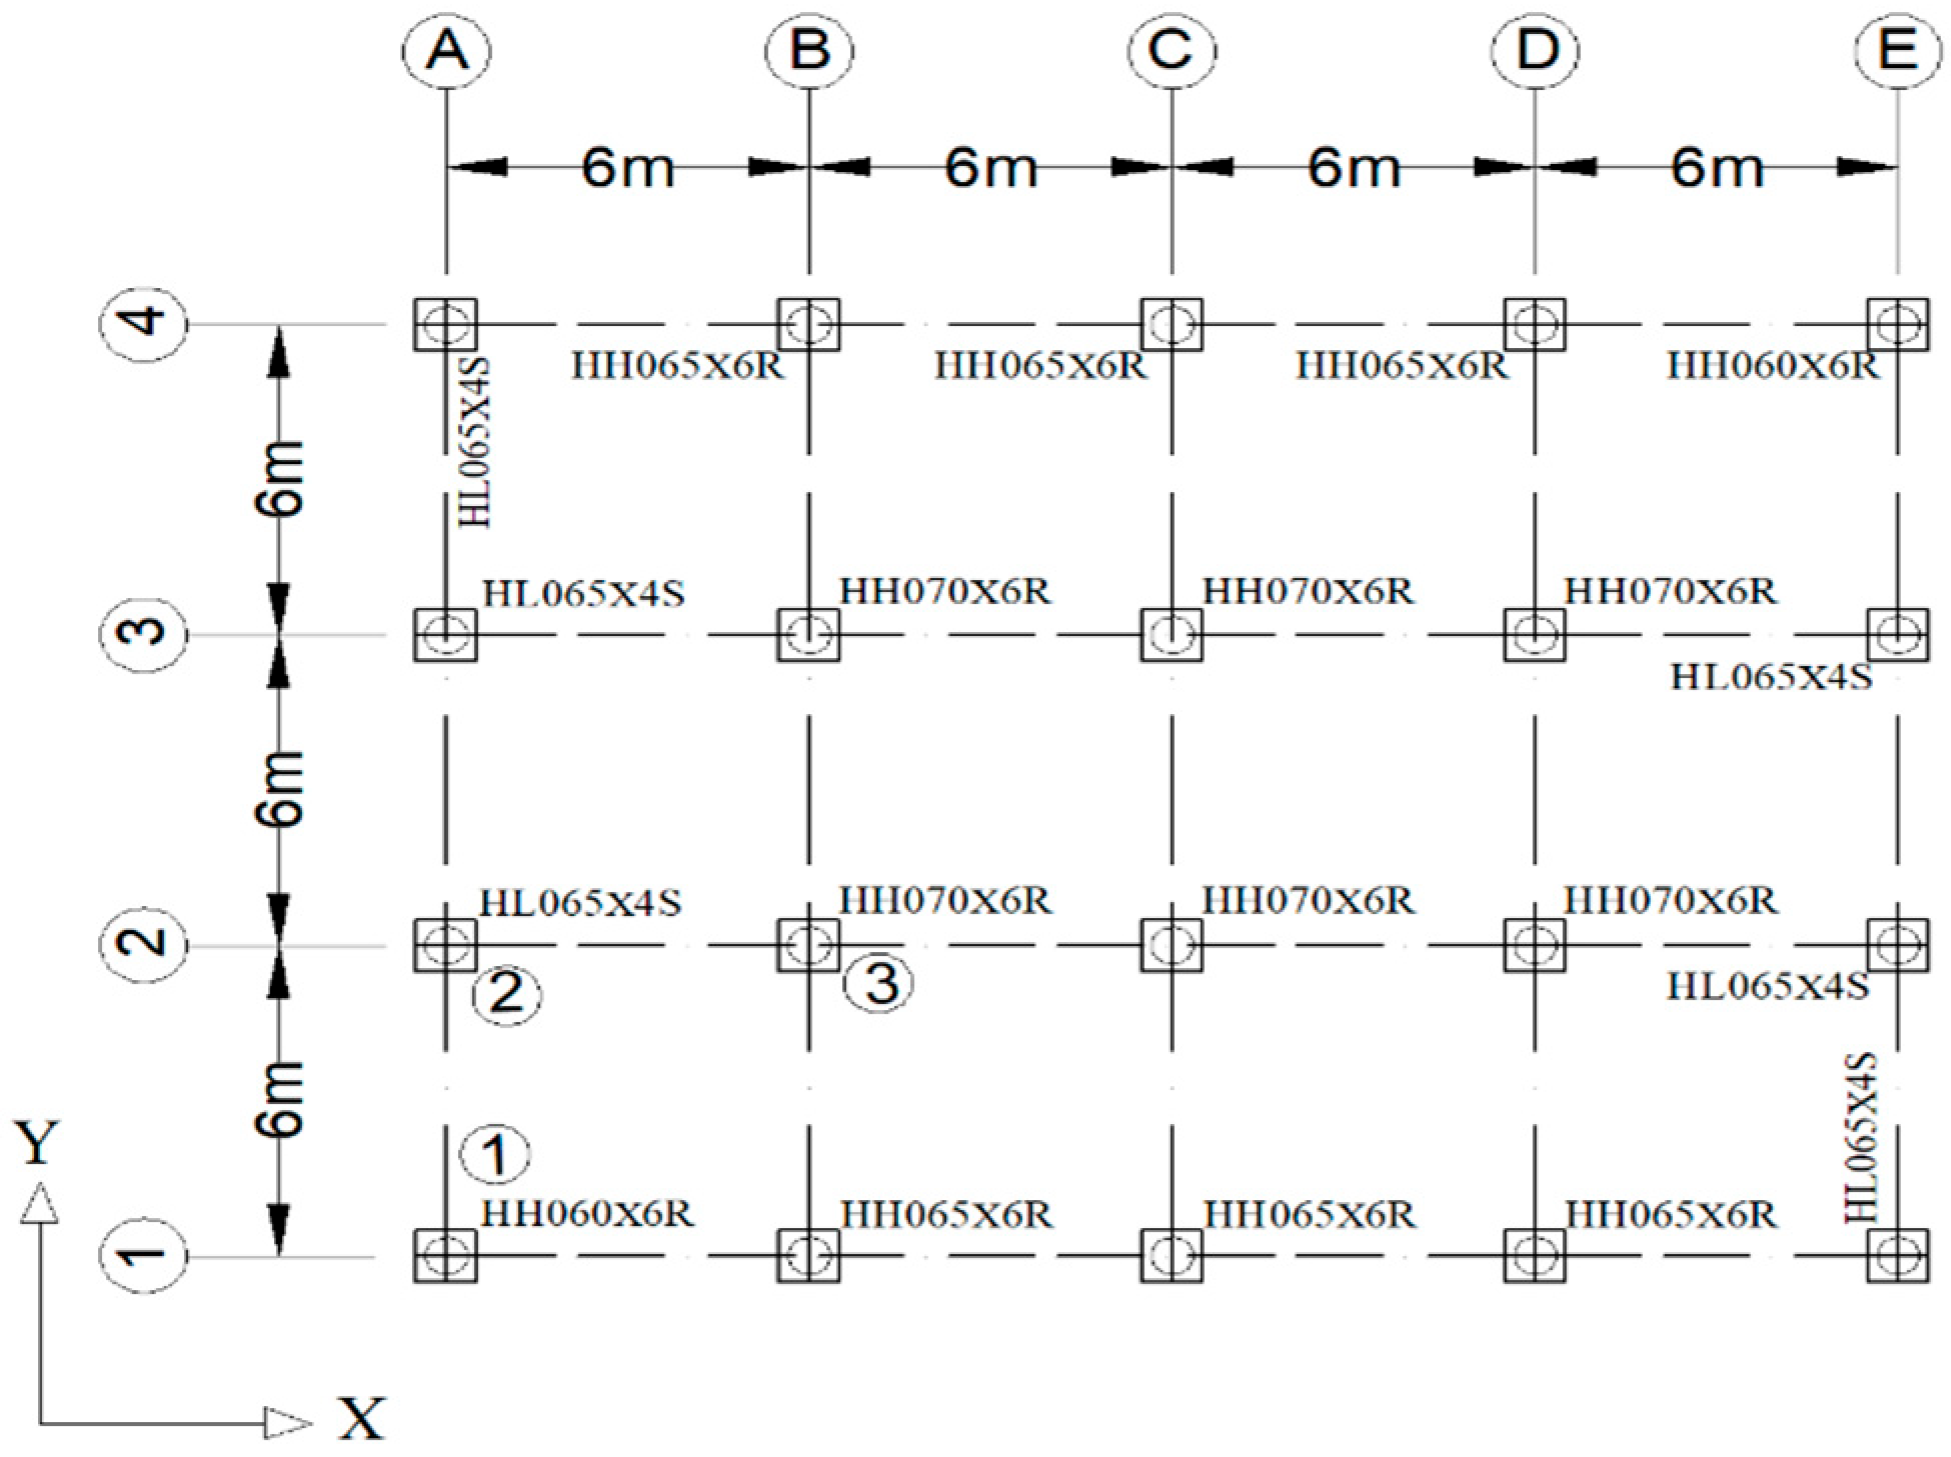
Figure 3 shows the 3D structural model and floor plan of the ten-story flat- and dropped-layer isolated structures with HDRBs. The building dimensions were 24 m in the X-direction and 18 m in the Y-direction, and the story height was kept constant at 3 m, totaling 30 m from the lower floor level (LFL). The study includes three structural configurations: a flat isolated structure (FIS), a four-story dropped-layer isolated structure (DIS), and a four-story dropped-layer inter-story isolated structure (DIIS), as depicted in Figure 4a–c. In addition to evaluating the response of these isolated structures, two corresponding fixed-base structures (F_fixed base and D_Fixed base) were considered in this study.
This study utilized ETABS FE-based software for structural modeling and analysis. Beams and columns were modeled using frame elements, whereas slabs were represented using shell elements. Table 2 presents the cross-sectional specifications of the beam, column, and slab. The concrete compressive strength and steel yield strength were specified as 30 and 400 MPa, respectively. Dead and live loads were designed at 4 kN/m2 and 2 kN/m2 for floors and 2 kN/m2 and 0.5 kN/m2 for roofs, respectively. The structural design aimed to meet a seismic fortification intensity level of eight (0.2 g). Site classification followed the Chinese code [47], categorizing the site as Category II with a seismic grade II.

3.2. Design of High-Damping Rubber Bearings

To design an isolated building with HDRBs, the process begins with an estimated effective damping ratio ( ξ e f f ) of 10–20% and an effective period ( T e f f ) of 2.5–3.5 s, followed by the selection of the design shear strain ( γ m a x ) [48,49]. The target values can be established by adjusting the design spectrum and analyzing the displacement spectra. In this study, the effective period was set to 2.75 s. This aimed to shift the building’s natural period away from the dominant frequencies of strong ground motions, thereby minimizing resonance and reducing the forces transmitted to the superstructure. Damping was set to 20% and design shear strain to 150%.
The design displacement of the isolator was calculated using Equation (13):
D D   =   g 4 π 2 S D   T e f f B D
For an effective damping of 20%, the damping coefficient B D was selected as 1.5 from the IBC [50], and from the same code, the seismic coefficient for the site of the isolated building with long periods was S D = 0.67. Therefore, D D   =   0.28   m   o r   280   m m was determined to be less than the column depth of 0.5 m, which satisfied the IBC [50].
Using Equation (14), the effective horizontal stiffness K e f f of the three isolators in the corner, edge, and center columns was calculated as 876, 1040 and 1180 kN/m, respectively.
K e f f = W g 2 π T e f f 2 | W = P D L + L L
The effective damping was calculated using Equation (15):
W d =   2 π   K e f f / D D 2 ξ e f f
The isolator height was determined as t r = 187 mm using Equation (16):
t r = D D γ m a x
For this study, rubber with a shear modulus G = 0.392   N / m m 2 , elastic module E c = 6.2   N / m m 2 , and 0.20 equivalent damping and elongation at break of 840% was chosen. Based on the proposed rubber properties, the effective and allowable areas of the bearing were determined and checked for shear strain stability using the following equations:
γ c = 6 S · P D L + L L E c · A   ε b 3
where ε b is rubber’s elongation at break; S is the shape factor; and A is the area of the bearing. To prevent the bearing from becoming unstable, the average compressive stress σ c of the bearing should be less than a preset tolerance:
σ c   = P A < σ c r =   π G · S · D 2.5   t r
The shear strain condition for the earthquake load was as follows:
γ s c +   γ e q + γ s t 0.75   ε b  
with
γ s c = 6 S · P D L + L L + E Q E c · A
  γ e q = D D t r
γ s r = B 2 · θ 2 · t · t r  
θ = 12 D e b 2 + d 2  
where γ s c is the shear strain under compression, as in Equation (16), except P D L + L L + E Q , which is the combination of dead, live, and earthquake loads. γ e q is the shear strain under an earthquake; γ s r is the shear strain under rotation; θ is the rotation angle of the bearing induced by an earthquake; e is the actual eccentricity +5% of accidental eccentricity; D is the diameter of the bearings; h is the height of the bearings; and b ,   d are the dimensions of the structure with a rectangular plan.
To avoid the rollout of the bearing, the displacement of the bearing under an earthquake load should fulfil the following conditions:
D D γ r o l l - o u t = P D L + L L + E Q · D P D L + L L + E Q   +   K e f f · h  
Upon completion of the primary bearing design, three types of isolators (HH060X6R, HH065X6R, and HH070X6R) manufactured by Bridgestone Corporation (Tokyo, Japan) were selected for the isolation system design. Subsequently, their stabilities were thoroughly assessed. The parameters for the DHI model of the HDRBs were determined in the previous section. Table 3 presents the mechanical properties of the HDRBs corresponding to the parameter values of the DHI model shown in Table 1.
All bearings were positioned directly beneath the columns. Figure 5 illustrates the configuration of the isolation layer. To support greater vertical compressive loads from the superstructure, HH070X6R isolators with a larger plane area and higher compressive stiffness were installed in the central part of the plane. Meanwhile, HH065X6R isolators were primarily placed around the edges, and HH060X6R isolators were installed in the corners of the building. The fast non-linear analysis (FNA) method, which is known for its efficiency in analyzing isolated structural systems, was employed in the non-linear time-history analyses. The isolator components were modeled as non-linear link elements, introducing non-linearity into the system and operating as HDRBs. In contrast, the superstructure was represented as an elastic element in the model. This assumption was based on several reasons. First, the core design philosophy of seismic isolation is to protect the superstructure from significant damage by concentrating inelastic deformation within the isolators, thus ideally keeping the superstructure within its elastic range under design-level earthquakes. Furthermore, modeling the full 3D non-linear behavior of a 10-story irregular structure, such as that investigated in this study, would require significantly greater computational time and resources. Such complex non-linear models, especially for irregular configurations, often present substantial convergence challenges in time-history analysis, potentially hindering the feasibility and efficiency of comparative studies across multiple structural configurations and ground motions. Therefore, focusing on the non-linearity within the isolators allows for a clear and computationally manageable assessment of their effectiveness in protecting an otherwise elastic superstructure.

3.3. Modal Analysis

In this study, modal analyses were conducted using ETABS.v22 software. Twenty modes were calculated using the Ritz vectors to capture the deformation of the model elements with a mass participation ratio exceeding 85%.
The first periods of F_fixed and D_Fixed were 1.463 and 0.915 s, respectively. The isolated structures, FIS and DIS, where the HDRBs were installed at the base, had periods of 3.453 and 3.164 s, respectively, and the DIIS model, where the HDRBs were installed at the inter-story level, had a period of 2.770 s. The periods of the modal analysis for the first three modes are presented in Table 4. The variation in the periods between the isolated and non-isolated structures results from the additional flexibility provided by base isolation. Base isolation systems enhance the building’s period by introducing flexible bearings that alter the natural frequency, moving it away from the dominant frequencies of the seismic forces. This reduces seismic forces, improves building stability, and minimizes earthquake damage, highlighting the effectiveness of base isolation in enhancing seismic performance and protecting the structures.

3.4. Ground Motion Selection and Scaling

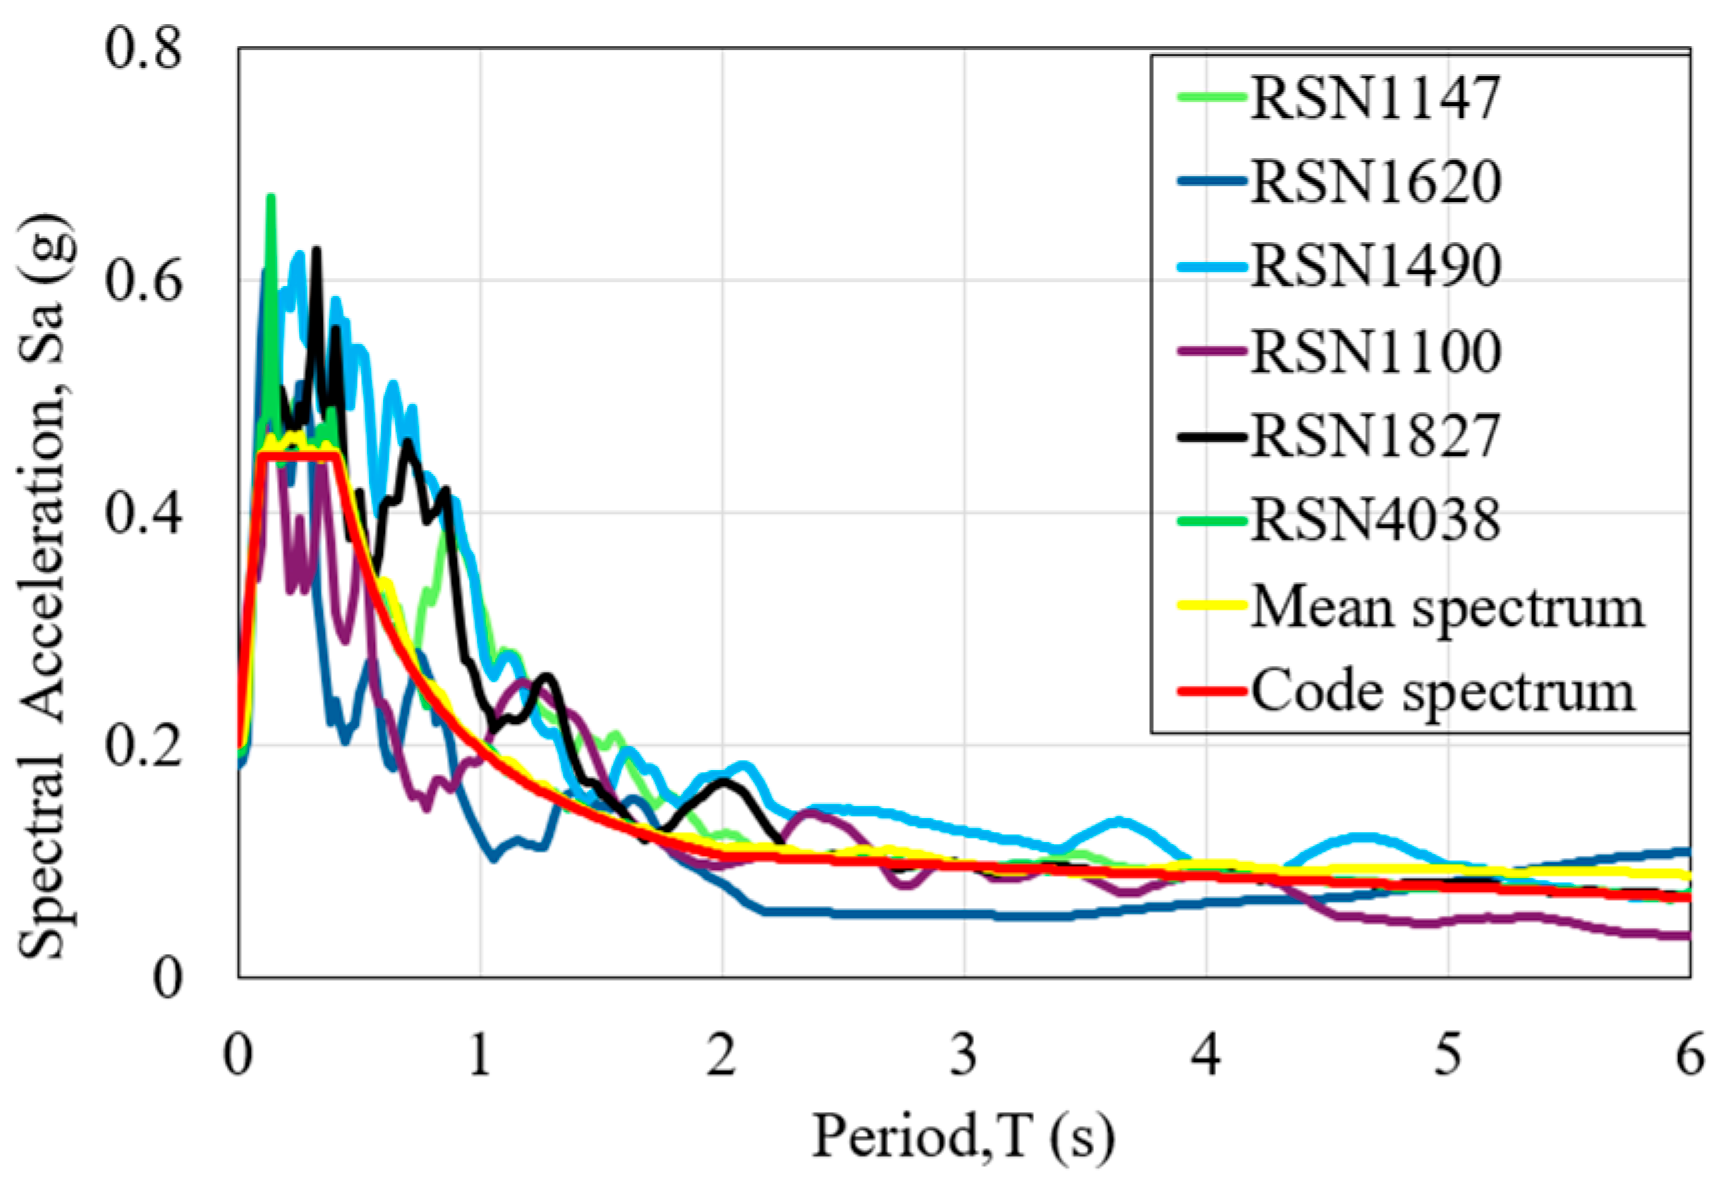
To ensure the representativeness and applicability of the non-linear time-history analysis (NTHA) results, six pairs of natural earthquake records were selected from the Pacific Earthquake Engineering Research Center (PEER) ground motion database. The selection process was rigorously based on site-specific seismic hazard characteristics for the building site in Kunming, China, in accordance with Chinese code GB 50011 [47]. Table 5 lists the natural records, including their record sequence numbers (RSNs), earthquake names, magnitudes, and Vs30 values (shear wave velocity of the soil layer at a depth of 30 m). Figure 6 illustrates the response spectra for these natural records (RSN1147, RSN1620, RSN1496, RSN1100, RSN1827, and RSN4038), along with the mean and designed spectra for each record. Additionally, the frequency content of the selected ground motions was considered in the analysis, with ground motion frequencies ranging from 0 to 100 Hz. This frequency range is important for comparison with the structural frequencies of the models because the seismic response of the structure can be significantly influenced by the interaction between the ground motion frequencies and the natural frequencies of the building.
The seismic responses of the structures were analyzed under these seismic waves and applied bidirectionally in the X- and Y-directions, with varying peak ground accelerations (PGAs). For the initial non-linear time-history analyses, the PGAs were set to 0.2 g, corresponding to major earthquakes with a seismic fortification intensity of eight. To evaluate the influence of HDRBs on the seismic responses of the isolation system and superstructure under severe earthquakes, the PGAs of RSN1147 were scaled to 0.4, 0.6, and 0.8 g.

4. Results and Discussion

4.1. Hysteresis and Energy Dissipation of the Bearings

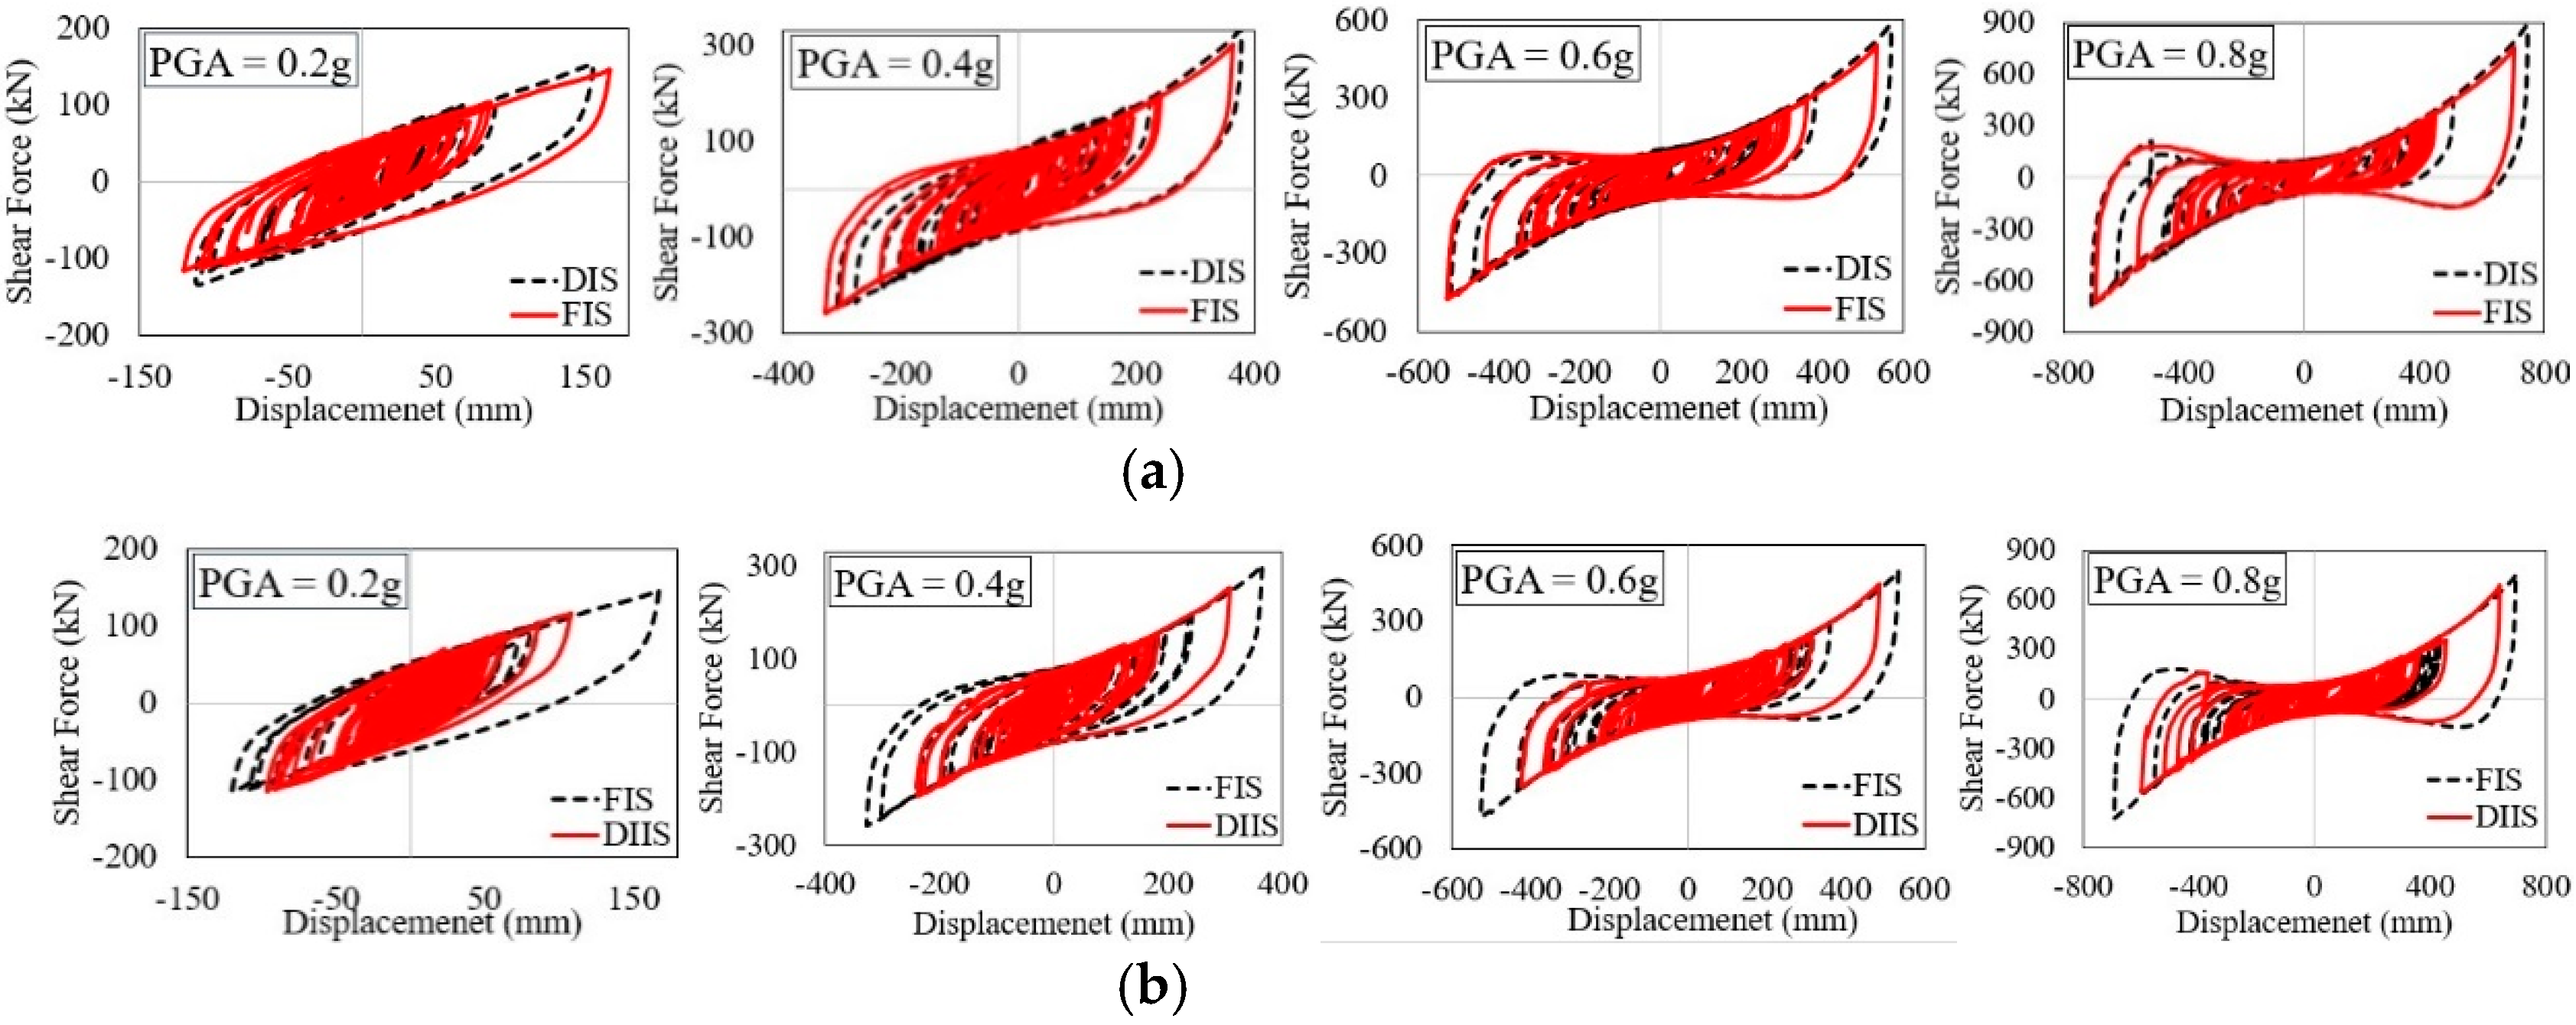
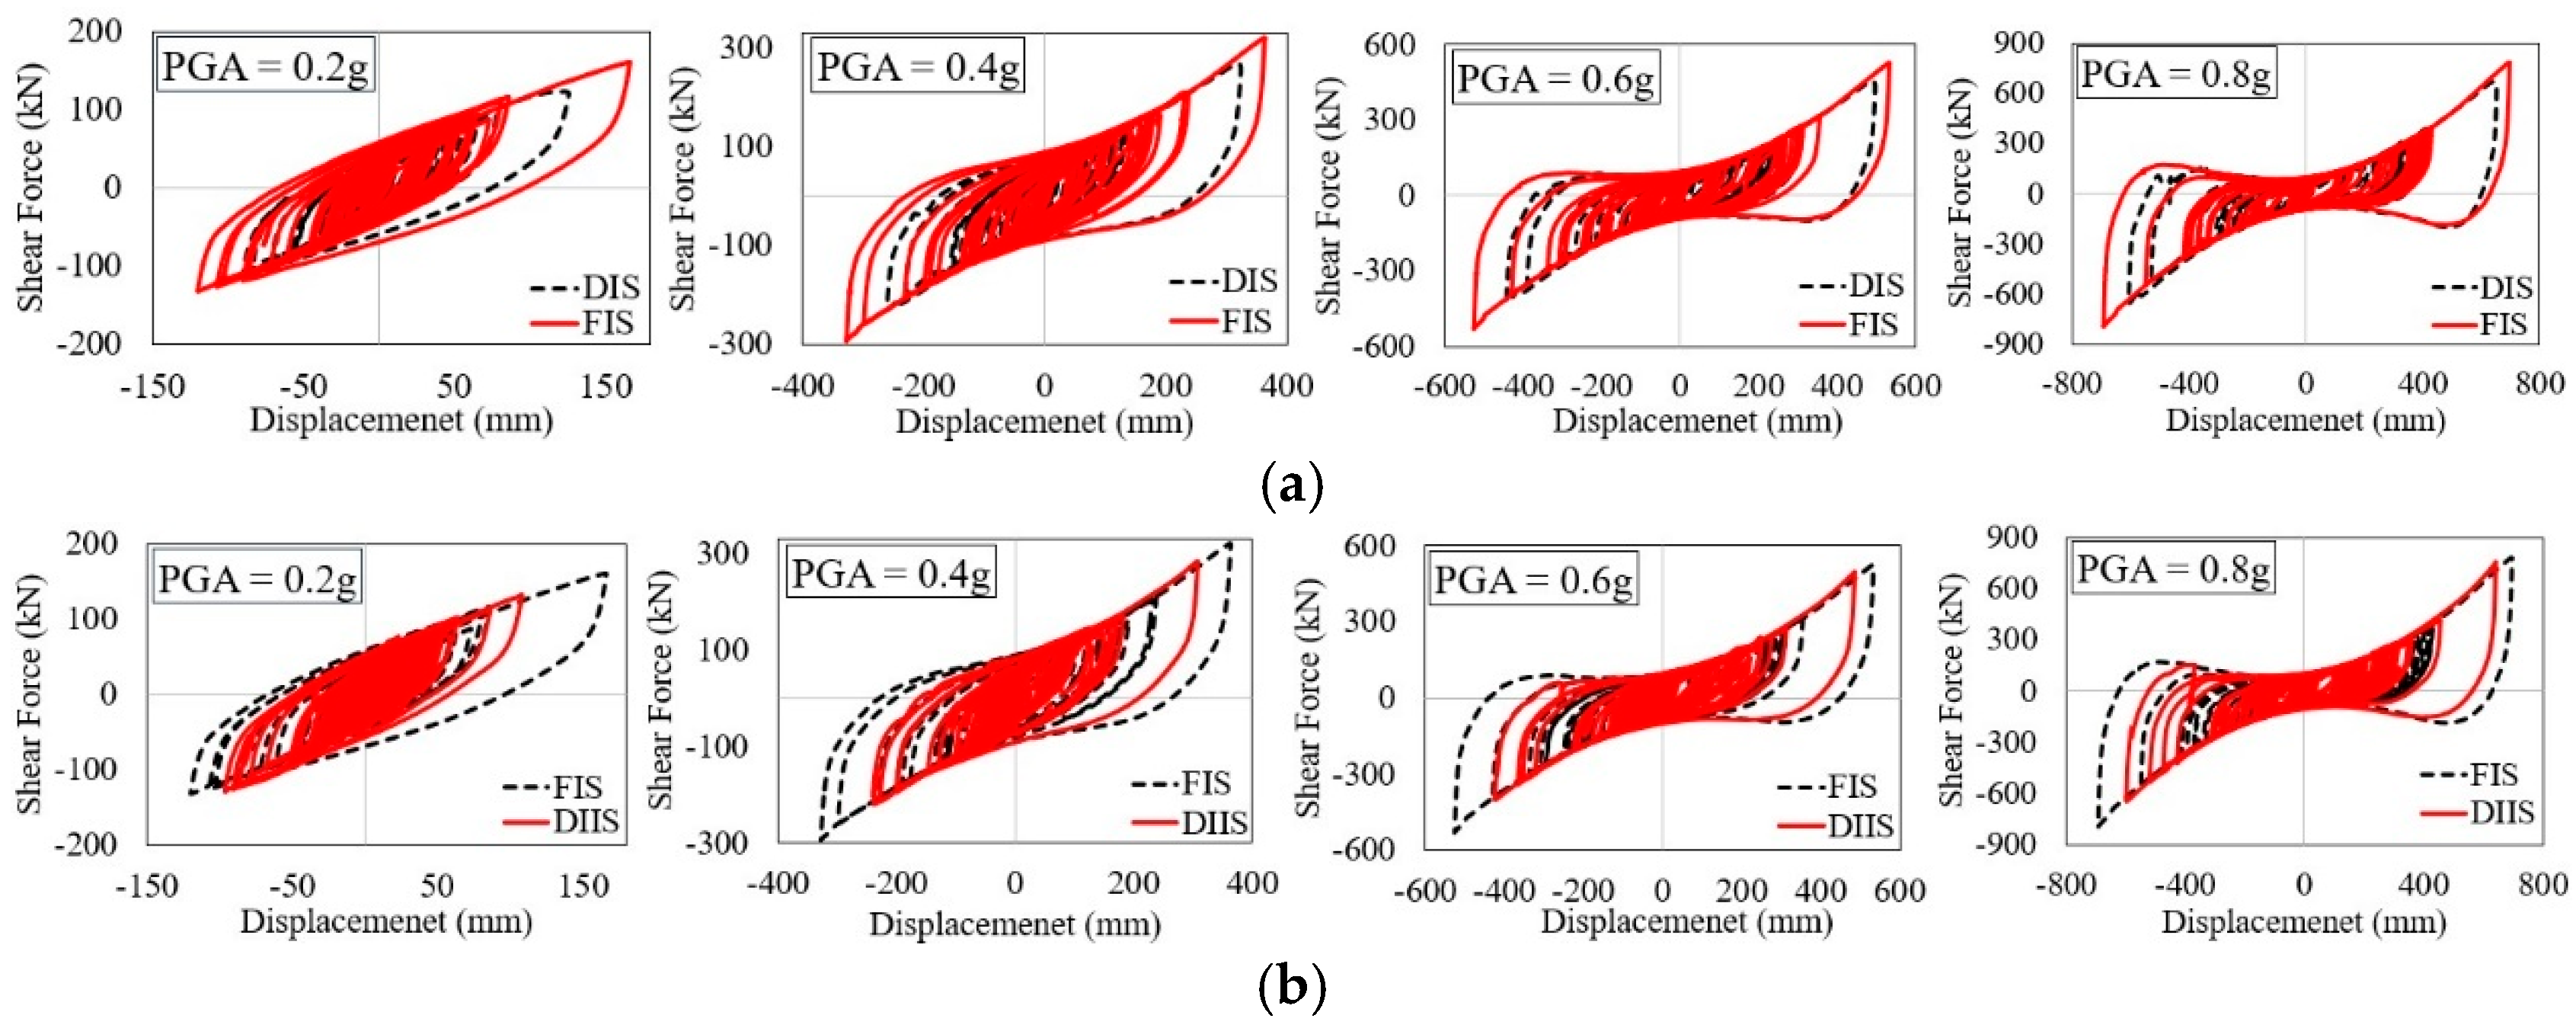
The hysteresis response of HDRBs in a structure is critical for evaluating their energy dissipation and damping characteristics during earthquake loadings. These characteristics are vital for assessing the seismic performance and resilience of isolated systems. Bearing Nos. 1, 2, and 3 (shown in Figure 5) were selected for a detailed analysis. The HDRBs exhibited stable hysteresis loops, indicating effective energy absorption and stiffness hardening. According to the code requirements, the horizontal displacement of the isolators during major earthquakes must not exceed 0.55 times the effective diameter or three times the total rubber thickness [52].
Figure 7, Figure 8 and Figure 9 illustrate the hysteresis behaviors of the three types of bearings (corner, edge, and center) under varying earthquake intensities. At a PGA of 0.2 g, the HDRBs exhibited narrow hysteresis loops with smaller enclosed areas. As the PGA content increased to 0.4 g, the hysteresis loops widened, and the enclosed area increased, signifying higher energy dissipation and greater deformation. The loops expanded further at higher PGAs of 0.6 and 0.8 g, indicating substantial energy dissipation and increased non-linearity.
For Bearing No. 1, the DIS model indicated that the displacement and shear increased from 174 mm and 108 kN at 0.2 g to 796 mm and 605 kN at 0.8 g, respectively. This exceeded the allowable limits at higher PGAs, posing a risk of bearing breakage. The FIS model showed similar values, suggesting effective energy dissipation but potential risks at high intensities, as shown in Figure 7a,b. In the DIS model, Bearing No. 2 showed displacement and shear increasing from 158 mm and 139.2 kN at 0.2 g to 737 mm and 876.6 kN at 0.8 g, respectively. These values exceeded the limits at higher PGAs. In the FIS model, the values were generally 5–10% lower, indicating a slightly better performance under similar conditions than the DIS model. This is illustrated in Figure 8a,b. For Bearing No. 3, the DIS model showed an increase in the displacement and shear. Specifically, it indicated an escalation from 125 mm and 138 kN at 0.2 g to 622.7 mm and 674.4 kN at 0.8 g, which exceeded the established limits at higher PGAs. In contrast, the FIS model demonstrated slightly higher values (5–10%), indicating effective energy dissipation in the FIS model. However, it also suggested a potential risk at higher intensities, as shown in Figure 9a,b.
HDRBs effectively dissipated energy and maintained structural integrity under varying seismic intensities, with performance variations observed between the DIS and FIS models, particularly for higher PGAs.
Seismic isolation devices significantly absorb and dissipate earthquake energy, reducing the forces transmitted to buildings and resulting in lower deformation and damage. In contrast, non-isolated buildings absorb earthquake energy through their structures, leading to higher stress, greater deformation, and an increased potential for damage compared to isolated buildings.
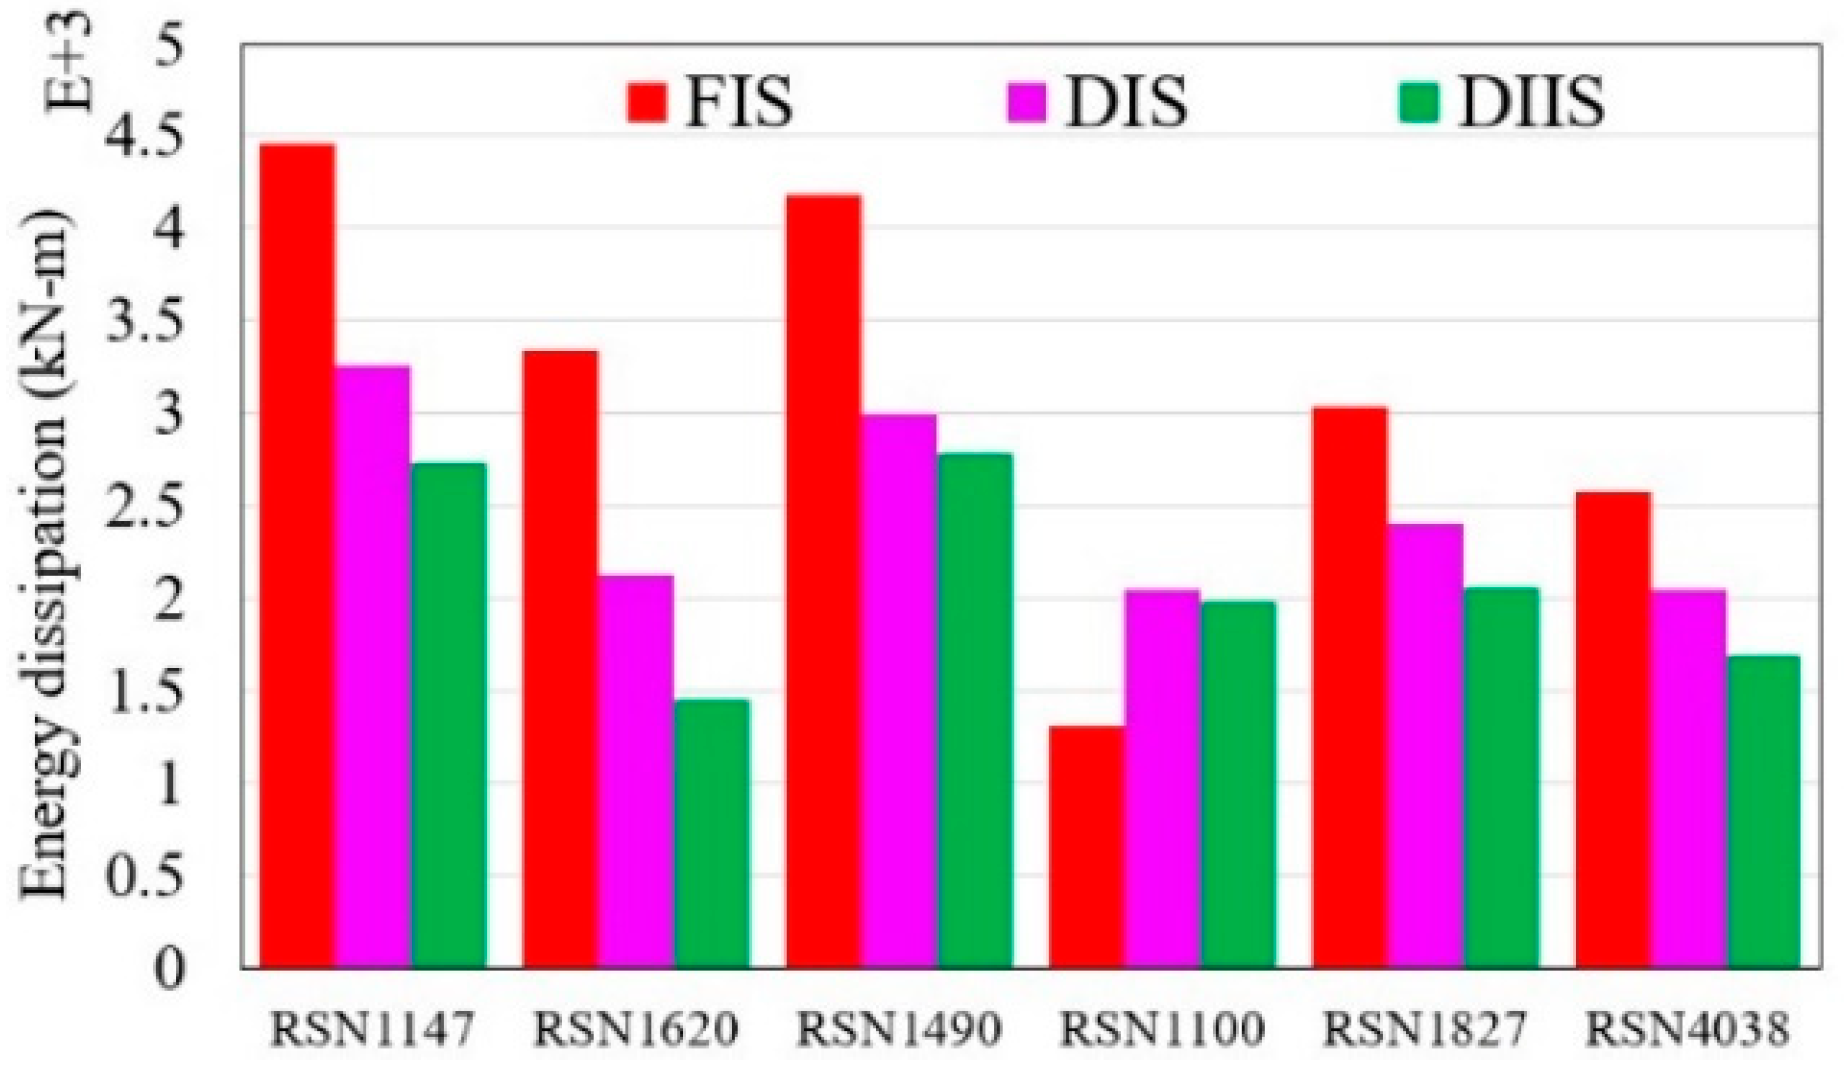
The non-linear time-history analysis of the isolated structure revealed the energy dissipation of the HDRBs, as shown in Figure 10. The energy dissipation curves show that as the earthquake intensity increases, the bearings experience larger displacements, resulting in wider loops and greater energy dissipation. A comparative analysis of the FIS, DIS, and DIIS models demonstrated that the FIS model dissipated 20% and 40% more energy than the DIS and DIIS models, respectively, underscoring the effectiveness of base-isolated bearings on flat terrain. The DIS model exhibited 25% higher energy dissipation across various earthquake intensities, indicating the comparable efficiency of the bearings. According to the data presented in Figure 11, the evaluation of energy dissipation using six distinct earthquake records revealed that the FIS model exhibited higher energy dissipation in five of the six earthquakes, except for RSN1100. This analysis underscores the diverse impact of seismic isolation strategies on energy absorption during seismic events.

4.2. Peak Acceleration of the Superstructures

Base isolation techniques effectively absorb and dissipate seismic energy, thereby mitigating the acceleration transmitted to structures during seismic events. As illustrated in Figure 12a,b, five numerical models were evaluated to demonstrate the maximum roof acceleration during an earthquake with an intensity of 0.2 g, as recorded in the earthquake record RSN1147. The FIS model showed a considerable reduction in maximum roof acceleration, which was nearly 90% lower than that of the fixed-base structures. Similarly, the DIS and DIIS models demonstrated a slight decrease in acceleration, reducing the maximum roof acceleration by 80% compared with that of the non-isolated structures. This highlights the substantial impact of implementing base-isolation devices at the base or inter-story level on the roof acceleration response of the structure.
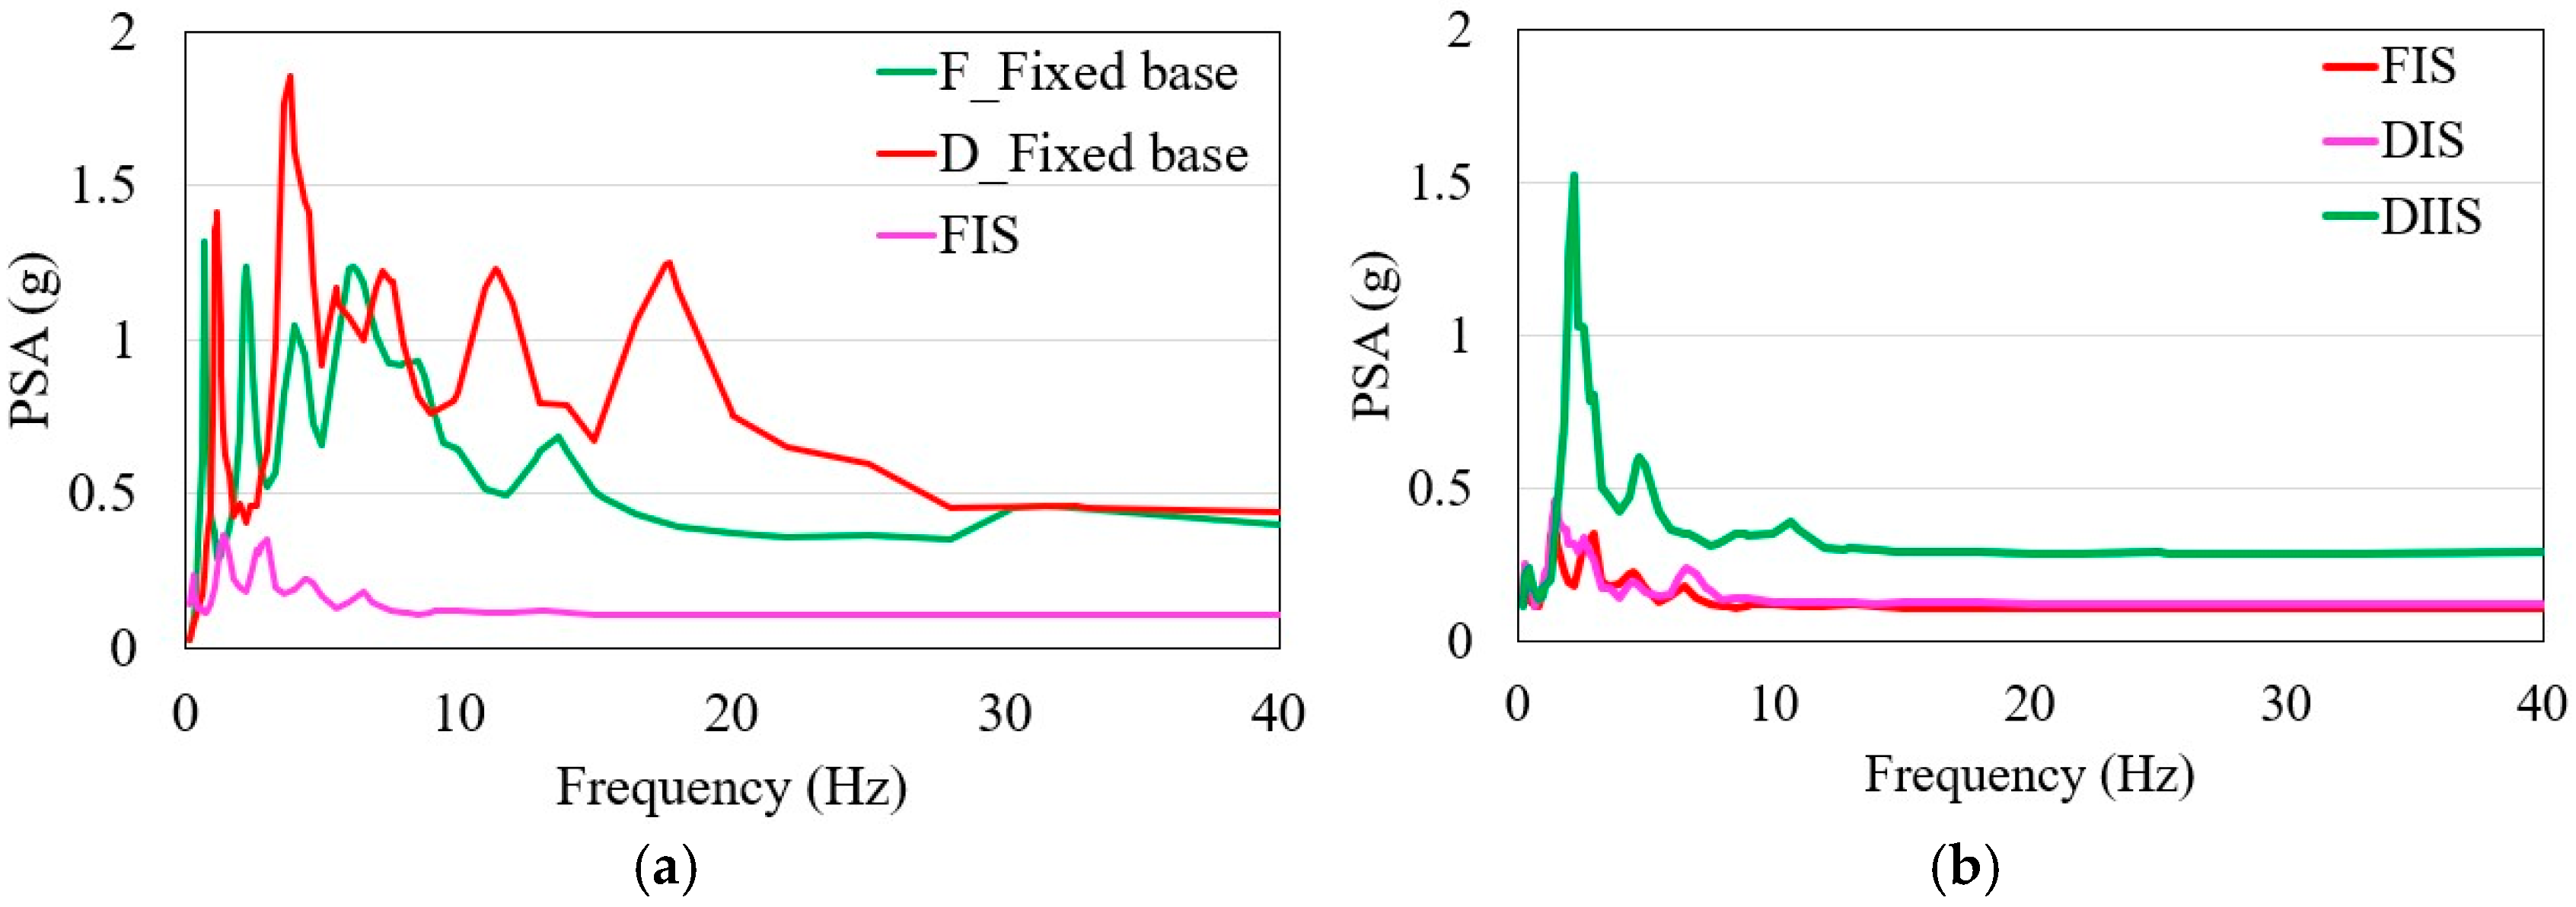
Figure 13a,b present the pseudo-spectral acceleration (PSA) of the five numerical models and the corresponding structural frequencies during earthquake RSN1147. The non-isolated structure exhibited significantly higher PSA values, particularly at lower frequencies of approximately 1–20 Hz, suggesting increased acceleration and potential resonance with the seismic waves. Conversely, the isolated structures (FIS and DIS) demonstrated markedly lower PSA values across all frequencies. The peaks were notably reduced, highlighting the effectiveness of seismic isolation in minimizing the acceleration responses. However, the DIIS exhibited high PSA levels between frequencies of 2 and 4 Hz, which decreased significantly at higher frequencies, as depicted in Figure 13b. Figure 14a,b show the absolute maximum roof acceleration for the six earthquake ground motions. The isolated structures significantly reduced roof acceleration when base isolation was installed at the base or inter-story level. The non-isolated split-foundation structure exhibited the highest maximum roof acceleration compared with the non-isolated flat structures, highlighting the vulnerability of hillside structures to seismic activity.

4.3. Maximum Inter-Story Drift

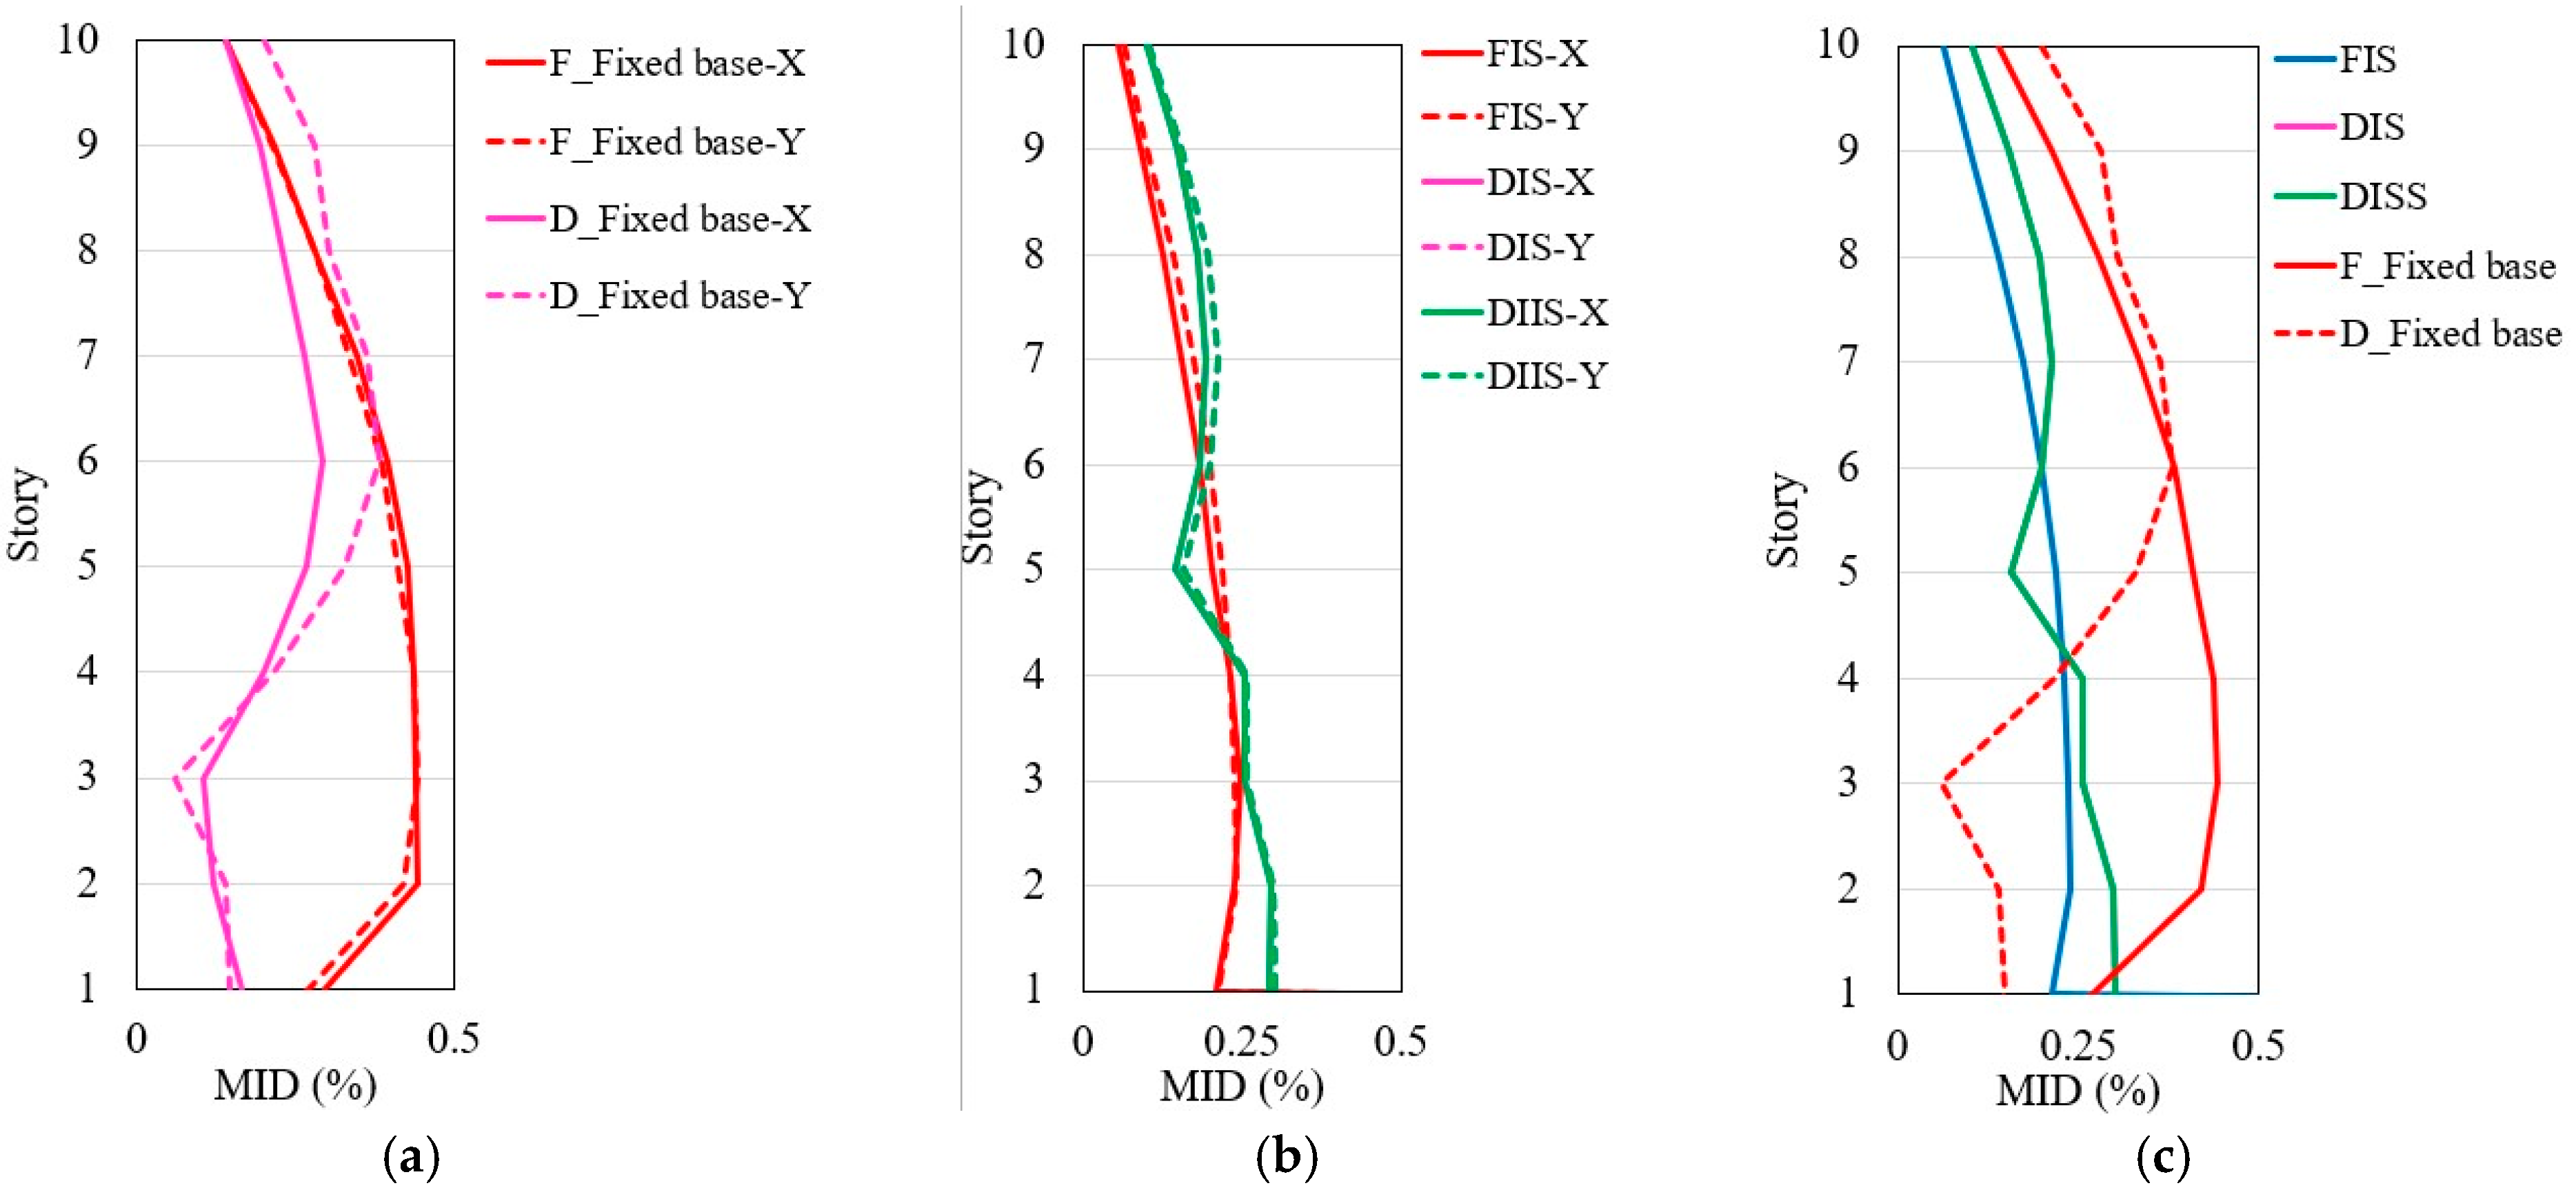
Analyzing structural drift is essential in earthquake engineering to ensure that buildings can withstand the seismic forces. High inter-story drift can lead to severe damage and instability. Figure 15a–c compare the maximum inter-story drift (MID) of the five numerical models under the earthquake record RSN1147. Figure 15a shows that the non-isolated flat and split-foundation structures reached a serviceability limit of 0.5% of the story height [52], indicating higher vulnerability. Specifically, the flat structure exhibited higher drift in the lower stories, whereas the split-foundation structure exhibited higher drift in the upper stories. Figure 15b shows the maximum inter-story drift for the isolated structures, which is an 80% reduction compared to that of the non-isolated structures depicted in Figure 15c. This reduction demonstrates the effectiveness of base and inter-story isolation in mitigating seismic impacts, including reducing inter-story drift and minimizing damage to structural components. By significantly decreasing inter-story drift, base isolation enhances the overall stability and performance of structures during earthquakes, ensuring greater occupant safety, reducing the risk of structural failure, and improving the building’s resilience to future seismic events.
Figure 15. Maximum inter-story drift comparison during earthquake RSN1147 (a) non-isolated structures in (X,Y), (b) isolated structures in X,Y (c) isolated structures with non-isolated structures. Figure 16a,b display the MID of the five structures subjected to the six ground motions. Structures with base isolation exhibited significantly lower MID, maintaining values below 0.12%. In contrast, non-isolated structures, particularly those with split foundations, showed the highest MID, exceeding 0.5%. This stark difference underscores the efficacy of base isolation in reducing seismic-induced drift, thereby enhancing structural resilience and satisfying serviceability state limits.
Infrastructures 10 00239 g015
Figure 16. Maximum inter-story drift comparison under six earthquake ground motions (a) isolated with non-isolated structures), (b) base with inter-story isolated structures.
Infrastructures 10 00239 g016

4.4. Maximum Story Displacement

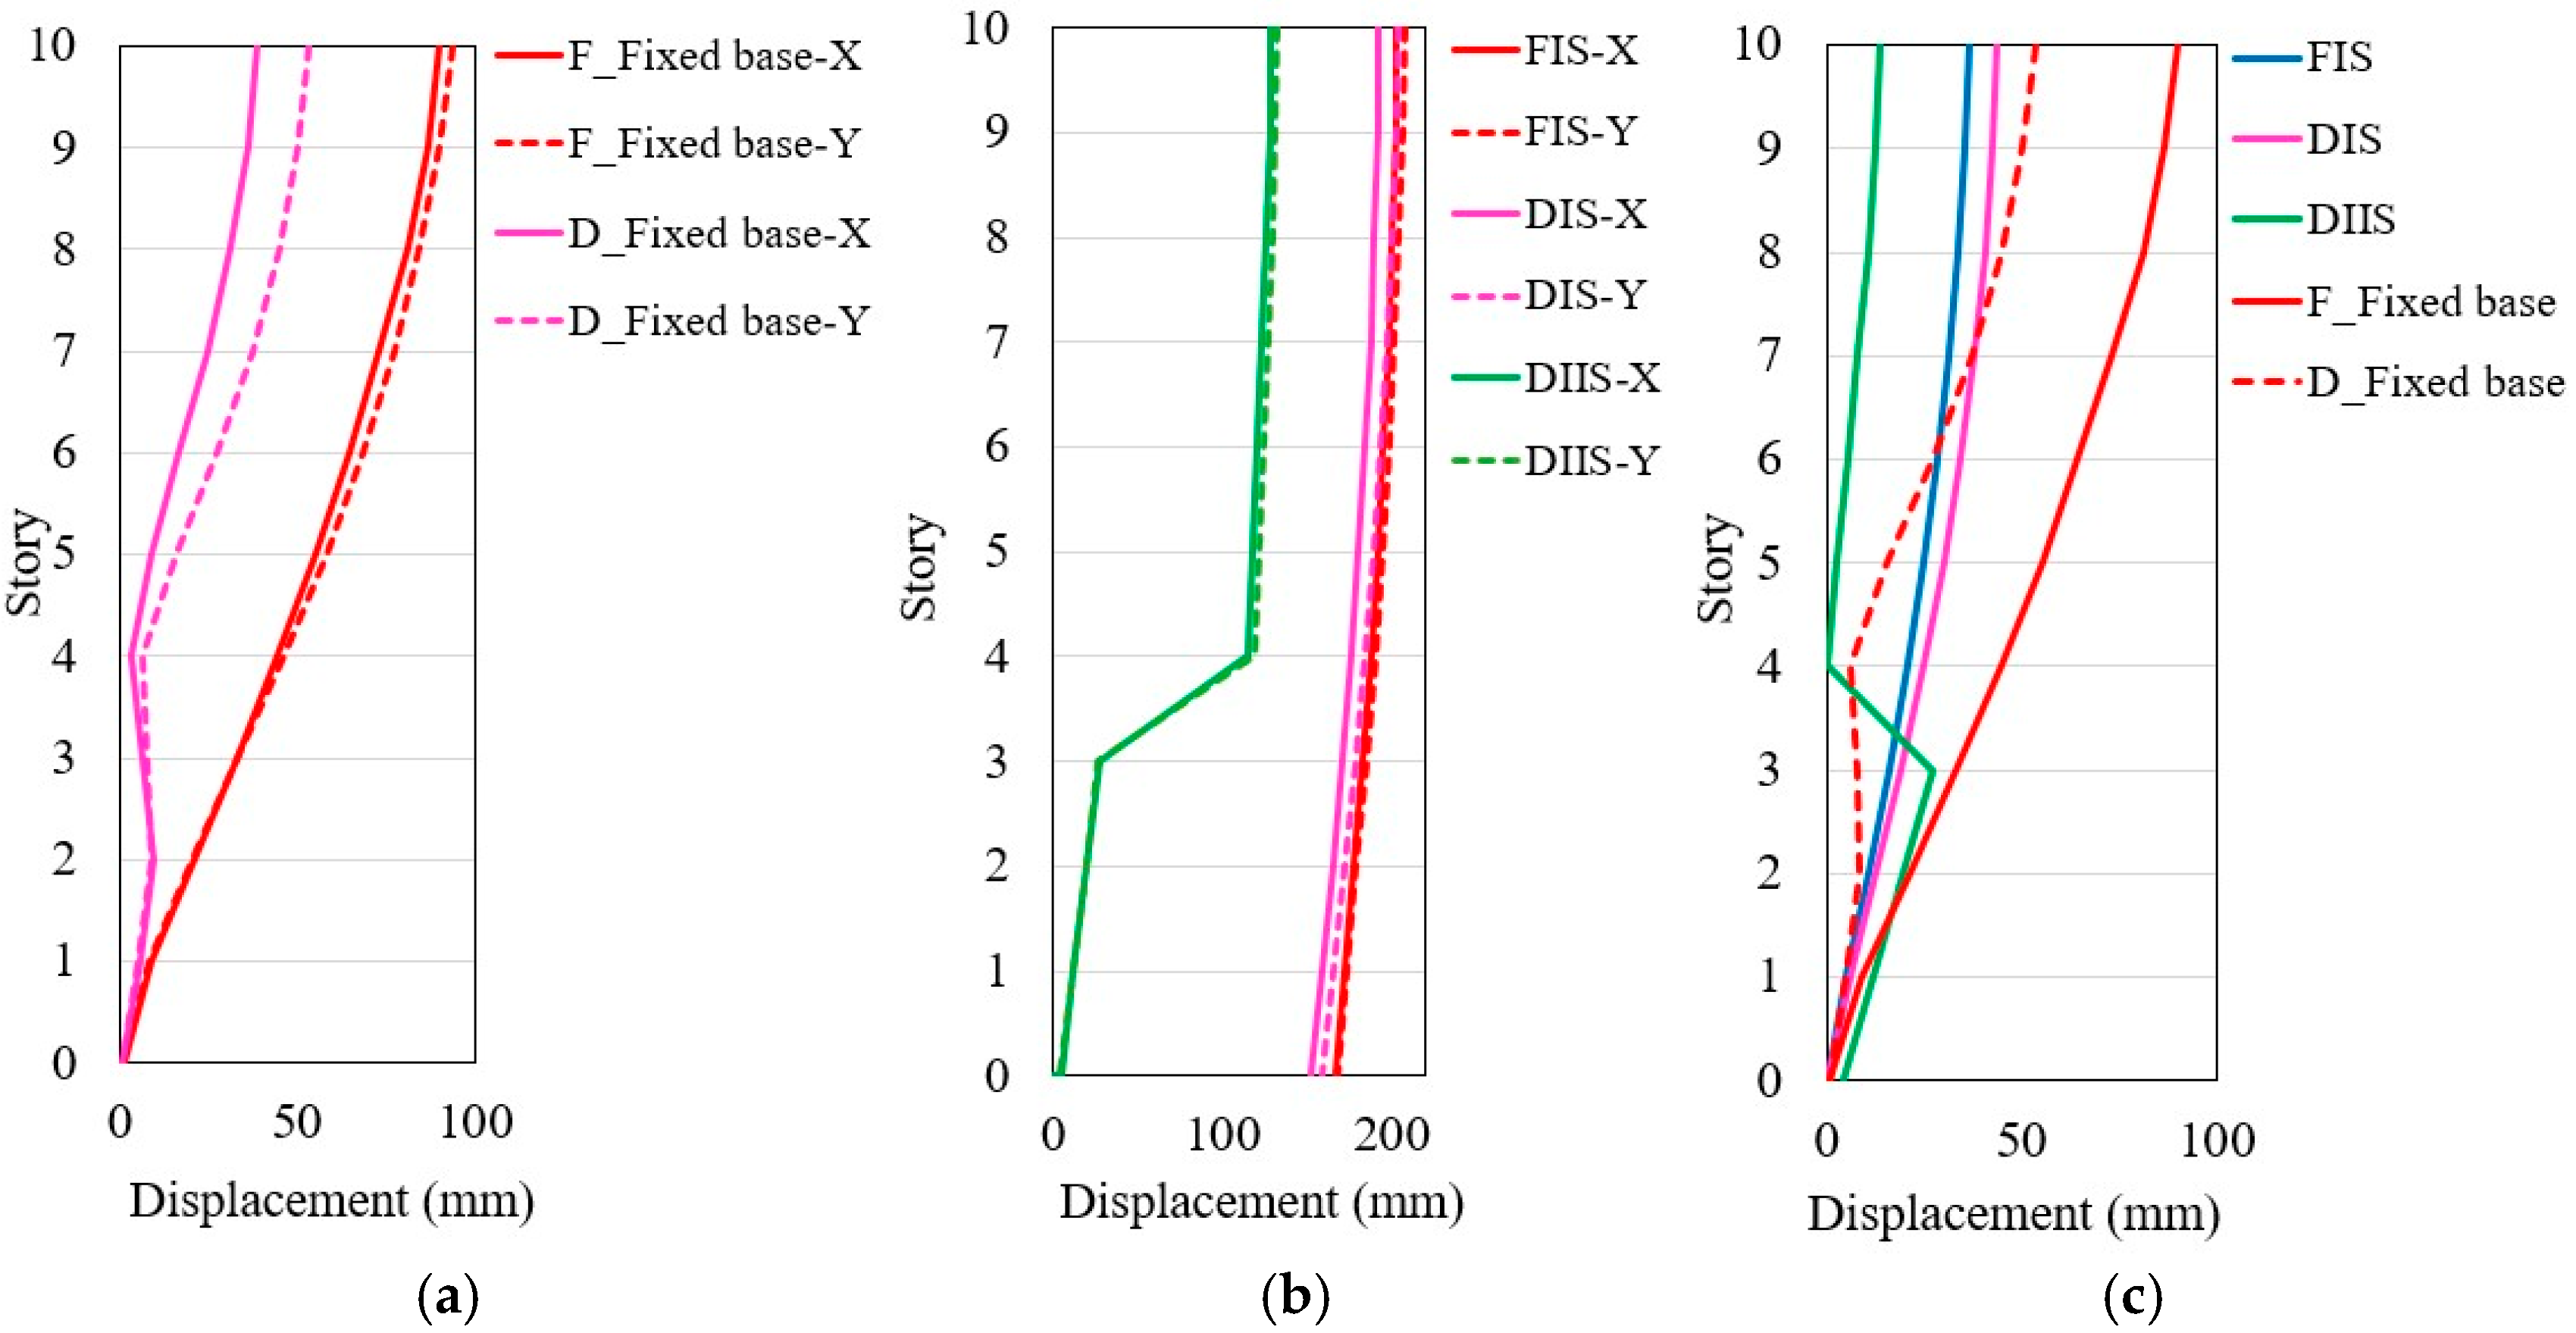
Figure 17a–c depict the maximum story displacement of the five non-isolated and isolated structure models during the RSN1147 earthquake event. The non-isolated flat structure exhibited the highest displacement at the roof, measuring approximately 90.2 mm in the X-direction and 93.8 mm in the Y-direction. In contrast, the split-foundation non-isolated structure exhibited displacements of 38.9 mm and 53.6 mm in the X- and Y-directions, respectively. The isolated structures demonstrated the lowest story displacements, decreasing by 80–90% at the roof.
Figure 18a,b show the maximum roof displacement of the structures under the six earthquake ground motions. The non-isolated flat building exhibited the highest roof displacement across all six earthquakes, particularly for RSN1620, which reached 155.2 mm. Additionally, the split-foundation building exhibited the highest displacement under the earthquake ground motion RSN1827, with a displacement of 147.4 mm. In contrast, the corresponding isolated structures significantly reduced roof displacement under the same earthquake ground motions by 90–100%, highlighting the effectiveness of base isolation in mitigating seismic impacts.

4.5. Story Shear Force

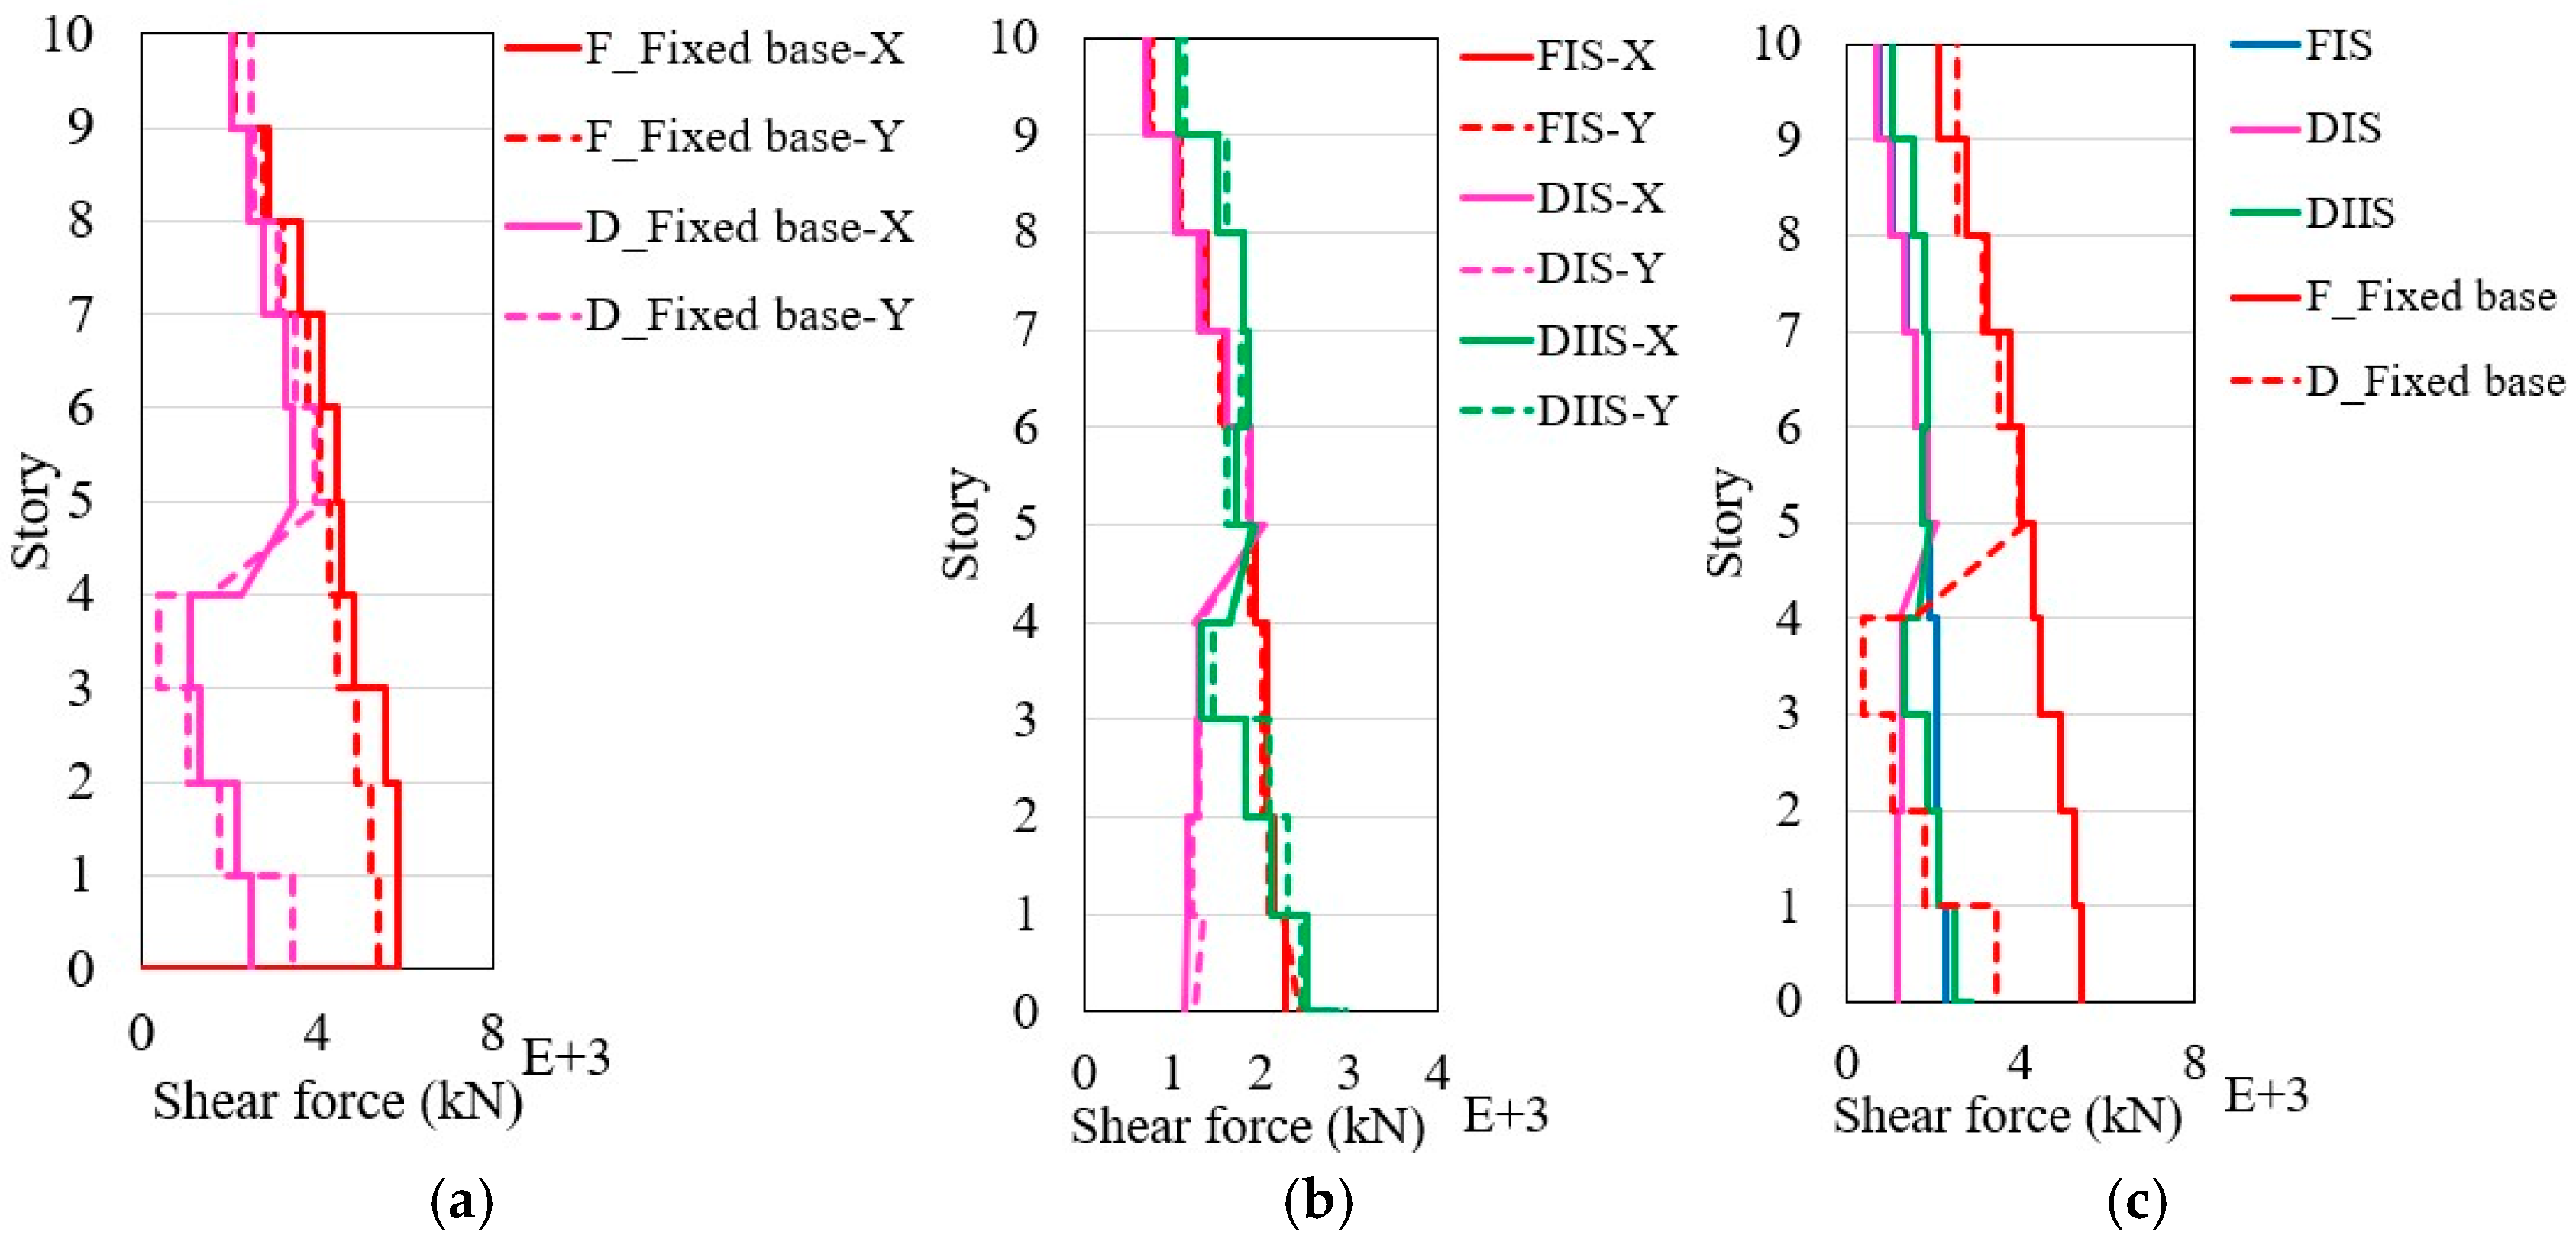
Figure 19a,b illustrate the shear force distribution along the X- and Y-directions of the FIS, DIS, and DIIS and the respective non-isolated structures under the earthquake ground motion RSN1147. In non-isolated structures with split-foundation areas, the shear force is lowest at the base, increases significantly in the split-foundation areas, and then decreases further upward, as shown in Figure 19a. Specifically, in Story 4, the split-foundation area experienced the highest shear force, approximately 4153 kN, indicating a higher seismic demand. In contrast, flat non-isolated structures exhibited higher shear forces at the base, approximately 5857.9 kN, which decreased in the upper stories. Meanwhile, the isolated structures exhibited lower story shear forces, with a reduction of 90–100% in the FIS and DIS structures. This highlights the effectiveness of base isolation in mitigating shear forces and enhancing the seismic performance of the structures.

4.6. Overturning Moment

Buildings located on hillsides are particularly vulnerable to seismic forces, making it essential to assess the shear forces and overturning moments to ensure stability and safety. Inadequately addressed overturning moments, rotational forces, and lateral shear forces can cause tipping and structural failure. Figure 20a,b illustrate the distribution of overturning moments across the stories of the FIS, DIS, and DIIS and the corresponding non-isolated structures under earthquake record RSN1147. The non-isolated structures depicted in Figure 20a exhibited the highest overturning moments, which were comparable in both the X- and Y-directions. For instance, both the flat and split-foundation structure models demonstrated approximate values of 1.02 × 10⁵ kN.m and 1.025 × 10⁵ kN.m, respectively, signifying heightened susceptibility without isolation measures.
In Figure 20b, the FIS, DIS, and DIS models demonstrated a significant reduction in the overturning moments in both directions, indicating the effective mitigation of overturning forces through isolation. Specifically, the peak overturning moment was approximately 0.93 × 10⁵ kN.m in the Y-direction and 0.94 × 10⁵ kN.m in the X-direction at the base of the FIS but was even lower than that in the DIS and DIIS models. A comparison of the overturning moments of the four models is shown in Figure 20c. The analysis consistently showed that non-isolated structures exhibited the highest shear forces and overturning moments, indicating a greater susceptibility to seismic forces. In contrast, the isolated structures demonstrated lower overturning moments.

4.7. Base Shear Force

Base shear refers to the total horizontal force applied at the base of a building during seismic events, and it must be effectively managed to prevent structural failure. Fixed-base structures often face challenges in handling seismic forces, thereby increasing their potential for damage occurrence. Base isolation is the most effective method for minimizing and managing the base shear of a building.
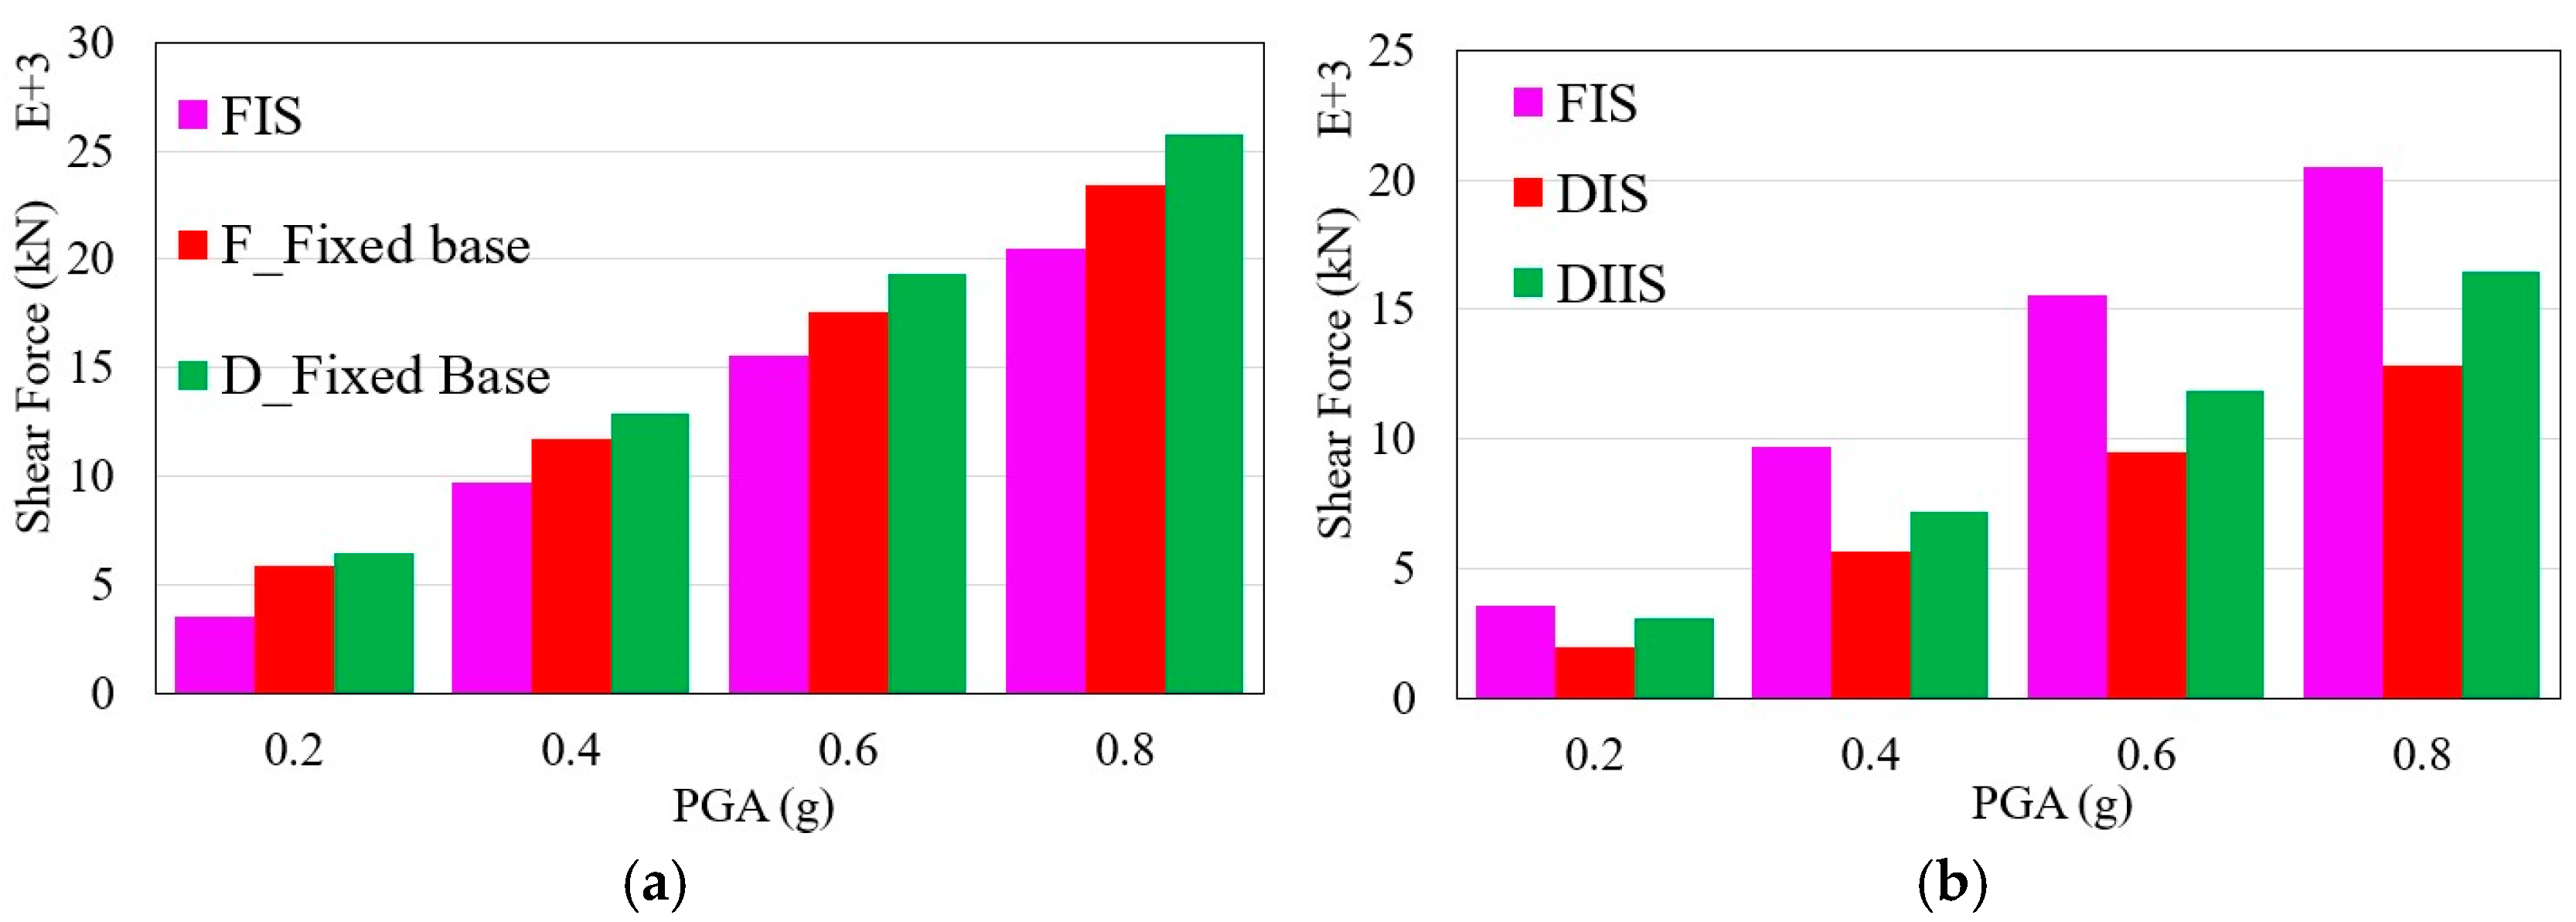
In this study, the base shear responses of both non-isolated and isolated structures were examined under earthquake RSN1147 with varying earthquake intensities, as illustrated in Figure 21. It was observed that as the earthquake intensity increased, the base shear in the fixed-base structure also increased. For instance, in the F_Fixed base model, the base shear escalated from 5856.7 to 23,427.2 kN when the intensity increased from 0.2 to 0.8 g. In the non-isolated D_Fixed base model, the base shear forces were more pronounced. Specifically, under a 0.2 g intensity, the base shear was 6444.8 kN, and when the intensity was elevated to 0.8 g, the shear force increased significantly to 25,779.4 kN, which was 10% higher than the base shear force of the F_Fixed base model, as depicted in Figure 21a.
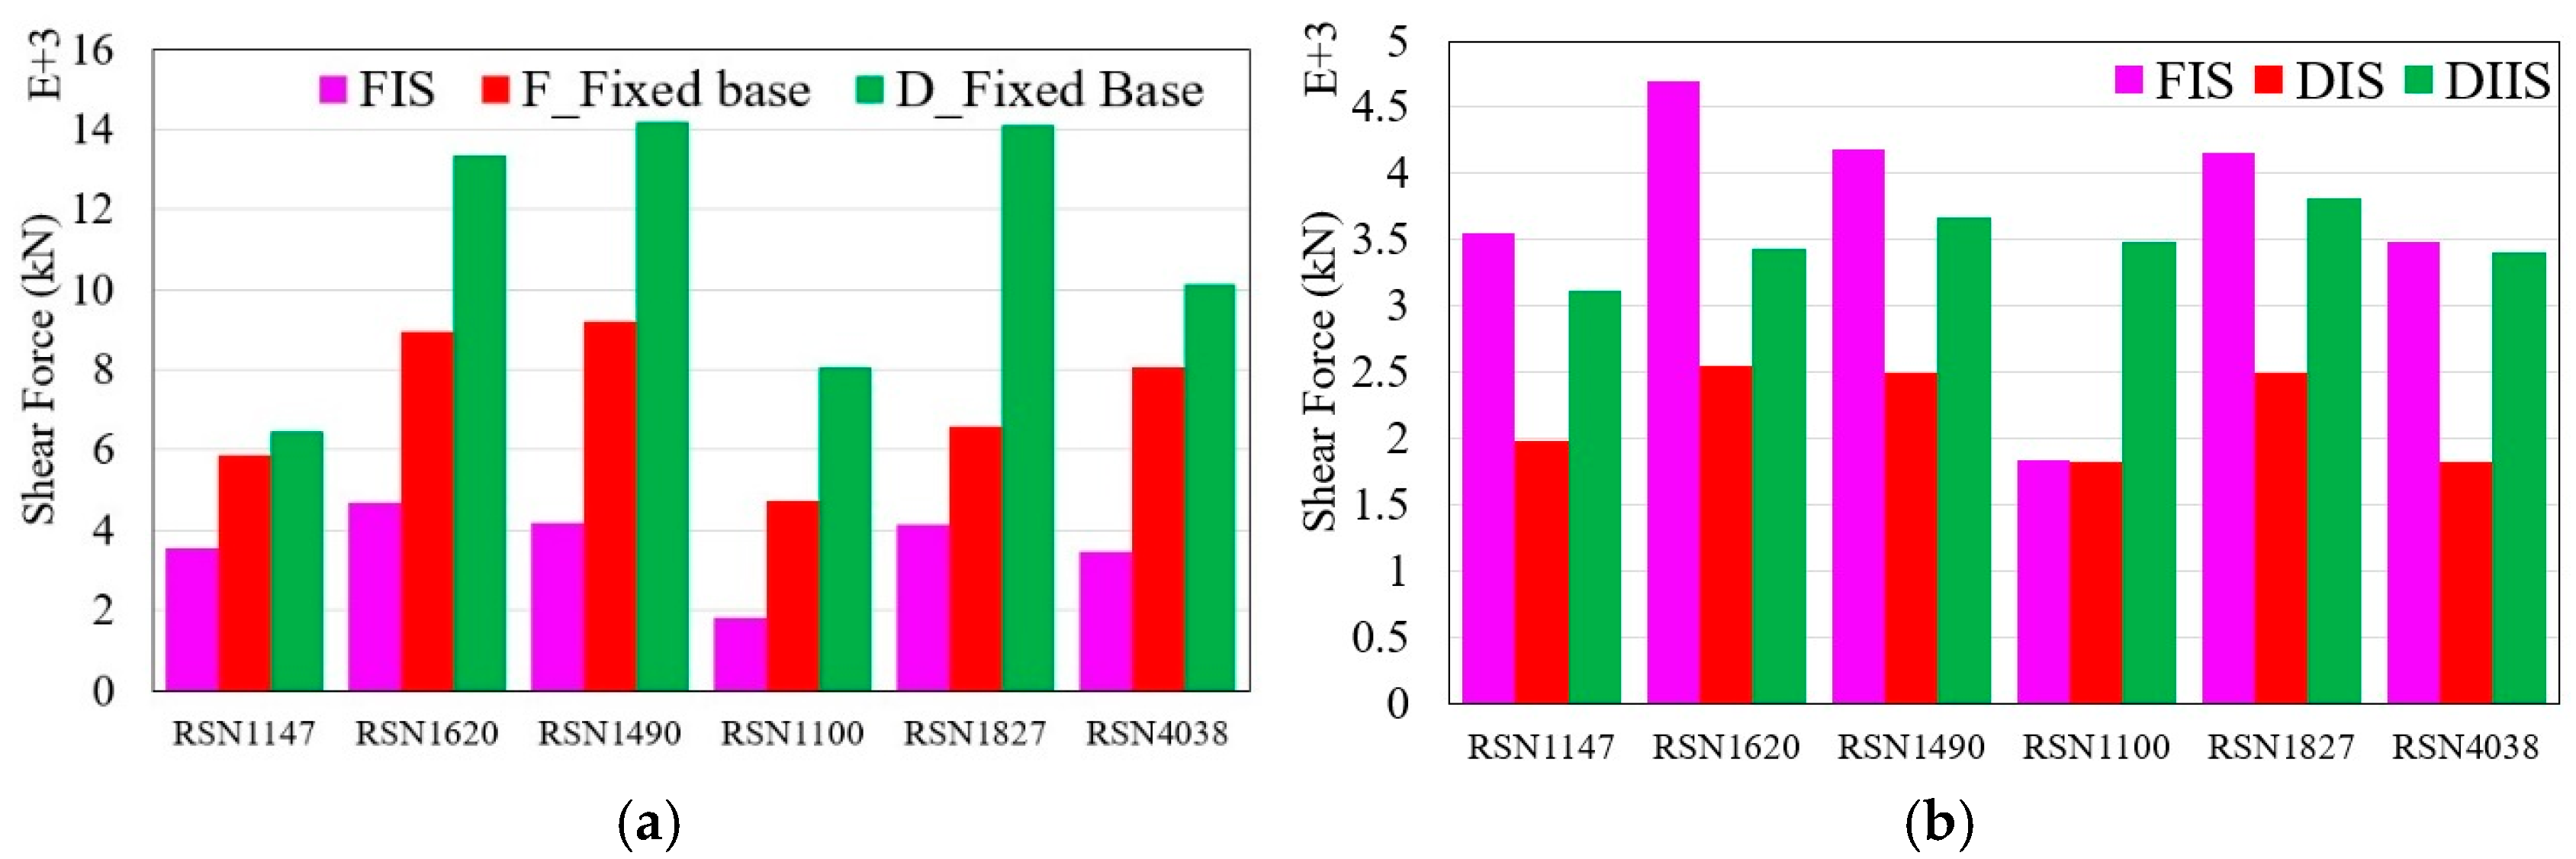
Conversely, the isolated DIS and DIIS models demonstrated substantial reductions in base shear, with decreases of 70% and 55%, respectively, compared with the non-isolated structure (Figure 21b). The base shear of the five models is presented in Figure 22a,b for the six ground motion records. The DIS model exhibited the lowest base shear, whereas the DIIS model exhibited a slightly higher base shear. The FIS model exhibited a higher base shear than the split-foundation isolated structures. Overall, the base isolation and inter-story isolation techniques were highly effective for both flat and split-foundation structures.

5. Conclusions

This study examined the seismic performance of five numerical models, including isolated FIS, DIS, and DIIS, and the corresponding fixed-base (F_fixed base and D_Fixed base) structures using HDRB with DHI modeling techniques. The main conclusions drawn from this analysis are as follows.
  • The HDRBs exhibited consistent hysteresis behavior and proficient energy dissipation at different earthquake intensities. Buildings with HDRBs experienced significantly reduced story shear forces, ranging from 90% to 100% compared to non-isolated structures. This demonstrates the ability of HDRBs to absorb substantial seismic energy without permanent deformation, thereby enhancing the structural resilience of flat-plane and split-foundation structures.
  • Base isolation techniques, especially in the FIS model, led to an almost 90% decrease in the peak roof acceleration compared to fixed-base structures. The DIS and DIIS models also exhibited a considerable reduction of approximately 80%. Additionally, the DIS and DIIS models exhibited noteworthy decreases in base shear forces of 70% and 55%, respectively, compared to non-isolated split-foundation structures.
  • The isolated structures demonstrated an 80% reduction in the maximum inter-story drift compared to the non-isolated structures, underscoring the effectiveness of base and inter-story isolation in bolstering structural stability and mitigating seismic risk, particularly in hillside structures with split foundations.
  • The analysis confirmed that the selected properties of an isolation period of 2.75 s and 20% damping ratio were highly effective for this hillside structure. The 2.75 s period successfully decoupled the building from the dominant energy content of the earthquake ground motions, which was the primary mechanism behind the substantial reductions in acceleration responses (up to 90%). Concurrently, the 20% damping ratio provided optimal energy dissipation, effectively controlling bearing displacements while still mitigating force-based demands, as evidenced by the up to 78% reduction in inter-story drift and 70% reduction in base shear. The discussion explicitly analyzed the interplay between period lengthening and damping, highlighting how these specific parameters are central to the enhanced seismic resilience demonstrated in the results.
  • Base isolation effectively reduced the overturning moments in both the X- and Y-directions, showing values that were much lower than those of the non-isolated models. This indicates enhanced stability and a reduced risk of structural failure or tipping during seismic activity.
In summary, the adoption of HDRBs and isolation techniques is highly effective in improving the seismic performance and ensuring the safety and integrity of structures subjected to seismic events. Despite the comprehensive insights gained from this numerical study, certain limitations and avenues for future research warrant further consideration. The current analysis, while employing advanced DHI modeling for HDRBs, assumes that the superstructure remains within the elastic range and does not fully account for complex soil–structure interaction effects. Future work will focus on the experimental validation of the proposed HDRB isolation systems in hillside building models to corroborate the numerical findings and provide empirical data. Additionally, incorporating more sophisticated modeling of non-linear superstructure behavior and detailed soil–structure interaction, particularly for varying soil conditions and slopes, will enhance simulation fidelity. A comprehensive cost–benefit analysis will also be conducted to evaluate the economic feasibility and long-term advantages of implementing these seismic isolation techniques in hillside construction.

Author Contributions

Conceptualization, A.G.W.; methodology, software, validation, writing—original draft preparation, Z.T.; writing—review and editing, supervision, T.H.; project administration, writing—review and editing, H.L.; funding acquisition, writing—review and editing, A.Y.R.; writing—review and editing, Y.L. All authors have read and agreed to the published version of the manuscript.

Funding

The authors would like to express their heartfelt gratitude and appreciation to the key project of China’s Ministry of Science and Technology (Grant No. 2017YFC070603) and the Key Research and Development programs (Key R&D programs) of the Department of Science and Technology of Yunnan Province (Grant No. 202003AC100001) for funding, support, and resources for this study.

Data Availability Statement

The data used to support the findings of this study are included in this article.

Conflicts of Interest

The authors disclose no potential conflicts related to this study, authorship, or publication.

References

  1. Bahuguna, A.; Firoj, M. Numerical simulation of seismic response of Slope–Foundation–Structure interaction for mid–rise RC buildings at various locations. Structures 2022, 44, 343–356. [Google Scholar] [CrossRef]
  2. Gómez, M.A.; Díaz-Segura, E.G.; Vielma, J.C. Nonlinear numerical assessment of the seismic response of hillside RC buildings. Earthq. Eng. Eng. Vib. 2021, 20, 423–440. [Google Scholar] [CrossRef]
  3. Rasa, A.Y.; Özyazıcıoğlu, M.H. Determination of the exact mode frequencies of multi-storey structures by state-space method and a comparison with mode superposition method. Chall. J. Struct. Mech. 2021, 7. [Google Scholar] [CrossRef]
  4. Athanassiadou, C.J. Seismic performance of R/C plane frames irregular in elevation. Eng. Struct. 2008, 30, 1250–1261. [Google Scholar] [CrossRef]
  5. Ning, P.; Gao, Y.; Wahab, A.G.; Zhong, T.; Bai, W.; Yang, W. Rammed earth construction for sustainable and seismic-resilient buildings: Structural advances and constraints methods. Mater. Struct. 2025, 58, 221. [Google Scholar] [CrossRef]
  6. Pinle, Z.; Wahab, A.G.; Xu, G.; Tao, Z.; Elias, S. Seismic performance of RC short-leg shear walls reinforced with HF-ECC: Experimental and numerical investigations. Structures 2025, 80, 110042. [Google Scholar] [CrossRef]
  7. Wahab, A.G.; Zhong, T.; Wei, F.; Hakimi, N.; Ahiwale, D.D. Seismic performance enhancement of RC framed structures through retrofitting and strengthening: An experimental and numerical study. Asian J. Civ. Eng. 2023, 25, 555–573. [Google Scholar] [CrossRef]
  8. Zhang, Z.; Tao, Z.; Zhang, Y.; Wu, L.; Liao, S.; Zhao, Z.; Ghafar, W.A. Molecular dynamics study on the interaction of phosphorus building gypsum /surfactant composites. J. Mol. Graph. Model. 2024, 126, 108650. [Google Scholar] [CrossRef] [PubMed]
  9. Von Winterfeldt, D.; Roselund, N.; Kitsuse, A. Framing Earthquake Retrofitting Decisions: The Case of Hillside Homes in Los Angeles; Pacific Earthquake Engineering Research Center, College of Engineering: Berkeley, CA, USA, 2000. [Google Scholar]
  10. Li, R.; Liu, L.; Li, Y.; Wang, G. Experimental Investigate on Seismic Performance of RC Hill-Side Stilted Buildings Affected by Vertical Stiffness Irregularity. J. Earthq. Eng. 2023, 28, 2273–2291. [Google Scholar] [CrossRef]
  11. Dai, B.; Tao, Z.; Wahab; Pei, Y.; Huang, R.; Yan, Z. Investigation and analysis of seismic damage to rural houses of Ninglang MS 5.5 earthquake. J. Nat. Disasters 2022, 31, 48–55. [Google Scholar] [CrossRef]
  12. Zheng, C.A.I.; Wen, P.A.N.; Qiang, Z.; Abdul, G.W.; Jing, Y. Seismic performance of an asymmetric twin-tower connected structure based on the hybrid energy dissipation technology. J. Vib. Shock 2024, 43, 288–300. [Google Scholar]
  13. Halkude, S.; Kalyanshetti, M.; Ingle, V. Seismic analysis of buildings resting on sloping ground with varying number of bays and hill slopes. Int. J. Eng. Res. Technol. 2013, 2, 3632–3640. [Google Scholar]
  14. Murthy, C. Open Ground Storey RC Frame Buildings with 230 mm Columns Unsafe During Earthquakes; National Seminar on Seismic Detailing of RCC Structures Proceedings: Kanpur, India, 2006; pp. 1–30. [Google Scholar]
  15. Ghosh, R.; Debbarma, R. Seismic Vulnerability Assessment of Soft Storeyed Structures with Plan Irregularity and Collapse Prevention. Int. J. Eng. Res. Technol. 2016, 5, 755–761. [Google Scholar]
  16. Roshan, P.; Pal, S. Structural challenges for seismic stability of buildings in hilly areas. Environ. Sci. Pollut. Res. Int. 2023, 30, 99100–99126. [Google Scholar] [CrossRef]
  17. Aggarwal, Y.; Saha, S.K. Seismic performance assessment of reinforced concrete hilly buildings with open story. Structures 2021, 34, 224–238. [Google Scholar] [CrossRef]
  18. Konakalla, R.; Chilakapati, R.D.; Raparla, H. Effect of vertical irregularity in multi-storied buildings under dynamic loads using linear static analysis. Int. J. Educ. Appl. Res. 2014, 5, 29–34. [Google Scholar]
  19. Surana, M.; Singh, Y.; Lang, D.H. Fragility analysis of hillside buildings designed for modern seismic design codes. Struct. Des. Tall Spec. Build. 2018, 27, e1500. [Google Scholar] [CrossRef]
  20. Birajdar, B.; Nalawade, S. Seismic analysis of buildings resting on sloping ground. In Proceedings of the 13th World Conference on Earthquake Engineering, Vancouver, BC, Canada, 1–6 August 2004. [Google Scholar]
  21. Raj, D.; Singh, Y.; Kaynia, A.M. Seismic fragility analysis of coupled building-slope systems. Earthq. Eng. Struct. Dyn. 2023, 53, 116–137. [Google Scholar] [CrossRef]
  22. Alhan, C.; Öncü-Davas, S. Performance limits of seismically isolated buildings under near-field earthquakes. Eng. Struct. 2016, 116, 83–94. [Google Scholar] [CrossRef]
  23. Ohsaki, M.; Miyamura, T.; Kohiyama, M.; Yamashita, T.; Yamamoto, M.; Nakamura, N. Finite-element analysis of laminated rubber bearing of building frame under seismic excitation. Earthq. Eng. Struct. Dyn. 2015, 44, 1881–1898. [Google Scholar] [CrossRef]
  24. Calvi, P.M.; Ruggiero, D.M. Numerical modelling of variable friction sliding base isolators. Bull. Earthq. Eng. 2015, 14, 549–568. [Google Scholar] [CrossRef]
  25. Pourmasoud, M.; Hajirasouliha, I.; Park, A.; Lim, J.B.P. A new approach to estimate the lead core characteristic strength of lead rubber bearings. Eng. Struct. 2022, 270, 114817. [Google Scholar] [CrossRef]
  26. Deringöl, A.H.; Güneyisi, E.M. Effect of Using High Damping Rubber Bearings for Seismic Isolation of the Buildings. Int. J. Steel Struct. 2021, 21, 1698–1722. [Google Scholar] [CrossRef]
  27. Riyadh, M.M.; Osman, S.S.; Alam, M.S. Experimental investigation of novel carbon-fiber reinforced elastomeric isolators with polyurethane cores under vertical and lateral loading. Eng. Struct. 2023, 275, 115186. [Google Scholar] [CrossRef]
  28. Rahgozar, A.; Estekanchi, H.E.; Mirfarhadi, S.A. On optimal lead rubber base-isolation design for steel moment frames using value-based seismic design approach. Soil Dyn. Earthq. Eng. 2023, 164, 107520. [Google Scholar] [CrossRef]
  29. Liu, Y.; Li, J.; Lin, G. Seismic performance of advanced three-dimensional base-isolated nuclear structures in complex-layered sites. Eng. Struct. 2023, 289, 116247. [Google Scholar] [CrossRef]
  30. Lal, K.M.; Whittaker, A.S.; Constantinou, M.C. Mid-height seismic isolation of equipment in nuclear power plants. Earthq. Eng. Struct. Dyn. 2023, 52, 998–1015. [Google Scholar] [CrossRef]
  31. Chen, P.; Wang, B.; Zhang, Z.; Li, T.; Dai, K. A generalized model of lead rubber bearing considering large strain stiffening and degradation. Eng. Struct. 2023, 275, 115264. [Google Scholar] [CrossRef]
  32. Sun, J.; Zhufu, G. Mechanical Behavior of Laminated Rubber Isolation Bearing with Buckling Steel Plate. Int. J. Steel Struct. 2022, 22, 1069–1085. [Google Scholar] [CrossRef]
  33. Mazza, F. Base-isolation of a hospital pavilion against in-plane-out-of-plane seismic collapse of masonry infills. Eng. Struct. 2021, 228, 111504. [Google Scholar] [CrossRef]
  34. Burtscher, S.L.; Dorfmann, A. Compression and shear tests of anisotropic high damping rubber bearings. Eng. Struct. 2004, 26, 1979–1991. [Google Scholar] [CrossRef]
  35. Gu, Z.; Lei, Y.; Qian, W.; Xiang, Z.; Hao, F.; Wang, Y. An Experimental Study on the Mechanical Properties of a High Damping Rubber Bearing with Low Shape Factor. Appl. Sci. 2021, 11, 59. [Google Scholar] [CrossRef]
  36. Losanno, D.; Hadad, H.A.; Serino, G. Design charts for eurocode-based design of elastomeric seismic isolation systems. Soil Dyn. Earthq. Eng. 2019, 119, 488–498. [Google Scholar] [CrossRef]
  37. Madera Sierra, I.E.; Losanno, D.; Strano, S.; Marulanda, J.; Thomson, P. Development and experimental behavior of HDR seismic isolators for low-rise residential buildings. Eng. Struct. 2019, 183, 894–906. [Google Scholar] [CrossRef]
  38. Mazza, F. In-plane–out-of-plane non-linear model of masonry infills in the seismic analysis of rc-framed buildings. Earthq. Eng. Struct. Dyn. 2019, 48, 432–453. [Google Scholar] [CrossRef]
  39. Kikuchi, M.; Aiken, I.D. An analytical hysteresis model for elastomeric seismic isolation bearings. Earthq. Eng. Struct. Dyn. 1997, 26, 215–231. [Google Scholar] [CrossRef]
  40. Yamamoto, M.; Minewaki, S.; Yoneda, H.; Higashino, M. Nonlinear behavior of high-damping rubber bearings under horizontal bidirectional loading: Full-scale tests and analytical modeling. Earthq. Eng. Struct. Dyn. 2012, 41, 1845–1860. [Google Scholar]
  41. Abe, M.; Yoshida, J.; Fujino, Y. Multiaxial behaviors of laminated rubber bearings and their modeling. I: Experimental study. J. Struct. Eng. 2004, 130, 1119–1132. [Google Scholar] [CrossRef]
  42. Grant, D.N.; Fenves, G.L.; Whittaker, A.S. Bidirectional modelling of high-damping rubber bearings. J. Earthq. Eng. 2004, 8, 161–185. [Google Scholar] [CrossRef]
  43. Hu, X.; Zhou, Z. Seismic analysis of a reinforced concrete building isolated by high damping rubber bearings using deformation history integral type model. Struct. Des. Tall Spec. Build. 2020, 29, e1811. [Google Scholar] [CrossRef]
  44. Masaki, N.; Mori, T.; Murota, N.; Kasai, K. Validation of hysteresis model of deformation-history integral type for high damping rubber bearings. In Proceedings of the 16th World Conference on Earthquake Engineering (WCEE), Santiago, Chile, 9–13 January 2017. [Google Scholar]
  45. Abe, M.; Yoshida, J.; Fujino, Y. Multiaxial behaviors of laminated rubber bearings and their modeling. II: Modeling. J. Struct. Eng. 2004, 130, 1133–1144. [Google Scholar] [CrossRef]
  46. CSI ETABS Software 2022, Computer and Structures, Inc.: Berkeley, CA, USA, 2024.
  47. GB50011; Code for Seismic Design of Buildings. National Standards of the People’s Republic of China: Beijing, China, 2010.
  48. Shang, J.; Tan, P.; Zhang, Y.; Han, J.; Mi, P. Seismic isolation design of structure using variable friction pendulum bearings. Soil Dyn. Earthq. Eng. 2021, 148, 106855. [Google Scholar] [CrossRef]
  49. Murota, N.; Suzuki, S.; Mori, T.; Wakishima, K.; Sadan, B.; Tuzun, C.; Sutcu, F.; Erdik, M. Performance of high-damping rubber bearings for seismic isolation of residential buildings in Turkey. Soil Dyn. Earthq. Eng. 2021, 143, 106620. [Google Scholar] [CrossRef]
  50. International Code Council. International Building Code 2000; Dearborn Trade Publishing: Chicago, IL, USA, 2000. [Google Scholar]
  51. Ghafar, W.A.; Tao, Z.; Hasan, M.M.; Liang, Y.M. Seismic Analysis of a Hillside Reinforced Concrete Building Isolated by High-Damping Rubber Bearings Using DHI Model Type. In Proceedings of the First International Conference on Engineering Structures, Singapore, 18–20 February 2025; pp. 959–971. [Google Scholar]
  52. GB/T 51408-2021; Standard for Seismic Isolation Design of Building. National Standards of the People’s Republic of China: Beijing, China, 2021.
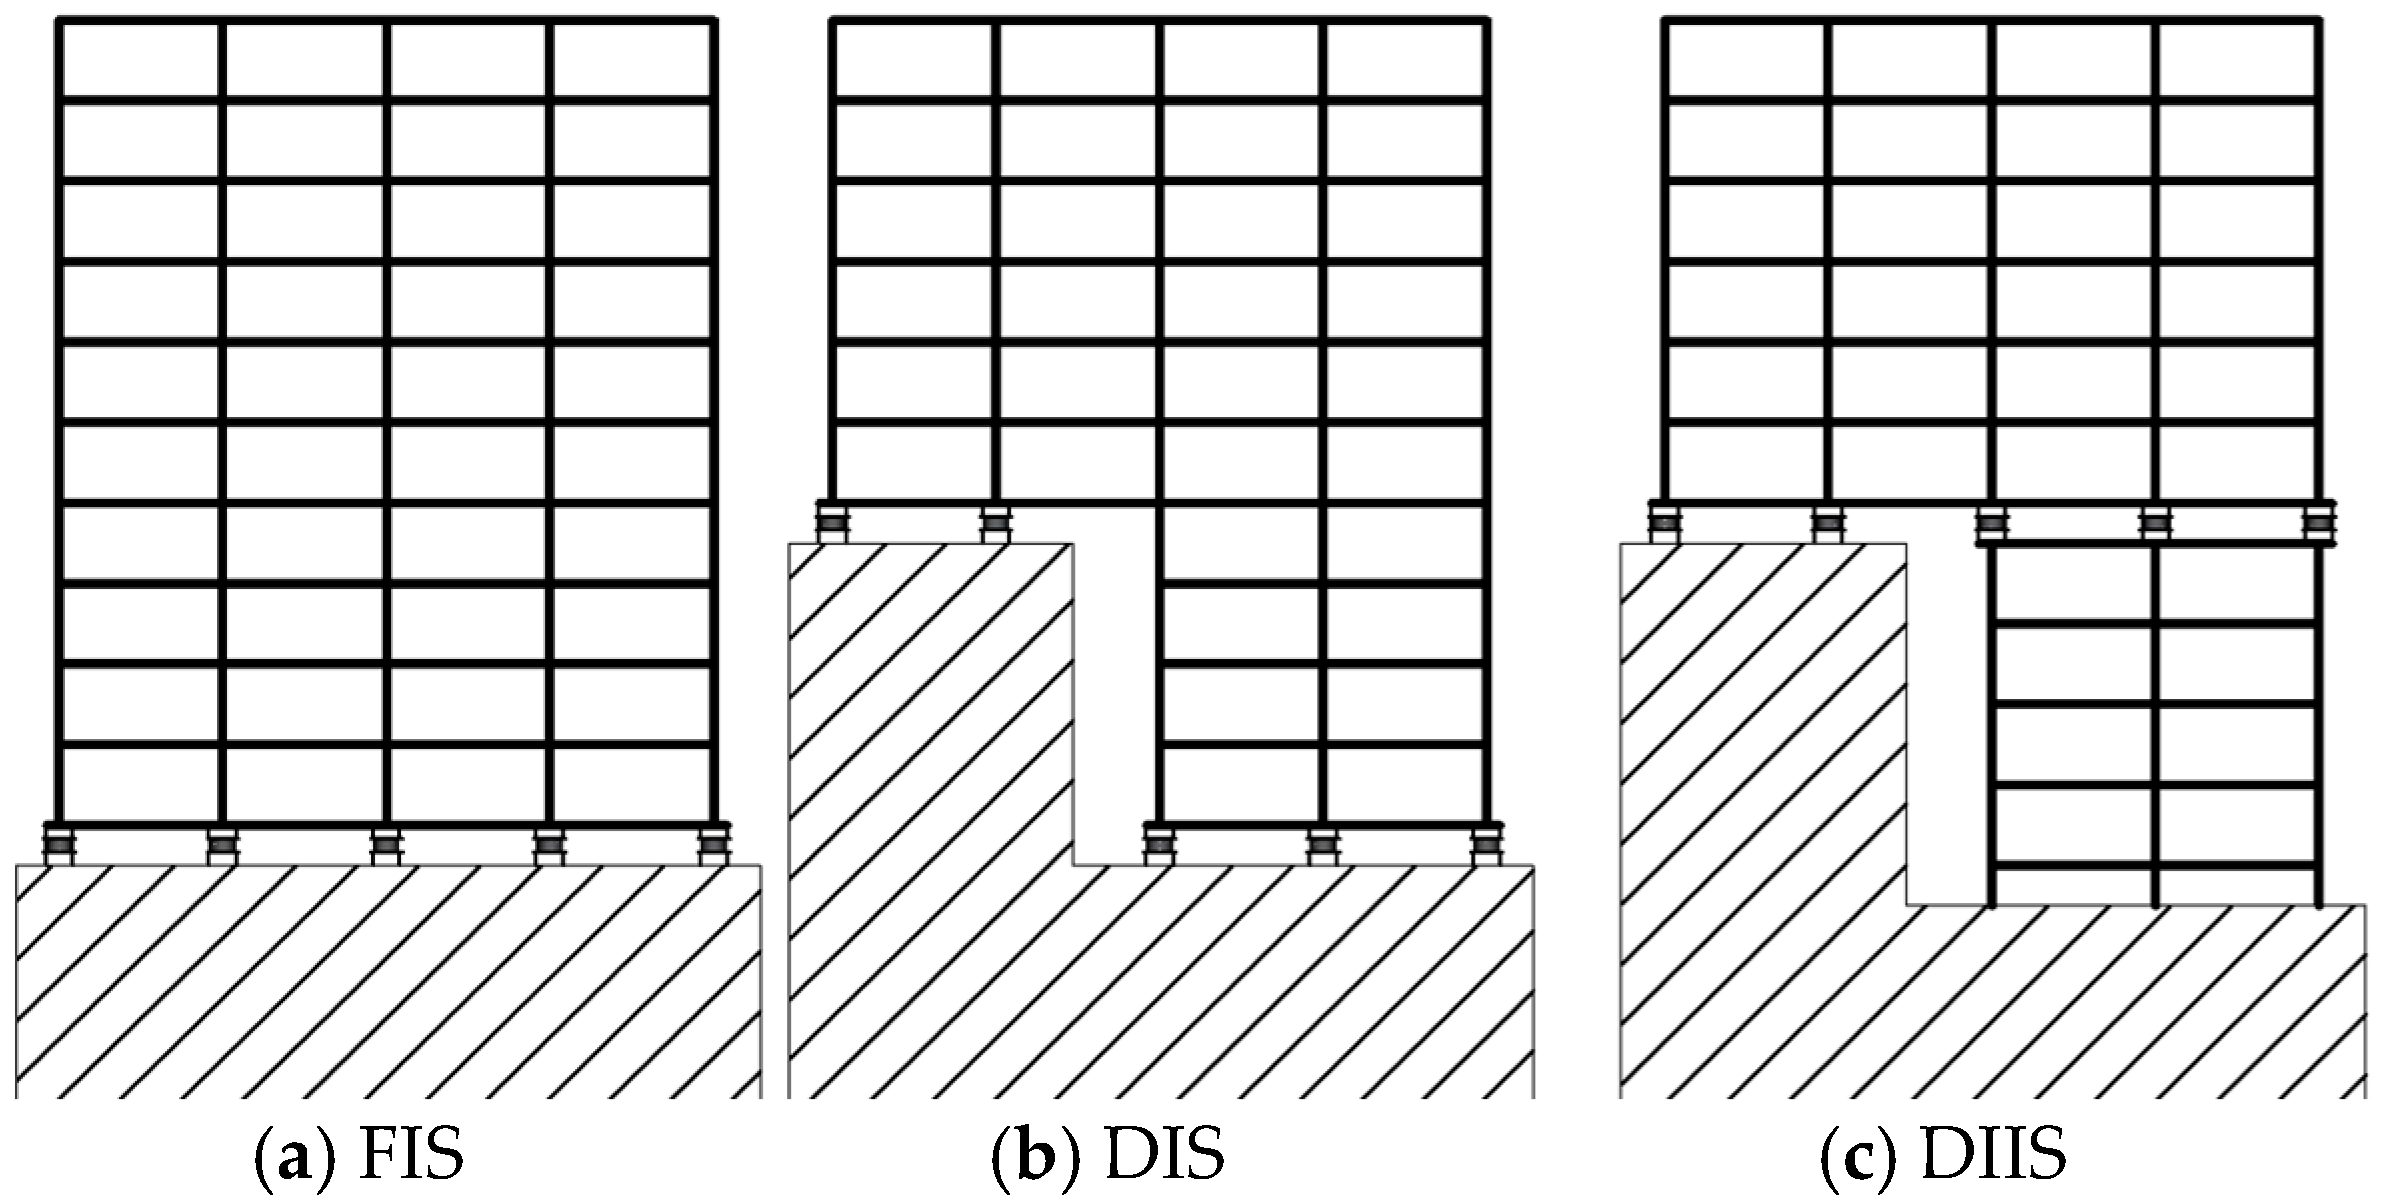
Figure 1. Proposed hillside-isolated structures.
Infrastructures 10 00239 g001
Figure 2. Hysteretic curve and analytical DHI model.
Infrastructures 10 00239 g002
Figure 3. Three-dimensional model and floor plan of the numerical models.
Infrastructures 10 00239 g003
Figure 4. Proposed numerical models.
Infrastructures 10 00239 g004
Figure 5. HDRBs’ layout.
Infrastructures 10 00239 g005
Figure 6. Response spectra of ground motions and design spectra.
Infrastructures 10 00239 g006
Figure 7. (a,b). Hysteresis curves of Bearing No. 1 under earthquake RSN1147 with varying PGA.
Infrastructures 10 00239 g007
Figure 8. (a,b). Hysteresis curves of Bearing No. 2 under earthquake RSN1147 with varying PGA.
Infrastructures 10 00239 g008
Figure 9. (a,b) Hysteresis curves of Bearing No. 3 under earthquake RSN1147 with varying PGA.
Infrastructures 10 00239 g009
Figure 10. Energy dissipation of bearings under earthquake RSN1147 with varying PGA.
Infrastructures 10 00239 g010
Figure 11. Total energy dissipation of bearings under six earthquake ground motions.
Infrastructures 10 00239 g011
Figure 12. Maximum roof acceleration comparison under the earthquake record RSN1147 (a) isolated with nonisolated structures), (b) base with inter-story isolated structures.
Infrastructures 10 00239 g012
Figure 13. PSA of the roof comparison under earthquake RSN1147 ground motion (a) isolated with non-isolated structures), (b) base with inter-story isolated structures.
Infrastructures 10 00239 g013
Figure 14. Maximum roof acceleration comparison under six earthquake ground motions(a) isolated with non-isolated structures), (b) base with inter-story isolated structures.
Infrastructures 10 00239 g014
Figure 17. Maximum story displacement comparison under earthquake RSN1147 ground motion (a) non-isolated structures in (X,Y), (b) isolated structures in X,Y (c) isolated structures with non-isolated structures.
Infrastructures 10 00239 g017
Figure 18. Maximum roof displacement comparison under six earthquake ground motions (a) isolated with non-isolated structures), (b) base with middle-story isolated structures.
Infrastructures 10 00239 g018
Figure 19. Story shear force comparison of structures during the RSN1147 earthquake event (a) non-isolated structures in (X,Y), (b) isolated structures in X,Y (c) isolated structures with non-isolated structures.
Infrastructures 10 00239 g019
Figure 20. Overturning moments comparison of structures during the RSN1147 earthquake event (a) non-isolated structures in (X,Y), (b) isolated structures in X,Y (c) isolated structures with non-isolated structures.
Infrastructures 10 00239 g020
Figure 21. Base shear force comparison of structures under varying earthquake intensities (a) isolated with non-isolated structures), (b) base with middle-story isolated structures.
Infrastructures 10 00239 g021
Figure 22. Base shear force comparison of structures under six ground motions (a) isolated with non-isolated structures), (b) base with middle-story isolated structures.
Infrastructures 10 00239 g022
Table 1. DHI model parameters for the three HDRBs.
HDRB
Model
Total Rubber Thickness (mm)Effective Plane Area (cm2) G a
(MPa)
θ γ d γ 1 τ 1 (MPa) γ 2 τ 2 (MPa)
HH060X6R20028260.530.460.420.0362.470.500.35
HH065X6R19833170.530.460.420.0362.470.500.35
HH070X6R20238470.530.460.420.0362.470.500.35
Table 2. Cross-sectional details of the numerical models.
Model IDInterior
Columns (mm)
Edge
Columns (mm)
Corner Columns (mm)Cantilevered Columns (mm)Beams
(mm)
Slab Thickness (mm)
F_Fixed base700 × 700600 × 600500 × 500800 × 800300 × 500150
FIS700 × 700600 × 600500 × 500800 × 800300 × 500150
D_Fixed base700 × 700600 × 600500 × 500800 × 800300 × 500150
DIS700 × 700600 × 600500 × 500800 × 800300 × 500150
DIIS700 × 700600 × 600500 × 500800 × 800300 × 500150
Table 3. Mechanical properties of selected HDRBs for buildings [51].
HDRB ModelEffective Shear Stiffness (kN/m) Compressive Stiffness (kN/m)Characteristic Strength (kN)Post-Yield Stiffness (kN/m) Nominal Long-Term Column Load Bearing (kN) Equivalent Damping Ratio
HH060X6R8761.97 × 10671.551918600.20
HH065X6R10402.34 × 10683.961526900.20
HH070X6R11802.66 × 10697.369935000.20
Table 4. Periods and circular frequencies of the structural models.
Model IDPeriod (s)
Mode 1
CircFreq
rad/s
Period (s)
Mode 2
CircFreq
rad/s
Period (s)
Mode 3
CircFreq
rad/s
Mass Participation Ratio
F_Fixed base1.4634.29411.4264.4061.2515.02160.998
FIS3.4531.81933.1711.98132.9462.13240.997
D_Fixed base0.9156.86650.8597.3150.7528.3530.998
DIS3.1641.9863.0422.06542.4862.52640.997
DIIS2.7702.30142.7132.31622.3012.72270.997
Table 5. Selected earthquake records for NTH analysis.
RSNYearEarthquake NameMagnitudeEpicenter Distance (km)Vs30 (m/s)PGA (g)
11471999Kocaeli_ Turkey7.5168.091750.189
16201999Duzce_ Turkey7.1445.16411.90.164
14901999Chi-Chi_ Taiwan7.6429.49542.410.162
11001995Kobe_ Japan6.924.852560.183
18271999Hector Mine7.13101.71332.530.166
40382003Bom_ Iran6.6137.92376.70.199
Disclaimer/Publisher’s Note: The statements, opinions and data contained in all publications are solely those of the individual author(s) and contributor(s) and not of MDPI and/or the editor(s). MDPI and/or the editor(s) disclaim responsibility for any injury to people or property resulting from any ideas, methods, instructions or products referred to in the content.