Article

Simulation of Pantograph–Catenary Arc Temperature Field in Urban Railway and Study of Influencing Factors on Arc Temperature

1
School of Automation & Electrical Engineering, Lanzhou Jiaotong University, Lanzhou 730070, China
2
CRRC Zhuzhou Electric Co., Ltd., Zhuzhou 412000, China
*
Author to whom correspondence should be addressed.
Infrastructures 2025, 10(9), 237; https://doi.org/10.3390/infrastructures10090237
Submission received: 16 April 2025 / Revised: 23 July 2025 / Accepted: 4 September 2025 / Published: 10 September 2025

Abstract

During the running of urban railway trains, arcs of the pantograph–catenary (PC) system cause instantaneous high-temperature ablation of PC system materials, which severely impact the standard running of trains. Utilizing magnetohydrodynamics (MHD), a mathematical model of urban railway PC arcs is introduced in this article. The multiphysics finite element analysis platform COMSOL Multiphysics was used to solve and simulate the mathematical model of the PC arc. The simulation results were analyzed to explore the temperature dispersion law of the PC arc. Experimental measurements of arc duration and arc temperature were conducted, with the mathematical model’s accuracy validated through empirical comparisons. Based on the established mathematical model of the PC arc, the effects of PC gap and current intensity on the arc temperature were investigated. The results reveal that the PC arc’s temperature field follows a radially decaying dispersion, attaining maximum temperature in the center of the arc column. The surface temperature of the pantograph strip is higher than that of the contact wire. As the duration of the PC arc increases, the arc temperature gradually increases; the temperature of the PC arc diminishes with the increase in the PC gap. The PC current increases, and the arc zone temperature increases. The research conclusions of this article can provide a basis for mitigating the number of PC arcs and enhancing the quality of the PC current.

1. Introduction

In recent years, with the progression of urban railway transit, more domestic and foreign scholars have directed scrutiny to boosting the operation speeds of railway transit trains [1,2,3].
In the current collection process of urban railway trains, the pantograph on the train is vertically driven by a spring mechanism, which ensures firm contact and sufficient pressure between the pantograph strip and contact wire, enabling continuous and stable current collection by the train [4]. During train operation, the hard points of the contact wire, foreign objects carried by the pantograph strip, and uneven wheel rails can all cause a sudden decrease in pressure between the contact wire and the pantograph strip, leading to PC offlining and arc generation [5,6,7].
Different from the AC arc, the DC arc has no natural zero crossing point, and the arc burning duration is longer. The high-temperature plasma will be accompanied by a large amount of heat dissipation during the generation process. When it acts on the surface of the PC system material, the surface temperature of the material will rise sharply, which seriously erodes the PC system material and shortens the service life of the PC electrode material. It is more likely to cause emergency stops or operational accidents of trains due to the interruption of current acquisition, which seriously threatens the safety and reliability of urban railway transit [8,9].
Extensive research has been conducted by numerous scholars on arc phenomena in PC systems. Reference [10] established a finite element model of the PC arc, solved it by employing MAR finite element software, and analyzed the temperature dispersion and magnetic field dispersion of the PC arc. However, the characteristics of long durations of DC arcs and significant energy accumulation effects are not considered. Reference [11] proposed a PC arc positioning method. This method can extract the resonance frequency related to the OHL position when a PC arc occurs to determine the position of the arc along the line. However, the range error of this method reaches 200 m, and it does not reflect the arcing strength of the PC arc. Reference [12] established a coupling model for the melting of PC arc electrodes and analyzed the melting features of the PC electrodes beneath the action of the PC arc. The steady-state features of the PC arc were calculated by finite element software, and the heat flux density dispersion of the PC electrode was obtained. The relationship between the arc burning time and the features of the electrode material melt pool were studied. However, the influence of the parameters such as the offline distance of the pantograph–catenary system and the DC current intensity on the arc temperature field were not investigated. Reference [13] developed an ultraviolet-based detection system for PC arcs in urban railway transit, utilizing solar-blind region features. Firstly, the feature spectral bands of the PC arc were identified based on solar-blind ultraviolet detection methodology. Secondly, the equivalent circuit of the photo-multiplier tube was analyzed, and the output integral value was determined as the feature quantity for evaluating PC arc intensity. The device can effectively detect the arc burning phenomenon and its intensity, but the detection system can only analyze the peak temperature of the arc and cannot measure the temperature dispersion of the arc. The above research mainly focused on the AC system, while the temperature field variation law of the DC arc on urban railway systems and the mechanism of influencing factors are not clear. On the basis of AC arc research, this paper takes the DC arc of urban railway systems as the research object, simplifies the hypothesis of its generation process, and establishes a mathematical model suitable for DC arcs and their unique characteristics without natural zero crossings and long durations. The model is solved by COMSOL Multiphysics finite element software (COMSOL 6.3). The arc temperature dispersion law is systematically analyzed, and the relationship between arc duration and temperature change is revealed. The experimental data are obtained by the arc detection system in the solar-blind area of the roof to verify the reliability of the simulation model. Based on this model, the influence of the PC gap and PC current on arc temperature is discussed.

2. Simulation Modeling of PC Arcs

2.1. Physical Occurrence Process of PC Arcs

The PC arc formation process results from multiphysics coupling interactions among thermal, fluid, and electromagnetic fields; the interaction process is shown in Figure 1 [14]. Firstly, the initial conditions are set to initialize the model. By setting the initial pressure and temperature, the conductivity of plasma in the PC arc is determined, and the potential dispersion and electric field dispersion are obtained using electromagnetic equations [15,16,17].
Through computational simulation, the current in the PC system generates Joule heating, inducing a rapid rise in temperature in the arc plasma, resulting in changes in the physical parameters of contact components. In the meantime, the PC arc is affected by electromagnetic force, causing the plasma flow field of the arc to constantly change. The entire system of the PC arc will continuously exchange energy with the external flow field in the form of heat conduction, convection, and radiation [18]. Concurrently, high-speed train operation and PC system state variations not only induce modifications in arc plasma flow field but also alter the system’s physical parameters of the PC system, which will affect the change of the flow field [19,20,21]. The whole physical process constantly changes and interacts with each other, and finally a stable flow field dispersion of PC arc plasma is formed.

2.2. Mathematical Model of PC Arcs

MHD theory emerges from the coupling of classical fluid mechanics and electromagnetics, constituting an interdisciplinary field that investigates the motion of electrically conducting fluids under electromagnetic fields [22]. The theory of magnetic fluid heat transfer includes fluid dynamics equations and Maxwell’s electromagnetic equations.
The internal situation is very complex when an arc occurs. For furtherance of this count procedure of arc plasma, the following hypothesis has been suggested based on the actual situation of the PC arc:
(1)
When calculating, stability of the PC arc exists.
(2)
When an arc happens, the parameters related to the arc change slowly with temperature.
(3)
When calculating the magnetic permeability of the PC arc plasma, it is invariable.
(4)
When an arc happens, the calculation process of arc plasma conforms to the local thermodynamic equilibrium state.

2.2.1. Fluid Mechanics Equations

According to the theory of fluid heat transfer, the basic equations of fluid mechanics contain the conservation of quality, quantity of motion, and amount of energy. Therefore, the equations of fluid dynamics are as follows:
ρ t + ρ u x + ρ v y + ρ w z = 0
ρ v i t + d i v ρ v v i = k = 1 2 x k η v i x k + v k x i p x + S v i
ρ T t + d i v ρ v T = d i v λ C p g r a d T + S T
In the formulas, ρ is the fluid density; u , v , w is the fluid speed in all directions; v i is the speed constituent at distinct harmonization; η is the viscidity factor; p is the plasma fluid pressure; T is the arc temperature; λ is the plasma thermal conductivity; C p is the specific heat capacity; S v i is the source term of the fluid momentum conservation equation; S T is the source term of the fluid energy conservation equation.
The source term representing the momentum conservation equation in Equation (2) is
S v i = j × B 0 + B i
In the formula, j is the current density; B 0 is the magnetic flux density produced by the current flowing through the arc; B i is the magnetic flux density manufactured by the contact wire current.
The source term representing the energy conservation equation in Equation (3) is
S T = ρ t + 1 σ j 2 + V Q R
In the formula, σ is the conductivity; V is the viscous dissipation term of this arc; Q R is the capacity filled by arc radiation.

2.2.2. Maxwell’s Electromagnetic Equation

To determine the unknown source terms in the conservation equations, it is necessary to compute coupled parameters including magnetic flux density and current density. Consequently, the governing equation to be solved is
d i v σ g r a d ϕ = 0
j = σ g r a d ϕ
The current density can be solved through Equations (6) and (7).
The calculation of magnetic induction intensity includes two parts: one is produced by the current flowing through the arc, and the other is produced by the contact wire current. This method for calculating the magnetic interaction strength produced by this contact wire current involves making the wire equivalent to a semi-infinite current wire and solving it using the Biot–Savart Law, which can be obtained through Equation (8). The method for calculating the magnetic interaction strength produced by the current flowing through the arc is the magnetic vector potential method, which can be obtained through Equations (9)–(11).
B i = 1 4 π r μ i e φ
In the formula, i represents the current of the PC; μ is the magnetic permeability of arc plasma; r is the vertical distance.
2 × A = μ 0 j
d i v g r a d A = μ 0 j
B 0 = × A
In the formulas, μ 0 is the vacuum magnetic conductivity, and A is the vector magnetic potential.

2.2.3. Radiation Equation

The influence of the thermal radiation process on arc temperature is very important and cannot be ignored, but the process of radiation dispersion and uptake is highly intricate. To simplify the computation, the simplified formulation method introduced in reference [23] is adopted to determine the thermal radiation equation.
Q R = 4 α k T 4 T 0 4
In the formula, k is the uptake factor, at 1 standard atmospheric, k = 13 (m−1); α = 5.67057 (W/m2 K), the Stefan–Boltzmann constant.

2.3. Geometric Model and Initial Conditions of PC

2.3.1. PC Geometric Model

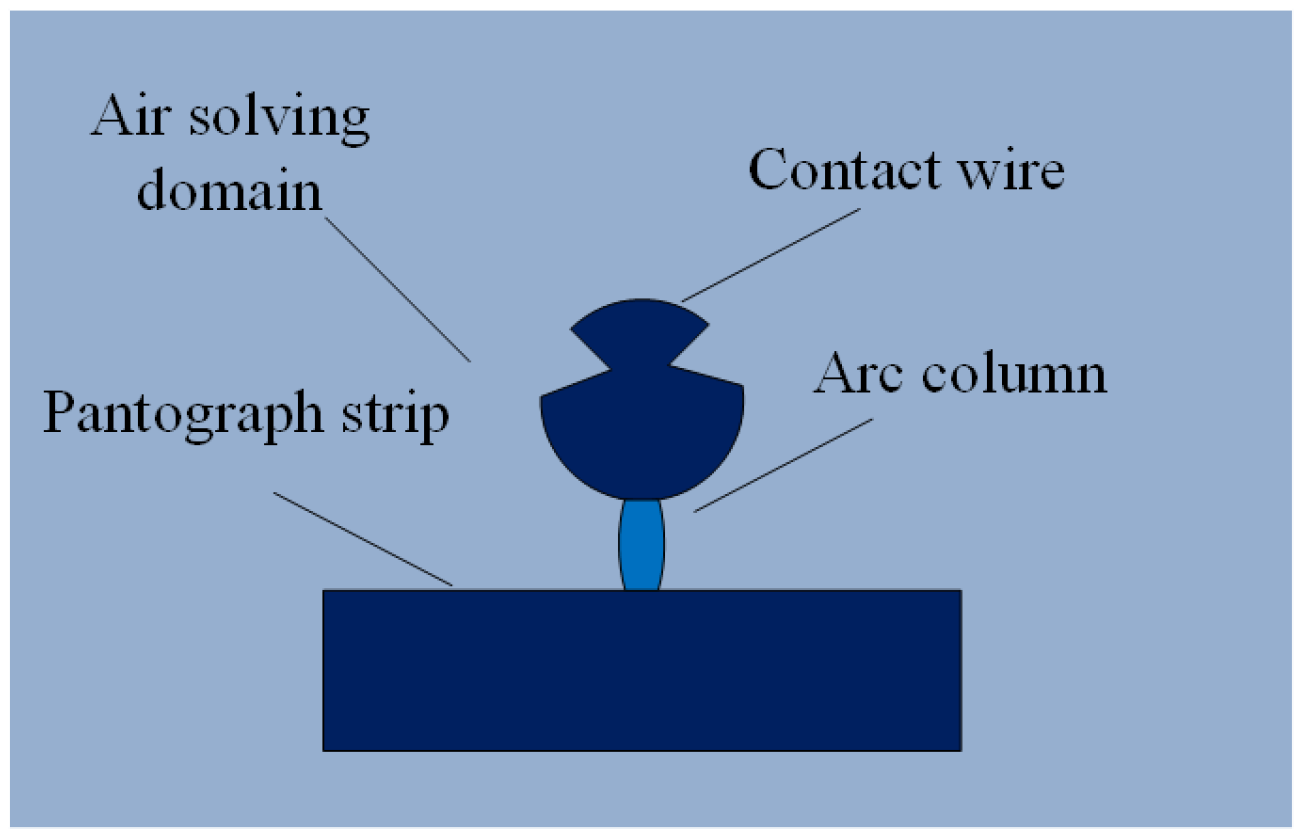
The COMSOL calculation method for 2D models is the same as that for 3D models, except that the 2D model is stretched into a 3D model before the model calculation. Therefore, a 2D model is sufficient for establishing the geometric model of the PC system. The geometric model is established along the transverse direction of the contact wire, with the abbreviated PC system geometry shown in Figure 2.
In Figure 2, the radius of the contact wire is 6.5 mm, while the pantograph strip is abbreviated into a rectangular element with a thickness of 15 mm. The contact wire is made of Cu–Sn, while the pantograph strip consists of copper-impregnated carbon material. The physical parameters are listed in Table 1.

2.3.2. Initial and Boundary Conditions

To solve the mathematical model of the PC arc, it is necessary to set the boundary and initial conditions of the arc simulation model. The contact wire is configured to act as the anode, and the pantograph strip is configured to act as the cathode. As an emitter, the cathode emits electrons emitted by the cathode. The air solution domain is set as fluid, the material is set as air, and the laminar flow is set as the flow field type. The contact surfaces between the contact wire and the strip represent the anode discharge boundary and the cathode discharge boundary, respectively, which participate in the plasma discharge of the urban railway PC arc. The upper and lower sides of the air domain are set as open boundaries. The initial temperature of the environment is set to 300 K; the fluid pressure is set to 1 atm; the current in the PC system is set to 100 A; the PC gap is set to 4 mm; the convection mode is set as forced convection, and the heat transfer coefficient is 100 W/(m2·K). The MUMPS solver is selected with a memory allocation factor of 3.5, the duration is set to 200 ms, and the solver step size is set to 0.1 ms.

2.3.3. Mesh Generation

In the built-in meshing setting of COMSOL software, the critical mesh element size parameters encompass maximum element size, minimum element size, maximum element growth rate, curvature factor, and narrow region resolution. The mesh unit division includes nine kinds—extremely fine, finer, normal, etc. Different materials and solution parameter settings should choose different mesh division formats. In this paper, the simulation model is meshed to guarantee the quality of the mesh unit, reduce the solution time, and avoid the factors such as the non-convergence of the solver when the mesh is not fine enough. All meshing is set as a free triangular mesh, and an extremely fine mesh is set on the surface of the contact wire and the surface of the pantograph strip. Normal mesh refinement is set inside the contact wire and the pantograph strip, and finer mesh refinement is set in the air domain.

3. Analysis of Simulation Results of PC Arcs

3.1. Temperature Dispersion of PC Arcs

From Figure 3, the peak temperature of the PC arc column exceeds 6000 K, with the highest temperature occurring in the central region of the arc and gradually decreasing towards the peripheral areas. The arc contracts toward both electrodes, with the contraction becoming more pronounced near the electrode surfaces. The temperature dispersion differs between the two poles, showing higher temperatures in the anode vicinity compared to the cathode region.
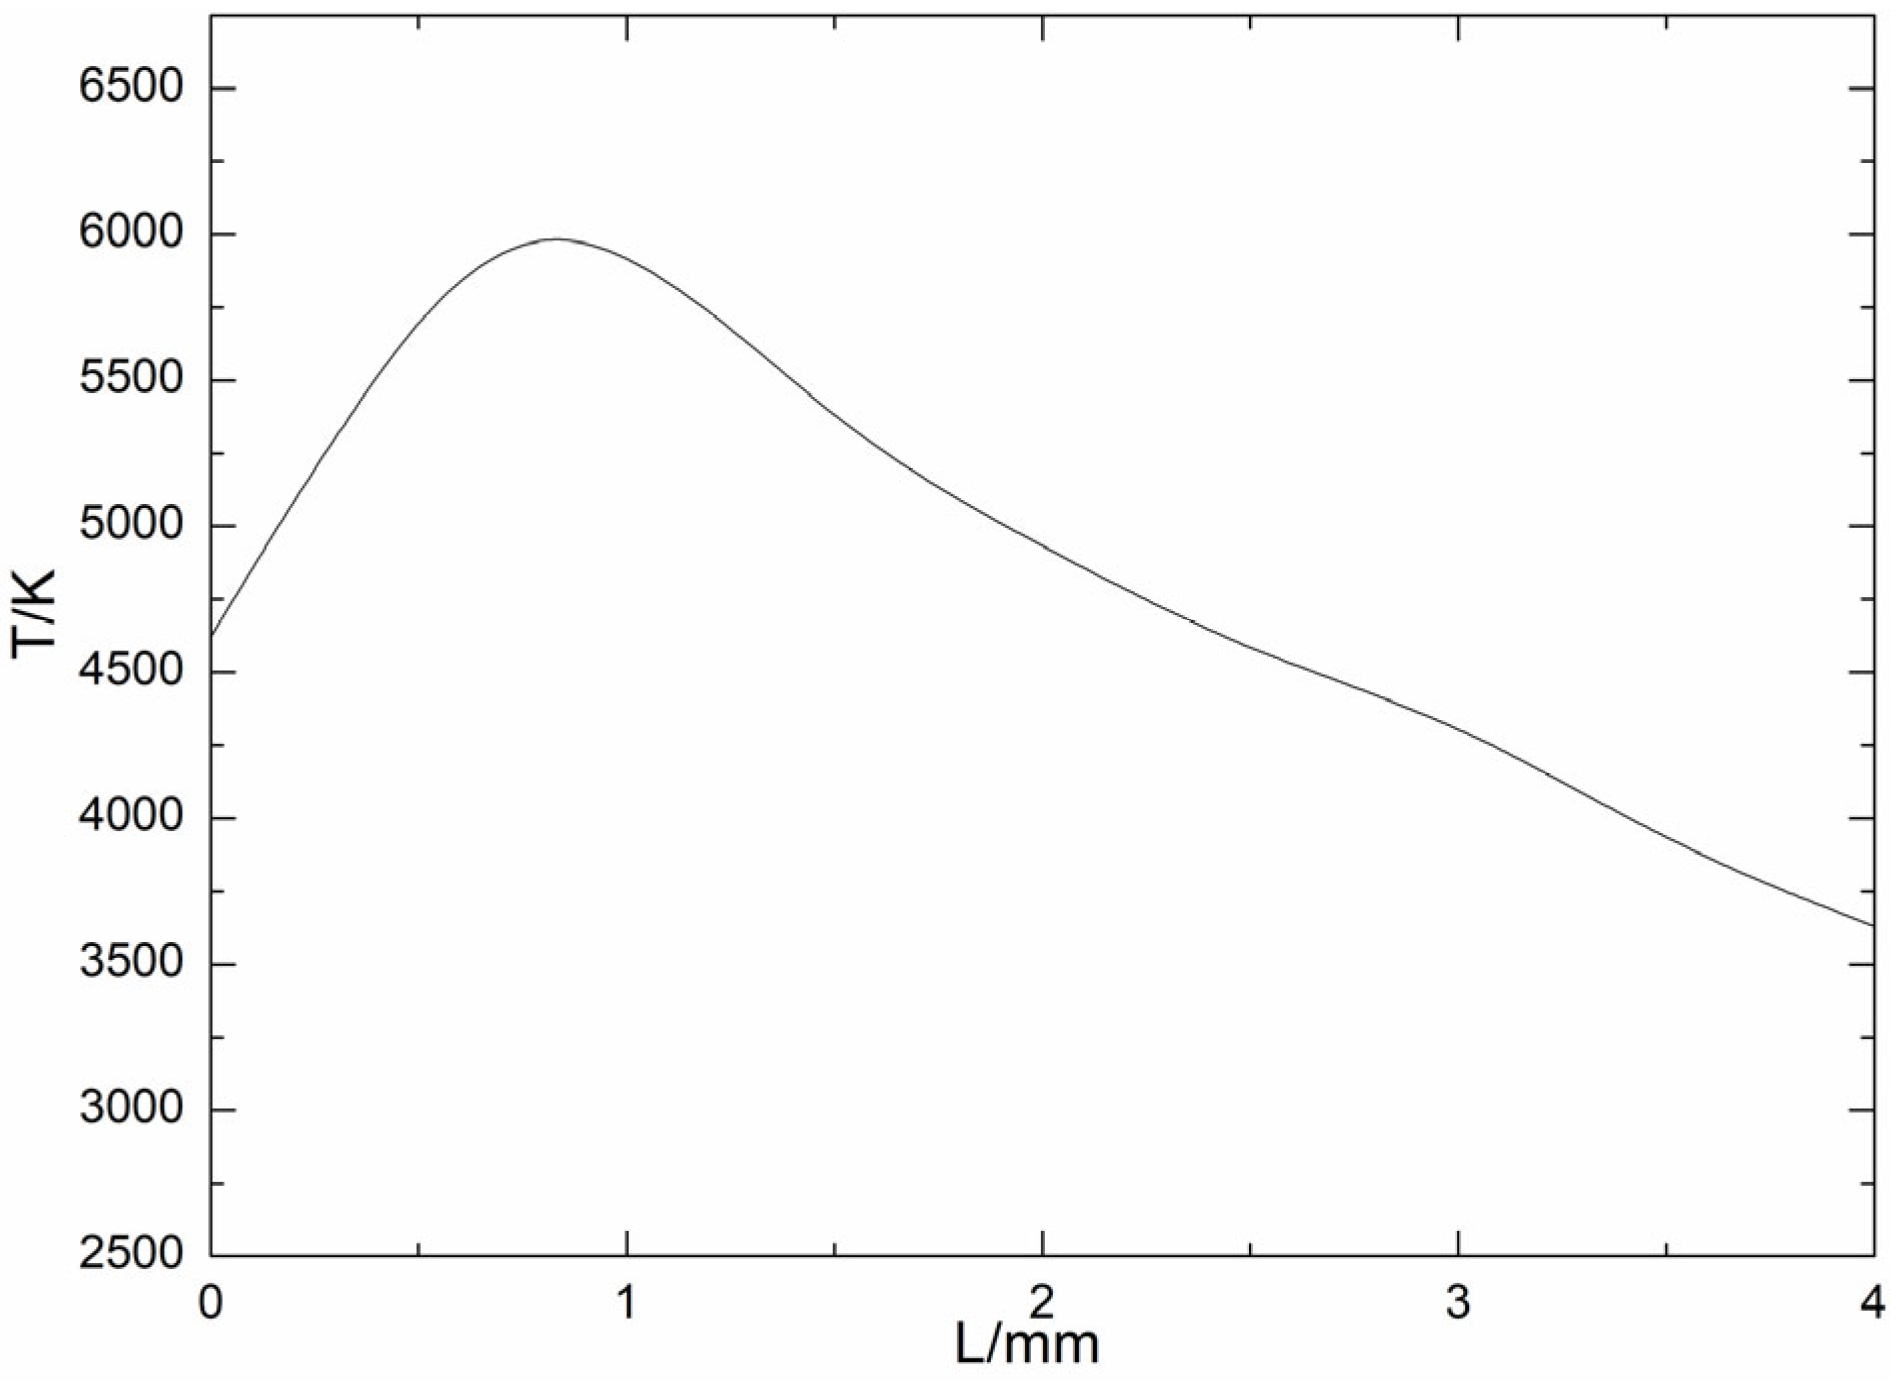
Using the simulation software to define a two-dimensional section as the central axis of the arc column, the temperature data was collected on the central axis of the arc column, and the temperature curve was drawn, as presented in Figure 4.
According to Figure 4, the arc temperature dispersion exhibits asymmetry. The temperature decreases more rapidly when approaching the anode side compared to the cathode side, and the temperature changes fastest between about 0 and 2 mm.

3.2. Surface Temperature Dispersion of PC Material

Figure 5 illustrates the temperature dispersion on both the contact wire and pantograph strip surface during PC arcing.
As evidenced in Figure 5, the temperature dispersion of the contact wire and the pantograph strip is the highest on the surface, with progressive thermal attenuation towards the interior regions. The contact wire surface can reach peak temperatures up to 4620 K. As contact wires are typically made of copper alloys, and the melting point of pure copper is 1358 K, and most copper alloys exhibit lower melting points than pure copper, the contact wire may melt when the PC arc occurs.

3.3. PC Arc Temperature Data

According to the IEC 60850 standard, the allowable fluctuation range of the DC1500 V system is +20% to −33%. During the actual running of trains, the voltage of the DC1500 V power supply system changes dynamically in the range of 1200 V–1700 V. The voltage DC1300 V to 1700 V was simulated by COMSOL simulation software, with collection at 0 ~ 200 ms, time step 20 ms, and with 10 groups of arc maximum temperature changes with arc duration data, as presented in Table 2.
As indicated in Table 2, within the duration of the PC arc, the arc temperature demonstrates a progressive increase with increased duration of the PC arc.

4. Experimental Verification of PC Arc Model

To validate the reliability of the PC arc model, the PC arc detection system with spectrometer was loaded on the roof of a train on the Lanzhou Railway Transit Line 1 Phase I line, and the arc data during operation was collected and compared with the arc simulation tentative data to validate the reliability of the arc model.

4.1. PC Arc Detection Device

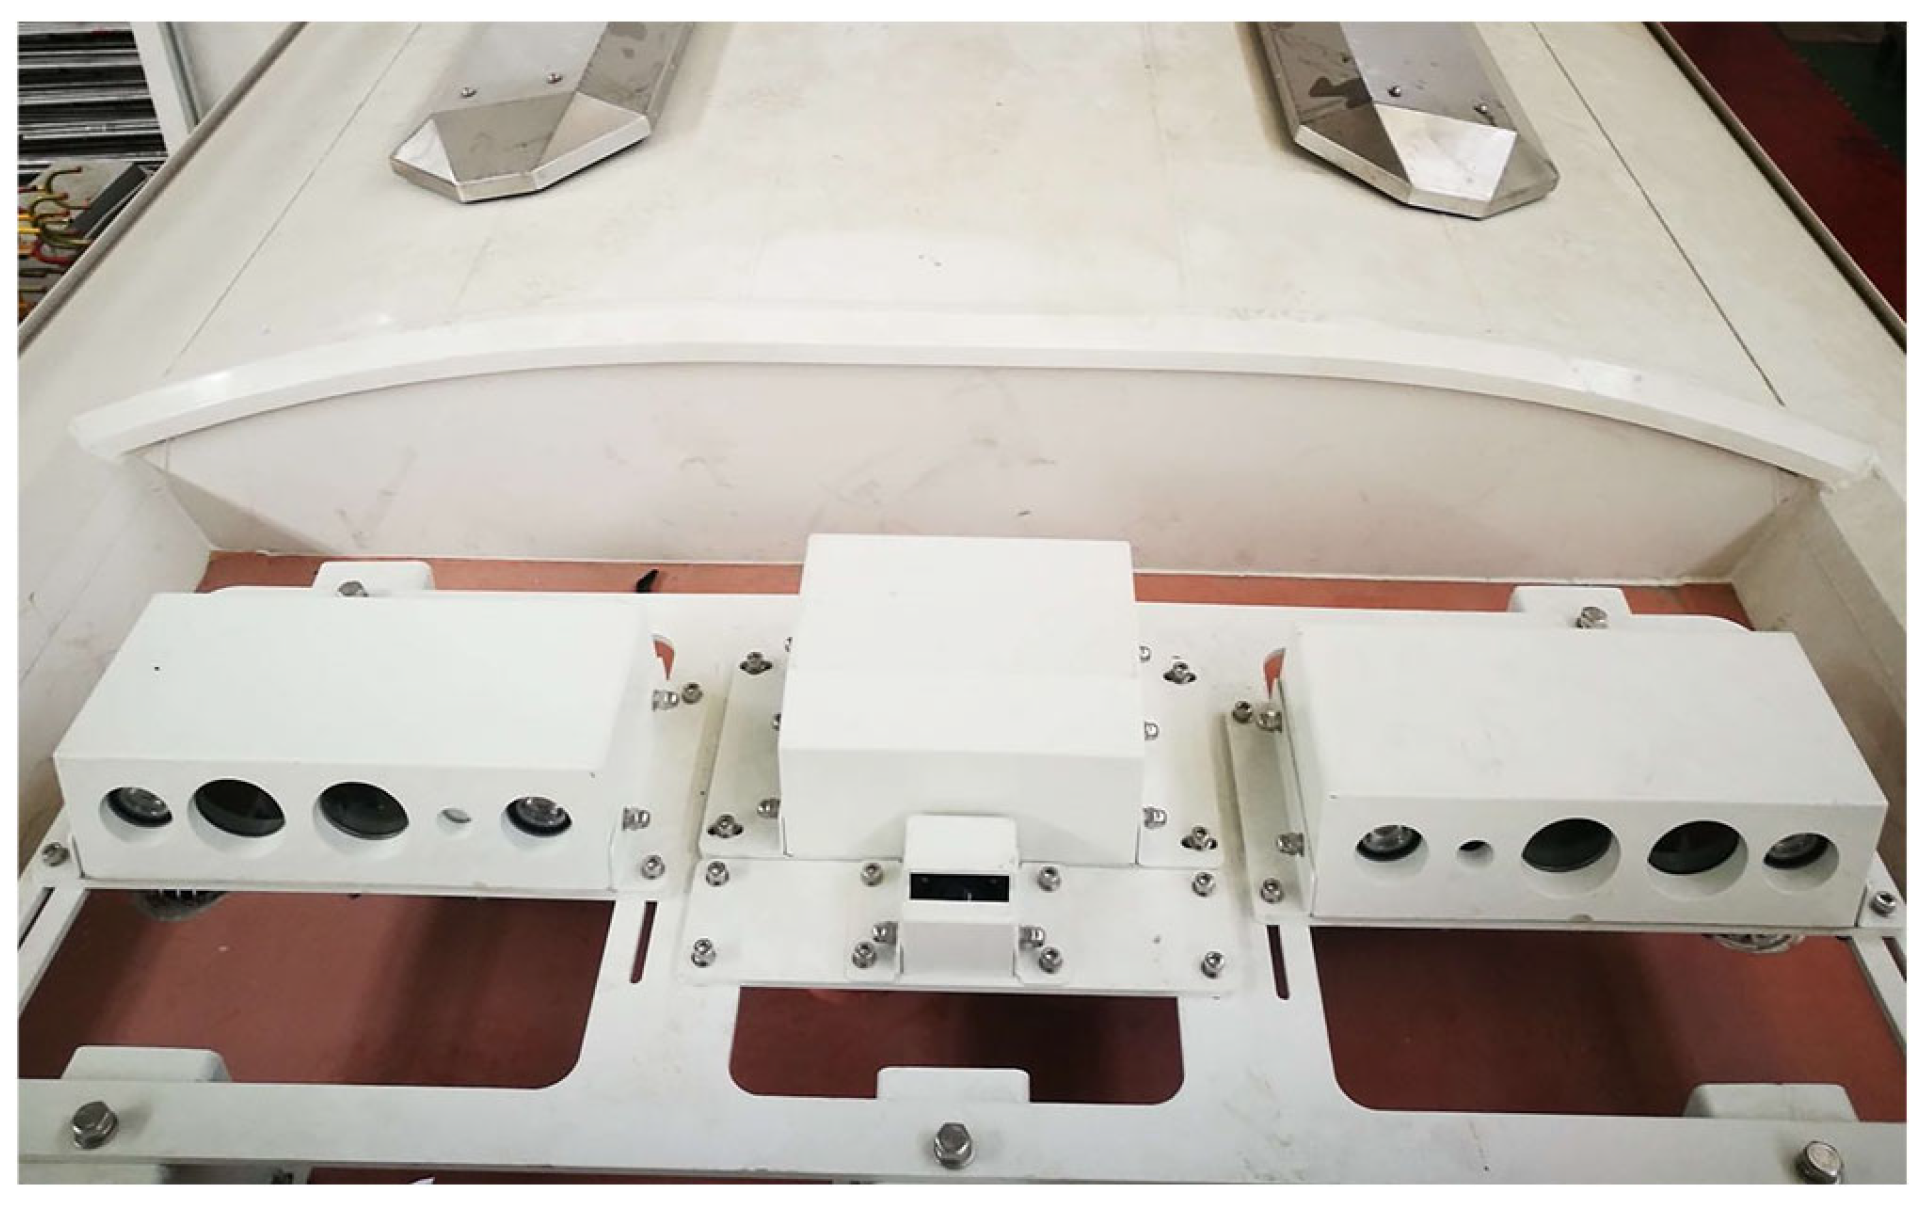
The experimental device collects data by loading the train roof with the vehicle, and processes and organizes the data through an industrial computer. Before testing, the arc detection system is calibrated, and the base of the device is adjusted to align the optical fiber probe of the spectrometer with the arc center, which is convenient to collect the temperature data of the arc center. The experimental device and schematic diagram of the device are shown in Figure 6 and Figure 7.
The detection device adopts the Shamrock SR-500i grating spectrometer, which can achieve spectral detection in the wavelength range of 180 nm to 850 nm. The detection device first collects the arc light when the pantograph arc passes through a fiber optic probe. The arc light enters the spectrometer through the fiber optic probe, passes through the grating of the spectrometer to split the light, and outputs the divided spectral information. It is then transmitted via optical fiber to the photoelectric conversion module, which primarily consists of a photo-multiplier tube. The optical signal is converted into an electrical signal output and finally processed and analyzed by the industrial computer. By detecting the duration and magnitude of the electrical signal, arc duration and intensity can be obtained. The temperature of arc plasma is calculated by comparing the intensities of spectral lines with different charge states using the Saha–Boltzmann method.

4.2. Test Data and Comparative Verification

In order to obtain spectral measurement information of the duration and temperature of the arc, the PC arc probe device was installed on the roof of the Lanzhou Railway Transit Line 1 Phase I train for on-board detection, and the arc temperature and arc light information of the PC arc were collected 4 times. The detection conditions cover the direction of train operation, line conditions, suspension modes, and consider factors such as test time period and train operation speed. During the uplink detection, the train departs from the Chen Guanying station, passes through 20 stations in sequence, and arrives at the Donggang station, with each station stopping for 1 min. During the downward inspection, the train drives from Donggang Station to Chenguanying Station. The specific detection conditions are shown in Table 3.
After 4 on-board detection tests, 10 arc data matching the simulation duration were selected and, based on spectroscopic calculation methods, the arc temperature variation data were computed, as presented in Table 4.
According to Table 3, in the selection of 10 up and down arc detection processes, the maximum temperature of arc detection by the optic-based arc detection system reached 7492 K.
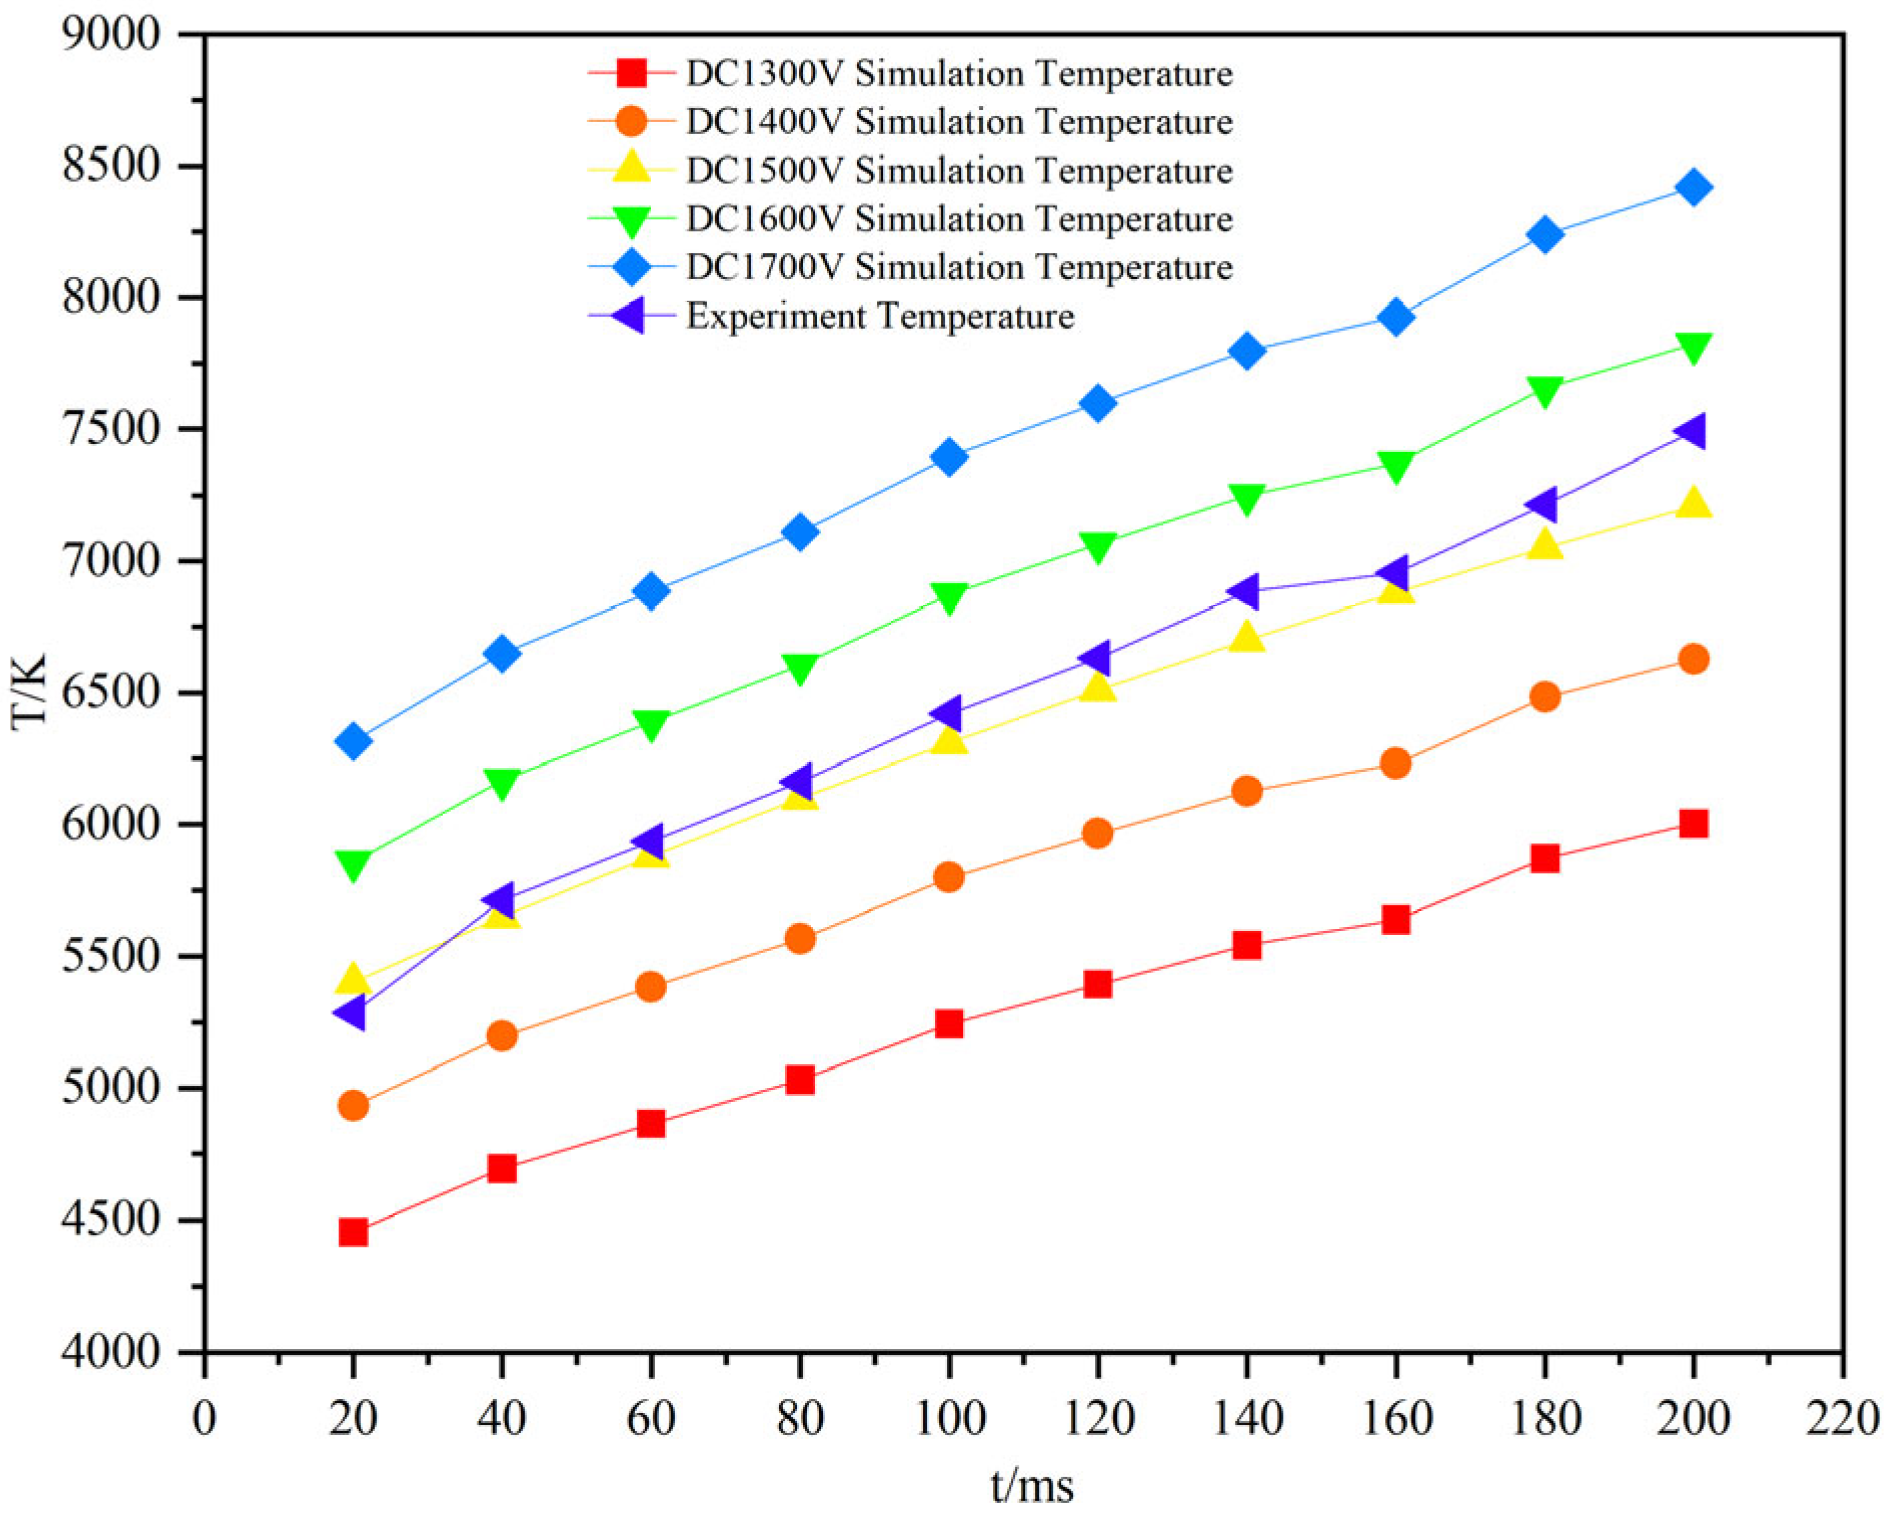
To validate the reliability of the arc model, comparative curves of arc temperature versus duration were plotted based on experimental and simulated data, as presented in Figure 8.
From Figure 3, the experimental and simulated arc temperature curves exhibit essentially consistent trends, thereby validating the reliability of the PC arc model. Due to the fact that the variation of the physical parameters of the PC system and the specific voltage fluctuation on the arc during the train operation were not considered in the simulation experiment, the comparison curve was not fully fitted, and there are differences.

5. Factors Affecting the Temperature of PC Arcs

During train operation, the electric locomotive operates with a 1.5 kV DC power supply. Pantograph vibrations or wheel–rail irregularities may cause PC separation, resulting in current surges through the PC system for which the PC gap is prone to arc phenomena. The high-temperature arcing generated in the PC system causes material ablation on contact surfaces, severely compromising current collection quality. Based on the previous arc model, studying the factors affecting arc temperature can master the changing law of arc temperature fields, reduce arc occurrence, and improve the quality of current collection during train operation.

5.1. Influence of PC Gap on Arc Temperature

When a PC arc occurs, both the magnitude and spatial dispersion of arc temperature exhibit significant variations depending on the PC gap. Therefore, based on the PC arc simulation model, the arc duration is parametrically set to 100 ms while systematically varying the PC gap distance, maintaining all other boundary conditions constant. In the COMSOL Multiphysics simulation environment, the PC gap is parametrically configured to 2 mm, 4 mm, 6 mm, and 8 mm to investigate its influence on arc temperature dispersion. The quantitative effects of PC gap variation on arc temperature dispersion features as presented in Figure 9.
From Figure 9, the arc temperature dispersion of various PC gaps is basically the same, and the peak temperature is located in the middle of the arc pillar and slowly lowers in the direction of the surroundings. As the gap increases, the arc pillar becomes longer, but the arc temperature decreases gradually.

5.2. Influence of PC Current on Arc Temperature

When a PC arc occurs in train operation, the current passing through the PC system has a significant impact on the temperature of the arc. Since it is difficult to control experimental quantification, the model was utilized to investigate the influence of PC current on arc temperature features. The arc duration was set to 100 ms, while keeping other conditions unchanged. The PC current was set to 50 A, 100 A, 150 A, and 200 A, and the nephogram of arc temperature dispersion in the arc is presented in Figure 10.
From Figure 10, the arc temperature dispersion remains broadly similar across different PC current levels. As the PC current increases, the arc area gradually expands, and the arc temperature rises accordingly.

6. Discussion

During the operation of urban railway trains, due to the long-term outdoor environment of the vehicle body, the PC system is affected by the external environment, resulting in a PC gap between the pantograph strip and the contact line, resulting in the PC arc phenomenon. When a PC arc occurs on an urban railway, the pantograph strip and the contact wire are not electrically disconnected, and the PC current will vary in accordance with fluctuations in traction current. Reference [24] studied the relationship between arc temperature and arc duration when PC arcs occur in DC power supply systems. Reference [25] studied the relationship between pantograph slide plate material and the pantograph strip surface temperature of urban railway PC systems. On the basis of the aforementioned research, this paper explored the relationship between different PC gaps and different PC currents and the arc temperature of the urban railway DC PC system. The PC arc cannot be eliminated. By optimizing the spring device of the pantograph, the lifting force of the pantograph can be increased so that the train can always maintain good contact between the pantograph and the catenary during operation, thereby reducing occurrences of PC offlining to reduce occurrences of PC arcs. This paper only explored the arc temperature dispersion when the urban railway PC arc is stable. Based on the arc simulation model, our subsequent research will further study the temperature change and dispersion during the arc initiation, combustion, and extinction processes of the PC.

7. Conclusions

The high temperature features of the PC arc will cause damage to both the contact wire and pantograph strip, leading to ablation of the contact wire, which may result in severe locomotive safety incidents. Therefore, this article established a mathematical model of the PC arc, employing finite element software for solution and simulation, and analyzed the simulated arc temperature results. Additionally, an optical arc detection system was installed on trains of Lanzhou Metro Line 1 to collect data on PC arc duration and arc spectral information, thereby validating the reliability of the arc model. Based on this model, the influencing factors of PC arc temperature were further investigated.
(1)
The PC arc temperature reaches its maximum in the arc central region, and gradually decreases from the arc center to the surrounding area. The contact wire surface temperature is consistently higher than that of the pantograph strip surface.
(2)
The results demonstrate a correlation between arc temperature and duration. The PC arc temperature increases with arc duration, but it is not completely linear.
(3)
The PC arc temperature decreases with increasing PC gap but rises with higher PC current.

Author Contributions

Conceptualization, Y.S. and X.Y.; methodology, X.Y.; software, Y.S. and M.S.; validation, Y.S. and J.Y.; formal analysis, L.S. and Z.W.; investigation, Y.L., C.W., and Y.C.; writing—original draft preparation, Y.S.; writing—review and editing, Y.S.; funding acquisition, X.Y. All authors have read and agreed to the published version of the manuscript.

Funding

This research was funded by the National Study Abroad Fund of China; the Science and Technology Research and Development Program of China National Railway Group Corporation Limited (N2022X009); the Science and Technology Program of Gansu Province (23CXGA0023); and National Natural Science Foundation of China (No. 52467008).

Data Availability Statement

The original contributions presented in the study are included in the article; further inquiries can be directed to the corresponding author.

Conflicts of Interest

Author Mengjie Song was employed by the company CRRC ZHUZHOU ELECTRIC CO. LTD. The remaining authors declare that the research was conducted in the absence of any commercial or financial relationships that could be construed as a potential conflict of interest.

References

  1. Li, X.; Zhu, F.; Qiu, R.; Tang, Y. Research on the influence of metro pantograph-catenary arc on airport instrument landing system. China Railw. Soc. 2018, 40, 97–102. [Google Scholar]
  2. John, M.; Mark, R.; Roberto, P. Use of dynamic analysis to investigate the behaviour of short neutral sections in the overhead line electrification. Infrastructures 2021, 6, 62. [Google Scholar] [CrossRef]
  3. Jiang, T.; Froseth, G.; Navik, P.; Ronnquist, A. Assessment of pantograph-catenary interaction in a railway overlap section via a novel optical-based method. Mech. Mach. Theory 2022, 177, 105045. [Google Scholar] [CrossRef]
  4. Jung, K.; Suh, Y. Medium voltage power supply with enhanced ignition characteristics for plasma torches. J. Power Electron. 2011, 11, 591–598. [Google Scholar] [CrossRef]
  5. Signorino, D.; Giordano, D.; Mariscotti, A.; Gallo, D.; Femine, A.D.; Balic, F.; Quintana, J.; Donadio, L.; Biancucci, A. Dataset of measured and commented pantograph electric arcs in DC railways. Data Brief 2020, 31, 105978. [Google Scholar] [CrossRef]
  6. Cho, Y.; Lim, J.; Seo, H.; Bang, S.; Choe, G. A series arc fault detection strategy for single-phase boost PFC rectifiers. J. Power Electron. 2015, 15, 1664–1672. [Google Scholar] [CrossRef]
  7. Hu, Y.; Gao, G.; Chen, X.; Zhang, T.; Wei, W.; Wu, G. Study on pantograph- catenary arc during pantograph lowing based on spectrum. High Volt. Eng. 2018, 44, 1668–1676. [Google Scholar]
  8. Lei, D.; Zhang, T.; Duan, X.; Gao, G.; Wei, W.; Wu, G. Study on the influence of train running speed on electric characteristics of pantograph-catenary arc. J. China Railw. Soc. 2019, 41, 50–56. [Google Scholar]
  9. Liu, X.; Zhou, C.; Wang, D.; Zhou, X.; Hu, M.; Guan, X.; Zhang, W.; Zheng, Y.; Gao, M.; Yang, W.; et al. Effect of Arc Erosion under Different Currents on Wear Mechanism of Impregnated Copper Carbon Skateboard/Cr-Zr-Cu Contact Wire. Tribology 2024, 44, 189–199. [Google Scholar]
  10. Xu, J. Physical Field Simulation Analysis of Pantograph-Catenary Arc. Master’s Thesis, Beijing Jiaotong University, Beijing, China, 2012. [Google Scholar]
  11. Fan, F.; Wank, A.; Seferi, Y.; Stewart, B. Pantograph Arc Location Estimation Using Resonant Frequencies in DC Railway Power Systems. IEEE Trans. Transp. Electrif. 2021, 7, 3083–3095. [Google Scholar] [CrossRef]
  12. Hao, J.; Gao, G.; Xu, P.; Wei, W.; Hu, Y.; Wu, G. Coupled model of pantograph-catenary arc and electrode considering electrode melting. High Volt. Eng. 2018, 44, 1668–1676. [Google Scholar]
  13. Yu, X. Development and Application of Urban Rail Transit Pantograph-Catenary Arc Detection System Based on Sun Blind Area. Ph.D. Thesis, Lanzhou Jiaotong University, Lanzhou, China, 2021. [Google Scholar]
  14. Xu, Z.; Gao, G.; Wei, W.; Yang, Z.; Xie, W.; Dong, K.; Ma, Y.; Yang, Y.; Wu, G. Characteristics of pantograph-catenary arc under low air pressure and strong airflow. High Volt. 2022, 7, 369–381. [Google Scholar] [CrossRef]
  15. Zhou, H.; Duan, F.; Liu, Z.; Chen, L.; Song, Y.; Zhang, Y. Study on electric spark discharge between pantograph and catenary in electrified railway. IET Electr. Syst. Transp. 2022, 12, 128–142. [Google Scholar] [CrossRef]
  16. Shi, H.; Chen, G.; Yang, Y. A comparative study on pantograph-catenary models and effect of parameters on pantograph-catenary dynamics under crosswind. J. Wind. Eng. Ind. Aerodyn. 2021, 211, 104587. [Google Scholar] [CrossRef]
  17. Gao, S. Automatic detection and monitoring system of pantograph-catenary in china’s high-speed railways. IEEE Trans. Instrum. Meas. 2020, 70, 3502012. [Google Scholar] [CrossRef]
  18. Li, Y.; Jin, T.; Liu, L.; Yuan, K. Dynamic performance simulation and stable current collection analysis of a pantograph catenary system for trolley wire overhead electrically actuated LHD. Energies 2020, 13, 1015. [Google Scholar] [CrossRef]
  19. Song, Y.; Wang, Z.; Liu, Z.; Wang, R. A spatial coupling model to study dynamic performance of pantograph-catenary with vehicle-track excitation. Mech. Syst. Signal Process. 2021, 151, 107336. [Google Scholar] [CrossRef]
  20. Zhou, H.; Liu, Z.; Xiong, J.; Duan, F. Characteristic analysis of pantograph-catenary detachment arc based on double-pantograph-catenary dynamics in electrified railways. IET Electr. Syst. Transp. 2022, 12, 238–250. [Google Scholar] [CrossRef]
  21. Zhou, Y.; Yang, Z.; Lu, C.; Mu, Y.; Wei, W.; Gao, G.; Wu, G. Research on Motion Characteristics of Offline Arc in Pantograph Catenary System Under Low Air pressure Environment. Proc. CSEE 2021, 41, 5412–5421. [Google Scholar]
  22. Seferi, Y.; Blair, S.M.; Mester, C.; Stewart, B.G. A novel arc detection method for DC railway systems. Energies 2021, 14, 444. [Google Scholar] [CrossRef]
  23. Wu, G.; Gao, G.; Wei, W.; Yang, Z. The Electrical Contact of the Pantograph-Catenary System, 1st ed.; Springer: Singapore, 2019; pp. 142–144. [Google Scholar]
  24. Yu, X.; Song, M.; Wang, Z. Simulation and Verification of Effect of Arc Duration on Arc Temperature Based on COMSOL. Machines 2023, 11, 289. [Google Scholar] [CrossRef]
  25. Yu, X.; Song, M.; Wang, Z. Simulation Study on Surface Temperature Distribution of Collector Strip Material under Pantograph-Catenary Arc of Urban Rail. IEEE Access 2023, 11, 68358–68365. [Google Scholar] [CrossRef]
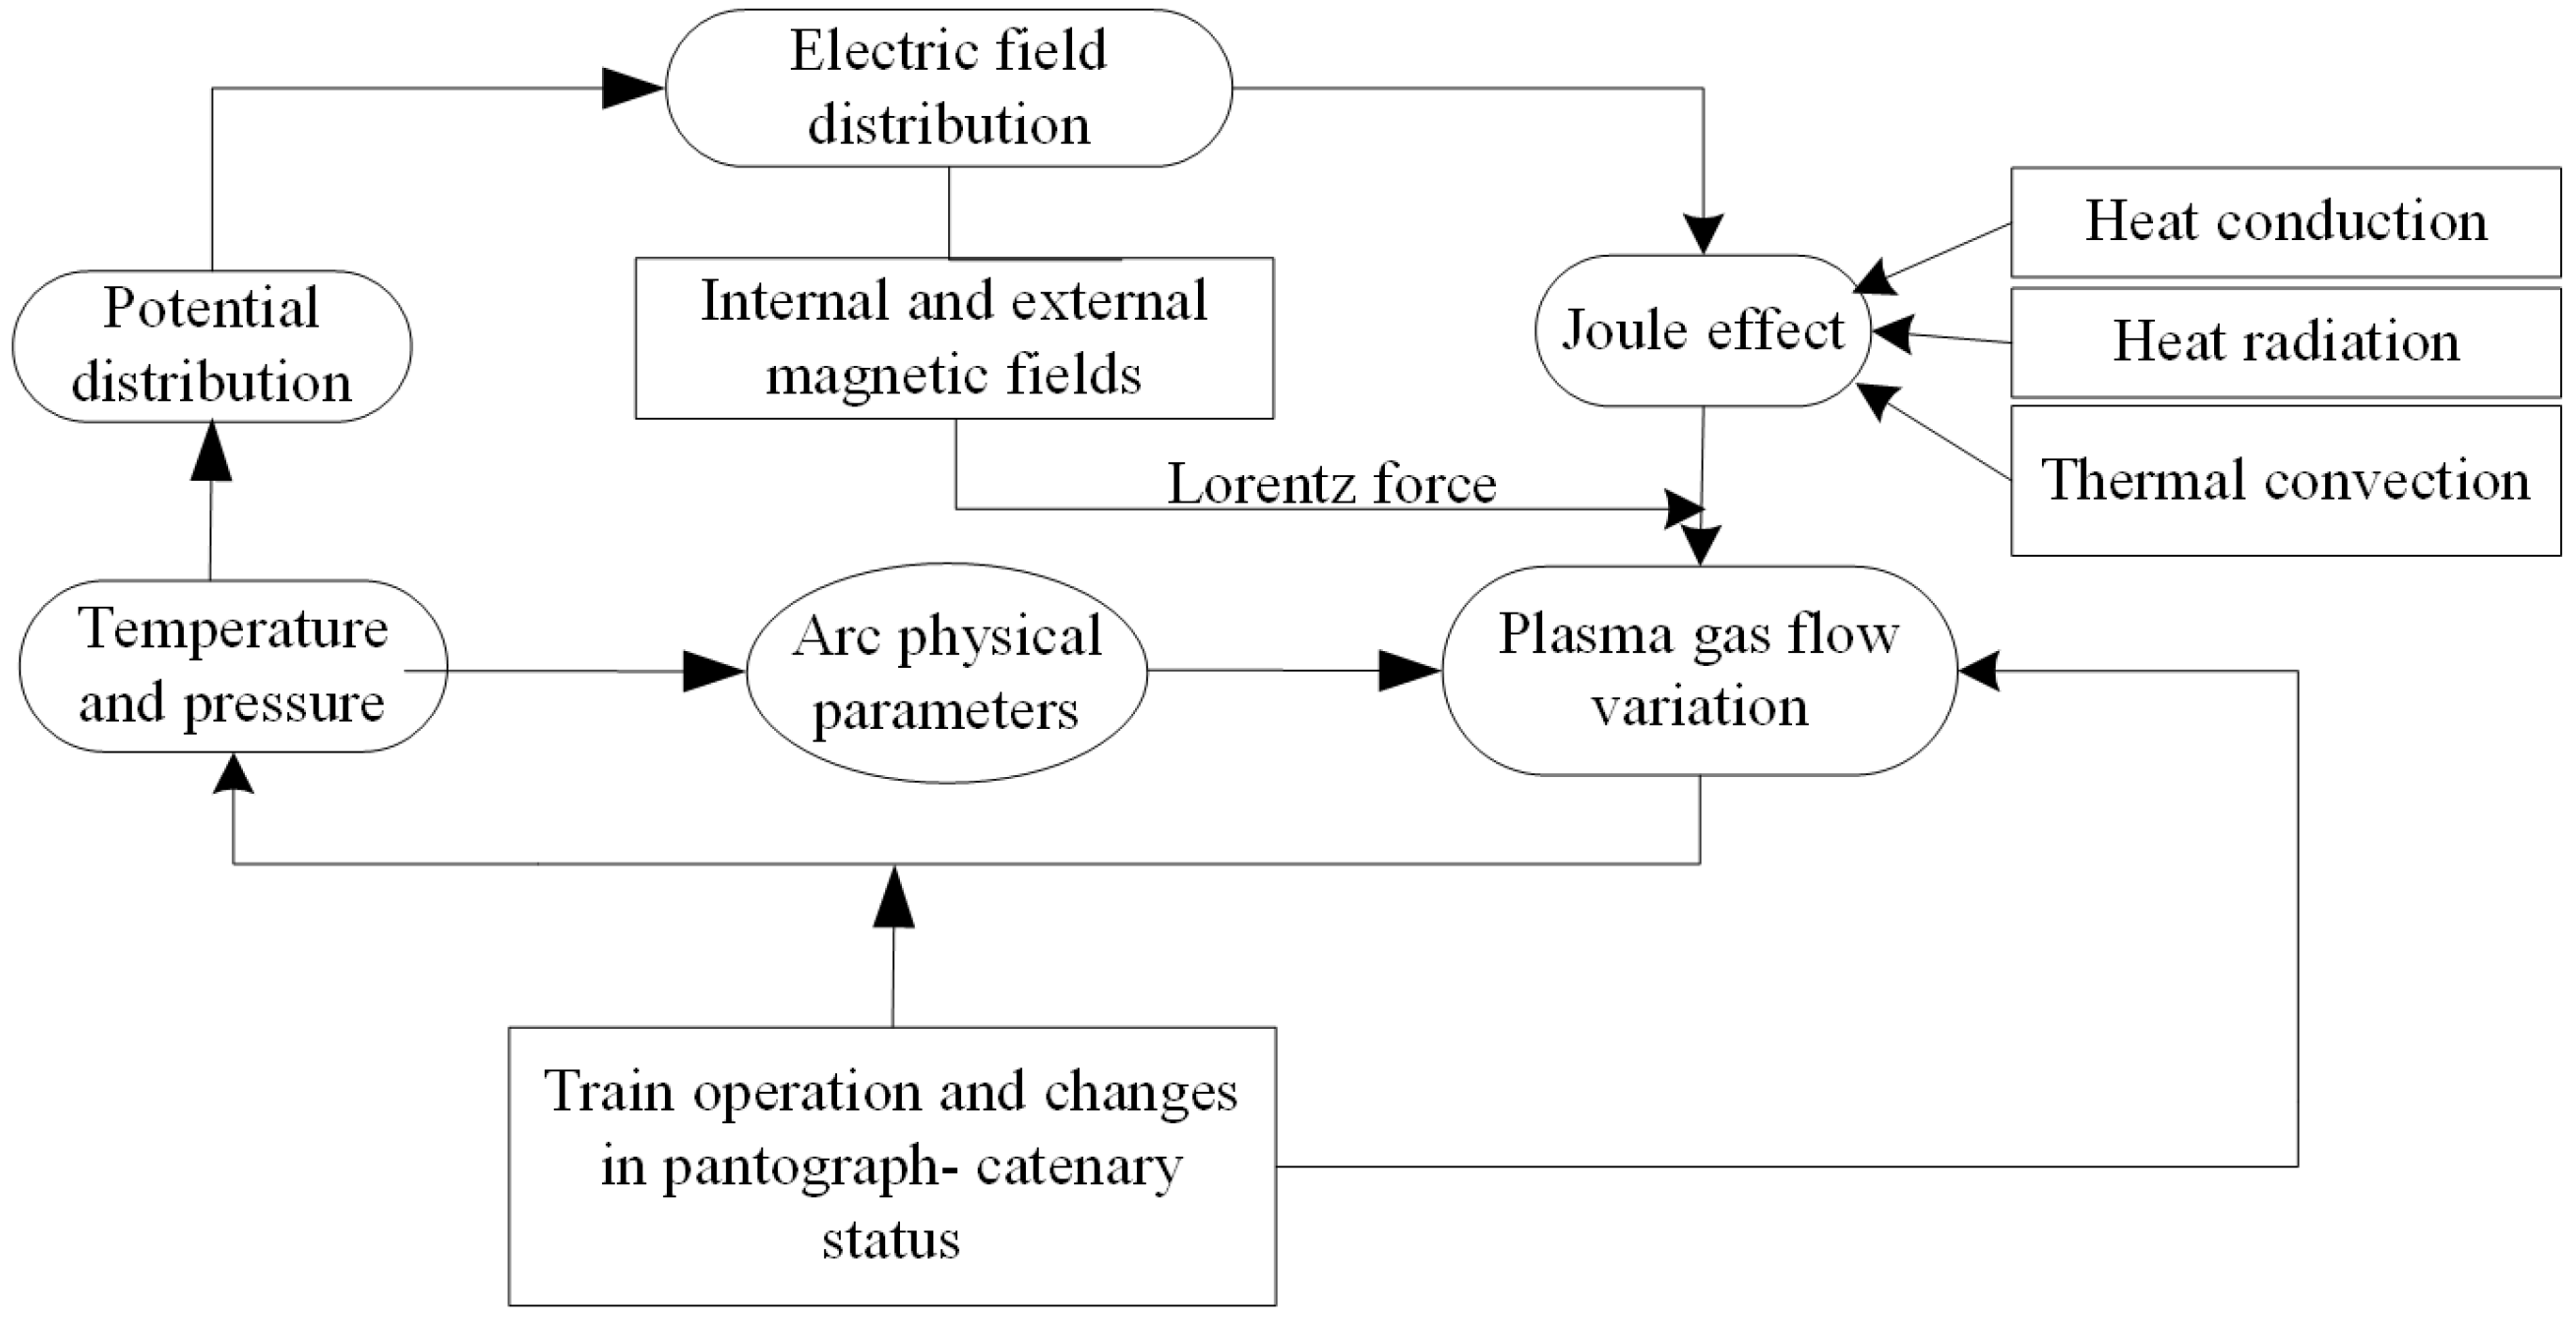
Figure 1. Physical occurrence process of urban railway PC arc.
Infrastructures 10 00237 g001
Figure 2. Abbreviated geometric model of the PC system.
Infrastructures 10 00237 g002
Figure 3. PC arc temperature dispersion nephogram.
Infrastructures 10 00237 g003
Figure 4. Temperature dispersion curve along the central axis of the arc column.
Infrastructures 10 00237 g004
Figure 5. Temperature dispersion of contact wire and pantograph strip. (a) Surface temperature dispersion of contact wire; (b) surface temperature dispersion of pantograph strip.
Infrastructures 10 00237 g005
Figure 6. Diagram of PC arc experimental device.
Infrastructures 10 00237 g006
Figure 7. Schematic diagram of the PC arc experimental device. A: Pantograph; B: Fiber Optic Probe; C: Spectrograph; D: IPC; E: Contact Wire; F: Rail.
Infrastructures 10 00237 g007
Figure 8. Comparison curve of experiment and simulation.
Infrastructures 10 00237 g008
Figure 9. Arc temperature dispersion nephogram under different PC gaps. (a) Arc temperature dispersion nephogram at 2 mm PC gap; (b) arc temperature dispersion nephogram at 4 mm PC gap; (c) arc temperature dispersion nephogram at 6 mm PC gap; (d) arc temperature dispersion nephogram at 8 mm PC gap.
Infrastructures 10 00237 g009
Figure 10. Arc temperature dispersion nephogram under different PC currents. (a) Arc temperature dispersion nephogram at 50 A PC current; (b) arc temperature dispersion nephogram at 100 A PC current; (c) arc temperature dispersion nephogram at 150 A PC current; (d) arc temperature dispersion nephogram at 200 A PC current.
Infrastructures 10 00237 g010
Table 1. Physical parameters of the contact wire and carbon strip.
ProjectsCu–Sn Contact Wire Copper-Impregnated Pantograph Strip
Density/(kg/m3)90202320
Specific heat/(J/(kg·K))384478
Heat conduction coefficient/(W/(m·K))3986
Table 2. Simulation data of peak arc temperature and arc duration.
Time/(ms)20406080100120140160180200
DC1300 V Temperature/(K)4454469348655030524253945542563858706003
DC1400 V Temperature/(K)4933519653845566579859656127623164836627
DC1500 V Temperature/(K)5400565058806100631065106700688070507210
DC1600 V Temperature/(K)5857616963906603687270657250737076587823
DC1700 V Temperature/(K)6315664968857110739676007799792882408422
Table 3. Detection conditions.
Detection Serial NumberMoving DirectionDetection Time PeriodAverage Ambient Temperature/°COperating Duration/minAverage Speed/(km·h−1)Maximum Instantaneous Speed/(km·h−1)
1Up-boundSolar maximum period19.848′42″34.678.7
2Down-boundSolar maximum period16.548′56″34.277.6
3Up-boundNight operations regime15.447′49″35.179.8
4Down-boundNight operations regime17.646′55″35.477.2
Table 4. Detection results.
Time/(ms)20406080100120140160180200
Temperature/(K)5286571259356163642166316884695472157492
Disclaimer/Publisher’s Note: The statements, opinions and data contained in all publications are solely those of the individual author(s) and contributor(s) and not of MDPI and/or the editor(s). MDPI and/or the editor(s) disclaim responsibility for any injury to people or property resulting from any ideas, methods, instructions or products referred to in the content.