Article

Characterization and Evaluation of Agar as a Bio-Based Asphalt Binder Alternative

by
Melissa R. Frey
1,
Sarah L. Williams
1,
Wil V. Srubar III
1,2 and
Cristina Torres-Machi
1,*
1
Department of Civil, Environmental, and Architectural Engineering, University of Colorado Boulder, Boulder, CO 80309, USA
2
Materials Science and Engineering Program, University of Colorado Boulder, Boulder, CO 80309, USA
*
Author to whom correspondence should be addressed.
Infrastructures 2025, 10(9), 223; https://doi.org/10.3390/infrastructures10090223
Submission received: 14 July 2025 / Revised: 11 August 2025 / Accepted: 14 August 2025 / Published: 22 August 2025
(This article belongs to the Special Issue Sustainable and Digital Transformation of Road Infrastructures)

Abstract

Over 90% of roads in the United States are surfaced with asphaltic materials that use petroleum-based asphalt binders, a material with high negative environmental impacts and costs. Biopolymers are a sustainable alternative, as they are sourced from renewable materials and offer the potential to reduce carbon footprint. However, their performance and durability in construction applications remain insufficiently understood. This study analyzes the potential of agar, a biopolymer extracted from red seaweed, to serve as a direct and sustainable replacement for asphalt binders. The study characterizes the rheological properties and durability of agar-based binders and the mechanical and microstructural properties of composites. The study found that agar-based binders exhibited resistance to fungal deterioration, adequate stiffness to resist rutting at temperatures up to 80 °C, and potential for energy efficiencies associated with lower mixing and compacting temperatures. Results indicate that agar-based composites illustrate many properties in line with those of traditional engineering materials. Overall, these results suggest that agar-based materials exhibit promising fresh-state and biodeterioration resistance properties to serve as a sustainable alternative to traditional, petroleum-based asphalt binders.

1. Introduction

Within the built environment, petroleum acts as the primary material source for a vast spectrum of materials, including plastics such as polyvinyl chloride and high-density polyethylene, adhesives (e.g., polyurethane, epoxies, poly(vinyl acetate), silicones), and binders used for asphalt for roadways, roofing, coatings, and waterproofing. Over 90% of the roads in the United States are surfaced with asphaltic materials comprising aggregate and a petroleum-based binder [1]. The sourcing and widespread use of non-renewable petroleum-based materials is problematic in multiple facets. The accelerated depletion of non-renewable crude oil has led to limited material availability, with the literature estimating that current petroleum reserves will only last for approximately 46 more years [2]. Petroleum-based materials are also associated with negative environmental impacts due to petroleum sourcing, refining, and manufacturing.
With continued shifts toward more sustainable practices, the construction industry has begun investigating bio-based asphalt binders created from renewable biomass sources. Bio-oils have been produced from various organic materials, including swine manure [3] and oils from waste cooking, vegetables and wood [4,5]. These studies, however, have mainly focused on modifying traditional asphalt binders (i.e., <10% replacement). To meet the global environmental need for sustainable and resilient construction materials, the transportation industry must begin to shift to direct alternatives (i.e., 100% replacement) for petroleum-based materials.
One algae-derived biopolymer that may be well suited as an alternative material for asphalt binder is agar. Agar is a linear polysaccharide composed of agarose and agaropectin extracted from red seaweed belonging to the Rhodophyceae class. Agar gels form via hydrogen bonding between agarose molecules, resulting in a transparent, thermoreversible material that exhibits hysteresis, gelling at temperatures between 38 and 45 °C and melting between 85 and 90 °C [6].
Agar has been investigated as a stabilizing material to improve the engineering properties of geotechnical materials. Smitha et al. [7] investigated the behavior of silty sand treated with 0.5, 1, and 2% agar biopolymer at multiple curing time periods and noted a significant increase in cohesion with an increase in biopolymer content and curing time. Chang et al. [8] evaluated the use of agar and gellan gum biopolymer with both clayey and sandy soil and noted significant improvements in composite compressive strength as compared to unmodified soil samples. Authors note that this is due to the ability of the biopolymers to coat aggregate surfaces, fill pore spaces, and improve particle to particle contact. Khatami and O’Kelly [9] evaluated sand combined with 1, 2, and 4% agar by weight and noted an increase in compressive strength from 150 kPa to approximately 500 kPa. Work completed by Fatehi et al. [10] evaluated agar biopolymer combined with both sand and soil and found that biopolymer use can improve the compressive strength by 115%. Verma et al. [11] evaluated the use of xanthan gum and agar to stabilize municipal solid waste fines and noted that agar produced a denser profile than xanthan gum and produced better mechanical performance. Kantesaria et al. [12] investigated the use of 2% agar in expansive soil. In SEM testing, agar biopolymers coated soil particles and connected aggregate that was not initially in contact.
Although biopolymers like agar are promising material alternatives for petroleum-based materials, they are largely underutilized in civil engineering applications due to uncertainty regarding long term performance and durability [13]. Additionally, there is a lack of systematic methodology available for predicting performance, reporting material characteristics, and ultimately incorporating biopolymer materials into pavement design [14].
The objective of this work is to study the suitability of high concentration agar gels as a direct replacement material for traditional petroleum-based materials used in the construction industry. To achieve this goal, this research follows a three-step approach. First, this study used technical testing standards of asphalt to measure the rheological properties of agar-based binder samples. Second, the study analyzed the durability of agar as an alternative binder. Finally, we evaluated the microstructure and mechanical properties of agar-based composites for use in pavement structures.

2. Materials and Methods

Agar powder, reagent-grade limestone (calcium carbonate, CaCO3) with a particle size < 250 μm, lab-grade glycerol, and Ottawa sand were supplied by Sigma Aldrich (St. Louis, MO, USA), Research Products International (Mt Prospect, IL, USA), Fisher Scientific (Waltham, MA, USA), and Gilson (Middleton, WI, USA), respectively. Fungal cultures were supplied by the American Type Culture Collection (ATCC, Manassas, VA, USA).
The aggregate used in agar-based composites mixtures was supplied by the Colorado Department of Transportation (CDOT). This aggregate was chosen for this analysis because it represents a commonly used and accepted aggregate for civil engineering applications. This aggregate was collected as a “belt cut” from a Coloradan asphalt manufacturing plant. In this sampling method, the aggregate was collected randomly from the conveyer belt of an asphalt plant prior to being mixed with any asphalt binder [15].
Table 1 summarizes the methods used to characterize: (i) the rheological properties and (ii) durability of agar-based binder samples; and (iii) the microstructure and mechanical properties of agar-based composites.

2.1. Sample Preparation

Two sets of samples were prepared for this study. One set of 12 samples, described below as “binder testing samples”, were used to characterize the rheological properties and durability of agar-based binder. This testing informed the design of the experimental plan used to characterize the mechanical and microstructural characterization of agar-based composites. This plan, referred to as “composite testing samples”, explored eight different sample types. The characteristics of each of these sets are described below. Several replicates were tested for each sample type, as described in each of the methods used and the results section.

2.1.1. Binder Testing Samples

A total of twelve samples were prepared to characterize the rheological properties and durability of agar-based binder (Table 2). The number of replicates used in each of the tests is specified in the test description and results section.
Samples were prepared at three agar concentrations (i.e., 5, 7.5, and 10% w/w relative to deionized water) without and with glycerol and without and with limestone additives. As these are relatively high agar concentrations and agar materials have a high degree of crystallinity and rigidity [16], glycerol was investigated due to reported plasticizing effects on agar [17]. In order to increase the dimensional stability of agar-based materials, ground limestone was investigated as a filler material. Limestone was explored as a filler material because it is widely available and already utilized in the construction industry (i.e., crushed for use as a subbase material, ground for use as a raw material in cement production).
A subset of samples contained glycerol (40% w/w of agar), limestone (15% w/w), or both glycerol and limestone, resulting in a total of twelve samples. Mixture formulations are summarized in Table 2. The sample naming convention is the letter A (for agar) followed by the %w/w agar-to-water concentration. Sample additives are denoted by a C (for control formulations without glycerol or limestone), G (for glycerol), and L (for limestone). For example, sample A7.5-GL indicates a 7.5% agar-to-water concentration with glycerol and ground limestone.
To prepare samples, 200 mL of deionized water was added to 500 mL media bottles. The appropriate amount of agar powder (i.e., 10, 15, or 20 g) was dissolved at ambient laboratory conditions (22 ± 2 °C) under continuous agitation using a magnetic stir bar. The appropriate amount of glycerol or limestone was then added and the sample was agitated until all constituent materials were well dispersed. The media bottles were then placed in an SK101C Yamato autoclave (Santa Clara, CA, USA) and heated to 100 °C for 20 min. After autoclaving, individual media bottles were placed in a heated water bath at 90 ± 5 °C until sample molding or testing.

2.1.2. Composite Testing Samples

The properties of composites were evaluated in samples comprising 5% w/w agar combined with a typical aggregate mixture specified for use in Coloradan pavement materials. The amount of agar (i.e., 5% w/w agar) used in composite testing was informed by the results obtained in the binder testing. Composite properties were evaluated at two binder ratios (i.e., mass ratios of 0.2 and 0.5) with and without two filler materials (i.e., limestone powder, Ottawa sand). This resulted in a total set of eight composite sample types.
Table 3 outlines the composite formulations of these eight samples, designed by mass ratios. The mass ratio of graded aggregate and reinforcing materials (i.e., cumulative mass of aggregate, limestone, and Ottawa sand) was kept constant at a ratio of 1.0 for all composites to maintain overall sample ratios and allow for better comparability between sample types. Sample subsets reinforced with limestone or sand fillers were prepared at constant mass ratios of 0.05 and 0.2, respectively, and the mass ratio of graded aggregate varied from 0.75 to 1.0. Composites were prepared at two mass ratios of 5% w/w agar binder, namely 0.2 and 0.5. The sample naming convention is as follows: C for control samples (i.e., formulations with only aggregate), L for limestone-containing samples, S for Ottawa sand-containing samples, and LS for limestone- and Ottawa sand-containing samples. The letter designation is followed by the mass ratio of agar binder (i.e., 0.2 or 0.5).
After autoclaving, the media bottles were removed and the appropriate amount of gelled agar was weighed out to reflect the mass ratios (i.e., 0.2 or 0.5) outlined in Composites prepared with limestone or Ottawa sand filler were mixed by hand into the agar for approximately 1 min until filler materials were well dispersed. The appropriate amount of aggregate (i.e., 0.75, 0.80, 0.95, or 1.0 mass ratio) was weighed and mixed with agar-based materials in Hobart mechanical mixer for approximately 1 min. Sample mixtures were compacted into 2 inches cube molds in three layers and tamped by hand after the addition of each layer. Samples were allowed to gel for approximately 30 min and then removed from molds.
Composites were acclimated at ambient laboratory conditions (i.e., 22 ± 2 °C) until reaching constant mass, defined as less than 1% change in composite mass in a 24 h period. Since the mechanical properties of agar-based composites have been shown to improve with dehydration to a dry state [13], the composites were acclimated to constant mass to replicate the best conditions for loadbearing or structural applications and to ensure all samples were at a consistent, reproducible moisture state.

2.2. Rheological Properties of Agar-Based Binder

Standard asphalt binder testing methods were implemented to compare the engineering properties of agar with those of asphalt. This methodological approach was chosen to allow for direct comparison to a reference petroleum-based material used in civil engineering applications. Rotational viscosity (RV), dynamic shear rheometry (DSR), and penetration testing were conducted on agar-based materials. RV and DSR results were subsequently compared to performance-grade (PG) specifications [18] and penetration results were compared to penetration-grade specifications [19].

2.2.1. Rotational Viscosity

The rotational viscosity (RV) of fresh-state agar-based materials was measured according to a modified ASTM D4402 procedure [20]. The procedure was modified by using a rotational rheometer instead of a Brookfield viscometer and lowering the testing temperature from 135 °C to 80 °C. The performance-grade (PG) specification [18] utilizes an RV testing temperature of 135 °C to mimic the conditions of asphalt during construction. However, prolonged incubation of fresh-state agar at temperatures above 80 °C has been shown to impact structural and mechanical properties of agar gels [21]. Thus, RV was measured at 80 °C in order to represent agar temperature compatibility and preparation temperatures more accurately.
Fresh-state samples were immediately loaded into an MCR 301 rotational rheometer (Anton Paar, Graz, Austria) with 25 mm diameter stainless steel parallel plate geometry and a sample gap of 1.0 mm. The top plate was cross-hatched to minimize slip. After equilibration at 80 °C for 15 min, a constant shear rate of 20 s−1 was applied for 3 min. Three consecutive RV measurements were recorded at 1 min intervals for each sample. These data were averaged to yield final reportable RV values. Each sample was tested in triplicate.
The RV of asphalt binders is typically characterized to predict the workability at specific handling, mixing, and application temperatures to ensure that the mixtures can be properly mixed and compacted to the required pavement density and smoothness [20]. To this end, asphalt mixtures with inadequate workability are often difficult to compact properly, resulting in a lower pavement strength, higher air void content, reduced moisture resistance [22], and loss of service life [23]. Results were compared to PG specifications that require a RV < 3 Pa·s [18].

2.2.2. Dynamic Shear Rheometry

A dynamic shear rheometer (DSR) was used to determine the high-temperature rheological properties and rutting behavior of agar-based materials. The complex modulus (G*), phase angle (δ), and rutting factor were determined using an MCR 301 rotational rheometer (Anton Paar, Graz, Austria) with 25 mm diameter stainless steel parallel plates. The rutting factor was calculated at various testing temperatures as denoted in Equation (1). The units of the rutting factor will be given by G*, which in the case of this study was measured in kPa.
R u t t i n g   F a c t o r = G s i n ( δ )
Cross-hatched top and bottom plates were used to minimize slip. The testing temperature ranged from 10 to 80 °C using a heating rate of 2 °C/min.
Freshly prepared agar samples were poured into 55 mm diameter molds to create disk-shaped samples with a depth of approximately 5 mm. After gelling for 30 min at ambient laboratory conditions (22 ± 2 °C), samples measuring 25 mm in diameter and 1 mm in thickness were taken from the center for testing. Beginning at the lowest testing temperature (i.e., 10 °C), samples were acclimated at the testing temperature for 20 min and then subjected to oscillatory shear flow at 12% strain amplitude and a rotational frequency of 10 rad/s. These parameters were chosen in order to reflect standard unaged asphalt binder rheological testing protocol (i.e., ASTM D7175) [24]. A constant axial force of 0.5 N was applied to account for thermal expansion and contraction. Each sample was tested in duplicate.
To compare the performance of agar-based samples with traditional asphalt binders, the rutting factor obtained from the DSR testing was compared with the requirements in asphalt performance-grade specifications [18]. The rutting factor, calculated from the complex modulus (G*) and the lower phase angle (δ) (i.e., G*/sin(δ)), measures the ability of binders to be both stiff and elastic to maintain shape and recover in response to repeated traffic loading [25]. A higher complex modulus (G*) and a lower phase angle (δ) are advantageous, resulting in the maximization of the rutting factor. To ensure adequate rutting performance, specifications [18] require the rutting factor to exceed 1.00 kPa at the upper pavement design temperature for unaged binders. Agar-based materials were compared to this specification.

2.2.3. Penetration

Penetration was determined according to ASTM D5 [26] using a Universal Penetrometer (Humboldt, Elgin, IL, USA). Fresh samples were poured into seamless tin cups measuring 80 mm in diameter and 50 mm in depth, covered, and stored for less than 24 h in refrigeration at 4 ± 2 °C until testing in order to prevent desiccation. Samples were then submerged in a 25 °C water bath for 30 min prior to testing, and they remained immersed in 25 °C deionized water for the duration of testing to ensure temperature stability. Results were compared to penetration grading standards (ASTM D946), which specify acceptable penetration grades in bins that range from 40 to 300 for unaged asphalt binders [19]. Triplicate penetration readings were collected for each sample.
Penetration is a measurement of binder consistency, and lower penetration values typically correspond to stiffer material behavior while higher penetration values typically correspond to softer material behavior [19]. Traditional asphalt binders with softer consistency characterized by high penetration values (i.e., 200 to 300) are typically used in cold climates to combat pavement cracking. Conversely, binders with low penetration (i.e., stiffer consistency) are typically used in warmer climates where a binder is expected to resist permanent deformation at high temperatures [27].

2.3. Durability of Agar-Based Binder

Durability was evaluated in terms of thermal stability (i.e., thermogravimetric analysis), fungal biodeterioration, and moisture sorption characteristics. These durability metrics were chosen based on the common limitations of biopolymers and bio-based materials noted in the literature. Thermal, moisture, and biodeterioration durability are some of the leading durability concerns that impose challenges in accepting and implementing bio-based materials in widespread industrial applications [28]. Relatedly, the undesirable hydrophilic behavior of biopolymers can provide pathways of moisture for the introduction of harmful microorganisms leading to biodeterioration [28]. The aforementioned mechanisms can negatively impact the appearance and mechanical properties of bio-based materials as well as impact human health and the service life of built infrastructure these materials are integrated into.

2.3.1. Thermogravimetric Analysis

Thermogravimetric analysis (TGA) was performed with a TA Discovery 5500 (TA Instruments, New Castle, DE, USA). Agar samples were poured into 55 mm diameter molds to create disk-shaped samples with a depth of approximately 10 mm. After gelling for 30 min at ambient laboratory conditions (22 ± 2 °C), samples were placed in incubation at 30 °C until samples reached constant mass (i.e., <1% change in mass in 1 h). A 10–20 mg sample was collected from the center of the dehydrated agar sample and placed in a platinum pan. Testing was conducted using continuous nitrogen gas flow at a rate of 10 mL/min. Samples were acclimated at 30 °C and then heated to 950 °C using a heating rate of 10 °C/min. The temperature and sample weight loss were recorded for analysis. Each sample was tested in duplicate.

2.3.2. Fungal Biodeterioration

Resistance to fungal biodeterioration was determined according to ASTM G21 [29]. The following fungal strains were used to create the testing spore solution at a concentration of 1,000,000 ± 200,000 spores/mL: Aspergillus brasiliensis (ATCC 9642), Penicillium funiculosum (ATCC 11797), Chaetomium globosum (ATCC 6205), Trichoderma virens (ATCC 9645), and Aureobasidium pullulans (ATCC 15233).
Nutrient-salt agar solutions were prepared according to ASTM G21. Solutions were poured into sterile Petri dishes measuring 150 mm in diameter and 15 mm in depth and allowed to gel. Agar samples to be tested for fungal resistance (summarized in Table 2) were poured into 55 mm diameter sample molds to create disk-shaped samples with a depth of approximately 10 mm. Samples were allowed to gel for approximately 30 min at ambient conditions (22 ± 2 °C) and then placed on the top surface of the nutrient-salts agar plates. Each nutrient-salts agar and agar test sample were inoculated by spreading a spore solution over the entire exposed surface with a sterile cell spreader. A negative control (i.e., blank nutrient-salts agar plates without a sample, denoted B-) and a positive control (i.e., nutrient-salts agar plates with sterilized cellulose paper, denoted C+) were also prepared to validate the experiment. Samples were sealed with parafilm and incubated at 30 °C for 28 days. Photos and observations were recorded every 7 days.
Biodegradation is a biochemical process where microorganisms metabolically degrade complex materials into natural compounds such as water, CO2, and biomass. The ASTM G21 [29] procedure is designed to provide an environment where heterotrophic microorganisms are provided with all the necessary components for growth (e.g., moisture, salts, minerals) except for excess organic carbon. At the end of the 28-day testing period, samples were visually examined and evaluated by using a rating of 0–4 based on the percentage of sample area covered in fungal growth. This rating system is shown in Table 4. All samples were tested in triplicate.

2.3.3. Moisture Sorption

The moisture sorption properties of agar-based materials were determined according to a modified ASTM D570 procedure [30]. The procedure was modified minimally by lowering the conditioning temperature from 50 °C to 30 °C. Fresh agar samples were poured into 55 mm diameter molds to create disk-shaped samples with a depth of approximately 10 mm. After gelling for 30 min at ambient laboratory conditions, samples were weighed to determine the fresh sample mass and then conditioned in incubation at 30 °C until reaching constant mass, defined as <1% decrease in mass in a 24 h period.
Moisture sorption testing was conducted in 20 ± 2 °C distilled water. At various intervals, samples were removed from the distilled water, the surface moisture was removed, and the mass of each sample was recorded. Sample masses were recorded every 24 h until the sample reached constant mass. The moisture content was calculated according to:
M o i s t u r e   C o n t e n t   % = m i m c   m c · 100 %
where mi is the incremental sample mass and mc is the conditioned sample mass.
After reaching constant mass in immersion testing, samples were reconditioned in incubation at 30 °C until again reaching constant mass, cooled for approximately 1 h, and reweighed. The percentage of matter lost, MLoss, during immersion was calculated for each sample according to:
M L o s s   % = m c m r c m c · 100 %
where mrc is the sample mass after reconditioning. Each sample was tested in triplicate.

2.4. Mechanical and Microstructural Characterization of Agar-Based Composites

This work investigates the properties of composites comprising 5% w/w agar combined with a typical aggregate mixture specified for use in Coloradan pavement materials. The microstructure (i.e., porosity, pore network characteristics) of agar-based composites were evaluated by non-destructive X-ray tomography testing, a procedure used by other researchers to investigate composites in pavement applications [31,32]. Mechanical properties were evaluated through unconfined compressive strength testing and data was further processed to obtain sample stress–strain curves and calculate the modulus of elasticity and resilience. Results are compared to traditional engineering materials and other bio-based composites in the literature.

2.4.1. X-Ray Tomography

The porosity of agar-based materials was not evaluated using typical water displacement methods (i.e., ASTM D7063 [33], ASTM C642 [34]) due to the hydrophilicity of agar-based materials that could alter the sample properties. X-ray tomography was chosen as a non-destructive alternative to evaluate the aggregate packing structure and sample porosity. Three-dimensional visualization of the internal structure of agar-based composites was obtained through X-ray tomography testing using a ZEISS Xradia 520 Versa system (ZEISS, Jena, Germany). The source voltage was set to 140 kV and the power to 10 W. An optical magnification of 0.4× and an HE3 filter were used to produce images. Agar-based composites prepared for X-ray tomography analysis are shown in Figure 1.
X-ray tomography is conducted by projecting a cone beam of X-rays onto a sample and capturing projections on a detector. The sample is mounted between the X-ray source and detector and is rotated throughout testing to create renderings of 2D “slices” of the sample [35]. Upon completion of X-ray tomography testing, 2D slices are “stacked” and processed to create a 3D reconstruction of the sample. The X-ray density captured by the detector is related to the physical density of the sample, as denser objects appear brighter in readings. Due to this premise, X-ray tomography is frequently applied to identify pore spaces in samples and to quantitatively analyze the spatial distribution and size of pores. This method has been applied to cement [36], concrete [37], and asphalt [31,32].
X-ray tomography analysis of pores requires processing to segment images at delineation thresholds. Dragonfly 2022.2 software was used to create 3D reconstructions and segment images of agar-based composites to produce volumetric data. The volume of air voids (i.e., pores) in samples was determined by splitting the image pixel intensity at the Otsu threshold [38] two times. The first split segmented data into dense particles (i.e., aggregate) and less dense components (i.e., binder, filler, and voids). The second split, conducted on the foreground (i.e., other or binder, filler, and voids) segmented data into binder and filler versus pores. The segmentation process is illustrated in Figure 2.
The volume percentage of pores in samples was determined by comparing the volume of segmented air voids against the total sample volume. Segmented sample data were further processed to create volume thickness maps of the pore space in order to analyze the pore sizes and distribution. Volume thickness mapping is an image processing technique based on a sphere fitting method that creates a “map” by identifying the diameter of the largest sphere that can be bounded within the region of interest and assigning distance values with color values [39]. This technique was applied to the region of pores segmented from the internal structure of agar-based composites to provide a colorized map of the internal pore network.
X-ray tomography testing requires the determination of a representative volume element (RVE), namely the minimum volume required for scanning that represents the bulk properties of the sample. In order to understand impacts from sample size scaling, the volumetric porosity was measured from the reconstruction of the entire tested composite (i.e., 50 mm × 50 mm × 25 mm sample) as well as from a smaller internal cross-section sampled from the center of the tested composite (i.e., 25 mm × 25 mm × 15 mm). Volume thickness maps were created based on reconstructions of the smaller internal cross-section.

2.4.2. Unconfined Compressive Strength

The unconfined compressive strength of agar-based composites was obtained using an Instron Universal Testing Machine and a constant axial extension rate of 0.1 mm/s. Prior to compressive strength testing, the average height (i.e., as an average of all 4 sides) and surface area (i.e., top and bottom) were measured using calipers. The compressive strength was calculated by dividing the maximum compressive load by the average sample test area (AAvg). Stress–strain curves were calculated from compressive strength data using the following equations:
S t r e s s   ( σ ) = F A A v g
S t r a i n   ε = Δ L L 0
where F represents the compressive force applied during testing (kN in this study), L0 represents the average height of the sample prior to testing (m in this study), and ΔL represents the change in sample length during testing in the linear elastic regime.

2.4.3. Modulus of Elasticity and Resilience

Stress–strain curves derived using Equations (4) and (5) were used to calculate the modulus of resilience (Ur) and modulus of elasticity, or Young’s modulus, (E) for agar-based composites. The modulus of elasticity is a material parameter of stiffness that quantifies the amount of stress a material can withstand per unit of strain before deforming plastically. E can be found by calculating the ratio of stress to strain in the linear elastic portion of the stress–strain curve (i.e., the slope of the linear region) and is quantified as:
E   =   σ / ε
The modulus of resilience (Ur) characterizes the strain-energy per unit volume of a material within the elastic range and quantifies the amount of energy a material can absorb without deforming plastically (i.e., permanently). The term “resilience” is used to indicate the ability of a material to absorb and release the energy in this range [40]. Generally, Ur (measured in J/m3) is defined as the area under the elastic portion of the stress strain curve. For uniaxial stress, this can be quantified according to:
U r =   1 2 σ   ε
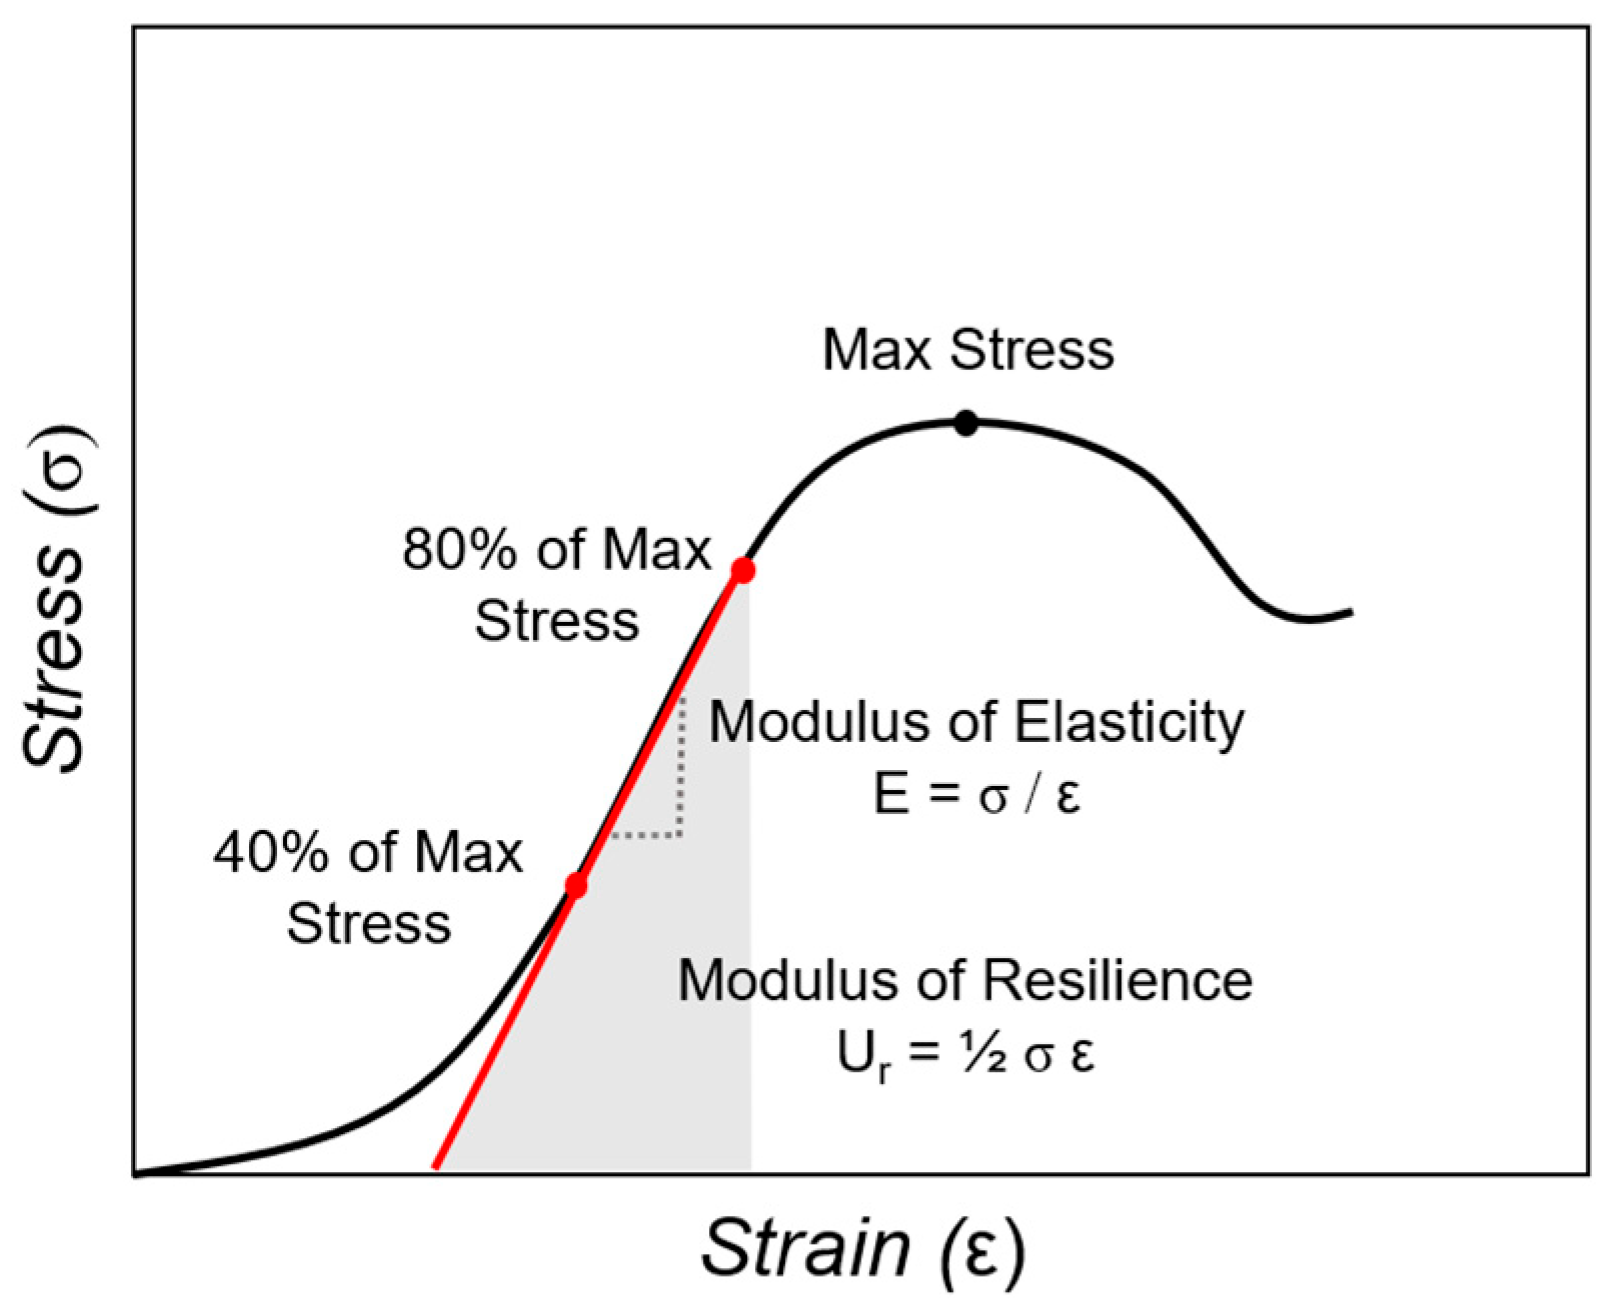
The elastic portion of each stress–strain curve was found by fitting a line through two points: The data point representing 40% of the maximum stress and the elastic limit, defined as 80% of the maximum stress. Using data from a linear fit (red line in Figure 3) corrects for the initial curved portion of the stress–strain curve that forms due to surface irregularities [41]. An illustration of this method is shown in Figure 3, with the modulus of resilience shown in gray.
Mechanical characterization results were analyzed through Scheirer Ray Hare (SRH) statistical techniques using a 95% confidence interval. SRH is a non-parametric equivalent of two-way ANOVA. This statistical methodology was chosen because the assumptions of parametric testing through ANOVA could not be met (i.e., normality). The two factors considered were (i) binder content (i.e., 0.2 or 0.5) and (ii) aggregate and reinforcement material composition (i.e., control, limestone-reinforced, sand-reinforced, or limestone- and sand-reinforced). Sample data determined to be statistically significant (i.e., p value ≤ 0.05) were further analyzed in post hoc testing to highlight statistically significant pairwise comparisons. A Dunn’s multiple comparison test was applied post hoc to compare pairwise differences.

3. Results and Discussion

3.1. Rheological Properties of Agar-Based Binder

3.1.1. Rotational Viscosity

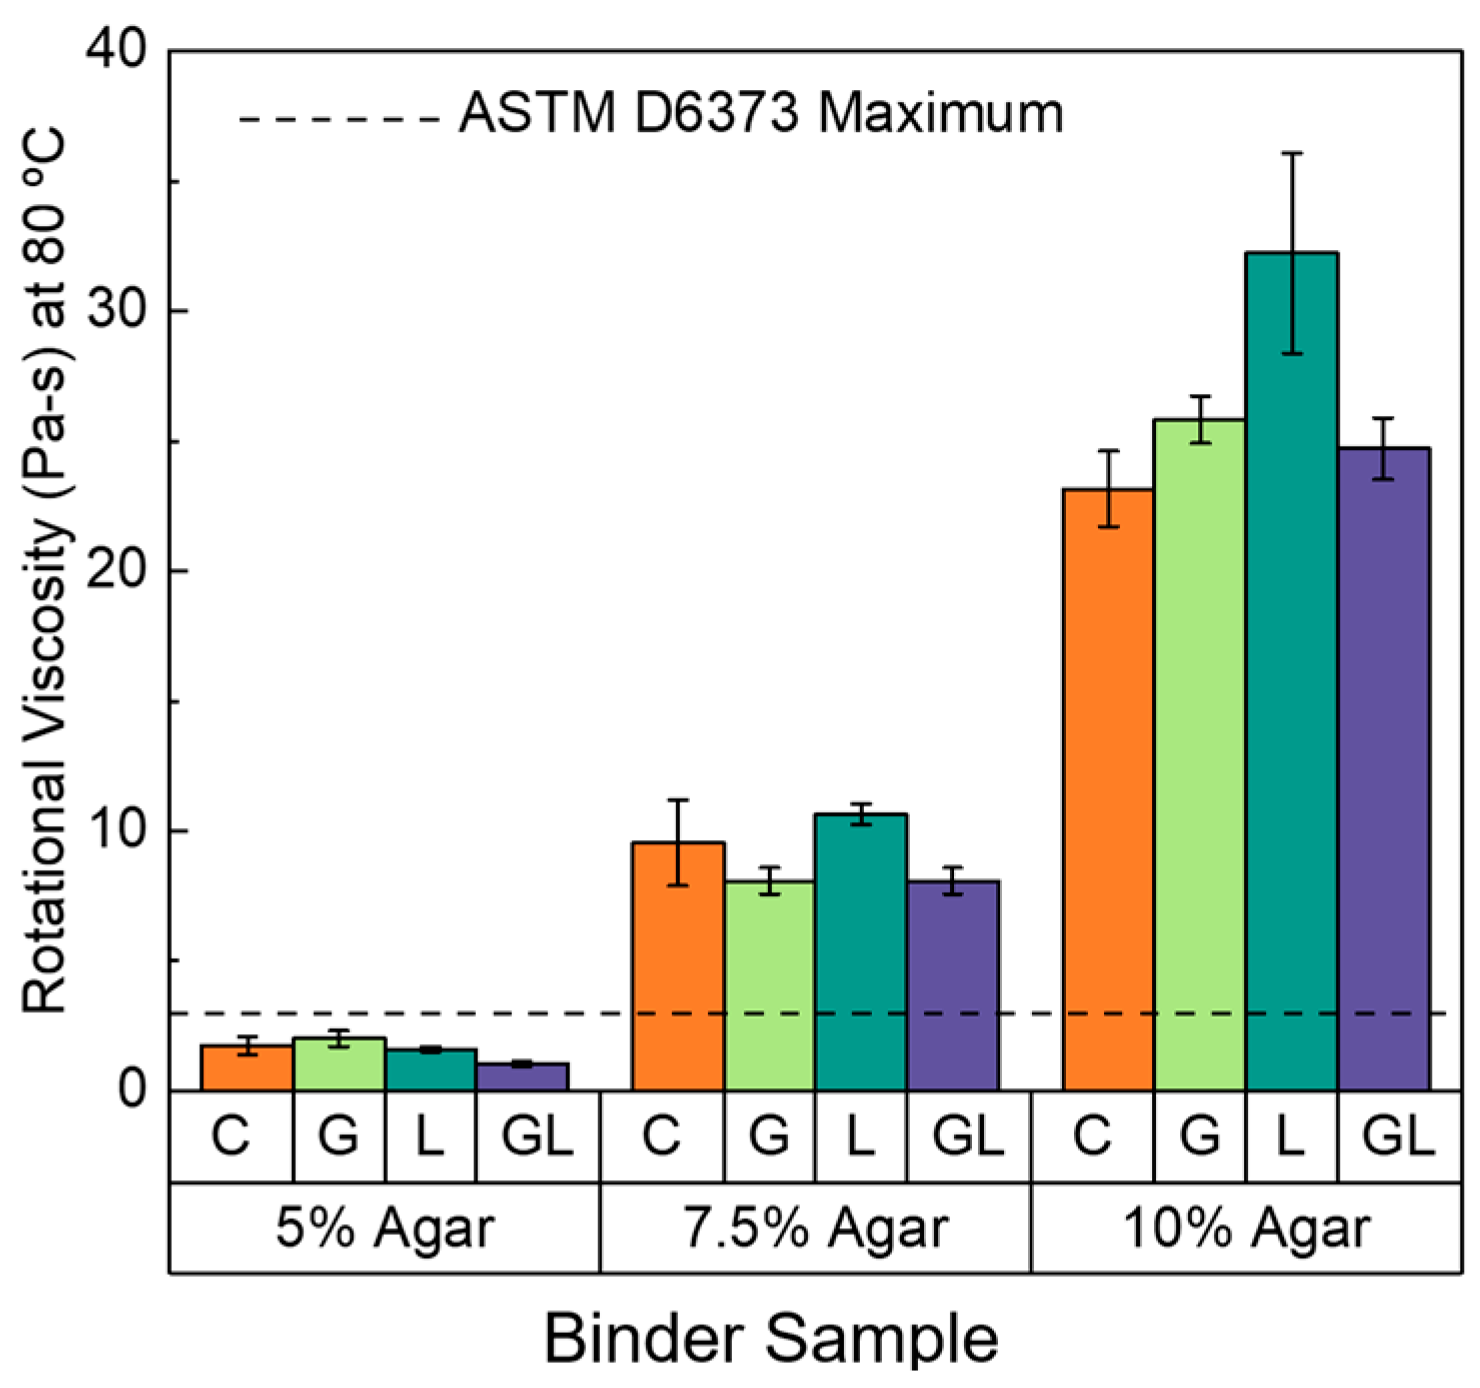
The results of rotational viscosity (RV) measurements for the agar-based materials are displayed in Figure 4. The PG specification [18] dictates an RV threshold of <3 Pa·s for asphalt binders, represented by a dashed line in. The RV of A5, A7.5, and A10 samples ranged from 1.03 to 2.01 Pa·s, 8.08 to 10.64 Pa·s, and 23.16 to 32.23 Pa·s, respectively. All A5 agar-based materials passed RV standards set by the PG specification for asphaltic binders, while all A7.5 and A10 agar-based materials exceeded current RV standards. Typically, higher RV asphalt binders are used in warmer climatic regions and lower RV binders are used in colder climatic regions [25].
Results obtained in this study suggest that agar-based materials, if used in flexible pavement applications, may be better suited for warm-climate applications where a stiff material response is beneficial. However, workability of an asphalt mix is not merely a function of asphalt binder RV. Additional factors such as binder lubricity and the type, shape, texture, gradation, and porosity of aggregate in a mixture have been shown to greatly influence the workability of an asphalt mixture [42].
As expected, RV of agar-based materials increased as the agar concentration increased. Similar trends in increasing viscosity of higher-concentration agar were noted in work by Fernandez et al. [43] and Yu et al. [44] using a parallel plate rheometer and a rotational viscometer, respectively. Notably, the inclusion of glycerol (40% w/w of agar) and limestone (15% w/w of agar) additives did not significantly impact the RV of agar-based binders. No significant trend in RV measurements was observed relative to the addition of each additive and the values of the glycerol- and limestone-containing samples are similar to their respective controls.
Glycerol is one of the most widely used plasticizers for biopolymers due to excellent compatibility with biopolymer chain structures [17]. Glycerol molecules occupy intermolecular spaces between biopolymer chains, which in turn decreases attractive intermolecular forces and increases chain mobility [45]. However, it might be possible that a higher addition of glycerol is needed to observe a measurable plasticizing effect in the agar-based binder formulations investigated herein. For example, Yang and Paulson reported that the lowest effective glycerol concentration was 60% w/w for gellan films [46]. As further discussed in the fungal resistance and moisture sorption results, higher amounts of glycerol, however, would likely have a greater negative effect on the ability of agar-based materials to resist fungal biodeterioration and hydrolytic degradation, indicating a trade-off in fresh-state workability performance and long-term durability.
The RV results suggest that applications of agar-based materials would necessitate minor modifications to traditional placement protocol for asphalt binders. Typical hot mix asphalt is mixed at temperatures between 140 and 180 °C before being transported to a construction site, placed, and compacted. The PG specification utilizes an RV testing temperature of 135 °C to mimic the conditions during construction. The lower temperature compatibility (i.e., 80 °C) of agar-based materials indicates the possibility of mixing and compacting agar mixes (i.e., agar-based binders and aggregate) at a lower temperature than typical hot mix asphalt. Implementation of lower placement temperatures corresponds to a reduction in material embodied energy as well as improved environmental safety. A mixing temperature reduction of 40 to 60 °C has been shown to reduce energy consumption of pavement construction by up to 40% [47]. Additionally, a lower placement temperature allows for quicker reopening of newly paved infrastructure to traffic and a longer paving season [48].

3.1.2. Dynamic Shear Rheometry

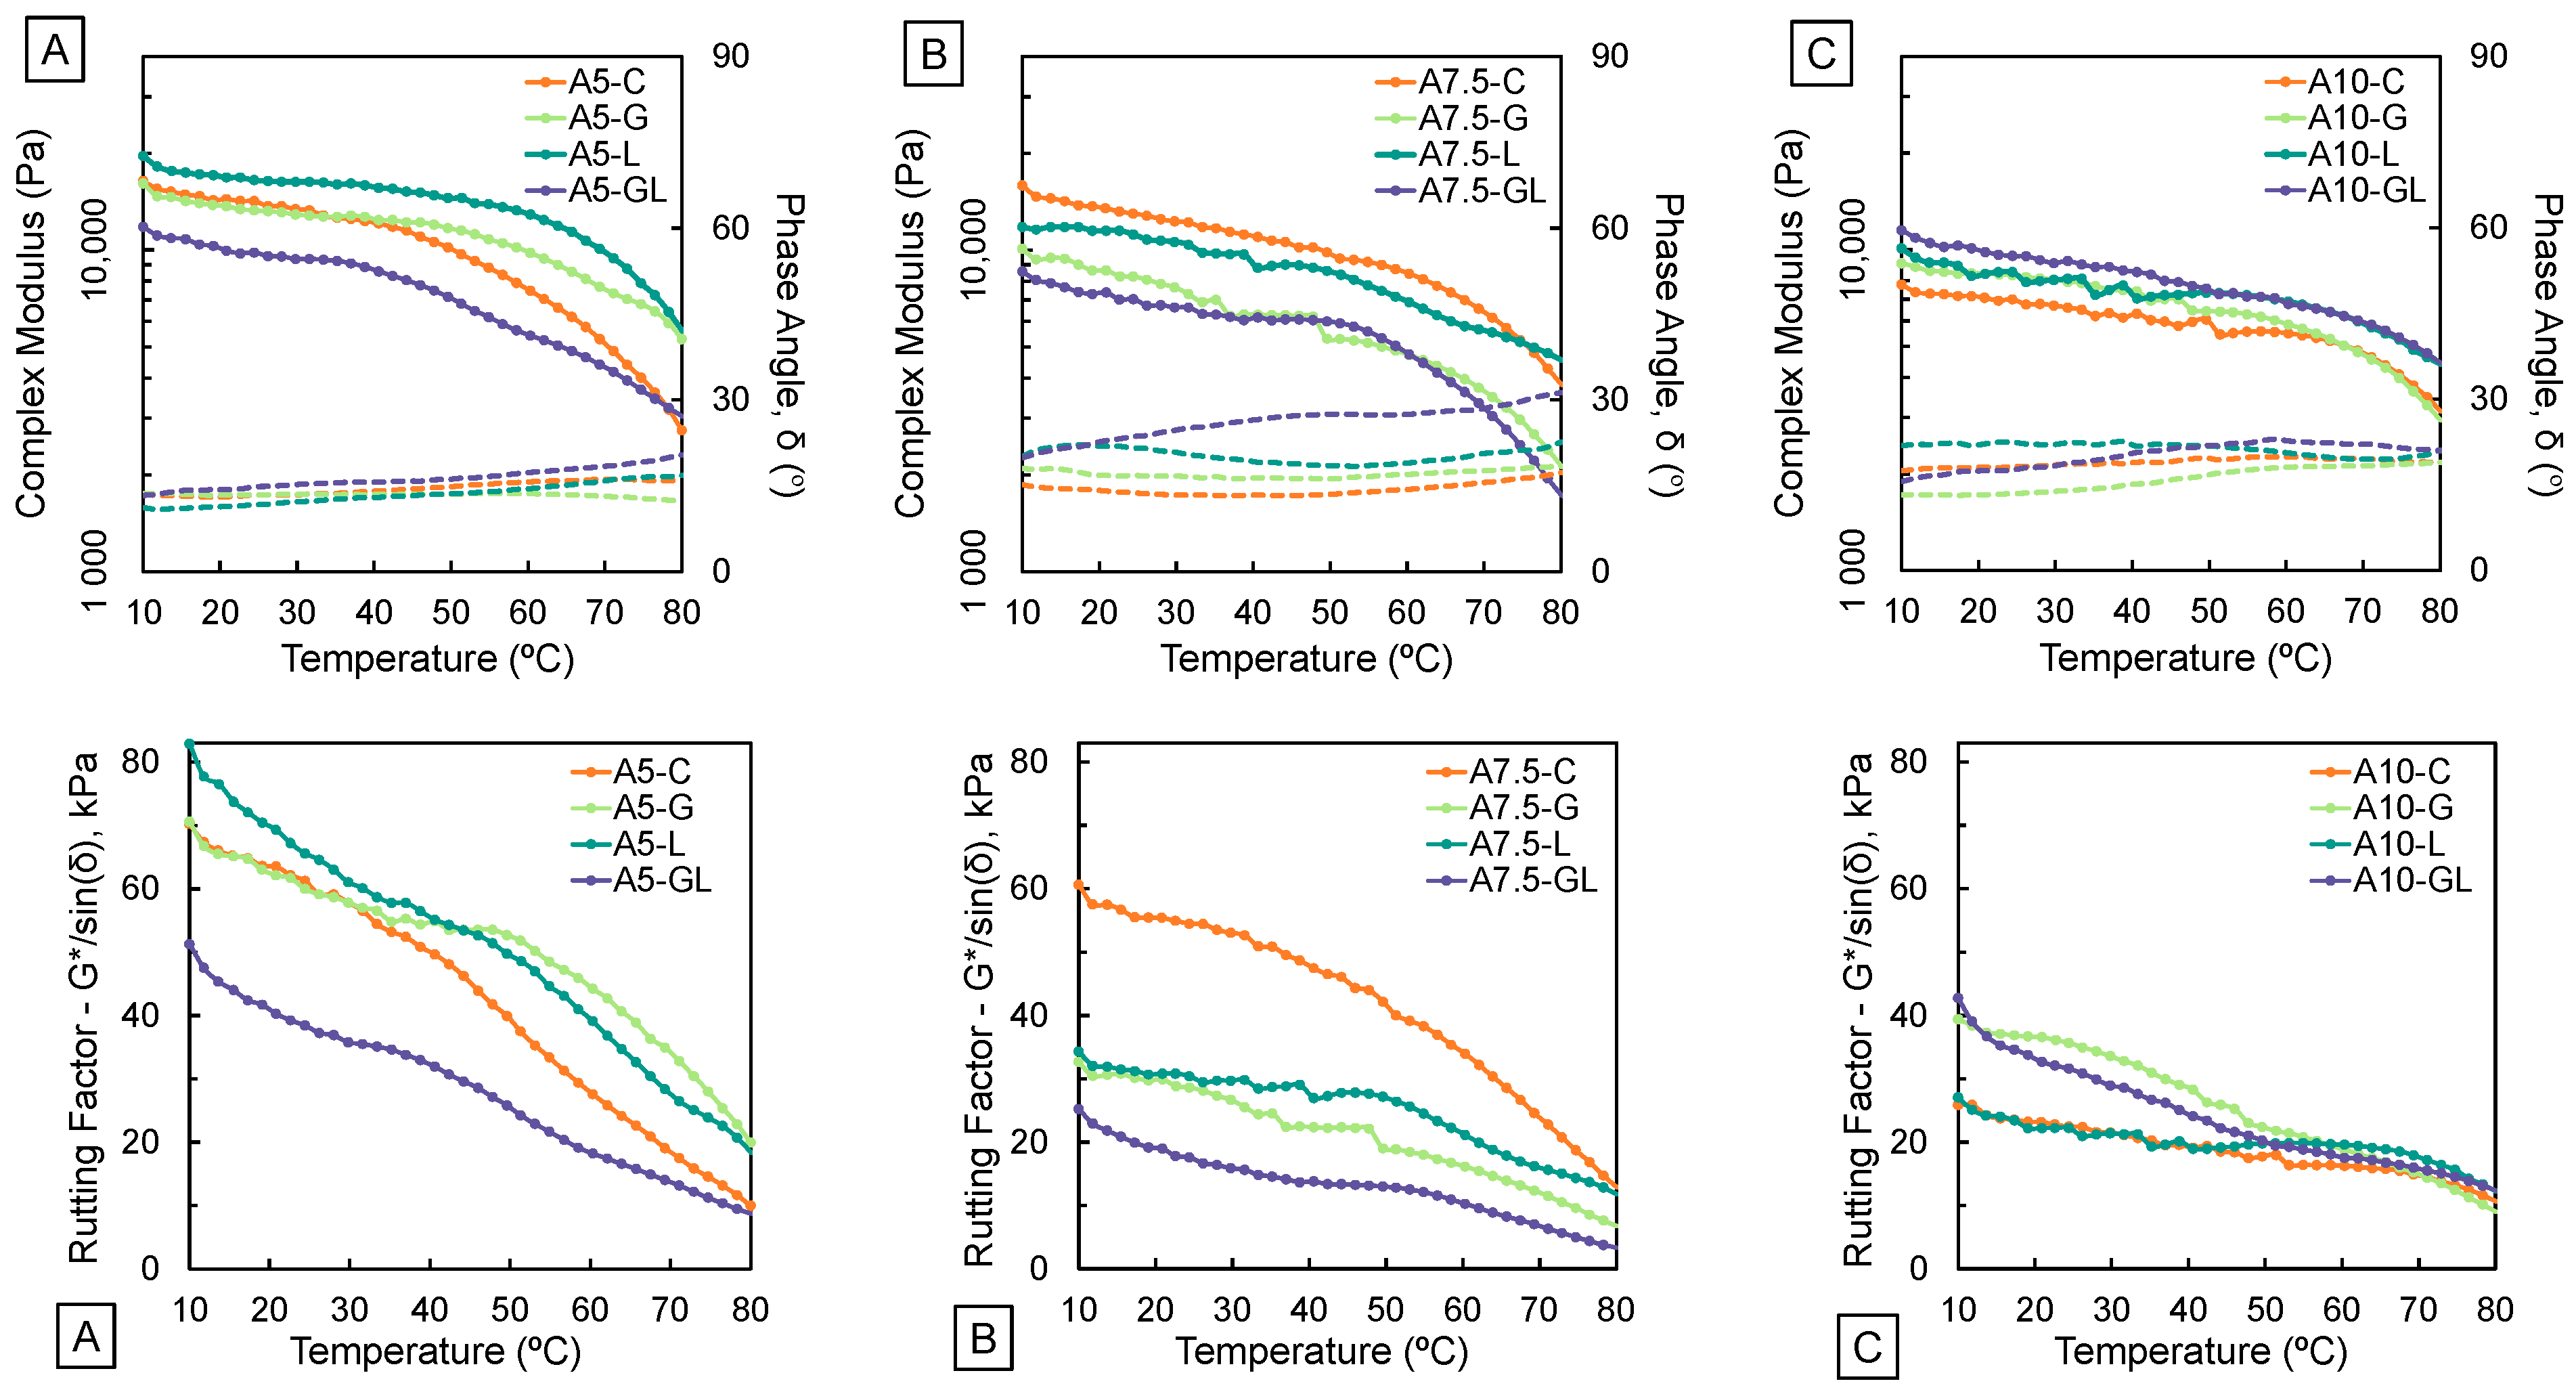
Dynamic shear rheometry (DSR) was performed to determine the complex modulus (G*) and phase angle (δ) for agar-based materials at temperatures ranging from 10 to 80 °C. These results are shown in Figure 5, with solid lines depicting complex modulus values and dotted lines representing phase angles.
Agar-based materials retained high stiffness (i.e., G* > 7000 Pa) at test temperatures and the phase angle was consistently between 15° and 30° for the formulations and temperatures investigated herein. These results align with previous rheological studies on 1% and 1.5% agar and agar blends [49,50]. Agar gels retain strength at high temperatures (i.e., 70–80 °C) analyzed in this study because it is below the temperature necessary (i.e., ~85 to 90 °C) for agar to attain random coil formation to significantly alter the tight 3-D gel network [51].
In general, as the testing temperature increased, the complex moduli decreased while the phase angle increased. Similar behavior has been observed in agar [52] and asphaltic binders [53]. Compared to petroleum-based asphalt binders, agar-based materials exhibited a higher complex modulus and a lower phase angle at PG testing temperatures. The phase angle of petroleum-based asphalt binders is typically between 80 and 90 °C [54] indicating a highly viscous material response. The rheological response of agar-based materials corresponds to stiffer material behavior, which may indicate superior binder resistance to permanent deformation as compared to traditional binders.
Previous work with asphalt mastics has reported an increase in material complex moduli with the use of filler materials like fly ash, stone and brick dust, and mineral fillers [55]. In this work, no significant difference was observed relative to the addition of limestone filler. Similarly to results obtained in rotational viscosity (RV) testing, no significant trend was observed relative to the addition of glycerol or limestone. DSR results for samples with glycerol validate the conclusions of RV data. A greater concentration of glycerol and limestone may be necessary to significantly impact the rheological properties of agar-based materials.
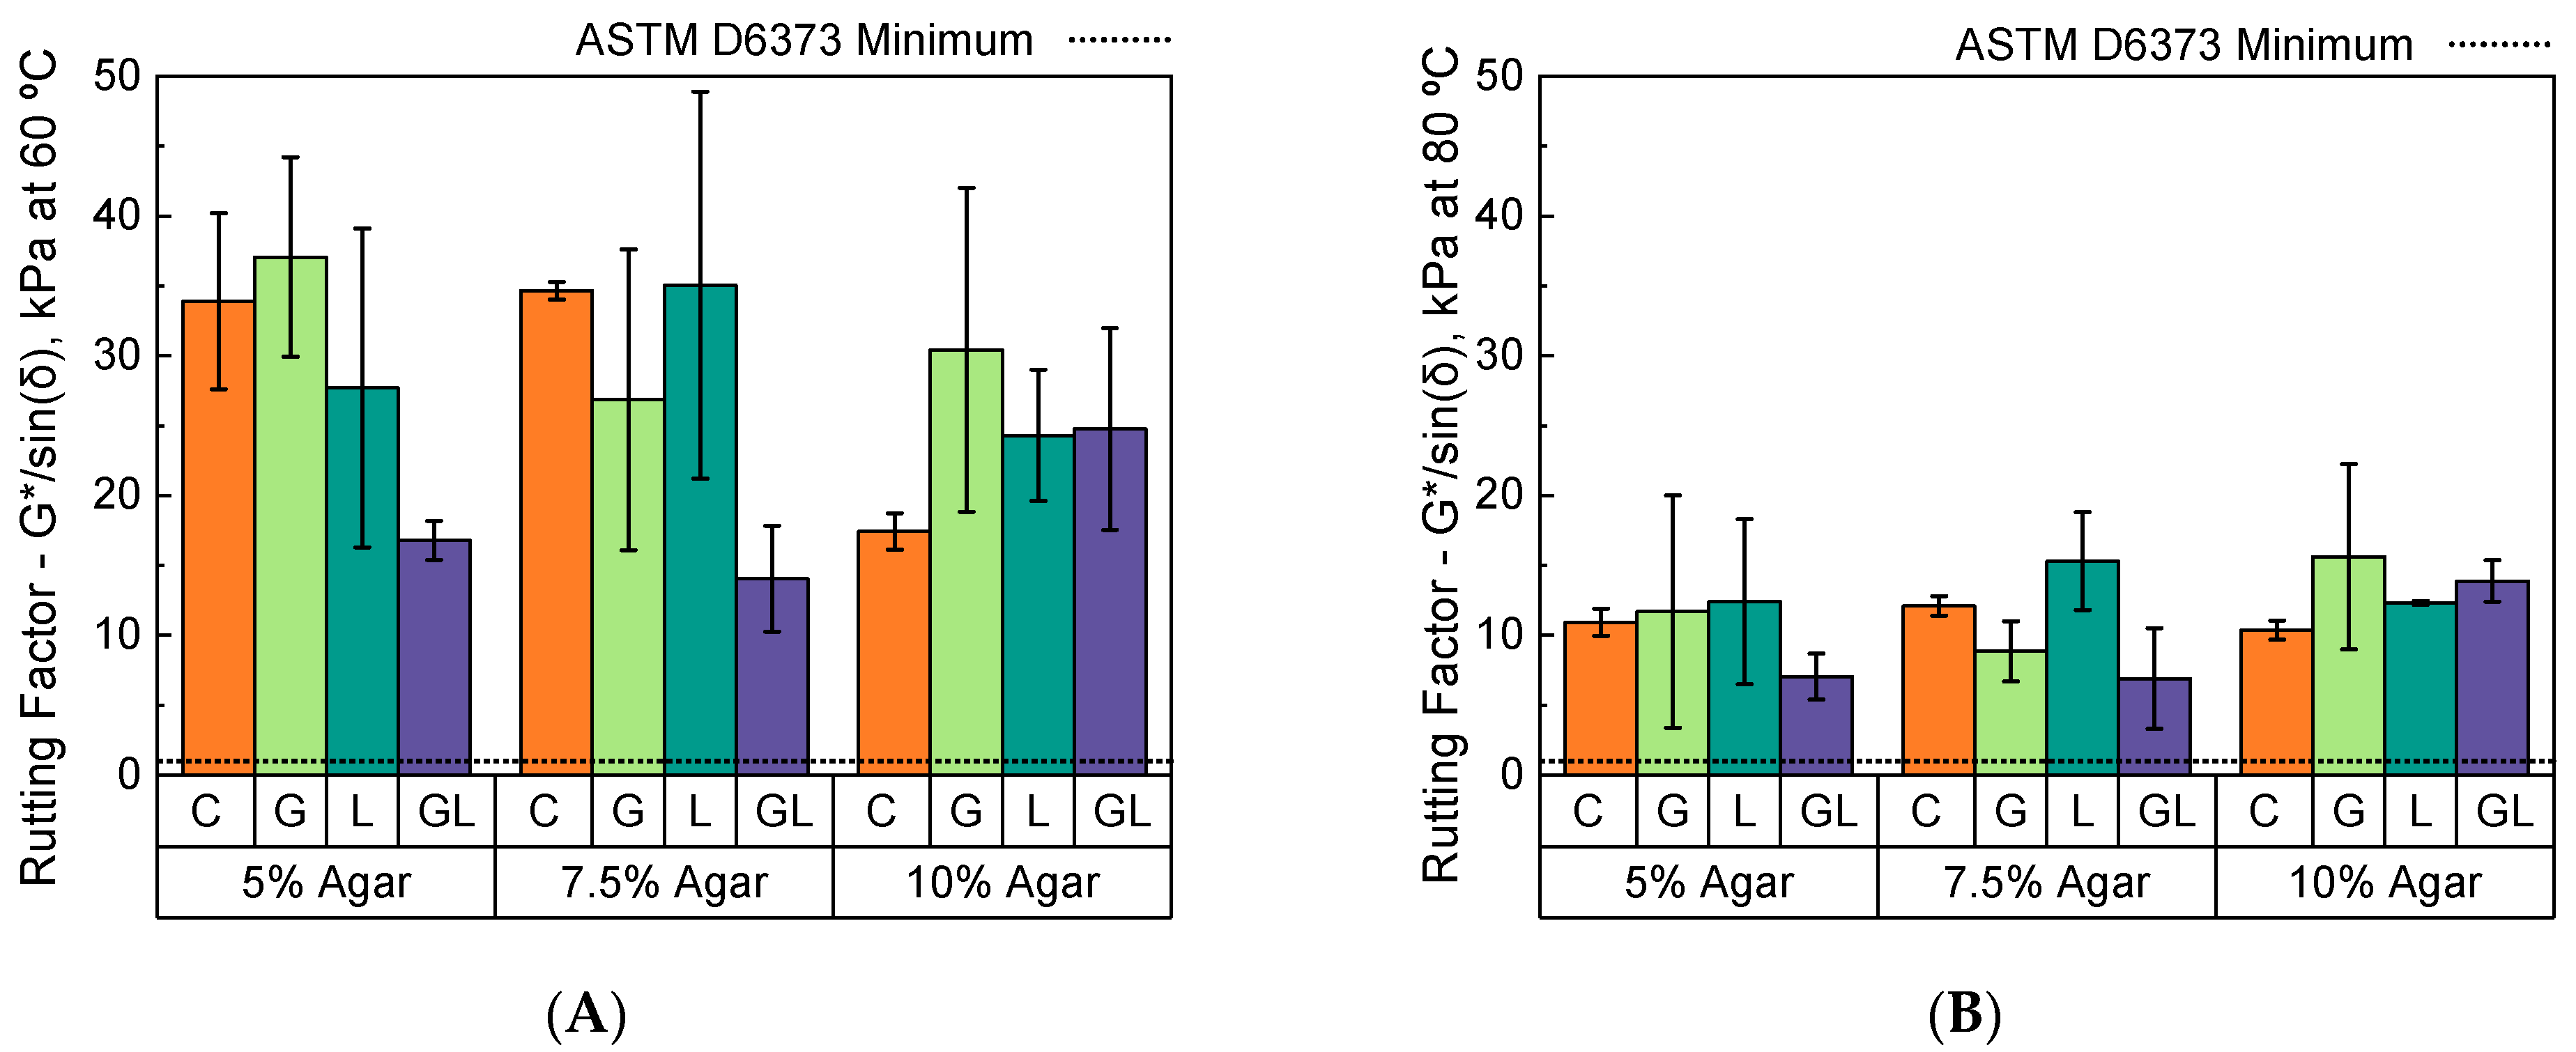
To compare the performance of agar-based samples with traditional asphalt binders, rutting factor results for 60 °C and 80 °C are shown in Figure 6. These temperatures were chosen as they closely resemble common upper pavement design temperatures for high-temperature PG grading (i.e., 58 °C and 82 °C). In the current study, the rutting factor calculated for agar-based binders at 60 °C and 80 °C ranged from 14.0 to 37.1 kPa and 6.9 to 15.6 kPa, respectively. These results suggest that all agar-based binder formulations possessed adequate stiffness to resist early-age rutting at upper pavement design temperatures less than 80 °C. Although these results point towards advantageous early-age rutting properties, the relatively high magnitude of complex moduli and rutting factors exhibited by agar-based binders may also indicate the possibility of low-temperature and fatigue-induced crack propagation.

3.1.3. Penetration

The results from penetration testing of agar-based materials binders are shown in Table 5. All four of the A5 sample formulations (i.e., A5-C, A5-G, A5-L, A5-GL) and both A7.5 sample formulations without limestone (i.e., A7.5-C, A7.5-G) exhibited a penetration greater than 350. Due to limitations based on the geometry of the penetration samples and apparatus, penetration measurements greater than 350 could not be accurately measured. The lowest penetration measurement, 162, was observed in both the A7.5-GL and A10-GL samples. Penetration measurements generally decreased as the agar concentration increased.
The addition of glycerol minimally impacted penetration measurements for 10% agar samples. The impact of glycerol was more pronounced in 7.5% agar samples with limestone (i.e., A7.5-L as compared to A7.5-GL). The addition of limestone generally resulted in a decrease in penetration, particularly for the A7.5 and A10 samples. These results were expected as previous literature has reported a similar decrease in the penetration of asphalt binders with the use of fillers like corn stalk fiber [56] and crayfish shell powder [57].
Traditional asphalt binders with high penetration values (i.e., softer consistency) are typically used in cold climates to combat pavement cracking. Conversely, binders with low penetration (i.e., stiffer consistency) are typically used in warmer climates where a binder is expected to resist permanent deformation at high temperatures. Asphalt binders with a penetration between 60 and 100 are mostly used in road construction, while asphalt binders with a penetration between 120 and 150 are primarily used in pavements with lighter traffic loading. Asphalt binders with penetration values between 200 and 300 are used less frequently for seal coating or arctic applications [27].
Compared to traditional asphalt binders, agar-based materials exhibited relatively high penetration values. However, these results illustrate a spectrum of binder consistency that might be tailorable with agar concentration and the use of mineral fillers, like ground limestone. Additionally, these measurements were obtained under the most conservative conditions given that the agar samples were unaged and submerged in a 25 °C water bath at the time of testing. Just as petroleum-based binders are known to stiffen with age due to volatilization and oxidation [25], agar-based materials are expected to stiffen with age due to dehydration of the hydrogel structure at ambient conditions.

3.2. Durability of Agar-Based Binder

3.2.1. Thermogravimetric Analysis

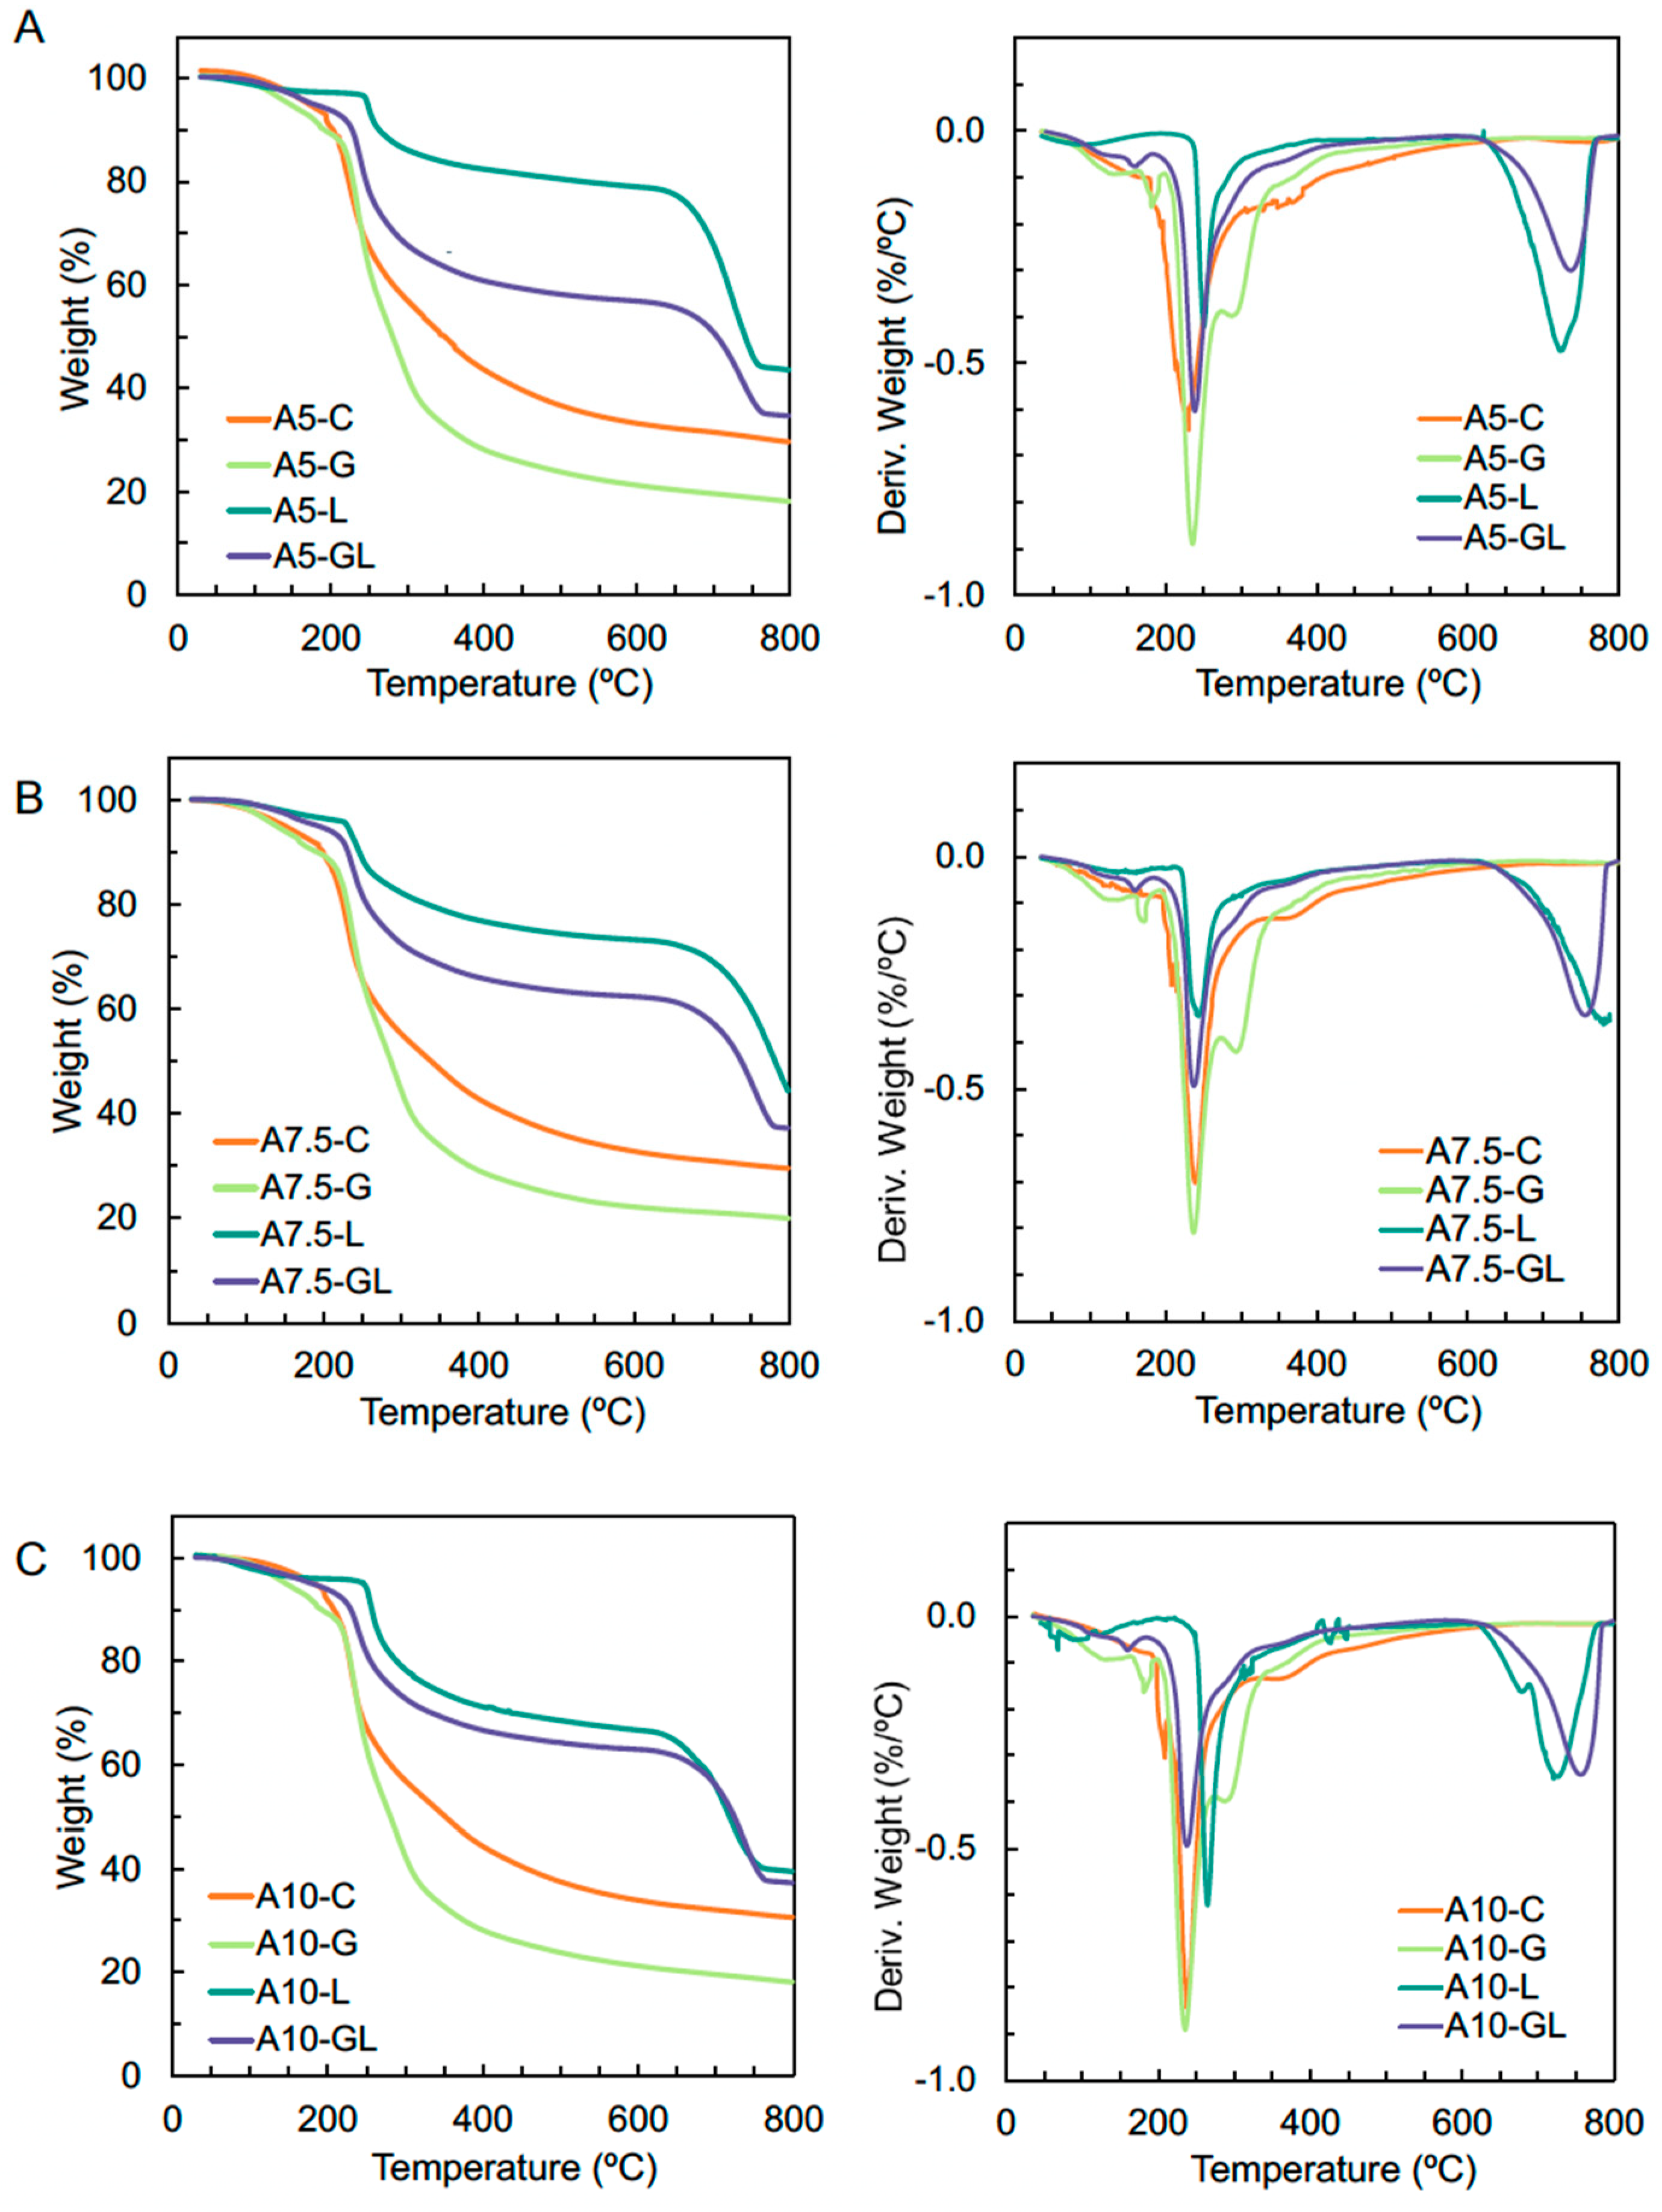
All agar-based material formulations were thermally stable up to 210 °C, followed by a steep mass loss due to decomposition of agar and glycerol (Figure 7).
Similar thermal behavior for agar composite materials has been reported previously [58,59]. For the agar-based formulations containing limestone, a second steep mass loss was observed beginning at 650 °C due to the decarbonation of limestone. Although the thermal stability of agar-based materials appeared to be minimally affected by agar concentration, the addition of both glycerol and limestone substantially impacted thermal stability. Specifically, glycerol addition resulted in a decrease in thermal stability and limestone addition resulted in an increase in thermal stability. The 5%, 7.5%, and 10% agar-based binder control formulations retained 29.60%, 29.54%, and 30.59% of their original mass, while limestone formulations retained 43.55%, 44.33%, and 39.45% of their original mass, respectively.
TGA characterization enables direct comparison between traditional petroleum-based construction materials and agar-based materials. Commonly used plastics including polyethylene, polypropylene, polystyrene, and polyethylene terephthalate begin to thermally degrade between 250 and 450 °C, with the maximum thermal degradation taking place between 420 and 490 °C [60]. Petroleum-based asphaltic binders for roadway or roofing applications begin to degrade between 300 and 350 °C [61] and degradation continues until the temperature reaches 500 °C, where typically less than 20% of the original mass is retained [62]. Agar-based materials exhibit partial thermal degradation at lower temperatures than petroleum-based materials and binders commonly utilized in the construction industry (i.e., beginning at 210 °C versus 250–300 °C). However, these data suggest that the addition of limestone filler can improve the thermal stability of agar-based materials allowing for a tailor ability of thermal durability. Previous work on asphalt mastics with additives including aluminum hydroxide, magnesium hydroxide, and limestone filler have shown similar improvements in thermal stability with the addition of a material that is inert until higher temperatures [61].

3.2.2. Fungal Biodeterioration

Photographs of a representative sample for each agar-based material formulation after fungal resistance testing are displayed in Figure 8. The control agar samples exhibited good fungal resistance and only traces of fungal growth (i.e., <10% of sample area) were observed after 28 days. The fungal resistance of samples increased with the addition of limestone whereas the addition of glycerol decreased fungal resistance.
At 28 days, most samples without glycerol addition (i.e., C and L samples) were rated as 1 (traces of growth). Contrastingly, the samples containing glycerol were rated in the range of 2 (light growth) to 4 (heavy growth). The experiment was validated using both a negative control (i.e., no sample) and positive control (i.e., cellulose). At 28 days, no growth was observed on the negative control specimens (rating of 0), and full growth coverage was observed on the positive control specimens (rating of 4).
Only traces of growth were observed on the samples without glycerol 28 days after inoculation. Therefore, it was concluded that agar and limestone did not serve as a primary carbon source for the growth of heterotrophic microorganisms, which is known to lead to biodeterioration. Agar is used as a microbiology culture media because it is non-nutritive for the vast majority of microorganisms making it a promising material candidate for construction application. However, glycerol provided an effective carbon source for fungal growth in samples containing it. Similar results were obtained by Nissa et al. [63], where 80% growth coverage (equivalent to ASTM G21 rating of 4) was observed on a starch-based bioplastic containing glycerol after just 10 days of incubation.
Microorganisms have evolved to use the hydrocarbons in petroleum as a source of carbon which can lead to biodegradation, which can worsen physical and chemical properties and reduced efficiency of petroleum products [64]. To combat potential biodeterioration, chemical biocides are often introduced. Notably, the chemical substances used to combat biodeterioration are often pollutive, mutagenic, and carcinogenic [65]. Comparatively, the fungal resistance properties of agar-based materials would limit the use and necessity of harmful biocides.

3.2.3. Moisture Sorption

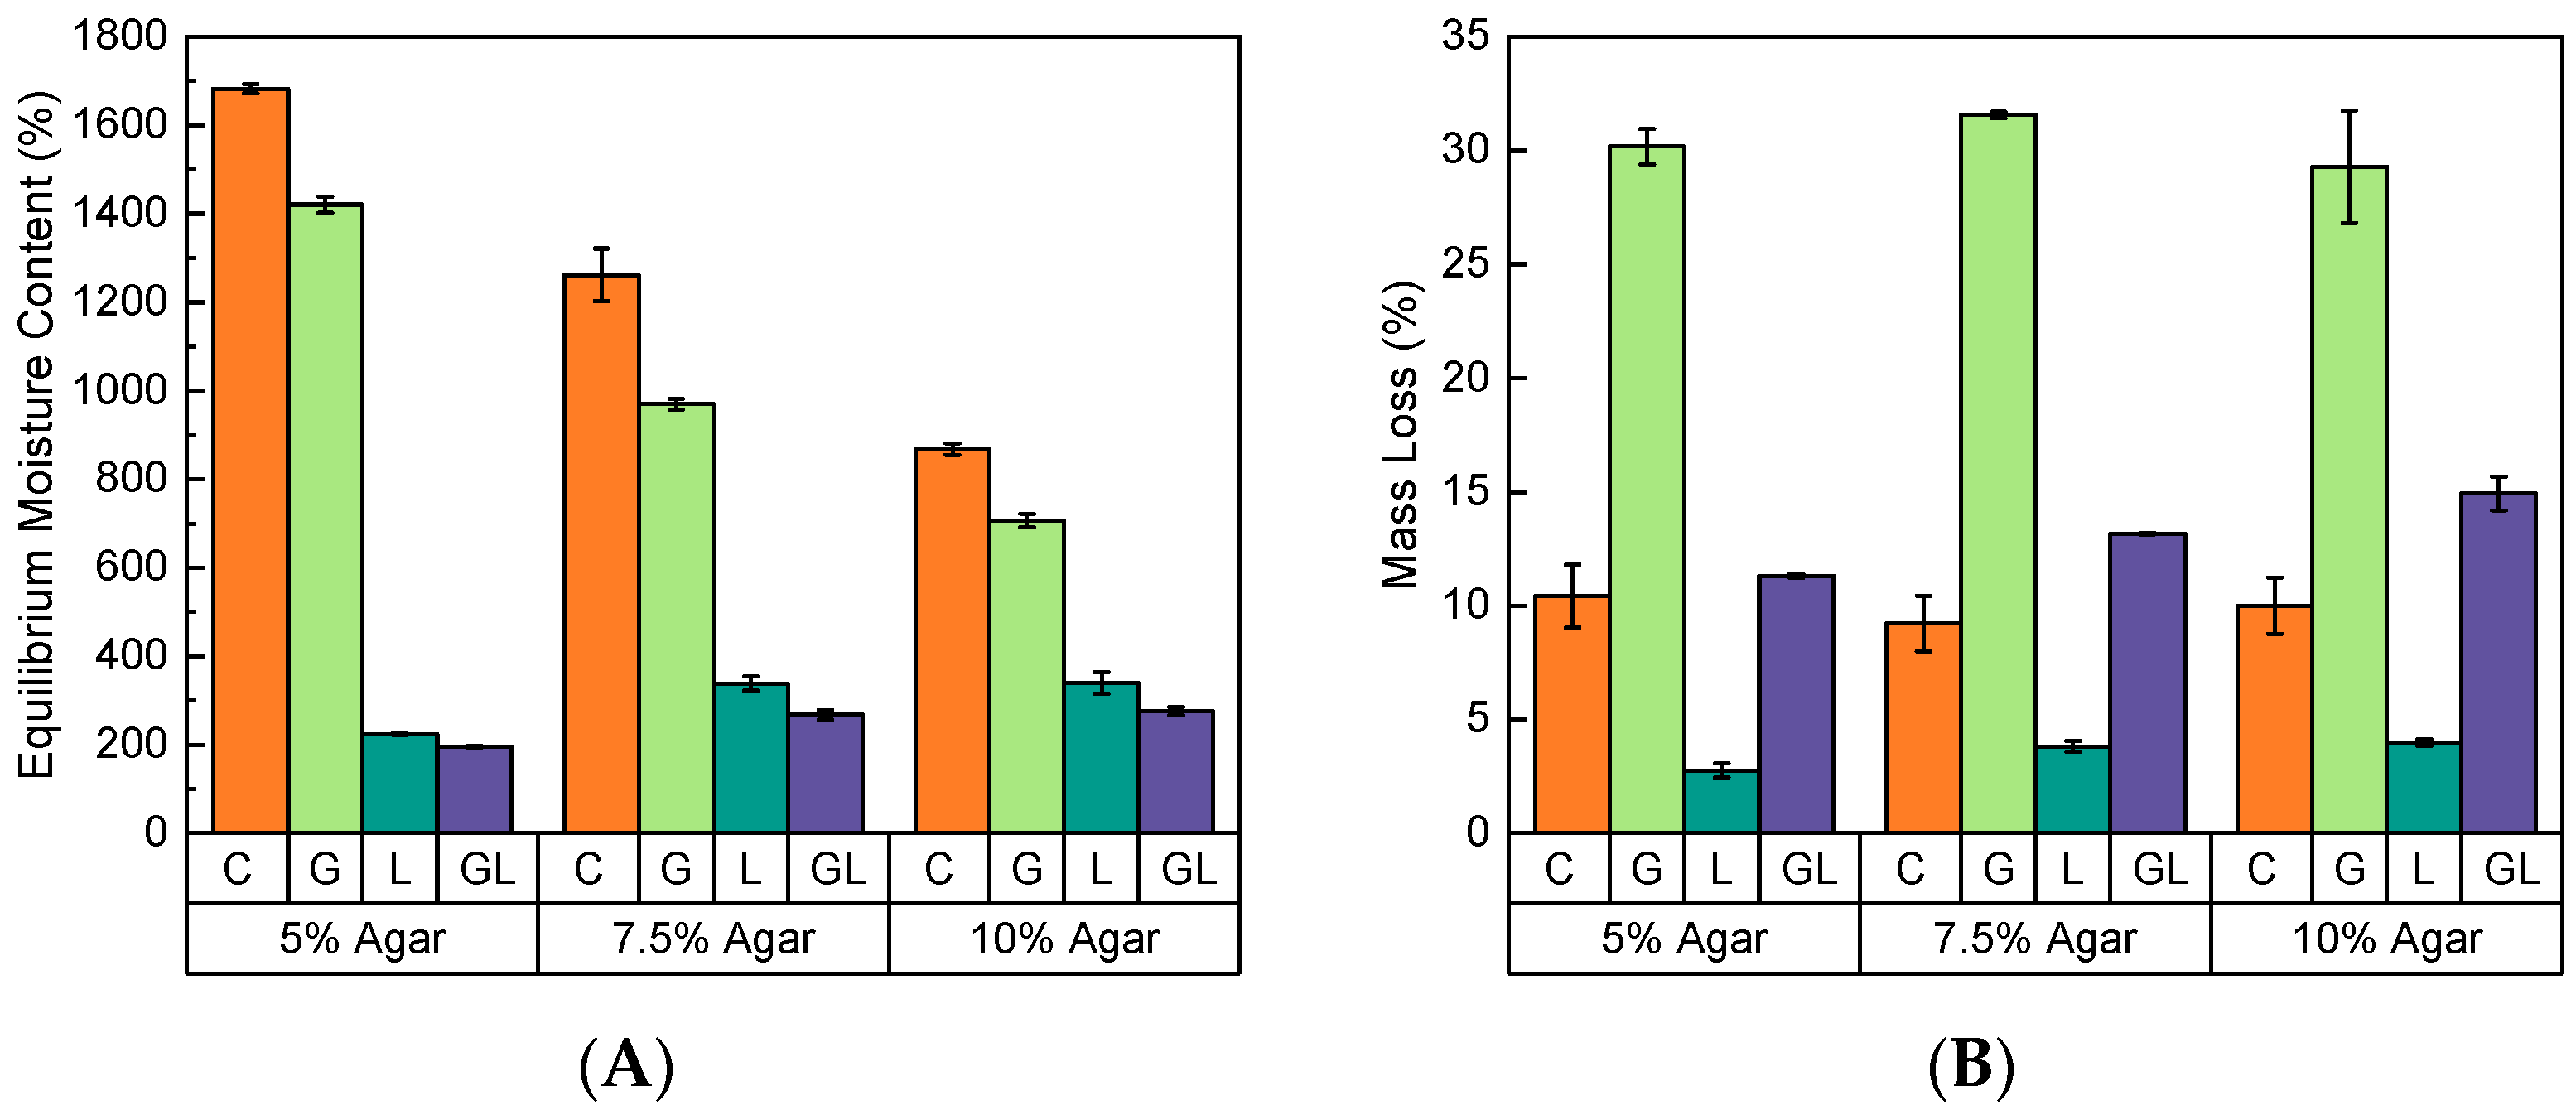
The equilibrated moisture content of agar-based binders, calculated using Equation (1), is shown in Figure 9A. In general, agar-based binders absorbed a large percentage of moisture relative to the conditioned mass of samples (i.e., samples incubated at 30 °C until constant mass). This behavior was expected due to abundant hydroxyl functional groups (i.e., -OH) in polysaccharides like agar, and the hydrophilicity of hydrogels [66]. After sample conditioning, agar-based binders retained 5 to 23% of fresh-state mass and upon immersion in distilled water, agar-based binders swelled to 55 to 97% of fresh state mass.
The equilibrated moisture content for control agar-based samples (Figure 9A) ranged from 196% to 1682%, 268% to 1262%, and 275% to 868% for A5, A7.5, and A10 samples, respectively. The maximum moisture content of control and glycerol dosed agar-based binders decreased with an increase in agar-concentration. These experimental observations are consistent with previous studies on the water holding capacity of agar hydrogels. The swelling behavior of agar is highly dependent on the porous size between crosslinked bonds. An increase in agar content results in a dense polymer network (i.e., decreased porous space) which can hinder polymer mobility and decrease water holding capacity [52,67].
The use of glycerol decreased water sorption for samples herein. Consistently, samples with glycerol absorbed less than comparative samples without glycerol (i.e., G and GL compared to C and L, respectively). Previous work conducted on chitosan films have noted similar decreases in water sorption with the use of glycerol [68]. It is hypothesized that this behavior is due to the formation of bonds between biopolymers and glycerol, which increases the network density. Additionally, glycerol molecules take up intermolecular space which can decrease access to active sites for the biopolymers to bond with water.
Notably, the inclusion of limestone reduced the moisture sorption of agar-based materials. These findings align with literature on hydrogel-based composites. Rigid fillers can increase composite density and mechanical stability which can alter the swelling capacity of hydrogels [69,70]. Similarly to glycerol findings, the decrease in moisture sorption with the use of limestone filler may be due to a sort of barrier effect. The limestone filler molecules can occupy intermolecular space and oppose moisture transport through the material.
Sample deterioration (i.e., bath clouding, small sample fragments) was evident for the agar-based materials containing glycerol. This observation was validated by mass loss data obtained from re-conditioned sample masses using Equation (2) and shown in Figure 9B. Agar-based binders with glycerol lost 19–22% more mass than samples without glycerol. Similar mass loss due to glycerol leaching has been noted in previous work on polymers [71,72]. Interestingly, agar-based materials with both glycerol and limestone only lost 8–11% more mass than samples with only limestone. These results indicate that agar sample formulations with limestone may have a stronger and more dense gel network than formulations without limestone and may be more dimensionally stable and capable of withstanding the stresses due to drying and shrinkage more successfully [51]. Conversely, sample formulations with glycerol may be less apt at withstanding drying and shrinkage.
These findings substantiate a propensity for agar-based material to exhibit high moisture sensitivity (i.e., high equilibrium moisture contents) and propensities for dimensional change and deterioration due to wetting and drying (i.e., mass loss). The moisture sorption characteristics highlight an inherent weakness associated with biopolymers, namely hydrophilicity. Agar-based materials may be suitable for pavement applications if the hydrophilic nature of agar is improved through physical or chemical modification. Without treatment, agar-based materials are more appropriate for applications without significant moisture exposure.

3.3. Mechanical and Microstructural Characterization of Agar-Based Composites

3.3.1. X-Ray Tomography

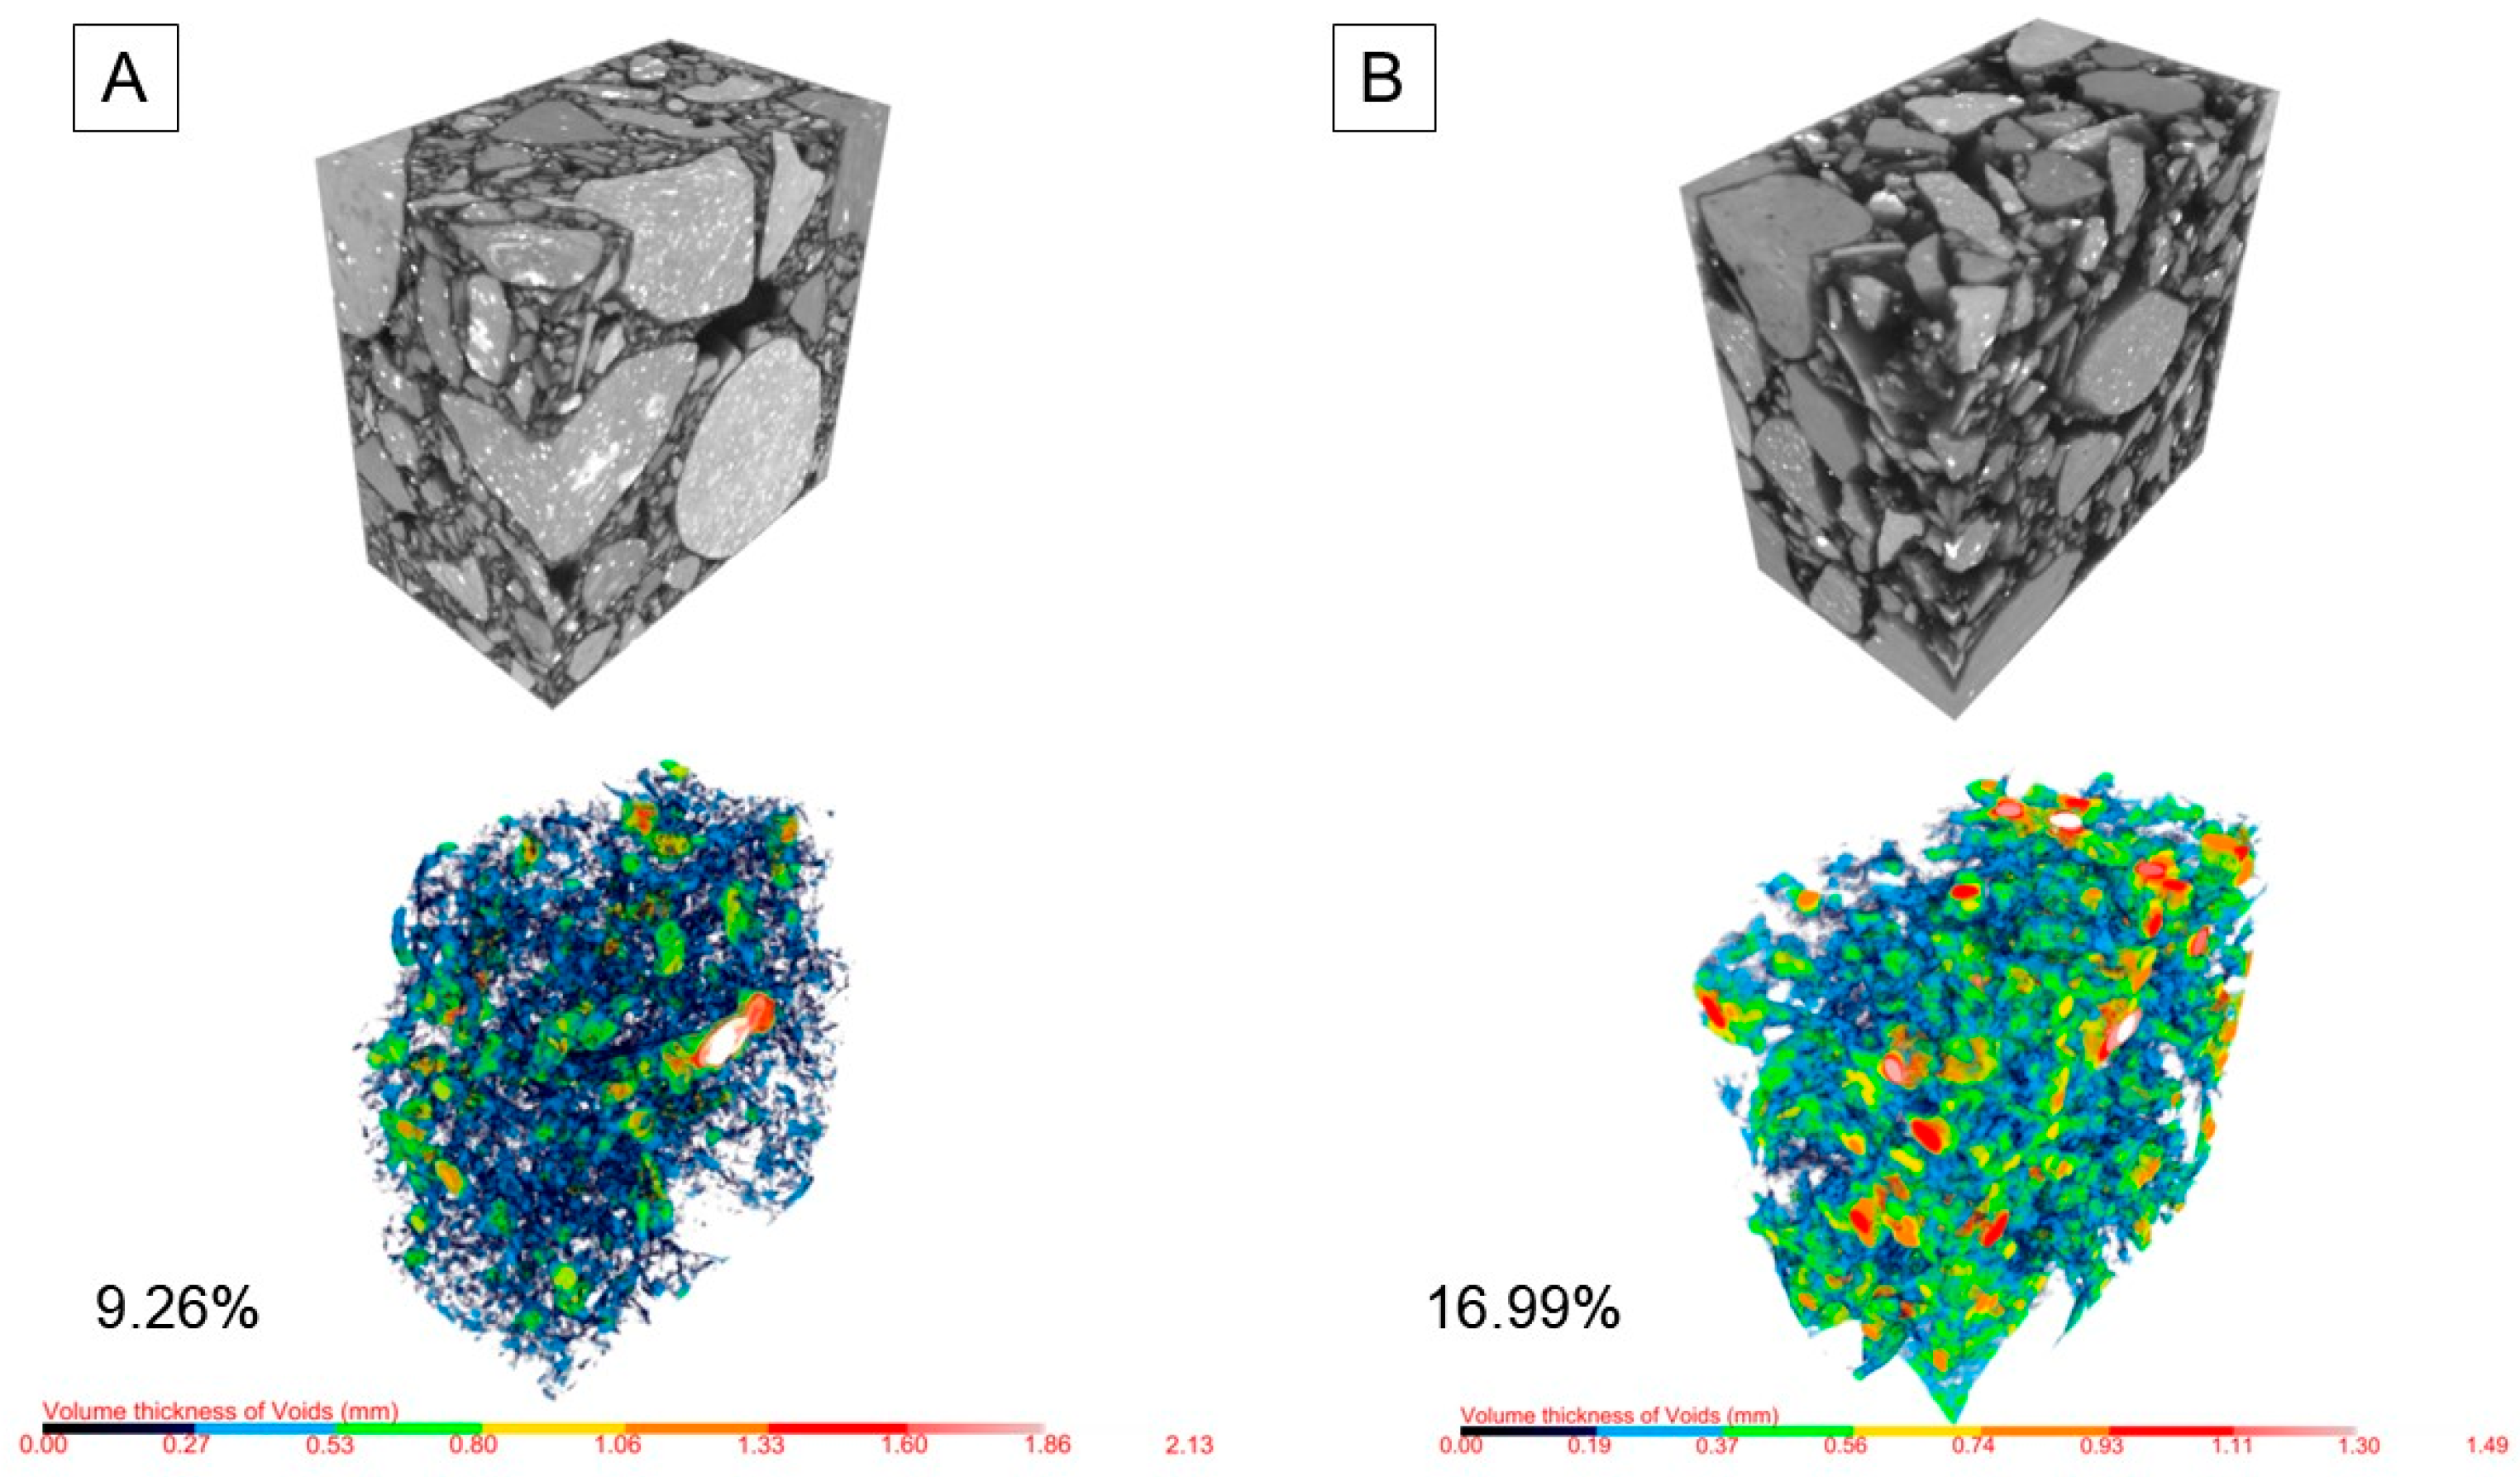
An example of X-ray tomography reconstruction of the cross-section sampled from the center of the control section sample is illustrated in Figure 10. The figure provides an image of the reconstructed sample and a volume thickness map of the segmented interior pore network (i.e., top and bottom of figure, respectively). The volume thickness maps use a color spectrum ranging from a dark navy to red or white with the navy coloring representing the smallest measured distances between pores and a red or white color representing the largest distance between pores, measured in mm.
The porosity of agar-based composites ranged from 5.79 to 16.99% for control samples, 6.25 to 15.21% for limestone-containing samples (L), 3.39 to 9.92% for sand-containing samples (S), and 5.60 to 16.55%, for limestone- and sand-containing (LS) samples. Comparatively, the measured porosity of agar-based composites is generally higher than the porosity of traditional concrete and asphalt (i.e., 5–15% and 2–7%, respectively). However, porosity measurements are within the same range as pervious concrete and porous asphalt (i.e., 15–25% and 10–15%, respectively) [73,74].
Porosity measurements obtained from segmented reconstructions of the entire tested composite (i.e., filled marker) and from a smaller internal cross-section sampled from the center of the tested composite (i.e., unfilled marker) are shown in Figure 11. In general, the porosity measured from the smaller segmented volume of the sample was slightly higher than the porosity calculated based on the entire sample volume. The LS-0.2 sample (i.e., limestone- and sand-reinforced, 0.2 binder content) was the only sample that presented an exception to this trend (i.e., porosity of the entire composite volume was approximately equivalent to the porosity of the segmented composite volume).
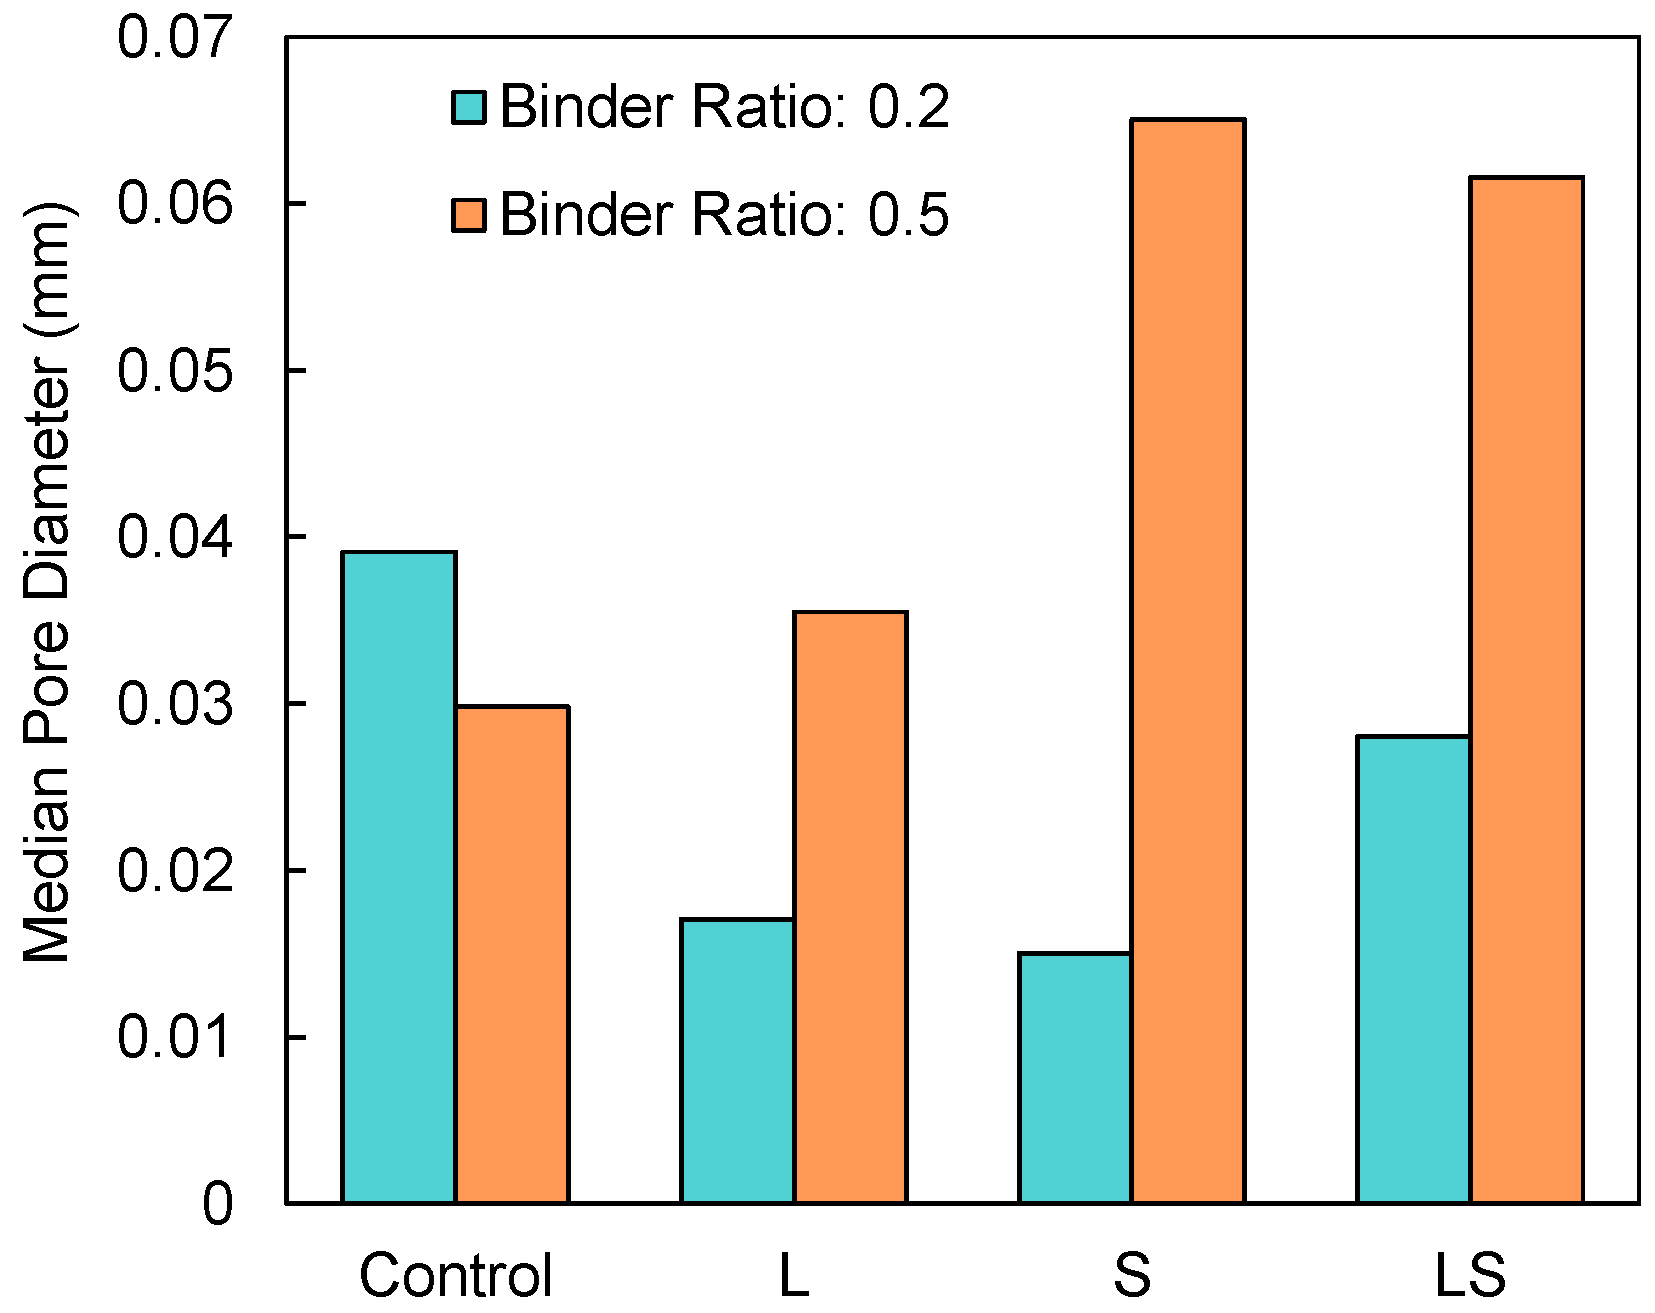
The volume thickness maps derived from this test (e.g., Figure 10) was used to identify the diameter of the largest sphere that can be bound within the segmented pore space of composite reconstructions. The maximum diameter of pores in samples ranged from 1.4 to 2.1 mm for all agar-based composites, with the exception of S-0.5 and LS-0.5 composites. The maximum diameter of pores for these samples was larger and ranged from 3.1 to 3.6 mm. Detailed diameter data was processed in order to compute the 50th percentile (i.e., median) pore diameter for each sample and results are illustrated in Figure 12.
Several trends are visible in the porosity measurements obtained. Firstly, an increase in binder content led to an increase in the volume of pores (i.e., comparison of 0.2 and 0.5 binder content in Figure 11) and pore size (Figure 12). These results align with visual observations of composites. Agar-based composites with a 0.5 binder content had visible surface cracks concentrated between large aggregate particles (Figure 1). As biopolymers dehydrate, shrinkage stresses draw aggregate particles towards one another and compress the pore space of the composite [10]. The use of too much biopolymer in a composite can result in increased internal stresses during dehydration, which can lead to particle conglomeration and a sample structure with larger, more connected voids [75]. Porosity data suggests that a 0.5 binder content (i.e., by mass) surpasses the optimal agar proportion for the aggregate and filler compositions studied herein.
Second, porosity measurements indicate that the inclusion of sand led to a decrease in the porosity of samples, evident by comparison of sand reinforced samples and control samples. The porosity of sand reinforced samples with a 0.2 and 0.5 binder content was 2.4–4.5% and 6.9–7.1% lower than comparable control samples (i.e., C-0.2 and C-0.5), respectively. Conversely, the porosity of limestone- and sand-reinforced samples was greater than the porosity of samples with only sand (i.e., porosity of LS-0.2 and LS-0.5 samples was 1.8 to 2.2% and 6.6 to 6.8% higher than S-0.2 and S-0.5 samples, respectively).
2D cross-sections from X-ray tomography reconstructions (Figure 13) suggest that a film or coating forms on the surface of aggregate particles. In these cross-sections, the interparticle structure of samples is illustrated using a color map of segmented sample components. Dense particles (i.e., aggregate), less dense components (i.e., fine particles and biopolymer), and pores are shown in black, blue, and yellow, respectively. These results align with previous research, which has found that biopolymers like agar improve composite mechanical properties by forming a connected film around the surface of particles [8,12]. When biopolymer composites are dehydrated, this thin film remains and functions as a matrix for particles [8,75] improving interaggregate contact area [12,16], sample density, and porosity [11]. In a dehydrated state, mechanical improvements of biopolymer aggregate composites are primarily due to frictional forces in the sample rather than adhesion or charge interactions related to the gel strength of agar [8]. Our work found that sand reinforced samples demonstrated a condensed structure, evident by comparison of panels A and B with panels E and F in Figure 13 (i.e., Comparison of C-0.2 and C-0.5 with S-0.2 and S-0.5). Samples with limestone did not demonstrate the same trend. Although it appears the addition of limestone may have minimally improved the interparticle structure of control composites (i.e., comparison of panels A and B with panels C and D), the interparticle structure was largely similar to comparable control composites (i.e., large pore spaces are present between dense particles).

3.3.2. Unconfined Compressive Strength

The results for unconfined compressive strength testing of agar-based composites are shown in Figure 14. Compressive strength results are within range of previous work conducted on biopolymers composites. Work conducted by Khatami and O’Kelly [9] on sand treated with 1, 2, and 4% agar found that the dehydrated (i.e., 30 days of acclimation) compressive strength of samples ranged from 158 to 487 kPa. Similarly, Fatehi et al. [10] reported unconfined compressive strengths as high as 225 kPa and 1800 kPa for agar composites composed of sand and clays, respectively, and Chang et al. [8] reported an unconfined compressive strength of 3190 kPa for agar and clay composites with thermal treatment. Notably, experimental results noted are for agar composites with fine particles (i.e., sand or clays) and not for composites with dense-graded, coarse aggregates.
Compressive strength data were further analyzed as a response variable in Scheirer Ray Hare (SRH) testing to determine the influence of binder content and aggregate and filler composition. Results of SRH statistical analysis (Table 6) indicate that both binder content (p = 1.29 × 10⁻⁶) and aggregate and filler composition (p = 0.0401) led to statistically significant differences in composite compressive strength. The interaction between factors was not statistically significant at a 95% confidence interval (i.e., p value > 0.05). A statistically significant interaction would indicate that the analyzed factors have a combined impact on the response variable that is not present in an analysis of each variable alone. These results indicate that the binder content had the same effect on compressive strength no matter the aggregate and filler composition used, and vice versa.
Although the SRH test can indicate whether statistical differences exist in a group, these results do not explicitly indicate which specific groups differ from one another. In order to determine pairwise differences, a Dunn’s test was applied to compare groups in detail. As there are only two binder contents (i.e., 0.2 vs. 0.5 binder content) and these sample types were determined to be significantly different in the SRH analysis, the Dunn’s test was applied to analyze the impact of aggregate and filler composition on compressive strength.
Results in Table 6 show that, of the six pairwise comparisons analyzed, the compressive strength were statistically significant in two sample pairs (i.e., C-LS and C-S). This indicates that the inclusion of sand in the aggregate and filler composition of samples led to a statistically significant improvement in the compressive strength of agar-based composites as compared to sample equivalents without sand (i.e., control samples, or limestone reinforced). Statistical analysis indicates that unlike sand, the addition of limestone did not lead to a statistically significant impact on the compressive strength of composites.

3.3.3. Modulus of Resiliency

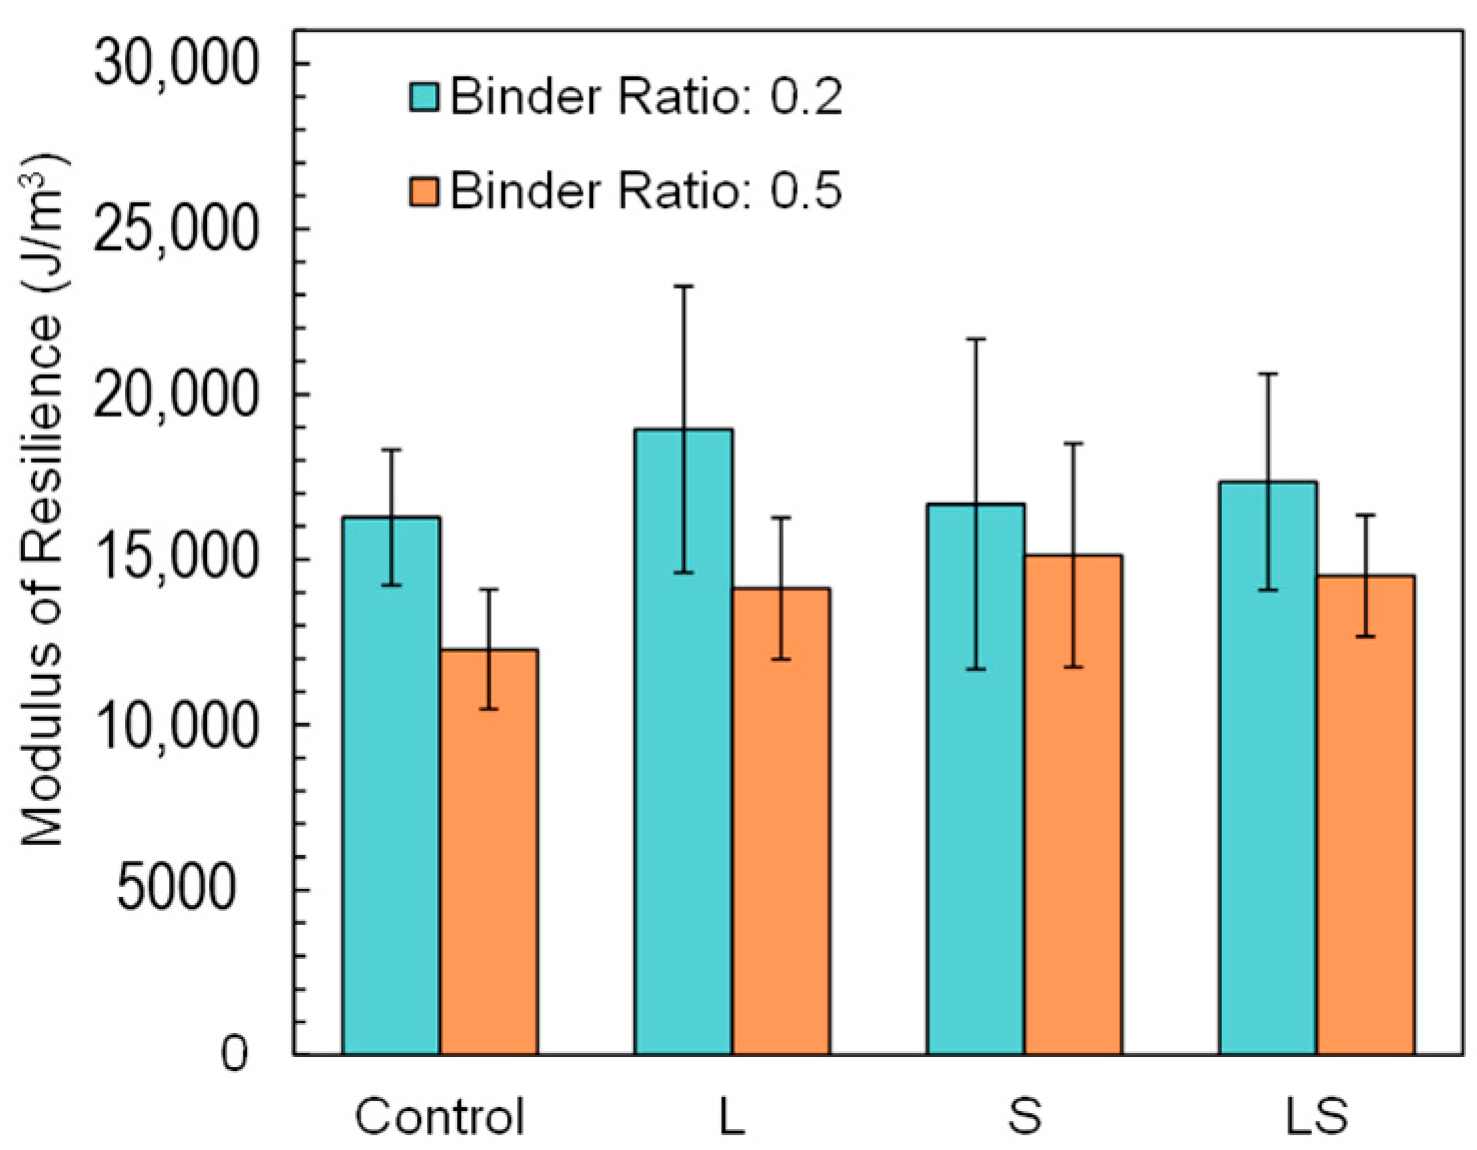
The moduli of resilience of agar-based composites are shown in Figure 15. The average modulus of resilience of samples ranged from 12,275 J/m3 (i.e., sample C-0.5) to 18,934 J/m3 (i.e., sample L-0.2).
These results align with findings in the literature. Namely, Cabalar et al. [76] reported an increase in the modulus of resilience (i.e., energy absorption capacity increased) to ~4000 J/m3 for crushed rock stabilized with xanthan gum. Hamza et al. [75] found that high plastic clays stabilized with agar illustrated a modulus of resiliency over 30,000 J/m3. Results in this work are within reasonable range considering that the particle size in this work is between that of the referenced literature.
The modulus of resilience results for agar-based composites were analyzed as a response variable in SRH testing using a 95% confidence interval in order to determine the influence of binder content and aggregate and filler composition. Results of SRH statistical analysis are shown in Table 7. SRH testing indicated that the aggregate and filler composition of composites did not lead to a statistically significant difference in the modulus of resilience of composites (p value = 0.70256). Similarly, the interaction between binder content and aggregate and filler composition was not statistically significant (i.e., p value = 0.51246).
Although the compressive strength of agar-based composites was significantly impacted by both experimental factors considered (i.e., binder content and the aggregate and filler composition produced a p value ≤ 0.025), the binder content was the only statistically significant factor for the modulus of resilience results (p-value = 0.00533). An increase in binder content of composites from 0.2 to 0.5 led to a 33%, 34%, 10% and 20% decrease in the average modulus of resilience for control, limestone reinforced, sand reinforced, and both limestone- and sand-reinforced samples, respectively.

3.3.4. Modulus of Elasticity

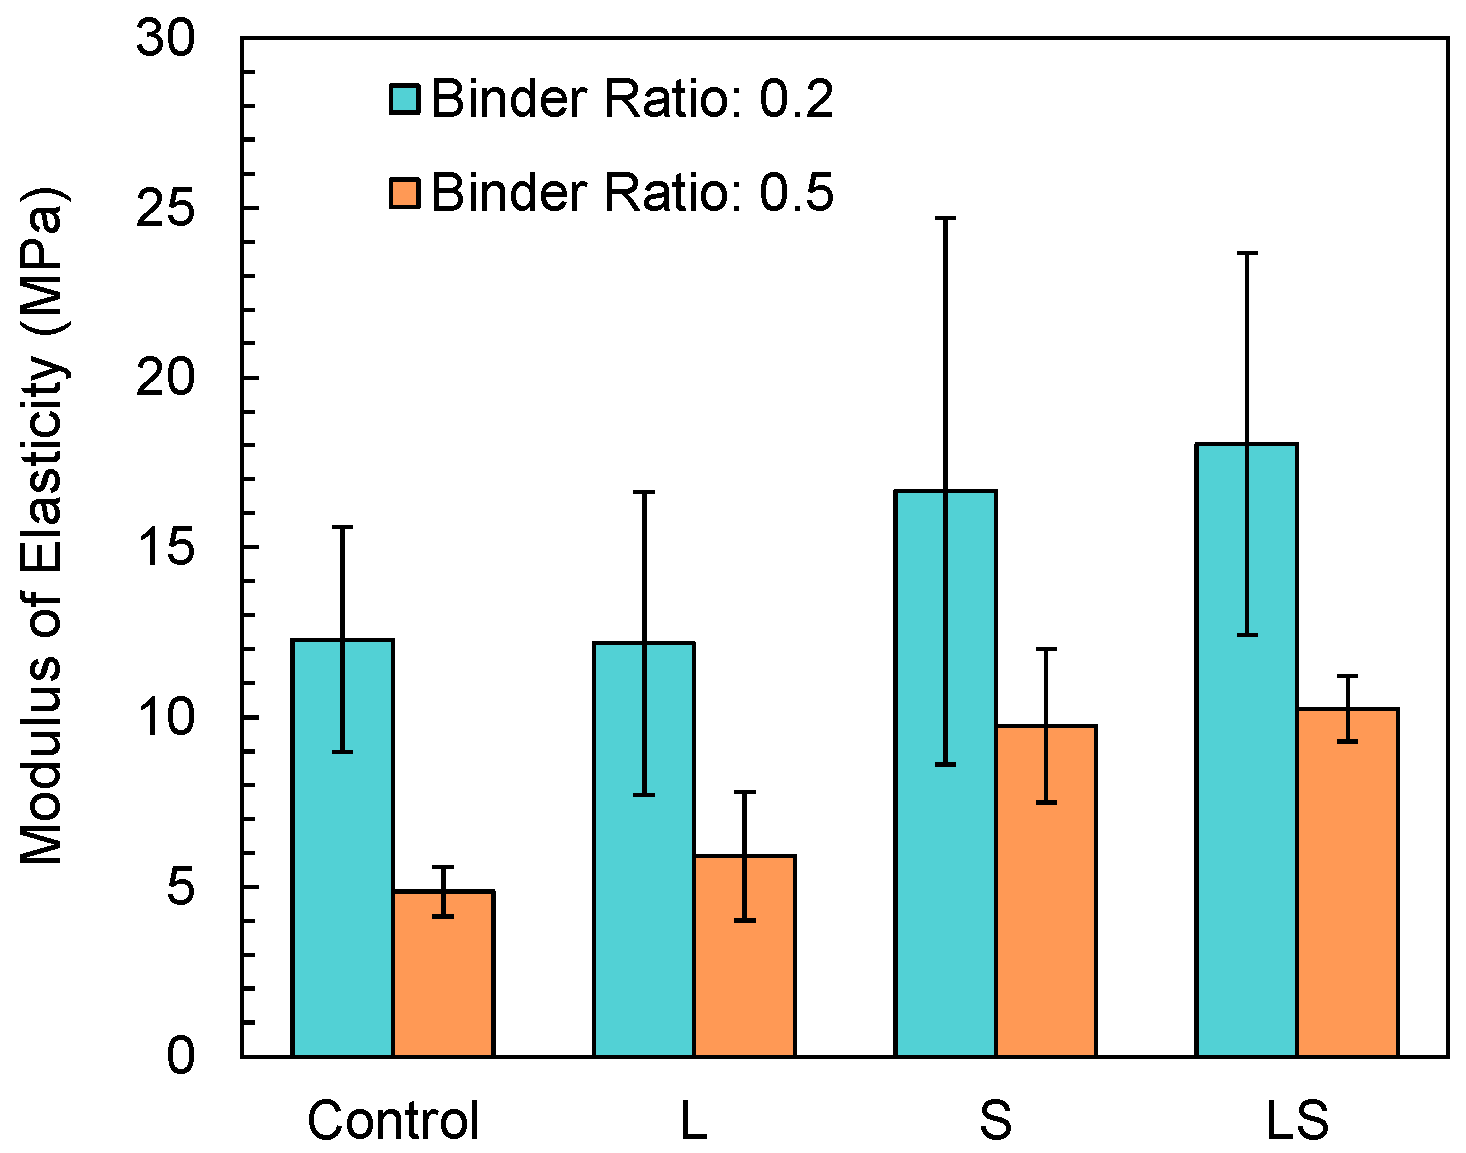
The modulus of elasticity (E) for samples is illustrated in Figure 16. Previous work conducted by Chang et al. [8] found the modulus of elasticity of 1% agar-treated clayey soils to range from 188 to 270 MPa depending on thermal treatment. The magnitude of difference in moduli results in this work was expected, as the agar-based composites investigated in this work utilize much larger particles (i.e., coarse aggregate instead of sand). A material with larger particles will often reflect a smaller modulus of elasticity due to increased porosity and reduced interparticle bonding and load transfer efficiency.
Results were analyzed as a response variable in SRH testing using a 95% confidence interval and results are shown in Table 8. Similarly to the modulus of resiliency, results from this analysis indicate that only binder content (p = 3.0 × 10⁻⁵) led to statistically significant differences in composite modulus of elasticity.

4. Conclusions

This study evaluated agar-based binders as a direct alternative material for traditional petroleum-based asphalt binders. In particular, the study analyzed the rheological properties and durability of agar-based binders, as well as the mechanical and microstructural characterization of composites. Overall, this analysis is a step towards the practical adoption of more sustainable practices in the construction industry. The experimental data indicated the following conclusions:
  • All 5% w/w agar-based binders passed the rotational viscosity (RV) threshold set by the performance-grade (PG) specification (<3 Pa·s), while all 7.5% and 10% w/w samples exceeded that same threshold. In general, agar-based binders exhibited more viscous behavior than traditional asphalt binders. However, RV testing of agar-based binders was completed at a lower temperature than stipulated by the PG specification (i.e., 80 °C vs. 135 °C). The lower temperature compatibility of agar-based materials indicates the possibility of lower mixing and compaction temperatures and an increase in energy efficiency of production as compared to petroleum-based binder production.
  • Dynamic shear rheometry (DSR) revealed that all agar-based binders in this study exhibited adequate stiffness to resist early-age rutting at temperatures up to 80 °C. Agar-based materials generally illustrated a higher complex modulus and lower phase angle than traditional asphalt binders, which is advantageous for rutting. Relatedly, the high magnitude of the complex moduli at testing temperatures might indicate the possibility of low-temperature and fatigue-induced cracking.
  • Penetration measurements performed on fully submerged, unaged agar-based binders ranged from 162 to greater than 350. While penetration readings were generally higher than those associated with traditional asphalt binders used in road applications, the results indicated that penetration consistency might be tailorable with the use of additives, such as ground limestone.
  • Thermogravimetric analysis illustrated that all agar-based binders were thermally stable up to 210 °C. The onset of thermal decomposition occurs at a slightly lower temperature for agar-based binders as compared to petroleum-based materials (i.e., 210 °C vs. 250–300 °C).
  • When subjected to ASTM G21 testing, agar-based binders without glycerol addition exhibited improved resistance to biodeterioration as compared to a positive control (i.e., cellulose). Samples with glycerol addition showed substantial growth, indicating that glycerol served as an effective carbon source for the growth of heterotrophic microorganisms.
  • Moisture diffused rapidly in agar-based binders and the equilibrated moisture content for agar-based samples relative to conditioned mass ranged from 196% to 1682%. Relative to fresh-state sample mass, rehydrated agar-based binders swelled to between 55 and 97% moisture content. Limestone significantly reduced moisture sorption and improved mass loss during testing. However, glycerol plasticizer was found to leach from agar-based binder samples in isothermal sorption testing.
  • As shown in X-ray tomography, agar-based material-coated aggregate particles, resulting in increased sample density and frictional contact between particles. Results indicate there is likely the existence of an optimum aggregate composition and binder content. Further, X-ray tomography illustrated the formation of large fractures due to shrinkage stresses in samples with a 0.5 agar binder content. Coupled with results from porosity measurements and mechanical data, this suggests that a 0.5 binder content (i.e., by mass) surpasses the optimal agar proportion for the aggregate and filler compositions studied herein.
  • In microstructural evaluation, several trends are visible in porosity measurements. The porosity of agar-based composites ranged from 5.79 to 16.99% for control samples, 6.25 to 15.21% for limestone-containing samples (L), 3.39 to 9.92% for sand-containing samples (S), and 5.60 to 16.55% for limestone- and sand-containing (LS) samples. An increase in binder content led to an increase in the volume of pores and pore size. The inclusion of sand led to a decrease in the porosity of samples and porosity of sand reinforced samples with a 0.2 and 0.5 binder content was 2.4–4.5% and 6.9–7.1% lower than comparable control samples (i.e., C-0.2 and C-0.5), respectively. Conversely, the porosity of limestone- and sand-reinforced samples was greater than the porosity of samples with only sand.
  • In mechanical characterization, the compressive strength of samples ranged from 431 to 780 kPa, 500 to 913 kPa, 699 to 1042 kPa, and 679 to 978 kPa for control, L, S, and LS samples, respectively. The average modulus of resilience of samples ranged from 12,275 J/m3 (i.e., sample C-0.5) to 18,934 J/m3 (i.e., sample L-0.2) and the average modulus of elasticity ranged from 4.87 MPa (i.e., sample C-0.5) to 18.03 MPa (i.e., sample LS-0.2). The use of a higher biopolymer content led to increased shrinking stresses and 0.5 binder content samples consistently illustrated lower mechanical properties.
Results herein illustrate that agar-based materials are more stiff than traditional asphalt binder materials, which may be problematic in regard to fatigue and low temperature stresses that accumulate in pavement materials. The rigid characteristics of agar-based materials indicate that these materials may perform adequately in regard to rutting, but they do not have the same ability as traditional petroleum-based asphalt binders to relax accumulated stresses.
Although this work highlights the benefits of agar-based material use (i.e., lower temperature requirements, advantageous rutting characteristics, strong biodeterioration resistance), portions of this work highlight inherent weaknesses associated with agar-based materials that need further research for its large-scale implementation. Namely, the moisture sorption properties of agar-based binders should be improved upon before implementation of agar-based binders. Possible solutions to address the high hydrophilicity and sensitivity to moisture of agar include physical (i.e., coatings, filler materials) and chemical (i.e., crosslinking) modification methods. These solutions, recommended for future research, could help expand the applicability of agar-based binders, which exhibited high penetration values aligned with applications in arctic climates.
Additional economic analyses are also recommended to better understand the broader implications of deploying agar-based binders. The literature includes large ranges of agar production costs that are mainly due to differences in the material quality of biopolymer. Utilizing the minimum unit cost found in the literature [77] (i.e., USD 2.21/kg) and the cost of purchase in this study (i.e., USD 397/kg), which is larger than the ones found in the literature, the cost of agar to prepare 5% w/w agar-based material could cost between USD 0.42 and USD 75.14 per gallon. These results do not consider the cost of the water source, long term maintenance, performance, and the environmental capital required to set up new forms of manufacturing/production. For reference, the cost of petroleum-based binder is approximately USD 2 per gallon [78]. This price estimate represents an exorbitant range and illustrates the need for future research on the economic costs associated with the deployment of this solution.
Application-specific results from this work indicate that agar-based materials are most appropriate for applications without significant moisture exposure. The moisture sensitivity, dimensional instability, and relative rigidity of agar-based materials may make it a less viable candidate for use as a surface pavement structure unless the hydrophilicity of agar is reduced through physical or chemical modification. The use of agar-based materials in the layers under a pavement surface course (i.e., base or subbase course) may be a more appropriate application as these layers are designed to be rigid and less exposed to surface moisture (i.e., they are protected by the surface course material).
Results from this work indicate that agar-based composites illustrate many properties in line with those of traditional engineering materials. Although the mechanical properties are lower than those of many typical engineering materials, results were in line with previous work on earthen material stabilization. Further, the porosity of agar-based composites was similar to that of pervious concrete or porous asphalt. This research is promising but highlights the need for additional work regarding optimization of binder and aggregate, the largescale environmental and economic impacts, the long-term impact of moisture on composite properties, and the evaluation of other durability mechanisms like UV.

Author Contributions

Conceptualization and methodology, all authors; data curation and formal analysis, M.R.F. and S.L.W.; resources, W.V.S.III and C.T.-M.; writing—original draft preparation and visualization, M.R.F.; writing—review and editing, S.L.W., W.V.S.III and C.T.-M.; supervision, project administration, and funding acquisition, W.V.S.III and C.T.-M. All authors have read and agreed to the published version of the manuscript.

Funding

This work was supported by the Colorado Department of Transportation under Grant No. R421.02; and the United States Department of Education Graduate Assistance in Areas of National Need Grant P200A180024. Publication of this article was funded by the University of Colorado Boulder Libraries Open Access Fund. Support for this work is gratefully acknowledged. This work represents the views of the authors and not necessarily those of the sponsors.

Institutional Review Board Statement

Not applicable.

Informed Consent Statement

Not applicable.

Data Availability Statement

Raw data were generated at the University of Colorado Boulder. Derived data supporting the findings of this study are available from the authors on request.

Conflicts of Interest

The authors declare no conflict of interest.

References

  1. Asphalt Paving Association of Iowa. Asphalt Paving Design Guide; Asphalt Paving Association of Iowa: West Des Moines, IA, USA, 2020. [Google Scholar]
  2. Penki, R.; Rout, S.K. Next-Generation Bitumen: A Review on Challenges and Recent Developments in Bio-Bitumen Preparation and Usage. Biomass Conv. Bioref. 2023, 13, 9583–9600. [Google Scholar] [CrossRef]
  3. Fini, E.H.; Al-Qadi, I.L.; You, Z.; Zada, B.; Mills-Beale, J. Partial Replacement of Asphalt Binder with Bio-Binder: Characterisation and Modification. Int. J. Pavement Eng. 2012, 13, 515–522. [Google Scholar] [CrossRef]
  4. Ahmed, R.B.; Hossain, K. Waste Cooking Oil as an Asphalt Rejuvenator: A State-of-the-Art Review. Constr. Build. Mater. 2020, 230, 116985. [Google Scholar] [CrossRef]
  5. He, M.; Tu, C.; Cao, D.W.; Chen, Y.J. Comparative Analysis of Bio-Binder Properties Derived from Different Sources. Int. J. Pavement Eng. 2019, 20, 792–800. [Google Scholar] [CrossRef]
  6. Armisen, R.; Galatas, F.; Spain, H.S.A. Agar. In Handbook of Hydrocolloids; Woodhead Publishing: Cambridge, UK, 2009. [Google Scholar]
  7. Smitha, S.; Rangaswamy, K.; Keerthi, D.S. Triaxial Test Behaviour of Silty Sands Treated with Agar Biopolymer. Int. J. Geotech. Eng. 2021, 15, 484–495. [Google Scholar] [CrossRef]
  8. Chang, I.; Prasidhi, A.K.; Im, J.; Cho, G.-C. Soil Strengthening Using Thermo-Gelation Biopolymers. Constr. Build. Mater. 2015, 77, 430–438. [Google Scholar] [CrossRef]
  9. Khatami, H.R.; O’Kelly, B.C. Improving Mechanical Properties of Sand Using Biopolymers. J. Geotech. Geoenviron. Eng. 2013, 139, 1402–1406. [Google Scholar] [CrossRef]
  10. Fatehi, H.; Ong, D.E.L.; Yu, J.; Chang, I. Biopolymers as Green Binders for Soil Improvement in Geotechnical Applications: A Review. Geosciences 2021, 11, 291. [Google Scholar] [CrossRef]
  11. Verma, A.K.; Prasad, A.; Bonal, N.S. Investigation of the Long-Term Shear Strength Behavior of Municipal Solid Waste Fines Stabilized with Biopolymer: An Experimental Study. J. Environ. Chem. Eng. 2023, 11, 109805. [Google Scholar] [CrossRef]
  12. Kantesaria, N.; Chandra, P.; Sachan, A. Stabilization of Expansive Soil Using Agar Biopolymer. In Proceedings of the IFCEE 2021: From Traditional to Emerging Geotechnics, Dallas, TX, USA, 10–14 May 2021; American Society of Civil Engineers: Reston, VA, USA, 2021; pp. 272–281. [Google Scholar]
  13. Huang, J.; Kogbara, R.B.; Hariharan, N.; Masad, E.A.; Little, D.N. A State-of-the-Art Review of Polymers Used in Soil Stabilization. Constr. Build. Mater. 2021, 305, 124685. [Google Scholar] [CrossRef]
  14. Losini, A.E.; Grillet, A.C.; Bellotto, M.; Woloszyn, M.; Dotelli, G. Natural Additives and Biopolymers for Raw Earth Construction Stabilization—A Review. Constr. Build. Mater. 2021, 304, 124507. [Google Scholar] [CrossRef]
  15. ASTM D75; Standard Practice for Sampling Aggregates. American Society for Testing and Materials: West Conshohocken, PA, USA, 2019.
  16. Smitha, S.; Sachan, A. Use of Agar Biopolymer to Improve the Shear Strength Behavior of Sabarmati Sand. Int. J. Geotech. Eng. 2016, 10, 387–400. [Google Scholar] [CrossRef]
  17. Arham, R.; Salengke, S.; Metusalach, M.; Mulyati, M.T. Optimization of Agar and Glycerol Concentration in the Manufacture of Edible Film. Int. Food Res. J. 2018, 25, 1845–1851. [Google Scholar]
  18. ASTM D6373; Standard Specification for Performance-Graded Asphalt Binder. American Society for Testing and Materials: West Conshohocken, PA, USA, 2021.
  19. ASTM D946; Standard Specification for Penetration-Graded Asphalt Binder for Use in Pavement Construction. American Society for Testing and Materials: West Conshohocken, PA, USA, 2020.
  20. ASTM D4402; Standard Test Method for Viscosity Determination of Asphalt at Elevated Temperatures Using a Rotational Viscometer. American Society for Testing and Materials: West Conshohocken, PA, USA, 2015.
  21. Mao, B.; Bentaleb, A.; Louerat, F.; Divoux, T.; Snabre, P. Heat-Induced Aging of Agar Solutions: Impact on the Structural and Mechanical Properties of Agar Gels. Food Hydrocoll. 2017, 64, 59–69. [Google Scholar] [CrossRef]
  22. Gudimettla, J.M.; Cooley, L.A.; Brown, E.R. Workability of Hot-Mix Asphalt. Transp. Res. Rec. 2004, 1891, 229–237. [Google Scholar] [CrossRef]
  23. Dessouky, S.; Pothuganti, A.; Walubita, L.F.; Rand, D. Laboratory Evaluation of the Workability and Compactability of Asphaltic Materials Prior to Road Construction. J. Mater. Civ. Eng. 2013, 25, 810–818. [Google Scholar] [CrossRef]
  24. ASTM D7175; Standard Test Method for Determining the Rheological Properties of Asphalt Binder Using a Dynamic Shear Rheometer. American Society for Testing and Materials: West Conshohocken, PA, USA, 2015.
  25. Mallick, R.B.; El-Korchi, T. (Eds.) Pavement Engineering: Principles and Practice, 3rd ed.; CRC Press LLC: Boca Raton, FL, USA, 2018. [Google Scholar]
  26. ASTM D5; Standard Test Method for Penetration of Bituminous Materials. American Society for Testing and Materials: West Conshohocken, PA, USA, 2020.
  27. Williams, E.G. When to Use What Grade of Asphalt and Why. Mater. Sci. 1961, 218–228. Available online: https://docs.lib.purdue.edu/cgi/viewcontent.cgi?article=3067&context=roadschool (accessed on 13 August 2025).
  28. Billington, S.L.; Srubar, W.V.; Michel, A.T.; Miller, S.A. Renewable Biobased Composites for Civil Engineering Applications. Sustain. Compos. Fibers Resins Appl. 2014, 2, 313–348. [Google Scholar]
  29. ASTM G21; Standard Practice for Determining Resistance of Synthetic Polymeric Materials to Fungi. American Society for Testing and Materials: West Conshohocken, PA, USA, 2021.
  30. ASTM D570; Test Method for Water Absorption of Plastics. American Society for Testing and Materials: West Conshohocken, PA, USA, 2022.
  31. Liu, J.; Wang, Y.; Wang, S.; Liu, Q.; Yu, B.; Wang, Q. Use of X-Ray Computed Tomography to Evaluate the Gradual Behaviour of Air Voids in Asphalt Mixtures during Permanent Deformation. Int. J. Pavement Eng. 2023, 24, 2134570. [Google Scholar] [CrossRef]
  32. Miljković, M.; Griffa, M.; Münch, B.; Plamondon, M.; Lura, P. Mesostructural Evolution of Fine-Aggregate Bitumen Emulsion–Cement Composites by X-Ray Tomography. Int. J. Pavement Eng. 2024, 25, 2283610. [Google Scholar] [CrossRef]
  33. ASTM D7063; Standard Test Method for Effective Porosity and Effective Air Voids of Compacted Bituminous Paving Mixture Samples. American Society for Testing and Materials: West Conshohocken, PA, USA, 2011.
  34. ASTM C642; Standard Test Method for Density, Absorption, and Voids in Hardened Concrete. American Society for Testing and Materials: West Conshohocken, PA, USA, 2021.
  35. du Plessis, A.; Boshoff, W.P. A Review of X-Ray Computed Tomography of Concrete and Asphalt Construction Materials. Constr. Build. Mater. 2019, 199, 637–651. [Google Scholar] [CrossRef]
  36. Frazier, S.D.; Matar, M.G.; Osio-Norgaard, J.; Aday, A.N.; Delesky, E.A.; Srubar, W.V. Inhibiting Freeze-Thaw Damage in Cement Paste and Concrete by Mimicking Nature’s Antifreeze. Cell Rep. Phys. Sci. 2020, 1, 100060. [Google Scholar] [CrossRef]
  37. Koenig, A. Analysis of Air Voids in Cementitious Materials Using Micro X-Ray Computed Tomography (µXCT). Constr. Build. Mater. 2020, 244, 118313. [Google Scholar] [CrossRef]
  38. Xu, X.; Xu, S.; Jin, L.; Song, E. Characteristic Analysis of Otsu Threshold and Its Applications. Pattern Recognit. Lett. 2011, 32, 956–961. [Google Scholar] [CrossRef]
  39. ORS, Object Research System. DragonFly Release Notes; ORS: Montreal, QC, Canada, 2019; pp. 1–68. [Google Scholar]
  40. Goodno, B.J.; Gere, J.M. Mechanics of Materials; Cengage Learning: Stamford, CT, USA, 2021. [Google Scholar]
  41. Hossain, M.S.; Kim, W.S. Estimation of Subgrade Resilient Modulus Using the Unconfined Compression Test; Virginia Center for Transportation Innovation and Research: Charlottesville, VA, USA, 2014. [Google Scholar]
  42. Hanz, A.J.; Bahia, H.U. Asphalt Binder Contribution to Mixture Workability and Application of Asphalt Lubricity Test to Estimate Compactability Temperatures for Warm-Mix Asphalt. Transp. Res. Rec. 2013, 2371, 87–95. [Google Scholar] [CrossRef]
  43. Fernández, E.; López, D.; Mijangos, C.; Duskova-Smrckova, M.; Ilavsky, M.; Dusek, K. Rheological and Thermal Properties of Agarose Aqueous Solutions and Hydrogels. J. Polym. Sci. Part B Polym. Phys. 2008, 46, 322–328. [Google Scholar] [CrossRef]
  44. Yu, Z.; Zhan, J.; Wang, H.; Zheng, H.; Xie, J.; Wang, X. Analysis of Influencing Factors on Viscosity of Agar Solution for Capsules. J. Phys.Conf. Ser. 2020, 1653, 012059. [Google Scholar] [CrossRef]
  45. Vieira, M.G.A.; da Silva, M.A.; dos Santos, L.O.; Beppu, M.M. Natural-Based Plasticizers and Biopolymer Films: A Review. Eur. Polym. J. 2011, 47, 254–263. [Google Scholar] [CrossRef]
  46. Yang, L.; Paulson, A.T. Mechanical and Water Vapour Barrier Properties of Edible Gellan Films. Food Res. Int. 2000, 33, 563–570. [Google Scholar] [CrossRef]
  47. Kheradmand, B.; Muniandy, R.; Hua, L.T.; Yunus, R.B.; Solouki, A. An Overview of the Emerging Warm Mix Asphalt Technology. Int. J. Pavement Eng. 2014, 15, 79–94. [Google Scholar] [CrossRef]
  48. Rubio, M.C.; Martínez, G.; Baena, L.; Moreno, F. Warm Mix Asphalt: An Overview. J. Clean. Prod. 2012, 24, 76–84. [Google Scholar] [CrossRef]
  49. Norziah, M.H.; Foo, S.L.; Karim, A.A. Rheological Studies on Mixtures of Agar (Gracilaria Changii) and κ-Carrageenan. Food Hydrocoll. 2006, 20, 204–217. [Google Scholar] [CrossRef]
  50. Somboon, N.; Karrila, T.T.; Kaewmanee, T.; Karrila, S.J. Properties of Gels from Mixed Agar and Fish Gelatin. Int. Food Res. J. 2014, 21, 485–492. [Google Scholar]
  51. Labropoulos, K.C.; Rangarajan, S.; Niesz, D.E.; Danforth, S.C. Dynamic Rheology of Agar Gel Based Aqueous Binders. J. Am. Ceram. Soc. 2001, 84, 1217–1224. [Google Scholar] [CrossRef]
  52. Ghebremedhin, M.; Seiffert, S.; Vilgis, T.A. Physics of Agarose Fluid Gels: Rheological Properties and Microstructure. Curr. Res. Food Sci. 2021, 4, 436–448. [Google Scholar] [CrossRef]
  53. Zhang, L.; Xing, C.; Gao, F.; Li, T.; Tan, Y. Using DSR and MSCR Tests to Characterize High Temperature Performance of Different Rubber Modified Asphalt. Constr. Build. Mater. 2016, 127, 466–474. [Google Scholar] [CrossRef]
  54. Gao, J.; Wang, H.; Liu, C.; Ge, D.; You, Z.; Yu, M. High-Temperature Rheological Behavior and Fatigue Performance of Lignin Modified Asphalt Binder. Constr. Build. Mater. 2020, 230, 117063. [Google Scholar] [CrossRef]
  55. Naveed, H.; ur Rehman, Z.; Hassan Khan, A.; Qamar, S.; Akhtar, M.N. Effect of Mineral Fillers on the Performance, Rheological and Dynamic Viscosity Measurements of Asphalt Mastic. Constr. Build. Mater. 2019, 222, 390–399. [Google Scholar] [CrossRef]
  56. Chen, Z.; Yi, J.; Chen, Z.; Feng, D. Properties of Asphalt Binder Modified by Corn Stalk Fiber. Constr. Build. Mater. 2019, 212, 225–235. [Google Scholar] [CrossRef]
  57. Lv, S.; Xia, C.; Yang, Q.; Guo, S.; You, L.; Guo, Y.; Zheng, J. Improvements on High-Temperature Stability, Rheology, and Stiffness of Asphalt Binder Modified with Waste Crayfish Shell Powder. J. Clean. Prod. 2020, 264, 121745. [Google Scholar] [CrossRef]
  58. Madera-Santana, T.J.; Robledo, D.; Azamar, J.A.; Ríos-Soberanis, C.R.; Freile-Pelegrín, Y. Preparation and Characterization of Low Density Polyethylene-Agar Biocomposites: Torque-Rheological, Mechanical, Thermal and Morphological Properties. Polym. Eng. Sci. 2010, 50, 585–591. [Google Scholar] [CrossRef]
  59. Nishinari, K.; Fang, Y. Relation between Structure and Rheological/Thermal Properties of Agar. A Mini-Review on the Effect of Alkali Treatment and the Role of Agaropectin. Food Struct. 2017, 13, 24–34. [Google Scholar] [CrossRef]
  60. Miandad, R.; Rehan, M.; Barakat, M.A.; Aburiazaiza, A.S.; Khan, H.; Ismail, I.M.I.; Dhavamani, J.; Gardy, J.; Hassanpour, A.; Nizami, A.-S. Catalytic Pyrolysis of Plastic Waste: Moving Toward Pyrolysis Based Biorefineries. Front. Energy Res. 2019, 7, 27. [Google Scholar] [CrossRef]
  61. Bonati, A.; Merusi, F.; Polacco, G.; Filippi, S.; Giuliani, F. Ignitability and Thermal Stability of Asphalt Binders and Mastics for Flexible Pavements in Highway Tunnels. Constr. Build. Mater. 2012, 37, 660–668. [Google Scholar] [CrossRef]
  62. Ragab, A.A.; Farag, R.K.; Kandil, U.F.; El-Shafie, M.; Saleh, A.M.M.; El-Kafrawy, A.F. Thermo-Mechanical Properties Improvement of Asphalt Binder by Using Methylmethacrylate/Ethylene Glycol Dimethacrylate. Egypt. J. Pet. 2016, 25, 397–407. [Google Scholar] [CrossRef]
  63. Nissa, R.C.; Fikriyyah, A.K.; Abdullah, A.H.D.; Pudjiraharti, S. Preliminary Study of Biodegradability of Starch-Based Bioplastics Using ASTM G21-70, Dip-Hanging, and Soil Burial Test Methods. IOP Conf. Ser. Earth Environ. Sci. 2019, 277, 012007. [Google Scholar] [CrossRef]
  64. Yemashova, N.A.; Murygina, V.P.; Zhukov, D.V.; Zakharyantz, A.A.; Gladchenko, M.A.; Appanna, V.; Kalyuzhnyi, S.V. Biodeterioration of Crude Oil and Oil Derived Products: A Review. Rev. Environ. Sci. Biotechnol. 2007, 6, 315–337. [Google Scholar] [CrossRef]
  65. Obahiagbon, K.O.; Amenaghawon, A.N.; Onyia, C. Prevention of Biodeterioration of Crude Oil in Tanks Using Anti-Microbial Agents. Int. J. Sci. Res. Environ. Sci. 2014, 2, 56–62. [Google Scholar] [CrossRef]
  66. Liu, Y.; Liu, X.; Duan, B.; Yu, Z.; Cheng, T.; Yu, L.; Liu, L.; Liu, K. Polymer–Water Interaction Enabled Intelligent Moisture Regulation in Hydrogels. J. Phys. Chem. Lett. 2021, 12, 2587–2592. [Google Scholar] [CrossRef]
  67. Rani, G.U.; Konreddy, A.K.; Mishra, S. Novel Hybrid Biosorbents of Agar: Swelling Behaviour, Heavy Metal Ions and Dye Removal Efficacies. Int. J. Biol. Macromol. 2018, 117, 902–910. [Google Scholar] [CrossRef]
  68. Kusmono; Abdurrahim, I. Water Sorption, Antimicrobial Activity, and Thermal and Mechanical Properties of Chitosan/Clay/Glycerol Nanocomposite Films. Heliyon 2019, 5, e02342. [Google Scholar] [CrossRef] [PubMed]
  69. Dave, P.N.; Gor, A. Chapter 3—Natural Polysaccharide-Based Hydrogels and Nanomaterials: Recent Trends and Their Applications. In Handbook of Nanomaterials for Industrial Applications; Mustansar Hussain, C., Ed.; Micro and Nano Technologies; Elsevier: Amsterdam, The Netherlands, 2018; pp. 36–66. ISBN 978-0-12-813351-4. [Google Scholar]
  70. Utech, S.; Boccaccini, A.R. A Review of Hydrogel-Based Composites for Biomedical Applications: Enhancement of Hydrogel Properties by Addition of Rigid Inorganic Fillers. J. Mater. Sci. 2016, 51, 271–310. [Google Scholar] [CrossRef]
  71. Jones, A.; Zeller, M.A.; Sharma, S. Thermal, Mechanical, and Moisture Absorption Properties of Egg White Protein Bioplastics with Natural Rubber and Glycerol. Prog. Biomater. 2013, 2, 12. [Google Scholar] [CrossRef] [PubMed]
  72. Wei, X.-F.; Linde, E.; Hedenqvist, M.S. Plasticiser Loss from Plastic or Rubber Products through Diffusion and Evaporation. Npj Mater. Degrad. 2019, 3, 18. [Google Scholar] [CrossRef]
  73. Chen, J.-S.; Yang, C.H. Porous Asphalt Concrete: A Review of Design, Construction, Performance and Maintenance. Int. J. Pavement Res. Technol. 2020, 13, 601–612. [Google Scholar] [CrossRef]
  74. Moretti, L.; Di Mascio, P.; Fusco, C. Porous Concrete for Pedestrian Pavements. Water 2019, 11, 2105. [Google Scholar] [CrossRef]
  75. Hamza, M.; Nie, Z.; Aziz, M.; Ijaz, N.; Akram, O.; Fang, C.; Ghani, M.U.; Ijaz, Z.; Noshin, S.; Madni, M.F. Geotechnical Behavior of High-Plastic Clays Treated with Biopolymer: Macro–Micro-Study. Environ. Earth Sci. 2023, 82, 91. [Google Scholar] [CrossRef]
  76. Cabalar, A.F.; Akbulut, N.; Demir, S.; Yildiz, O. Use of a Biopolymer for Road Pavement Subgrade. Sustainability 2023, 15, 8231. [Google Scholar] [CrossRef]
  77. Jang, J. A Review of the Application of Biopolymers on Geotechnical Engineering and the Strengthening Mechanisms between Typical Biopolymers and Soils. Adv. Mater. Sci. Eng. 2020, 2020, 1465709. [Google Scholar] [CrossRef]
  78. Fini, E.H.; Kalberer, E.W.; Shahbazi, A.; Basti, M.; You, Z.; Ozer, H.; Aurangzeb, Q. Chemical Characterization of Biobinder from Swine Manure: Sustainable Modifier for Asphalt Binder. J. Mater. Civ. Eng. 2011, 23, 1506–1513. [Google Scholar] [CrossRef]
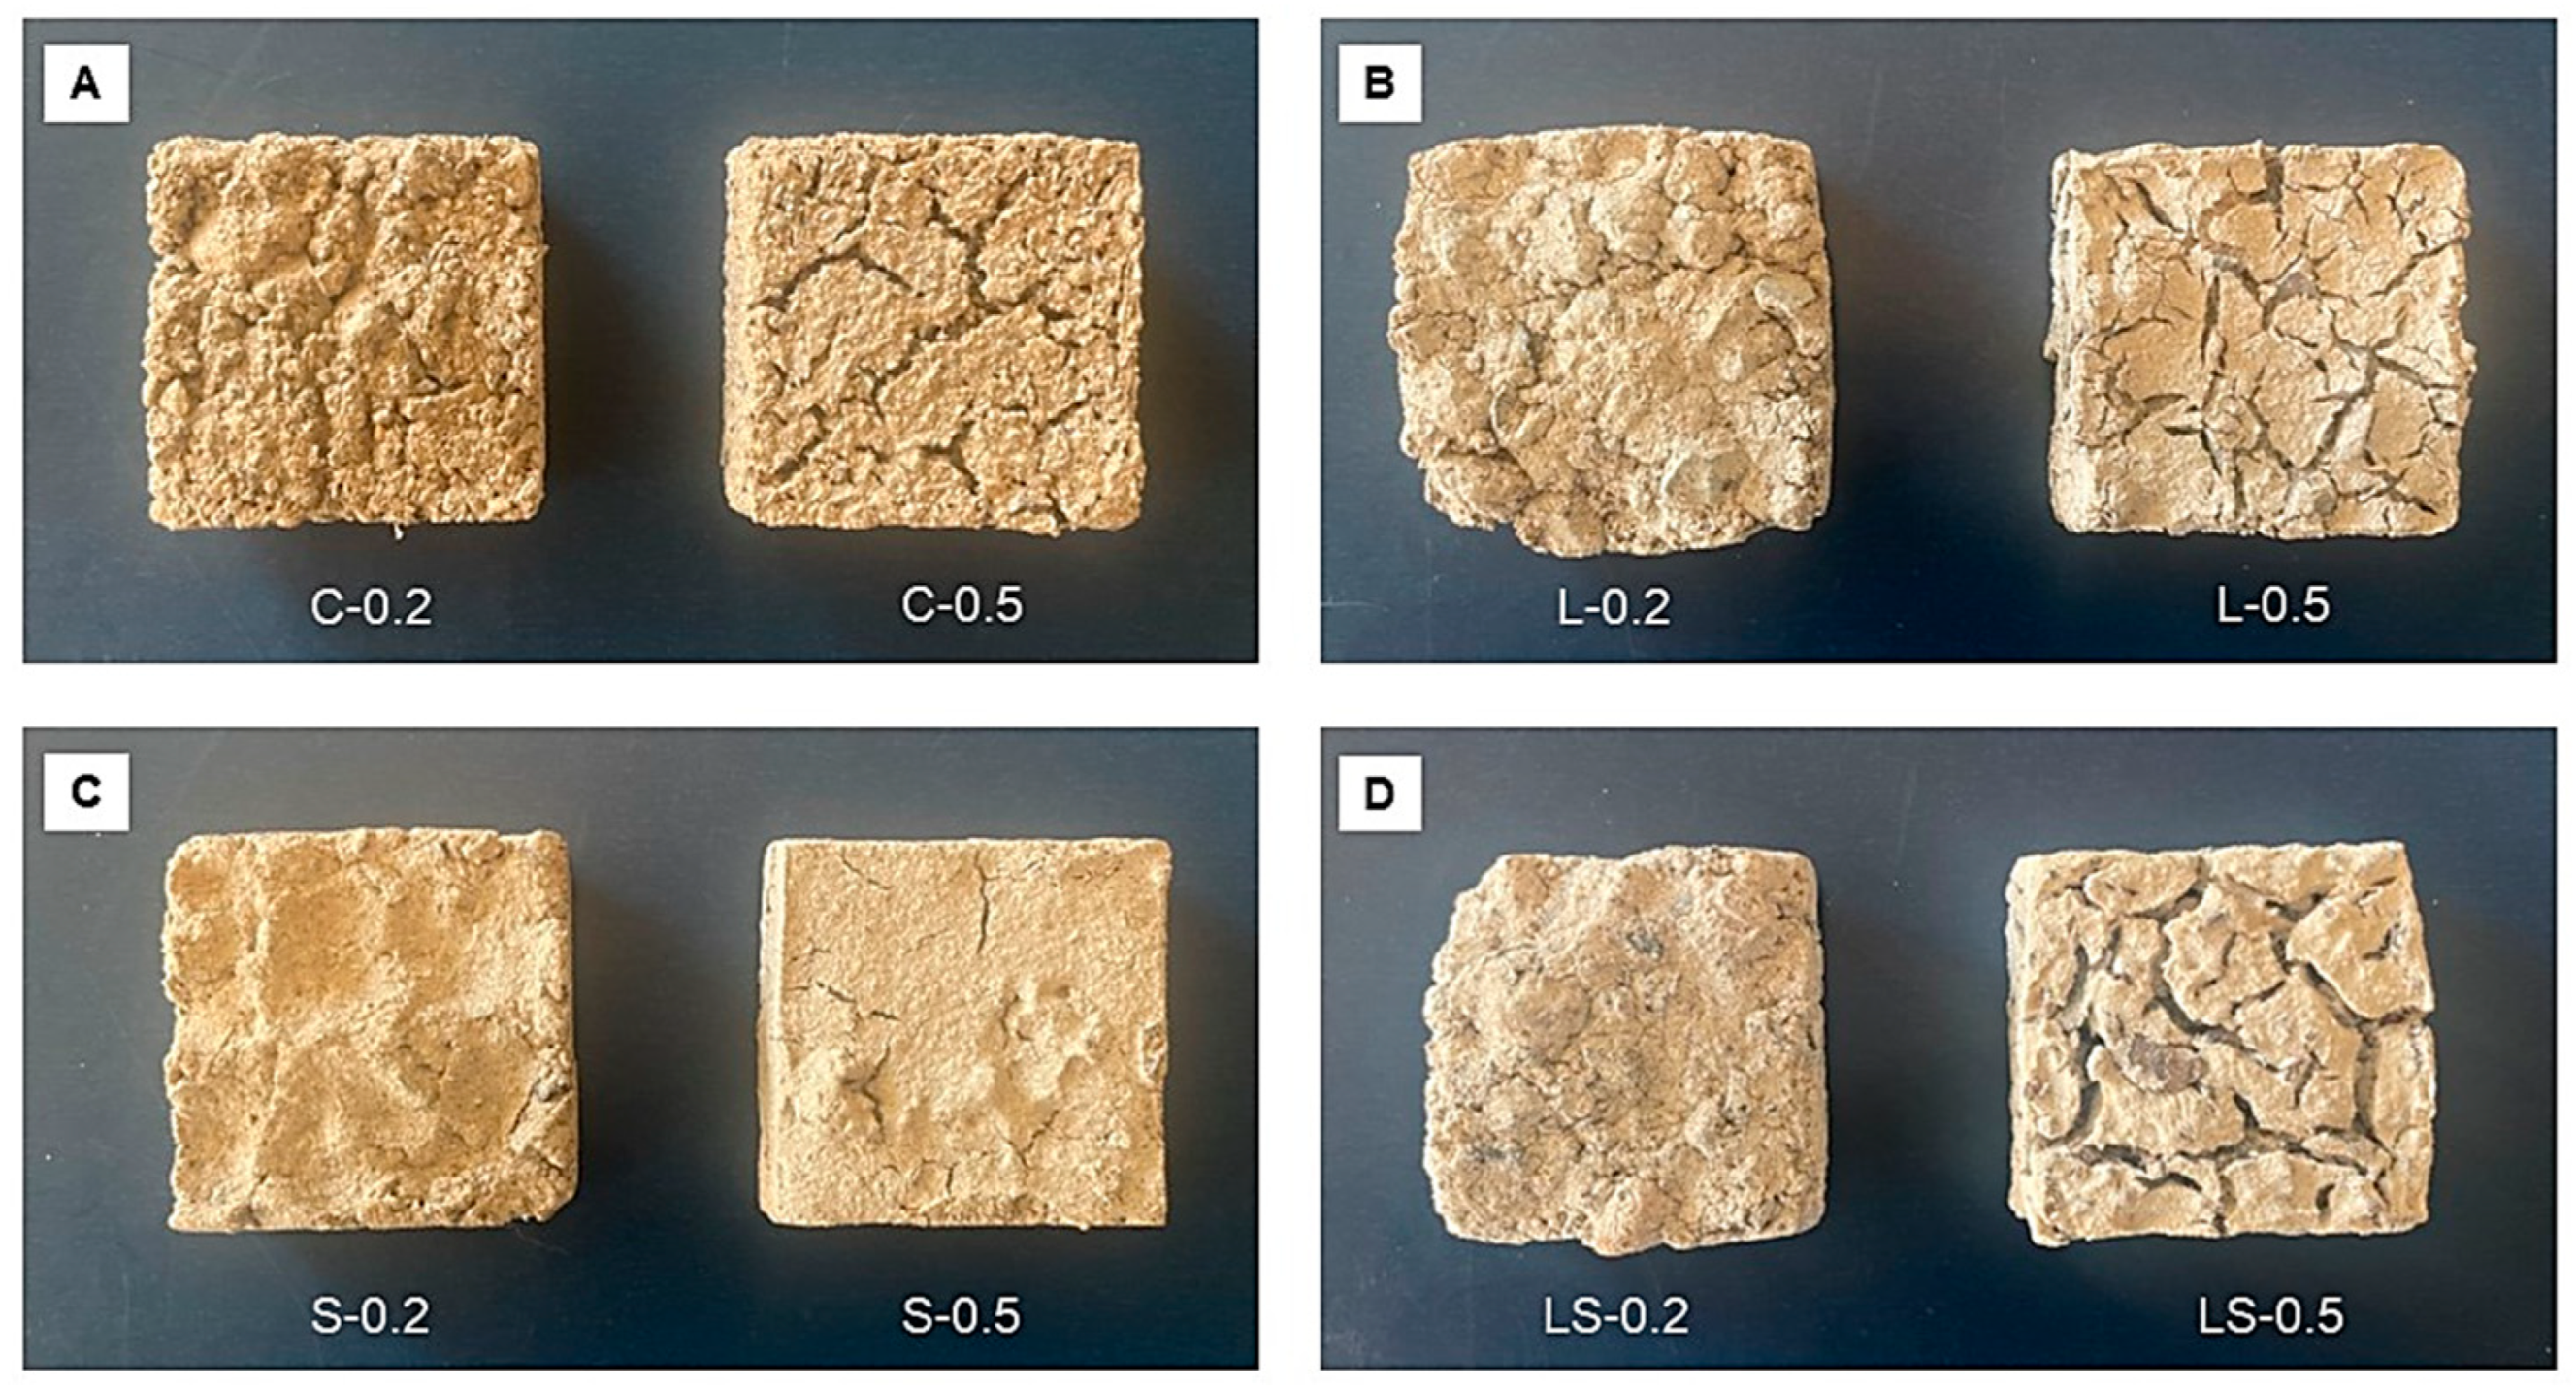
Figure 1. Representative images of samples prepared for X-ray tomography testing: (A) control samples; (B) limestone-reinforced samples; (C) sand-reinforced samples; and (D) limestone- and sand-reinforced samples.
Infrastructures 10 00223 g001
Figure 2. Segmentation processing implemented to analyze the porosity of agar-based composites: (A) X-ray tomography of the sample; (B) sample split at Otsu to segment particles (orange) from less dense components (blue); and (C) binder and air voids split at Otsu to segment binder and filler (orange) from voids (blue). Scale bar = 1 cm.
Infrastructures 10 00223 g002
Figure 3. Illustration of methodology used to calculate the modulus of elasticity (E) and modulus of resilience (Ur—shown in gray).
Infrastructures 10 00223 g003
Figure 4. Rotational viscosities (RV) of agar-based materials with no additives (C), glycerol (G), and limestone (L). Error represents ± one standard deviation of triplicate measurements.
Infrastructures 10 00223 g004
Figure 5. Representative results from dynamic shear rheometry (DSR) temperature sweeps (top) and rutting factor (bottom) for (A) 5% agar; (B) 7.5% agar; and (C) 10% agar specimens. Each sample was tested in duplicate.
Infrastructures 10 00223 g005
Figure 6. Mean rutting factor (i.e., G*/sin(δ)) for agar-binders at (A) 60 °C and (B) 80 °C. Error bars represent the high and low results for duplicate measurements.
Infrastructures 10 00223 g006
Figure 7. Representative results from thermogravimetric analysis for (A) 5% agar; (B) 7.5% agar; and (C) 10% agar specimens. Each sample was tested in duplicate.
Infrastructures 10 00223 g007
Figure 8. Representative photographs of agar-based materials subjected to ASTM G21 biodeterioration testing. Photos were taken at the end of a 28-day incubation period at 30 °C.
Infrastructures 10 00223 g008
Figure 9. Equilibrium moisture content (A) and mass loss (B) of samples immersed in 20 ± 2 °C distilled water. Error bars represent one standard deviation of triplicate measurements.
Infrastructures 10 00223 g009
Figure 10. X-ray tomography reconstructions and volume thickness map of pore network for control composites with (A) 0.2 agar binder content and (B) 0.5 agar binder content. Sample porosity as % volume is shown to the bottom left.
Infrastructures 10 00223 g010
Figure 11. Porosity (% volume) of agar-based composites tested in X-ray tomography.
Infrastructures 10 00223 g011
Figure 12. Median pore diameter (mm) of agar-based composites based on volume thickness map.
Infrastructures 10 00223 g012
Figure 13. Representative cross-section of agar-based composites for (A) C-0.2; (B) C-0.5; (C) L-0.2; (D) L-0.5; (E) S-0.2; (F) S-0.5; (G) LS-0.2; and (H) LS-0.5 samples. Dense aggregate, binder and fines, and voids shown in black, blue, and yellow, respectively. Red scale bar represents 1 cm length.
Infrastructures 10 00223 g013
Figure 14. Compressive strength of agar-based composites. Error bars represent standard deviation of five samples.
Infrastructures 10 00223 g014
Figure 15. Modulus of resilience of agar-based composites. Error bars represent standard deviation of five samples.
Infrastructures 10 00223 g015
Figure 16. Modulus of elasticity of agar-based composites. Error bars represent standard deviation of five samples.
Infrastructures 10 00223 g016
Table 1. Methods used to characterize agar-based binders and composites.
Characteristics of InterestMethods
Rheological properties of agar-based binderRotational Viscosity (ASTM D4402)
Dynamic Shear Rheometry (ASTM D7175)
Penetration (ASTM D5)
Durability of agar-based binderThermogravimetric Analysis (TGA)
Biodeterioration Resistance (ASTM G21)
Moisture Sorption Characteristics (ASTM D570)
Mechanical and microstructural characterization of agar-based compositesX-Ray Tomography Testing
Compressive Strength Testing
Resilient and Elastic Moduli Characterization
Table 2. Sample nomenclature and mixture formulations for binder testing.
SampleDeionized Water (mL)Agar (g)Glycerol (mL)Limestone (g)
A5-C20010--
A5-G200103.2-
A5-L20010-30
A5-GL200103.230
A7.5-C20015--
A7.5-G200154.8-
A7.5-L20015-30
A7.5-GL200154.830
A10-C20020--
A10-G200206.4-
A10-L20020-30
A10-GL200206.430
Table 3. Mass ratios of constituent mix components for agar-based composites.
SubsetSample Name5% w/w Agar BinderAggregateLimestoneSand
ControlC-0.20.201.00--
C-0.50.501.00--
Limestone fillerL-0.20.200.950.05-
L-0.50.500.950.05-
Sand fillerS-0.20.200.80-0.20
S-0.50.500.80-0.20
Limestone and sand fillerLS-0.20.200.750.050.20
LS-0.50.500.750.050.20
Table 4. Rating system used for the evaluation of agar-based material fungal resistance.
RatingObserved Growth on Specimens
0None
1Traces of growth (<than 10% of sample area)
2Light growth (10–30% of sample area)
3Medium growth (30–60% of sample area)
4Heavy growth (60% to complete coverage)
Table 5. Penetration results for agar-based binders in 0.1 mm. Error represents one standard deviation of triplicate measurements.
Agar-to-Water ConcentrationCGLGL
5% Agar>350>350>350>350
7.5% Agar>350>350225 ± 8162 ± 12
10% Agar211 ± 12217 ± 2167 ± 3162 ± 8
Table 6. Results for post hoc Dunn’s analysis used to evaluate the impact of aggregate composition on the compressive strength of agar-based composites. An asterisk (*) represents statistically significant results.
Pairwise Sample ComparisonZp-Value
C-L−0.95640.338
C-LS−2.25700.024 *
L-LS−1.30070.193
C-S−2.52480.011 *
L-S−1.56840.117
LS-S−0.26790.789
Table 7. Results for Scheirer Ray Hare analysis used to evaluate modulus of resiliency results for agar-based composites. An asterisk (*) represents statistically significant results.
Source of VariationdfSSHp Value
Binder Content11060.97.760.00533 *
Aggregate and Filler Composition3193.01.410.70256
Interaction3314.32.300.51246
Residuals (Within Group)323761.2
Table 8. Results for Scheirer Ray Hare analysis used to evaluate modulus of elasticity results for agar-based composites. An asterisk (*) represents statistically significant results.
Source of VariationdfSSHp Value
Binder Content12371.617.353.0 × 10−5 *
Aggregate and Filler Composition3965.87.070.0698
Interaction3166.61.220.7485
Residuals (Within Group)321826.0
Disclaimer/Publisher’s Note: The statements, opinions and data contained in all publications are solely those of the individual author(s) and contributor(s) and not of MDPI and/or the editor(s). MDPI and/or the editor(s) disclaim responsibility for any injury to people or property resulting from any ideas, methods, instructions or products referred to in the content.