Article

Multi-Model Intelligent Prediction of Rock Integrity in Tunnels Based on Geological Differences of Ground-Penetrating Radar Exploration Workfaces

1
Faculty of Geosciences and Environmental Engineering, Southwest Jiaotong University, Chengdu 610031, China
2
China Railway First Survey and Design Institute Group Co., Ltd., Xi’an 710043, China
3
State Key Laboratory of Intelligent Geotechnics and Tunnelling, Xi’an 710043, China
*
Author to whom correspondence should be addressed.
Infrastructures 2025, 10(8), 211; https://doi.org/10.3390/infrastructures10080211
Submission received: 20 May 2025 / Revised: 4 July 2025 / Accepted: 11 August 2025 / Published: 13 August 2025

Abstract

Intelligent prediction of rock integrity is essential for tunneling construction. Ground-Penetrating Radar (GPR), a high-resolution detection technique, is usually used for rock integrity prediction. However, the geological conditions of the detection workface are rarely considered when utilizing the GPR to forecast rock integrity. In this paper, a multi-model intelligent prediction method for tunnel rock integrity based on geological differences of GPR exploration workfaces is proposed. Firstly, the structural features are extracted from the GPR detection data through matrix calculations. A statistic is proposed to judge the abnormal data, and filtering rules are formulated to eliminate abnormal data. Then, considering the difference of geological conditions of the GPR exploration workface, multi-models are established with different degrees of fragmentation of the exploration workface. Finally, the validity of the multi-model prediction method is proved by practical engineering verification.

1. Introduction

With the acceleration of urbanization and the development of transport, the demand for infrastructure construction and large-scale tunneling projects has increased. Long tunneling projects with large depths and large cross-sections have become a common trend in modern engineering construction [1]. During the construction of such tunnels, fractured rock is often encountered, which is less stable and prone to accidents such as falling blocks and collapses [2,3]. Cracks in the fractured rock can also become water channels, increasing the risk of groundwater surge. Therefore, forecasting the rock integrity in advance can provide safety assurance for tunnel construction personnel and equipment [4,5]. Before tunnel excavation, obtaining the complete situation of the tunnel’s surrounding rock in advance can help engineers to fully understand the geological situation, discover potential geological hazards, formulate reasonable support, and avoid most of the accidents caused by collapses and falling blocks to ensure construction safety.
In recent years, with the continuous progress of science and technology, GPR has been widely used in advanced geological tunnel prediction [6]. GPR is well acknowledged for its efficiency, high accuracy, and other characteristics and is applied in tunnel engineering [7,8], road detection [9,10], and hydroelectric engineering [11]. However, the data processing process of GPR is complicated, and the resulting exploration data need to be professionally interpreted and analyzed, making the interpretation process complicated. A large number of scholars have conducted research on the above problems.
GPR is susceptible to metal interferences such as steel bars in tunnels, and the data are noisy. A geological radar noise suppression algorithm based on a compression-parallel non-local mean filtering method has been proposed, which reduces the computational complexity and improves the efficiency [12]. Aims to handle the attenuation of electromagnetic wave signals, employing an amplitude gain function, and using elimination methods have been proposed, which can identify the underground abnormal rock masses effectively [13]. In the field of GPR image denoising, scholars have developed a new algorithm that is based on the non-subsampled shearlet transform and grey wolf optimization [14]. This method demonstrates superior denoising performance while effectively preserving edge signals.
In terms of GPR interpretation, many scholars have utilized signal analysis methods to interpret the reflection wave signals of GPR [15,16]. Researchers have established an intelligent identification model for typical karst geological anomalies using a Gaussian Process, considering analyses in the time domain, frequency domain, and time–frequency domain [17]. In addition, the time domain, time–frequency domain, and spatial domain features of GPR were extracted by Zhang Run, achieving the conversion of unstructured detection results into structured features and laying the foundation for the intelligent prediction of rock mass integrity [18]. When it comes to the interpretation of GPR images, Gao and colleagues summarized the characteristics of the waveform, amplitude, phase, and frequency features of GPR images in a karst tunnel with typical examples, and they summarized the key to GPR image interpretation [19]. Chen proposed an automated positioning prediction method based on a convolutional neural network (CNN) algorithm for water-rich fragmentation zones in front of the tunnel palm faces [20], which has better detection accuracy for water-rich fragmentation zones in GPR images. The image pattern recognition technology has been introduced for the over-advanced geological forecasting of tunnels, and researchers successfully detected the hyperbolic features of the GPR image, which provided a new way for the identification of advanced geological tunnel prediction [21].
In addition to deep learning and other methods mentioned above, the fuzzy comprehensive evaluation method has also been widely used in advanced geological forecasting. Li extracted the relevant geological parameters of several common unfavorable geological conditions and the parameters of the physical exploration results. Then, the fuzzy neural network method was used to achieve a comprehensive prediction of common unfavorable geological conditions [22]. An improved analytic hierarchy process (AHP) has been proposed that introduces numerical weights and establishes an improved AHP model for GPR prediction accuracy classification [23].
All of the above studies are the basis for advance geological forecasting of tunnel rock integrity, but most of them did not consider the correlation between the geological conditions of the exploration workface and the rock integrity to be predicted. In the field of geological drilling, some scholars have already taken into account the influence of geological factors. For example, a two-layer model has been established by Gan Chao, where the formation drillability is first predicted. Subsequently, the predicted formation drillability is utilized as one of the inputs to the model for drilling rate prediction, thereby reducing the prediction error [24].
In order to meet the higher level requirements of risk avoidance in tunnel construction, a multi-model intelligent prediction method of rock integrity in tunnels based on the geological difference of GPR exploration workfaces is proposed. Given the impact of geological differences in the exploration workface on the rock integrity ahead of the palm face, the prediction models will be built separately for the geological differences of the working face, which can effectively improve the prediction accuracy.
To achieve this, we first analyze the structural and physical characteristics of fractured surrounding rock and elucidate the working principles and interpretation mechanisms of GPR. Subsequently, we develop a specific implementation process for our proposed multi-model intelligent prediction method, which takes into account the geological differences at the exploration workface. This method is then applied to actual engineering sites, where we utilize it to forecast and verify the conditions ahead of the tunnel face. The results obtained from these applications are thoroughly discussed to evaluate the method’s effectiveness. Finally, we summarize the key contributions of this research, highlighting its potential for enhancing the safety and efficiency of tunnel construction through more accurate geological predictions.

2. Characteristics Analysis

This section analyzes the structural and physical properties of fractured rock, followed by an explanation of the principles and interpretation techniques of GPR detection.

2.1. Rock Integrity Characteristics and Fractured Rock Structure

To quantitatively evaluate rock mass quality and guide tunnel support design, several internationally recognized classification systems have been developed [25]. Among them, the Rock Mass Rating (RMR) system and the Q-system are two widely used approaches [26]. The RMR system evaluates rock mass based on parameters that include uniaxial compressive strength, rock quality designation (RQD), joint spacing, joint condition, groundwater inflow, and orientation adjustment [27]. The Q-system, on the other hand, integrates RQD, number of joint sets, joint roughness, joint alteration, stress reduction factor, and groundwater conditions to provide a comprehensive index of rock mass quality [28]. These systems are essential tools for engineers to assess the stability and support requirements of rock masses in various geological settings.
Despite the widespread use of RMR and Q-systems, different projects may require specific criteria tailored to local geological conditions. In this study, we adopt the engineering rock mass classification standard as defined by relevant regulations in China [29]. According to this standard, rock integrity is qualitatively classified into five grades: complete, fairly complete, slightly broken, broken, and extremely broken. This classification is based on key indicators such as joint characteristics (including spacing, continuity, and filling materials), the types of dominant structural planes, and their degree of interlocking. These classifications reflect the degree of fracturing and continuity within the rock mass, which directly influence its mechanical behavior and stability. This five-grade classification provides a practical framework for assessing the integrity of rocks ahead of tunnel excavation, ensuring that appropriate measures are taken to mitigate potential risks during construction.
Fractured rock is an unfavorable geology often found in tunnel environments, and it is an important cause of collapse and water surges during tunnel construction [30]. The fracture development in broken rock bodies results in high permeability, which can become a conduit for water and other liquids. It also leads to lower mechanical strength and poorer stability of the broken rock body relative to the intact rock body, which is prone to greater deformation under stress. In the area of broken rock, the uneven filling of fractures with different materials will lead to local reductions in density, increases in conductivity, and decreases in elastic modulus. The propagation velocity of sound waves and the attenuation rate of electromagnetic waves will change, typically due to large differences in physical properties such as dielectric constant and elastic wave impedance within these areas. Therefore, in the actual tunnel construction process, usually the seismic wave reflection method, electromagnetic wave method, and other methods are used to detect the rock body in front of the palm face. The integrity of unexcavated rock masses can be identified in advance by analyzing the response characteristics of broken rock to reflected seismic waves and electromagnetic waves.

2.2. The Interpretation Mechanism of GPR

The working principle of GPR involves using a transmitting antenna to emit high-frequency electromagnetic waves. When these electromagnetic waves encounter interfaces between media with different electrical properties, they undergo refraction and generate reflected waves. The radar’s receiving antenna captures these reflected waves. By analyzing the travel time, amplitude, and waveform of the reflected waves, it is possible to infer the structural morphology of the medium. The geological radar exploration schematic diagram is shown in Figure 1.
By processing and analyzing the radar images, the amplitude, frequency, and other characteristics of the reflected waves are extracted, which can be used to forecast the rock integrity in front of the palm face. The existence of adverse geology such as fracture zones and karst will change the integrity of the rock, in which the rock is broken and accompanied by fissure water or air filling, and there are large electrical differences. As summarized by a large number of scholars, the fragmented rock will lead to strong reflections, misalignment of the same phase axis of the reflected waves, and disorganized waveforms in the GPR images [18].
As the environment of GPR exploration and the geological conditions of surrounding rocks are usually complicated, this also leads to difficulty in interpreting GPR images, which usually require a lot of prior information to interpret correctly. The response characteristics of different adverse geological conditions in GPR images are variable and difficult to identify accurately, which also require technicians to have rich professional knowledge and experience. Considering that interpretation of the GPR exploration results is a complex engineering problem, the experience of the technicians in the interpretation will be fully absorbed, and a multi-model prediction method of rock integrity based on the geological differences of the working face will be proposed, which provides a new way of thinking for advanced geological prediction of tunnels.

3. Methodology

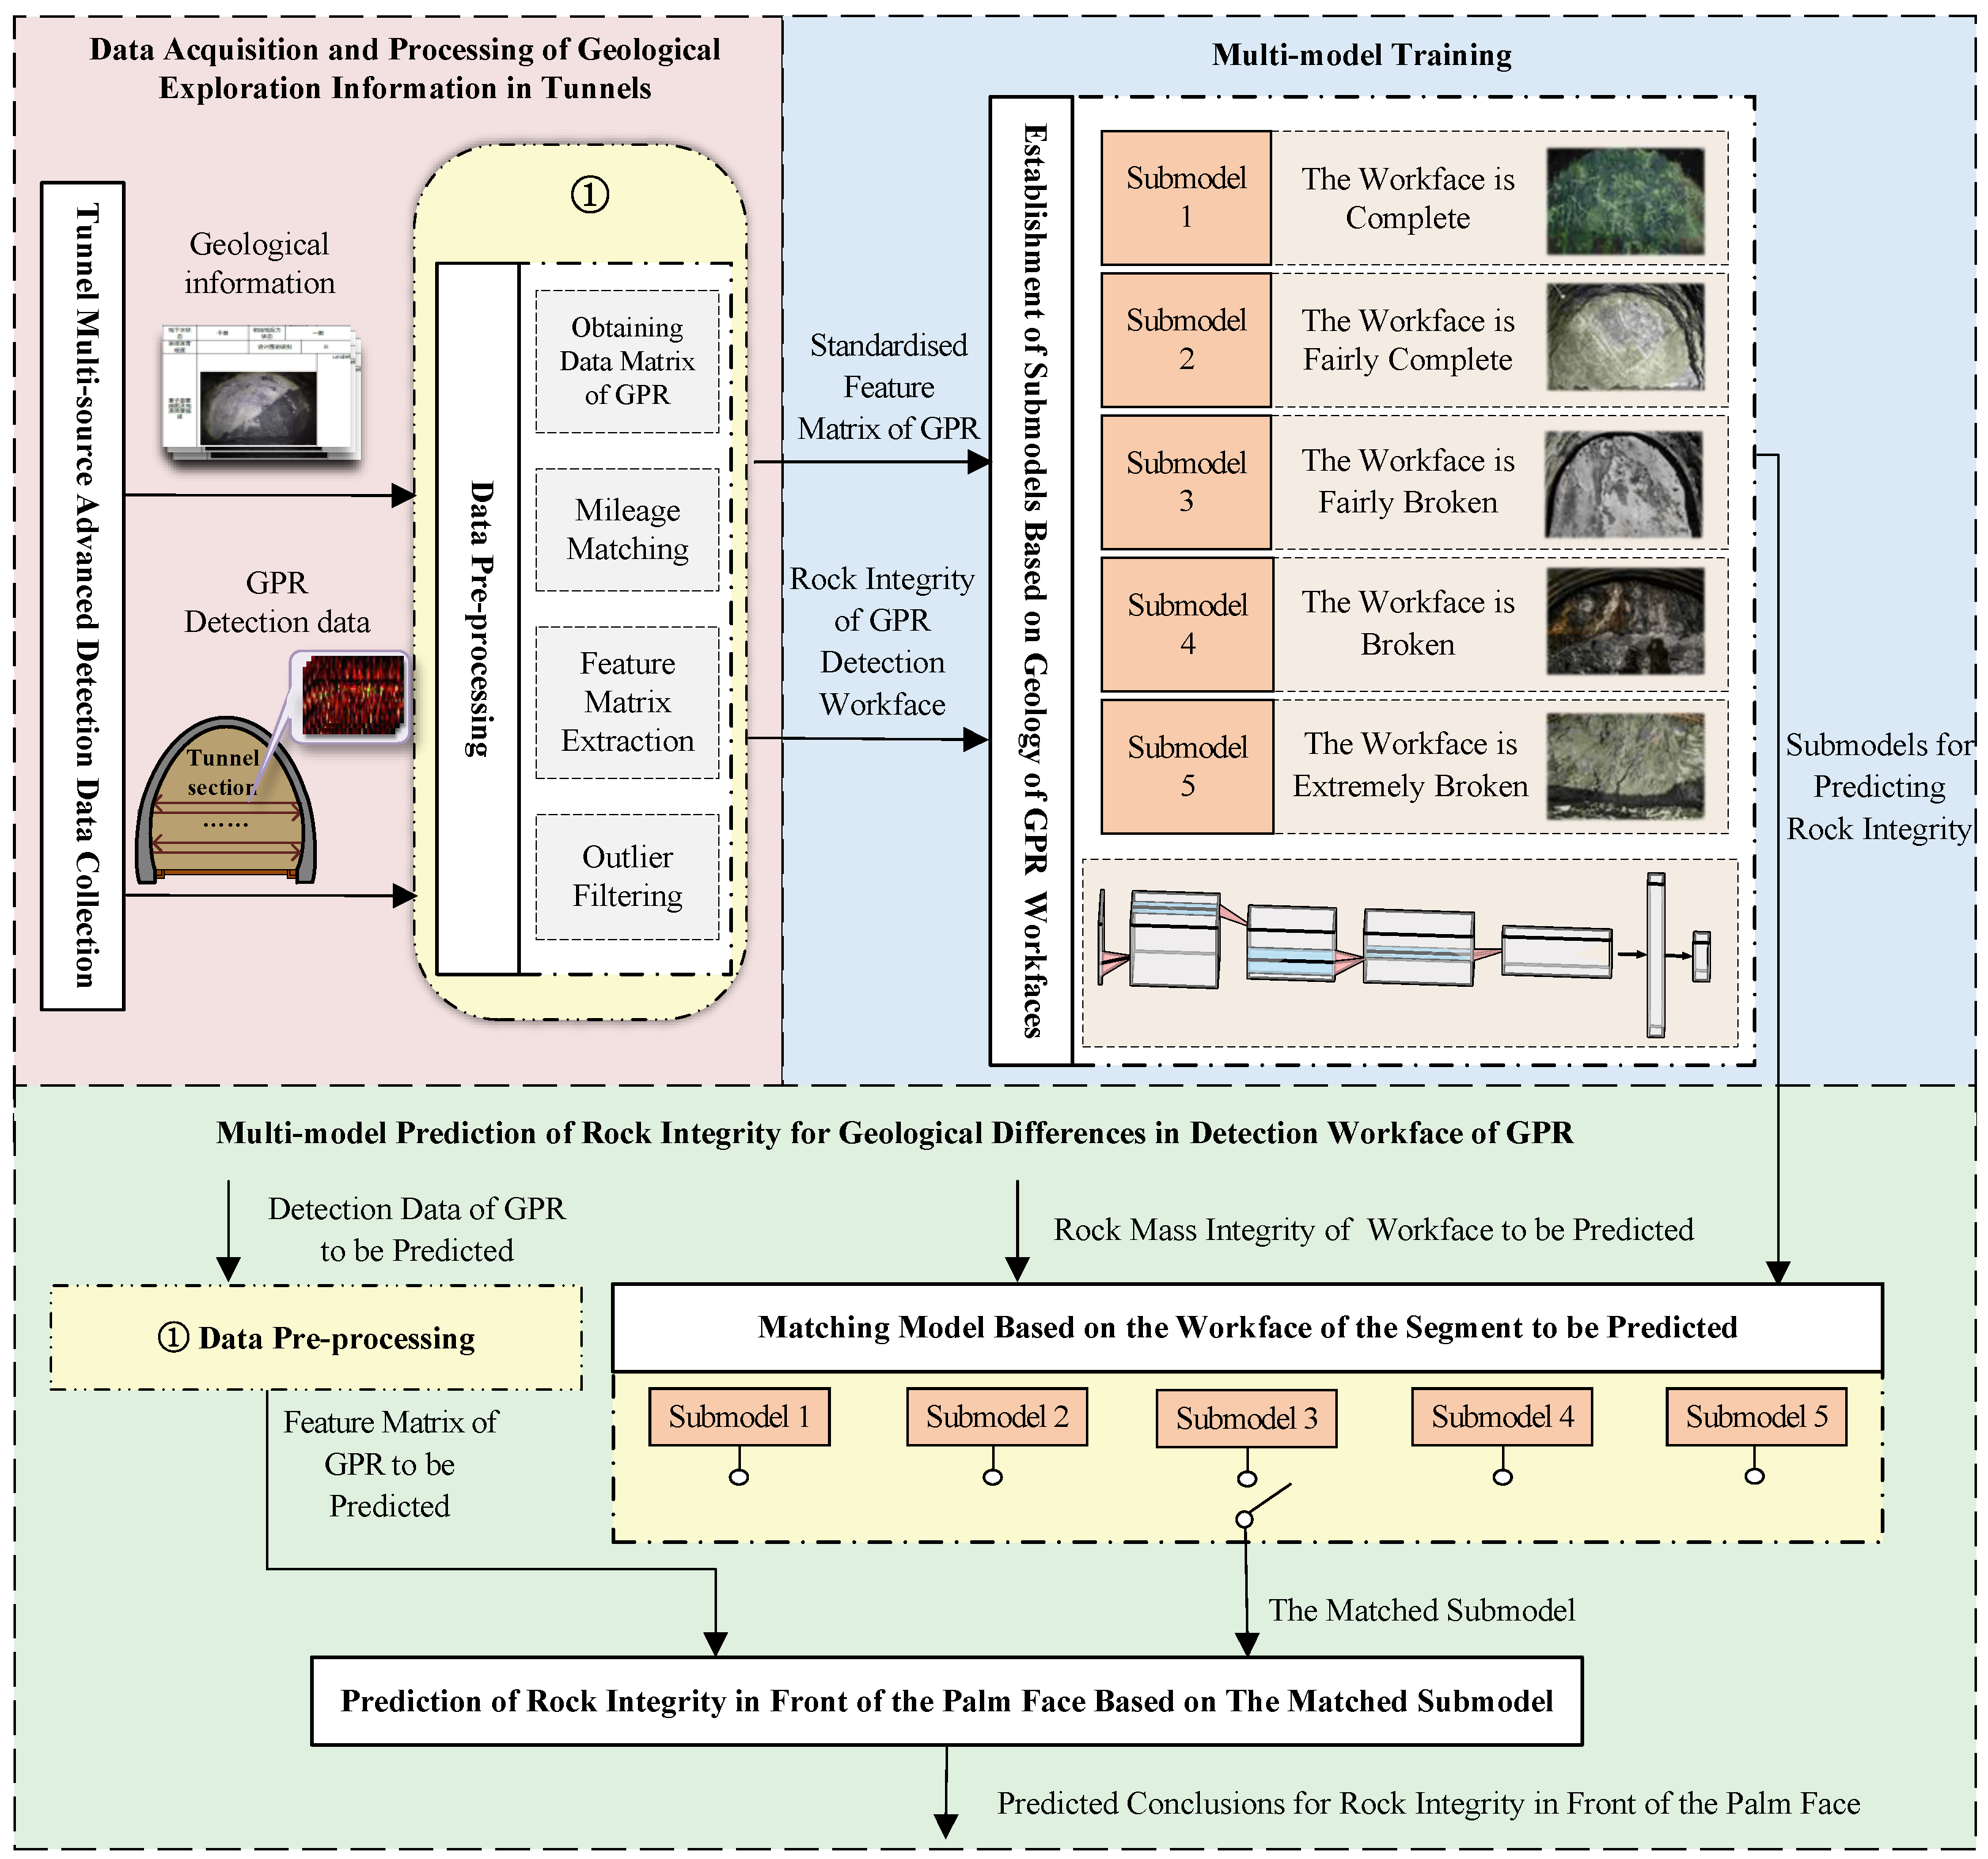
This section will introduce the data processing procedure for advanced geological tunnel forecasting, as well as the multi-model training and forecasting approach for rock integrity in response to geological differences at the working face as detected by geological radar. The specific framework is shown in Figure 2.
Firstly, read the GPR detection result file according to a specific file header format to obtain the original relative amplitude matrix of the electromagnetic wave. According to the mileage points of the target palm face, match the relative amplitude matrix within its neighborhood. For the sake of unifying the size of the feature matrix, superpose the relative amplitude feature matrix corresponding to the mileage according to the columns. Rules for filtering out abnormal data are established to remove abnormal feature matrices. On this basis, considering the differences in rock mass integrity grades among the GPR exploration working faces, multi-models are established using training data from different degrees of fragmentation on the working face. Finally, according to the working face conditions of the mileage to be predicted, a suitable model will be matched and the rock integrity forecast will be completed.

3.1. Data Pre-Processing

This section will introduce the data acquisition and processing method of geological exploration information in tunnels.

3.1.1. Obtaining Relative Amplitude Matrix of GPR

The relative amplitude data of the electromagnetic wave obtained by reading the DZT file of the GPR exploration results in a two-dimensional matrix A, and the form of A is as follows:
A = a 11 a 12 a 1 n a 21 a 22 a 2 n a m 1 a m 2 a m n .
where the column vectors of matrix A correspond to the direction along the cross-section of the tunnel face, while the row vectors correspond to the direction along the mileage; m represents the number of rows, and n represents the number of columns; a m n is the relative amplitude value of the m t h row n t h column of the matrix A.
Maximum and minimum normalization are performed on each element of the matrix A to obtain the normalized matrix, as shown in the following equation:
a i j _ norm = a i j a min a max a min , ( i = 1 , 2 , , m ; j = 1 , 2 , , n )
where a i j _ norm is the element of the ith row and jth column of the normalized matrix, a i j is the element of the ith row and jth column of the original matrix, a min is the minimum value of matrix A, and a max is the maximum value of matrix A.

3.1.2. Mileage Matching and Feature Matrix Extraction

For each palm face mileage point, the feature matrix within the neighborhood of the mileage point is matched and extracted in the GPR electromagnetic wave relative amplitude matrix, and the corresponding row position of the mileage point in the electromagnetic wave relative amplitude matrix is determined by Equation (3):
L p a l m f a c e = M p a l m f a c e M w o r k f a c e · T n s a m p T d e p t h + 1
where L p a l m f a c e is the corresponding row in the relative amplitude matrix for that mileage point; M p a l m f a c e is the mileage value where the palm face is located; M w o r k f a c e is the mileage value where the working face is located; T n s a m p is the number of sample points; and T d e p t h is the detection depth.
Due to the huge amount of data in the original relative amplitude matrix obtained from GPR exploration data, in order to improve computational efficiency, the feature matrix will be extracted for each palm face to reduce the amount of data and simplify the data. In reality, the palm face is a plane, corresponding to only one row in the feature matrix. If the geological conditions are predicted only based on a single row of data, the result may be subject to randomness. Considering the correlation between the geological conditions of the palm face and its neighbouring rock mass, the relative amplitude matrix of the palm face and its certain neighborhood range are taken as the feature matrix of the palm face.
Take the L p a l m f a c e row and the subsequent fixed rows of data in the relative amplitude matrix, totaling Num r o w s rows, to form the relative amplitude matrix within the neighborhood corresponding to the mileage point of this palm face, denoted as B .
The newly formed matrix is stacked by columns to find the mean value. First, calculate the number of columns N s t a c k e d that need to be stacked each time; the formula is as in Equation (4). Then, for each row element in the matrix B obtained in the previous step, every N s t a c k e d elements are stacked to find the mean value of the operation. The dimensions of the relative amplitude matrix corresponding to each mileage point of the working face are unified to Num r o w s × Num c o l s , denoted as B.
N s t a c k e d = n Num c o l s

3.1.3. Outlier Filtering

In order to improve the quality of data, first of all, on the basis of the obtained feature matrix, the abnormal data screening rules are formulated, and the outlier indicator is determined to be the sum of the row variances, which is noted as S u m v a r , and the formula is calculated in Equation (5), in which b i j is the element of the ith row and jth column of the matrix B, and μ i is the mean value of the ith row; the equation is defined as follows:
S u m v a r = i = 1 Num r o w s j = 1 Num c o l s ( b i j μ i ) 2 / Num c o l s
Set the threshold as T; if S u m v a r < T , it indicates that the GPR electromagnetic wave detection data have almost no fluctuation; it is an anomalous sample, and the palm face sample will be excluded.

3.2. Multi-Model Training and Prediction

This section will introduce the data segmentation and multi-modeling approach considering the geological differences in the GPR exploration workface.

3.2.1. Data Analysis and Segmentation

According to the described feature matrix extraction and anomaly data screening method, the electromagnetic wave relative amplitude feature matrix is extracted for each palm face to form a dataset.
Taking into account the geological variations across the surveyed palm face of GPR, all samples can be categorized into five grades: complete, fairly complete, slightly fractured, fractured, and extremely fractured.
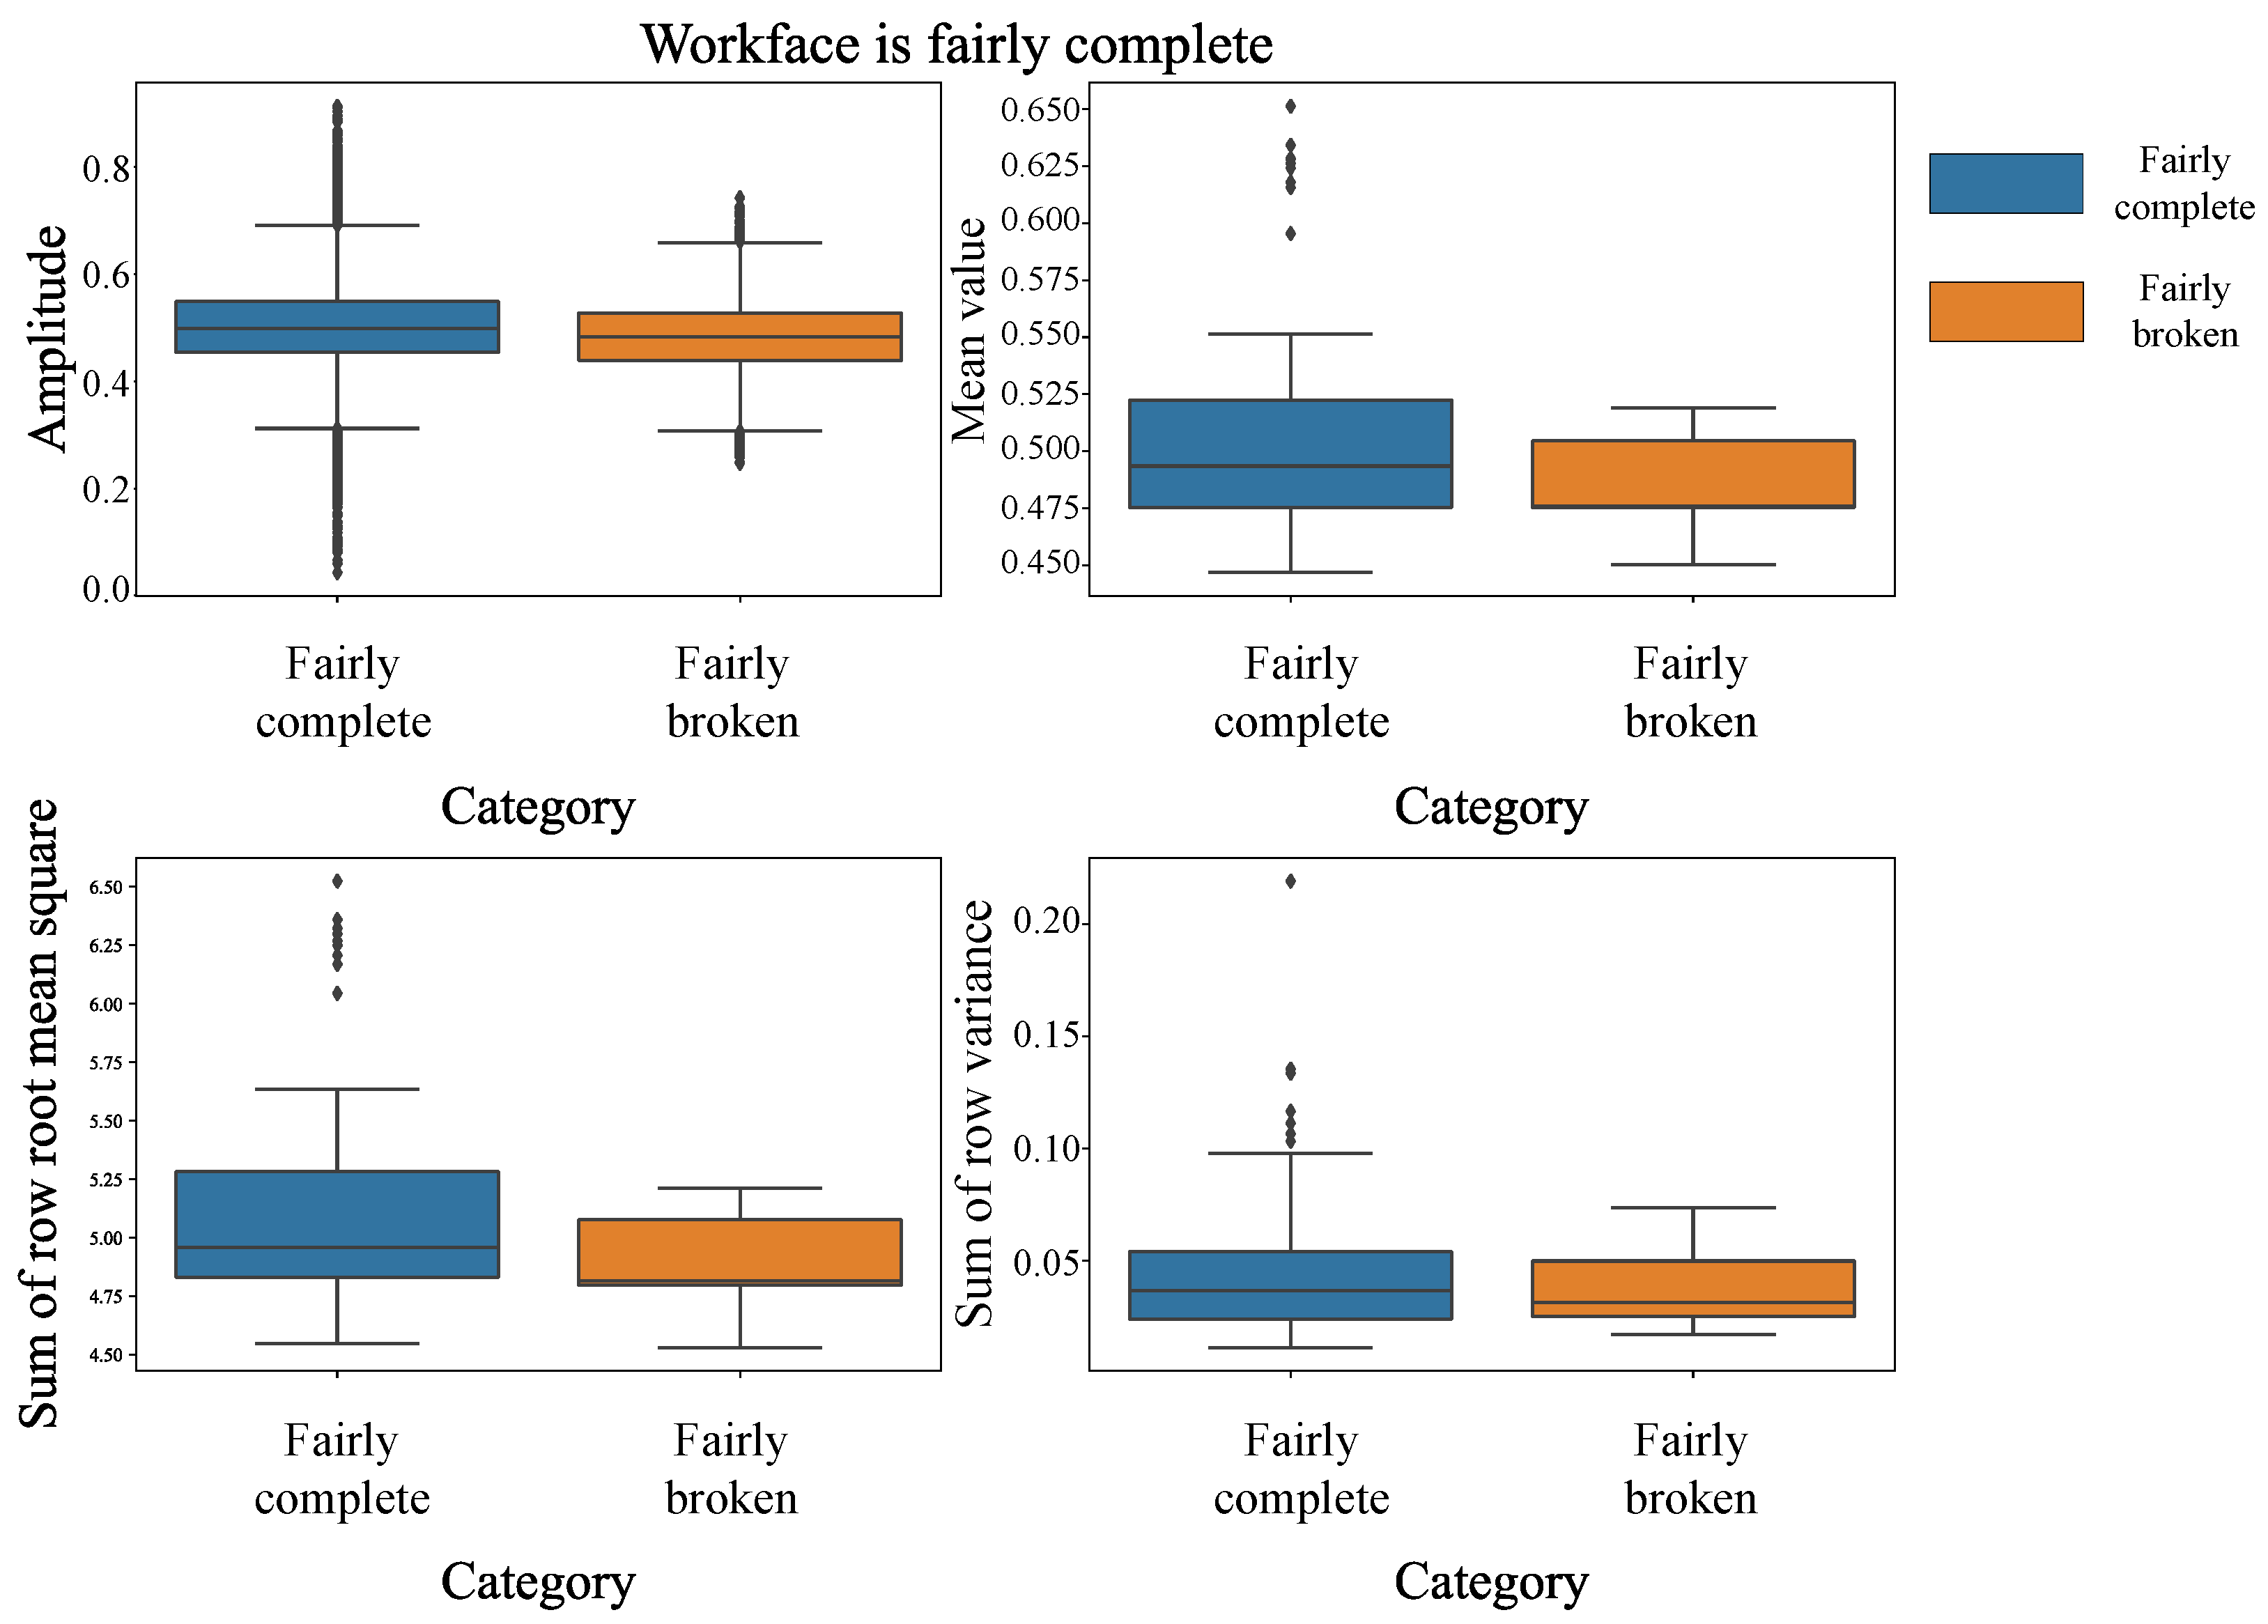
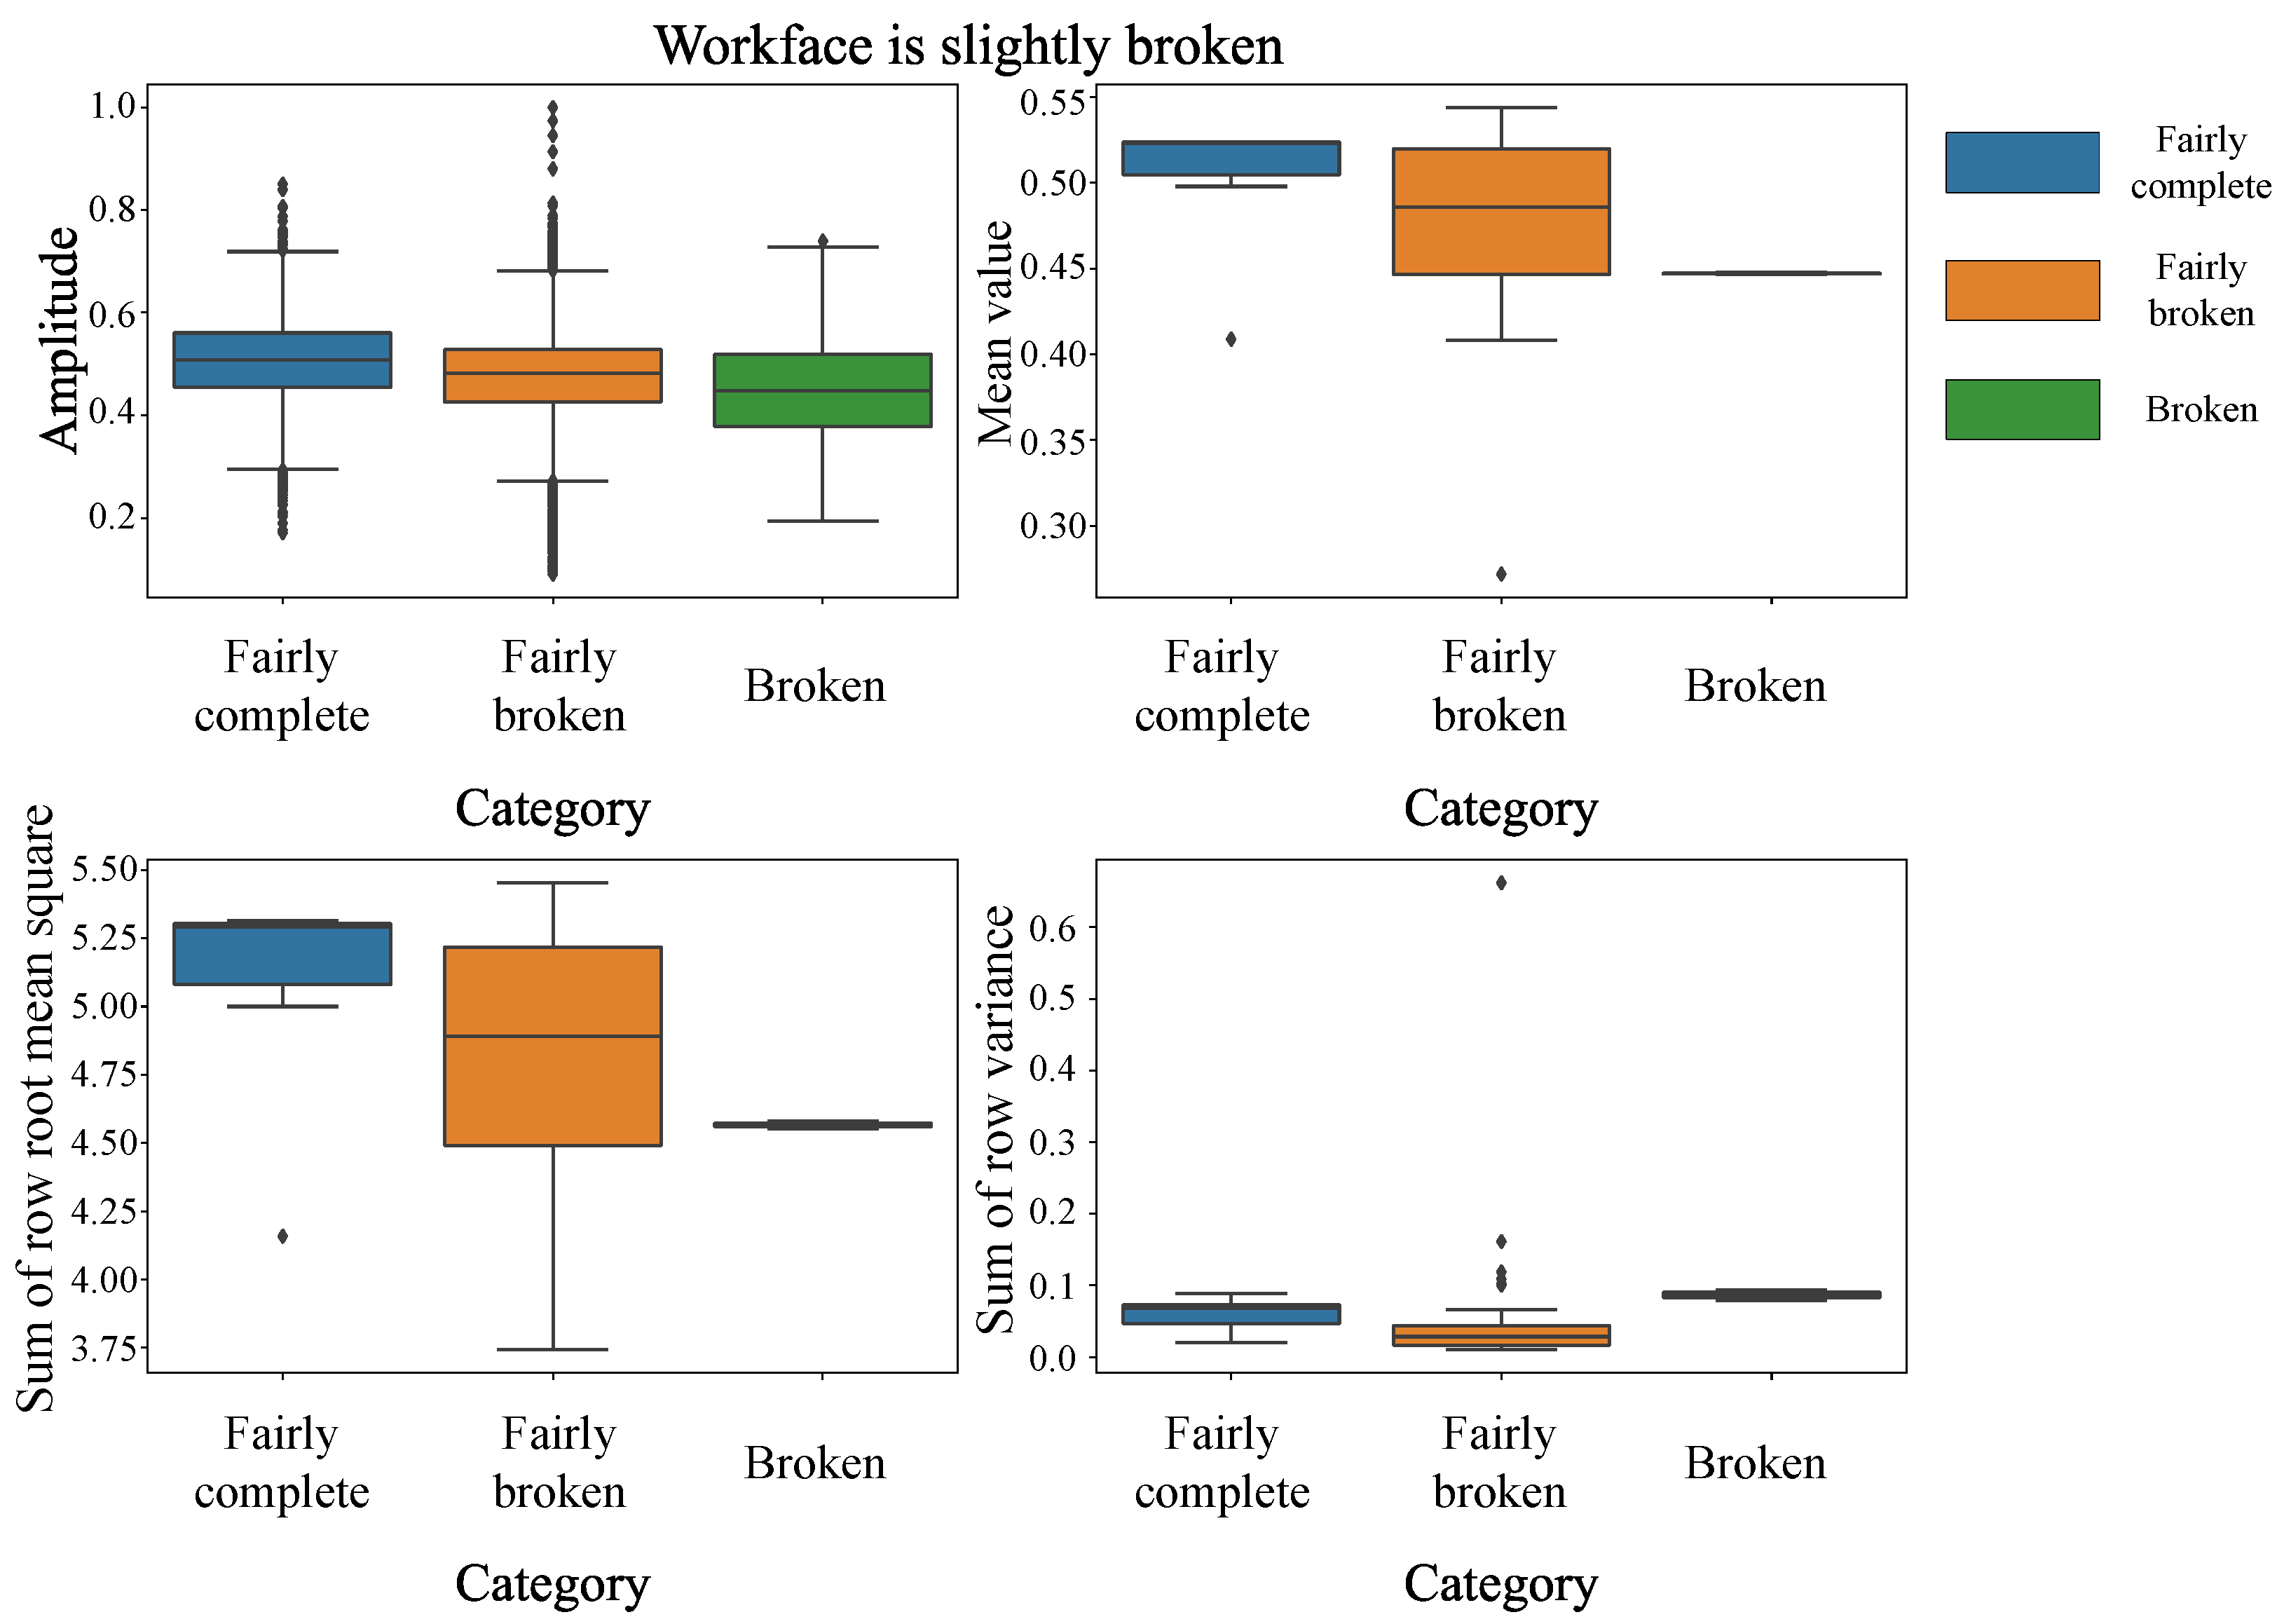
In order to analyze the relative data distribution characteristics of the electromagnetic wave, the amplitude value of the statistical feature matrix, as well as three statistical quantities of mean, sum of row root mean square, and sum of row variance based on the amplitude value, will be computed. And box plots will be drawn to compare the dataset before and after the division. Figure 3 shows before division, and Figure 4, Figure 5, and Figure 6 show the exploration workface as fairly complete, slightly broken, and broken after division, respectively.
It can be seen through comparison that when the data are not divided according to the geological condition of the working face, the distribution characteristics of amplitude and the other three statistics corresponding to each type of rock integrity are similar and cannot be completely distinguished. After dividing the data according to the geological condition of the working face, the complex data distribution characteristics can be distinguished. It is worth mentioning that when the working face condition is broken, there is only one category of rock integrity behind the palm face, so the data analysis and prediction may become simpler and more accurate, thus reducing the complexity and uncertainty. This is also in line with the habit of field experts in making forecasts, who tend not to reduce the rock integrity forecast results when the rock integrity of the working face is poor in order to maximize the construction risk avoidance.

3.2.2. Multi-Model Training

The dataset was divided according to the geological differences of the exploration workface and then input into the convolutional neural network to train the respective corresponding models. The CNN is mainly composed of an input layer, convolutional layer, pooling layer, fully connected layer, and output layer. The convolutional layer is the core of the CNN, through which the convolution operation can effectively capture the local features of the input data. The pooling layer is used to reduce the size of the features, reduce the amount of computation, and retain the main feature information. The commonly used pooling methods are Maximum Pooling and Average Pooling; Maximum Pooling was used in this paper. The structure of the CNN network used in this paper is shown in Table 1. It includes two convolutional layers, two pooling layers, and one fully connected layer.
In the back-propagation stage, the cross-entropy loss function was chosen for use in this paper, which is shown in Equation (6), where N is the number of samples, C is the number of categories, y i , c is the true labeling of the ith sample belonging to the category c, and p i , c is the predicted probability of ith sample being predicted to be in category c.
The Adaptive Moment Estimation optimization algorithm was used in this paper, and it was used to adjust the network weights and biases to minimize the cross-entropy loss function.
CE Loss = 1 N i = 1 N c = 1 C y i , c log ( p i , c )

4. Experimental Results and Discussions

The GPR exploration data used in the experimental part of this paper all came from actual tunnel sites. The selected tunnels are deeply buried and cross several fracture zones, where adverse geological problems such as high in situ stress, high geothermal temperature, sudden water surges, and dangerous rockfalls are prominent. These areas require advanced geological forecasting prior to construction, and appropriate measures were taken in advance to reduce risks.

4.1. Dataset Preparation

The proposed feature extraction method was adopted to extract the feature matrix for 44 tunnels. The dataset containing 694 samples was constructed, covering three rock integrity grades—fairly complete, fairly broken, and broken. The training data came from 34 tunnel sites, with 90 batches of detection data, and the test data came from 10 tunnel sites, with 29 batches of detection data. The test data came from 10 tunnel sites, with 29 batches of detection data. Num r o w s = 40 and Num c o l s = 10 were set to extract the GPR exploration data within the range of 1.2 m in front and behind the palm face. Then, they were inputted into the trained multi-model according to the difference in rock integrity of the working face respectively to get the predicted results.

4.2. Results and Analysis

In addition to the methods proposed in the paper, two additional methods were used for comparative experiments. The first comparative method involved manual prediction of the rock integrity ahead of the palm face by professionals based on the obtained GPR detection data. The second comparative method involved training a single model without classifying the dataset based on the conditions of the exploration workface. This model utilized the same CNN network structure as the proposed method. The prediction accuracy of the three methods in ten tunnels were compared, and the results are shown in Figure 7. The comparison shows that the proposed method has an average accuracy of more than 90% and is generally better than the undivided face prediction and manual prediction.
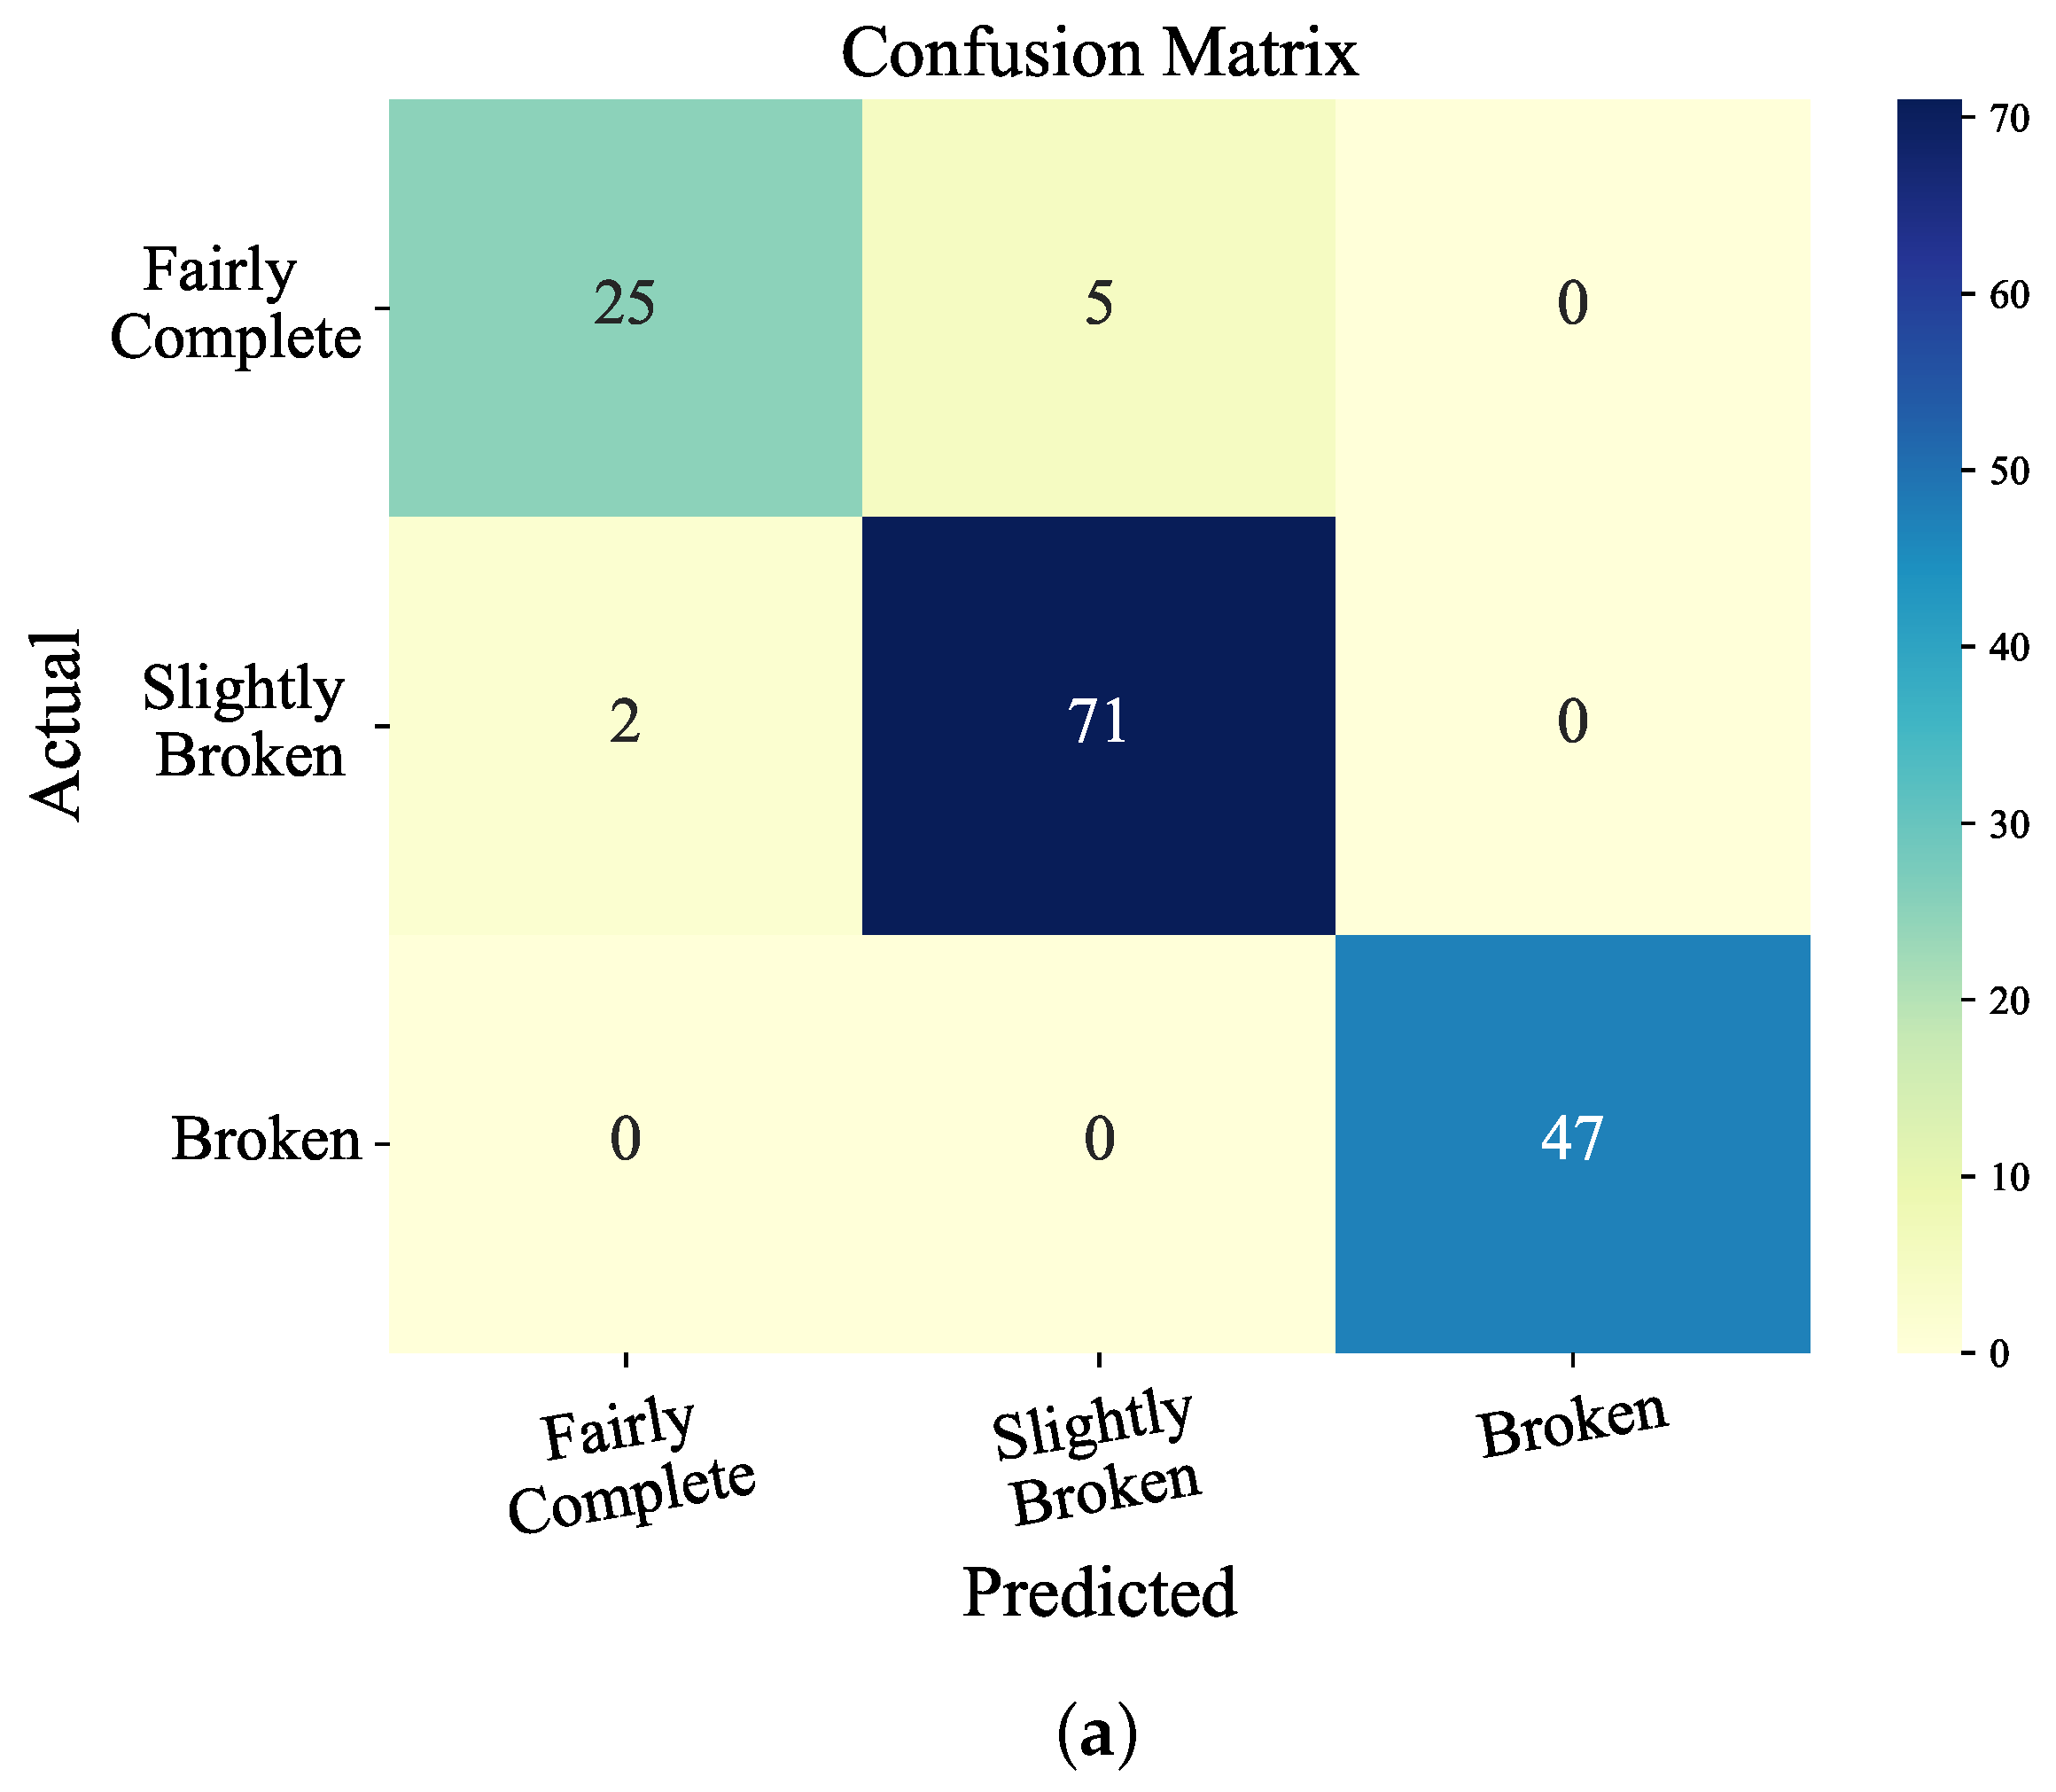
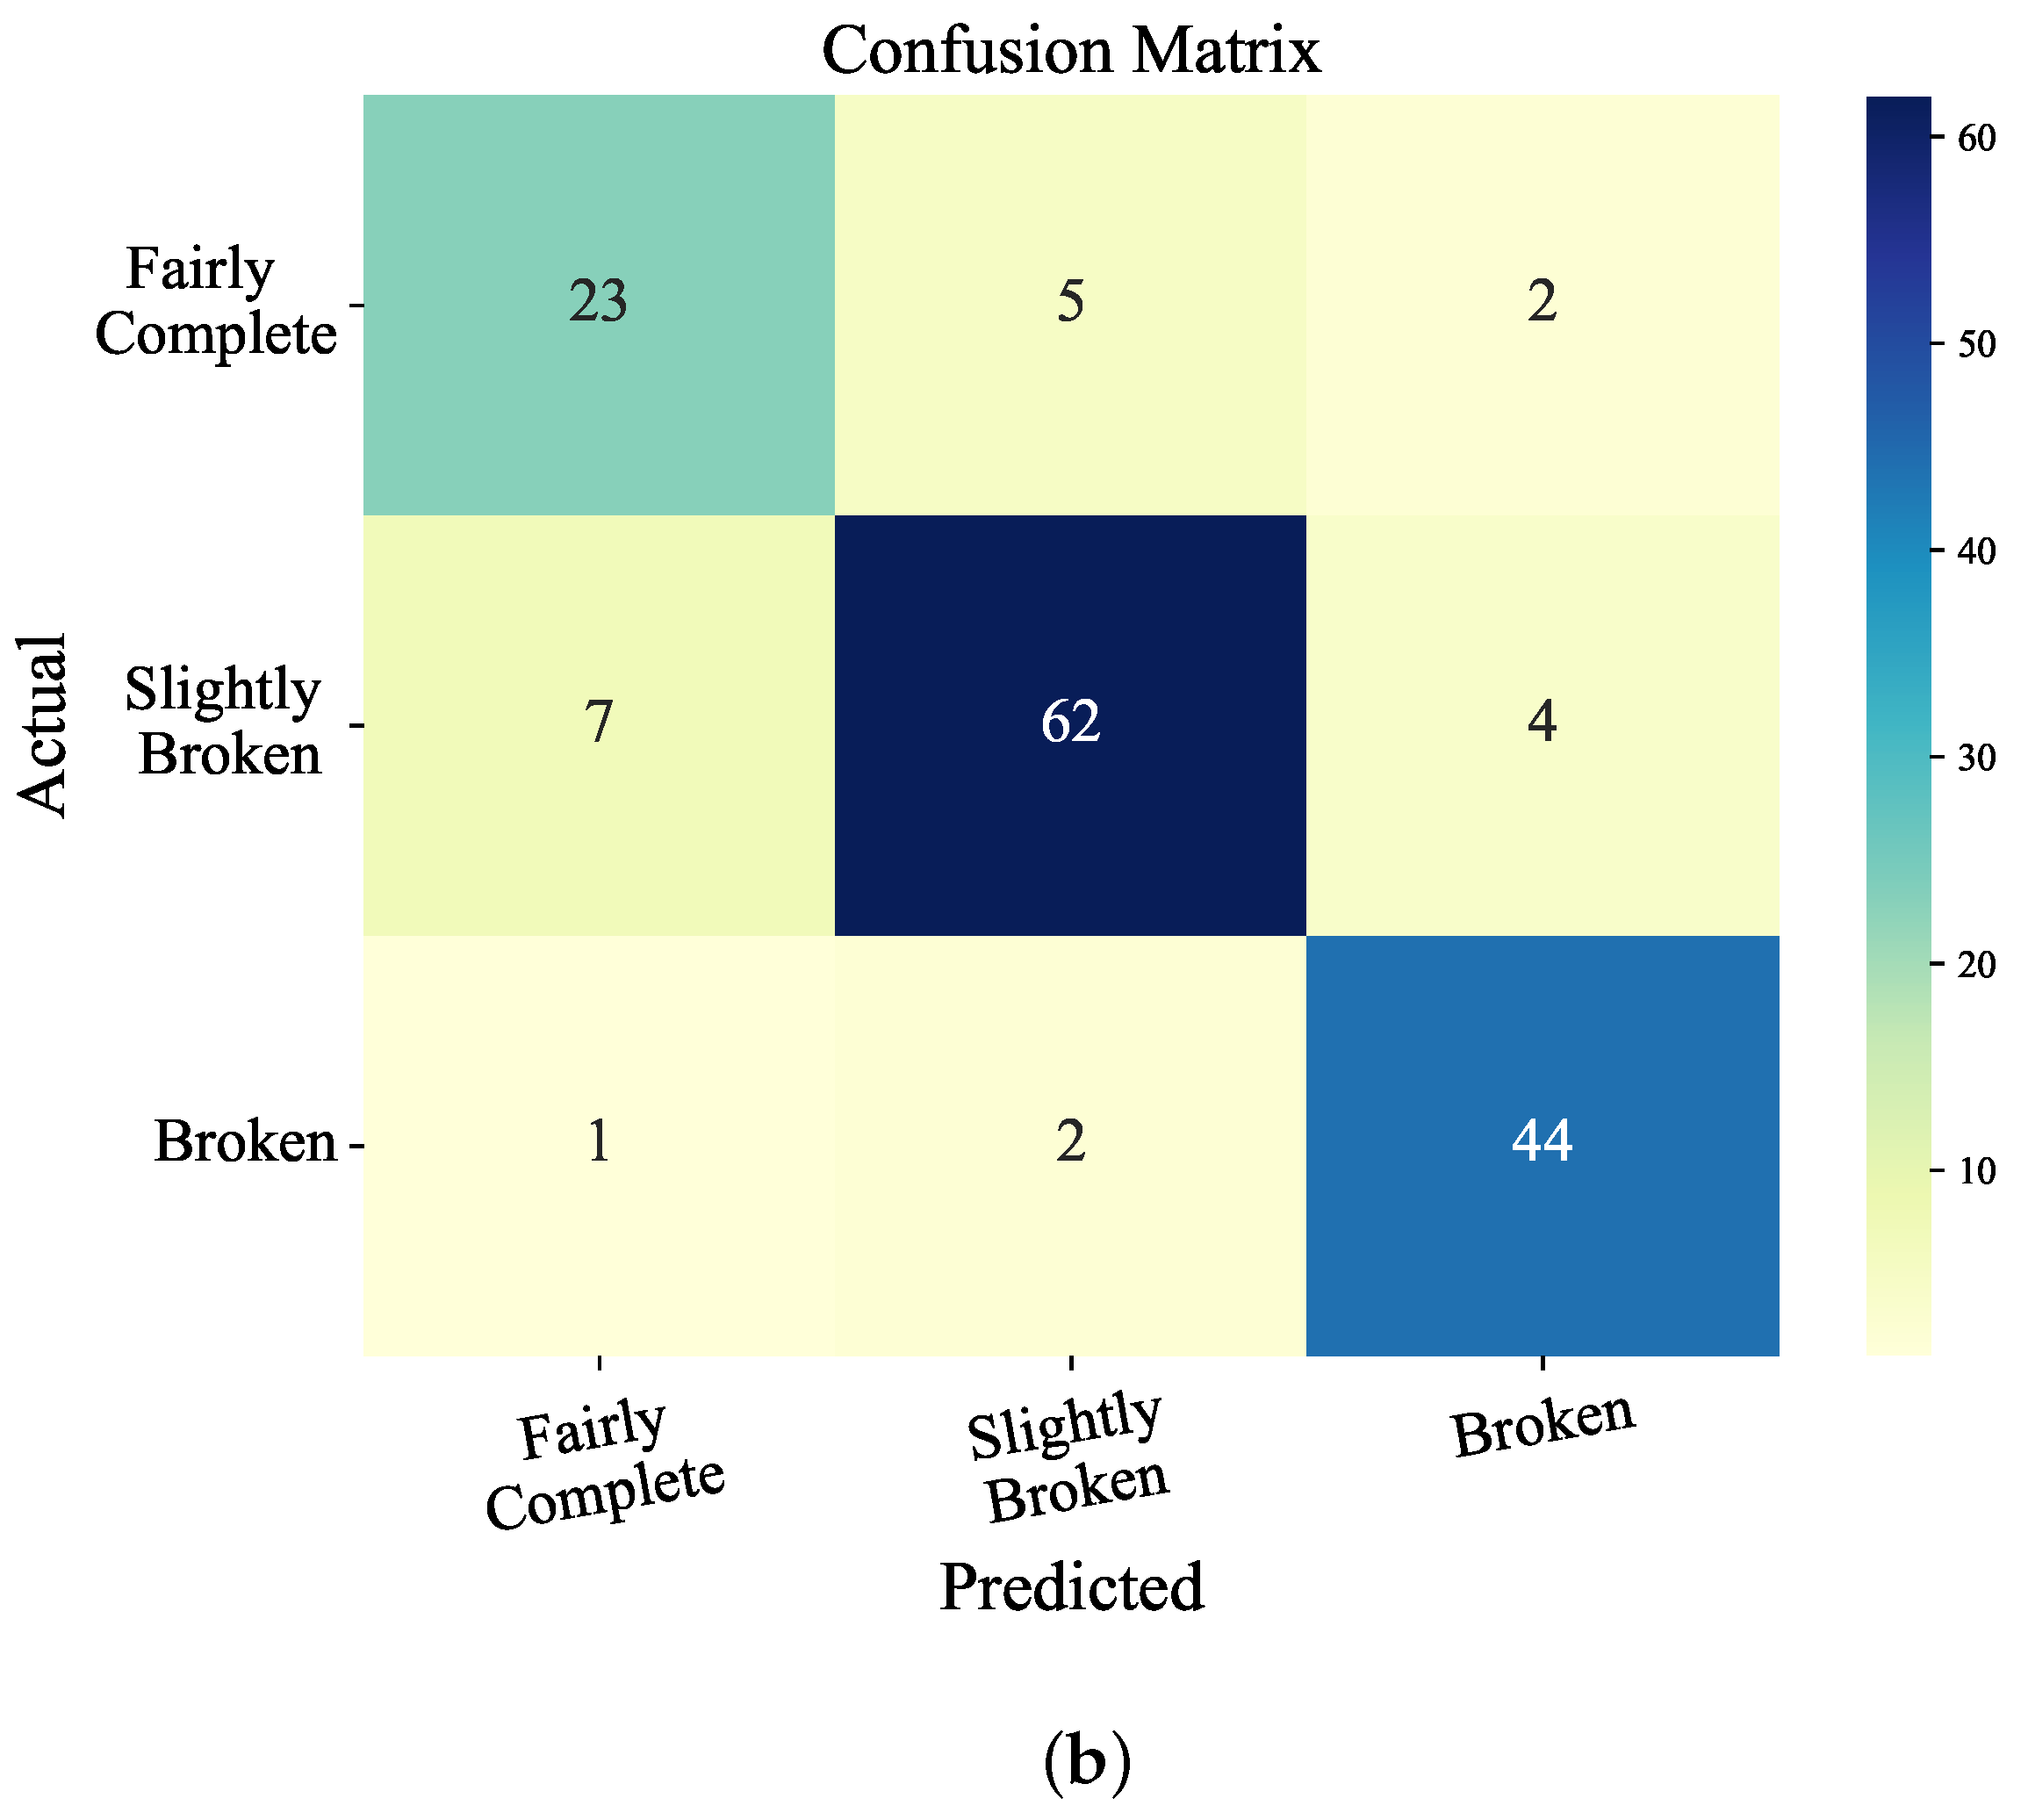
The results of the confusion matrix between the proposed method and the model not divided based on the exploration workface are shown in Figure 8. The accuracy of the proposed method is 95.33% for the test set and 86% for the model not divided according to the exploration workface. The prediction accuracy of the proposed method for all three categories is higher than that of the model not divided by exploration workface.
The accuracy, macro-precision, and macro-recall of the proposed method and comparative methods are shown in Table 2. It can be seen that the recall of the fairly complete samples is the lowest, and more of the fairly complete samples were predicted to be slightly broken according to the confusion matrix. Although its recall is low, being predicted as the more fragmented category minimizes the construction risk in practical engineering.

4.3. Discussions

In general, manual predictions tend to provide a uniform assessment of rock integrity based on the data obtained from a single batch of surveys. For example, if a GPR survey covers a distance of 30 m ahead of the palm face, manual predictions will often yield a uniform result for this entire distance. However, this approach may lead to reduced accuracy in manual predictions when there are discrepancies between the rock integrity of local areas and the overall conditions.
When the predictive model is built without dividing the data according to the geological conditions of the workface, there may be significant discrepancies between the rock integrity level of the workface and the predicted result. For instance, this might happen when the workface is fractured, but the prediction result indicates that the rock integrity ahead of the palm face is complete, which is obviously inconsistent with the mechanism. This will result in lower accuracy in the prediction of this method.
The method proposed in this paper avoids the problems associated with the two comparison methods mentioned above, resulting in a certain degree of improvement in prediction accuracy. In addition, the precision and recall of the broken category are both 100%, which is because when the exploration workface is broken, so only one category of broken exists for its samples, and the model outputs can only be broken.

5. Conclusions

Aiming at the problem that the response characteristics of geological radar to adverse geology are complicated and the characteristics of data distribution are not obvious, this study proposes a multi-model intelligent method for predicting rock integrity in tunnels based on geological differences of GPR exploration workfaces. This method achieves innovative breakthroughs and practical contributions in the following aspects:
  • It proposes a method for extracting structured feature matrices from unstructured GPR detection data, addressing the challenge of converting raw radar data into analyzable formats for intelligent prediction.
  • It introduces an index to measure amplitude anomaly fluctuations, namely, the sum of row variances, which provides a quantitative basis for identifying abnormal data in GPR signals.
  • It considers the geological differences of GPR exploration workfaces to establish multi-models for predicting rock integrity, improving the adaptability of the prediction method to complex and variable tunnel geological conditions.
  • It validates the effectiveness of the proposed method through testing in ten real tunnels and comparison with two alternative methods. The method achieved an accuracy of 95.33% in the constructed dataset, with precision rates above 90% for the prediction of fairly complete, slightly broken, and broken rock categories, demonstrating its practical application value.
Despite these achievements, limitations exist: the dataset used in this study only covers three conditions of workfaces, and the results for fractured workface categories lack sufficient diversity, which may reduce the persuasiveness of the findings. Future research will focus on expanding the dataset to include more geological conditions and workface scenarios, thereby enhancing the method’s robustness and generalizability. Overall, this study provides a significant advancement in the application of GPR data for tunnel rock integrity prediction, laying a foundation for more accurate and reliable geological risk assessment in tunnel construction.

Author Contributions

Methodology, Y.H.; Software, W.F.; Supervision, X.H. All authors have read and agreed to the published version of the manuscript.

Funding

This work was supported by the Tibet Autonomous Region Science and Technology Plan Project under Grant XZ202501ZY0108, the National Key R&D Program of China under Grant 2021YFB2300603, the Major Science and Technology R&D Program of China Railway Construction Corporation Limited under Grant 2024-W04, and the Key R&D Program of China Railway First Survey and Design Institute Group Co. Ltd. under Grant 2022KY53ZD(CHY)-10.

Data Availability Statement

The data presented in this study are available on request from the corresponding author.

Acknowledgments

The authors would like to thank the editors and anonymous reviewers for their numerous detailed and inspiring suggestions and comments that helped improving the quality and readability of this paper.

Conflicts of Interest

Author Wei Fu was employed by China Railway First Survey and Design Institute Group Co., Ltd. The remaining authors declare that the research was conducted in the absence of any commercial or financial relationships that could be construed as a potential conflict of interest.

References

  1. Zhang, D.; Sun, Z.; Fang, Q. Scientific problems and research proposals for Sichuan–Tibet railway tunnel construction. Undergr. Space 2022, 7, 419–439. [Google Scholar] [CrossRef]
  2. Abbas, N.; Li, K.G.; Fissha, Y.; Lei, W.; Emad, M.Z.; Chandrahas, N.S.; Khatti, J.; Taiwo, B.O.; Sazid, M.; Gebrehiwot, Z.; et al. Stress-deformation and stability challenges in Himalayan tunnels: Impact of geological discontinuities. Discov. Mater. 2024, 4, 72. [Google Scholar] [CrossRef]
  3. Sazid, M.; Ahmed, H.A. Stability analysis of shallow depth tunnel in weak rock mass: 3D numerical modeling approach. J. City Dev. 2019, 1, 18–22. Available online: https://pubs.sciepub.com/jcd/1/1/3 (accessed on 10 August 2025).
  4. Duan, S.; Xu, X. Discussion of problems in calculation and application of rock mass integrity coefficient. J. Eng. Geol. 2013, 21, 548–553. [Google Scholar]
  5. Dong, F.; Wang, S.; Yang, Y.; Ren, M.; Demisa, M.; Zhang, R. Research on dynamic fuzzy prediction method for surrounding rock stability of mountain tunnels throughout the construction period. Tunn. Undergr. Space Technol. 2025, 158, 106390. [Google Scholar] [CrossRef]
  6. Zaki, N.F.M.; Ismail, M.A.M.; Abidin, M.H.Z. Geological prediction ahead of tunnel face in the limestone formation tunnel using multi-modal geophysical surveys. J. Phys. Conf. Ser. 2018, 995, 12114. [Google Scholar] [CrossRef]
  7. Yue, Y.P.; Liu, H.; Lin, C.D.; Meng, X.; Liu, C.; Zhang, X.; Cui, J.; Du, Y. Automatic recognition of defects behind railway tunnel linings in GPR images using transfer learning. Measurement 2024, 224, 113903. [Google Scholar] [CrossRef]
  8. Li, C.; Wang, H.C.; Wang, Y.S.; Wang, L.L.; Yang, X.; Wan, X.R. Recognition of tunnel fracture zones in seismic waves and ground-penetrating radar data. Appl. Sci. 2024, 14, 1282. [Google Scholar] [CrossRef]
  9. Qin, Z.; Wu, H.B.; Zhang, E.Z. Application of ground penetrating radar in urban transportation construction. West China Explor. Eng. 2018, 30, 95–98+103. [Google Scholar] [CrossRef]
  10. Ling, J.Y.; Qian, R.Y.; Shang, K.; Guo, L.Y.; Zhao, Y.; Liui, D. Research on the dynamic monitoring technology of road subgrades with time-lapse full-coverage 3D ground penetrating radar (GPR). Remote Sens. 2022, 14, 1593. [Google Scholar] [CrossRef]
  11. Sun, C.X. Application of ground penetrating radar technology in geological survey of water conservancy and hydropower engineering. Groundwater 2024, 46, 183–184. [Google Scholar] [CrossRef]
  12. Cui, Y.T.; Wang, S.H.; Li, J.W. GPR noise suppression algorithm based on compressed parallel non-local mean filtering method. Chin. J. Eng. Geophys. 2023, 20, 825–834. [Google Scholar] [CrossRef]
  13. Jin, Y.; Duan, Y.L. A new method for abnormal underground rocks identification using ground penetrating radar. Measurement 2020, 149, 106988. [Google Scholar] [CrossRef]
  14. He, X.K.; Wang, C.; Zheng, R.Y.; Li, X.W. GPR image noise removal using grey wolf optimisation in the NSST domain. Remote Sens. 2021, 13, 4416. [Google Scholar] [CrossRef]
  15. Zhang, L.; Zhang, S.; Deng, Z.W.; Ling, T.H. Geological detection of hard rocks by GPR and signal time-frequency characteristics analysis in urban underground trenchless construction. Meas. Sci. Technol. 2024, 35, 045406. [Google Scholar] [CrossRef]
  16. Zhang, S.; He, W.C.; Cao, F.; Hong, L. Time-frequency analysis of GPR simulation signals for tunnel cavern fillings based on short-time fourier transform. In Earth and Space 2021: Materials, Structures, Dynamics, and Control in Extreme Environments; American Society of Civil Engineers: Reston, VA USA, 2021; pp. 572–581. [Google Scholar] [CrossRef]
  17. Liu, M.M.; Liu, Z.H.; Zhou, D.; Lan, R.Y.; Wu, H. Recognition method of typical anomalies during karst tunnel construction using GPR attributes and Gaussian processes. Arab. J. Geosci. 2020, 13, 791. [Google Scholar] [CrossRef]
  18. Zhang, R.; Gan, C.; Cao, W. A novel intelligent method for extracting the multi-domain features of ground penetrating radar data. In Proceedings of the 2023 China Automation Congress (CAC), Chongqing, China, 17–19 November 2023; pp. 6069–6074. [Google Scholar] [CrossRef]
  19. Gao, S.Q.; Wang, Y.Q.; Mou, Y.C. Advance geological forecasting and image analysis of karst tunnel with ground penetrating radar. Chin. J. Eng. Geophys. 2021, 18, 642–646. [Google Scholar] [CrossRef]
  20. Chen, P.S.; Yuan, Q.; Zhang, Z.P.; Yang, L.; Chen, Z.L.; Wu, L. Image interpretation method for geological advance prediction of water-rich fracture zone in tunnel based on convolutional neural network. J. Appl. Basic Eng. Sci. 2022, 30, 196–207. [Google Scholar] [CrossRef]
  21. Chen, H.H.; Liu, S.M. Advanced geological prediction technology of tunnel based on image recognition. Arab. J. Geosci. 2019, 12, 601. [Google Scholar] [CrossRef]
  22. Li, T.B.; Meng, L.B.; Zhu, J. Comprehensive analysis method for advanced geological prediction of tunnels. J. Rock Mech. Eng. 2009, 28, 2429–2436. [Google Scholar] [CrossRef]
  23. Zheng, L.; Li, X.; Liu, Z.; Huang, D.; Tang, Z. Accuracy evaluation of advanced geological prediction based on improved analytic hierarchy process and ground penetrating radar. Math. Probl. Eng. 2020, 2020, 8617165. [Google Scholar] [CrossRef]
  24. Gan, C.; Cao, W.H.; Wu, M.; Liu, K.Z.; Chen, X.; Hu, Y.L.; Ning, F.L. Two-level intelligent modeling method for the rate of penetration in complex geological drilling process. Appl. Soft Comput. J. 2019, 80, 592–602. [Google Scholar] [CrossRef]
  25. Xie, W.; Zhang, X.; Tang, S.; Liu, X.; Li, X.; Zhang, Q.; Yan, F.; Xu, C.; Liu, Q. Fast perception of rock mass strength and integrity in TBM tunnelling using in-situ penetration test. Tunn. Undergr. Space Technol. 2023, 141, 105358. [Google Scholar] [CrossRef]
  26. Park, J.S.; Go, Y.W.; Oh, T.M. Evaluating the relationship between RMR and Q-system for improved classification of faulted rocks and weak rocks. Sci. Rep. 2025, 15, 17121. [Google Scholar] [CrossRef]
  27. Bieniawski, Z. Engineering classification of jointed rock masses. Civ. Eng. Siviele Ingenieurswese 1973, 1973, 335–343. Available online: https://hdl.handle.net/10520/AJA10212019_17397 (accessed on 10 August 2025).
  28. Barton, N. Rock mass classification and tunnel reinforcement selection using the q-system. In Rock Classification Systems for Engineering Purposes; ASTM International: West Conshohocken, PA, USA, 1988. [Google Scholar] [CrossRef]
  29. GB50218-94; Standard for Engineering Classification of Rock Masses. China Planning Press: Beijing, China, 1995.
  30. Guo, K.; Zhang, L. Multi-source information fusion for safety risk assessment in underground tunnels. Knowl.-Based Syst. 2021, 227, 107210. [Google Scholar] [CrossRef]
Figure 1. GPR detection schematic.
Infrastructures 10 00211 g001
Figure 2. Framework for constructing multi-domain structured feature database.
Infrastructures 10 00211 g002
Figure 3. The data distribution before division.
Infrastructures 10 00211 g003
Figure 4. The working face is fairly complete.
Infrastructures 10 00211 g004
Figure 5. The working face is slightly broken.
Infrastructures 10 00211 g005
Figure 6. The working face is broken.
Infrastructures 10 00211 g006
Figure 7. The prediction accuracy of the three methods.
Infrastructures 10 00211 g007
Figure 8. Confusion matrix comparison. (a) Proposed model. (b) Prediction without division of the exploration face.
Infrastructures 10 00211 g008aInfrastructures 10 00211 g008b
Table 1. The structure of the CNN network used in this paper.
LayerFiltersKernel SizeStridePaddingActivationOutput Size
Input----- 40 × 10
Conv116(5,5)12ReLU 40 × 10
MaxPool1-(2,2)20- 20 × 5
Conv232(5,5)12ReLU 20 × 5
MaxPool2-(2,2)20- 10 × 2
Linear-----5
Table 2. Comparison of performance evaluation indicators for three methods.
MethodAccuracyMacro-PrecisionMacro-Recall
Proposed method95.33%95.34%93.53%
Manual prediction86.67%85.57%84.37%
Prediction without division of the exploration face86.00%84.02%85.07%
Disclaimer/Publisher’s Note: The statements, opinions and data contained in all publications are solely those of the individual author(s) and contributor(s) and not of MDPI and/or the editor(s). MDPI and/or the editor(s) disclaim responsibility for any injury to people or property resulting from any ideas, methods, instructions or products referred to in the content.