
The Development and Statistical Analysis of a Material Strength Database of Existing Italian Prestressed Concrete Bridges

 ,
,  ,
,  ,
, 
 , , ,
, , ,  , , ,
, , ,  ,
,  ,
,  , ,
, , 
 ,
,  add
Show full author list
add
Show full author list
Abstract
1. Introduction
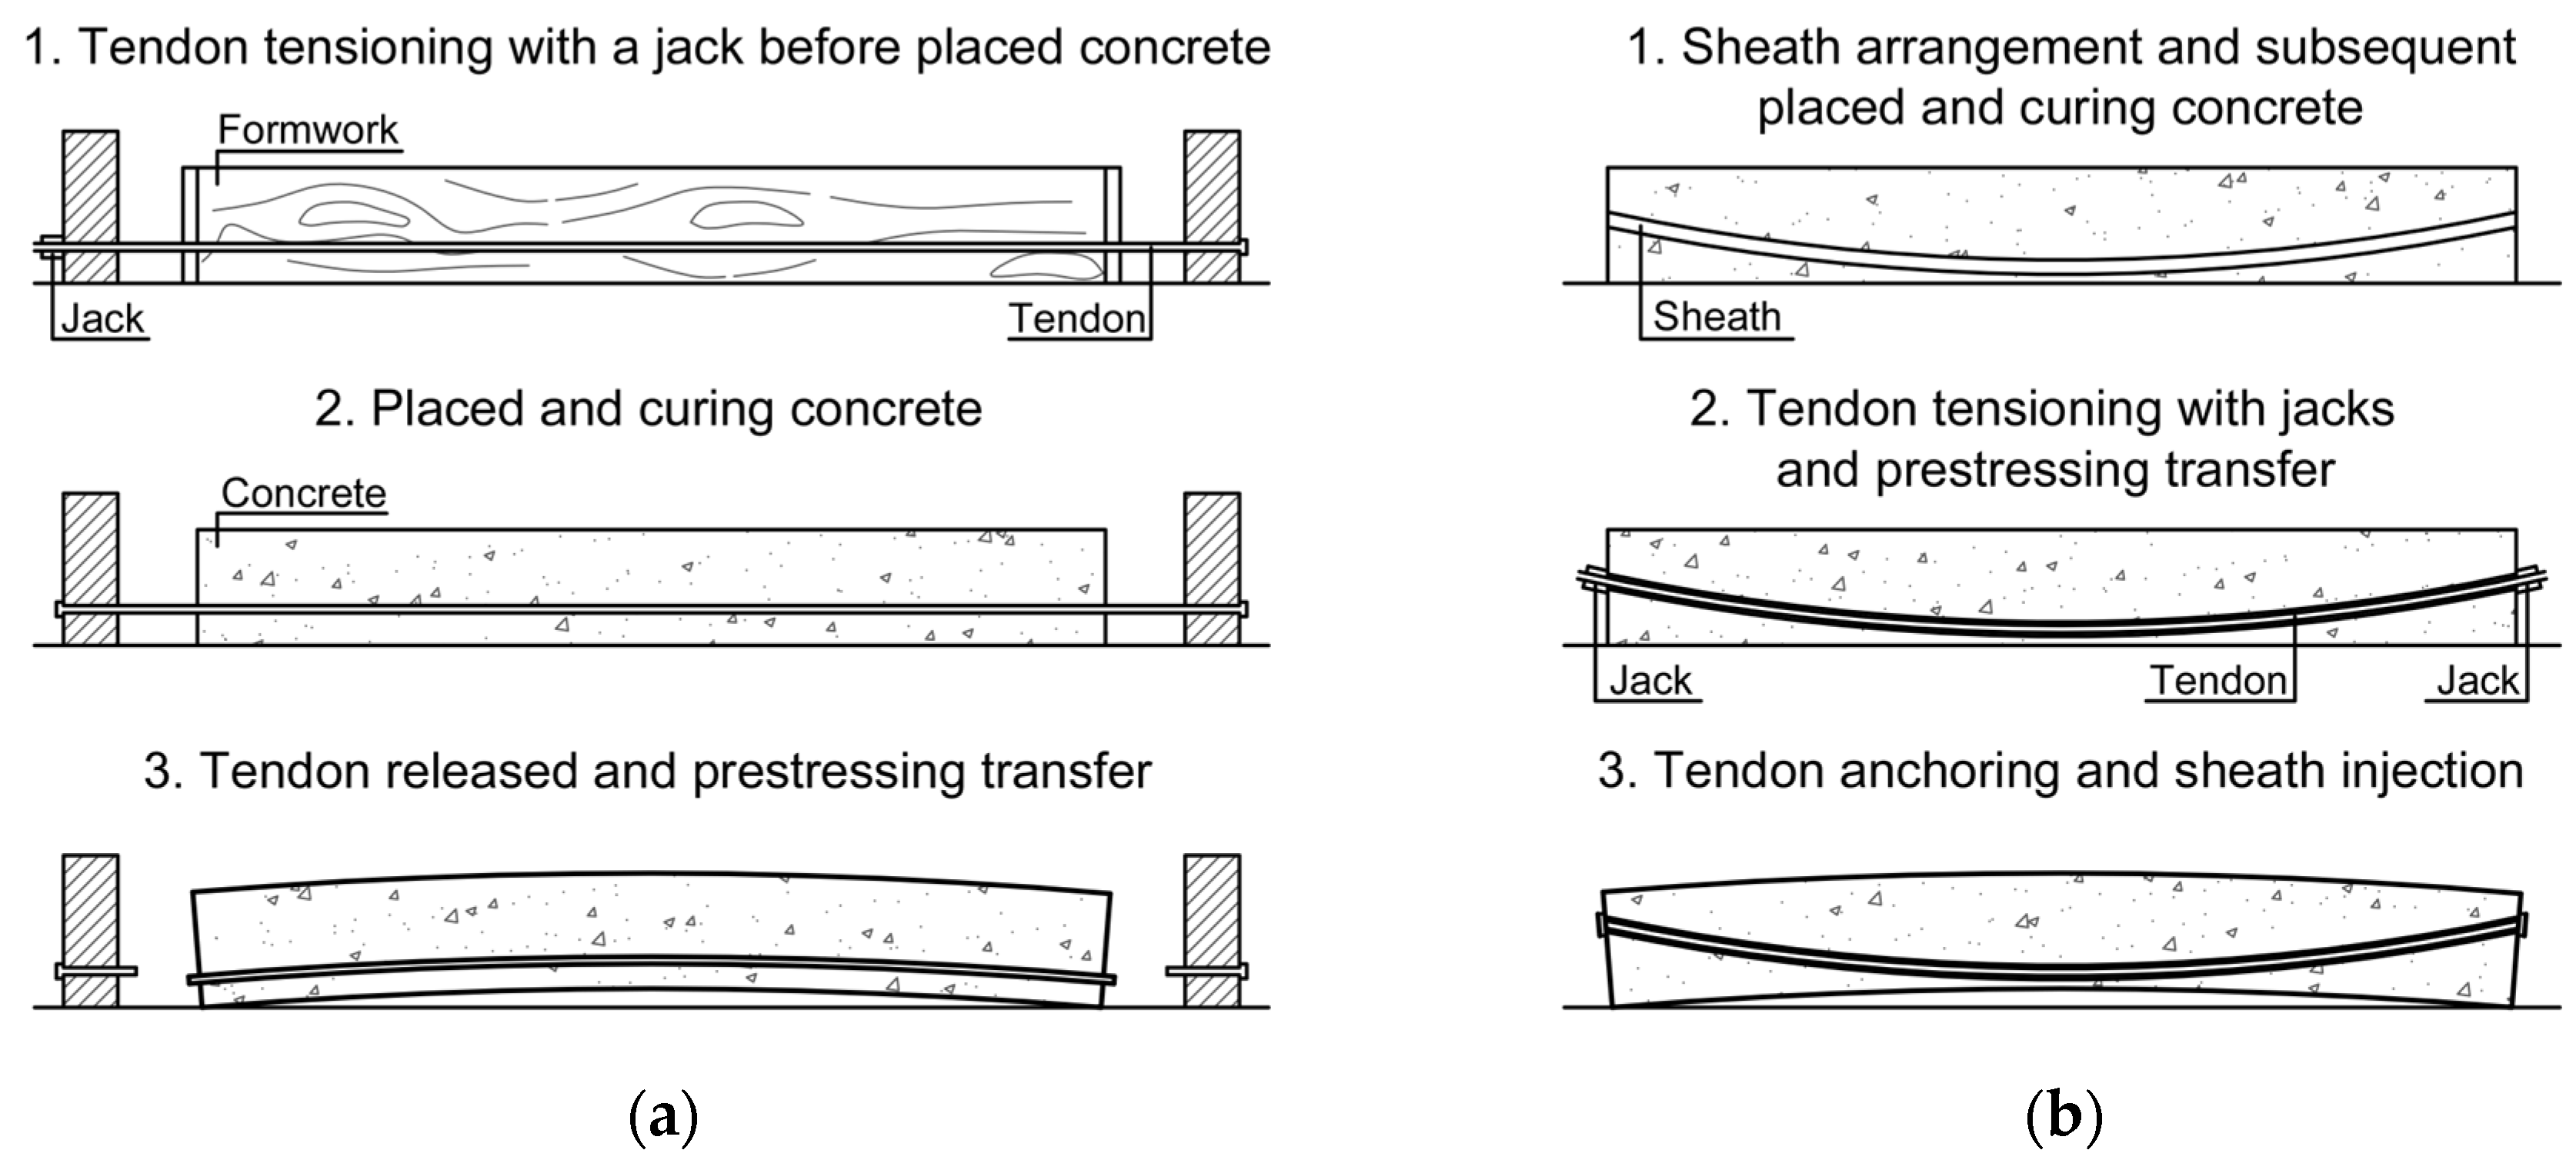
2. Concrete-Prestressing Technology
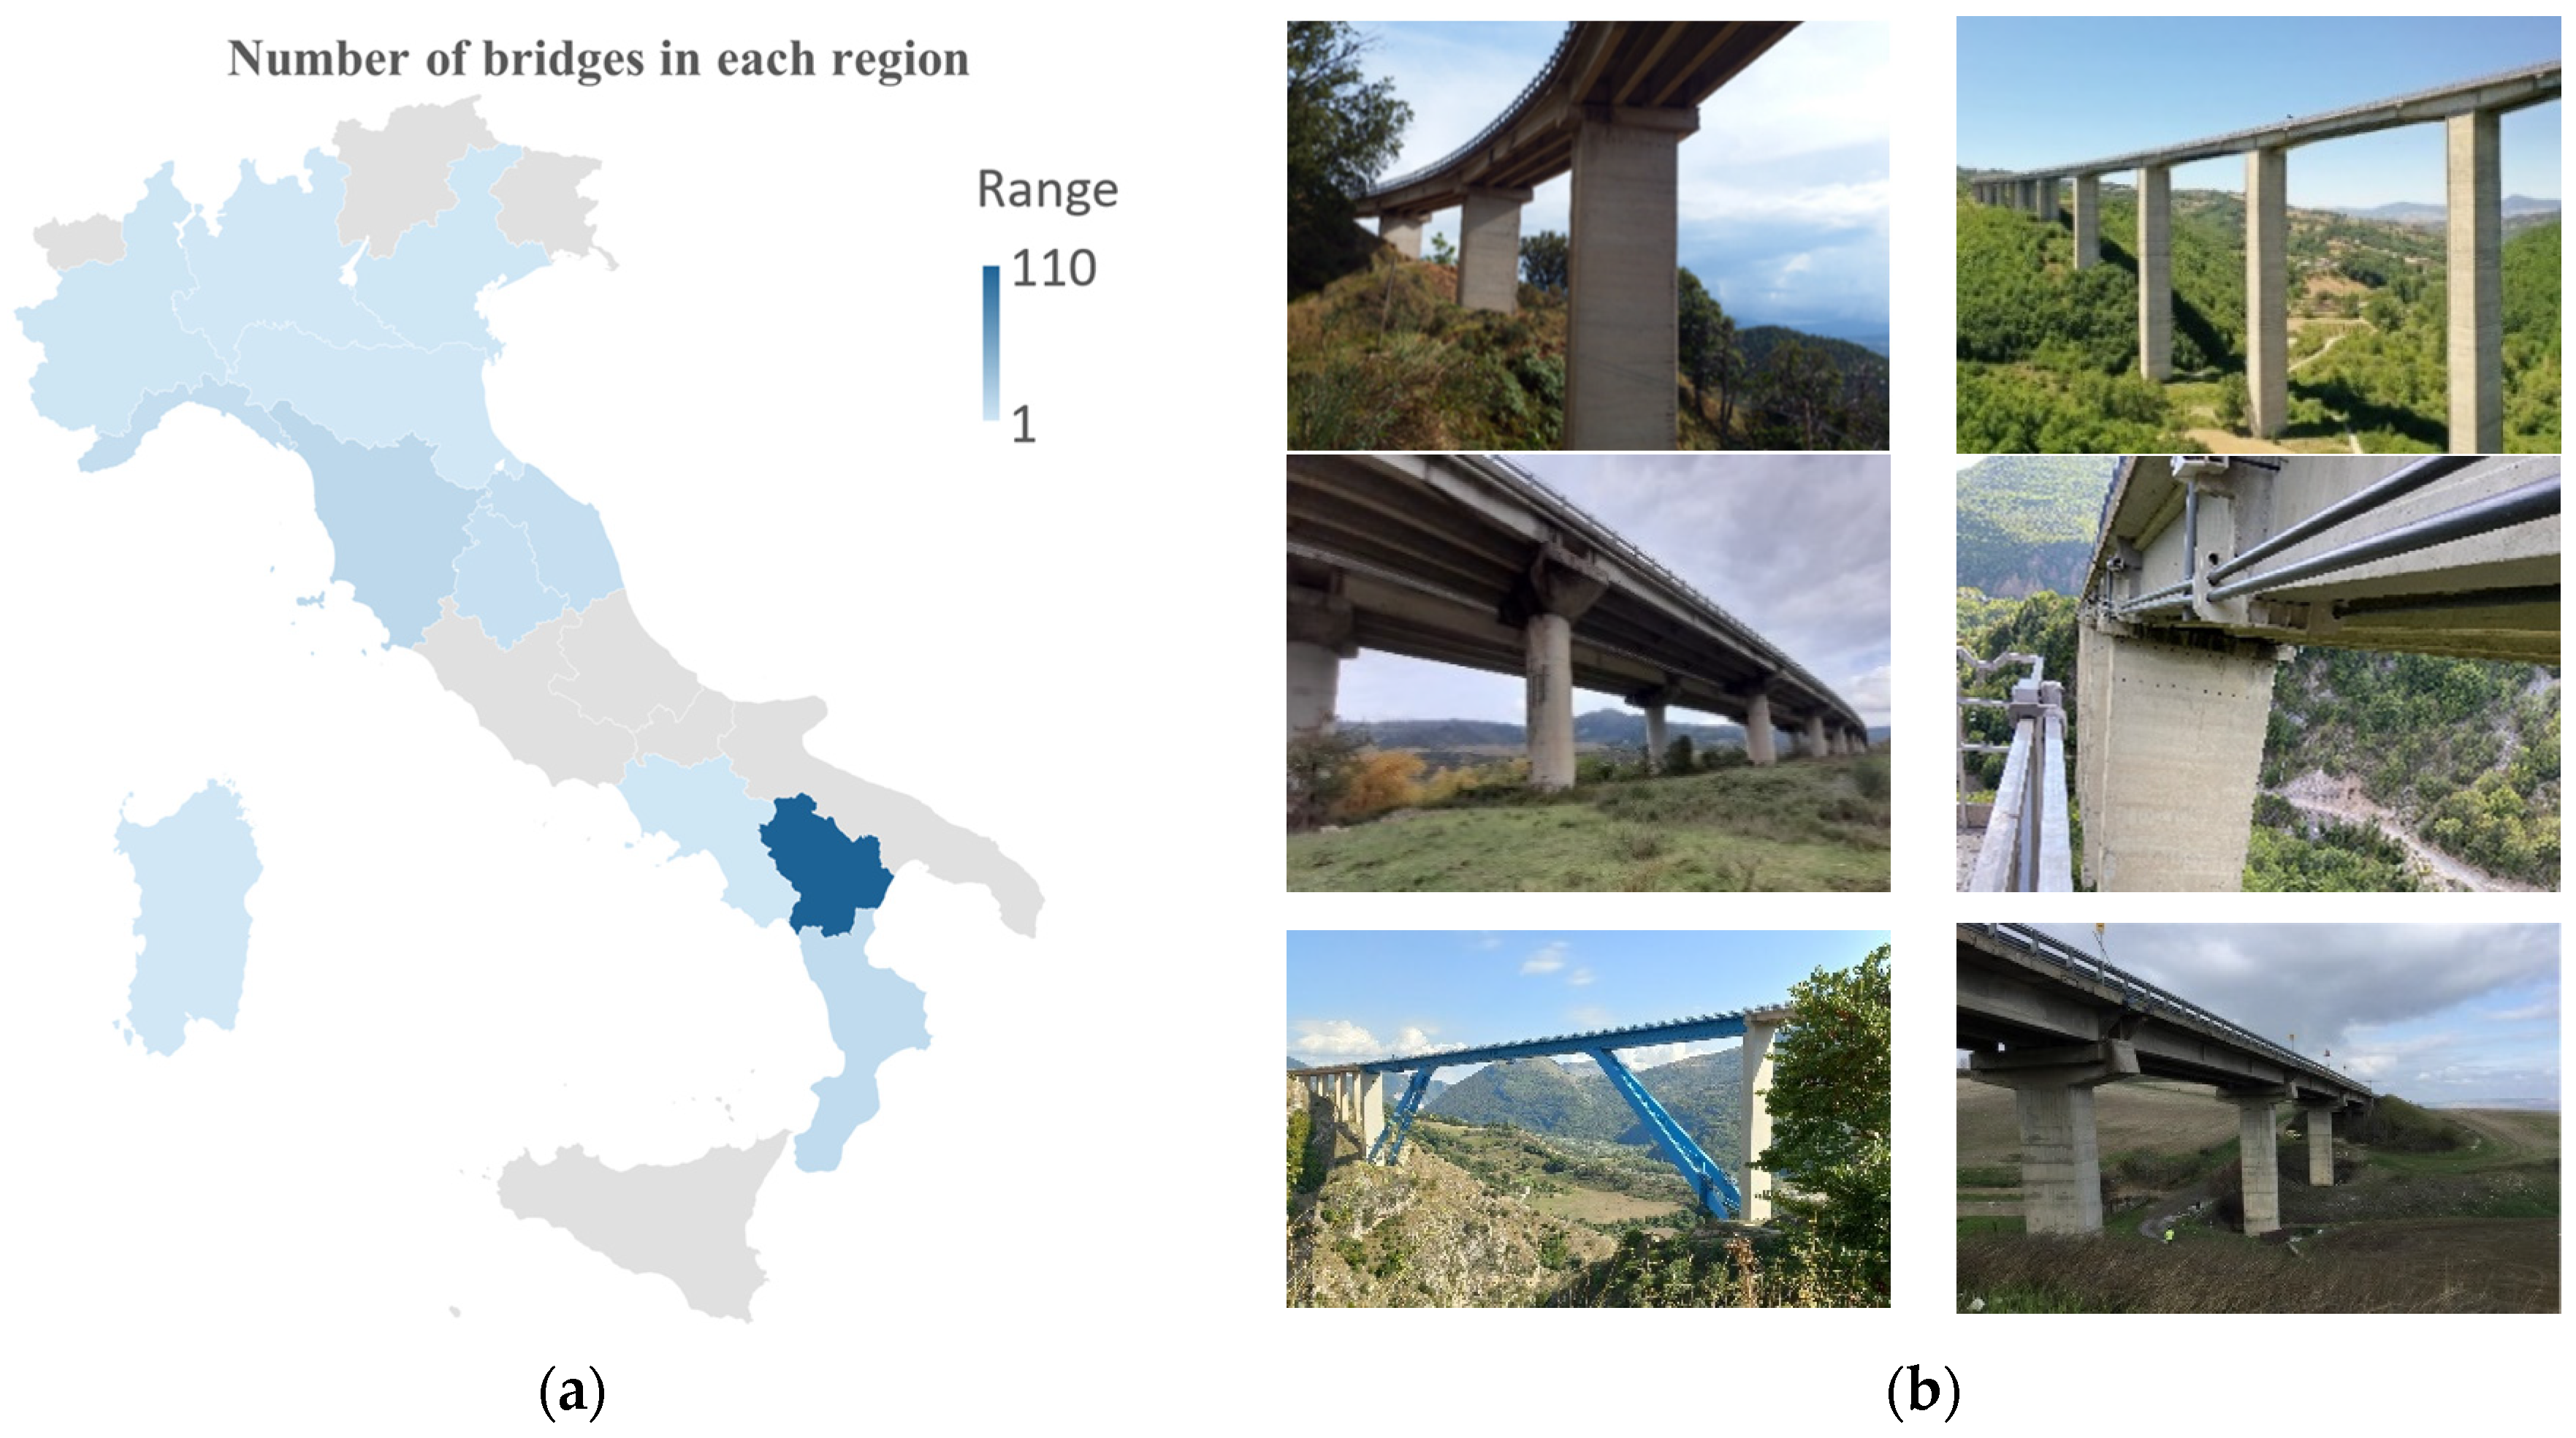
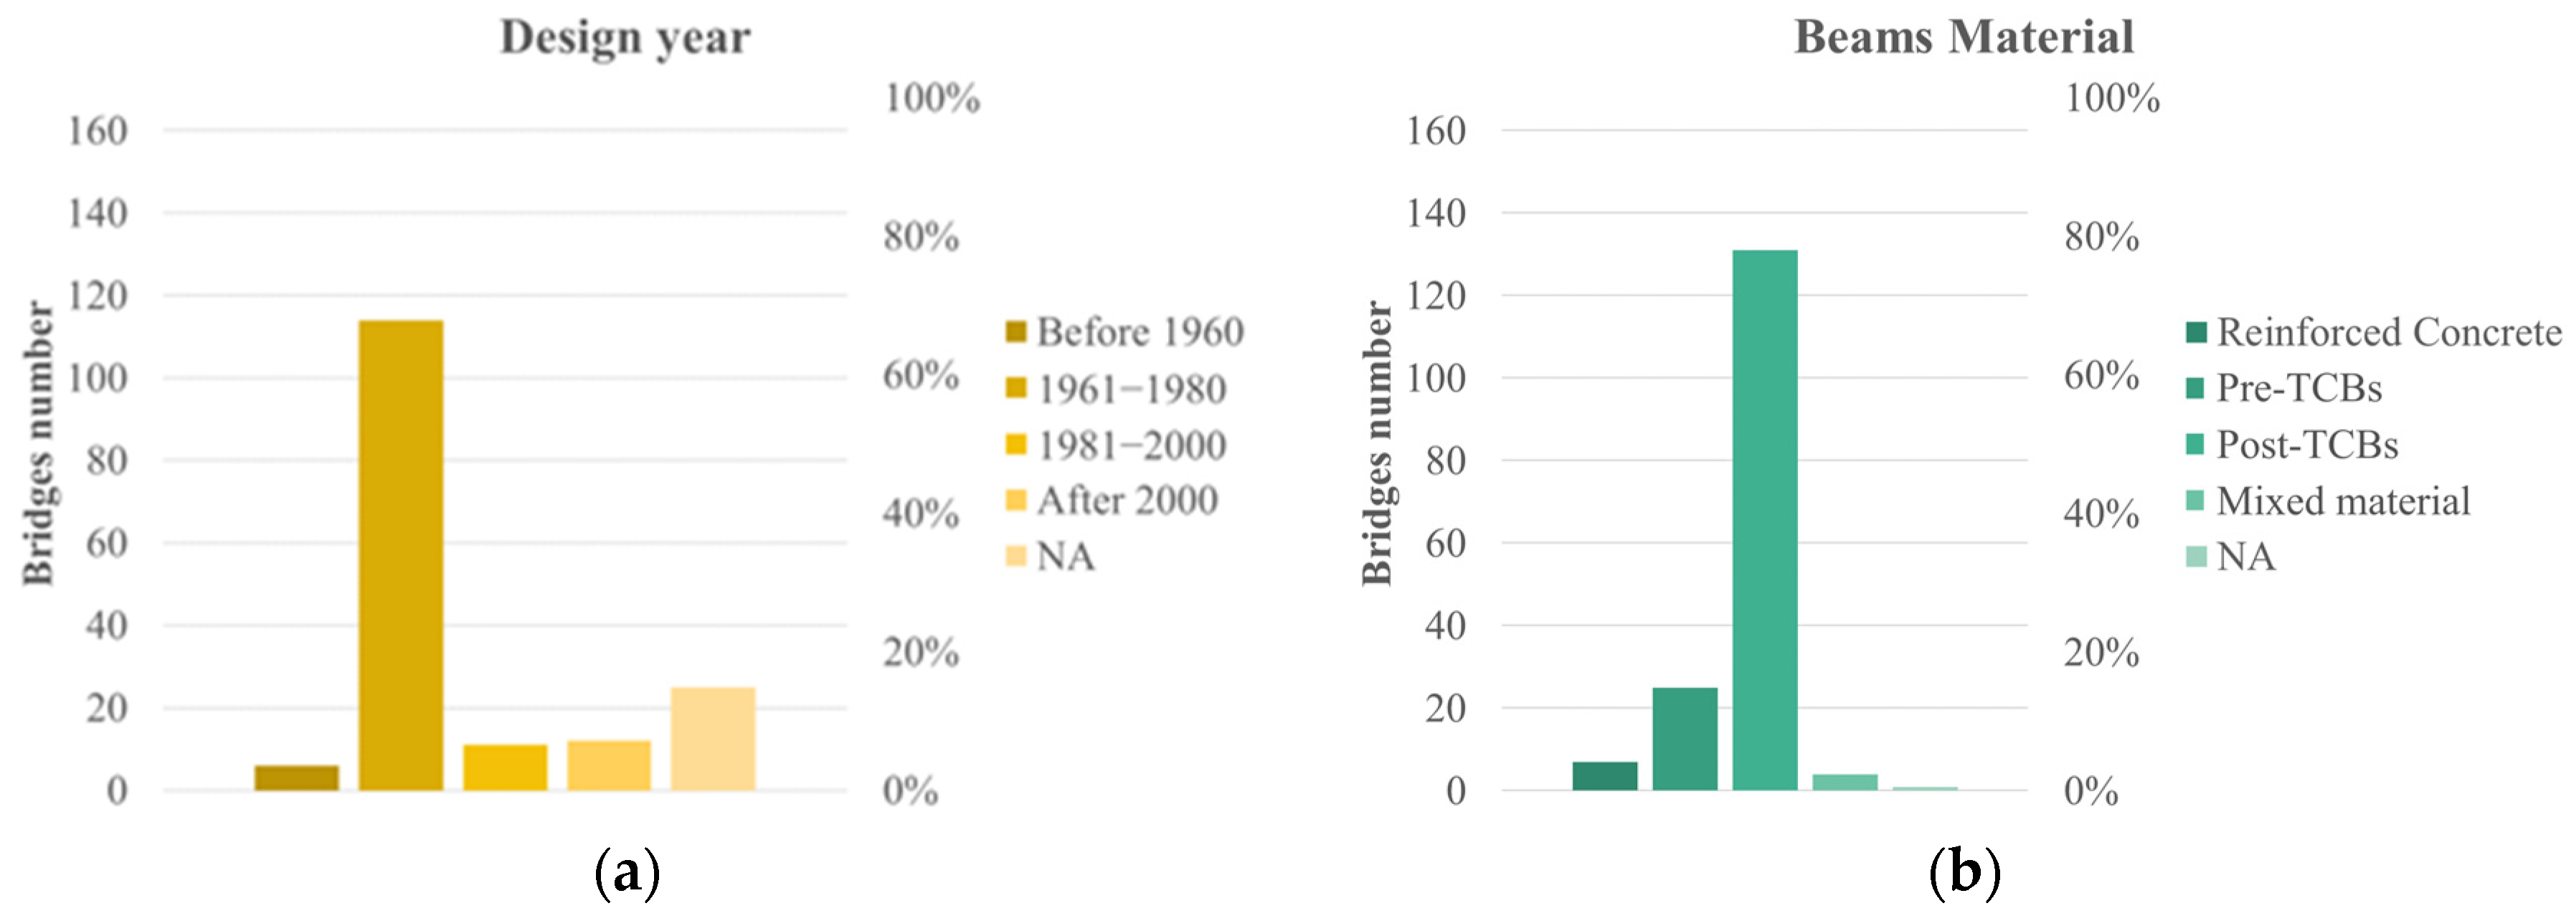
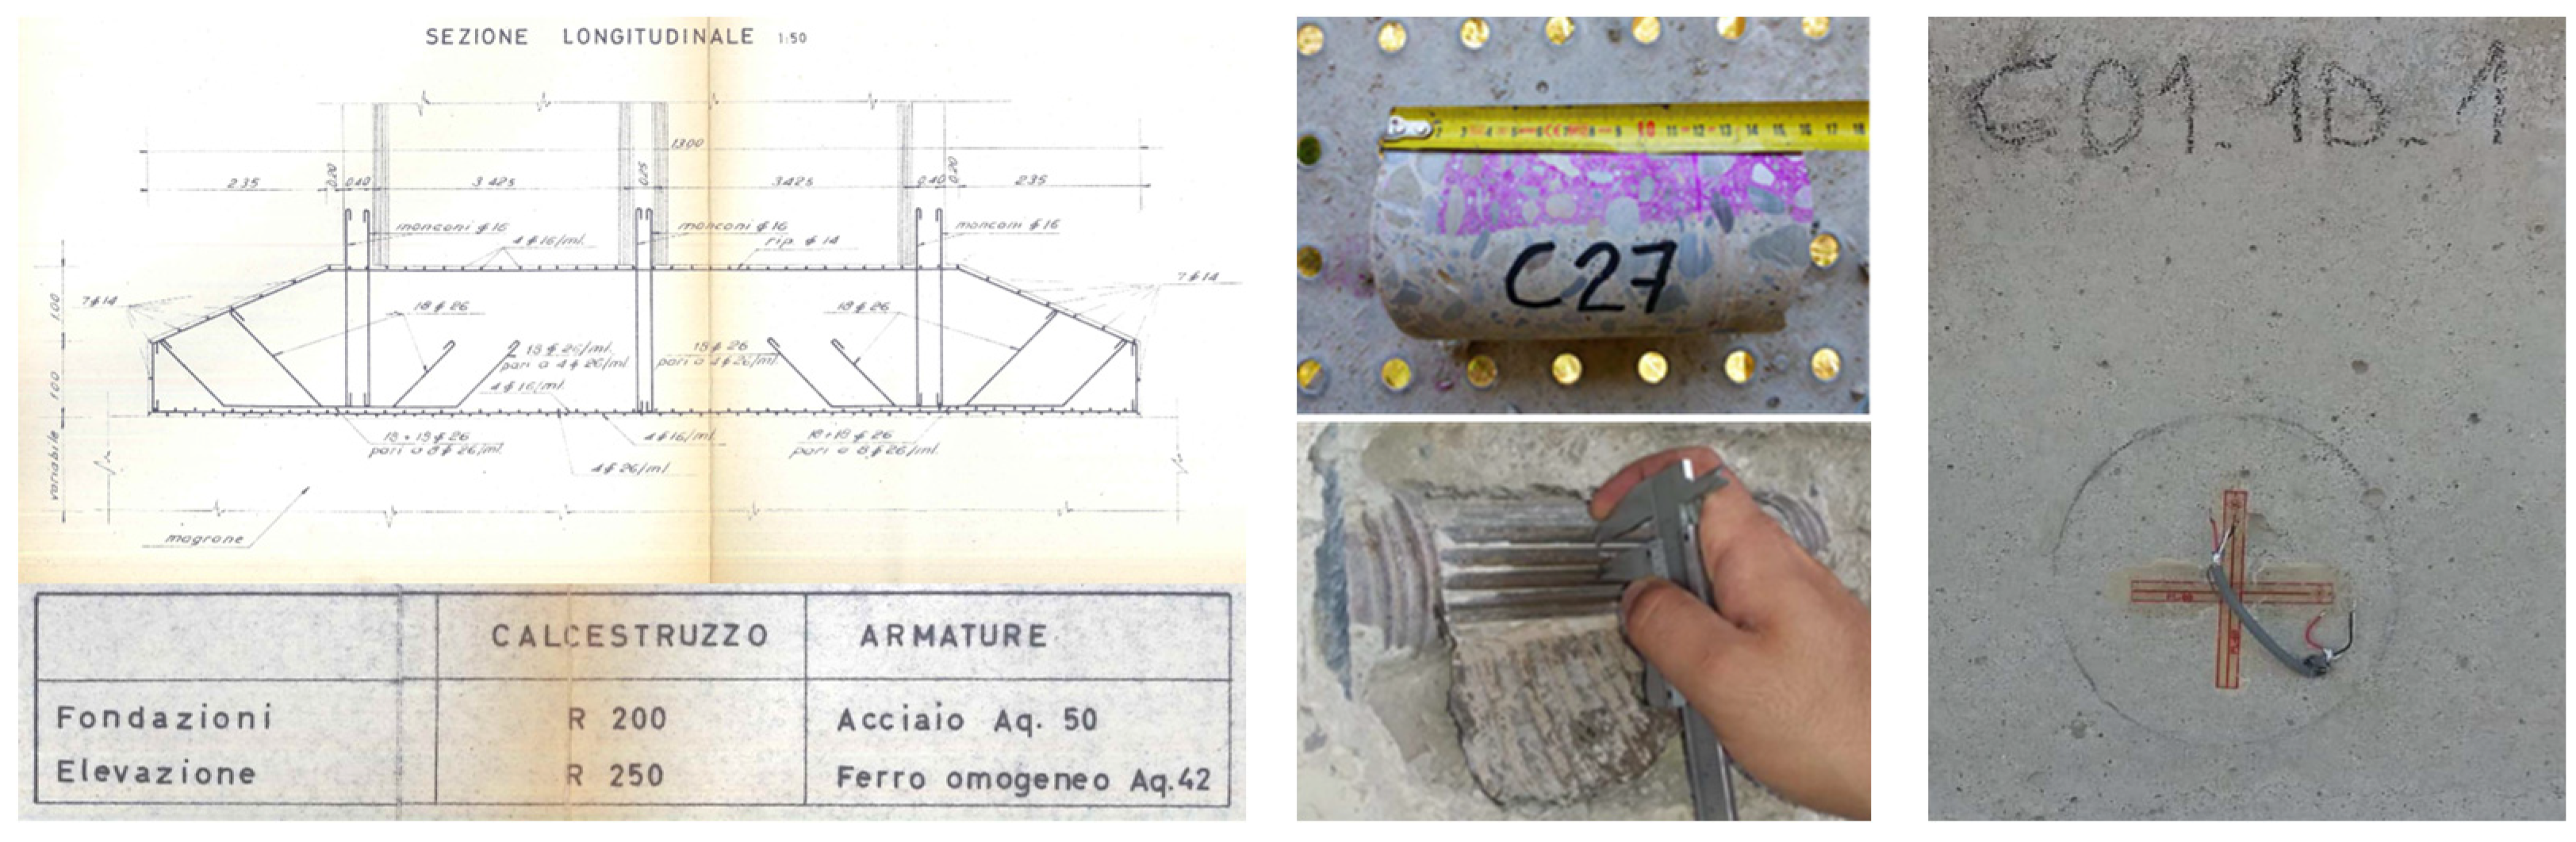
3. Database Development
4. Database Analysis
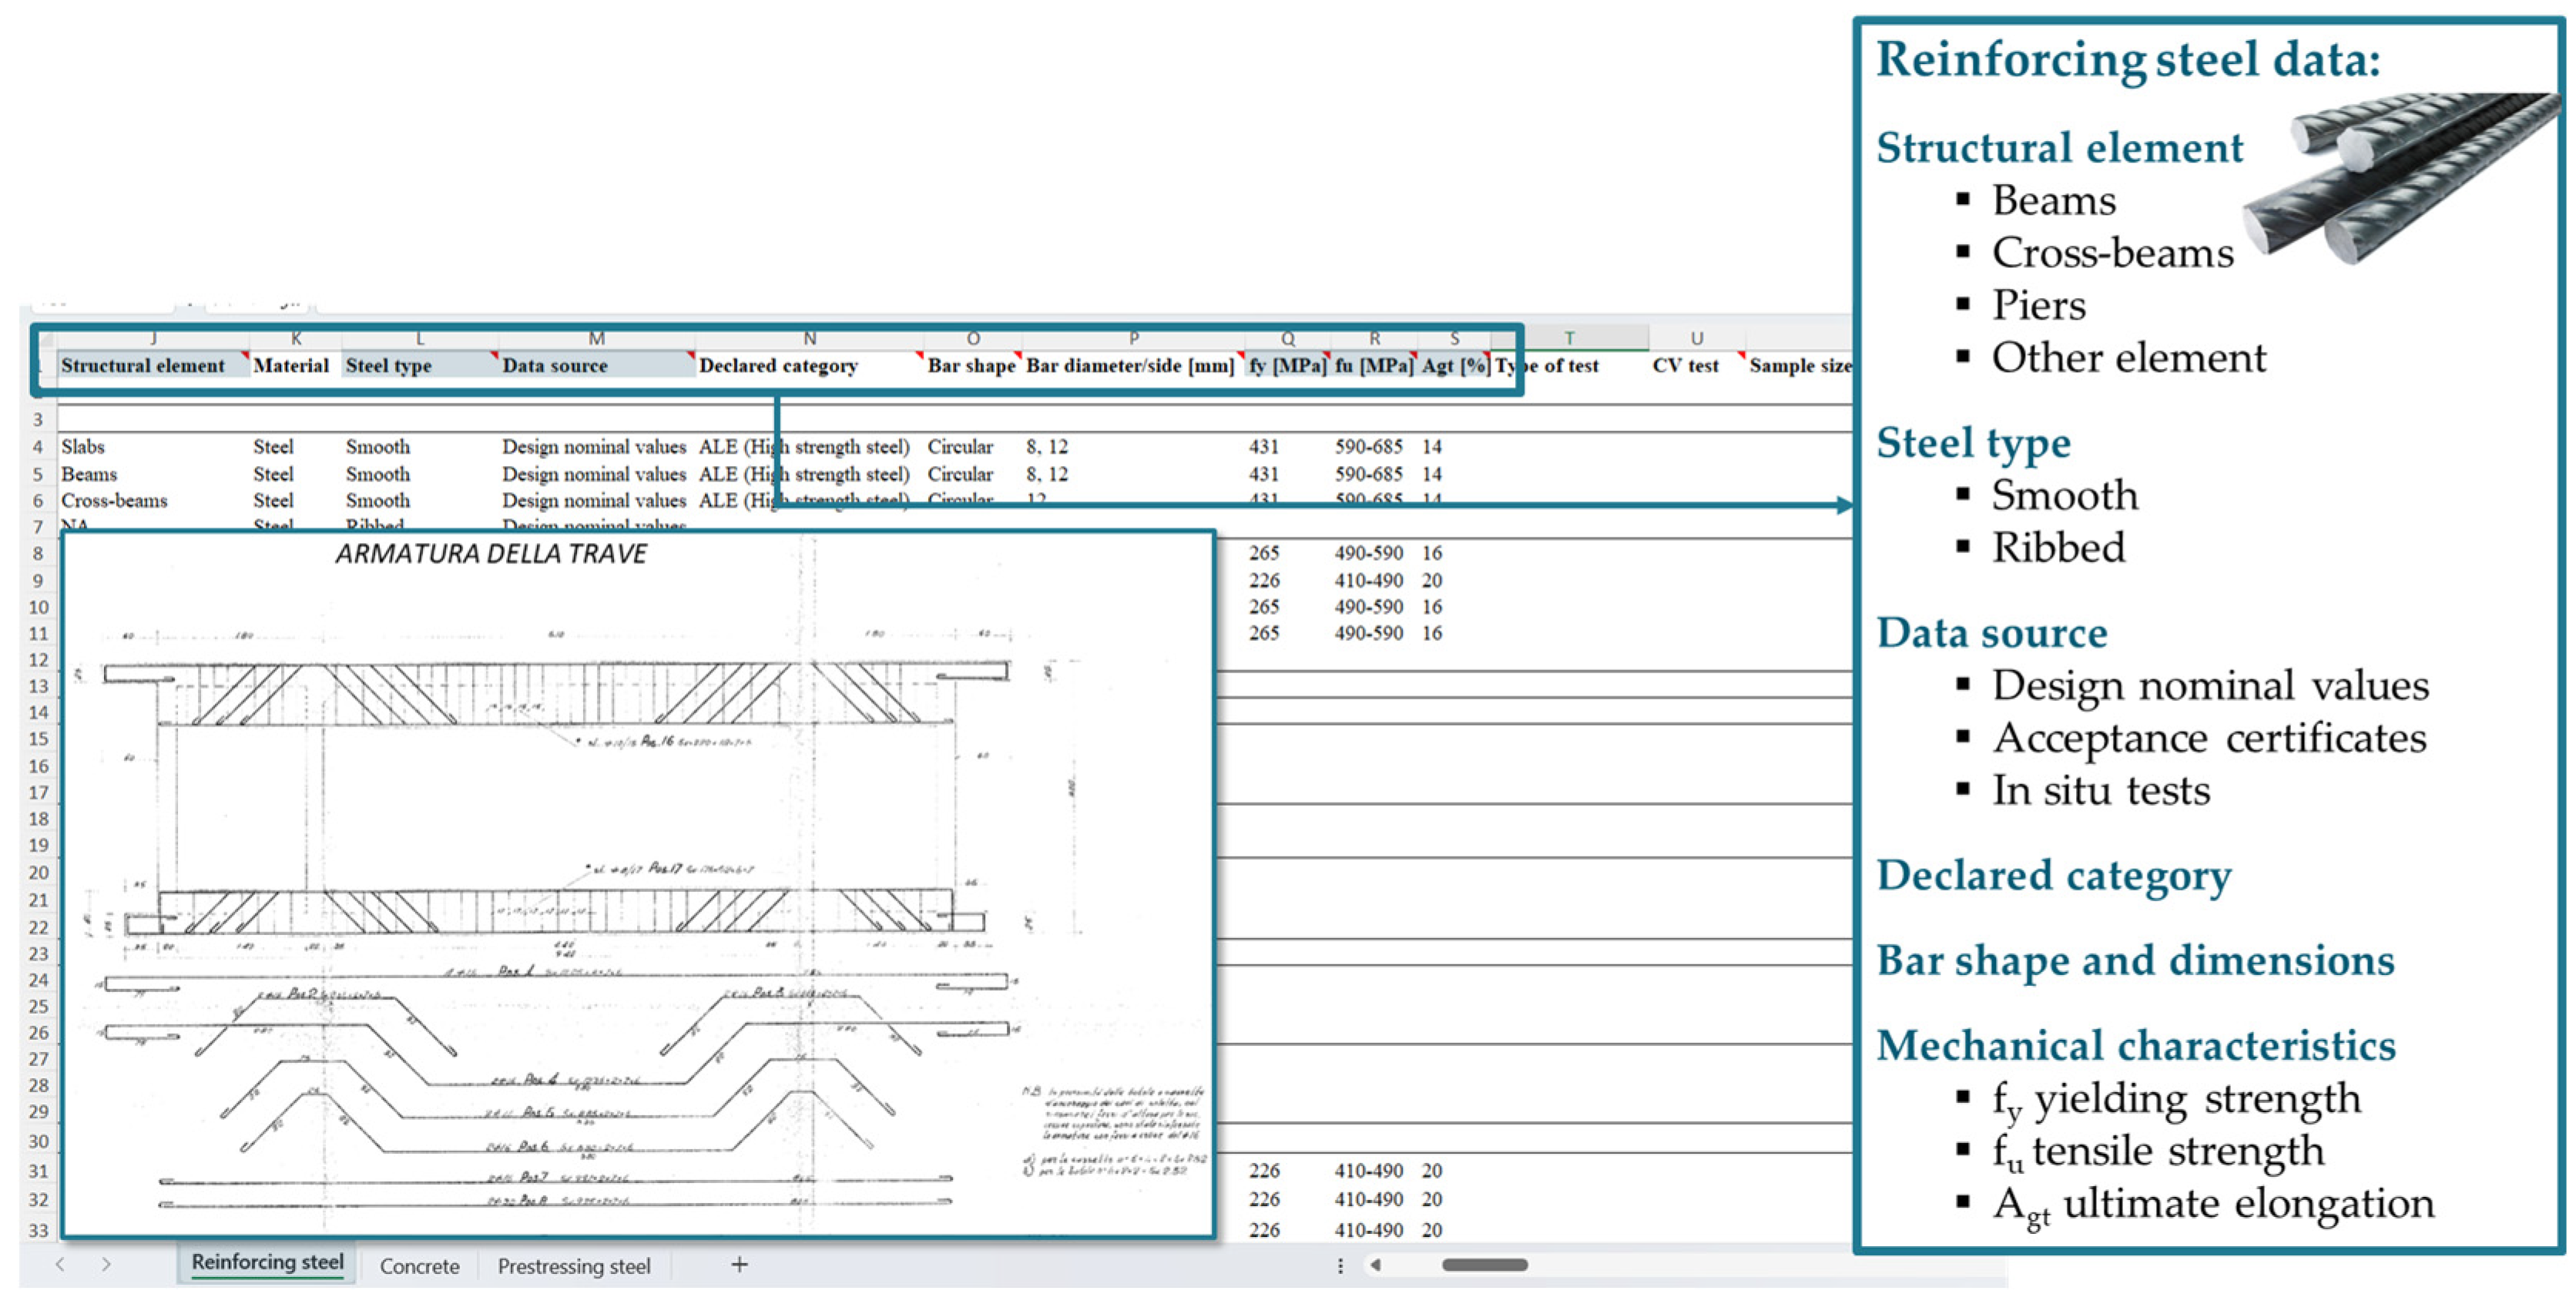
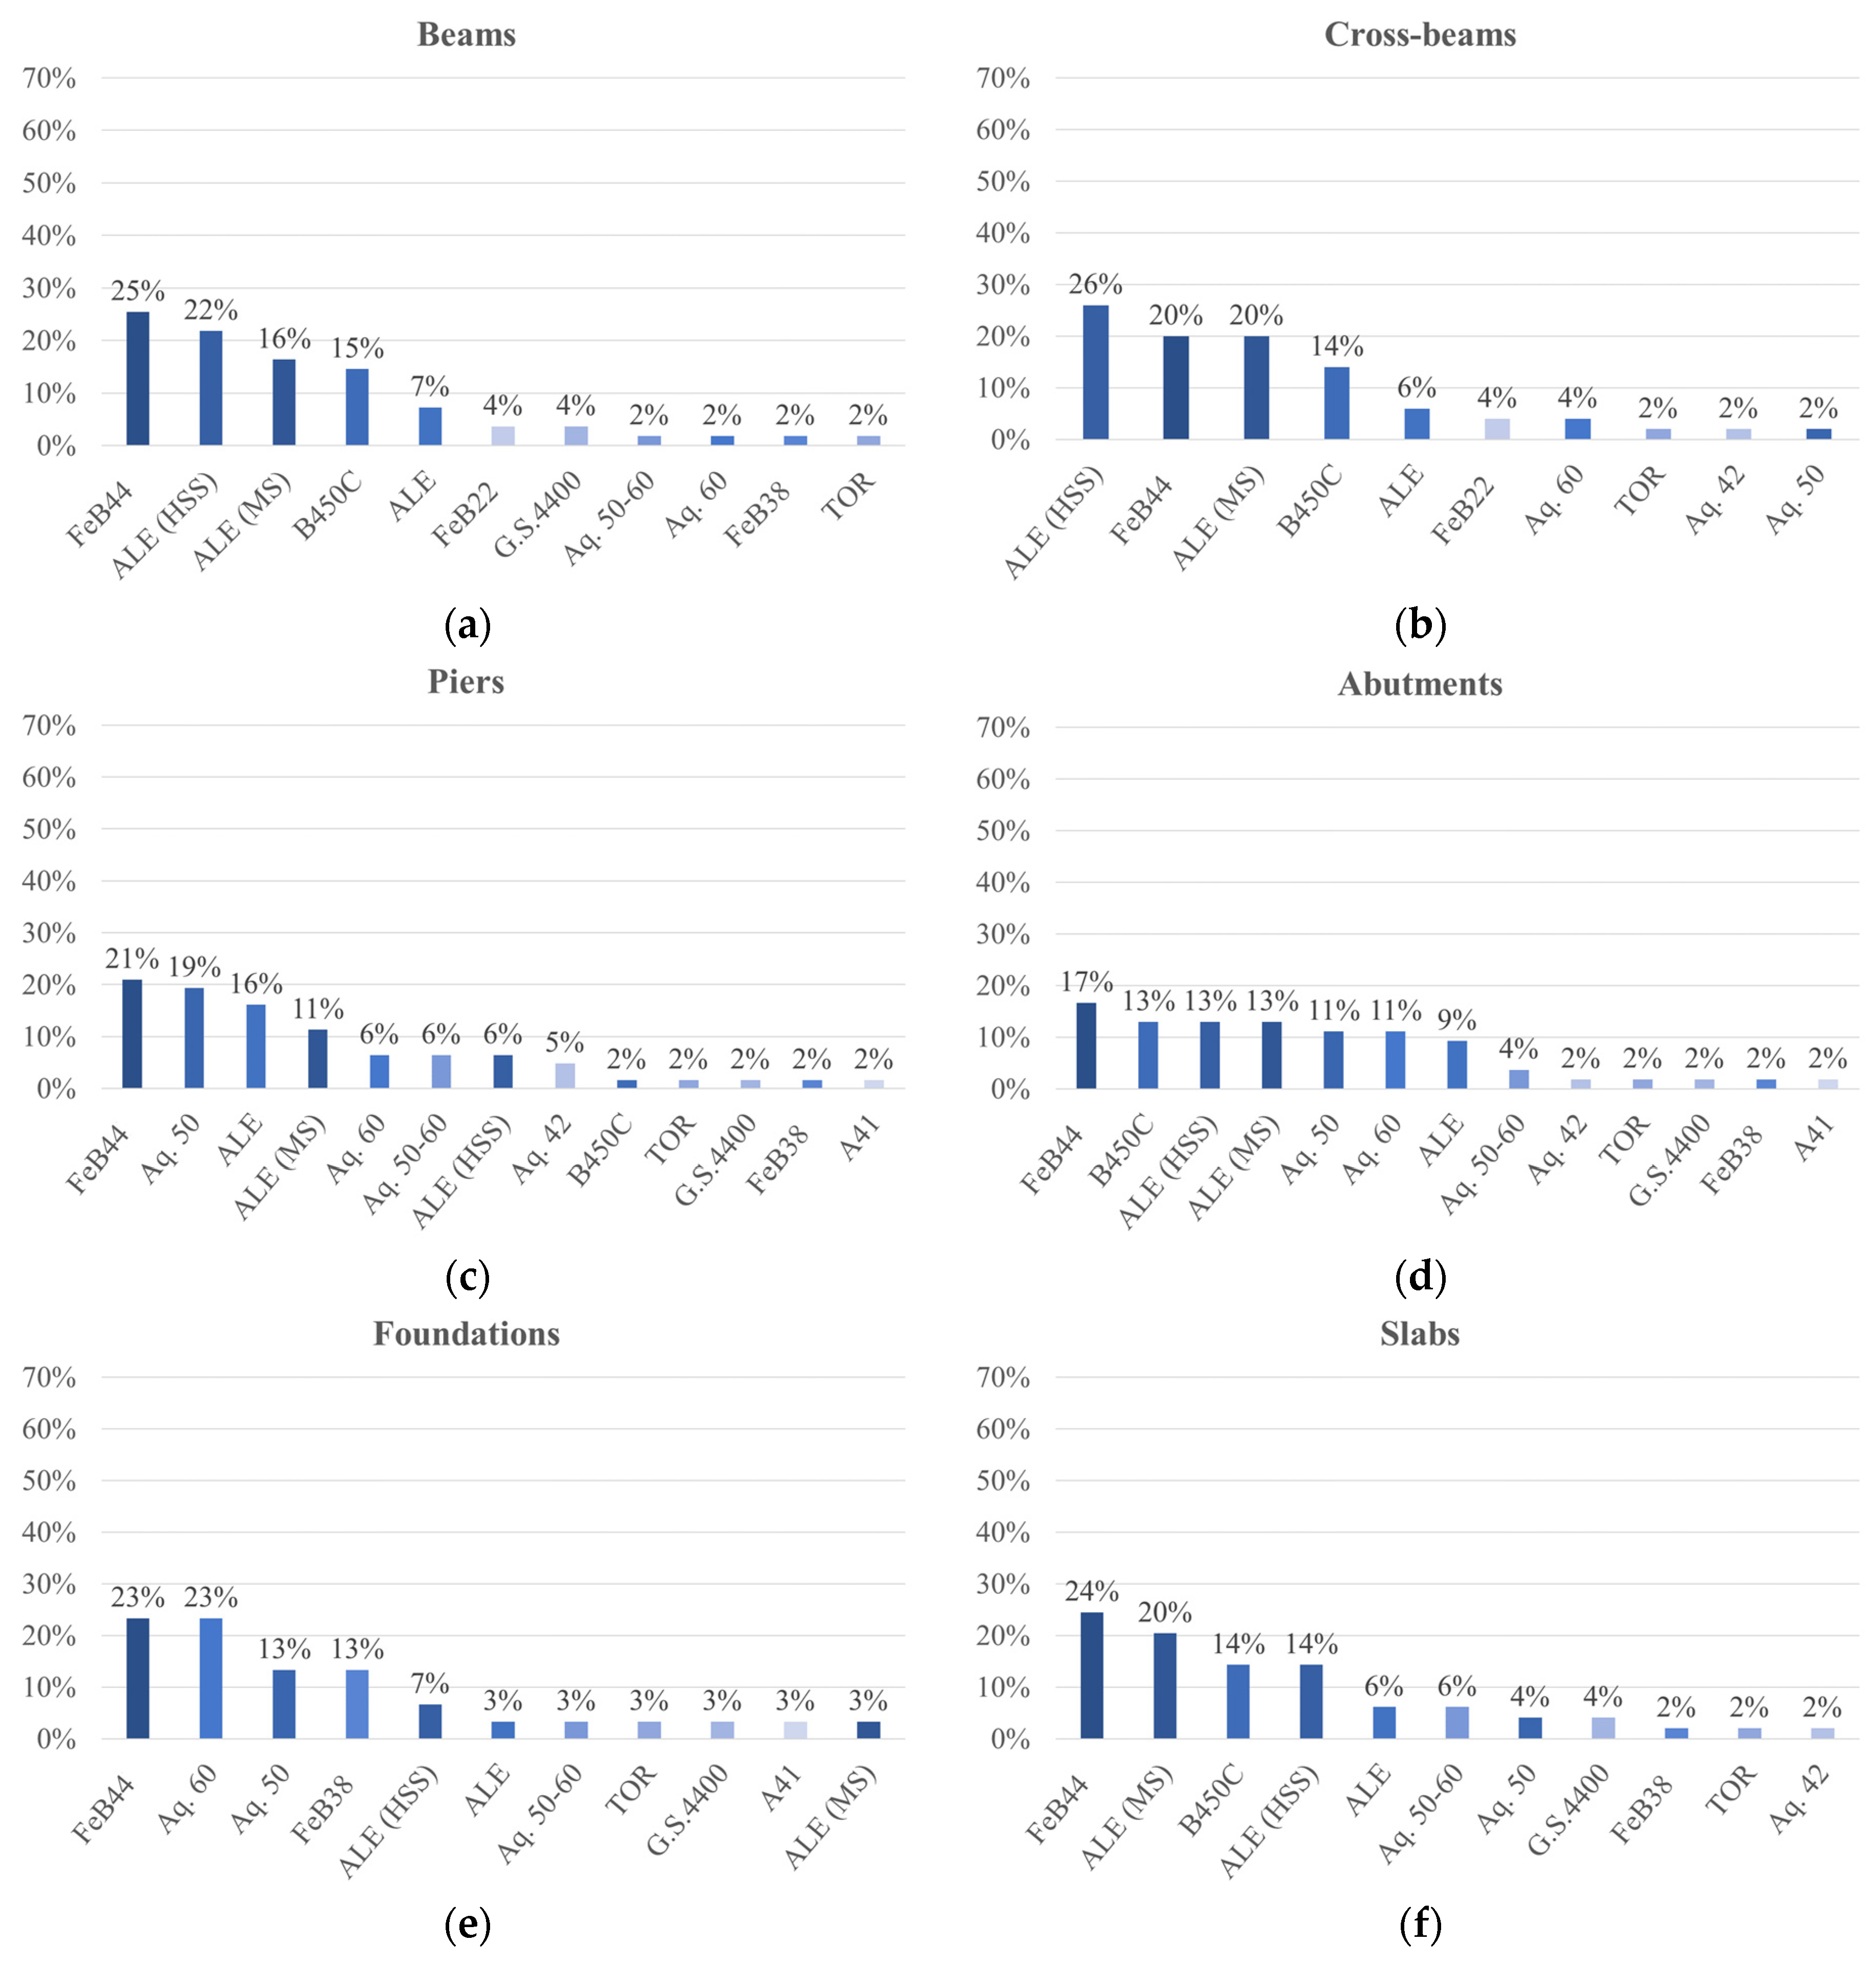
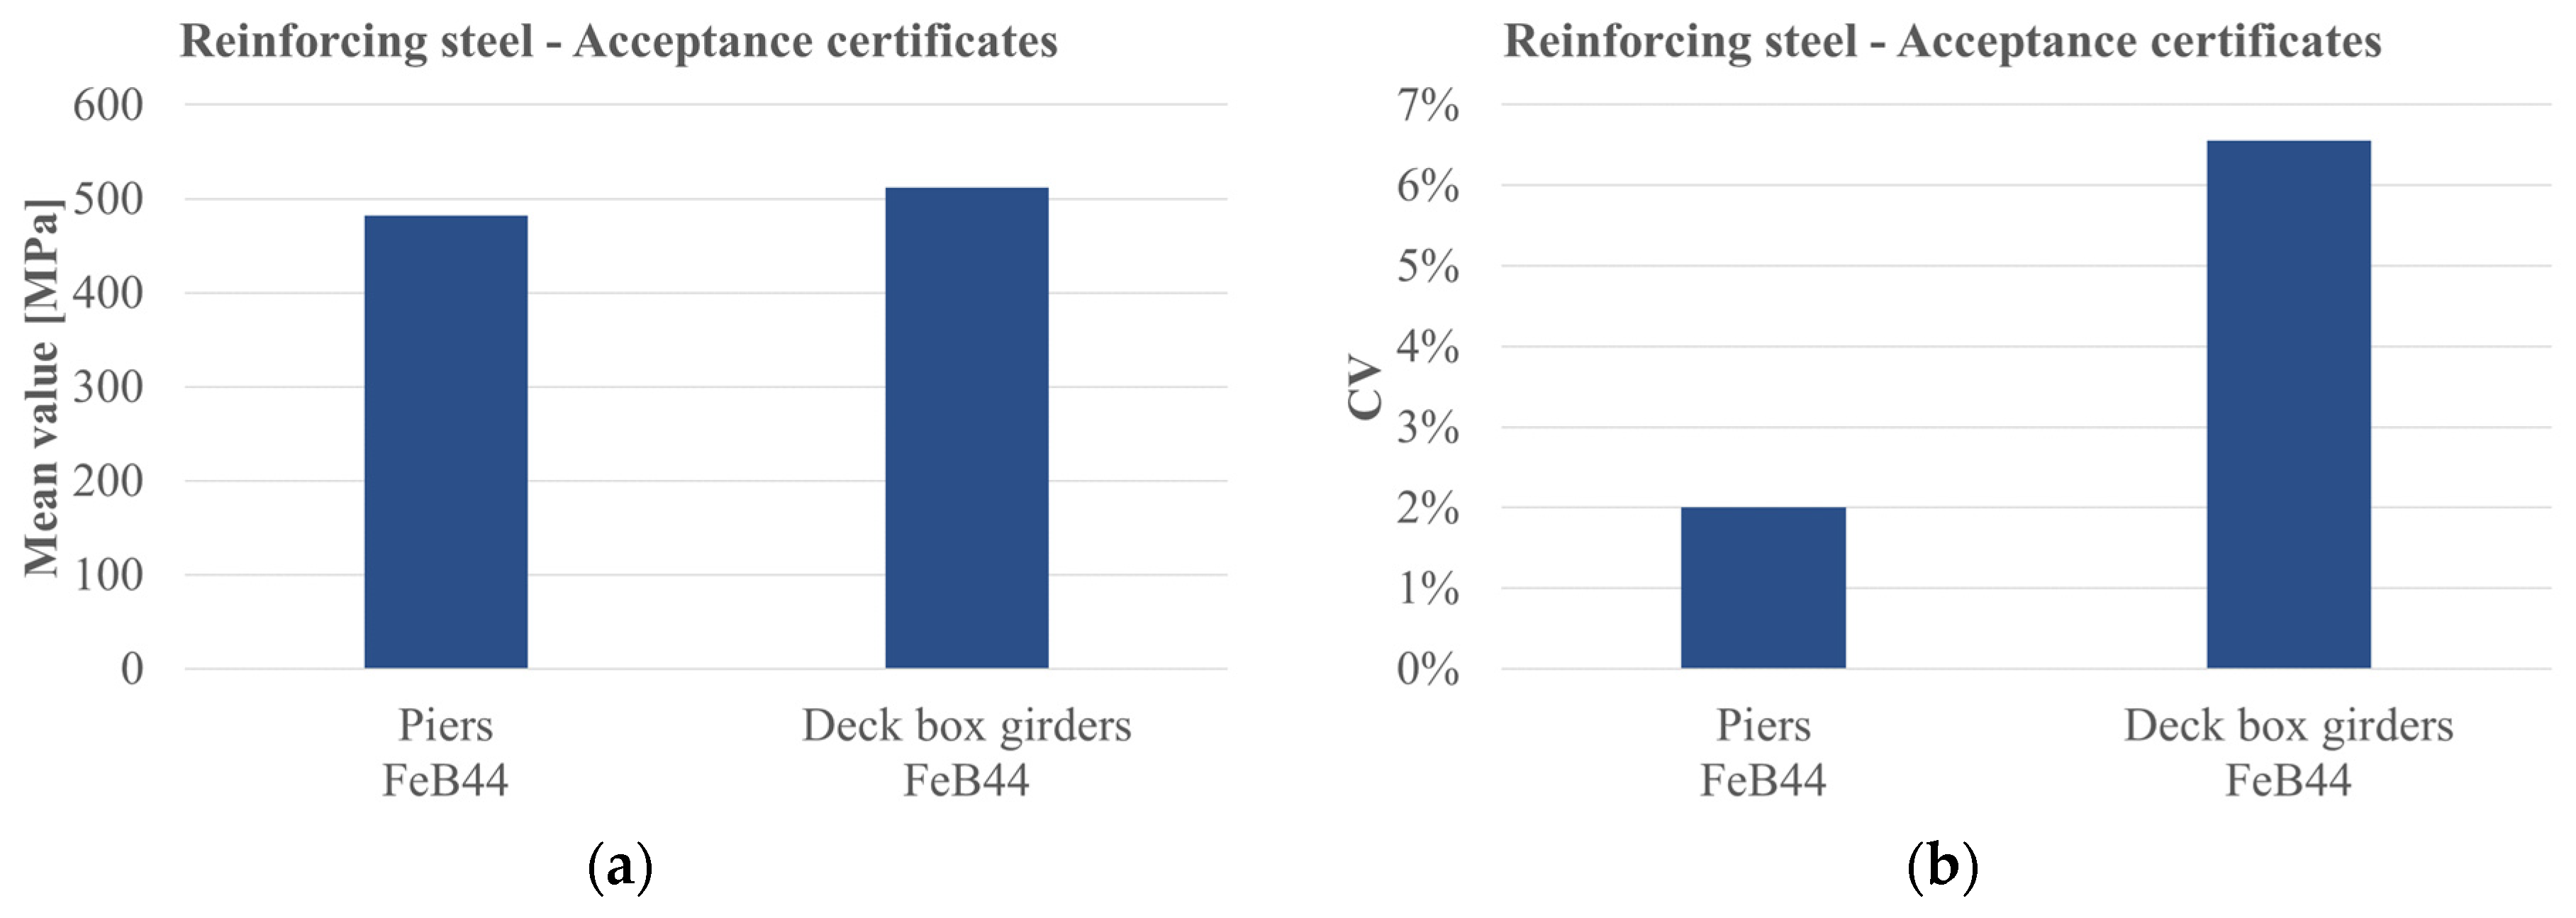
4.1. Reinforcing Steel
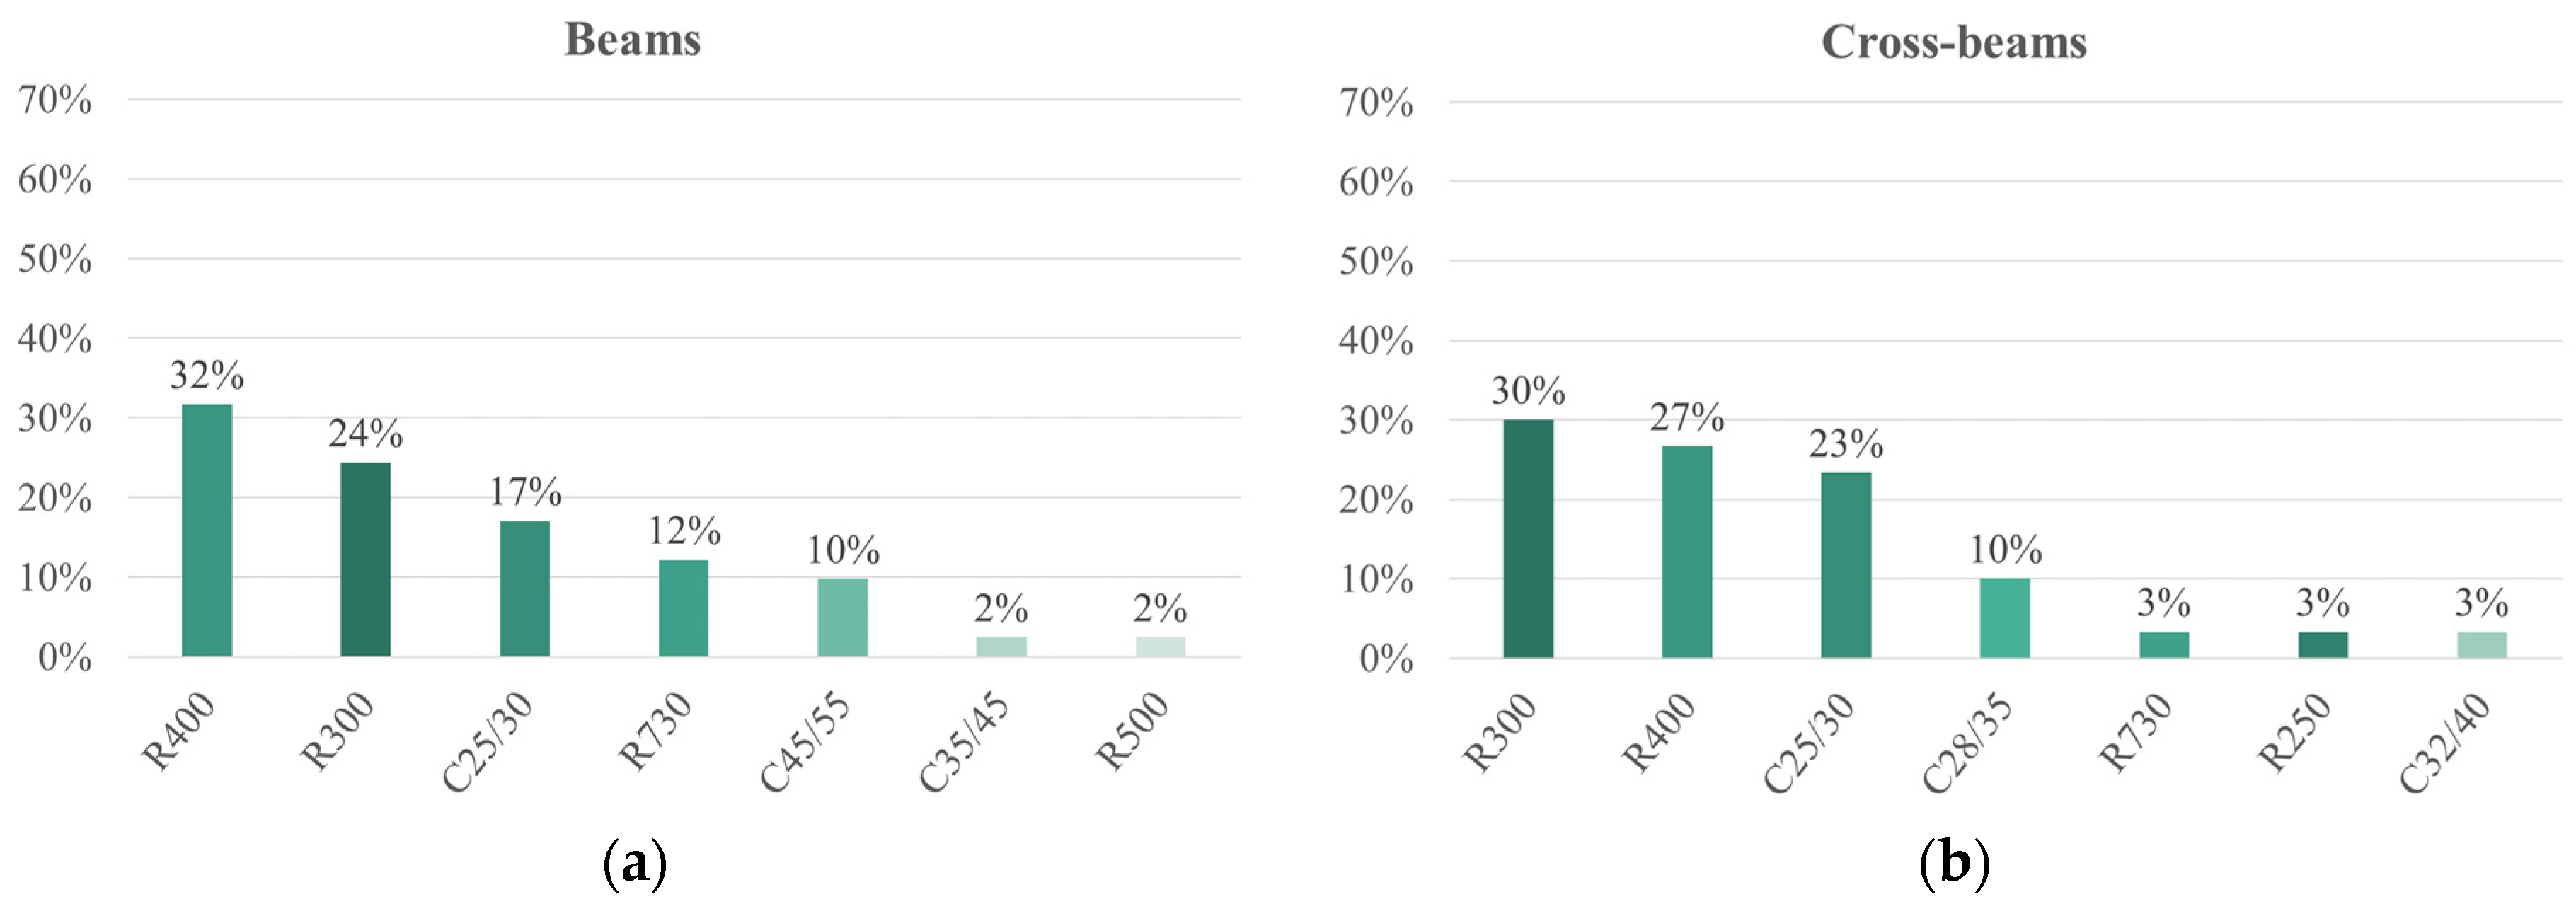
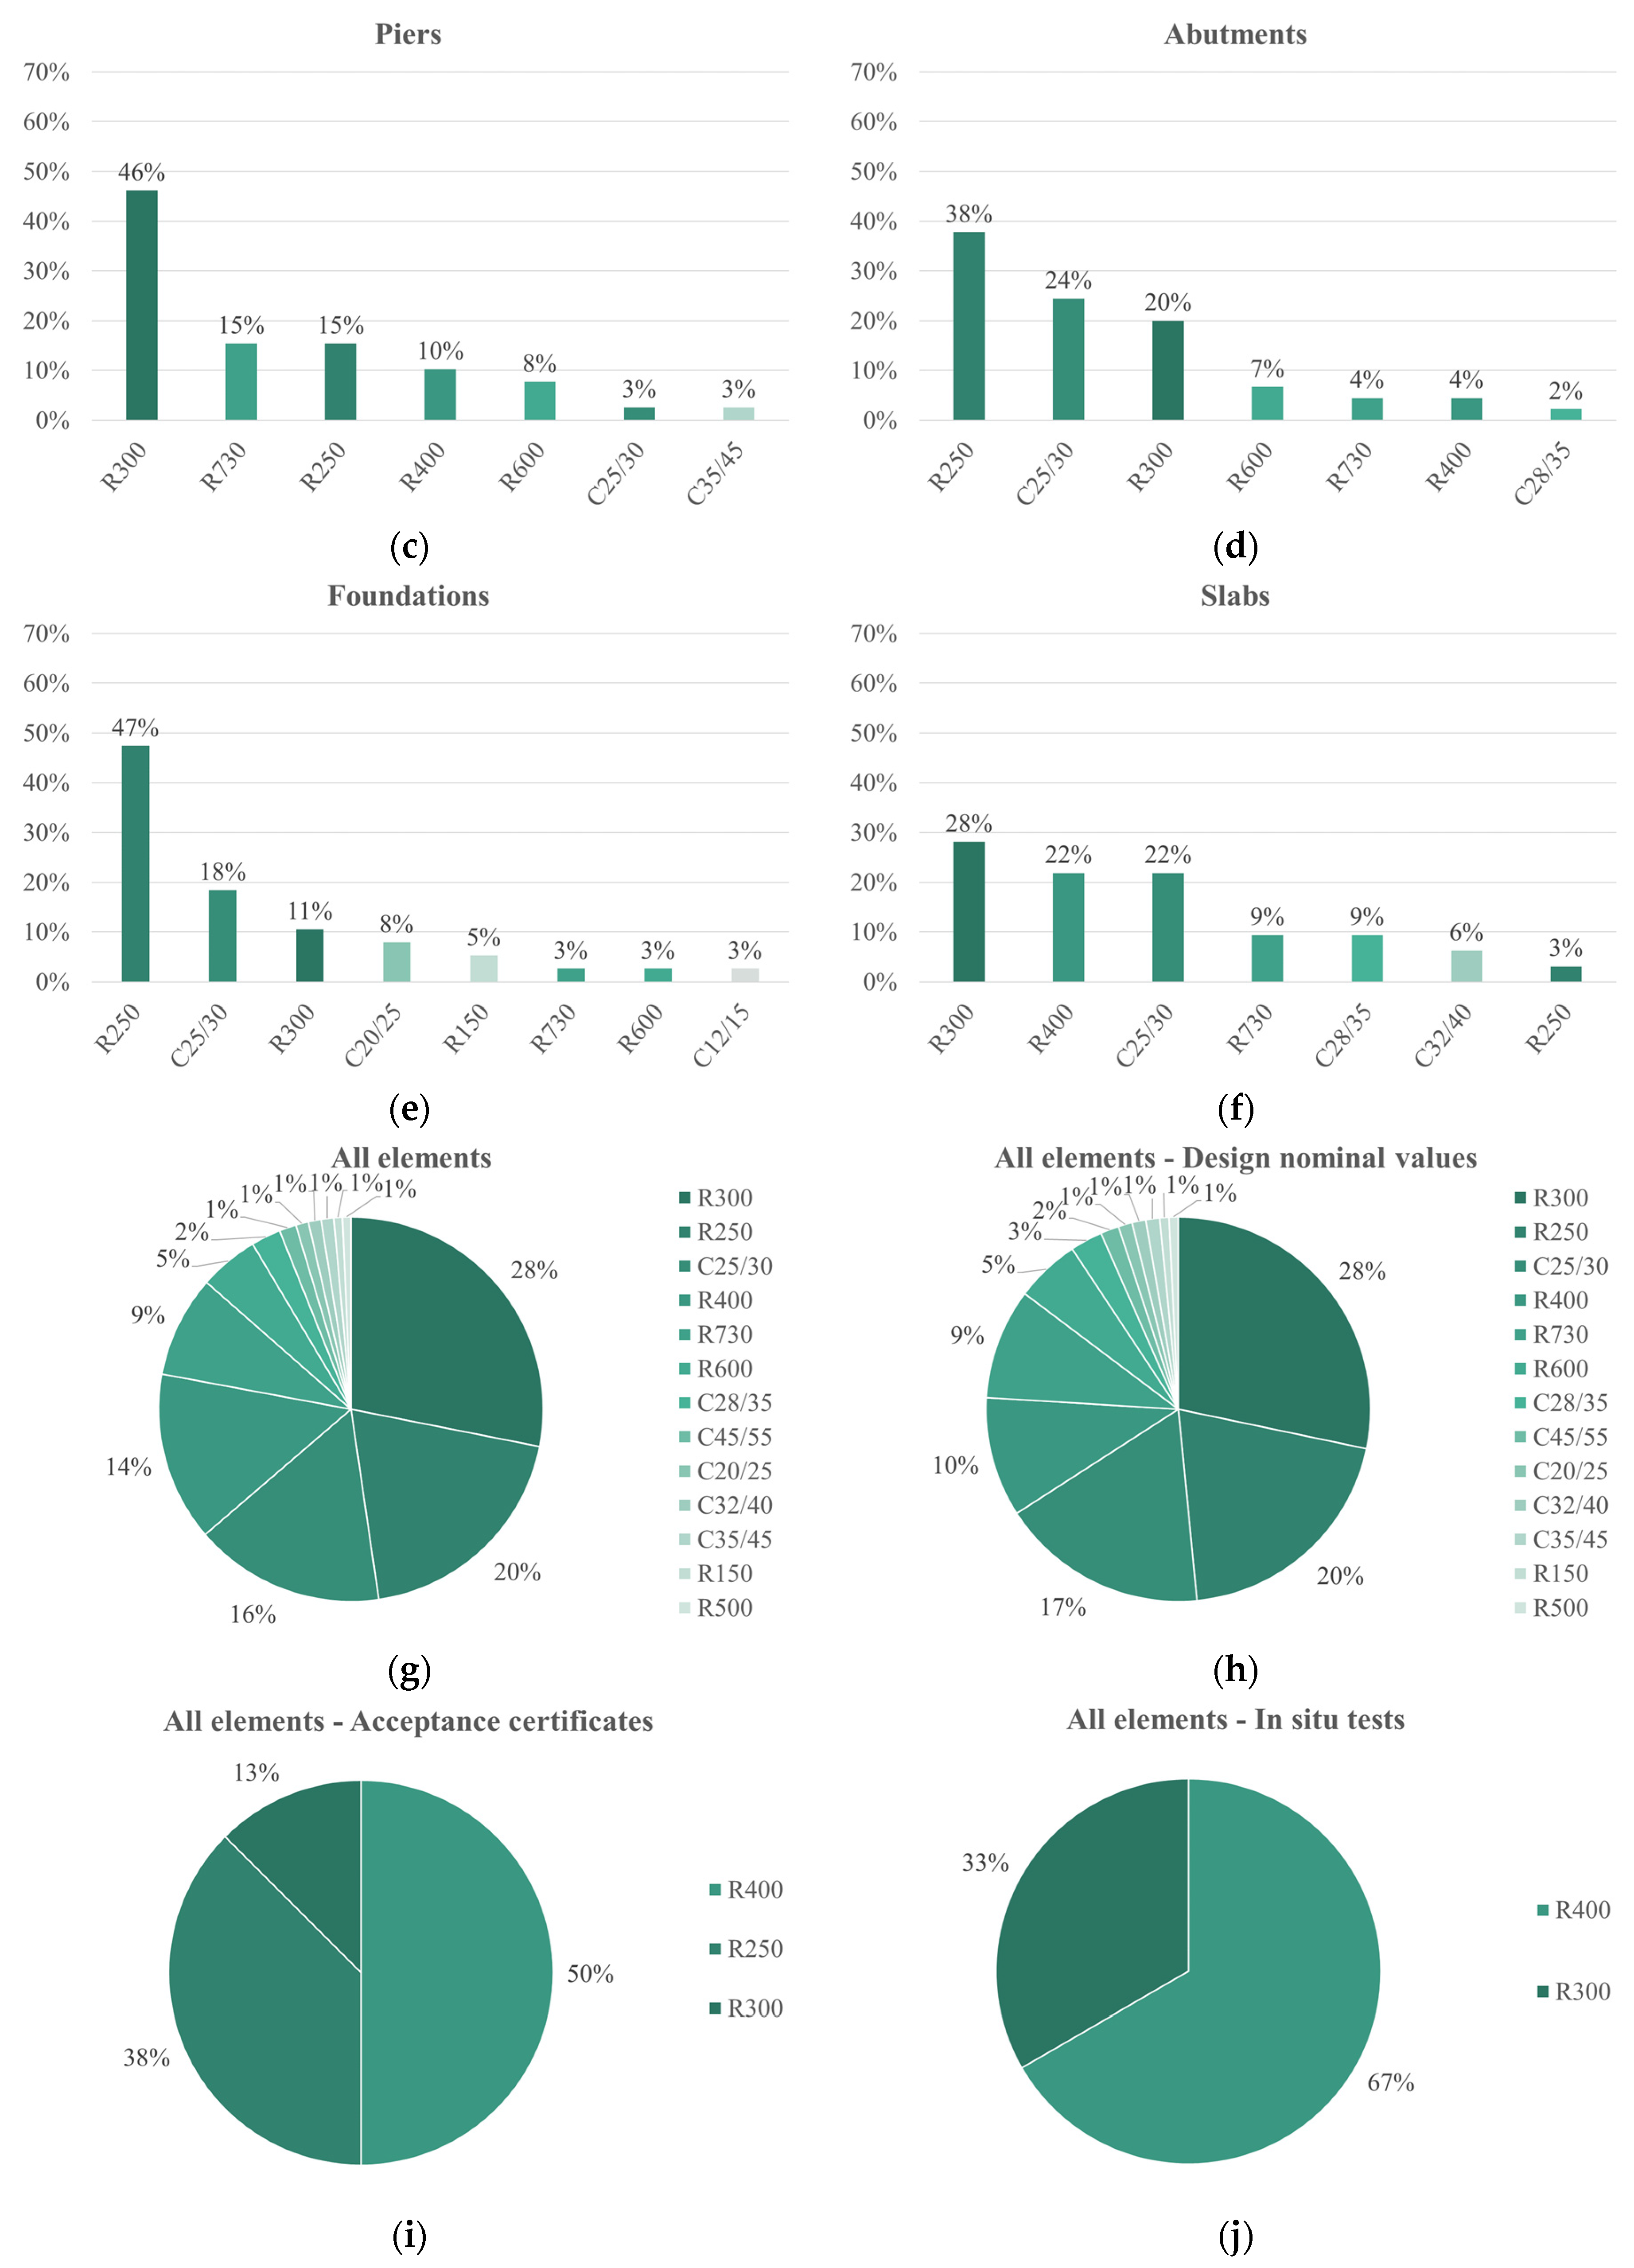
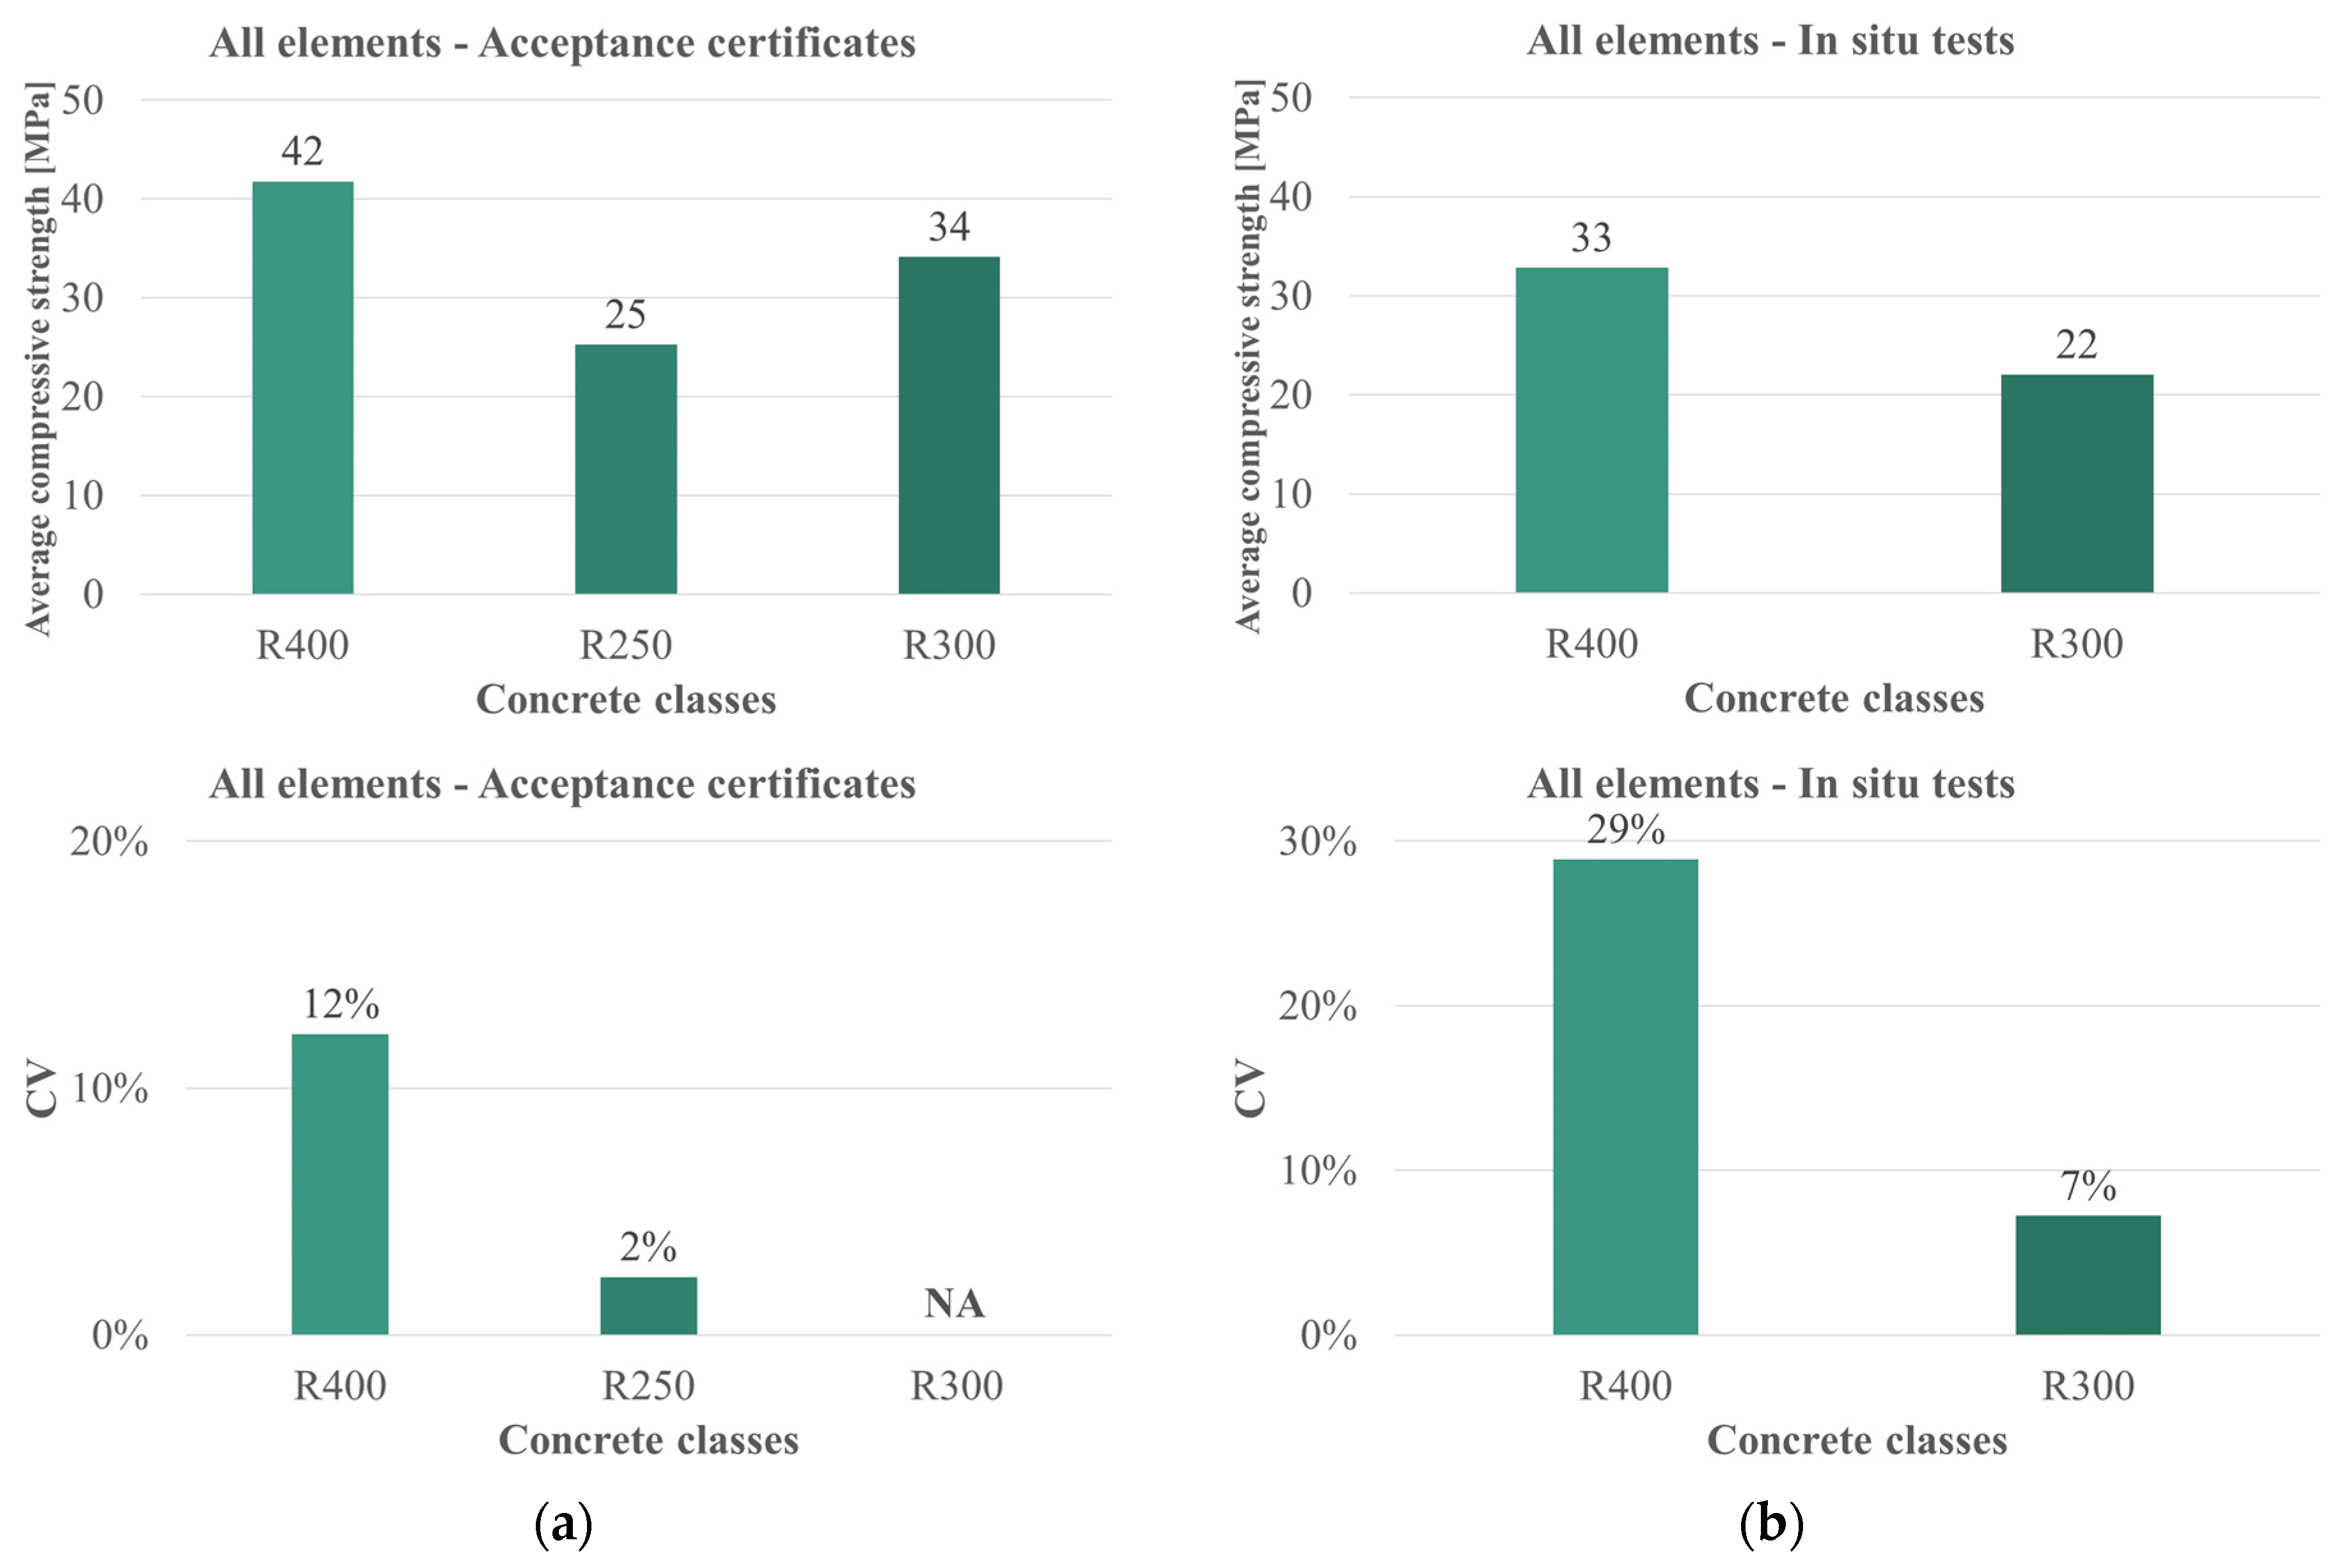
4.2. Concrete
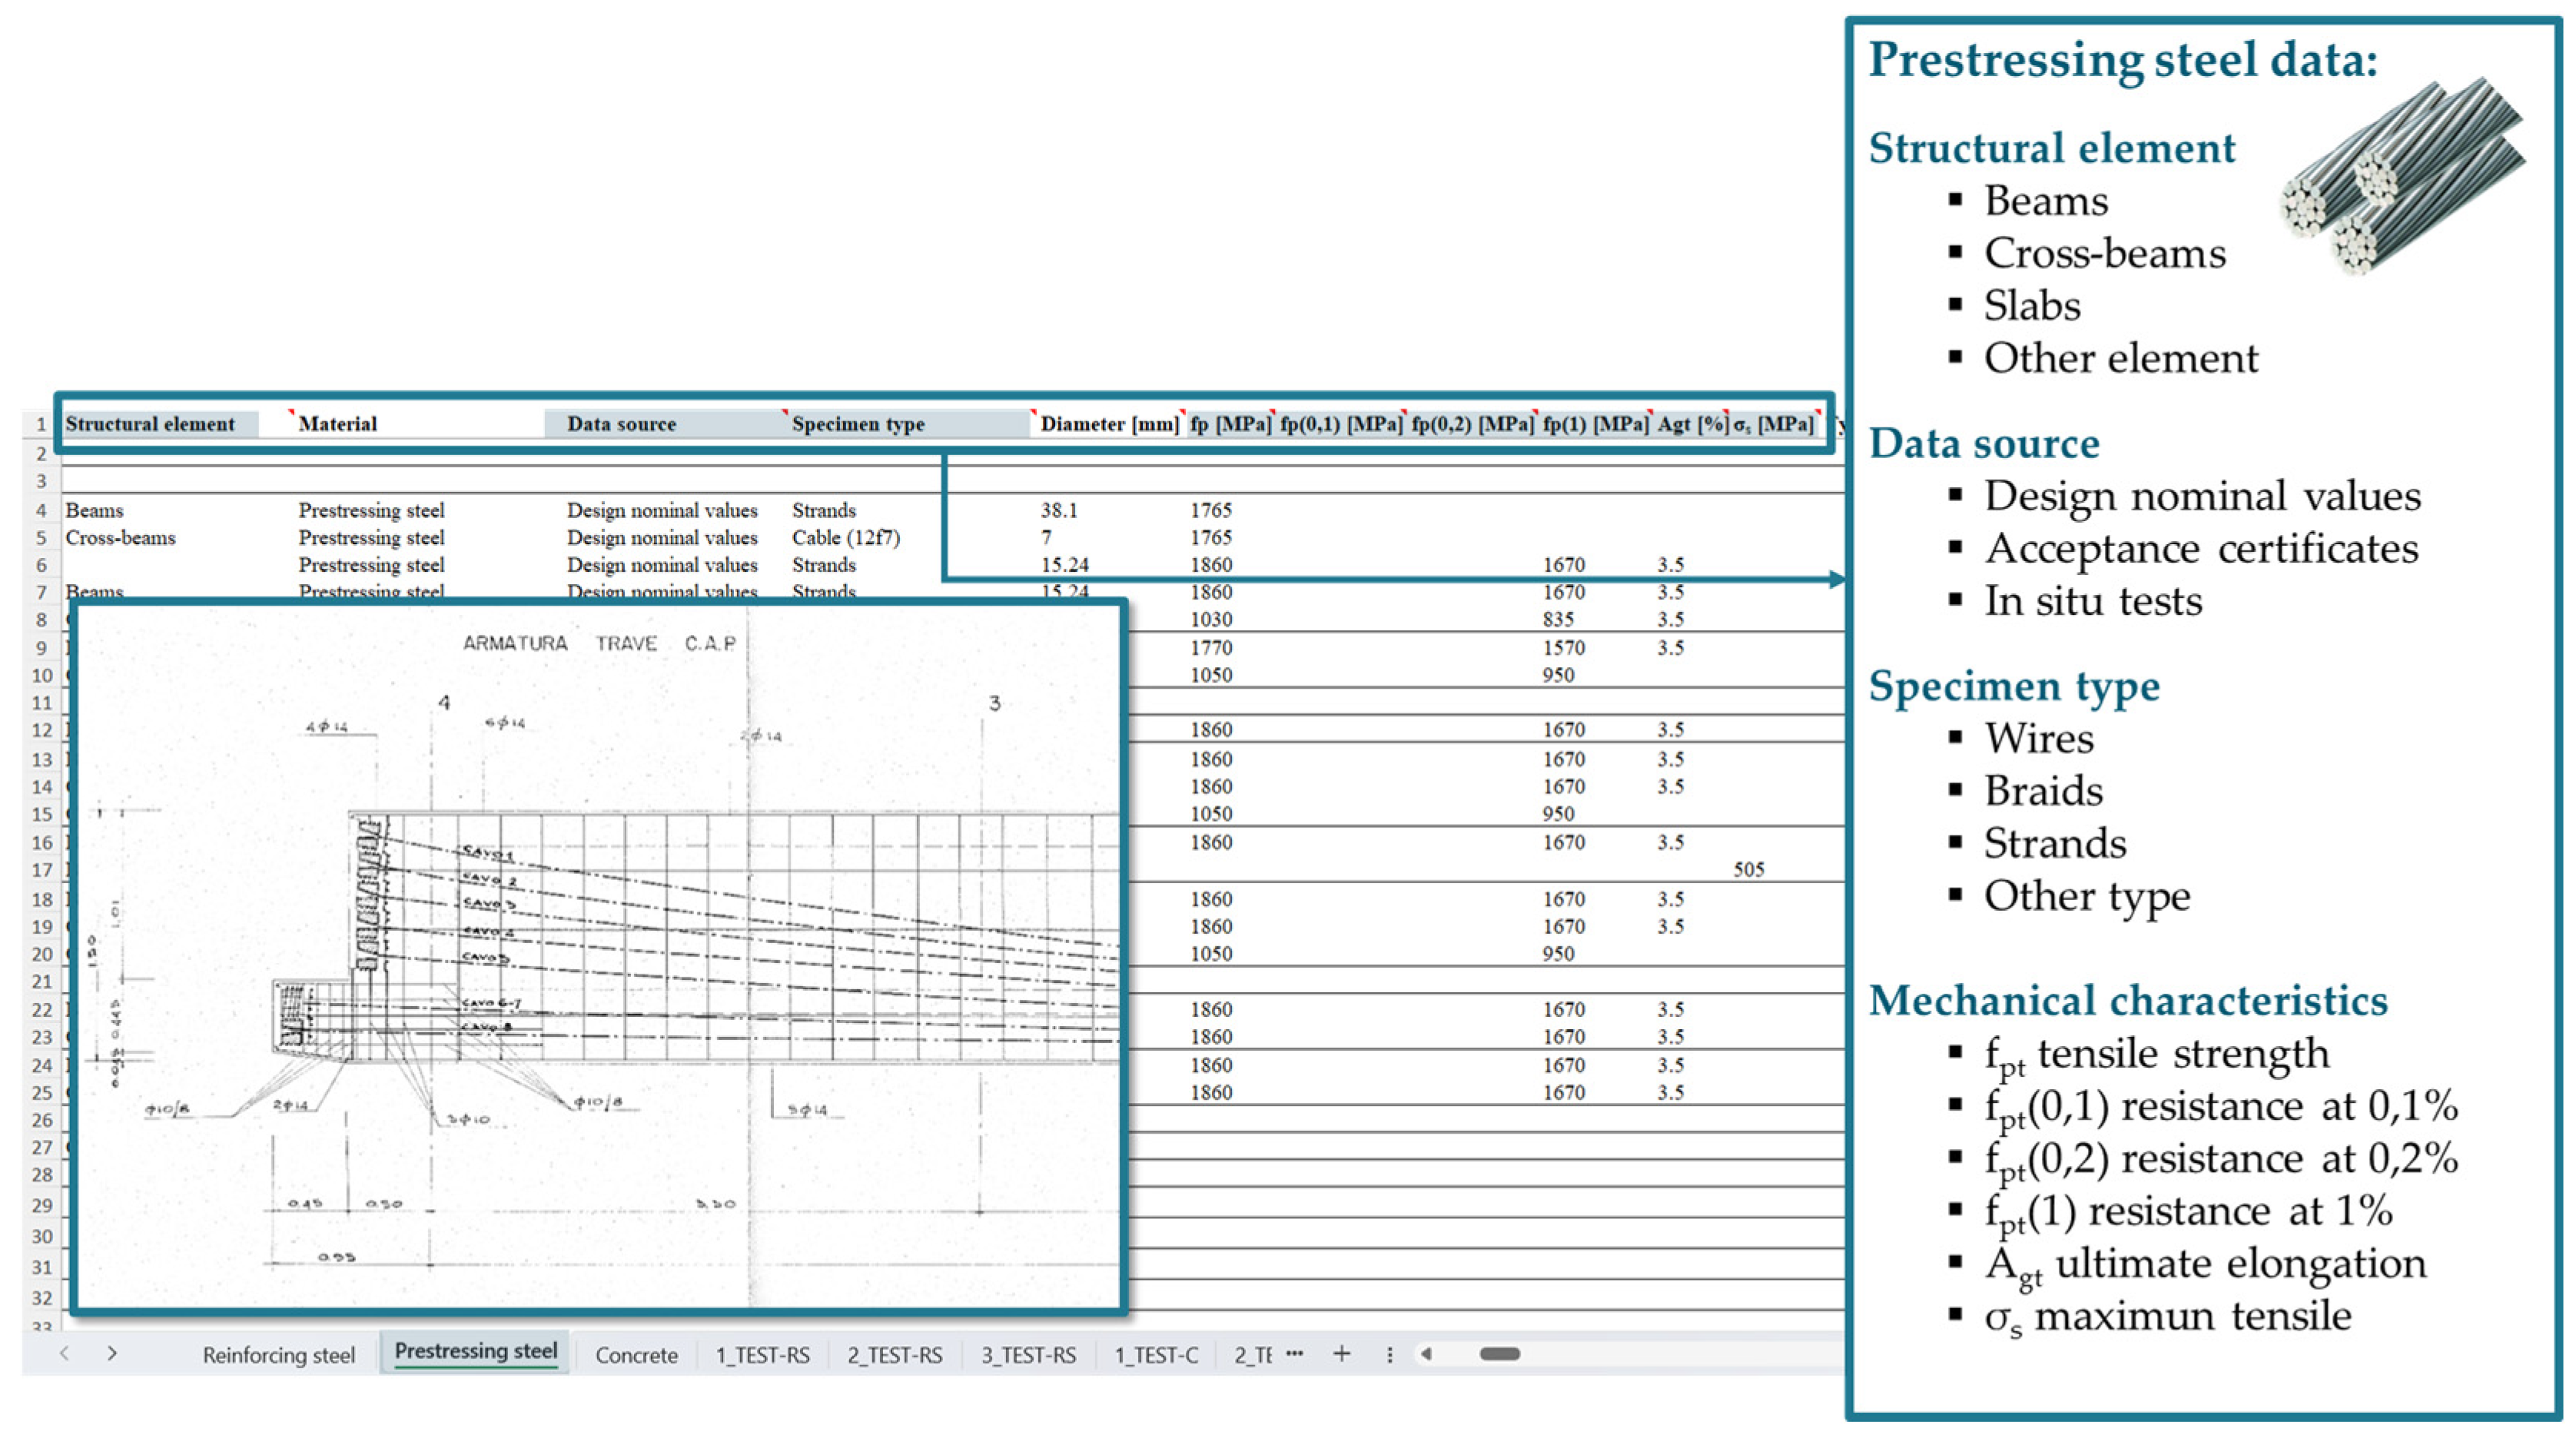
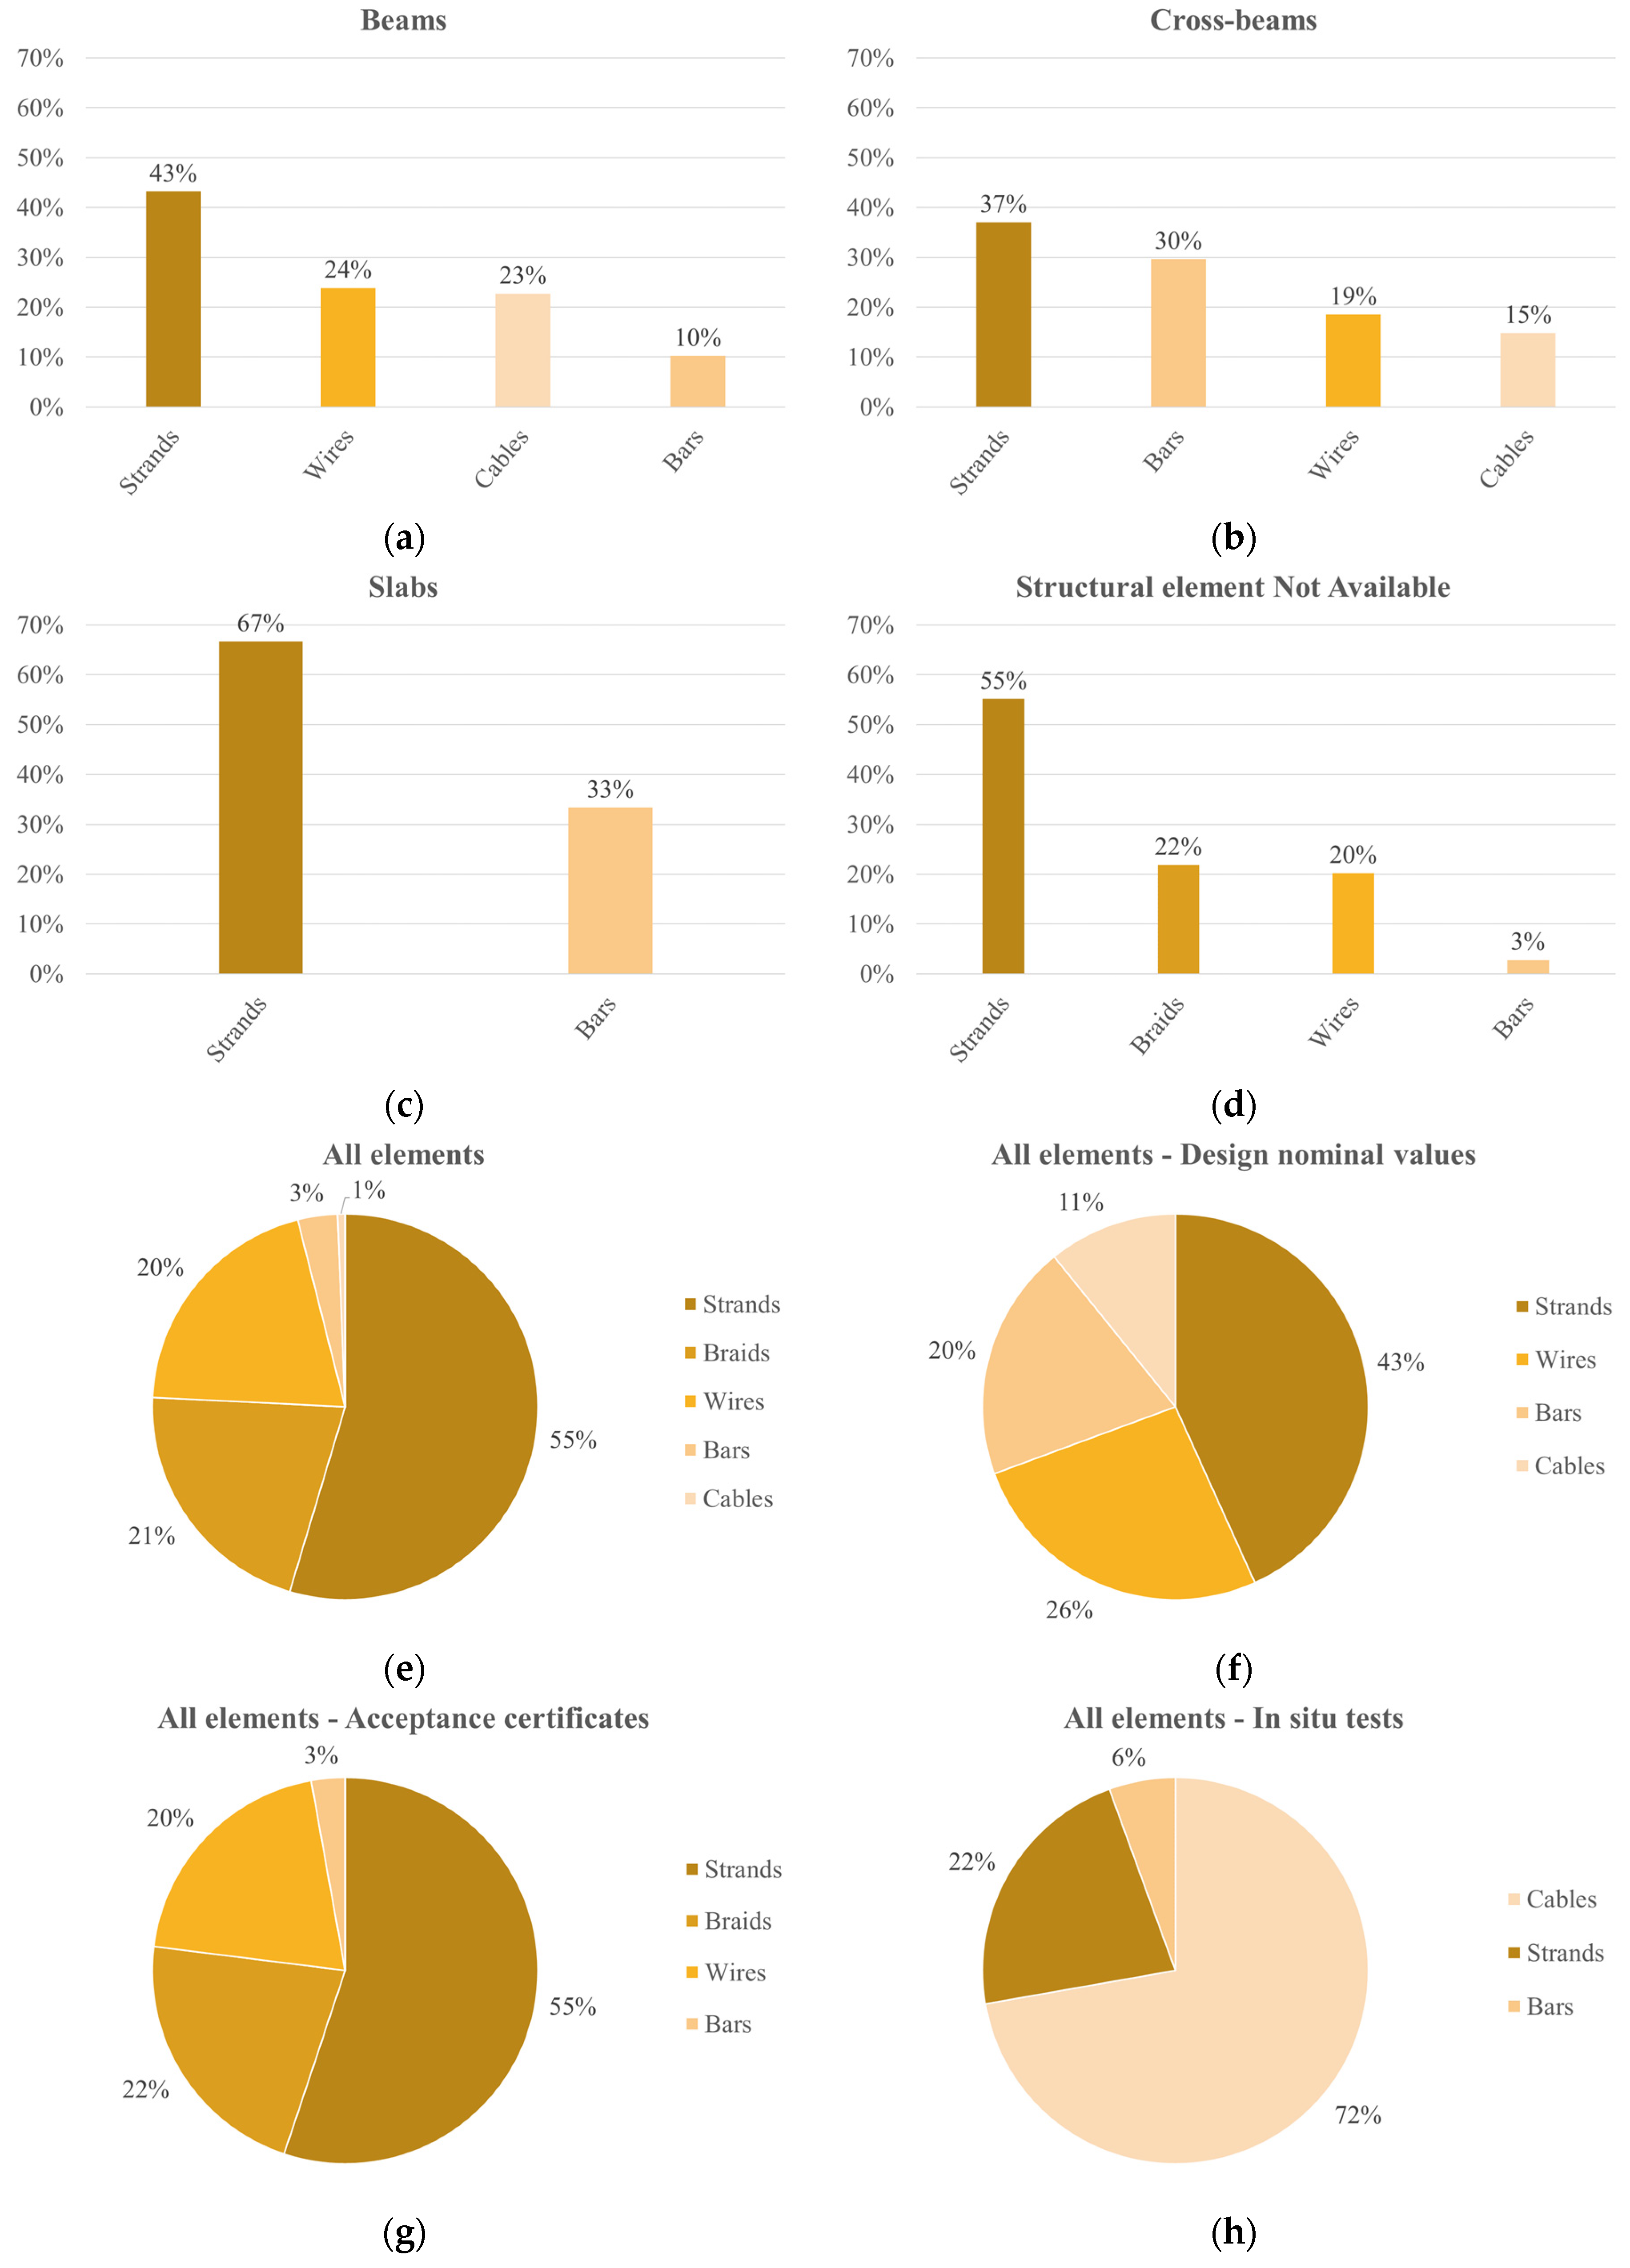
4.3. Prestressing Steel
5. Statistical Analysis of Data
5.1. Goodness-of-Fit Tests
5.2. Test Results
6. Discussion
7. Conclusions and Future Development
Author Contributions
Funding
Data Availability Statement
Acknowledgments
Conflicts of Interest
Abbreviations
| PCBs | Prestressed Concrete Beams |
| WP | Work Package |
| Pre-TCBs | Pre-Tensioned Concrete Beams |
| Post-TCBs | Post-Tensioned Concrete Beams |
| PC | Prestressed Concrete |
| RC | Reinforced Concrete |
| NA | Not Available |
| CV | Coefficient of Variation |
| NSS | Not Statistically Significant |
| SS | Statistically Significant |
References
- Bazzucchi, F.; Restuccia, L.; Ferro, G.A. Considerations over the Italian road bridge infrastructure safety after the Polcevera viaduct collapse: Past errors and future perspectives. Frat. Ed Integrità Strutt. 2018, 46, 400–421. [Google Scholar] [CrossRef]
- Contardi, A.; La Fortezza, F. Methodology for Estimating Bridge Failure Costs. BER Int. J. Bridge Eng. Manag. Res. 2025, 2, 214250013. [Google Scholar] [CrossRef]
- Malerba, P.G. Bridge vulnerabilities and collapses: The Italian Experience. Struct. Infrastruct. Eng. 2024, 20, 976–1001. [Google Scholar] [CrossRef]
- Lee, G.C.; Mohan, S.B.; Huang, C.; Fard, B.N. A Study of U.S. Bridge Failures (1980–2012); MCEER: Buffalo, NY, USA, 2013. [Google Scholar]
- Wardhana, K.; Hadipriono, F.C. Analysis of recent bridge failures in the United States. J. Perform. Constr. Facil. 2003, 17, 144–150. [Google Scholar] [CrossRef]
- Zhang, G.; Liu, Y.; Liu, J.; Lan, S.; Yang, J. Causes and statistical characteristics of bridge failures: A review. J. Traffic Transp. Eng. 2022, 9, 388–406. [Google Scholar] [CrossRef]
- Tatangelo, M.; Audisio, L.; D’Amato, M.; Gigliotti, R.; Braga, F. A new reliability-based procedure for life-cycle management of new and existing constructions. Structures 2024, 70, 107837. [Google Scholar] [CrossRef]
- Du Béton, Fédération Internationale du Béton. Partial Factor Methods for Existing Concrete Structures: Recommendation; International Federation for Structural Concrete: Lausanne, Switzerland, 2016. [Google Scholar] [CrossRef]
- Ranaldo, A.; Lo Monaco, A.; Palmiotta, A.; D’Amato, M.; Lippolis, A.; Vacca, V.; Sarno, R. A preliminary investigation on material properties of existing prestressed concrete beams. Procedia Struct. Integr. 2024, 62, 145–152. [Google Scholar] [CrossRef]
- Micozzi, F.; Poeta, A.; Gioiella, L.; Natali, A.; Celati, S.; Mazzatura, I.; Salvatore, W.; Meoni, A.; Ierimonti, L.; Venanzi, I.; et al. SAFOTEB project: Towards new approaches for the reliability assessment of existing prestressed bridge. ce/papers 2023, 6, 43–48. [Google Scholar] [CrossRef]
- Poeta, A.; Micozzi, F.; Gioiella, L.; Dall’Asta, A. Influence of knowledge uncertainties on the safety assessment of existing post-tensioned concrete bridges. Struct. Eng. Mech. 2025, 94, 463–478. Available online: https://www.techno-press.org/content/?page=article&journal=sem&volume=94&num=6&ordernum=5# (accessed on 1 August 2025).
- Rossi, D.; Pettorruso, C.; Bruschi, E.; Zoccolini, L.; Quaglini, V. Evaluation of non-destructive techniques for inspection of post-tensioned concrete bridges. Procedia Struct. Integr. 2024, 62, 307–314. [Google Scholar] [CrossRef]
- Meoni, A.; Sconocchia, G.G.; Mariani, F.; Ierimonti, L.; Castellani, M.; Tomassini, E.; Venanzi, I.; Ubertini, F. Characterization of the static and dynamic response of a post-tensioned concrete box girder bridge with vertically prestressed joints showing vertical deflections due to concrete creep deformation. J. Phys. Conf. Ser. 2024, 2647, 192020. [Google Scholar] [CrossRef]
- Bracchi, S.; Rota, M.; Magenes, G.; Penna, A. Seismic assessment of masonry buildings accounting for limited knowledge on materials by Bayesian updating. Bull. Earthq. Eng. 2016, 14, 2273–2297. [Google Scholar] [CrossRef]
- Jalayer, F.; Elefante, L.; Iervolino, I.; Manfredi, G. Knowledge-based performance assessment of existing RC buildings. J. Earthq. Eng. 2011, 15, 362–389. [Google Scholar] [CrossRef]
- Yuen, K.V.; Kuok, S.C. Bayesian methods for updating dynamic models. Appl. Mech. Rev. 2011, 64, 010802. [Google Scholar] [CrossRef]
- Simoen, E.; Papadimitriou, C.; Lombaert, G. On prediction error correlation in Bayesian model updating. J. Sound Vib. 2013, 332, 4136–4152. [Google Scholar] [CrossRef]
- Jia, S.; Akiyama, M.; Han, B.; Frangopol, D.M. Probabilistic structural identification and condition assessment of prestressed concrete bridges based on Bayesian inference using deflection measurements. Struct. Infrastruct. Eng. 2024, 20, 131–147. [Google Scholar] [CrossRef]
- Sohn, H.; Law, K.H. Bayesian probabilistic damage detection of a reinforced-concrete bridge column. Earthq. Eng. Struct. Dyn. 2000, 29, 1131–1152. [Google Scholar] [CrossRef]
- Verderame, G.M.; Stella, A.; Cosenza, E. Le proprietà meccaniche degli acciai impiegati nelle strutture in ca realizzate negli anni’60. In Proceedings of the X Convegno Nazionale “L’Ingegneria Sismica in Italia”, Potenza e Matera, Italy, 9–13 September 2001. (In Italian). [Google Scholar]
- Verderame, G.M.; Manfredi, G.; Frunzio, G. Le proprietà meccaniche degli calcestruzzi impiegati nelle strutture in ca realizzate negli anni’60. In Proceedings of the X Convegno Nazionale “L’Ingegneria Sismica in Italia”, Potenza e Matera, Italy, 9–13 September 2001. (In Italian). [Google Scholar]
- Verderame, G.M.; Ricci, P.; Esposito, M.; Sensiviero, F.C. Le caratteristiche meccaniche degli acciai impiegati nelle strutture in ca realizzate dal 1950 al 1980. In Proceedings of the XXVI Convegno Nazionale AICAP “Le Prospettive Di Sviluppo Delle Opere in Calcestruzzo Strutturale Nel Terzo Millennio”, Padova, Italy, 19–21 May 2011. (In Italian). [Google Scholar]
- Del Lago, B.; Cefis, N.; Beltrame, M.; Coppolino, A.; Rubia, M. Experimental strength of steel and concrete in 1926–1950 from the archive of Politecnico di Milano/Resistenza sperimentale di acciai e calcestruzzi nel periodo 1926–1950 dall’archivio del Politecnico di Milano. In Proceedings of the Italian Concrete Days 2020, Napoli, Italy, 10–12 June 2021. (In Italian). [Google Scholar]
- STIL—Caratteristiche Degli Acciai Da Cemento Armato. ReLUIS. Available online: https://www.reluis.it/stil/ (accessed on 1 August 2025).
- Wiśniewski, D.F.; Cruz, P.J.; Henriques, A.A.R.; Simões, R.A. Probabilistic models for mechanical properties of concrete, reinforcing steel and pre-stressing steel. Struct. Infrastruct. Eng. 2012, 8, 111–123. [Google Scholar] [CrossRef]
- Křivý, V.; Konečný, P. Real material properties of weathering steels used in bridge structures. Procedia Eng. 2013, 57, 624–633. [Google Scholar] [CrossRef]
- Caltrans. BDMs Bridge Design Memos. In 16.4 Material Properties for Existing Structures, Approved June 2025; Caltrans: Sacramento, CA, USA, 2025. Available online: https://dot.ca.gov/-/media/dotmedia/programs/engineering/documents/bridgedesignmemos/16/202506bdm1604materialpropertiesforexisitingstructures-a11y.pdf (accessed on 1 August 2025).
- Hewson, N.R. Prestressed Concrete Bridges: Design and Construction, 1st ed.; Thomas Telford: London, UK, 2003. [Google Scholar]
- Guidi, C.C. Cemento Armato Precompresso, 7th ed.; Ulrico Hoepli: Milano, Italy, 2013. (In Italian) [Google Scholar]
- Circular of Ministry of Public Works. Load Standards for the Calculation of Road Bridges; Ministry of Public Works: Rome, Italy, 1962. (In Italian) [Google Scholar]
- MIT—Ministry of Infrastructure. Ministerial Decree, no. 578 of 17.12.2020. In Guidelines for Risk Classification and Management, Safety Assessment and Monitoring of Existing Bridges; last update MD no. 204 of 1 July 2022; Ministry of Infrastructure: Rome, Italy, 2022. (In Italian) [Google Scholar]
- Ministerial Degree. Technical Standards to Which Concrete, Normal and Prestressed Concrete and Metal-Framed Constructions must Conform; G.U. no. 190, 1972; Council of Ministers: Rome, Italy, 1972. (In Italian) [Google Scholar]
- D’Agostino, R.B.; Stephens, M.A. Goodness-Of-Fit Techniques, 1st ed.; Marcel Dekker, Inc.: New York, NY, USA, 1986. [Google Scholar]
- Shapiro, S.S.; Wilk, M.B.; Chen, H.J. A comparative study of various tests for normality. J. Am. Stat. 1968, 63, 1343–1372. [Google Scholar] [CrossRef]
- Shapiro, S.S.; Wilk, M.B. An analysis of variance test for normality (complete samples). Biometrika 1965, 52, 591–611. [Google Scholar] [CrossRef]
- D’Agostino, R.; Pearson, E.S. Tests for departure from normality. Empirical results for the distributions of b2 and √b1. Biometrika 1973, 60, 613–622. [Google Scholar] [CrossRef]
- D’Agostino, R.B.; Balanger, A.; D’Agostino, R.B., Jr. A suggestion for using powerful and informative tests of normality. Am. Stat. 1990, 44, 316–321. [Google Scholar] [CrossRef]
- Erto, P. Probabilità E Statistica Per Le Scienze E L’ingegneria, 3rd ed.; McGraw-Hill Education: Milano, Italy, 2008. (In Italian) [Google Scholar]
- Piccolo, D. Statistica Per Le Decisioni. La Conoscenza Umana Sostenuta Dall’evidenza Empirica, 3rd ed.; Il Mulino: Bologna, Italy, 2020. (In Italian) [Google Scholar]


| Class A | Class B | Class C | ||
|---|---|---|---|---|
| Category I | Category II | Category I | Category II | Category I and Category II |
| Bridges designed before 1952 | Bridges designed before 1990 | Bridges designed between 1952 and 1990 for spans under 10 m | Bridges designed in 1990 for spans under 10 m | Bridge designed from 2005 to the present for spans under 10 m |
| Bridges designed between 1952 and 2005 for spans over 10 m | Bridges designed between 1990 and 2005 for spans over 10 m | Bridge designed from 2008 to the present for spans over 10 m | ||
| Statistical Indicator | Formulation |
|---|---|
| Mean μ | |
| Standard deviation σ | |
| Coefficient of variation (CV) | |
| Skewness (Fisher–Pearson) | |
| Kurtosis (Fisher–Pearson) |
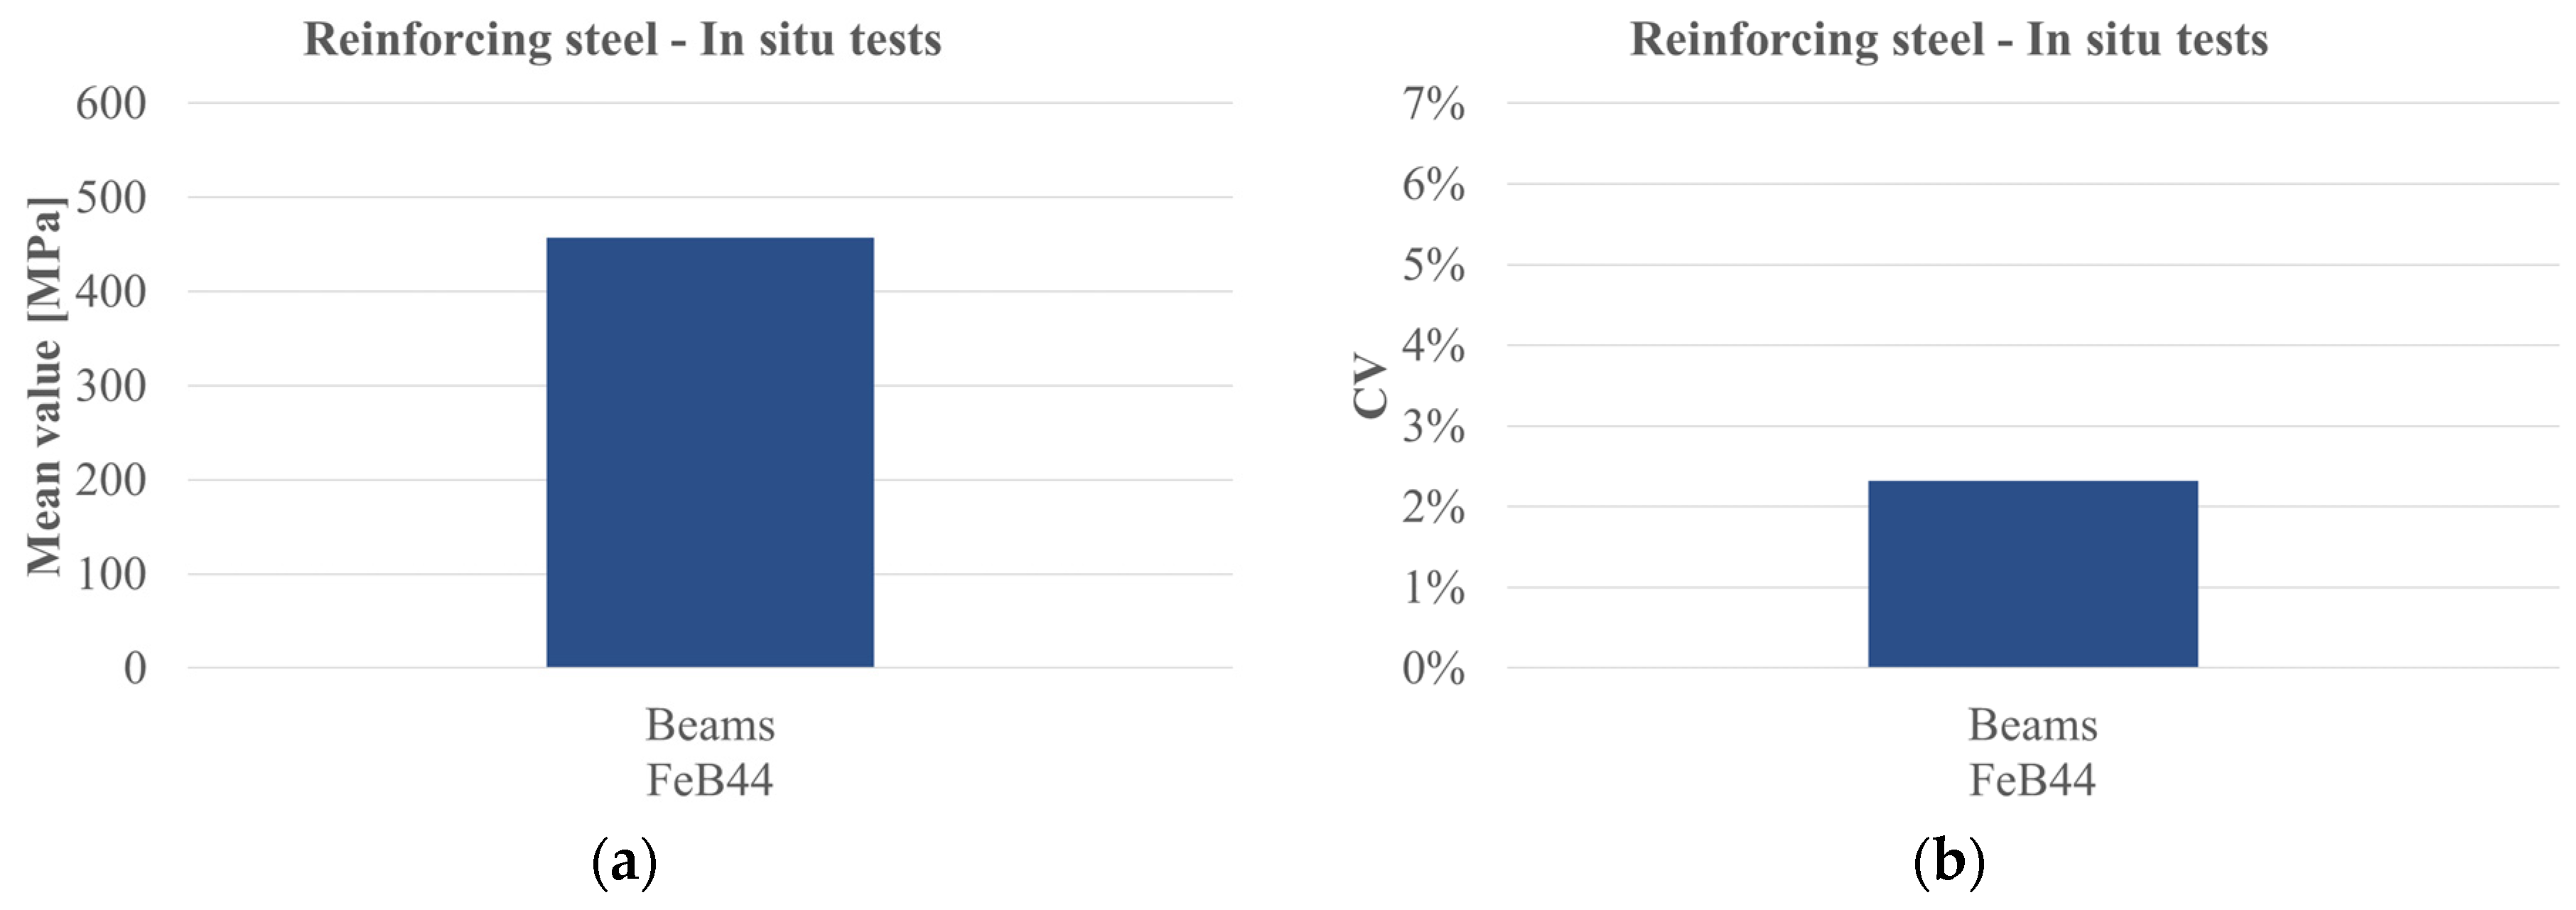
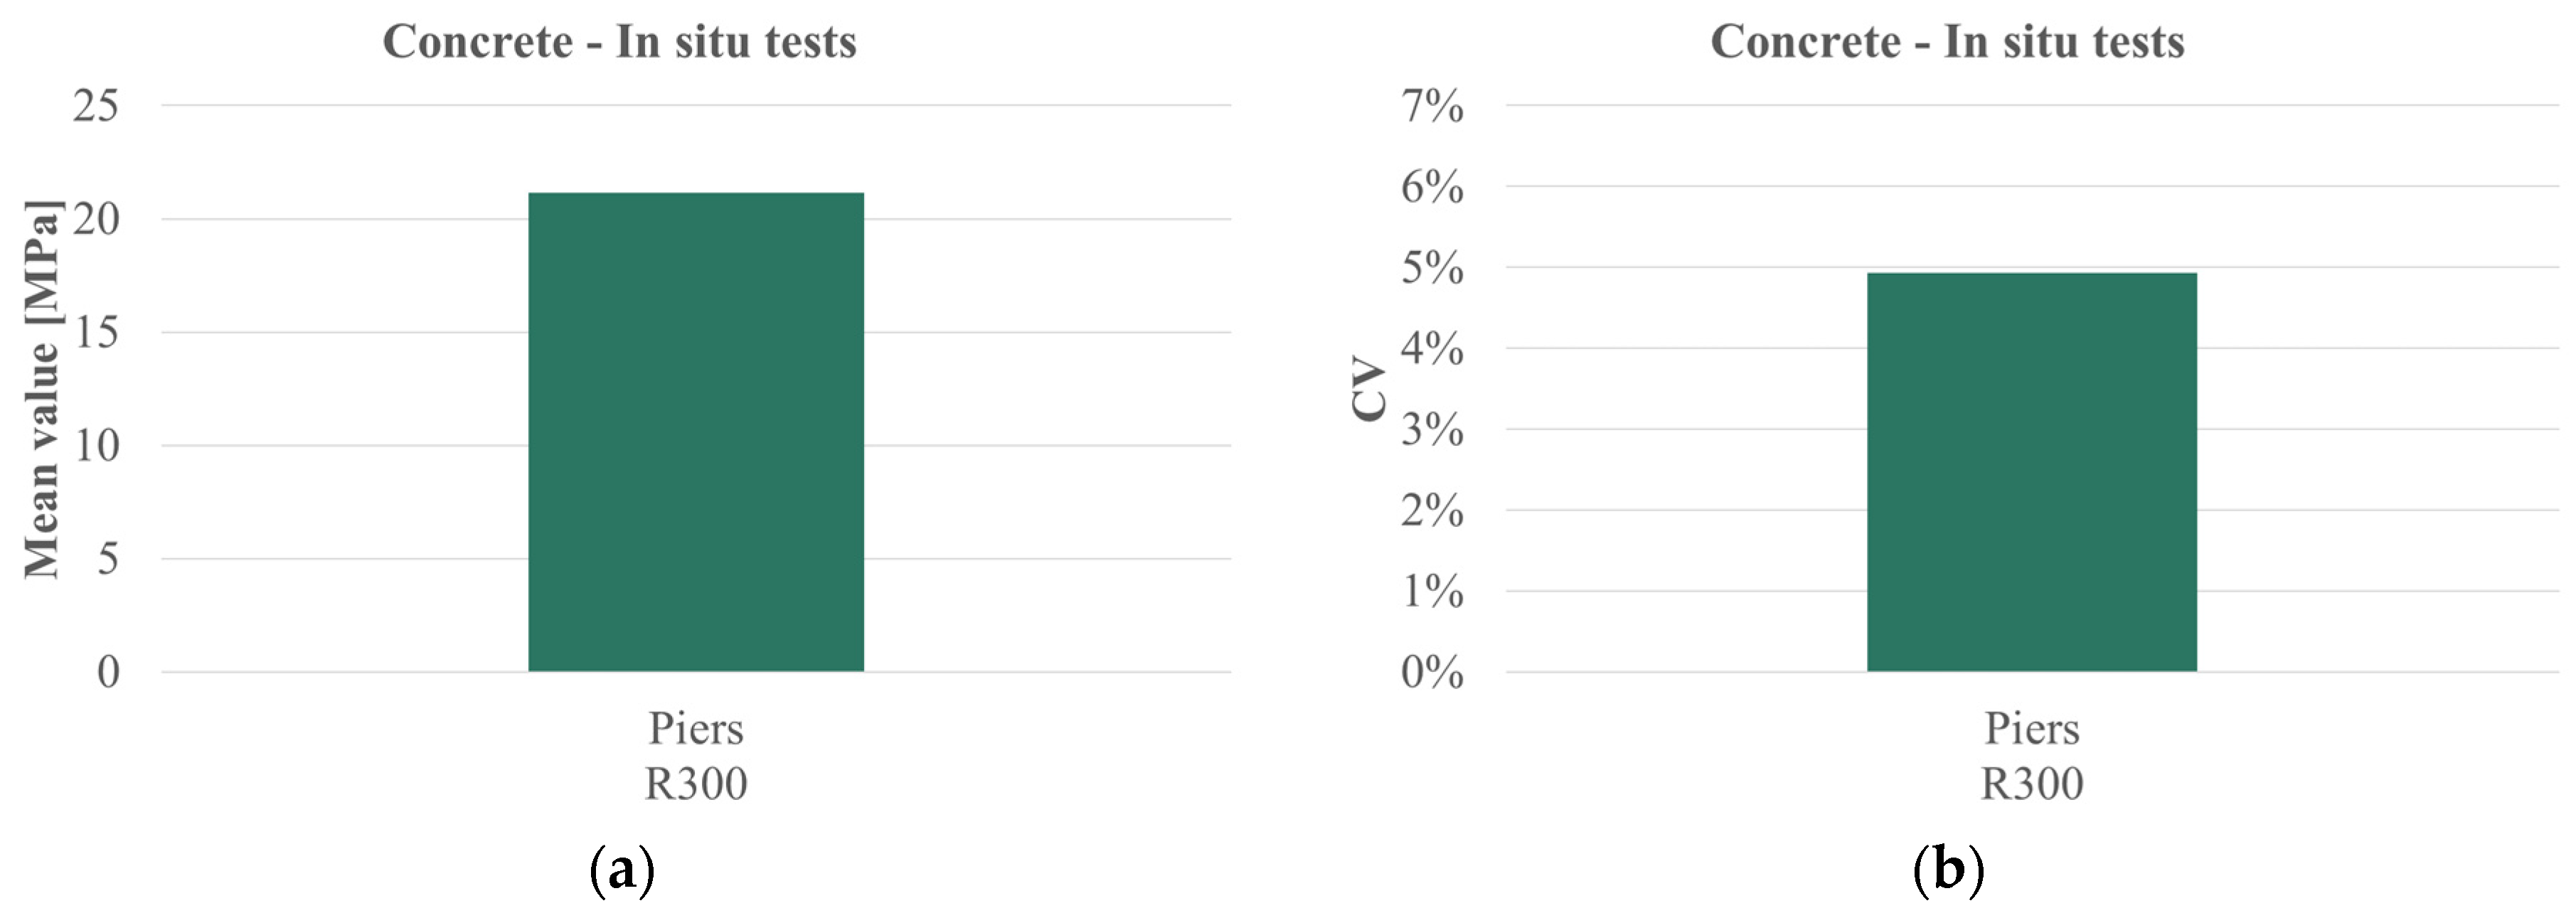
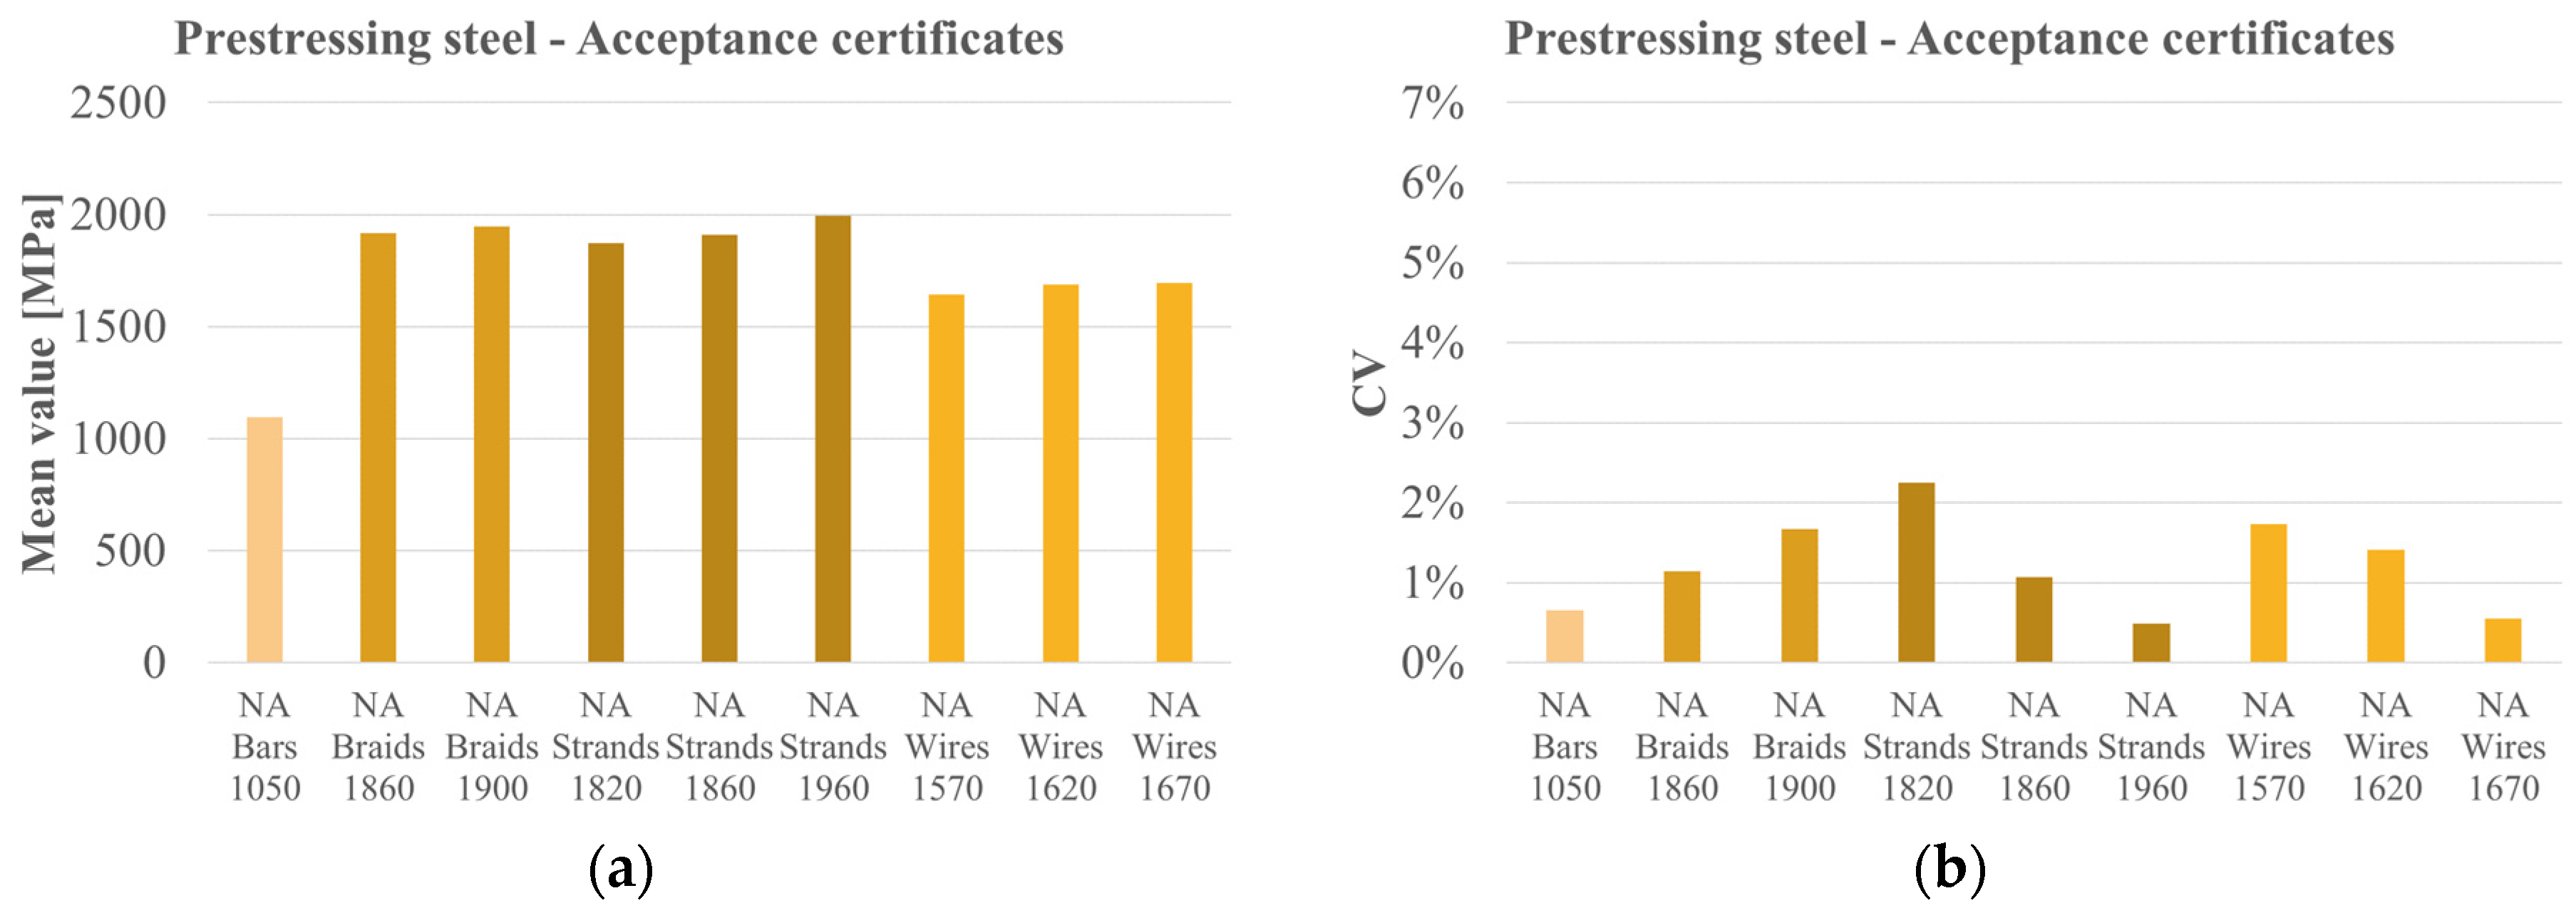
| Material | Data Source | Structural Element | Class | No. of Data | Mean [Mpa] | Median [Mpa] | CV [%] | Skewness | Kurtosis |
|---|---|---|---|---|---|---|---|---|---|
| Reinforcing steel | Acceptance certificates | Piers | FeB44 | 4 | 480.00 | 482.00 | 2.00 | −1.015 | 0.578 |
| Deck box girders | FeB44 | 9 | 521.11 | 512.00 | 6.55 | 0.646 | 0.146 | ||
| In situ tests | Beams | FeB44 | 5 | 451.26 | 457.50 | 2.32 | −0.561 | −3.255 | |
| Concrete | In situ tests | Piers | R300 | 3 | 21.75 | 21.17 | 4.94 | 1.725 | / |
| Prestressing steel | Acceptance certificates | NA | Bars 1050 | 107 | 1095.00 | 1095.86 | 0.65 | −0.356 | −0.598 |
| Braids 1860 | 155 | 1919.48 | 1916.72 | 1.14 | 0.044 | 0.101 | |||
| Braids 1900 | 53 | 1951.71 | 1947.36 | 1.67 | 0.665 | −0.024 | |||
| Strands 1820 | 10 | 1883.03 | 1871.11 | 2.25 | −0.094 | −1.455 | |||
| Strands 1860 | 550 | 1907.55 | 1909.26 | 1.07 | −0.181 | −0.111 | |||
| Strands 1960 | 6 | 1990.93 | 1994.28 | 0.48 | −0.250 | −1.128 | |||
| Wires 1570 | 143 | 1642.39 | 1643.39 | 1.74 | −0.002 | −0.379 | |||
| Wires 1620 | 68 | 1687.11 | 1687.97 | 1.41 | 0.099 | 1.038 | |||
| Wires 1670 | 6 | 1699.85 | 1694.76 | 0.55 | 0.954 | −1.744 |
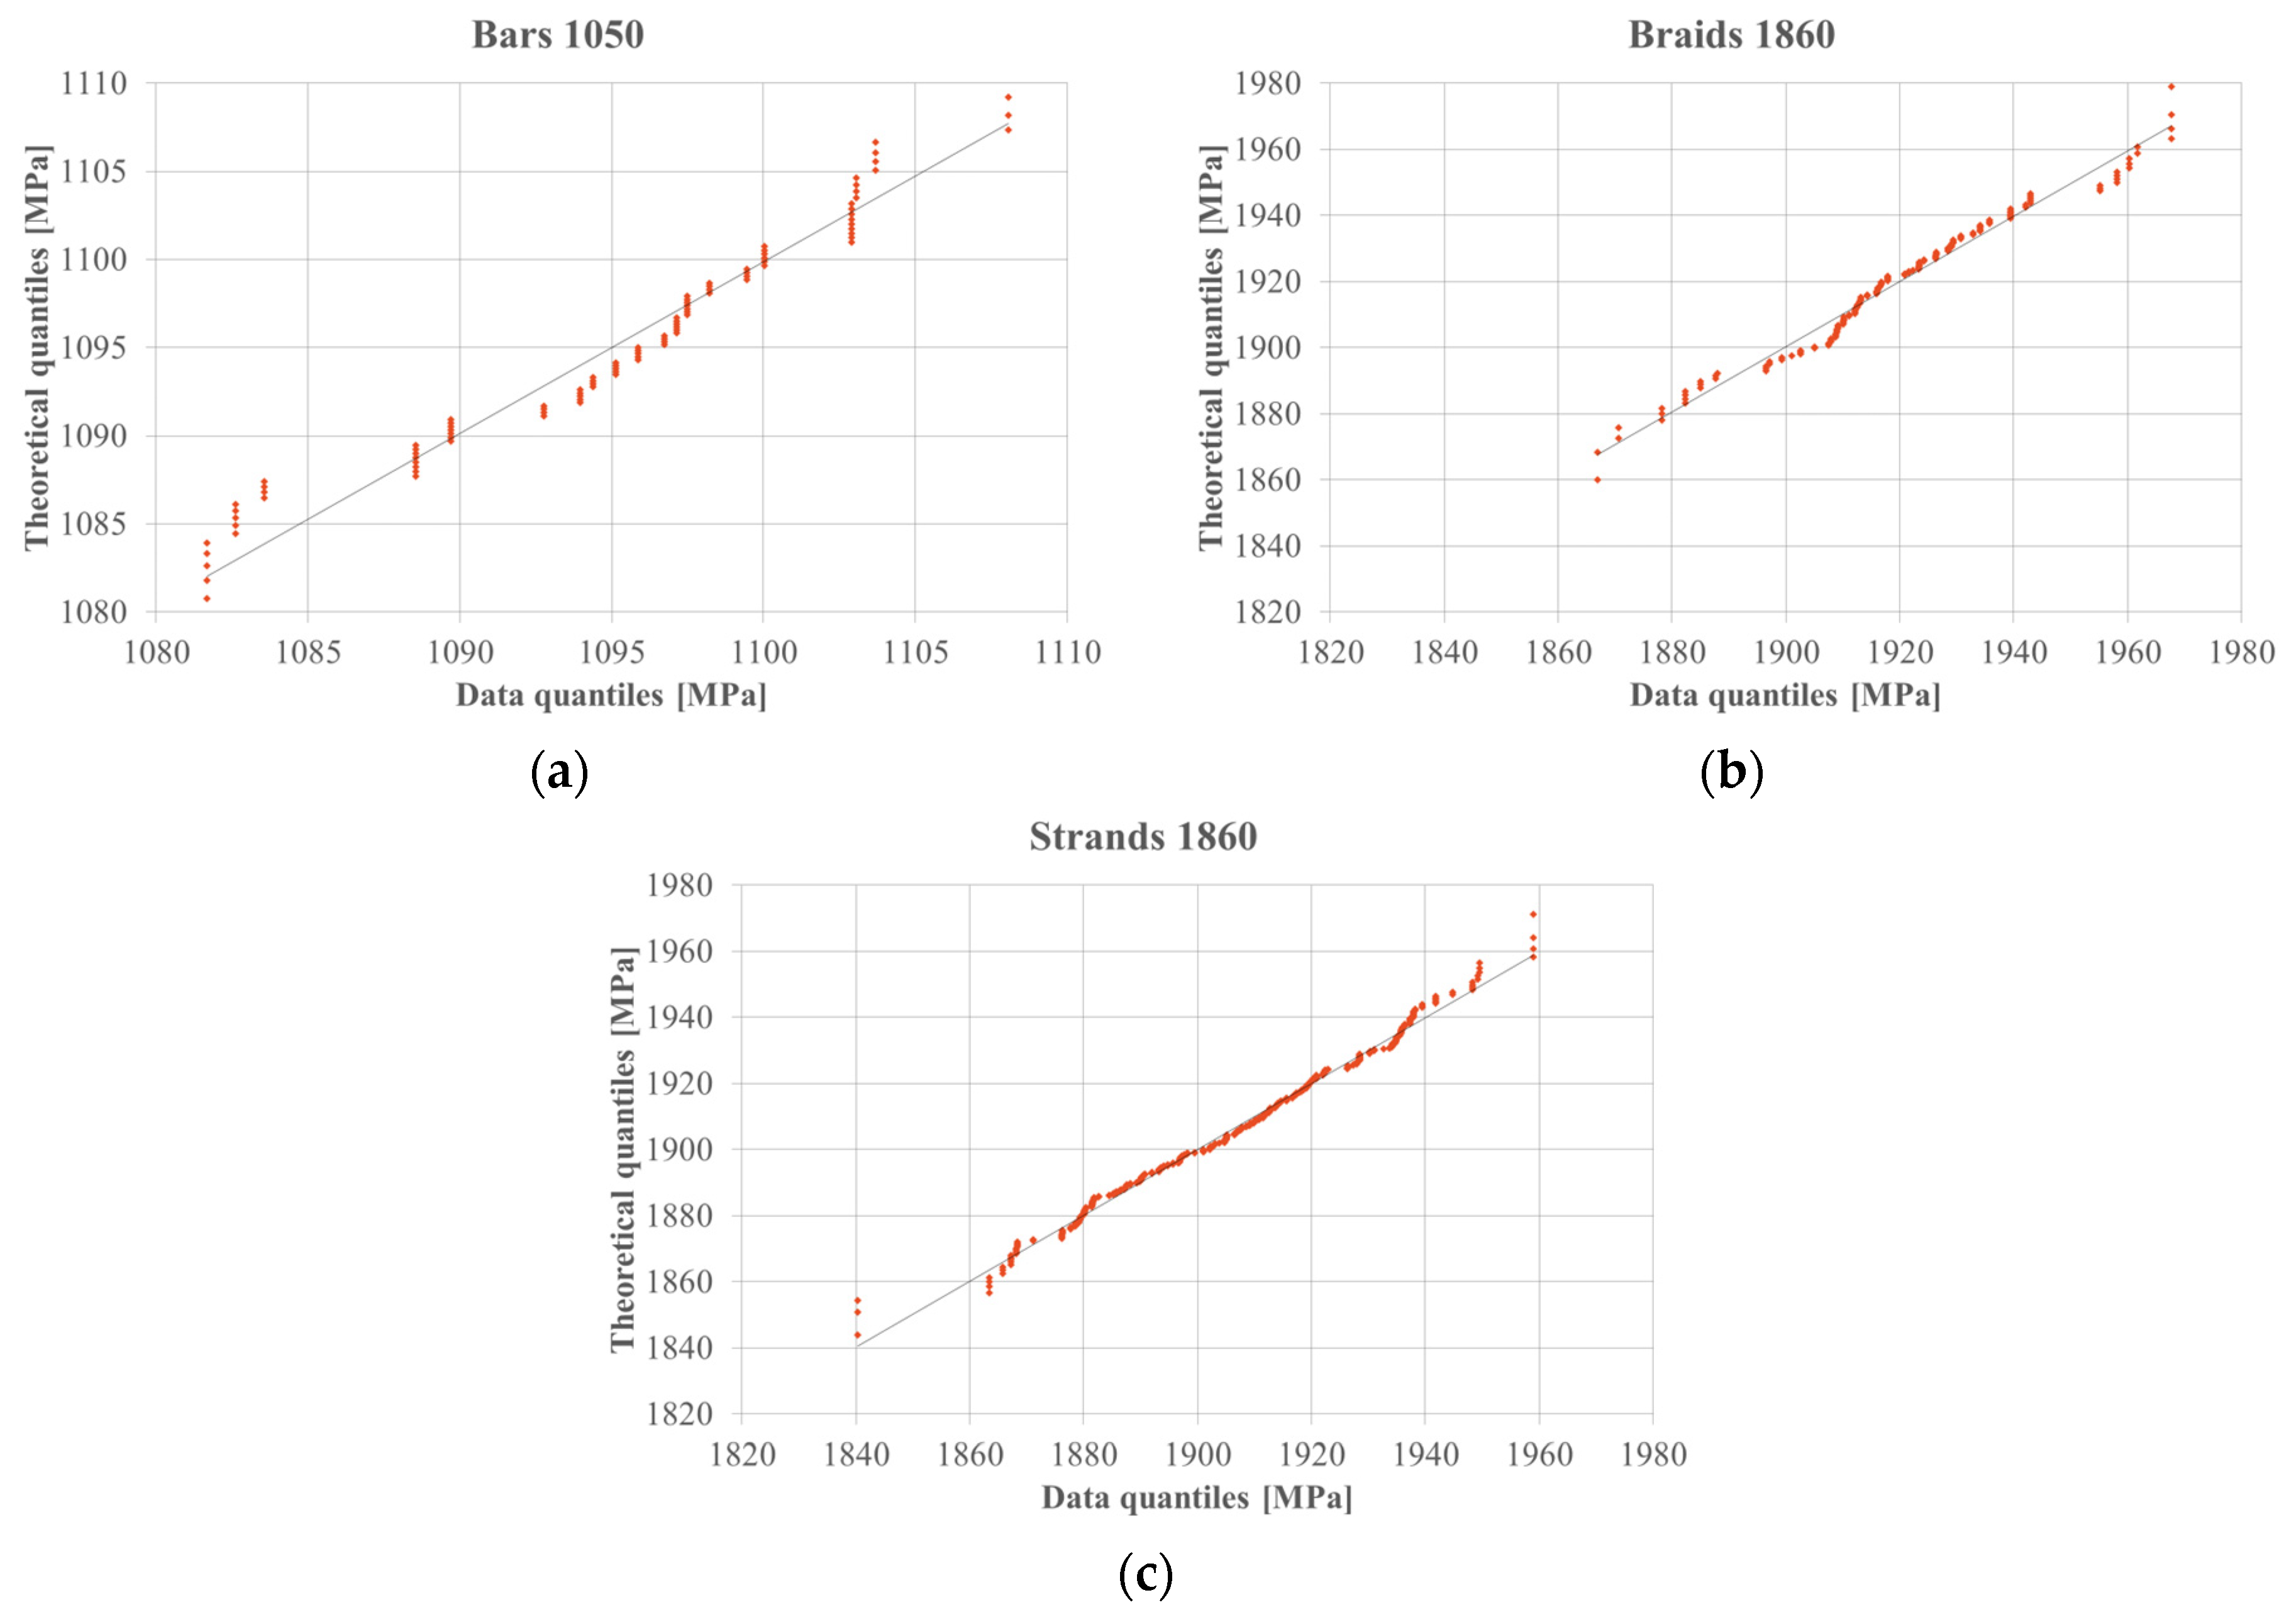
| Material | Data Source | Structural Element | Class | No. of Data | W | p-Value | Significance | Distribution |
|---|---|---|---|---|---|---|---|---|
| Reinforcing steel | Acceptance certificates | Piers | FeB44 | 4 | 0.942 | 0.6668 | NSS | Normal |
| Deck box girders | FeB44 | 9 | 0.959 | 0.7911 | NSS | Normal | ||
| In situ tests | Beams | FeB44 | 5 | 0.765 | 0.0406 | NSS | Normal | |
| Concrete | In situ tests | Piers | R300 | 3 | 0.777 | 0.0603 | NSS | Log-normal |
| Prestressing steel | Acceptance certificates | NA | Bars 1050 | 107 | 0.946 | 0.0003 | SS | Not normal |
| Braids 1860 | 155 | 0.976 | 0.0091 | SS | Not normal | |||
| Braids 1900 | 53 | 0.940 | 0.0102 | NSS | Normal | |||
| Strands 1820 | 10 | 0.856 | 0.0687 | NSS | Normal | |||
| Strands 1860 | 550 | 0.992 | 0.0031 | SS | Not normal | |||
| Strands 1960 | 6 | 0.849 | 0.1553 | NSS | Normal | |||
| Wires 1570 | 143 | 0.989 | 0.2943 | NSS | Normal | |||
| Wires 1620 | 68 | 0.973 | 0.1422 | NSS | Normal | |||
| Wires 1670 | 6 | 0.734 | 0.0139 | NSS | Normal |
| Material | Data Source | Structural Element | Class | No. of Data | K2 | p-Value | Significance | Distribution |
|---|---|---|---|---|---|---|---|---|
| Prestressing steel | Acceptance certificates | NA | Bars 1050 | 107 | 5.088 | 0.0785 | NSS | Normal |
| Braids 1860 | 155 | 0.231 | 0.8909 | NSS | Normal | |||
| Strands 1860 | 550 | 3.246 | 0.1973 | NSS | Normal |
Disclaimer/Publisher’s Note: The statements, opinions and data contained in all publications are solely those of the individual author(s) and contributor(s) and not of MDPI and/or the editor(s). MDPI and/or the editor(s) disclaim responsibility for any injury to people or property resulting from any ideas, methods, instructions or products referred to in the content. |
© 2025 by the authors. Licensee MDPI, Basel, Switzerland. This article is an open access article distributed under the terms and conditions of the Creative Commons Attribution (CC BY) license (https://creativecommons.org/licenses/by/4.0/).
Share and Cite
D’Amato, M.; Ranaldo, A.; Rosciano, M.; Zona, A.; Morici, M.; Gioiella, L.; Micozzi, F.; Poeta, A.; Quaglini, V.; Cattaneo, S.; et al. The Development and Statistical Analysis of a Material Strength Database of Existing Italian Prestressed Concrete Bridges. Infrastructures 2025, 10, 203. https://doi.org/10.3390/infrastructures10080203
D’Amato M, Ranaldo A, Rosciano M, Zona A, Morici M, Gioiella L, Micozzi F, Poeta A, Quaglini V, Cattaneo S, et al. The Development and Statistical Analysis of a Material Strength Database of Existing Italian Prestressed Concrete Bridges. Infrastructures. 2025; 10(8):203. https://doi.org/10.3390/infrastructures10080203
Chicago/Turabian StyleD’Amato, Michele, Antonella Ranaldo, Monica Rosciano, Alessandro Zona, Michele Morici, Laura Gioiella, Fabio Micozzi, Alberto Poeta, Virginio Quaglini, Sara Cattaneo, and et al. 2025. "The Development and Statistical Analysis of a Material Strength Database of Existing Italian Prestressed Concrete Bridges" Infrastructures 10, no. 8: 203. https://doi.org/10.3390/infrastructures10080203
APA StyleD’Amato, M., Ranaldo, A., Rosciano, M., Zona, A., Morici, M., Gioiella, L., Micozzi, F., Poeta, A., Quaglini, V., Cattaneo, S., Rossi, D., Pettorruso, C., Salvatore, W., Natali, A., Celati, S., Ubertini, F., Venanzi, I., Giglioni, V., Ierimonti, L., ... Dall’Asta, A. (2025). The Development and Statistical Analysis of a Material Strength Database of Existing Italian Prestressed Concrete Bridges. Infrastructures, 10(8), 203. https://doi.org/10.3390/infrastructures10080203