
Experimental Lateral Behavior of Porcelain-Clad Cold-Formed Steel Shear Walls Under Cyclic-Gravity Loading


Abstract
1. Introduction
2. Experimental Description
2.1. Program of Experimental
- S/D = Single or double middle studs
- H/V = Horizontal or vertical porcelain sheathing orientation
- Number = Number of blocking rows
- S-H-3 vs. D-H-3 → Effect of mid-stud quantity
- D-H-3 vs. D-V-3 → Effect of sheathing orientation
- D-V-3 vs. D-V-1 → Effect of number of blocking rows
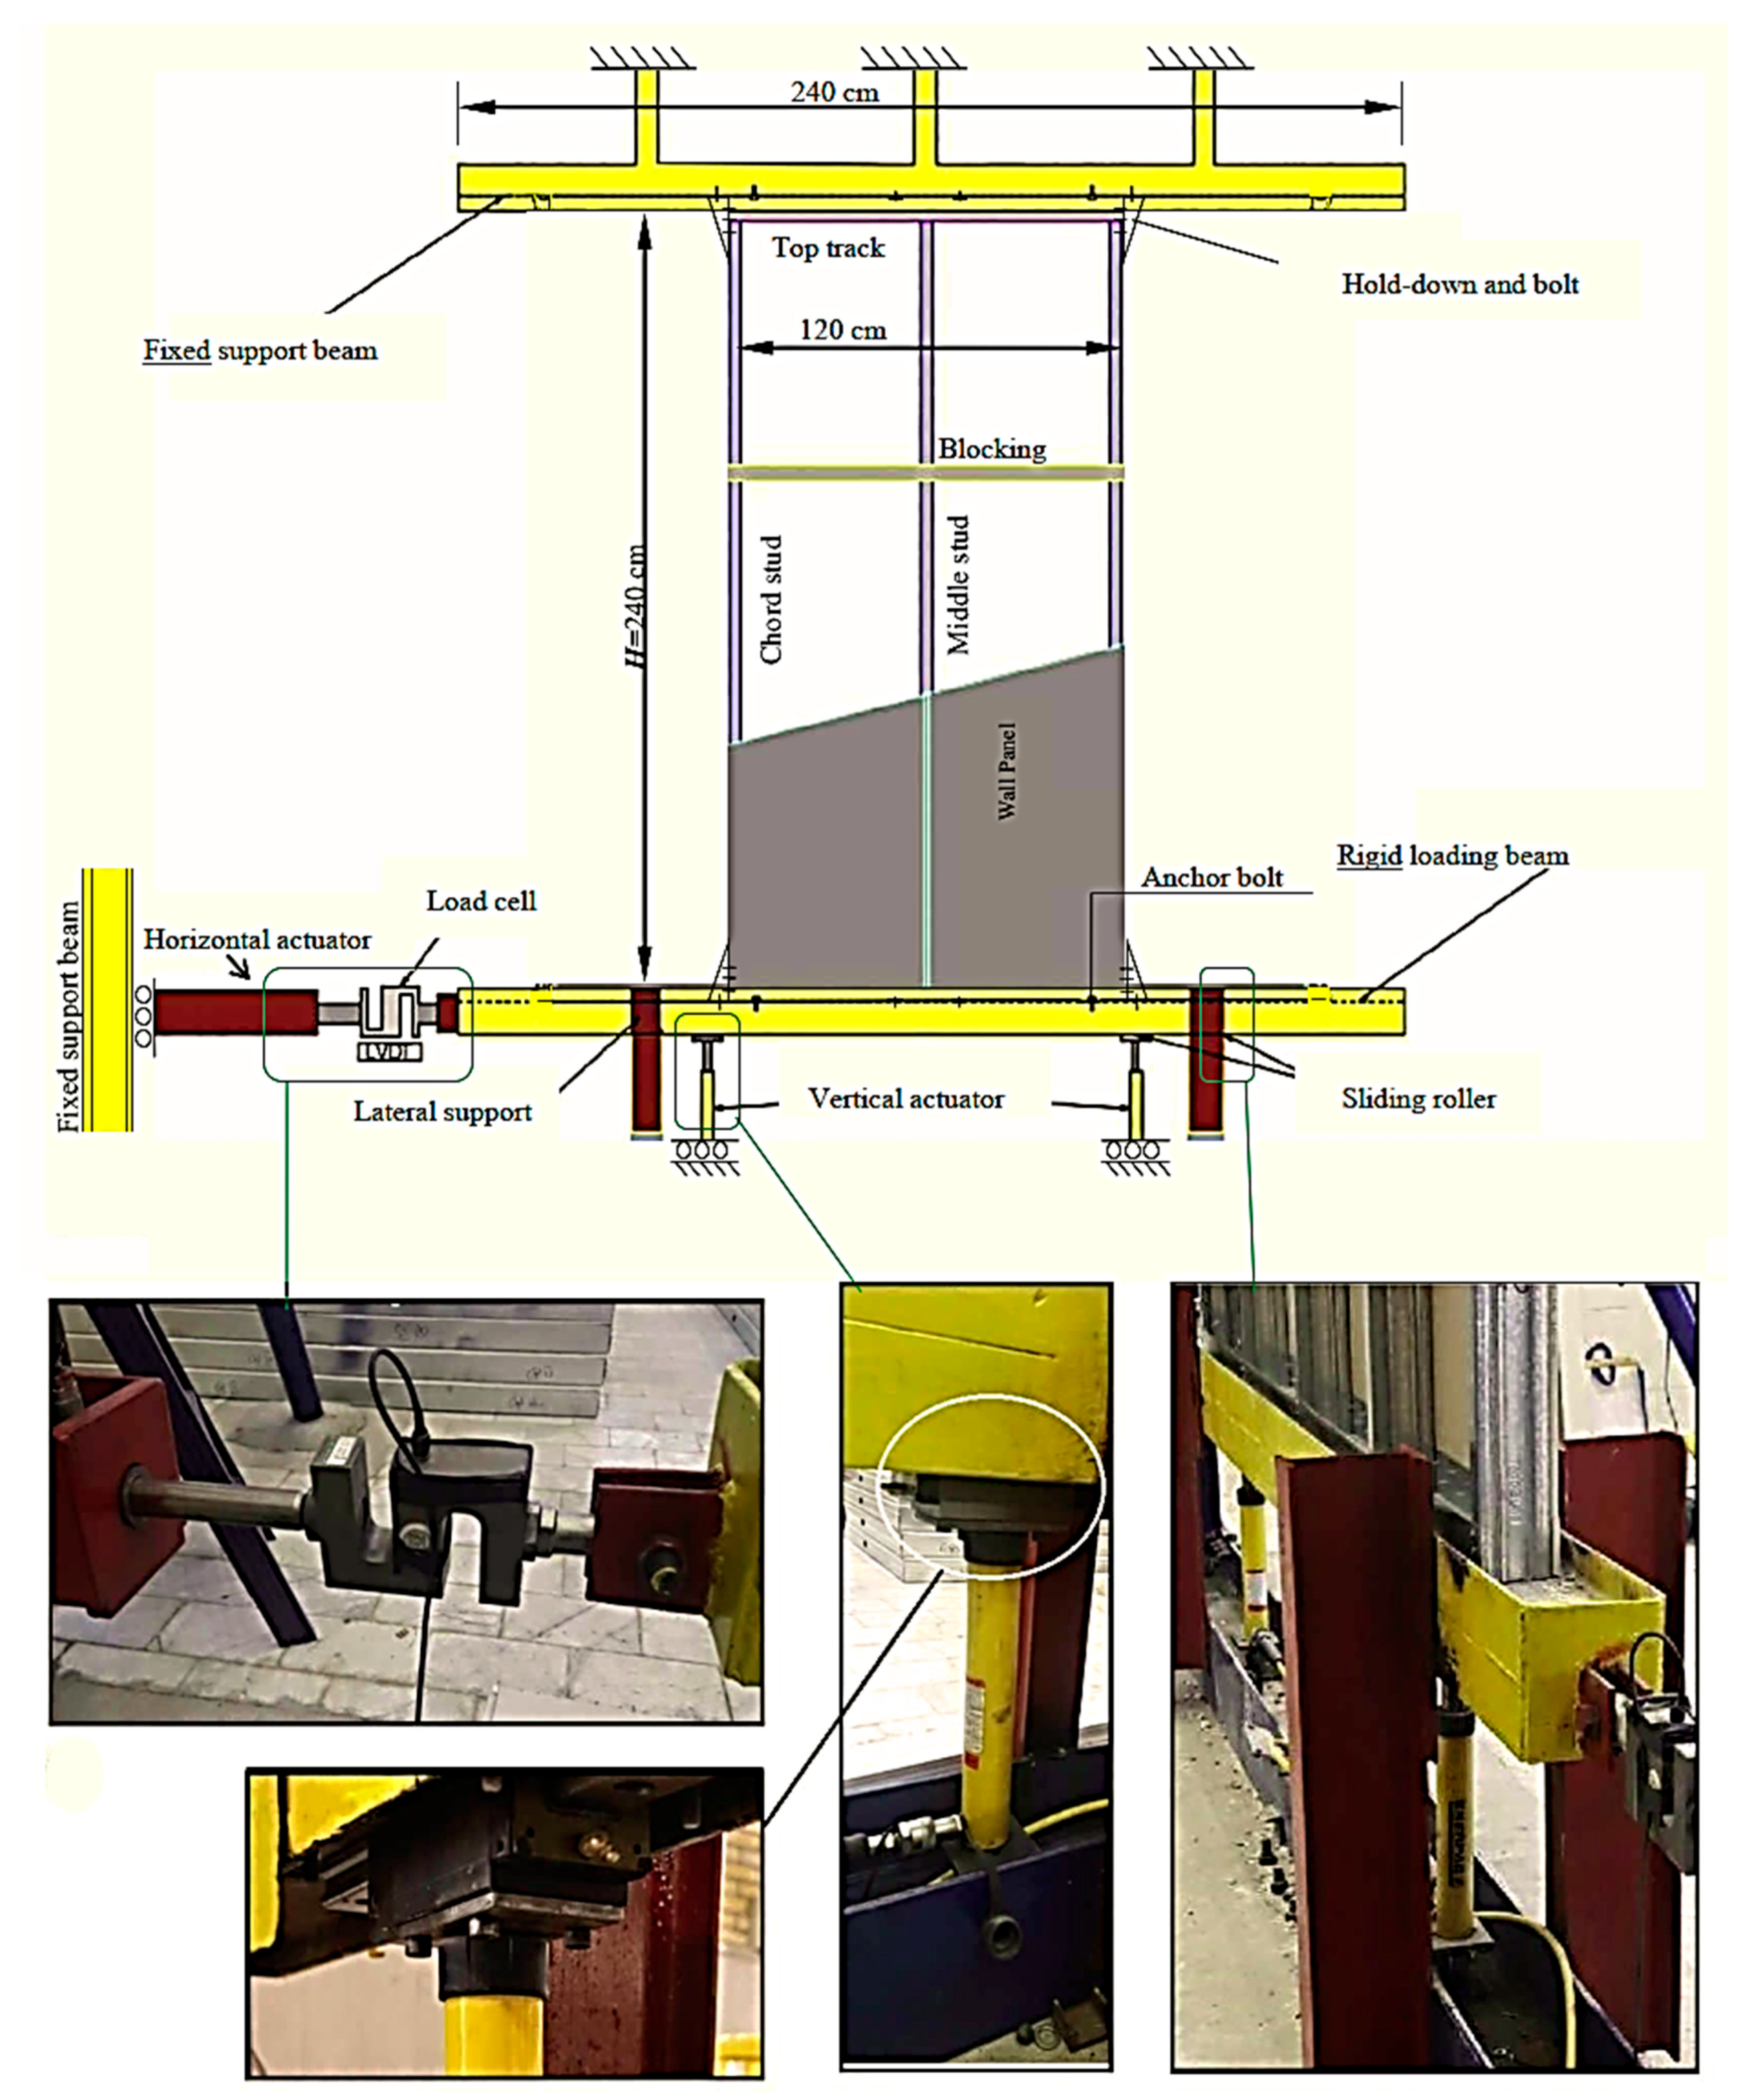
2.2. Test Setup and Instrumentation
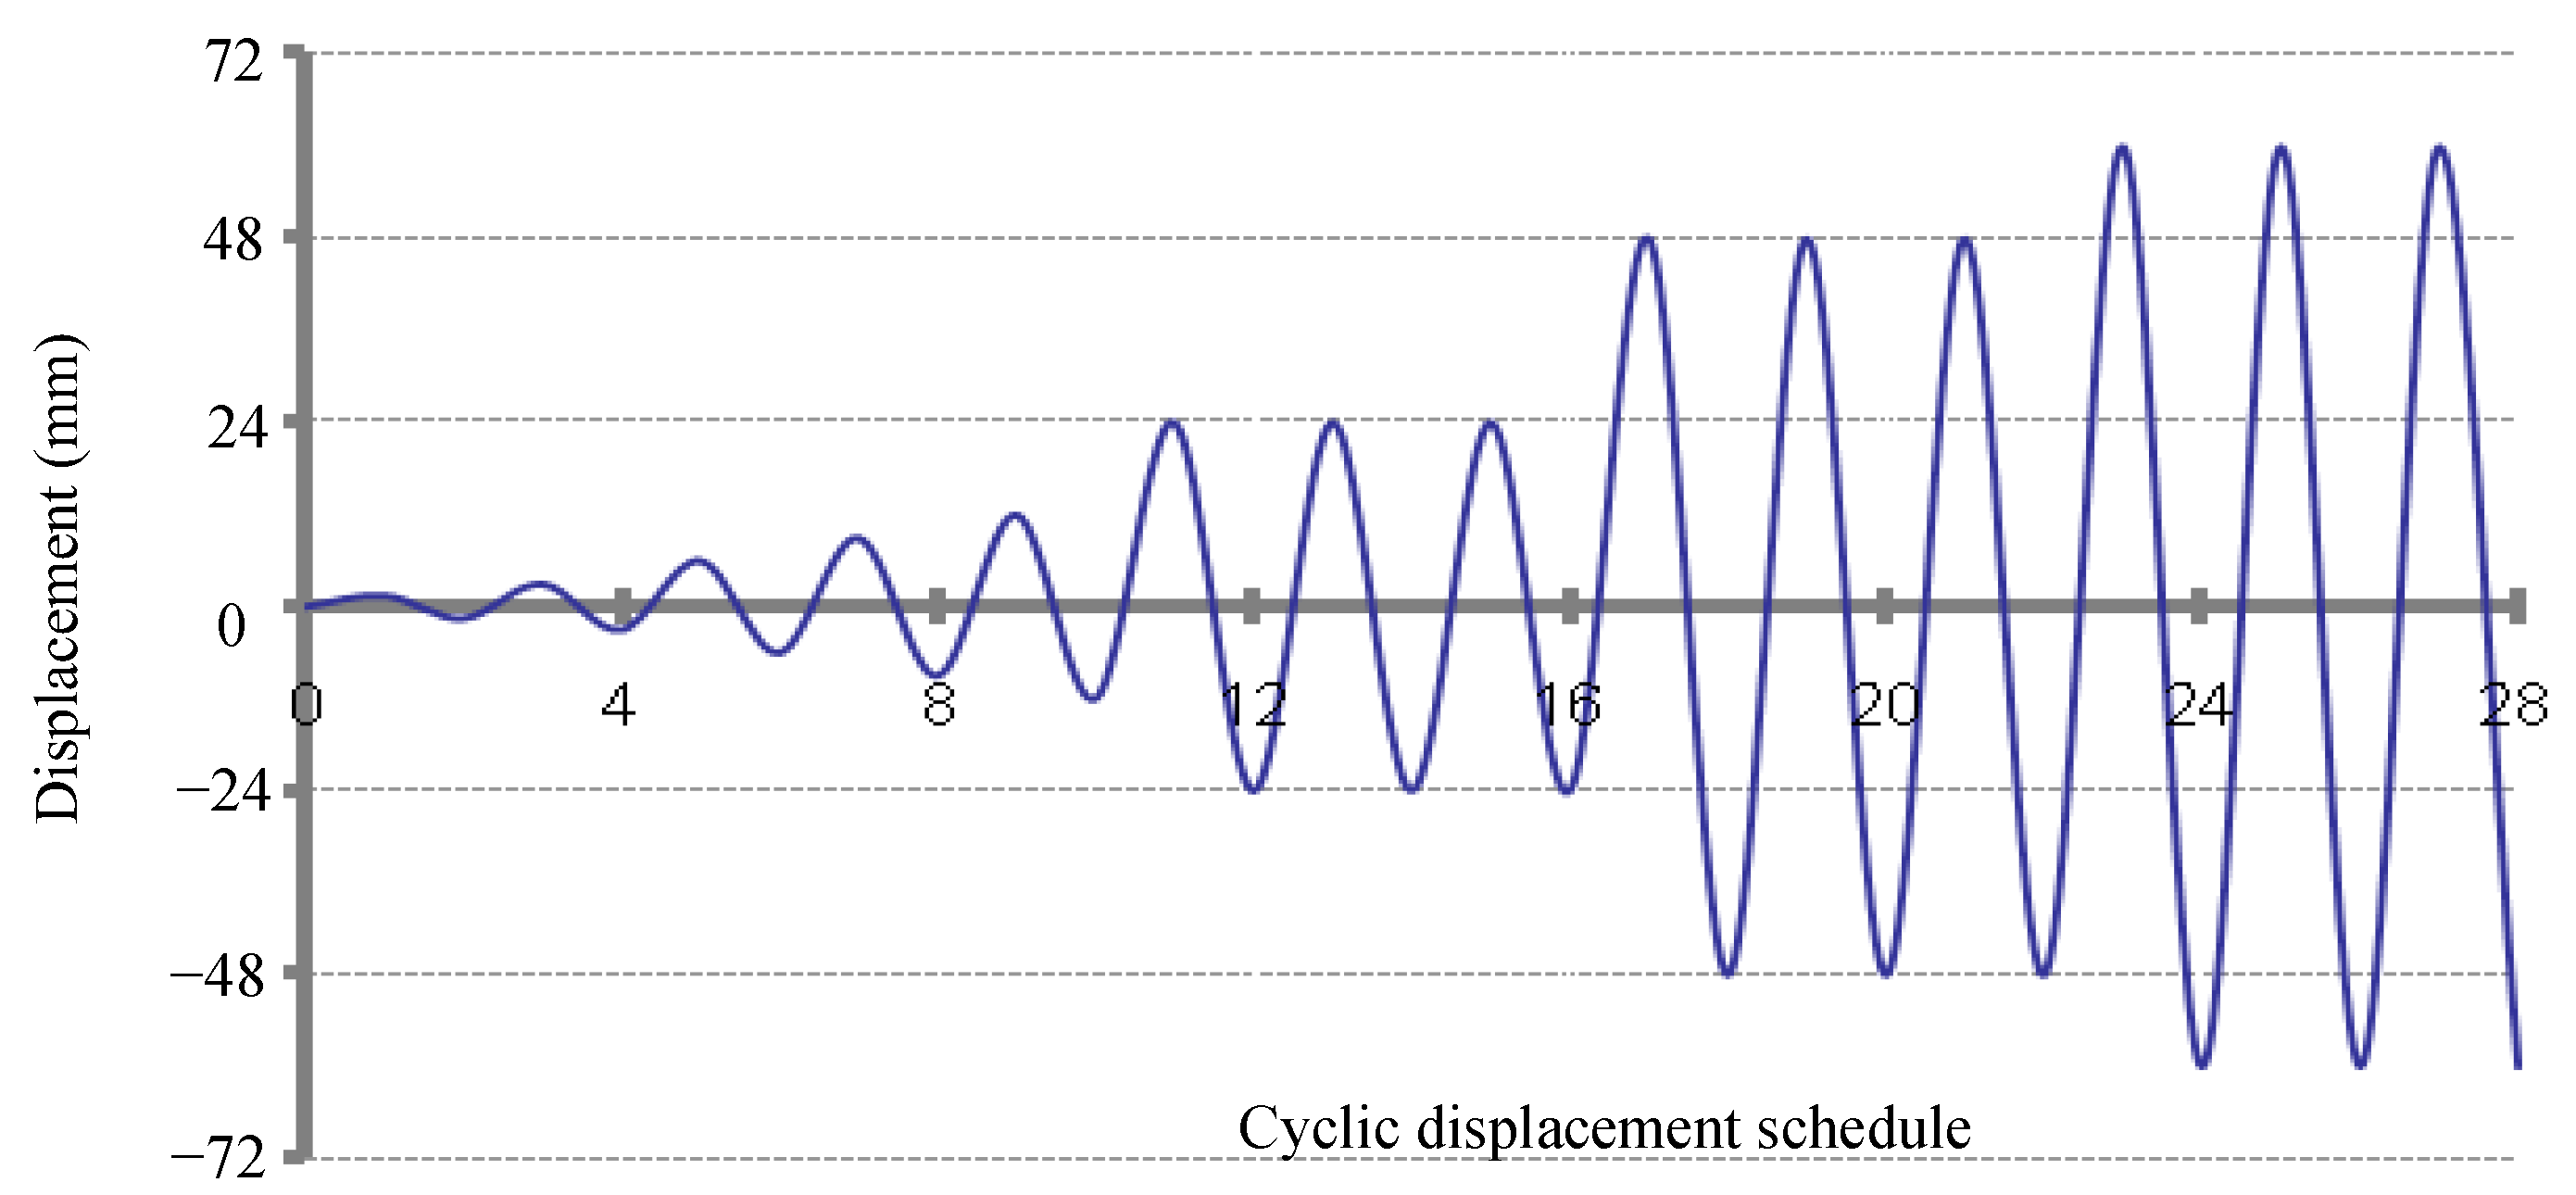
2.3. Lateral and Gravitational Loading Protocol
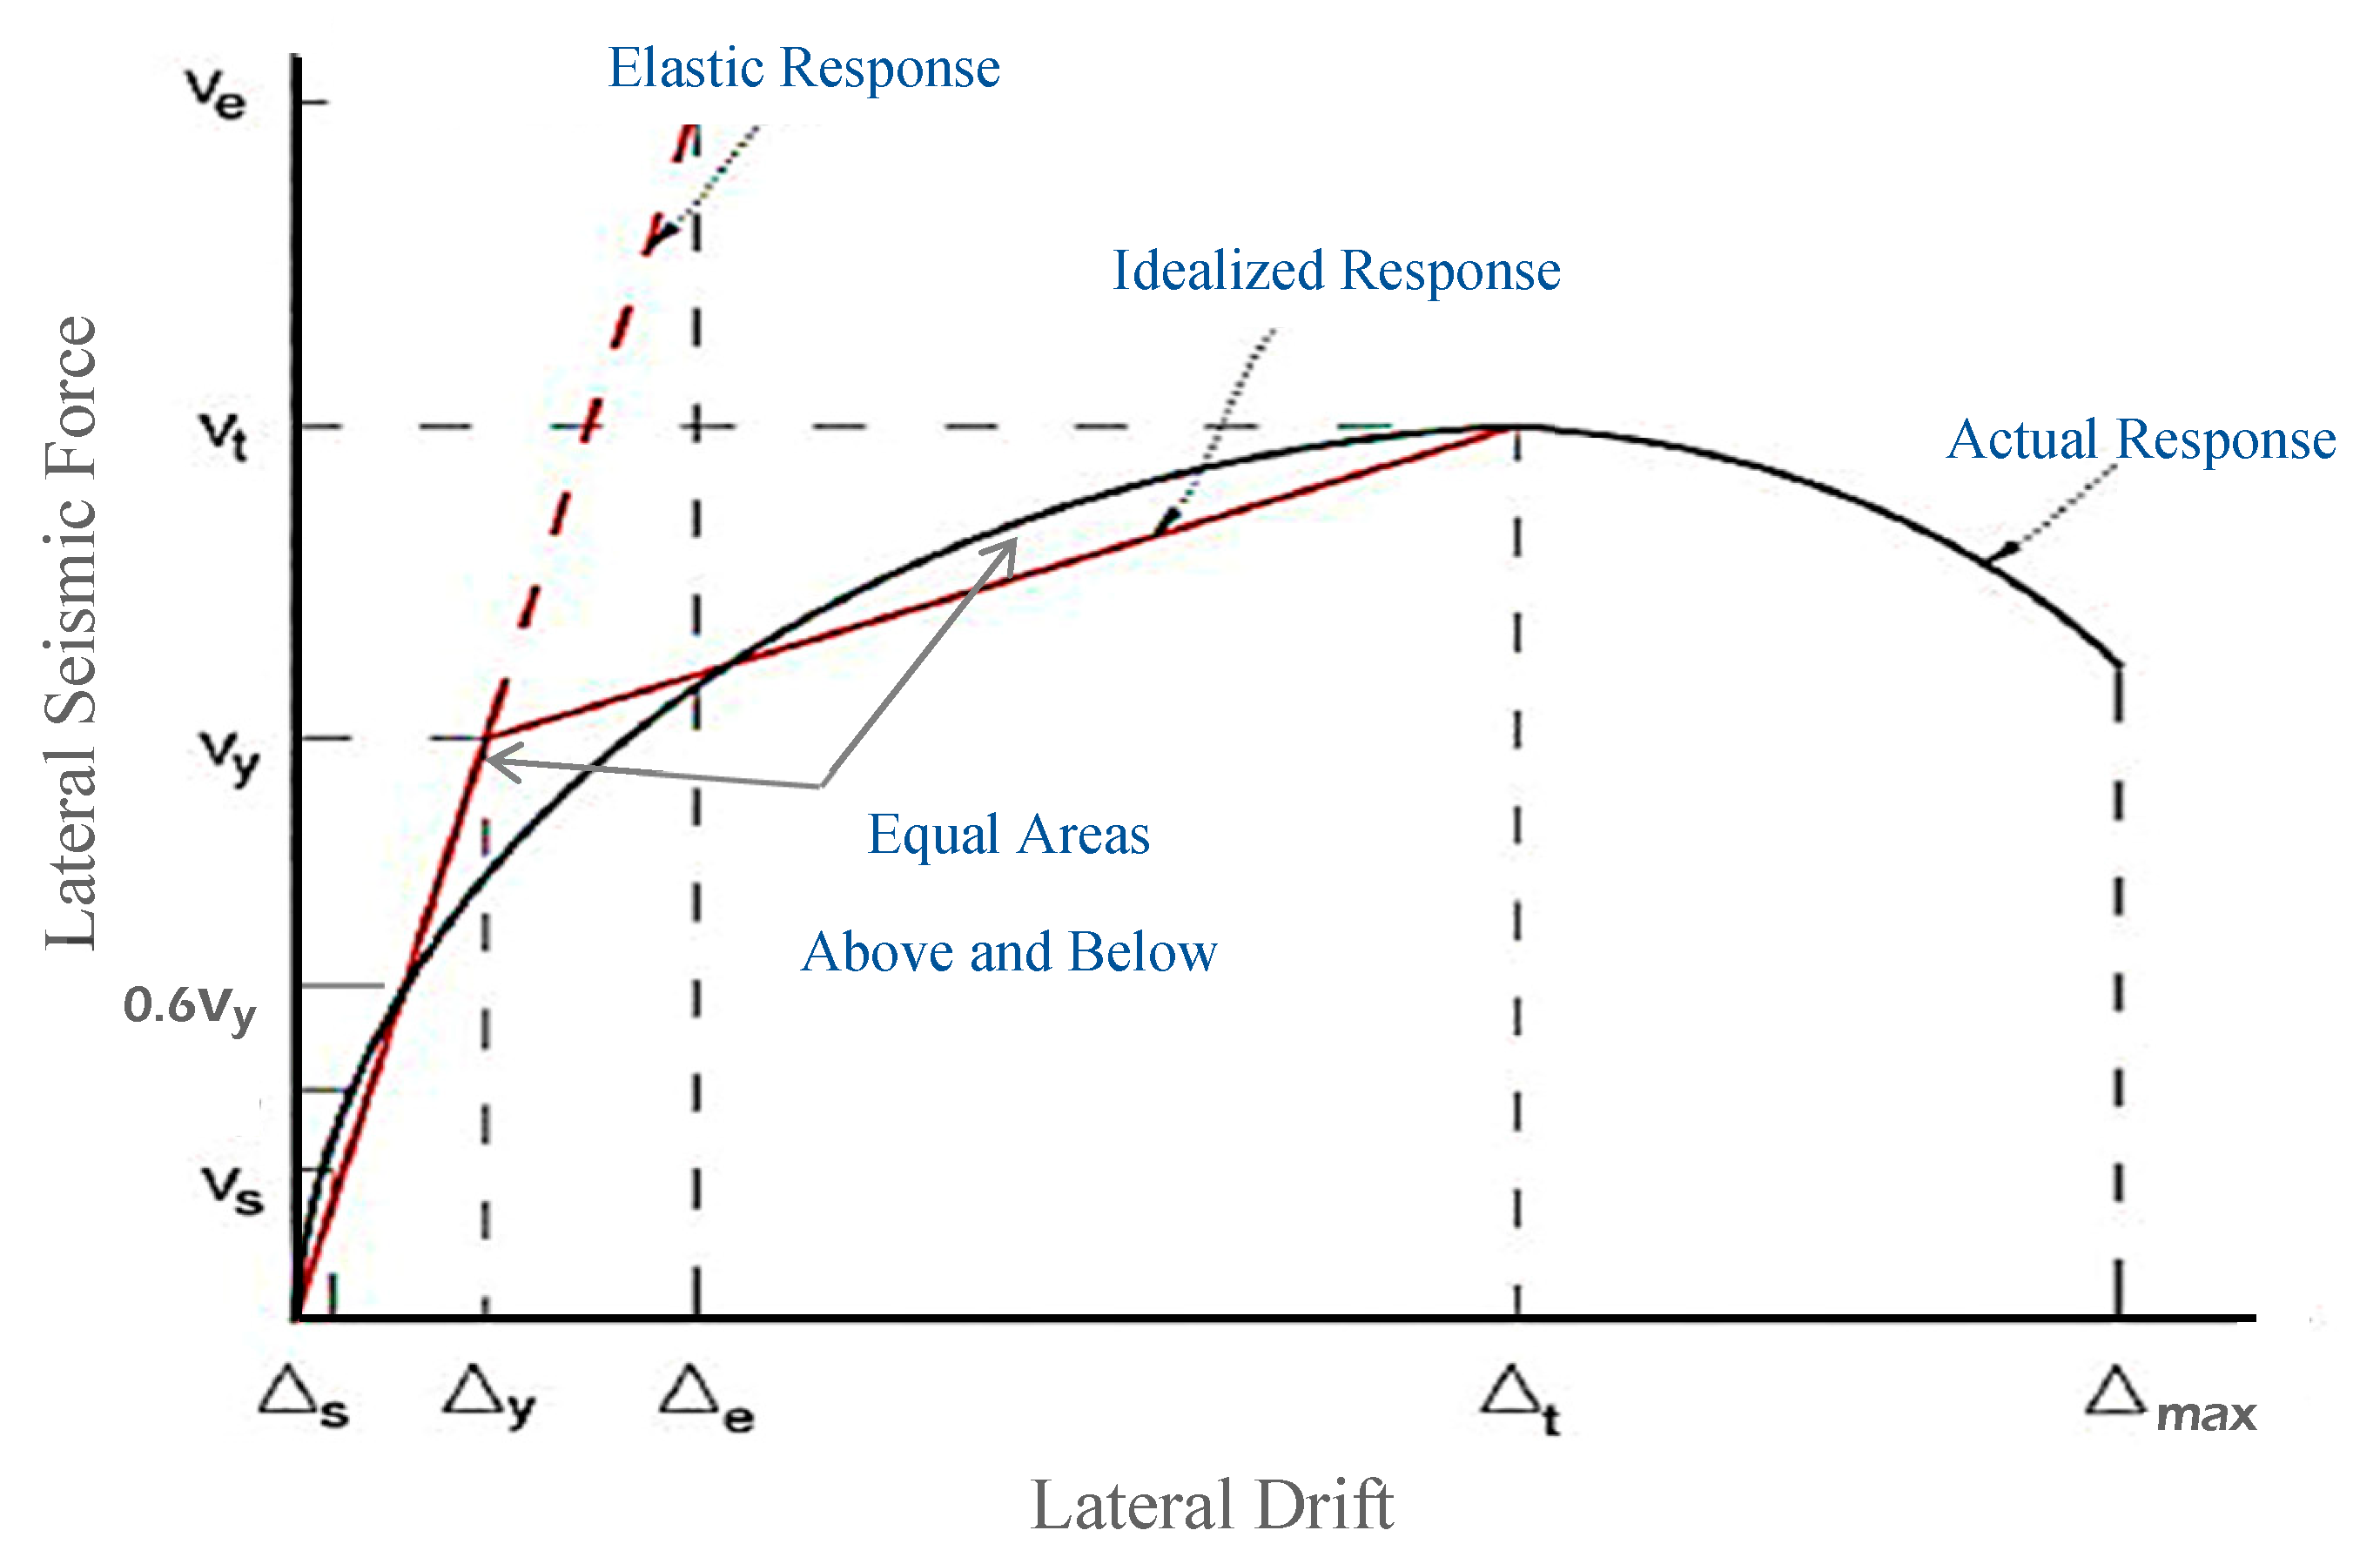
3. Evaluation of Seismic Response Modification Factor
4. Test Results and Discussion
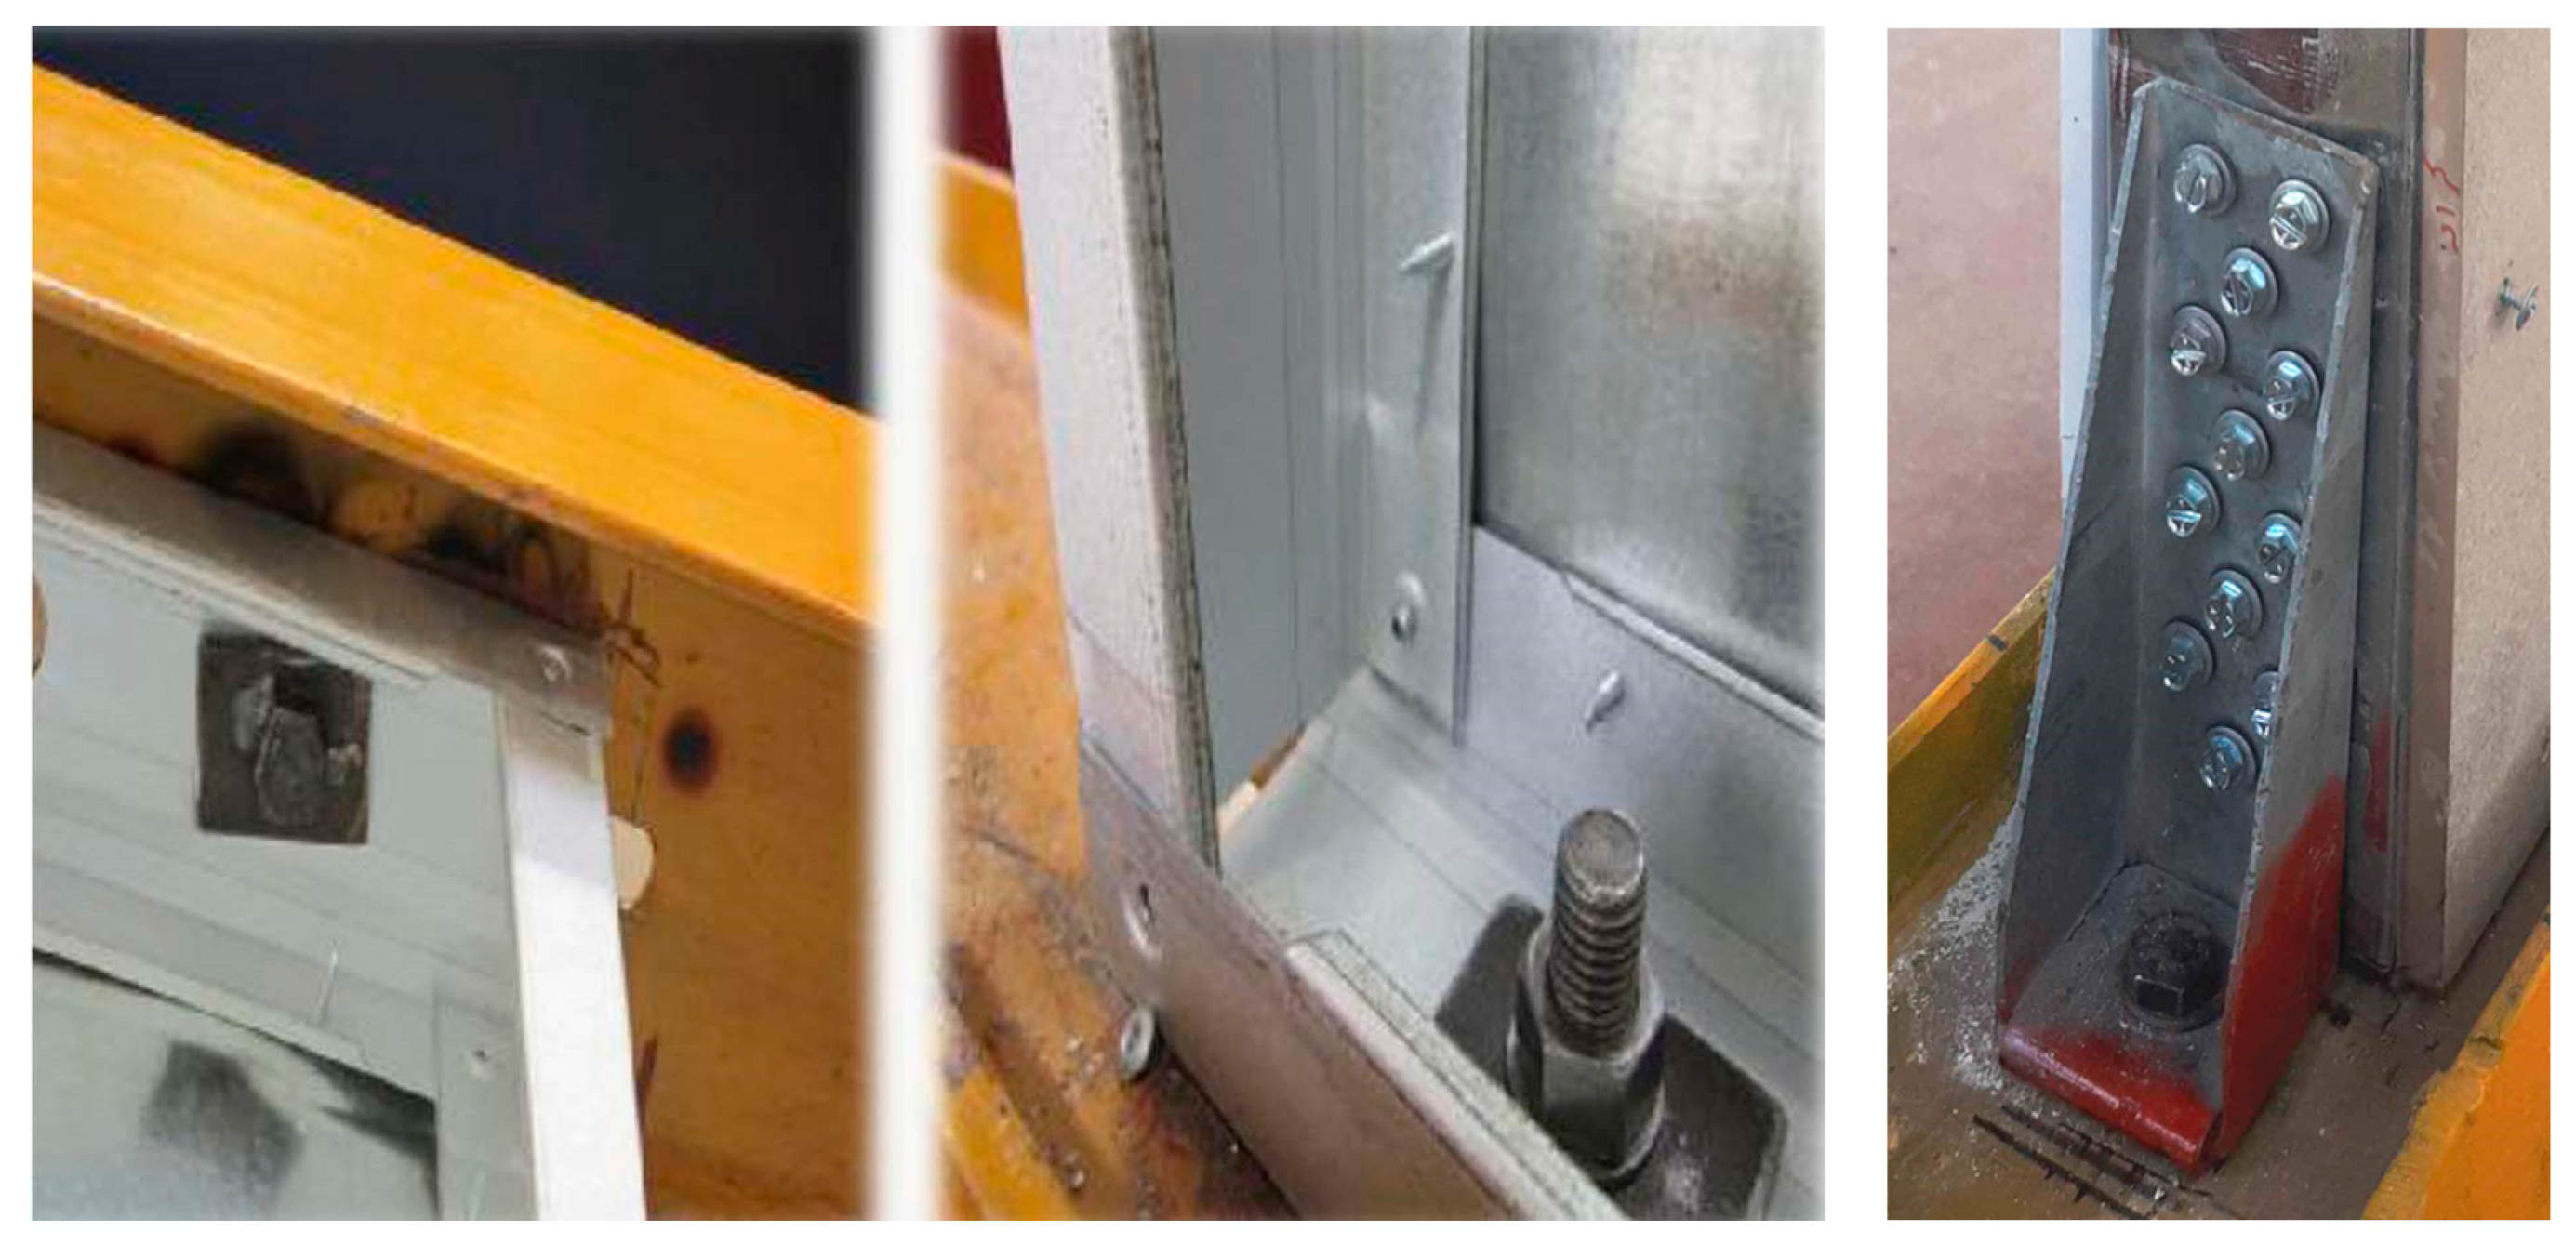
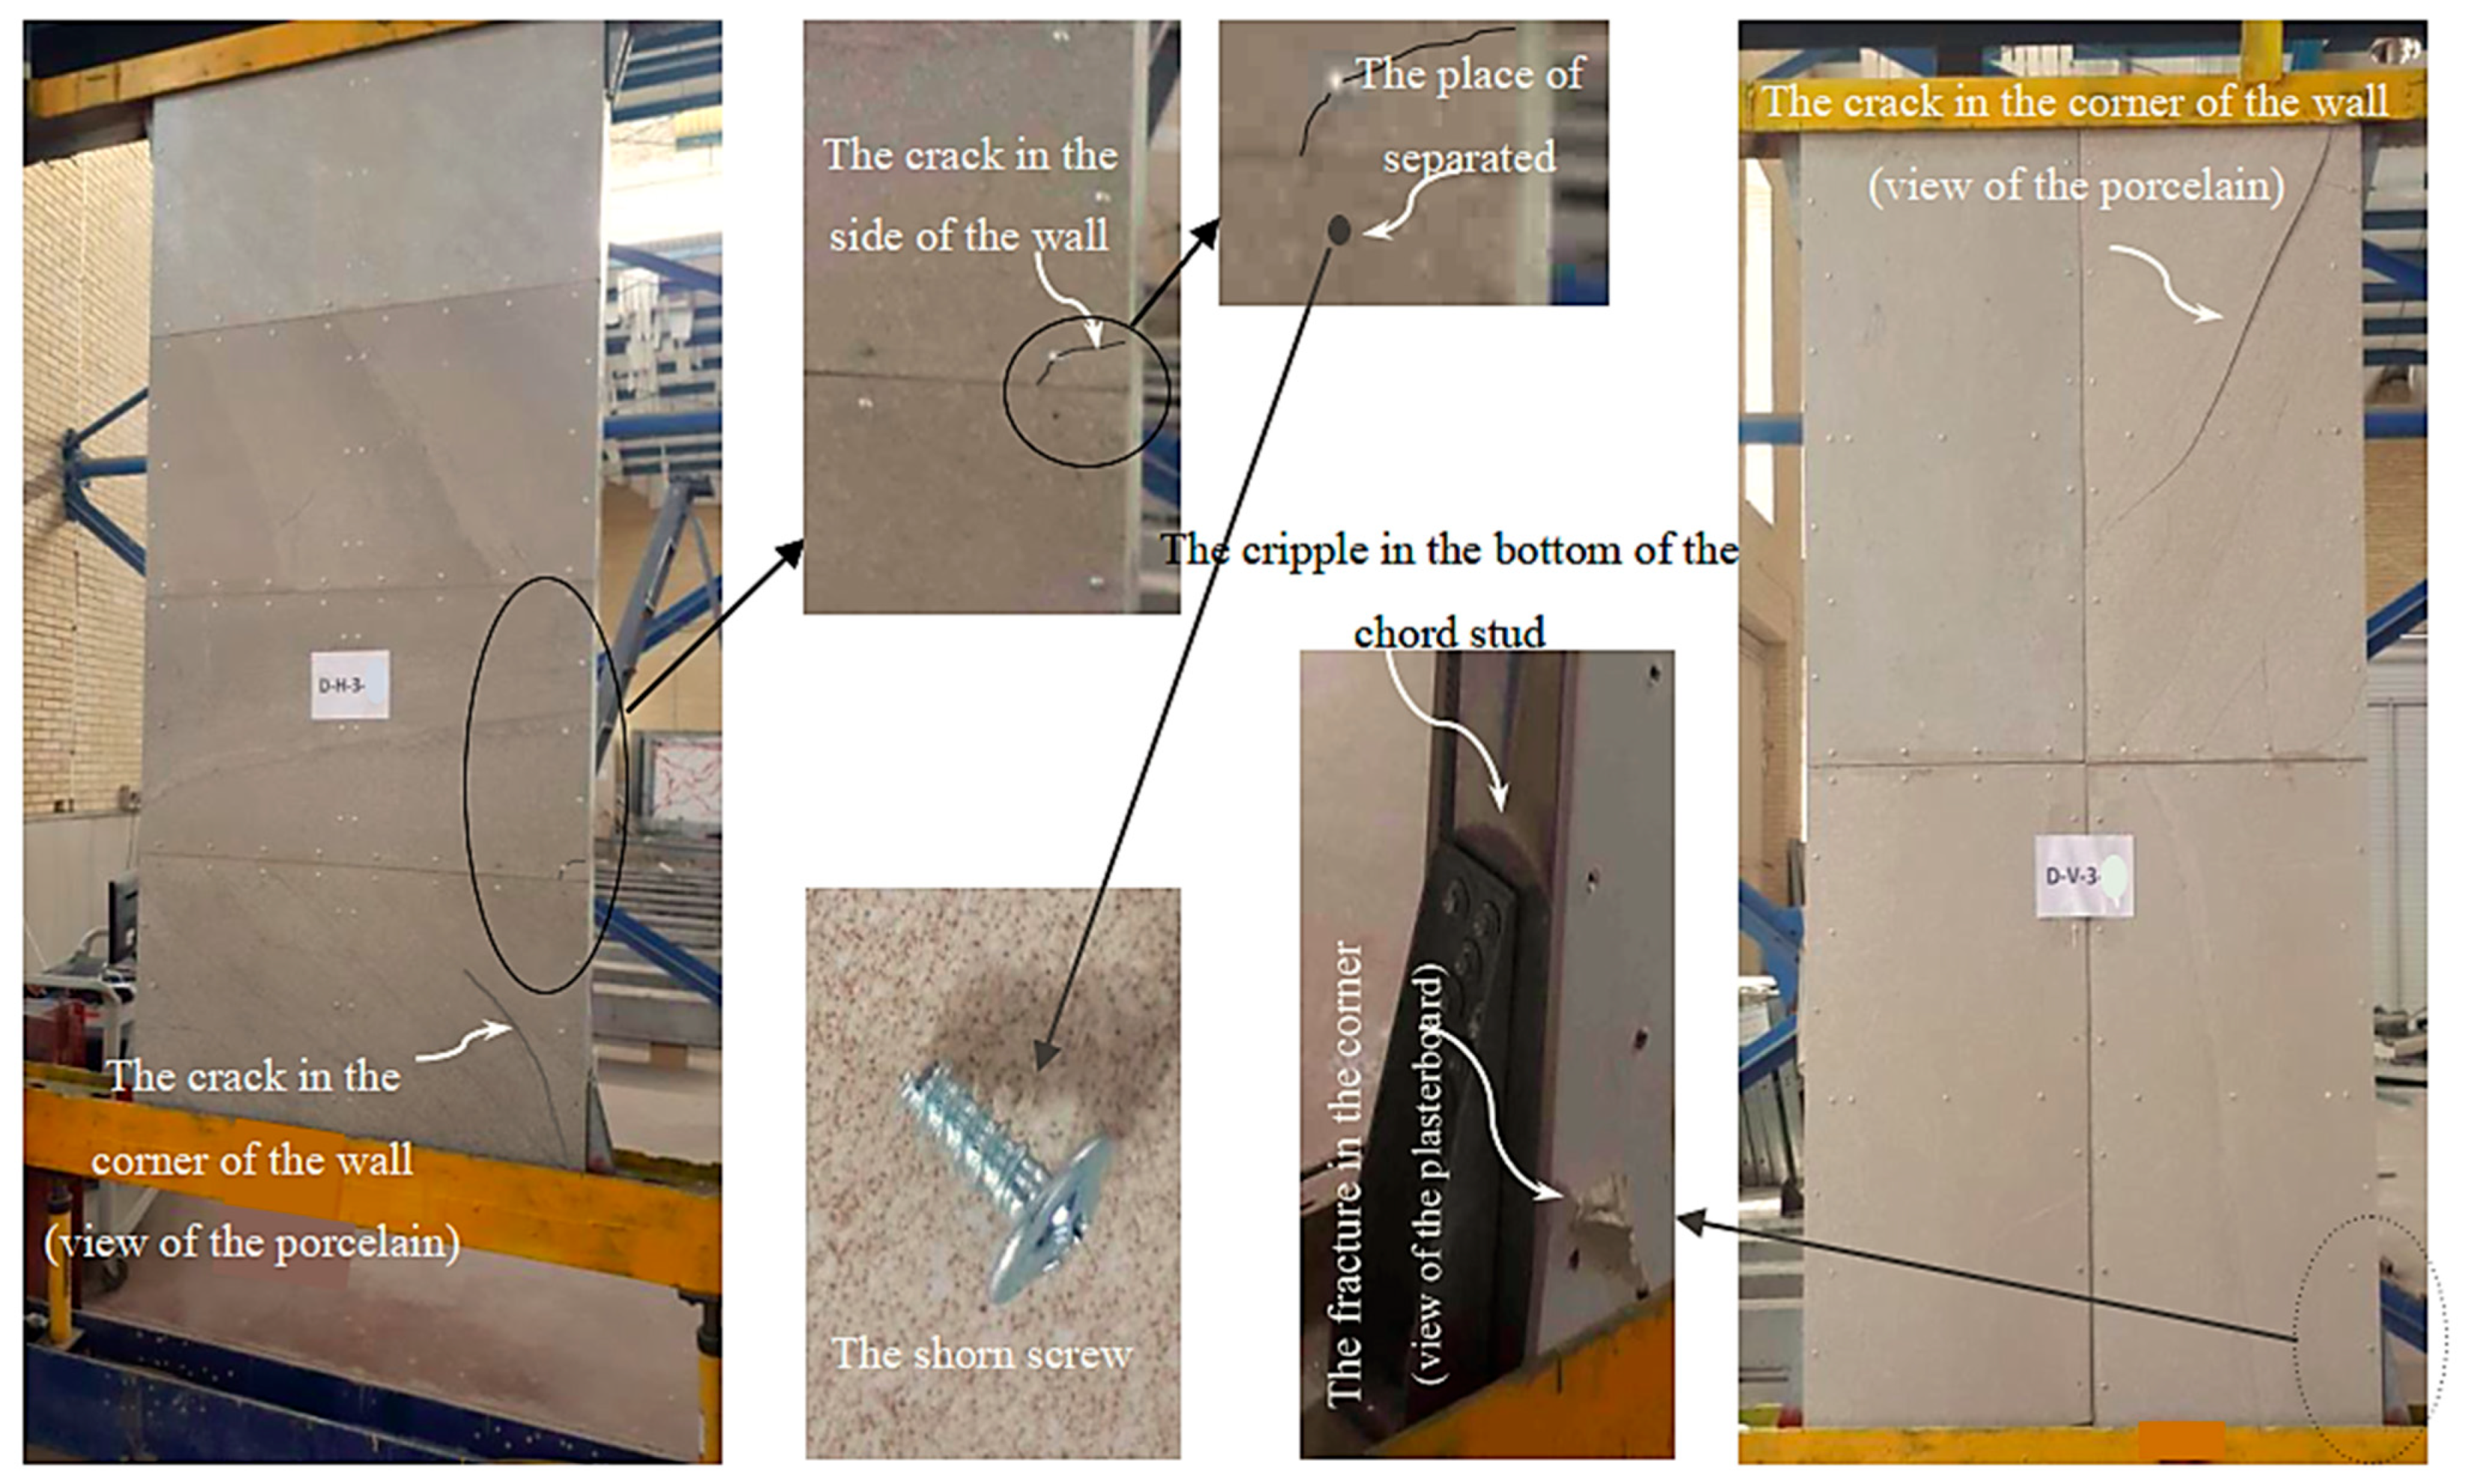
4.1. Failure Modes
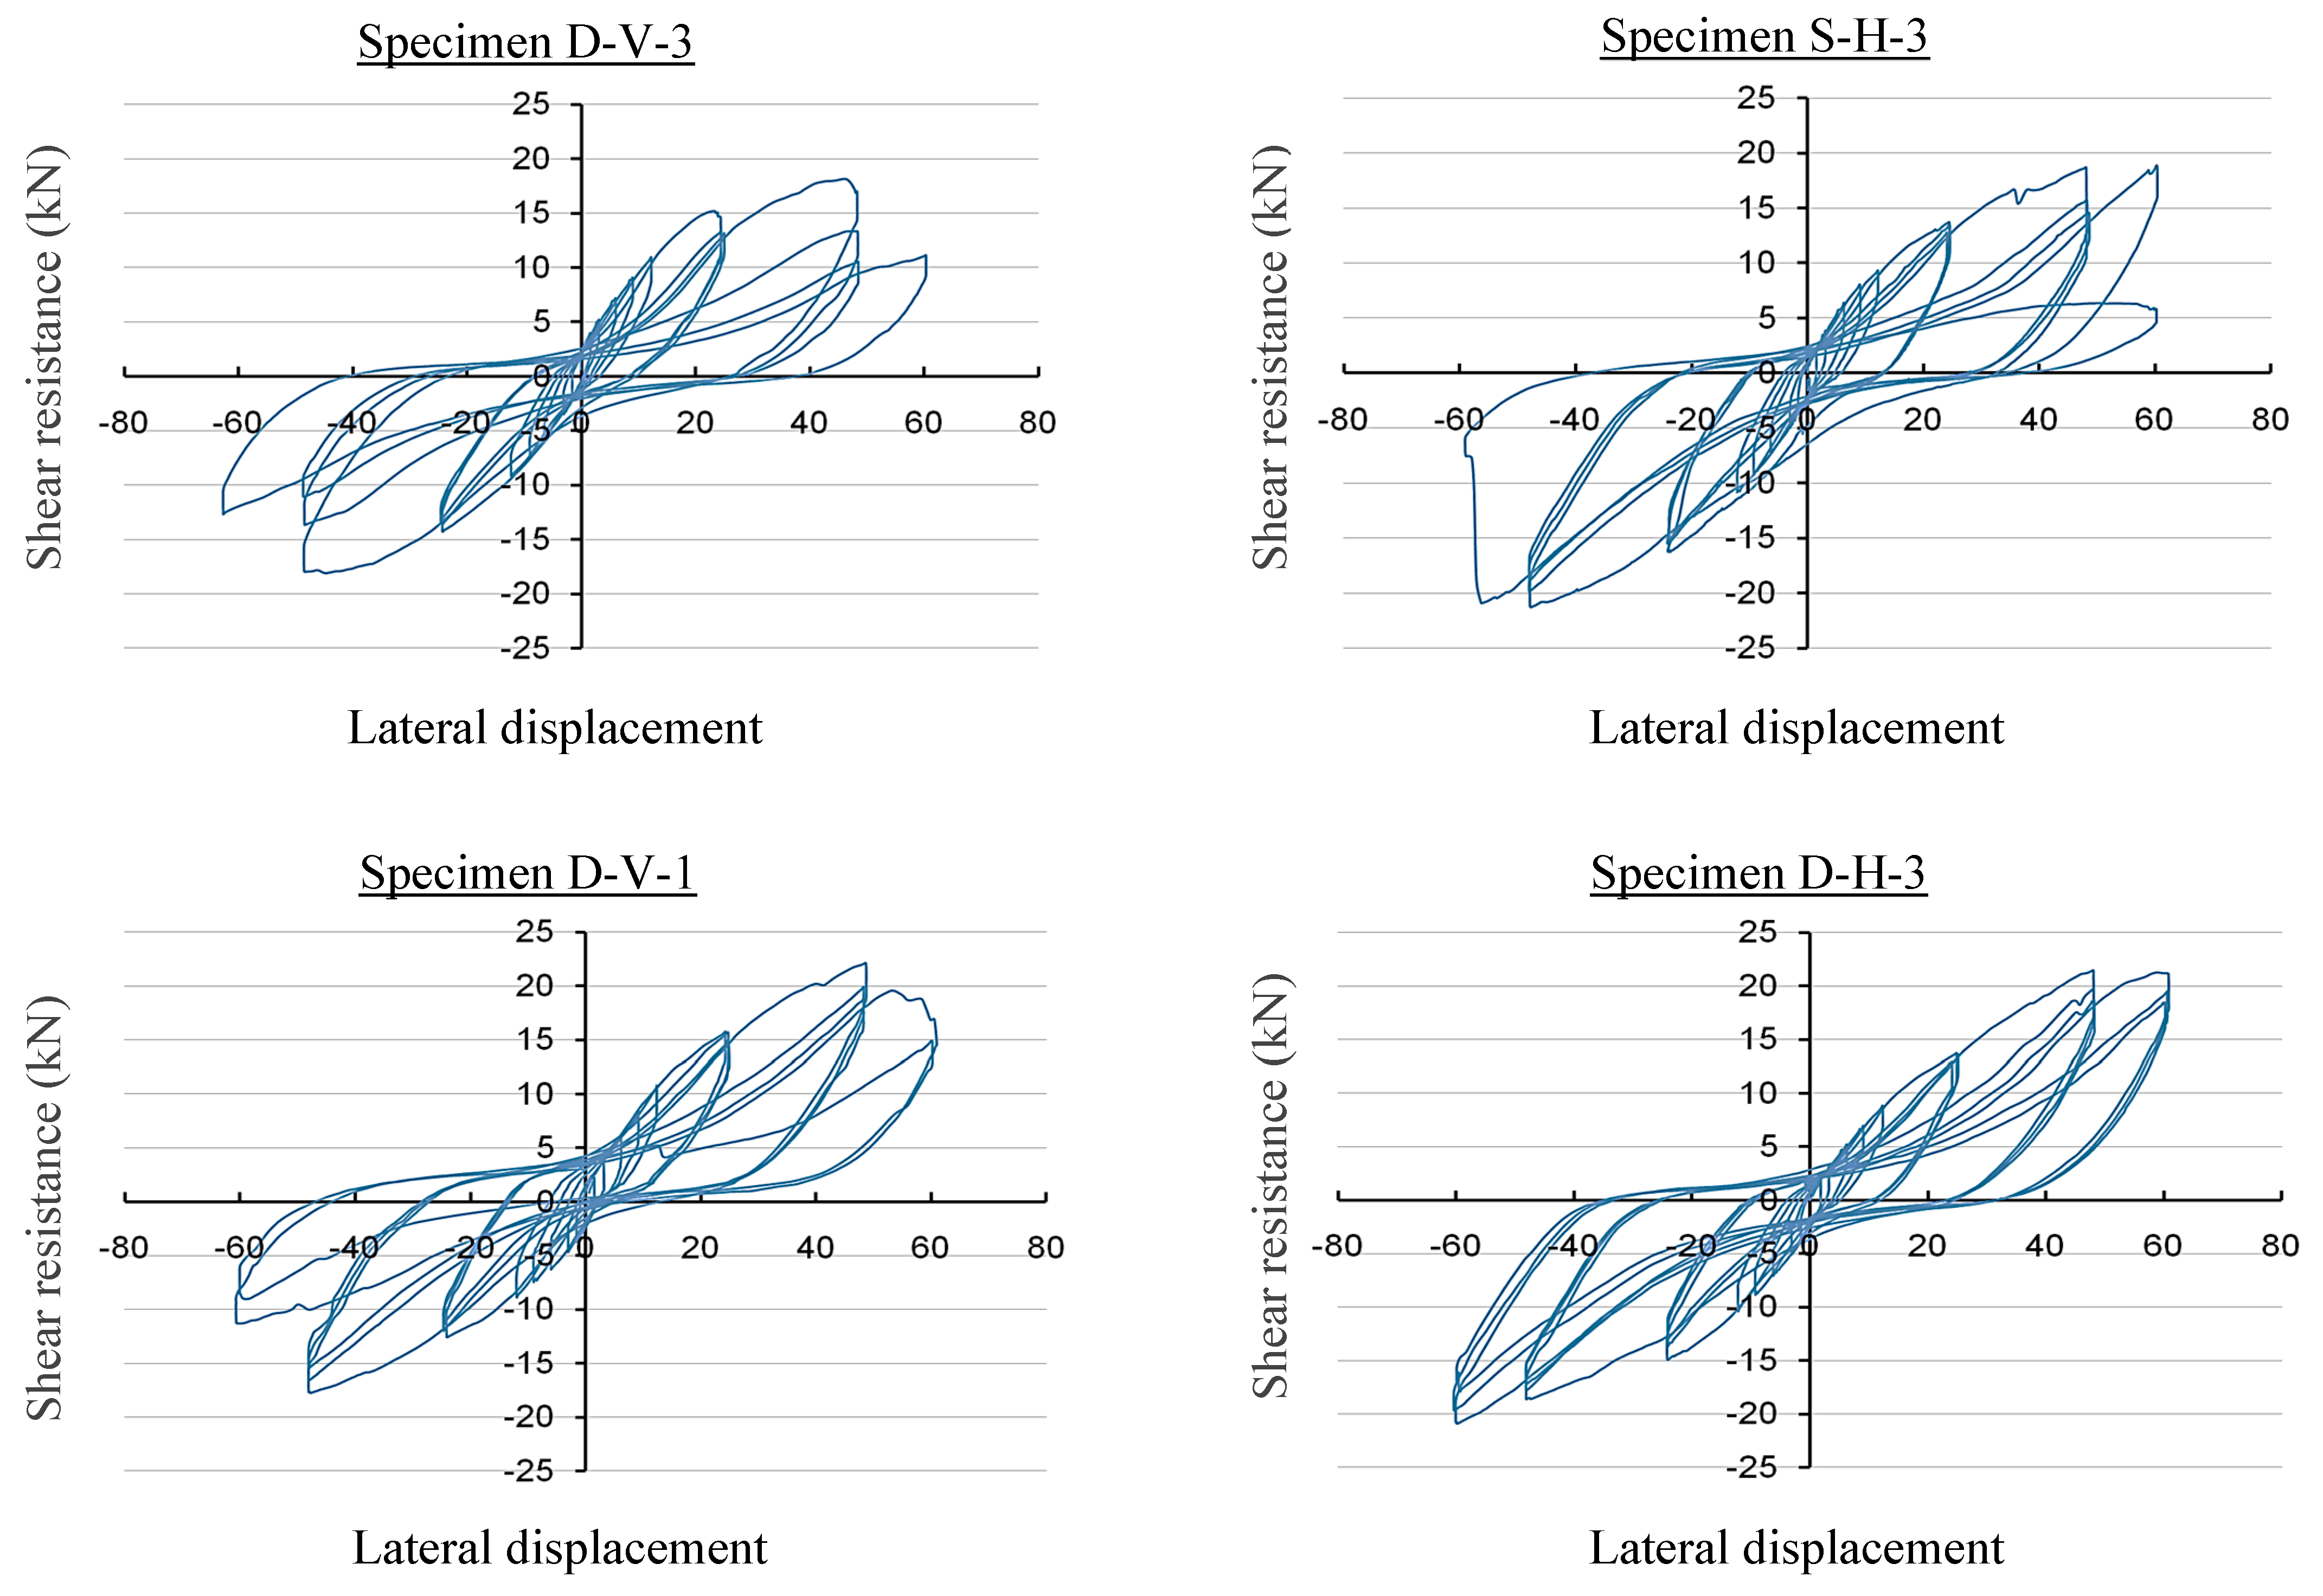
4.2. Hysteresis Response and Envelope Curves
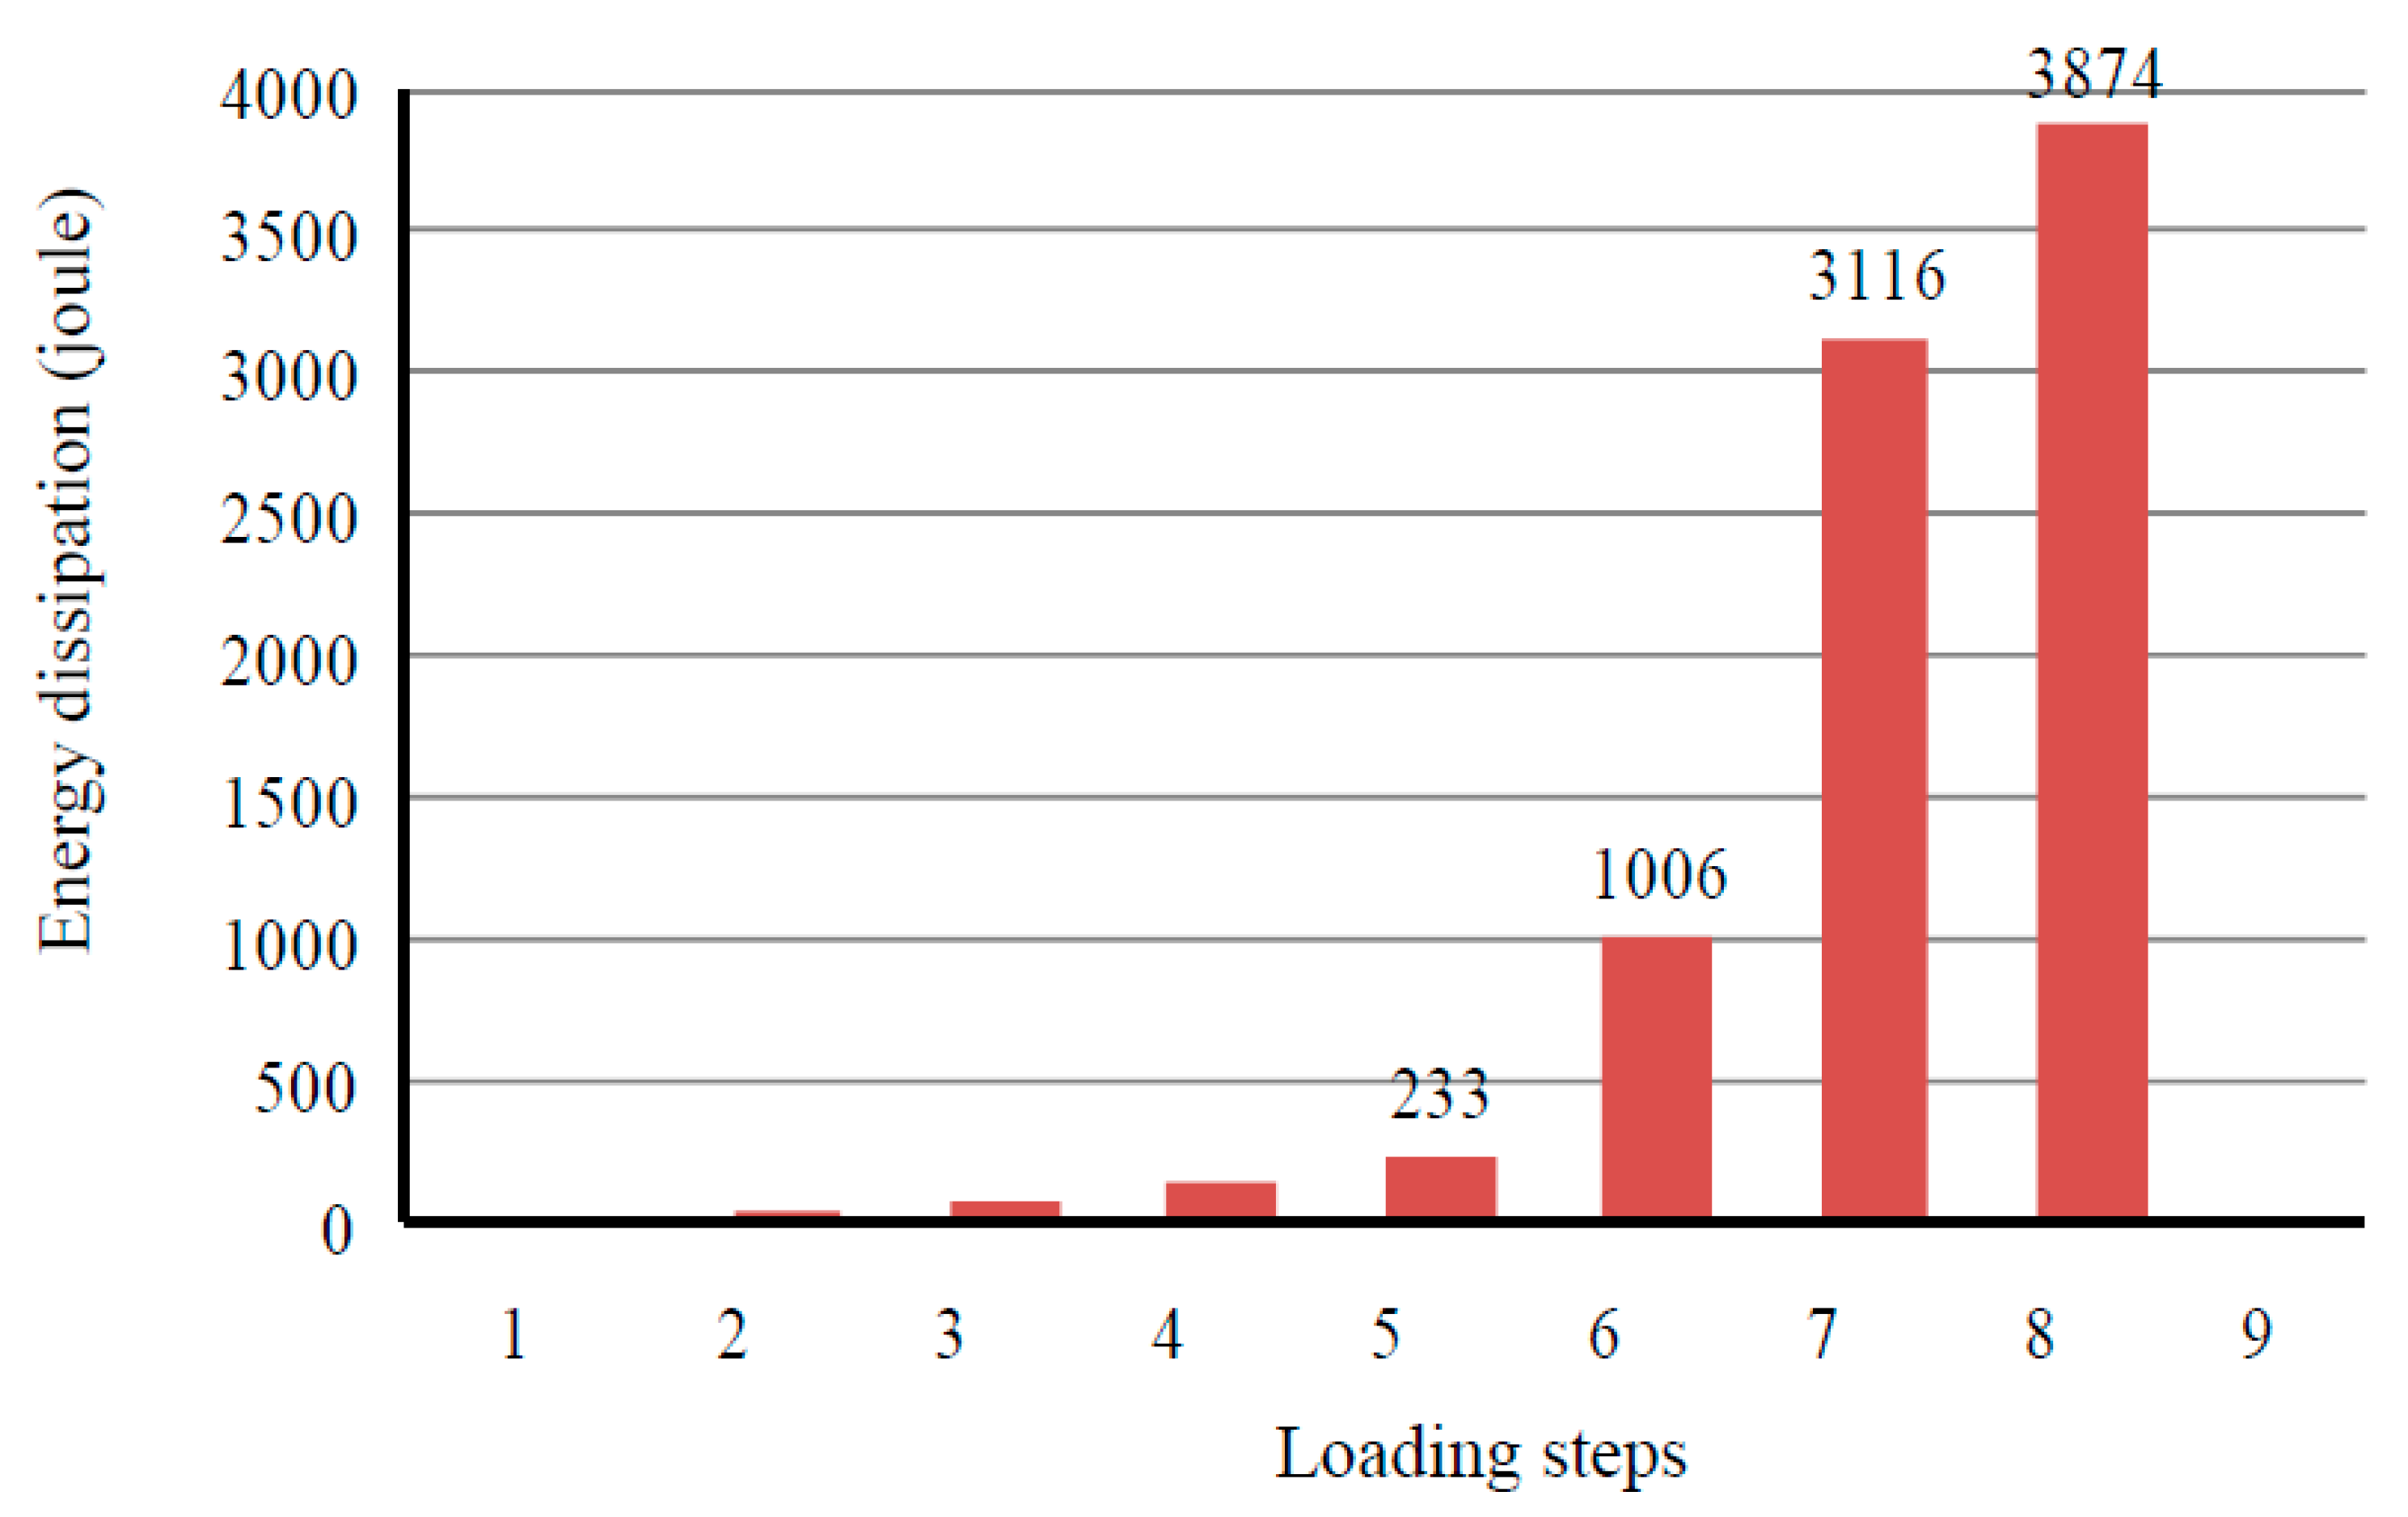
4.3. Energy Dissipation
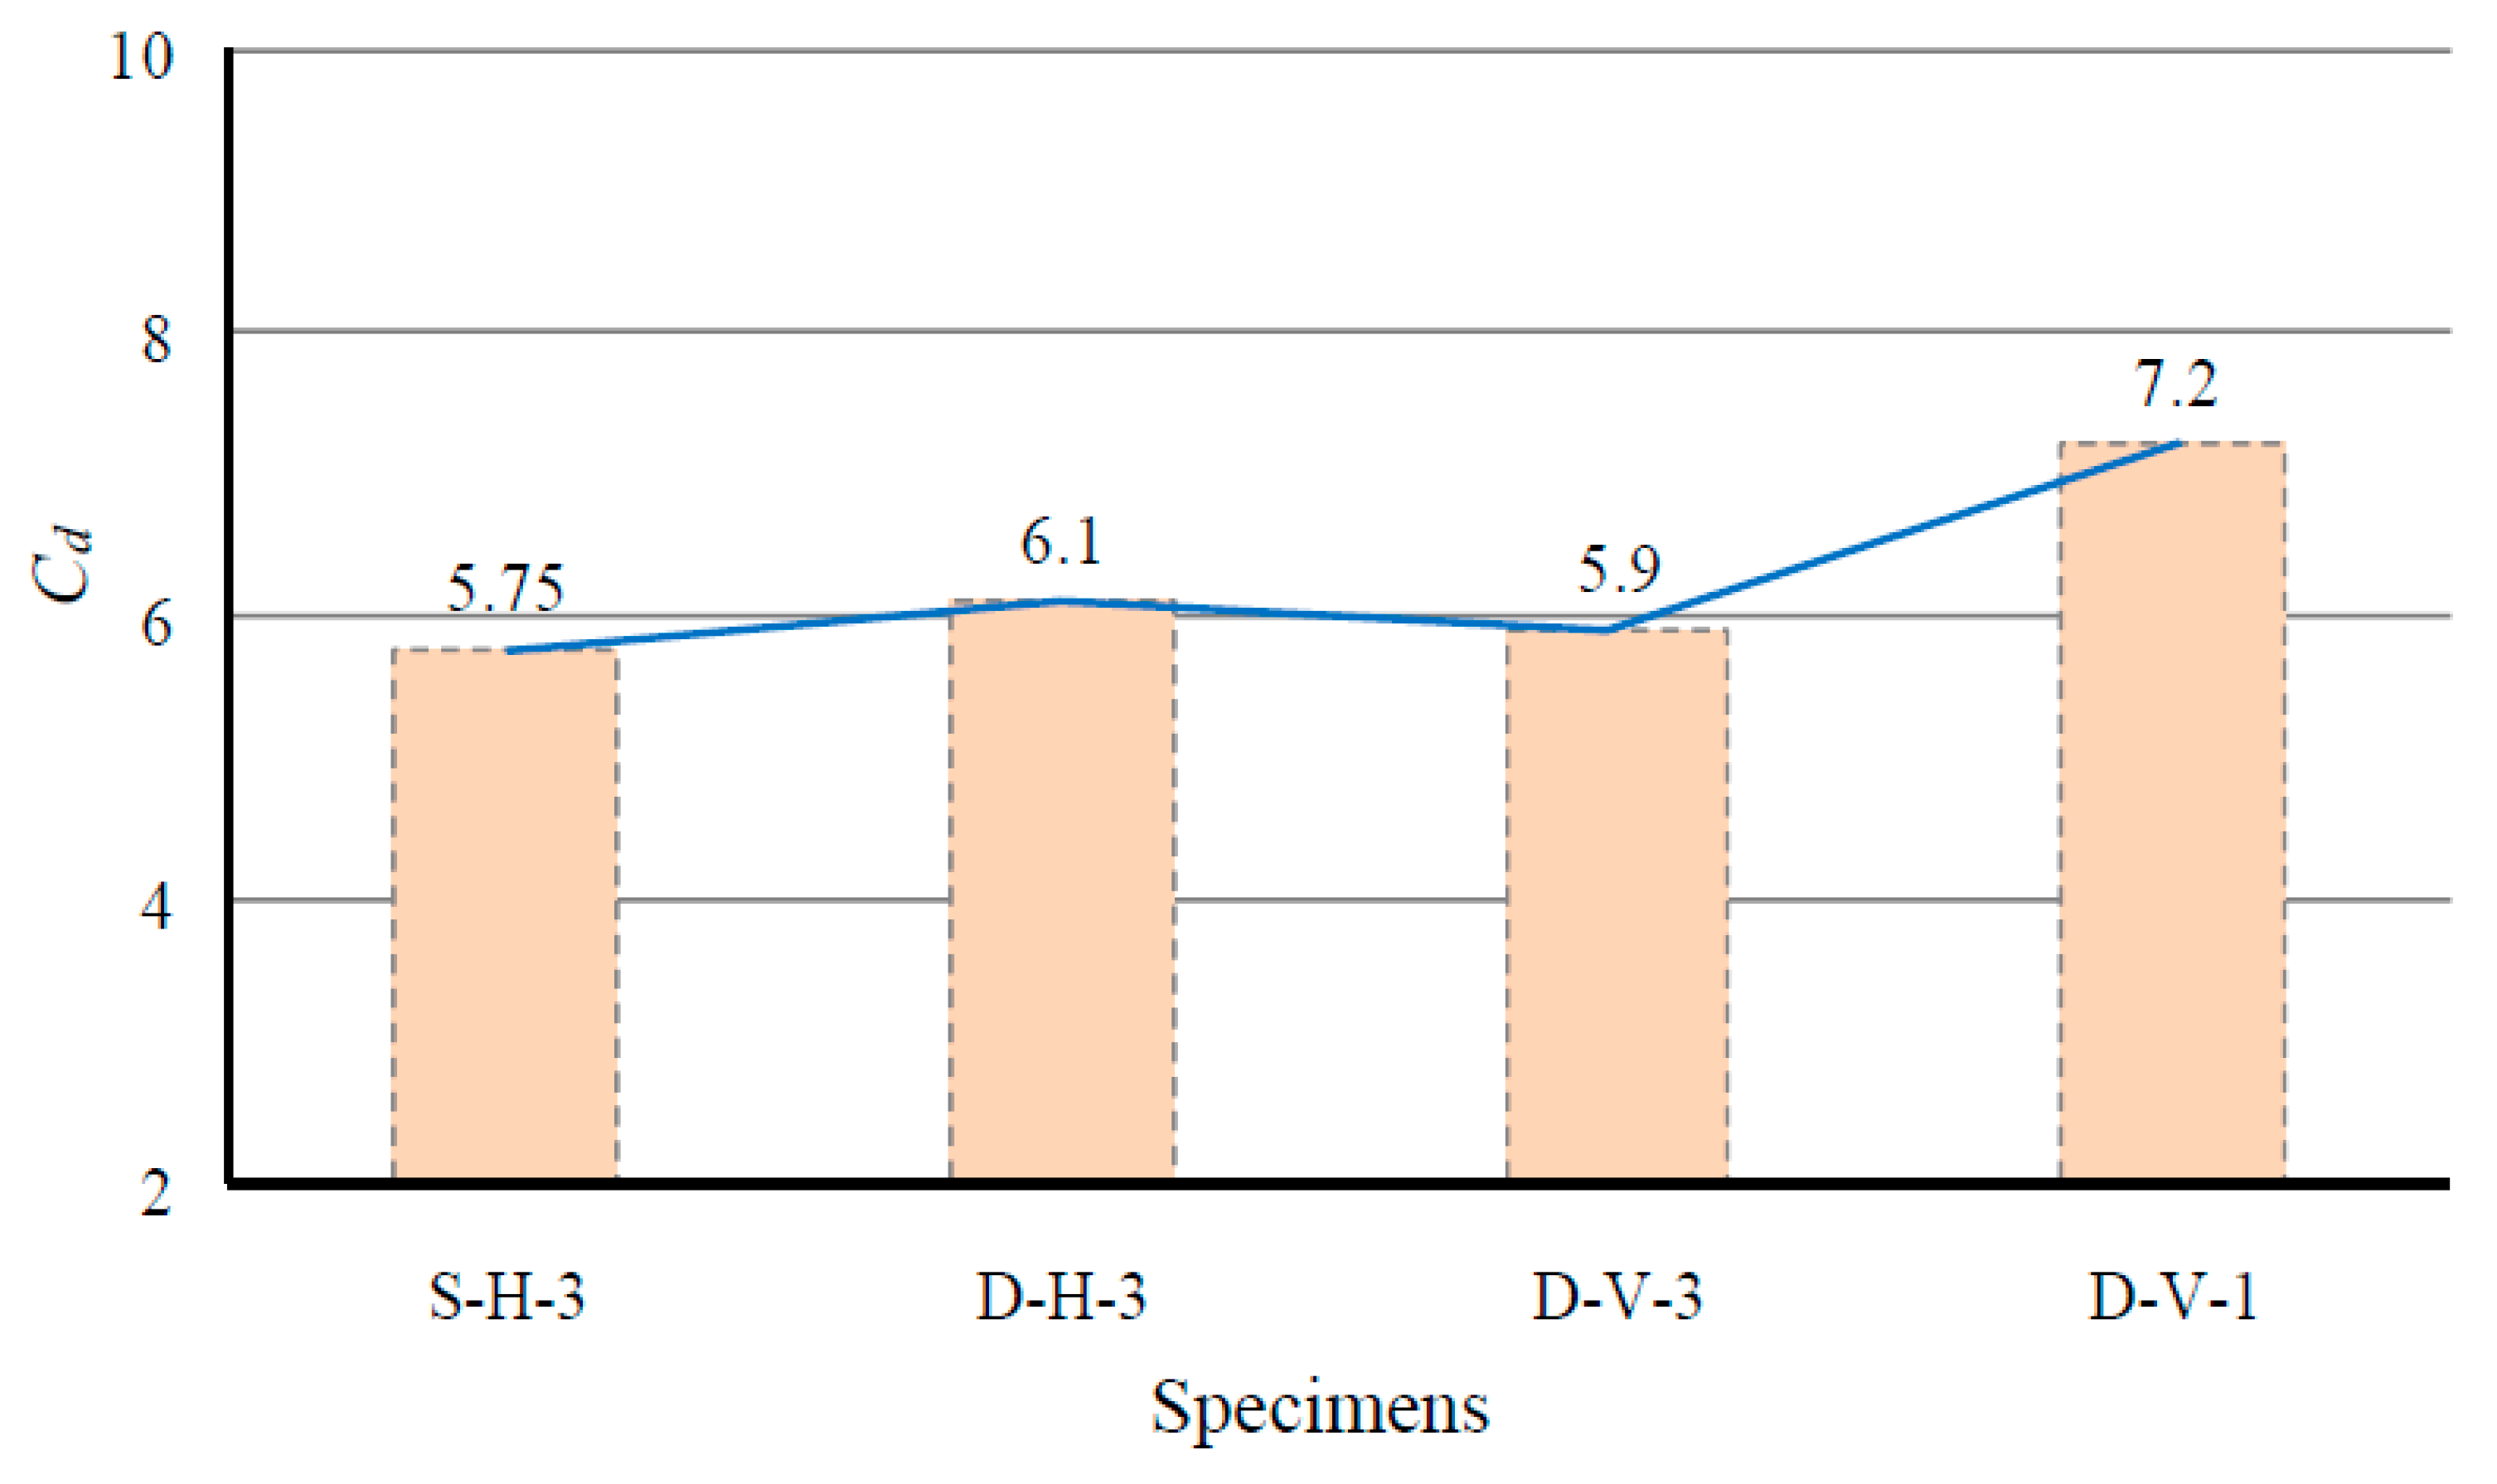
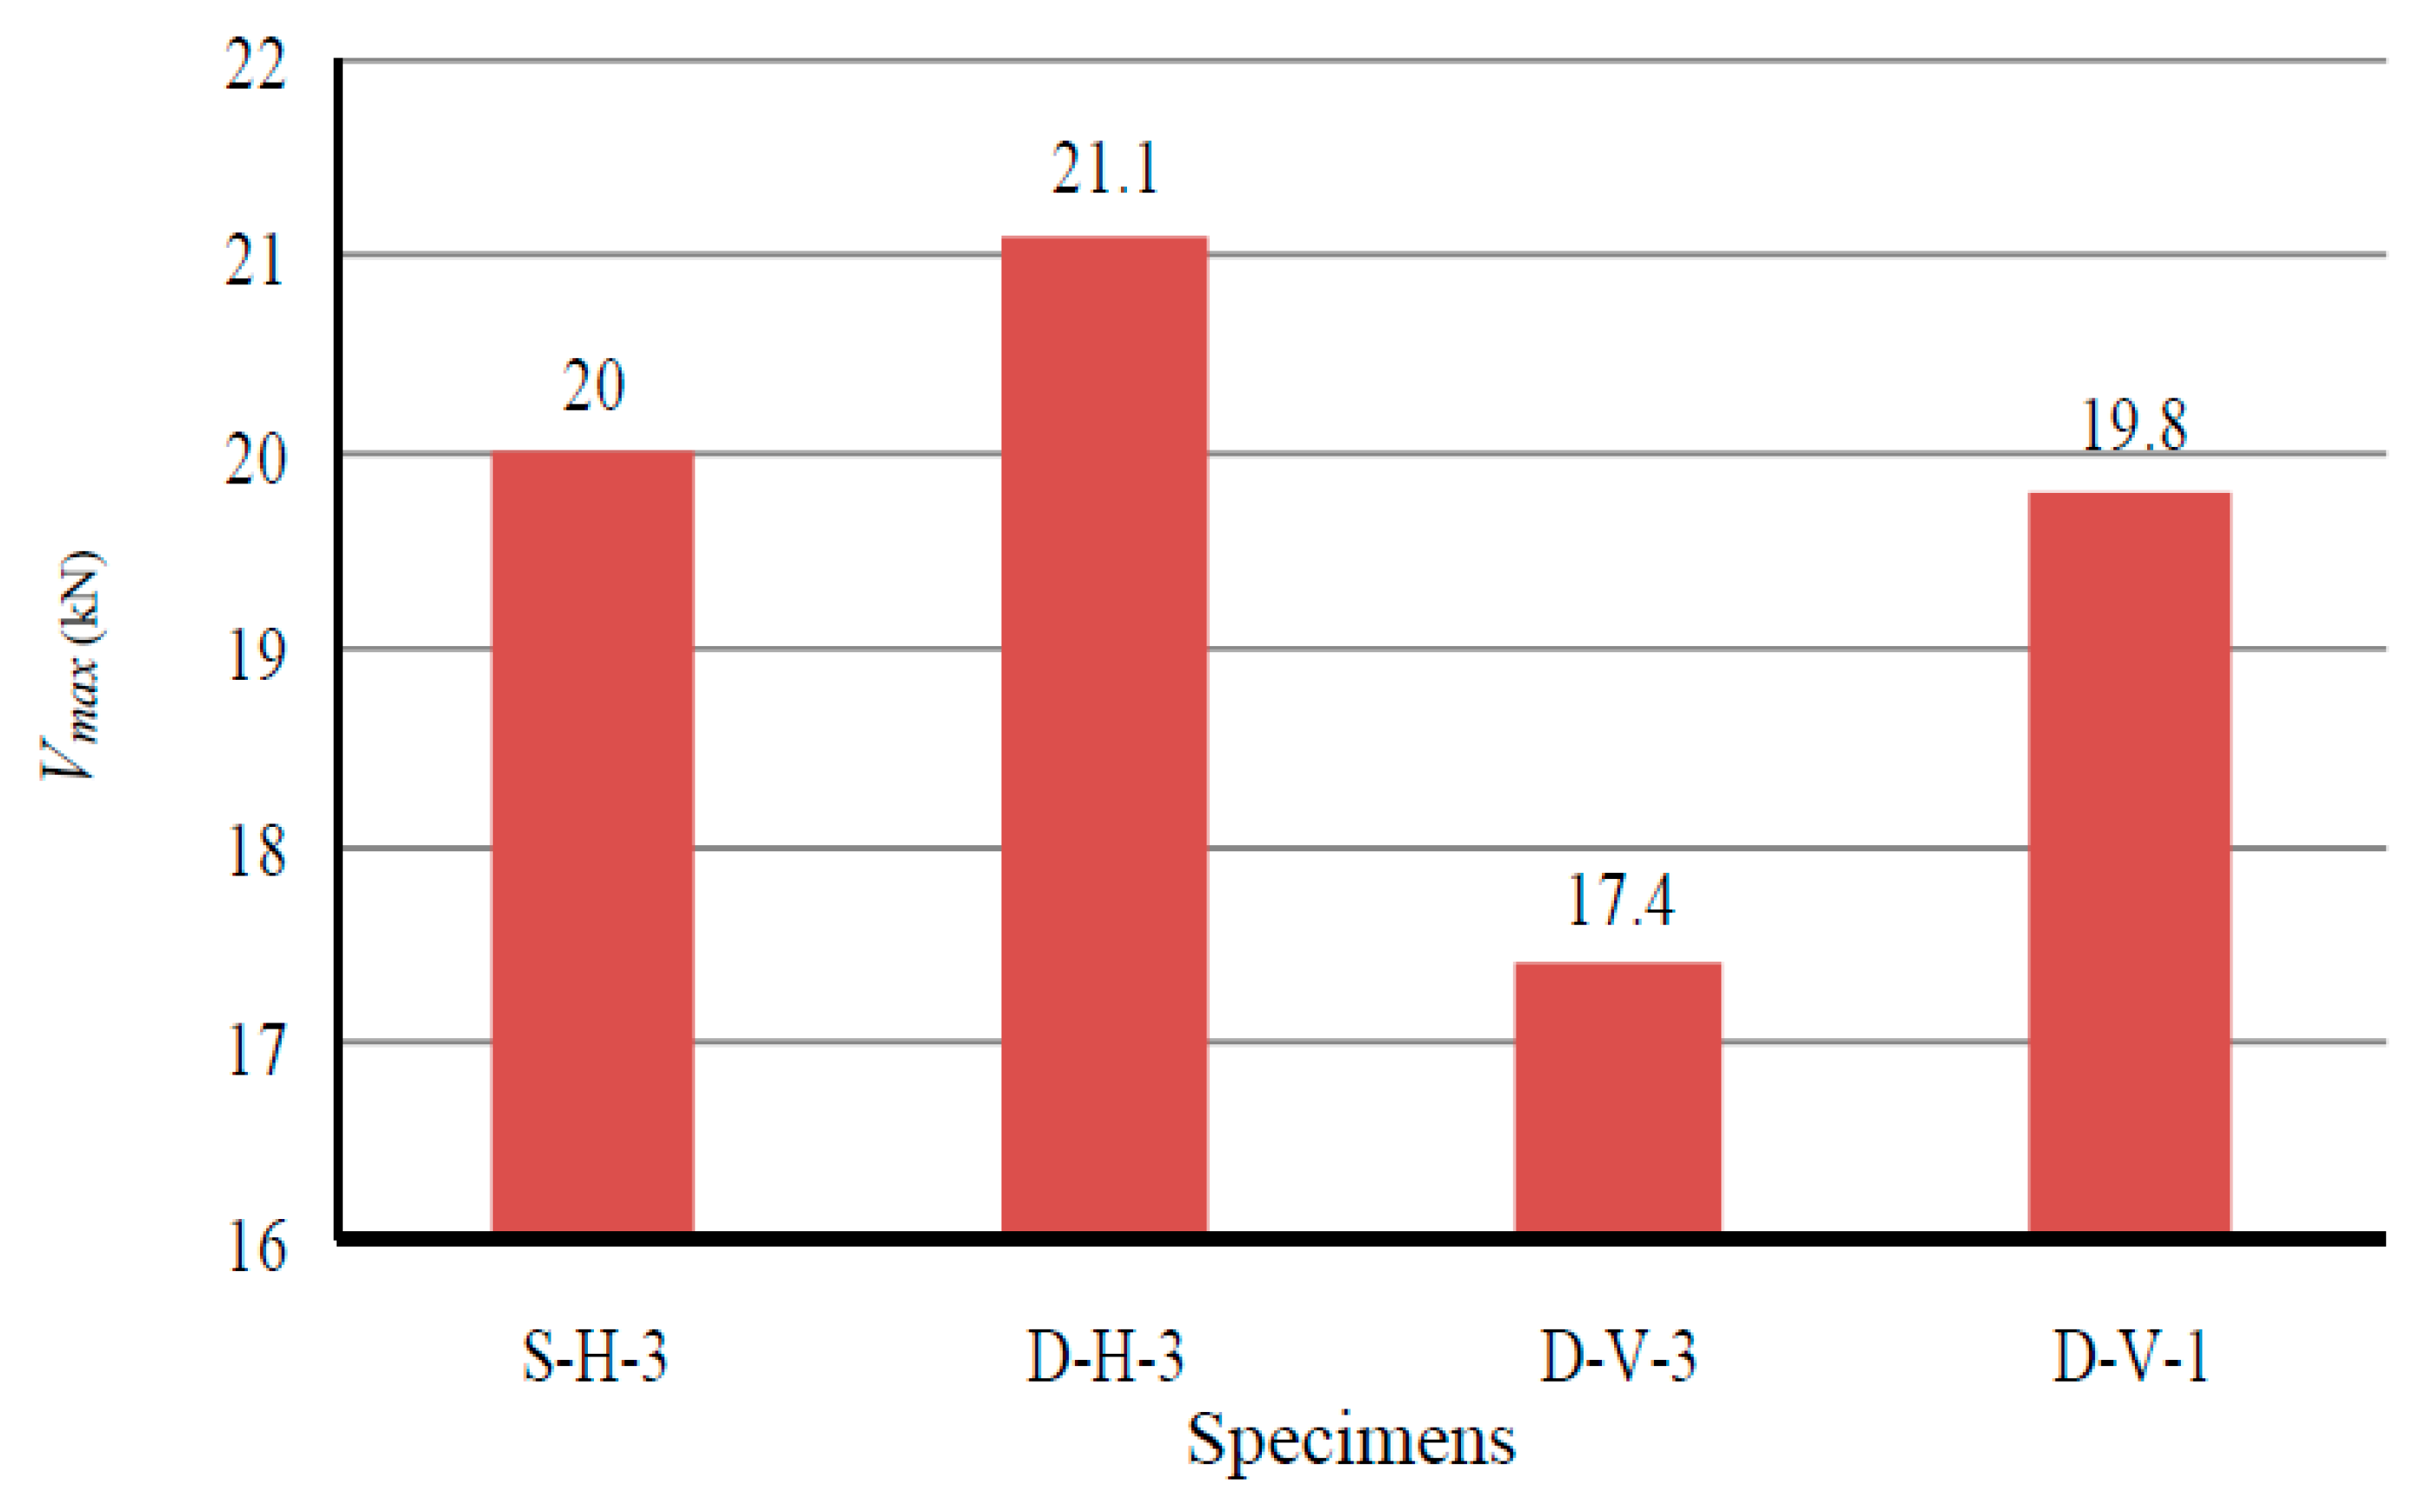
4.4. Stiffness and Other Seismic Characteristics
5. Conclusions and Recommendations
Author Contributions
Funding
Data Availability Statement
Conflicts of Interest
Abbreviations
| LSF | Lightweight steel frame |
| CFS | Cold-formed steel |
| SPS | Screwed porcelain sheath |
| GWB | Gypsum wall board |
| BMB | Bolivian magnesium board |
| CSB | Calcium silicate board |
| OSB | Oriented strand board |
| FCB | Fiber cement board |
| HLFC | High-strength lightweight foamed concrete |
| LVDT | Linear variable displacement transducer |
References
- Maizi, S.-E.; Hadidane, Y.; Dar, M.A. Flexural design of cold-formed steel built-up sections failing by local buckling: Development of generalised direct strength method. Eng. Struct. 2024, 308, 117967. [Google Scholar] [CrossRef]
- Sharafi, P.; Mortazavi, M.; Usefi, N.; Kildashti, K.; Ronagh, H.; Samali, B. Lateral force resisting systems in lightweight steel frames: Recent research advances. Thin-Walled Struct. 2018, 130, 231–253. [Google Scholar] [CrossRef]
- Ran, X.; Shi, Y.; Yao, X.; Zeng, L. Seismic performance of cold-formed steel centre-sheathed shear wall: Simulation and theoretical prediction. J. Constr. Steel Res. 2024, 213, 108372. [Google Scholar] [CrossRef]
- Ran, X.; Shi, Y. Seismic performance optimization and theoretical analysis towards resilient cold-formed steel shear wall. Structures 2024, 64, 106584. [Google Scholar] [CrossRef]
- Wang, K.; Wang, Y.-H.; Gao, Y.; Zhou, X.-H.; Tan, J.-K.; Qi, H. Lateral behaviour of steel plate shear wall with cold-formed steel strips reinforcing door opening. Thin-Walled Struct. 2023, 190, 110981. [Google Scholar] [CrossRef]
- Gad, E.F.; Duffield, C.F.; Hutchinson, G.L.; Mansell, D.S.; Stark, G. Lateral performance of cold-formed steel-framed domestic structures. Eng. Struct. 1999, 21, 83–95. [Google Scholar] [CrossRef]
- Zhang, L.; Xu, L.; Ziemian, R.D.; Ziemian, C. Effect of solid blocking on lateral bracing requirements for cold-formed steel wall studs. Thin-Walled Struct. 2024, 203, 112208. [Google Scholar] [CrossRef]
- Esmaeili Tafti, M.A.; Javaheri Tafti, M.R.; Fallah, A.A. Investigation of the effect of mortar size on the cyclic behavior of a brick shear wall in a cold-formed steel frame using experimental studies. Asas J. 2021, 23, 30–44. [Google Scholar]
- Usefi, N.; Sharafi, P.; Ronagh, H.R. Numerical models for lateral behavior analysis of cold-formed steel framed walls: State of the art, evaluation and challenges. Thin-Walled Struct. 2019, 138, 252–285. [Google Scholar] [CrossRef]
- AISI S400; Standard for Seismic Design of Cold-Formed Steel Structural Systems. American Iron and Steel Institute: Washington, DC, USA, 2015.
- Zhang, W.; Xu, X.; Liu, Y.; Yu, C.; Liu, X.; Xie, Z. High-strength cold-formed steel framed shear wall with steel sheet sheathing. Thin-Walled Struct. 2021, 162, 107584. [Google Scholar] [CrossRef]
- BHRC. Cold-Formed Light Steel Structures Design and Construction Code 612 (Structural); BHRC: Tehran, Iran, 2013. [Google Scholar]
- Yu, Y.; Xie, Q.; Liu, Y.; Xue, Y. Cyclic behavior of partially prefabricated steel shape-reinforced concrete composite shear walls: Experiments and finite element analysis. Buildings 2024, 14, 2208. [Google Scholar] [CrossRef]
- Li, F.; Gao, J.; Zhang, Y.; Chen, Y.; Lv, Y. Experimental investigation and numerical simulation of corrugated steel plate shear wall considering the gravity load. Buildings 2023, 13, 346. [Google Scholar] [CrossRef]
- Pan, C.L.; Shan, M.Y. Monotonic shear tests of cold-formed steel wall frames with sheathing. Thin-Walled Struct. 2011, 49, 363–370. [Google Scholar] [CrossRef]
- Baran, E.; Alica, C. Behavior of cold-formed steel wall panels under monotonic horizontal loading. J. Constr. Steel Res. 2012, 79, 144–158. [Google Scholar] [CrossRef]
- Swensen, S.; Deierlein, G.G.; Miranda, E. Behavior of screw and adhesive connections to gypsum wallboard in wood and cold-formed steel-framed wallettes. J. Struct. Eng. 2016, 142, E4015002. [Google Scholar] [CrossRef]
- Mohebbi, S.; Mirghaderi, R.; Farahbod, F.; Sabbagh, A.B. Experiment work on single and double-sided steel sheathed cold-formed steel shear walls for seismic actions. Thin-Walled Struct. 2015, 91, 50–62. [Google Scholar] [CrossRef]
- Niari, S.E.; Rafezy, B.; Abedi, K. Seismic behavior of steel sheathed cold-formed steel shear wall: Experimental investigation and numerical modeling. Thin-Walled Struct. 2015, 96, 337–347. [Google Scholar] [CrossRef]
- Javaheri-Tafti, M.R.; Ronagh, H.R.; Behnamfar, F.; Memarzadeh, P. An experimental investigation on the seismic behavior of cold-formed steel walls sheathed by thin steel plates. Thin-Walled Struct. 2014, 80, 66–79. [Google Scholar] [CrossRef]
- Zhang, W.; Mahdavian, M.; Li, Y.; Yu, C. Experiments and simulations of cold-formed steel wall assemblies using corrugated steel sheathing subjected to shear and gravity loads. J. Struct. Eng. 2017, 143, 04016193. [Google Scholar] [CrossRef]
- Zeynalian, M.; Ronagh, H.R. Seismic performance of cold formed steel walls sheathed by fibre-cement board panels. J. Constr. Steel Res. 2015, 107, 1–11. [Google Scholar] [CrossRef]
- Xu, Z.; Chen, Z.; Osman, B.H.; Yang, S. Seismic performance of high-strength lightweight foamed concrete-filled cold-formed steel shear walls. J. Constr. Steel Res. 2018, 143, 148–161. [Google Scholar] [CrossRef]
- Xu, Z.; Chen, Z.; Yang, S. Seismic behavior of cold-formed steel high-strength foamed concrete shear walls with straw boards. Thin-Walled Struct. 2018, 124, 350–365. [Google Scholar] [CrossRef]
- Wu, F.-W.; Li, Y.-Q. Multi-level simulation studies on seismic performance evaluation of steel-sheathed cold-formed steel framing shear walls. J. Build. Eng. 2022, 61, 105302. [Google Scholar] [CrossRef]
- Liu, S.; Feng, R.; Zhong, Y. Numerical Study on the seismic performance of cold-formed steel shear walls with steel sheathing and gypsum board. Materials 2023, 16, 5685. [Google Scholar] [CrossRef]
- Lopes, D.M.; Duarte, A.P.C.; Silvestre, N. Experimental investigation of light steel framing walls under horizontal loading. Buildings 2023, 13, 193. [Google Scholar] [CrossRef]
- Iuorio, O. From Mass Prefab to Mass Customization, SpringerBriefs in Applied Sciences and Technology; Springer Nature Switzerland: Cham, Switzerland, 2025; ISBN 978-3-031-73326-0. [Google Scholar]
- AISI S213; Standard for Cold-Formed Steel Framing–Lateral Design. 2020th ed, American Iron and Steel Institute (AISI): Washington, DC, USA, 2020.
- AISI S200; Standard for Cold-Formed Steel Framing—General Provisions. American Iron and Steel Institute (AISI): Washington, DC, USA, 2004.
- FEMA 450; Recommended Provisions for Seismic Regulations for New Buildings and Other Structures. Building Seismic Safety Council (BSSC): Washington, DC, USA, 2003.
- FEMA P. 750; Recommended Seismic Provisions for New Buildings and Other Structures. U.S. Federal Emergency Management Agency (FEMA): Washington, DC, USA, 2009.
- AS/NZS 4600; Cold-Formed Steel Structures. 2018th ed. Standards Australia: Sydney, Australia; Standards New Zealand: Wellington, New Zealand, 2018.
- Zeynalian, M.; Ronagh, H.R. An experimental investigation on the lateral behavior of knee-braced cold-formed steel shear walls. Thin-Walled Struct. 2012, 51, 64–75. [Google Scholar] [CrossRef]
- ASTM E2126-07; Standard Test Methods for Cyclic (Reversed) Load Test for Shear Resistance of Walls for Buildings. American Society for Testing and Materials (ASTM): West Conshohocken, PA, USA, 2005.
- Yu, W.-W.; LaBoube, R.A.; Chen, H. Cold-Formed Steel Design; John Wiley & Sons: Hoboken, NJ, USA, 2019; ISBN 1119487390. [Google Scholar]
- Uang, C.M. Establishing R (or Rw) and Cd factors for building seismic provisions. J. Struct. Eng. 1991, 117, 19–28. [Google Scholar] [CrossRef]
- FEMA 356; Prestandard and Commentary for the Seismic Rehabilitation of Buildings. Federal Emergency Management Agency (FEMA): Washington, DC, USA, 2000.
- Nassar, A.A. Seismic Demands for SDOF and MDOF Systems; Stanford University: Stanford, PA, USA, 1991. [Google Scholar]
- Miranda, E.; Bertero, V.V. Evaluation of strength reduction factors for earthquake-resistant design. Earthq. Spectra 1994, 10, 357–379. [Google Scholar] [CrossRef]
- Newmark, N.M.; Hall, W.J. Earthquake Spectra and Design; Earthquake Engineering Research Institute (EERI): Oakland, CA, USA, 1982. [Google Scholar]
- Abdul Ghafar, W.; Tao, Z.; Tao, Y.; He, Y.; Wu, L.; Zhang, Z. Experimental and numerical study of an innovative infill web-strips steel plate shear wall with rigid beam-to-column connections. Buildings 2022, 12, 1560. [Google Scholar] [CrossRef]
- Abdul Ghafar, W.; Zhong, T.; Abid, M.; Faizan, E.; Mohamed, A.; Yosri, A.M. Seismic performance investigation of an innovative steel shear wall with semi-rigid beam-to-column connections. Front. Mater. 2022, 9, 1075300. [Google Scholar] [CrossRef]


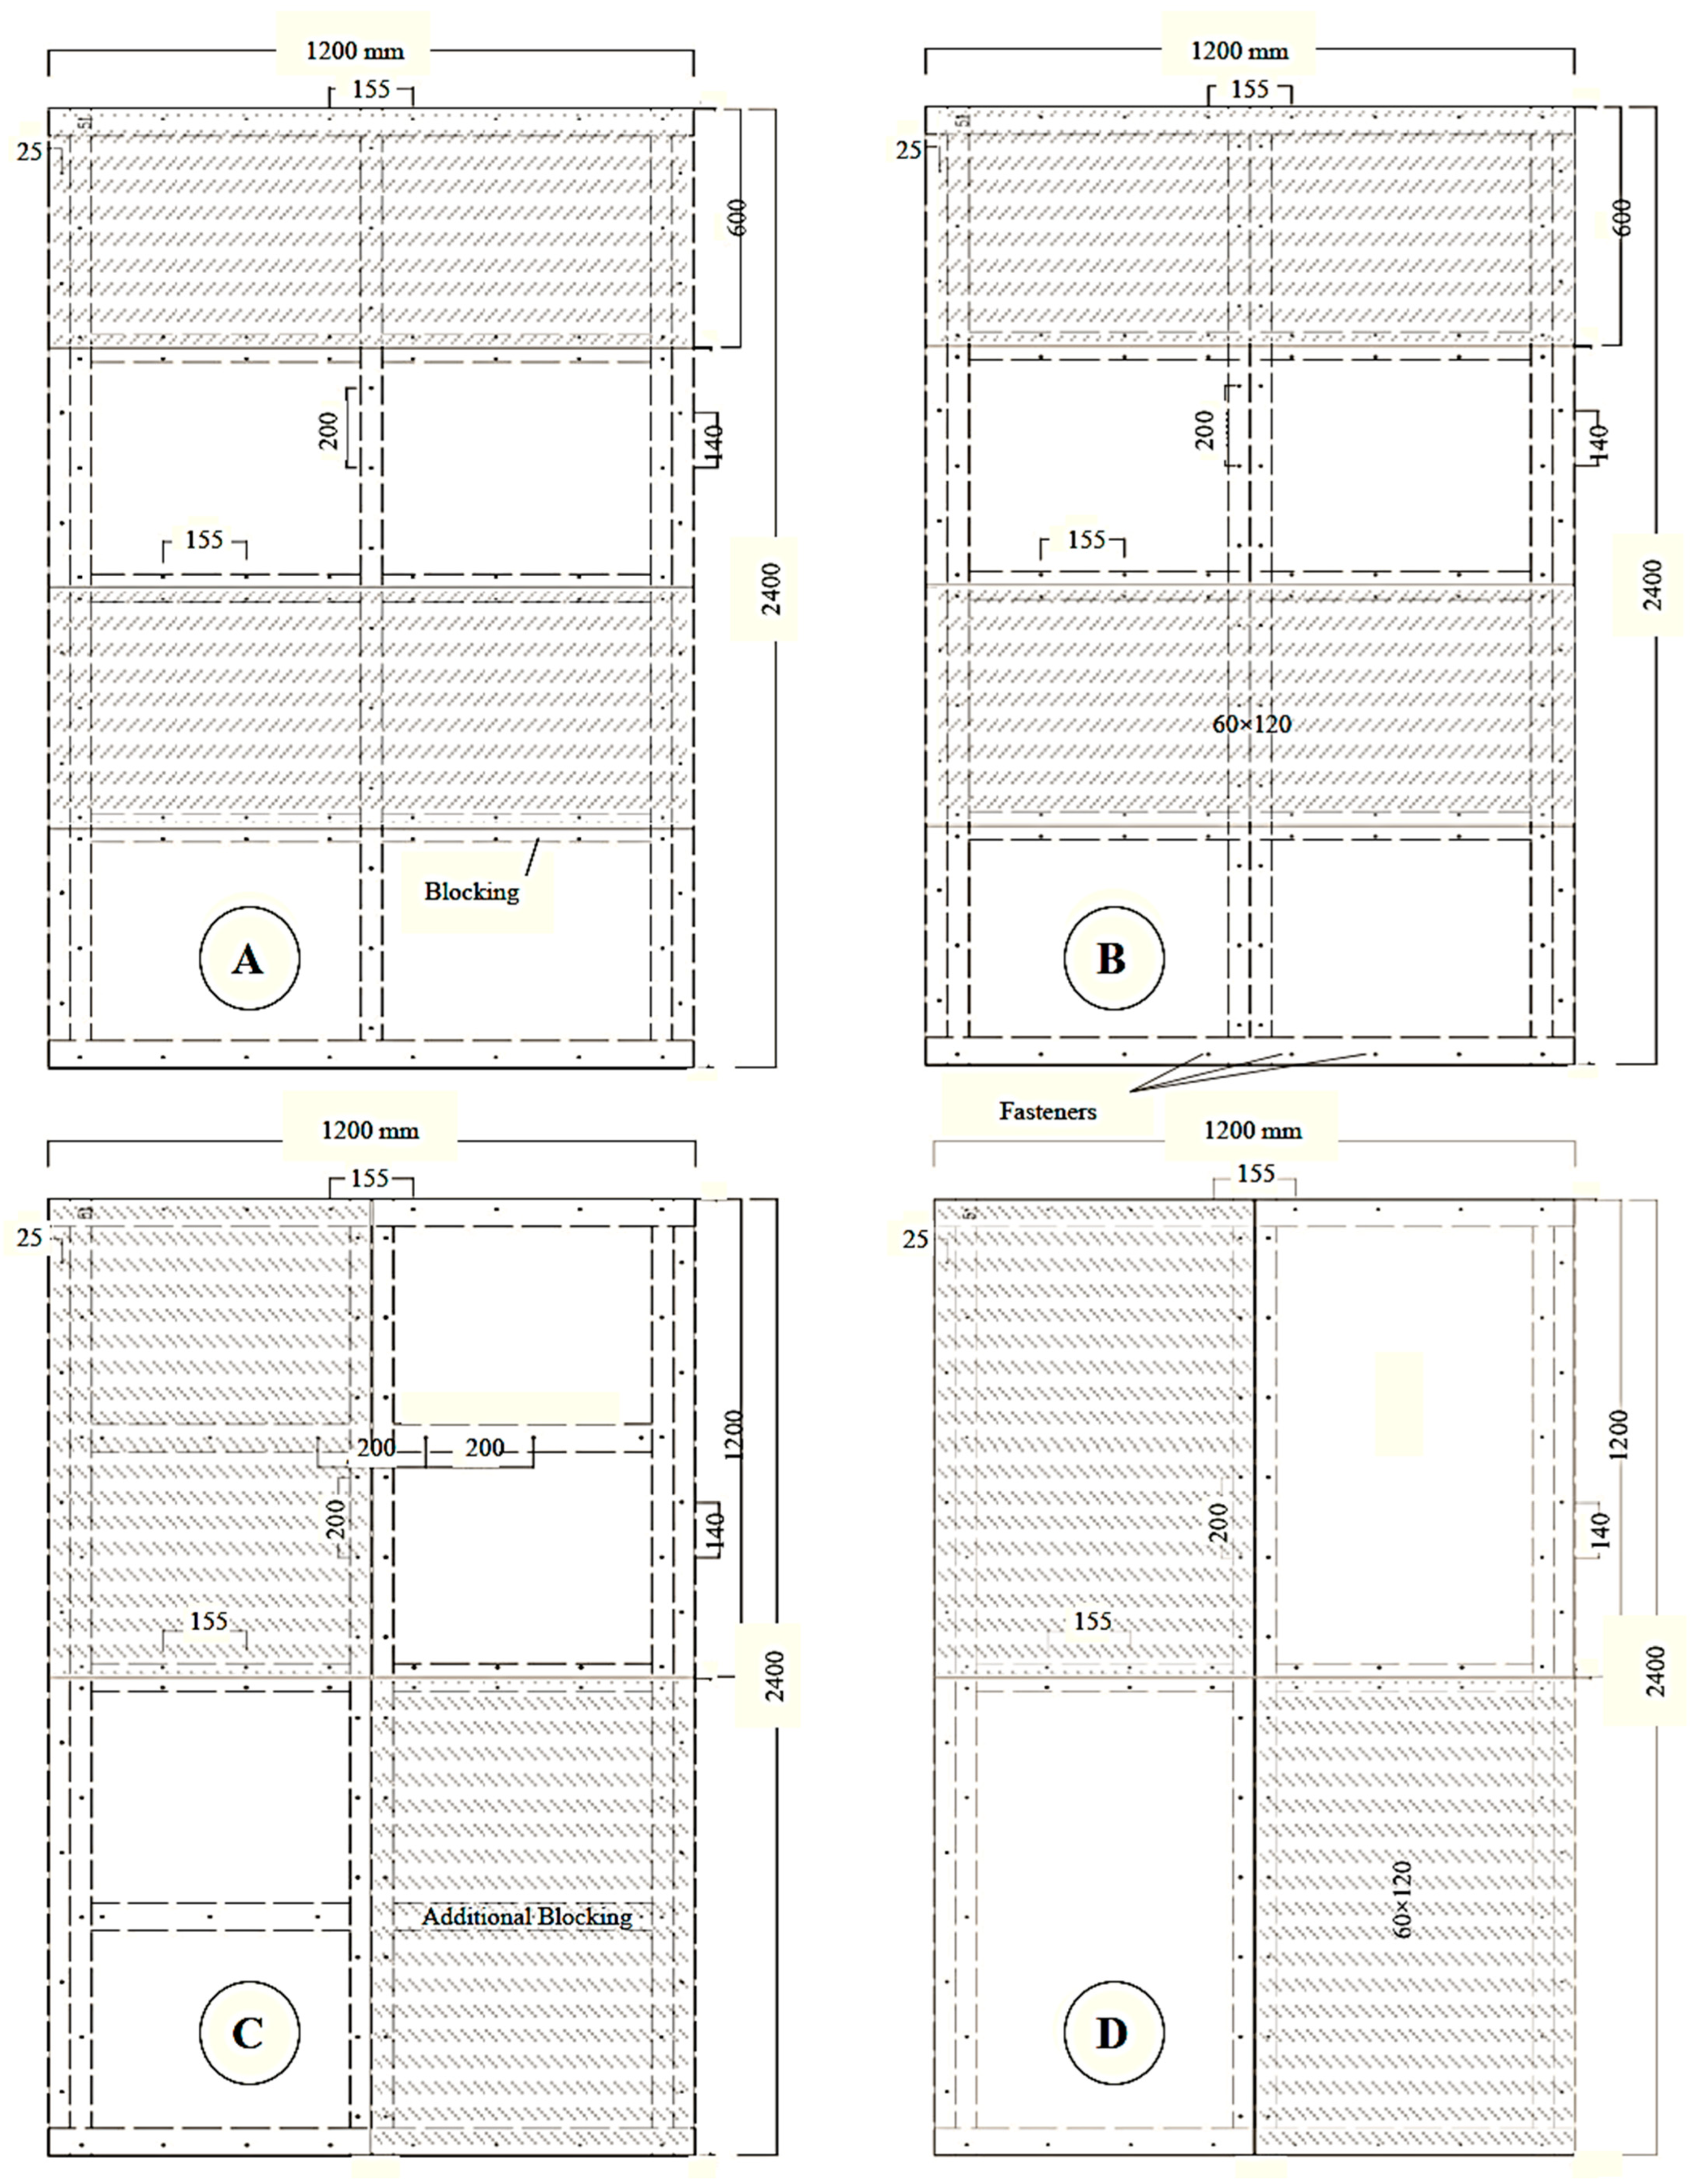
| Wall Panel | Dimensions (cm) | Porcelain Size (cm) | Chord Studs | Middle Studs | Stud Spacing (cm) | Sheathing Orientation | Blocking Rows | G * (kN) | Schematic |
|---|---|---|---|---|---|---|---|---|---|
| S-H-3 | 240 × 120 | 60 × 120 | Double | Single | 60 | Horizontal | 3 | 40 | Figure 1A |
| D-H-3 | 240 × 120 | 60 × 120 | Double | Double | 60 | Horizontal | 3 | 40 | Figure 1B |
| D-V-3 | 240 × 120 | 60 × 120 | Double | Double | 60 | Vertical | 3 | 40 | Figure 1C |
| D-V-1 | 240 × 120 | 60 × 120 | Double | Double | 60 | Vertical | 1 | 40 | Figure 1D |
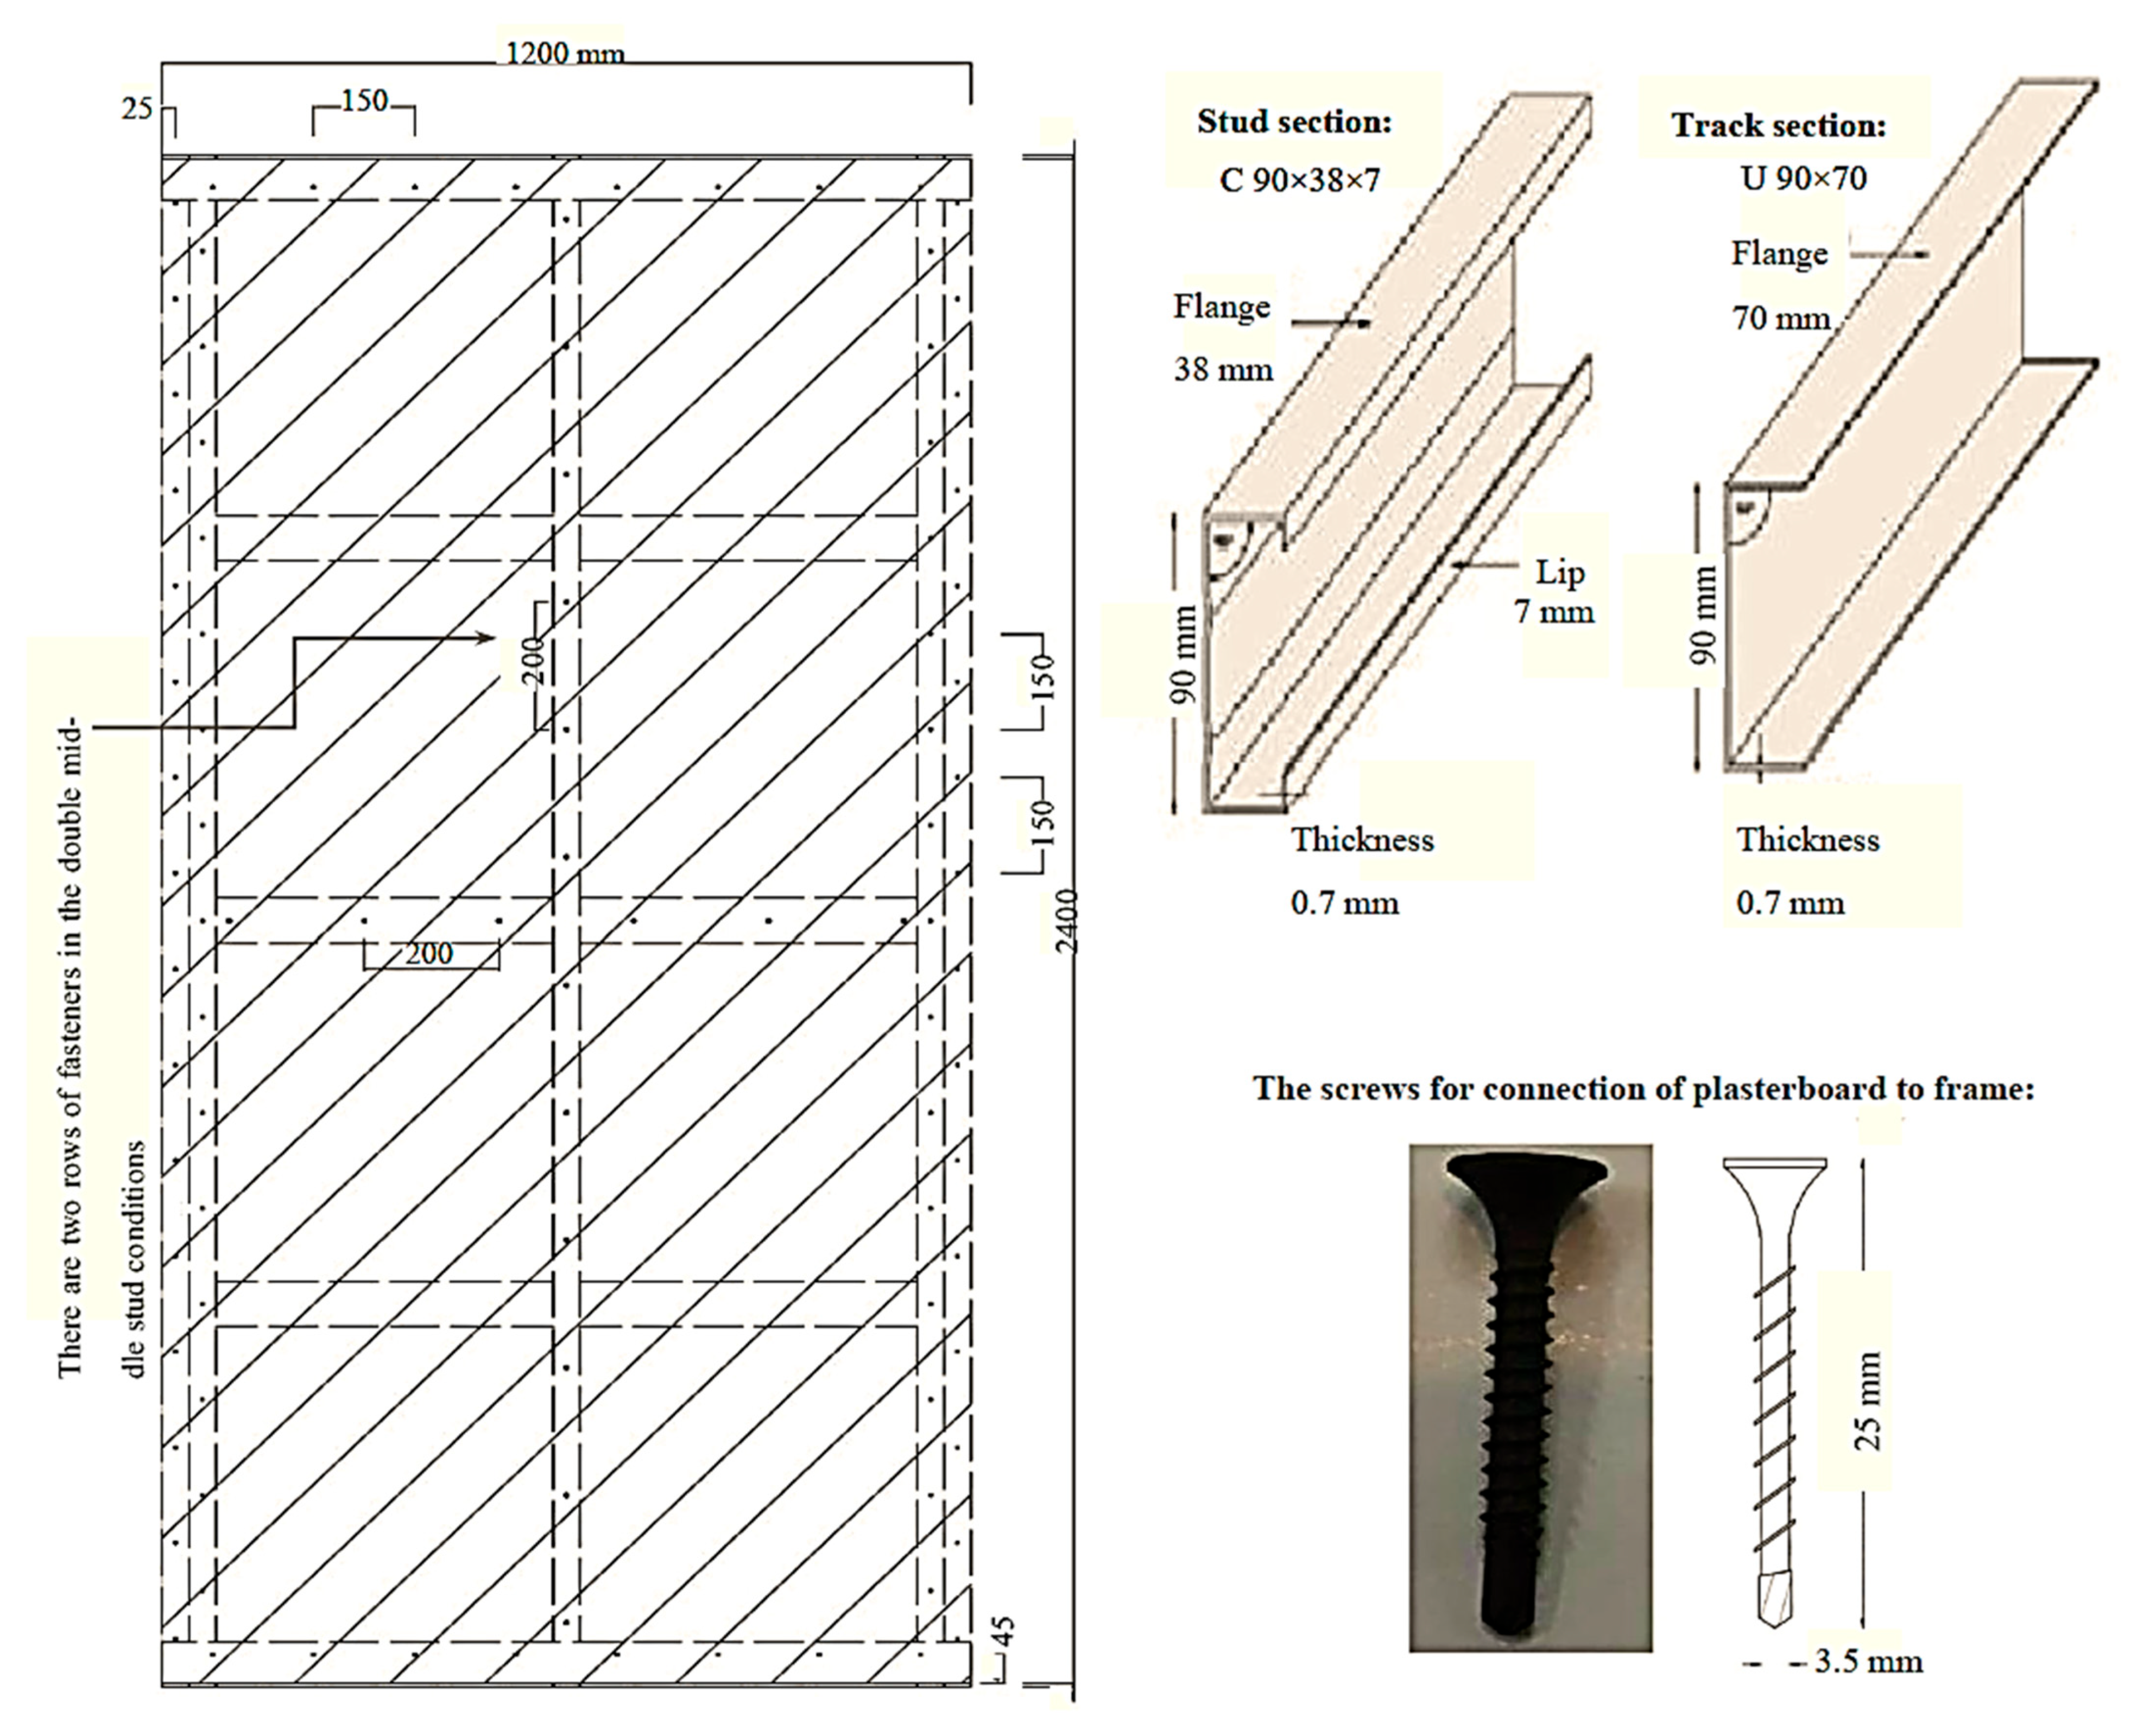
| Mechanical properties | Value | Mechanical properties | Value |
|---|---|---|---|
| Nominal grade | 550 MPa | Yield strain | 0.0045 |
| Nominal thickness | 0.7 mm | Ultimate stress, Fu | 617 MPa |
| Elastic modulus | 169 GPa | Ultimate strain | 0.0286 |
| Yield stress, Fy | 592 MPa | Fu/Fy | 1.04 |
| Loading Step | 1 | 2 | 3 | 4 | 5 | 6 | 7 | 8 |
|---|---|---|---|---|---|---|---|---|
| ASTM displacement (% of ) | 1.25 | 2.5 | 5 | 7.5 | 10 | 20 | 40 | 60 |
| Current study displacement (% of ) | 2.5 | 5 | 10 | 15 | 20 | 40 | 80 | 120 * |
| Displacement amplitude (mm) | 1.5 | 3 | 6 | 9 | 12 | 24 | 48 | 72 * |
| Specimen | Failure Onset Displacement, ∆sf (mm) | Fractures Count | (mm) | /H | (kN) | ||||
|---|---|---|---|---|---|---|---|---|---|
| Board | Porcelain | Screw | Board | Porcelain | Total | ||||
| S-H-3 | 24 | 48 | 48 | 4 | 4 | 8 | 58 | 0.024 | 20 |
| D-H-3 | 24 | 48 | 24 | 4 | 2 | 6 | 60 | 0.025 | 21.1 |
| D-V-3 | 24 | 48 | 48 | 4 | 3 | 7 | 48 | 0.02 | 17.4 |
| D-V-1 | 24 | 48 | 60 | 4 | 3 | 7 | 51 | 0.021 | 19.8 |
| Specimen | S-H-3 | D-H-3 | D-V-3 | D-V-1 | Average | |
| Step | ||||||
| 1 | 9 | 9 | 8 | 9 | 9 | |
| 2 | 27 | 27 | 25 | 28 | 27 | |
| 3 | 70 | 67 | 62 | 73 | 68 | |
| 4 | 147 | 129 | 125 | 142 | 136 | |
| 5 | 251 | 217 | 220 | 244 | 233 | |
| 6 | 1180 | 963 | 834 | 1048 | 1006 | |
| 7 | 3436 | 3075 | 2829 | 3125 | 3116 | |
| 8 | 3538 | 5503 | 2829 | 3625 | 3874 | |
| Total: | 8658 | 9990 | 6932 | 8294 | 8469 | |
| Specimen | Direction | Vy (kN) | ∆y (mm) | ∆t (mm) | Vs (kN) | ∆s (mm) | µ | Rd | Ω0 | R | Cd (∆t/∆s) | Ki (Vy/∆y) | Vmax (kN) |
|---|---|---|---|---|---|---|---|---|---|---|---|---|---|
| Positive | 12.9 | 14.2 | 60 | 8.1 | 9.2 | 4.2 | 2.72 | 1.59 | 4.3 | 6.52 | 0.9 | 18.8 | |
| S-H-3 | Average | 16 | 4 | ||||||||||
| Negative | 16.38 | 17.74 | 56.4 | 10.28 | 11.4 | 3.18 | 2.3 | 1.59 | 3.7 | 4.95 | 0.9 | 21.2 | |
| Positive | 17.11 | 26.8 | 60 | 10.6 | 16.88 | 2.2 | 1.9 | 1.61 | 3.1 | 3.55 | 0.6 | 21.5 | |
| D-H-3 | Average | 19 | 4.1 | ||||||||||
| Negative | 12.05 | 10.67 | 60 | 7.53 | 6.95 | 5.6 | 3.2 | 1.6 | 5.1 | 8.63 | 1.1 | 20.7 | |
| Positive | 12.6 | 11 | 48 | 7.87 | 7.14 | 4.4 | 2.8 | 1.6 | 4.5 | 6.72 | 1.1 | 16.9 | |
| D-V-3 | Average | 13 | 4.1 | ||||||||||
| Negative | 12 | 14.4 | 48 | 7.7 | 9.5 | 3.33 | 2.4 | 1.56 | 3.7 | 5.05 | 0.8 | 17.9 | |
| Positive | 18.2 | 22.12 | 54 | 11.2 | 13.8 | 2.44 | 1.97 | 1.63 | 3.2 | 3.91 | 0.8 | 22 | |
| D-V-1 | Average | 14 | 4.4 | ||||||||||
| Negative | 8 | 6.7 | 48 | 5.2 | 4.6 | 7.16 | 3.65 | 1.54 | 5.6 | 10.43 | 1.2 | 17.6 |
| Specimen | Vy (kN) | Vmax (kN) | E * (Joule) | ∆t/H (%) | Ki (kN/mm) | Cd | µ | Ω0 | R |
|---|---|---|---|---|---|---|---|---|---|
| S-H-3 | 14.6 | 20 | 8658 | 2.4 | 0.9 | 5.7 | 3.7 | 1.6 | 4 |
| D-H-3 | 14.6 | 21.1 | 9990 | 2.5 | 0.85 | 6.1 | 3.9 | 1.6 | 4.1 |
| D-V-3 | 12.1 | 17.4 | 6932 | 2 | 0.95 | 5.9 | 3.9 | 1.6 | 4.1 |
| D-V-1 | 13.3 | 19.8 | 8294 | 2.1 | 1 | 7.2 | 4.8 | 1.6 | 4.4 |
| Average | 13.7 | 19.6 | 8469 | 2.3 | 0.9 | 6.2 | 4.1 | 1.6 | 4.2 |
| Specimen | Cd | Cd/R | Ω0.R |
|---|---|---|---|
| S-H-3 | 5.7 | 1.4 | 6.4 |
| D-H-3 | 6.1 | 1.5 | 6.6 |
| D-V-3 | 5.9 | 1.4 | 6.6 |
| D-V-1 | 7.2 | 1.6 | 7 |
| Average | 6.2 | 1.5 | 6.7 |
Disclaimer/Publisher’s Note: The statements, opinions and data contained in all publications are solely those of the individual author(s) and contributor(s) and not of MDPI and/or the editor(s). MDPI and/or the editor(s) disclaim responsibility for any injury to people or property resulting from any ideas, methods, instructions or products referred to in the content. |
© 2025 by the authors. Licensee MDPI, Basel, Switzerland. This article is an open access article distributed under the terms and conditions of the Creative Commons Attribution (CC BY) license (https://creativecommons.org/licenses/by/4.0/).
Share and Cite
Sowlat-Tafti, C.R.; Javaheri-Tafti, M.R.; Varaee, H. Experimental Lateral Behavior of Porcelain-Clad Cold-Formed Steel Shear Walls Under Cyclic-Gravity Loading. Infrastructures 2025, 10, 202. https://doi.org/10.3390/infrastructures10080202
Sowlat-Tafti CR, Javaheri-Tafti MR, Varaee H. Experimental Lateral Behavior of Porcelain-Clad Cold-Formed Steel Shear Walls Under Cyclic-Gravity Loading. Infrastructures. 2025; 10(8):202. https://doi.org/10.3390/infrastructures10080202
Chicago/Turabian StyleSowlat-Tafti, Caeed Reza, Mohammad Reza Javaheri-Tafti, and Hesam Varaee. 2025. "Experimental Lateral Behavior of Porcelain-Clad Cold-Formed Steel Shear Walls Under Cyclic-Gravity Loading" Infrastructures 10, no. 8: 202. https://doi.org/10.3390/infrastructures10080202
APA StyleSowlat-Tafti, C. R., Javaheri-Tafti, M. R., & Varaee, H. (2025). Experimental Lateral Behavior of Porcelain-Clad Cold-Formed Steel Shear Walls Under Cyclic-Gravity Loading. Infrastructures, 10(8), 202. https://doi.org/10.3390/infrastructures10080202